Abstract
In recent years, applying slag micro-powder as a substitute for cement in preparing alkali-activated slag cement stabilized sand (AASCSS) mixtures has become increasingly widespread. In the severe cold regions of Xinjiang, multi-objective optimization of the mechanical and frost resistance properties of AASCSS is particularly crucial. This paper adopts slag micro-powder to replace Portland cement, together with lime and desulfurization gypsum as activators, to explore the effects of activator type and dosage on the mechanical and frost-resistance properties of AASCSS. A prediction model for the mechanical and frost-resistance properties of AASCSS based on projection-pursuit regression (PPR) was proposed and established. Using the developed PPR model, contour plots of the comprehensive performance were calculated, simplifying the multi-objective problem into two single-objective problems focusing on mechanical and frost resistance properties for analysis. This method avoids subjective weighting and hypothesis-based modeling. By analyzing the contour plots of comprehensive performance, the optimal performance indices for mechanical and frost–thaw properties and the corresponding types and dosages of activators can be directly determined. When the required 7-day unconfined compressive strength in road engineering is 5.6 MPa, the optimal value of the freeze–thaw performance index (BDR) is 94.08%. At this point, the corresponding lime content is 2.1%, and the desulfurization gypsum content is 3.3%. The research results provide a reference for applying slag to road-based materials.
1. Introduction
Slag is generated as an industrial waste during steel production processes. In the Xinjiang region of China, issues such as new slag emissions and the accumulation of old slag have been problematic for years due to the region’s economic development. These slags have occupied extensive land areas, leading to resource wastage and environmental pollution. Consequently, the efficient and rational management of these slags have become a focal point of local government attention [1]. Currently, the most widely used road base in China is the cement-stabilized material base. The construction of these bases necessitates the substantial use of cement, which not only consumes large amounts of natural resources and energy but also significantly pollutes the ecological environment. Studies have demonstrated that slag micro-powder, as an active mixing material, can replace cement [2,3]. Therefore, to address these issues, slag micro-powder was used as a binder instead of cement in the preparation of alkali-activated slag cement-stabilized sand (AASCSS) mixtures during the construction of these bases. By using slag in road-based materials, CO2 emissions from cement production can be significantly reduced, contributing to the mitigation of global climate change. Additionally, it reduces the consumption of natural resources and energy. Since slag is a byproduct of steel production, it does not require the additional extraction of natural resources, thus conserving valuable raw materials. Furthermore, it promotes the resource utilization of industrial solid waste, reducing the environmental pollution caused by waste disposal and improving the ecological environment. Finally, the cost of slag is usually lower than that of traditional cement, and its use in road construction can reduce material costs, offering significant economic benefits [4]. The cement-stabilized base is a crucial load-bearing component of road pavement structures, requiring sufficient mechanical strength to withstand repetitive vehicle loads. During the transition between winter and spring, the Xinjiang region experiences intense freeze–thaw cycles. During these cycles, the pore water within the road base materials freezes under low temperatures. As water expands by approximately 9% upon freezing, this expansion exerts pressure that causes the formation and propagation of microcracks within the road base materials, compromising the structural integrity of the road base. Additionally, the repeated freeze–thaw cycles lead to an increase and propagation of cracks within the road base materials, gradually accumulating fatigue damage. This not only further compromises the structural integrity of the road base but also reduces the mechanical strength of the road base materials. Ultimately, this process leads to the deterioration of the entire pavement structure [5,6,7,8]. Hence, AASCSS used in road bases not only needs adequate mechanical strength but should also possess good freeze resistance to ensure the stability of the road structure. Accordingly, the study of the comprehensive performance of mechanical and freeze-resistance properties of AASCSS appears particularly important.
Substantial progress has been made in the study of slag micro-powder and its comprehensive performance analysis as a replacement for cement. Overall, scholars have primarily focused on two aspects: Firstly, in experimental research, researchers primarily utilize industrial and agricultural waste products such as slag, steel slag, fly ash, and rice husk ash to prepare alkali-activated cementitious materials. These raw materials are rich in oxides such as CaO, SiO2, and Al2O3, which, under the action of alkaline activators, can significantly enhance their hydration reaction rate, forming cementitious materials with strength and stability [9,10]. Wang [11] used recycled concrete powder (RCP), fly ash, and slag micro-powder as raw materials, with sodium silicate as the alkaline activator, to prepare alkali-activated recycled fly ash (RFA) cement paste. The cement paste’s fluidity, setting time, strength, and microstructure were analyzed. It was found that the cement paste composed of 60% RCP, 20% slag, and 20% fly ash exhibited optimal mechanical and workability performance. Li [12] studied the impact of materials such as slag, fly ash, and lime, as well as their proportions, on the structure and strength of cementitious materials; several methods were proposed to improve the mechanical properties of alkali-activated cementitious materials. Muralidhar Kamath [13] investigated the microstructure, physical properties, and mechanical performance of alkali-activated slag cement and geopolymer, analyzing the effects of different activators on these materials and assessing their potential applications in sustainable building materials. N.K. Lee [14] studied the shrinkage characteristics of alkali-activated fly ash/slag (AFS) mortar, finding that the autogenous shrinkage of AFS mortar was mainly due to drying in the hardened state. Regarding predictive methods, Nehdi [15] explored the workability and mechanical properties of ternary cementitious materials containing fly ash, slag, and silica fume, and established two optimization models based on the expected functions and response surface methodologies. Hilal El-Hassan [16] conducted research on the properties of steel-fiber-reinforced alkali-activated slag–fly ash mixed with recycled concrete aggregate and dune sand, using regression analysis to establish a model correlating the properties of hardened concrete with the 28-day compressive strength of cylindrical specimens. Algaif [17] investigated the effects of different material contents on mortar performance through experimental and statistical modeling methods and optimized the mortar mix ratio using the response surface methodology. Dilshad [18] used four models—FQ, NLR, MLR, and ANN—to evaluate the influence of SiO2 and CaO content in fly ash on the compressive strength of green concrete, emphasizing their potential in accurately predicting compressive strength.
The aforementioned scholars’ research primarily focused on applying slag micro-powder in mortar and concrete. However, a significant research gap exists in its application as a road-based material, which necessitates further exploration. Moreover, the comprehensive performance analysis of the mechanical properties and freeze-resistance of AASCSS can be considered a multi-objective problem. Currently, in multi-objective design issues, many researchers commonly employ methods such as linear weighting, utility functions, and evolutionary algorithms for the multi-objective design of building materials such as cement and mortar. However, these methods typically require modeling based on extensive sample data, leading to labor-intensive experimentation and inherent subjectivity [19,20]. Projection-pursuit regression (PPR), an exploratory data analysis (EDA) method based on the “dimension reduction and optimization” concept, allows for the analysis of genuine and objective patterns in high-dimensional data without the need to preprocess the initial experimental data. This method has been successfully applied in the field of building materials [21,22]. To address the issues mentioned, in this study, S75 slag partially replaced Portland cement. Based on relevant literature [23,24,25] and considering the low cost and effective activation properties of lime and desulfurization gypsum, lime and desulfurization gypsum were selected as activators. The contents of lime and desulfurization gypsum were considered the main influencing factors. A PPR predictive model for the 7-day and 28-day unconfined compressive strength and the BDR of AASCSS was constructed using the PPR technique. The established PPR predictive model was used for simulation calculations, and the results were plotted as contour maps of comprehensive performance, thus transforming the multi-objective problem of AASCSS into single-objective analyses of mechanical properties and freeze resistance. The findings from this study could provide insights for applying slag micro-powder to road-based materials.
2. Materials and Methods
2.1. Raw Materials for Experimentation
The Xinjiang Tianshan Cement Factory produced the 42.5R ordinary Portland cement used in this study, and its chemical composition is detailed in Table 1. The slag is S75 grade micro-powder produced by the Xinjiang Baoxinshengyuan Building Materials Factory, with its chemical composition also provided in Table 1. The aggregate selected was well-graded natural sand with a fineness modulus of 2.74; its physical properties and particle composition are shown in Table 2. The alkaline activators used were lime and desulfurization gypsum. The main component of lime is Ca(OH)2, while the main component of desulfurization gypsum is CaSO4·2H2O. The mixing water was municipal tap water with a pH of 7.

Table 1.
The chemical composition of the cement and slag.
Table 2.
Physical property indices of the natural sand.
2.2. Experimental Method
2.2.1. Preparation and Maintenance of Specimens
The specimen preparation method followed the T 0843-2009 method, as specified in JTG E51-2009 [26]. Cylindrical specimens with dimensions of diameter × height = 50 mm × 50 mm and diameter × height = 150 mm × 150 mm were produced using the static pressing method. After fabrication, the specimens were placed into plastic bags, which were securely sealed. A damp cloth was laid over the top of the bag opening. The specimens, wrapped in plastic bags, were then stored for curing in a controlled environment at a temperature of 20 ± 3 °C and a relative humidity exceeding 90%.
2.2.2. Mechanical Properties’ Testing
The mechanical performance tests were conducted to evaluate the 7-day and 28-day unconfined compressive strengths of the AASCSS. For the mechanical tests, cylindrical specimens measuring 50 mm in diameter and 50 mm in height were used. The tests were carried out in accordance with the T 0805-1994 test method described in JTG E51-2009 [26]. Before the mechanical testing, specimens were submerged in a water tank for 24 h to ensure complete saturation. Following saturation, specimens were removed from the water, and surface moisture was wiped off using a towel. The specimens were then placed in a compression testing machine to assess the unconfined compressive strength. During the test, the loading rate of the compression testing machine was controlled at 1 mm/min. The formula for calculating the unconfined compressive strength is as follows:
In the formula:
Rc represents the unconfined compressive strength of the specimen (MPa);
P denotes the maximum pressure at specimen failure (N);
D is the diameter of the specimen (mm).
2.2.3. Frost-Resistance Testing
The freeze–thaw performance test was conducted in accordance with the specifications in [26]. Standard cured specimens with dimensions of diameter × height = 150 mm × 150 mm were used. The freeze test involved freezing the specimens in a low-temperature chamber at −18 °C for 16 h. The thaw test involved placing the frozen specimens in water at 20 °C for 8 h. This process constituted one freeze–thaw cycle, and the total number of cycles was set to 5. The frost resistance was evaluated based on the BDR (freeze–thaw durability ratio) of specimens cured under standard conditions for 28 days and subjected to five freeze–thaw cycles. The calculation formula for the BDR is:
In the formula, BDR represents the freeze–thaw durability ratio (%) after the freeze–thaw cycles, RDC is the representative value of the unconfined compressive strength of the specimen after the freeze–thaw cycles (MPa), and Rc denotes the unconfined compressive strength of the control specimen (MPa).
2.3. Experimental Plan
Based on engineering experience and on-site practices, the replacement rate of cement by slag micro-powder was determined to be 50%, with a binder dosage of 5.5%. The water content was measured at 4.8% through compaction tests. Based on preliminary experiments and the literature [27], the total dosage of activators was determined to be 0–8%. The compaction degree was controlled at 96% during the specimen preparation. Control of the compaction degree was achieved according to the relevant provisions of the standard [26]. The compaction degree of the AASCSS was controlled by adjusting the quality of the constituent materials. The formula for calculating the control of compaction degree is as follows:
where is the standard mass of a single specimen (g), V is the volume of the specimen (cm3), is the maximum dry density of the AASCSS (g/cm3), is the optimal moisture content of the AASCSS (%), and is the compaction degree standard of the AASCSS (%).
Refer to Table 3 for specific experimental details.
Table 3.
Experimental plan for the AASCSS.
2.4. Discussion of Experimental Results
2.4.1. Mechanical Properties
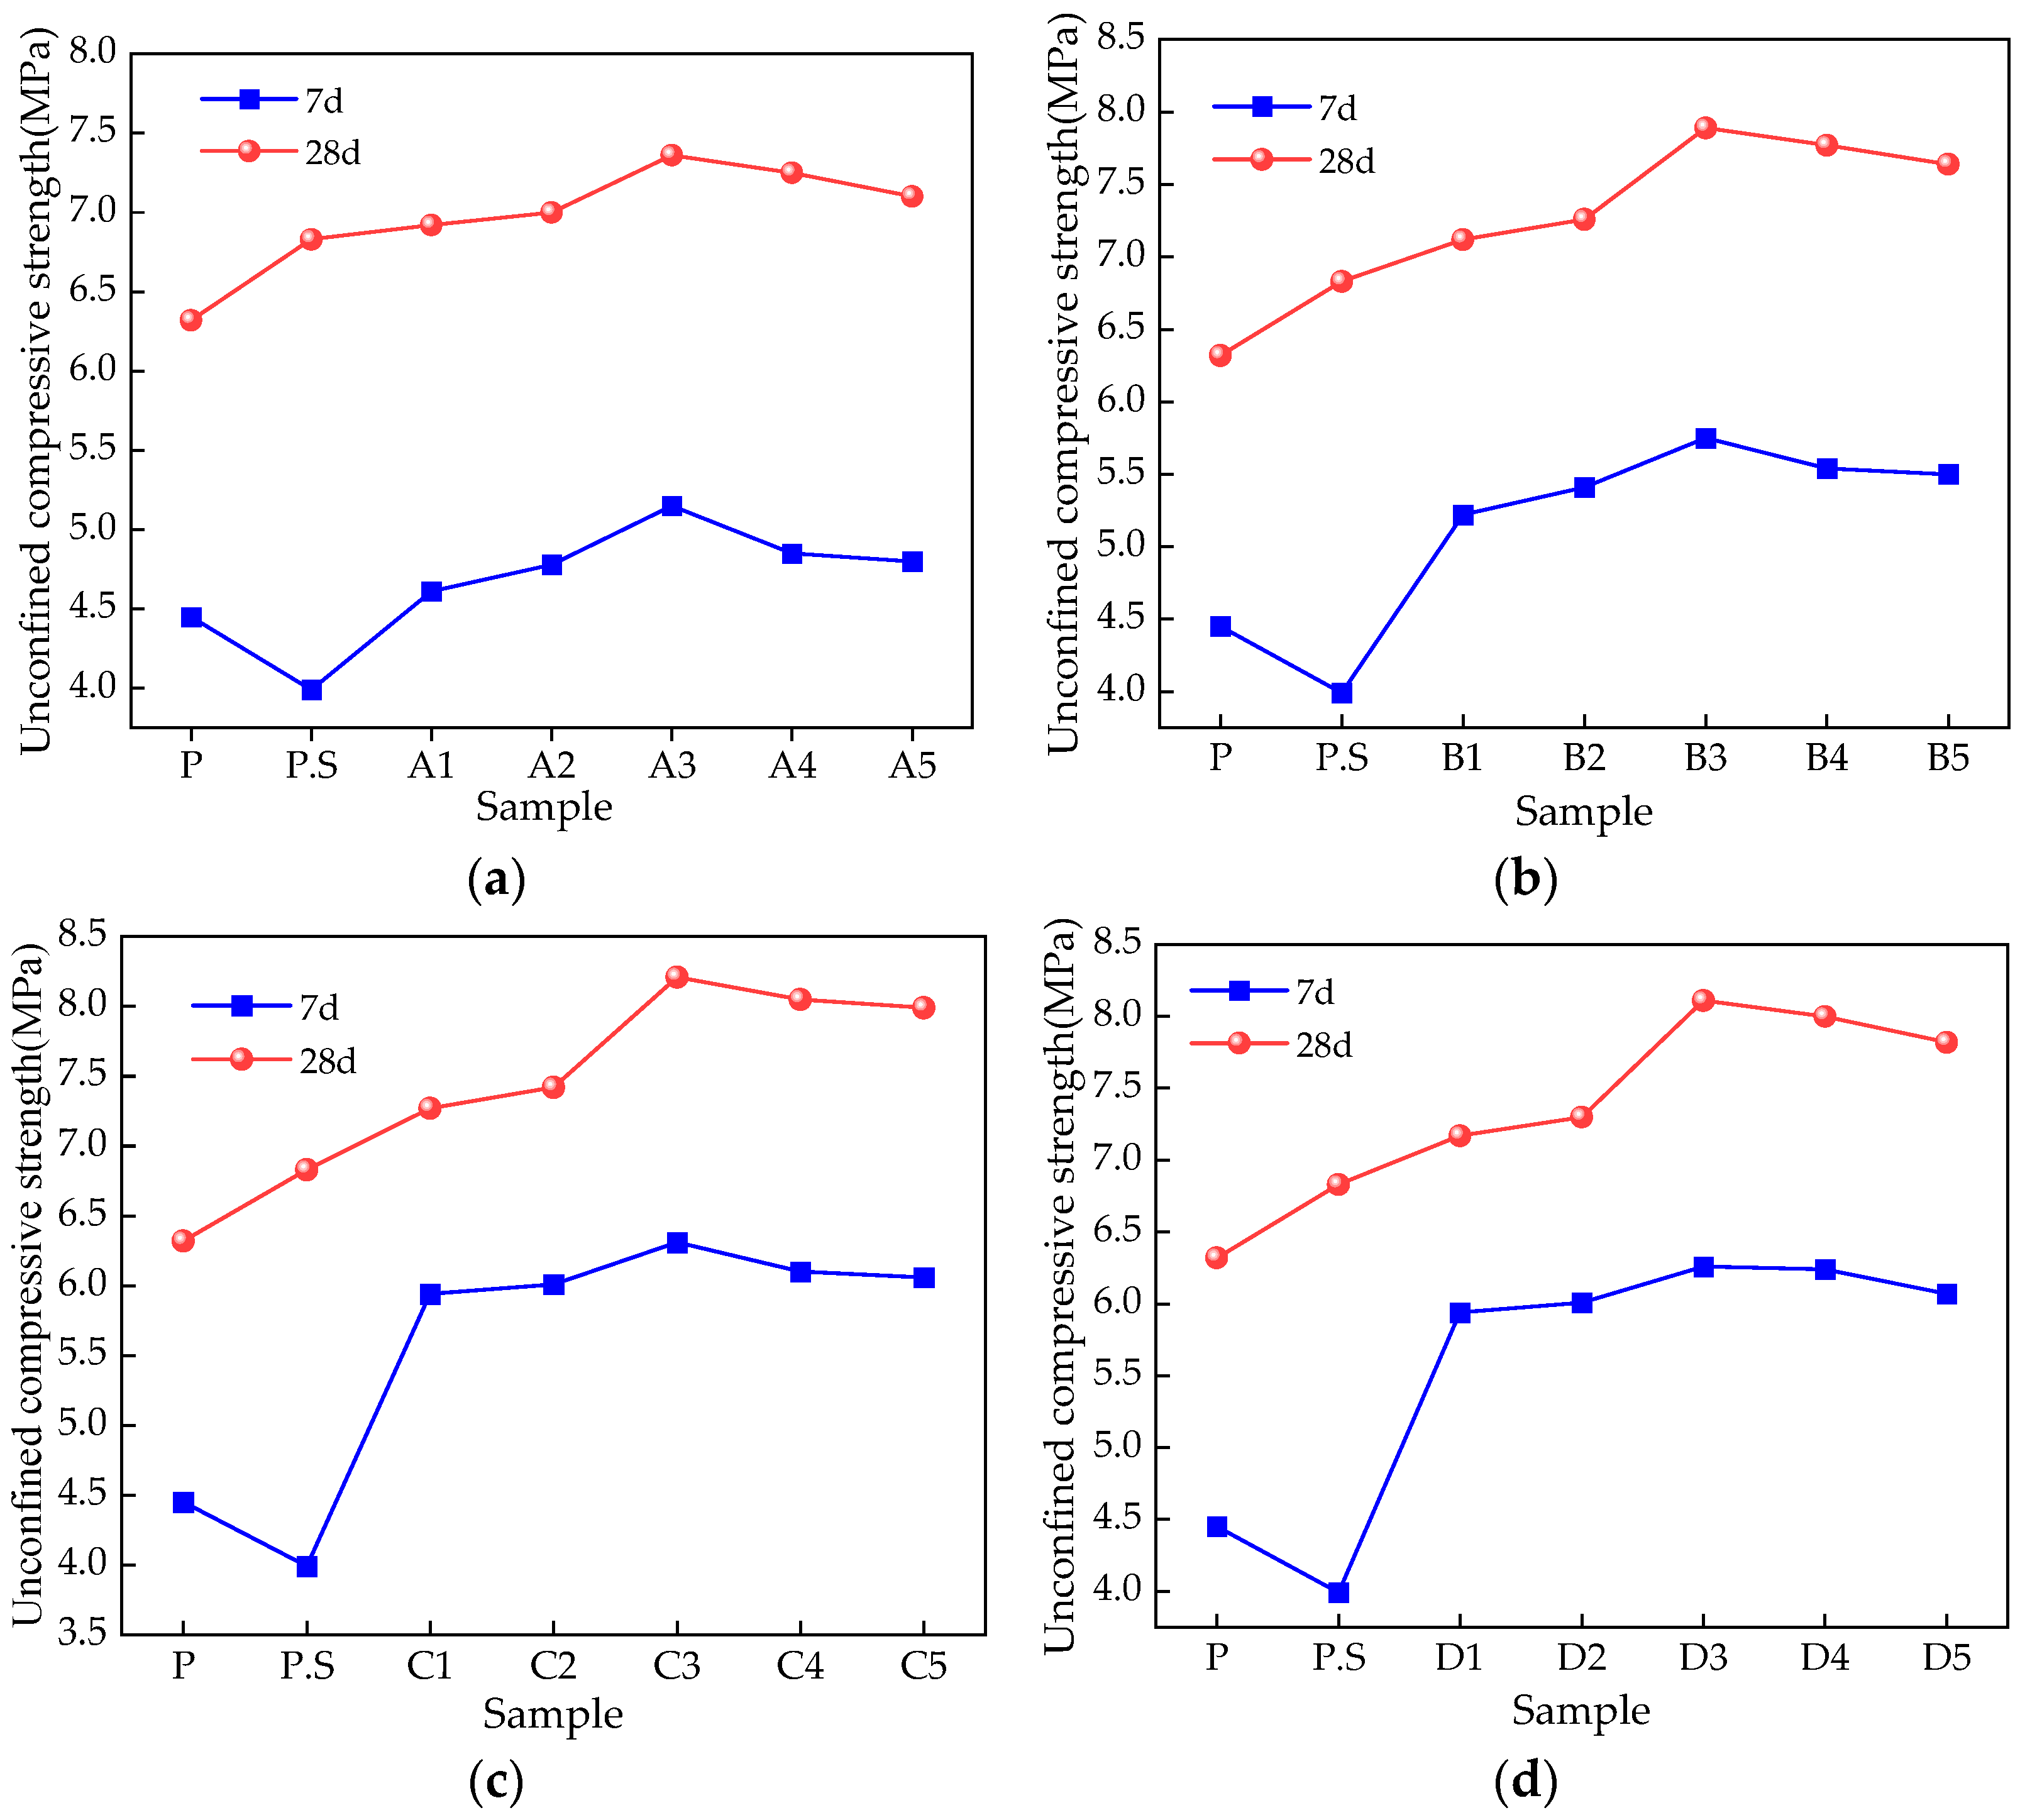
The unconfined compressive strengths of the specimens for both 7-day and 28-day ages, as listed in Table 3, were measured. The curves of the unconfined compressive strength of the AASCSS with varying activator dosages of 0, 2%, 4%, 6%, and 8% were plotted, as shown in Figure 1.
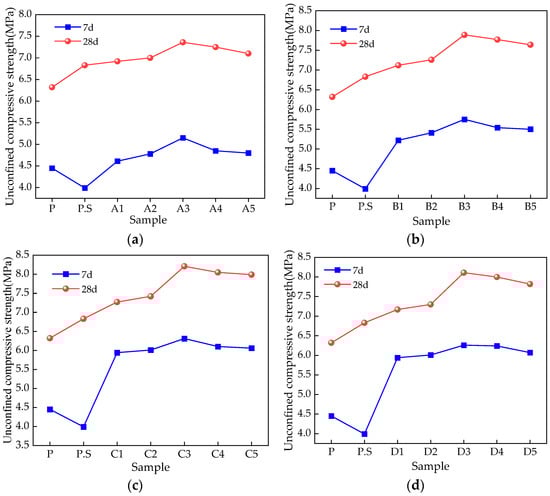
Figure 1.
(a–d) Unconfined compressive strength curves of the AASCSS representing activator dosages of 2%, 4%, 6%, and 8%, respectively.
Figure 1 shows that the unconfined compressive strength of the AASCSS decreases at 7 days when slag micro-powder replaces the cement, but it exceeds that of the cement control group at 28 days. With the addition of the admixture, the unconfined compressive strength of the AASCSS at 7 and 28 days shows a trend of rapid increase followed by a slow increase as the admixture content increases. When the alkaline activator content is the same, there is a significant difference in the unconfined compressive strength of the AASCSS with different ratios of the two activators. When the ratio of lime to desulfurized gypsum is 1:2, the unconfined compressive strength of the AASCSS at 7 and 28 days reaches its peak; when lime is used alone, the unconfined compressive strength of the AASCSS at 7 and 28 days is the lowest; and when lime and desulfurized gypsum are co-used, the unconfined compressive strength of the AASCSS at 7 and 28 days gradually increases with the increase in desulfurized gypsum content. However, the growth rate of the unconfined compressive strength of the AASCSS at 7 and 28 days does not increase proportionally with the alkaline activator content, indicating that the improvement effect of co-adding the two alkaline activators on the unconfined compressive strength of AASCSS is better than that of adding the two activators separately.
The primary reason is that when slag replaces cement, the contents of C2S, C3S, C3A, and C4AF decrease, resulting in a reduction in the formation of strength-contributing hydration products (such as C-S-H gel), thereby reducing early strength. As the curing time increases, the latent hydraulic properties of the slag are fully activated, allowing for more extensive hydration, forming more hydration products that fill the pores, thus improving the density and strength of the material. With the addition of lime and desulfurization gypsum, the alkaline components in the AASCSS increase, effectively compensating for the deficiency of alkaline components caused by the replacement of cement with slag [28]. The OH− in lime not only dissociates the slag glass structure but also provides an alkaline environment for desulfurized gypsum as a sulfate activator of slag micro-powder; this promotes the activation of desulfurized gypsum on slag micropowder, improving the degree of hydration of slag micro-powder, and generating more hydration products (such as ettringite) [29,30,31]. At the same time, the addition of desulfurized gypsum and lime not only increases the amount of hydration products but also helps to improve the microstructure of hydration products. SO42− promotes the formation of fine and dense hydration products, filling the voids inside the AASCSS, making the entire system more compact and improving the strength of the AASCSS. The crystalline products formed during hydration can effectively fill the original pores, reduce the porosity, and increase the density. In particular, calcium sulfate in desulfurized gypsum will produce a large volume of hardened products during hydration, which can effectively improve the compactness and strength of the material. In addition, under the joint action of lime and desulfurized gypsum, not only are enough OH− and SO42− provided to promote the activity of the slag, but there may also be a synergistic effect; that is, the combination of the two is better than the use of either alone, which helps to improve the mechanical strength of the AASCSS [32,33].
2.4.2. Frost Resistance
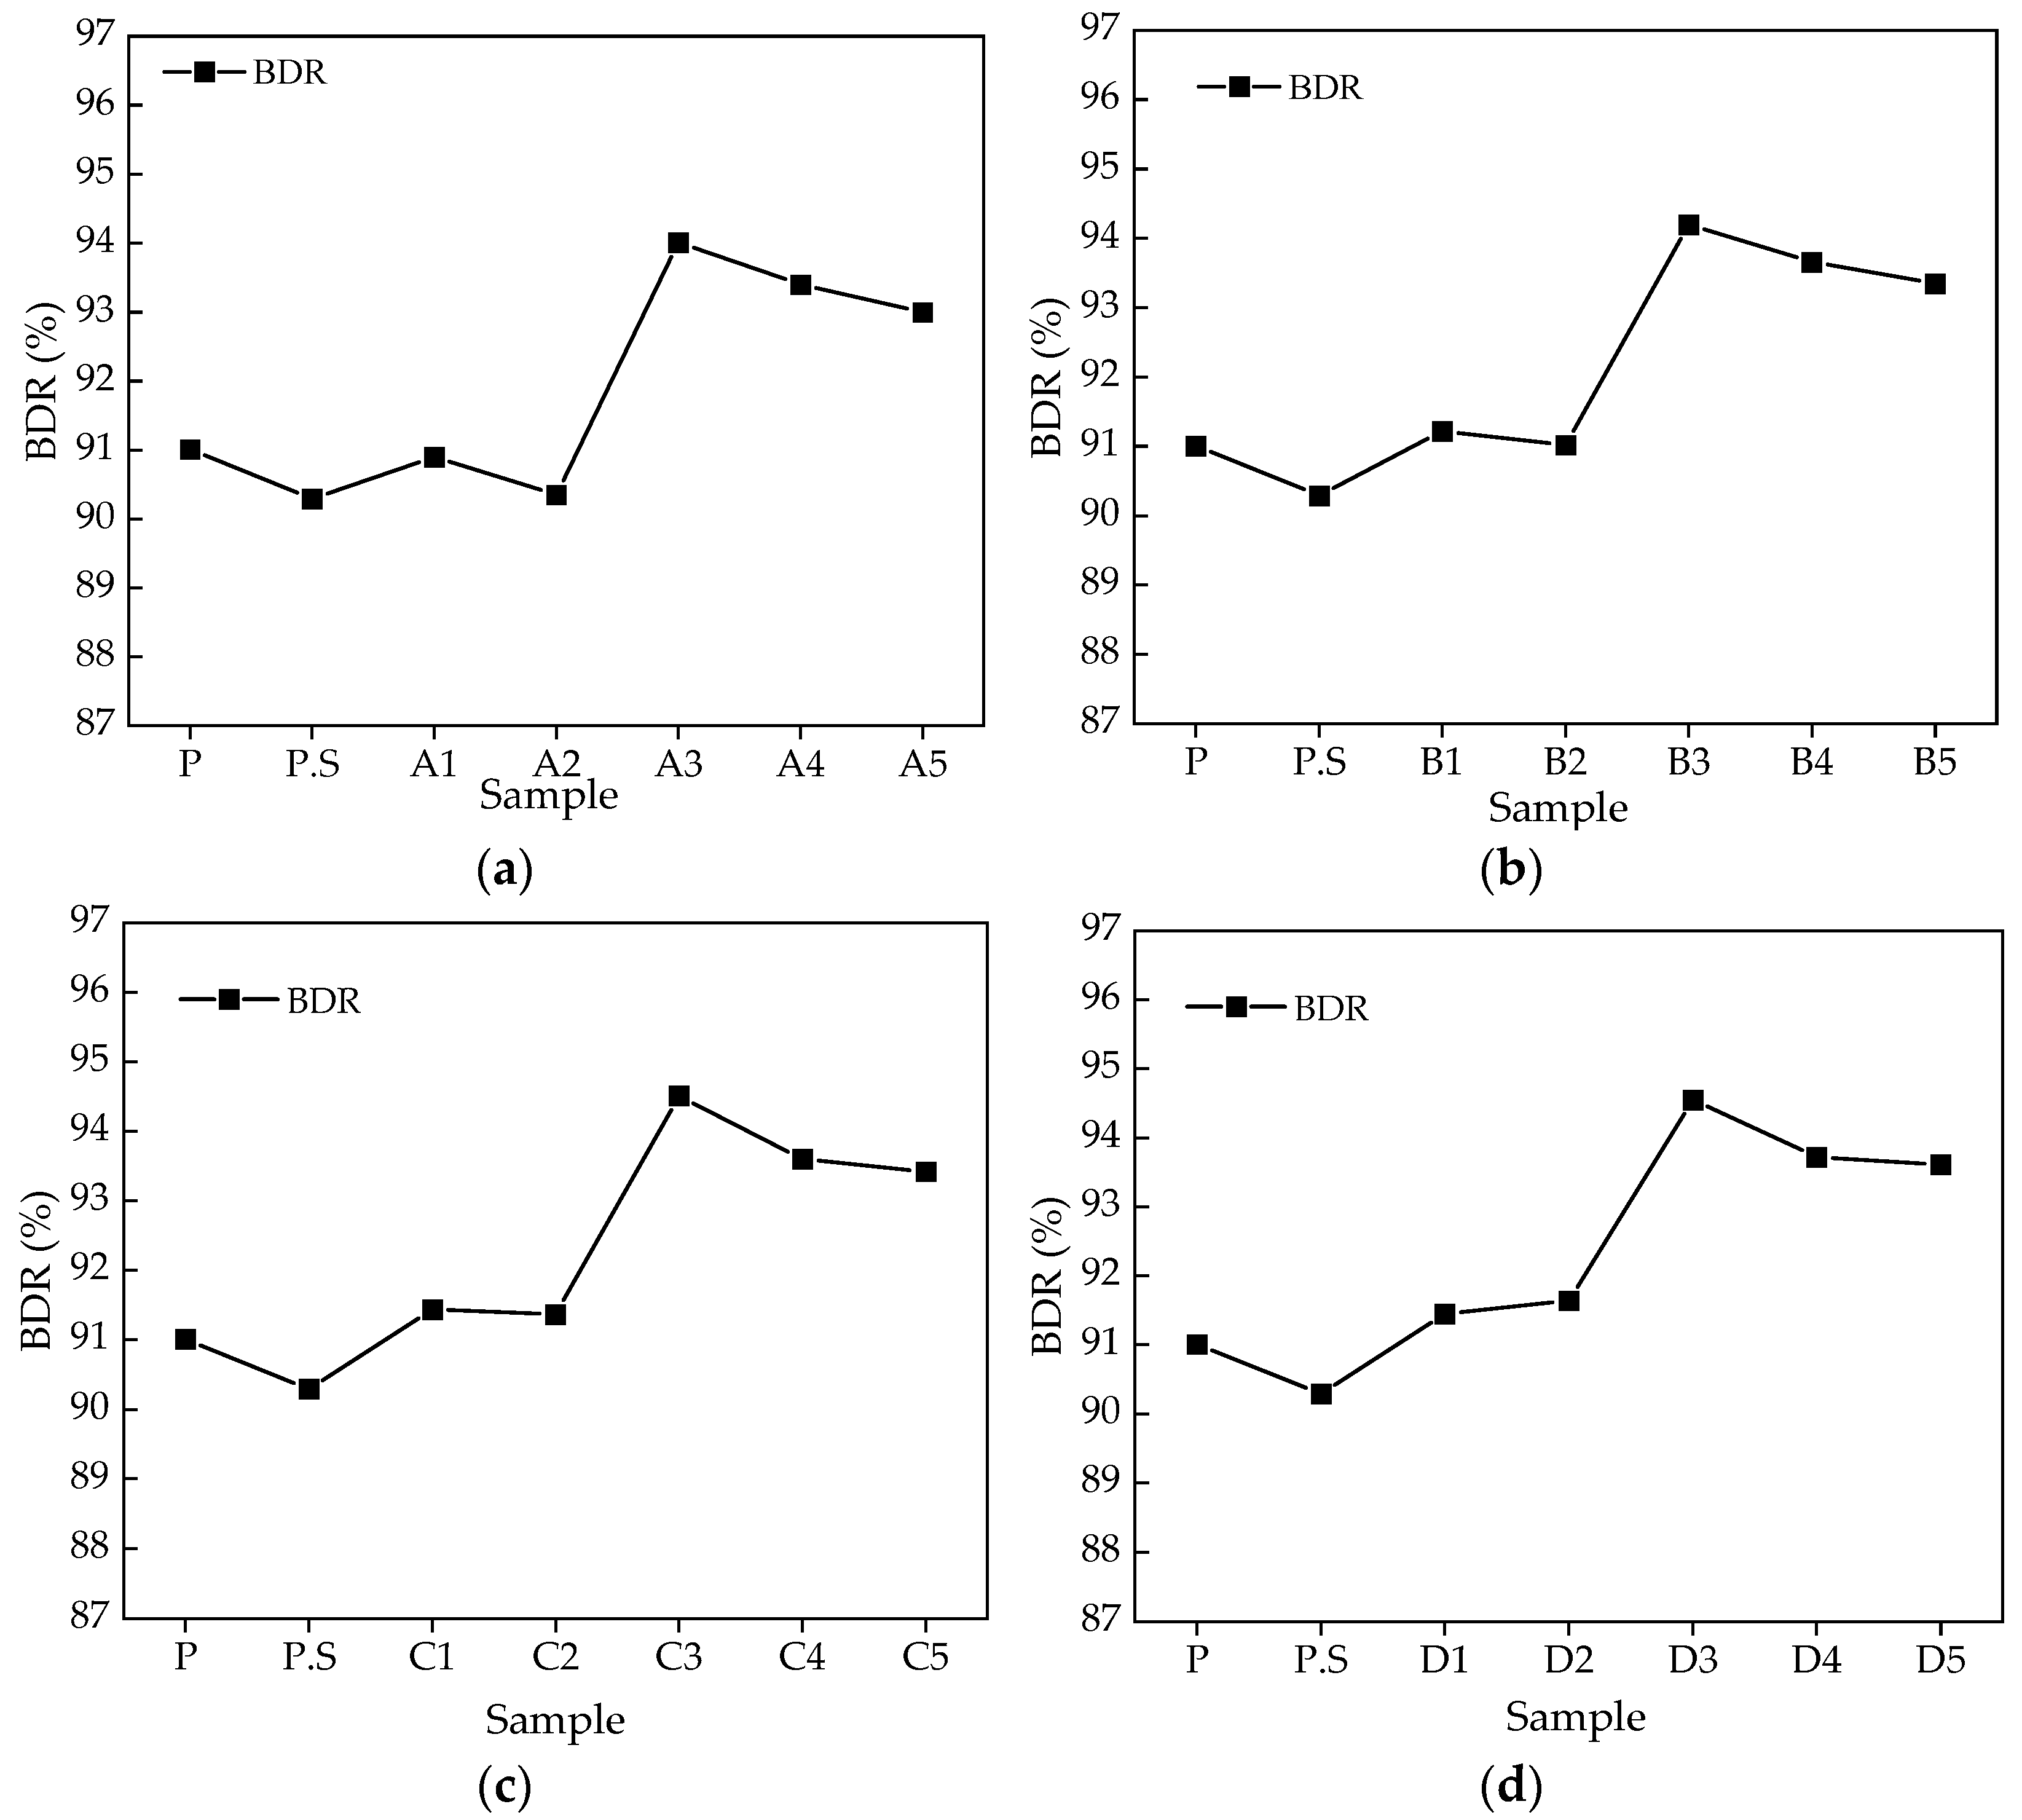
The BDR of the AASCSS groups, as shown in Table 3, was determined after a curing period of 28 days and after being subjected to five freeze–thaw cycles. Based on the experimental results, BDR curves were plotted for activator dosages of 2%, 4%, 6%, and 8%, as depicted in Figure 2.
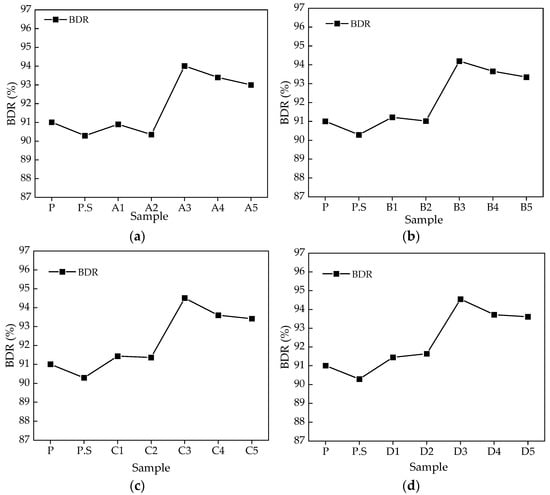
Figure 2.
(a–d) BDR variation curves of the AASCSS representing activator dosages of 2%, 4%, 6%, and 8%, respectively.
From Figure 2, it can be observed that frost resistance of the AASCSS deteriorates when slag micro-powder replaces cement. With the addition of an alkaline activator, the BDR of the AASCSS significantly increases with the increase in alkaline activator content. When the alkaline activator content is the same, the BDR of AASCSS with the single addition of lime and desulfurized gypsum is lower than that of AASCSS with the co-addition of lime and desulfurized gypsum; in AASCSS with the co-addition of lime and desulfurized gypsum, the BDR decreases gradually with the increase in lime content, and it is higher than the BDR of AASCSS with the single addition of both activators. The reason for these phenomena is that desulfurized gypsum and lime, as composite activators, can promote the hydration reaction of slag, generating more hydration products. These hydration products fill the internal pores of the AASCSS, making the microstructure of the AASCSS more compact and uniform. The dense microstructure can effectively reduce the permeability of water in the AASCSS, reducing the damage by ice crystals to the internal structure of the AASCSS during freeze–thaw cycles, and thus improving the frost resistance of the AASCSS. In addition, desulfurized gypsum and lime can change the distribution of pores in the AASCSS, especially by reducing the number of large pores and increasing the proportion of fine pores. Fine pores have a certain limiting effect on the formation and expansion of ice crystals, slowing down the damage by ice crystals to the material’s microstructure during freeze–thaw cycles and thereby improving the frost resistance of AASCSS [34,35].
3. PPR Modeling and Simulation Calculation
3.1. Introduction to the PPR Modeling Method
Projection-pursuit regression (PPR) is a statistical modeling method used to analyze high-dimensional experimental data and to establish predictive computational models. Compared with artificial neural network modeling, PPR modeling has higher computational accuracy under the same conditions. Moreover, when the computational accuracy is similar, PPR modeling requires fewer modeling samples, whereas artificial neural network modeling requires a large number of data samples [21,36,37]. Therefore, the experimental workload required for PPR modeling is relatively lower. The relevant theory and specific implementation methods of PPR can be found in the literature [21].
Consider a set of random variables (G, H), where G is a C-dimensional random variable (independent variable), and H is a D-dimensional random variable (dependent variable). The random variables G and H can be represented as and . In PPR modeling, based on n trial results of the random variable (G, H), multiple ridge functions are weighted and summed to approximate the regression function F(g) = E(H|G = g). The resulting PPR model is given by:
where ft is the t-th ridge function and must satisfy a condition, namely Eft = 0, Eft2 = 1; M is the number of ridge functions’ upper limit; t represents the contribution weight coefficient of the t-th ridge function; Hm is the m-th dependent variable, with a range of 1 ≤ m ≤ D; is the average value of the n trial data for the m-th dependent variable; k is a coefficient obtained by reverse inference during the modeling process; t is the contribution weight coefficient of the ridge function ft; gj is the j-th independent variable with a range of 1 ≤ j ≤ C; and jt is the t-th component of the j-th direction and must satisfy a condition.
PPR uses a computer program to reduce the dimensionality and to iteratively optimize parameters other than the coefficient k in the above equation. It first estimates the ridge function ft and then determines parameters such as the projection direction jt and the contribution weight coefficient t of the ridge function ft, satisfying the minimization criterion in Equation (3):
Mu is the optimal number of ridge functions, and Wm is the weight coefficient of the dependent variable.
3.2. Modeling Process
In PPR modeling, there are five main parameters: P, Q, M, Mu, and Span. P is the number of influencing factors (i.e., input variables); Q is the number of dependent variables (i.e., output variables); M is the upper limit of the ridge function, and Mu is the optimal number of the ridge function. M and Mu determine the fineness of the model when analyzing the internal structure of the data. Span is the smoothing coefficient, which is determined by the relative error of the test data and determines the sensitivity of the model. Among the above parameters, only P and Span need to be manually determined, while the rest of the parameters do not require artificial assumptions and can be decided based on the modeling data. Therefore, the PPR modeling process is entirely focused on the internal structure of the data, remaining true to the original data and being completely objective. In the PPR modeling process, an ”accuracy consistency test” is used to verify the validity of the model. If the similarity between the modeling samples and the inspection samples is high and close, then no over-fitting or under-fitting will occur [22].
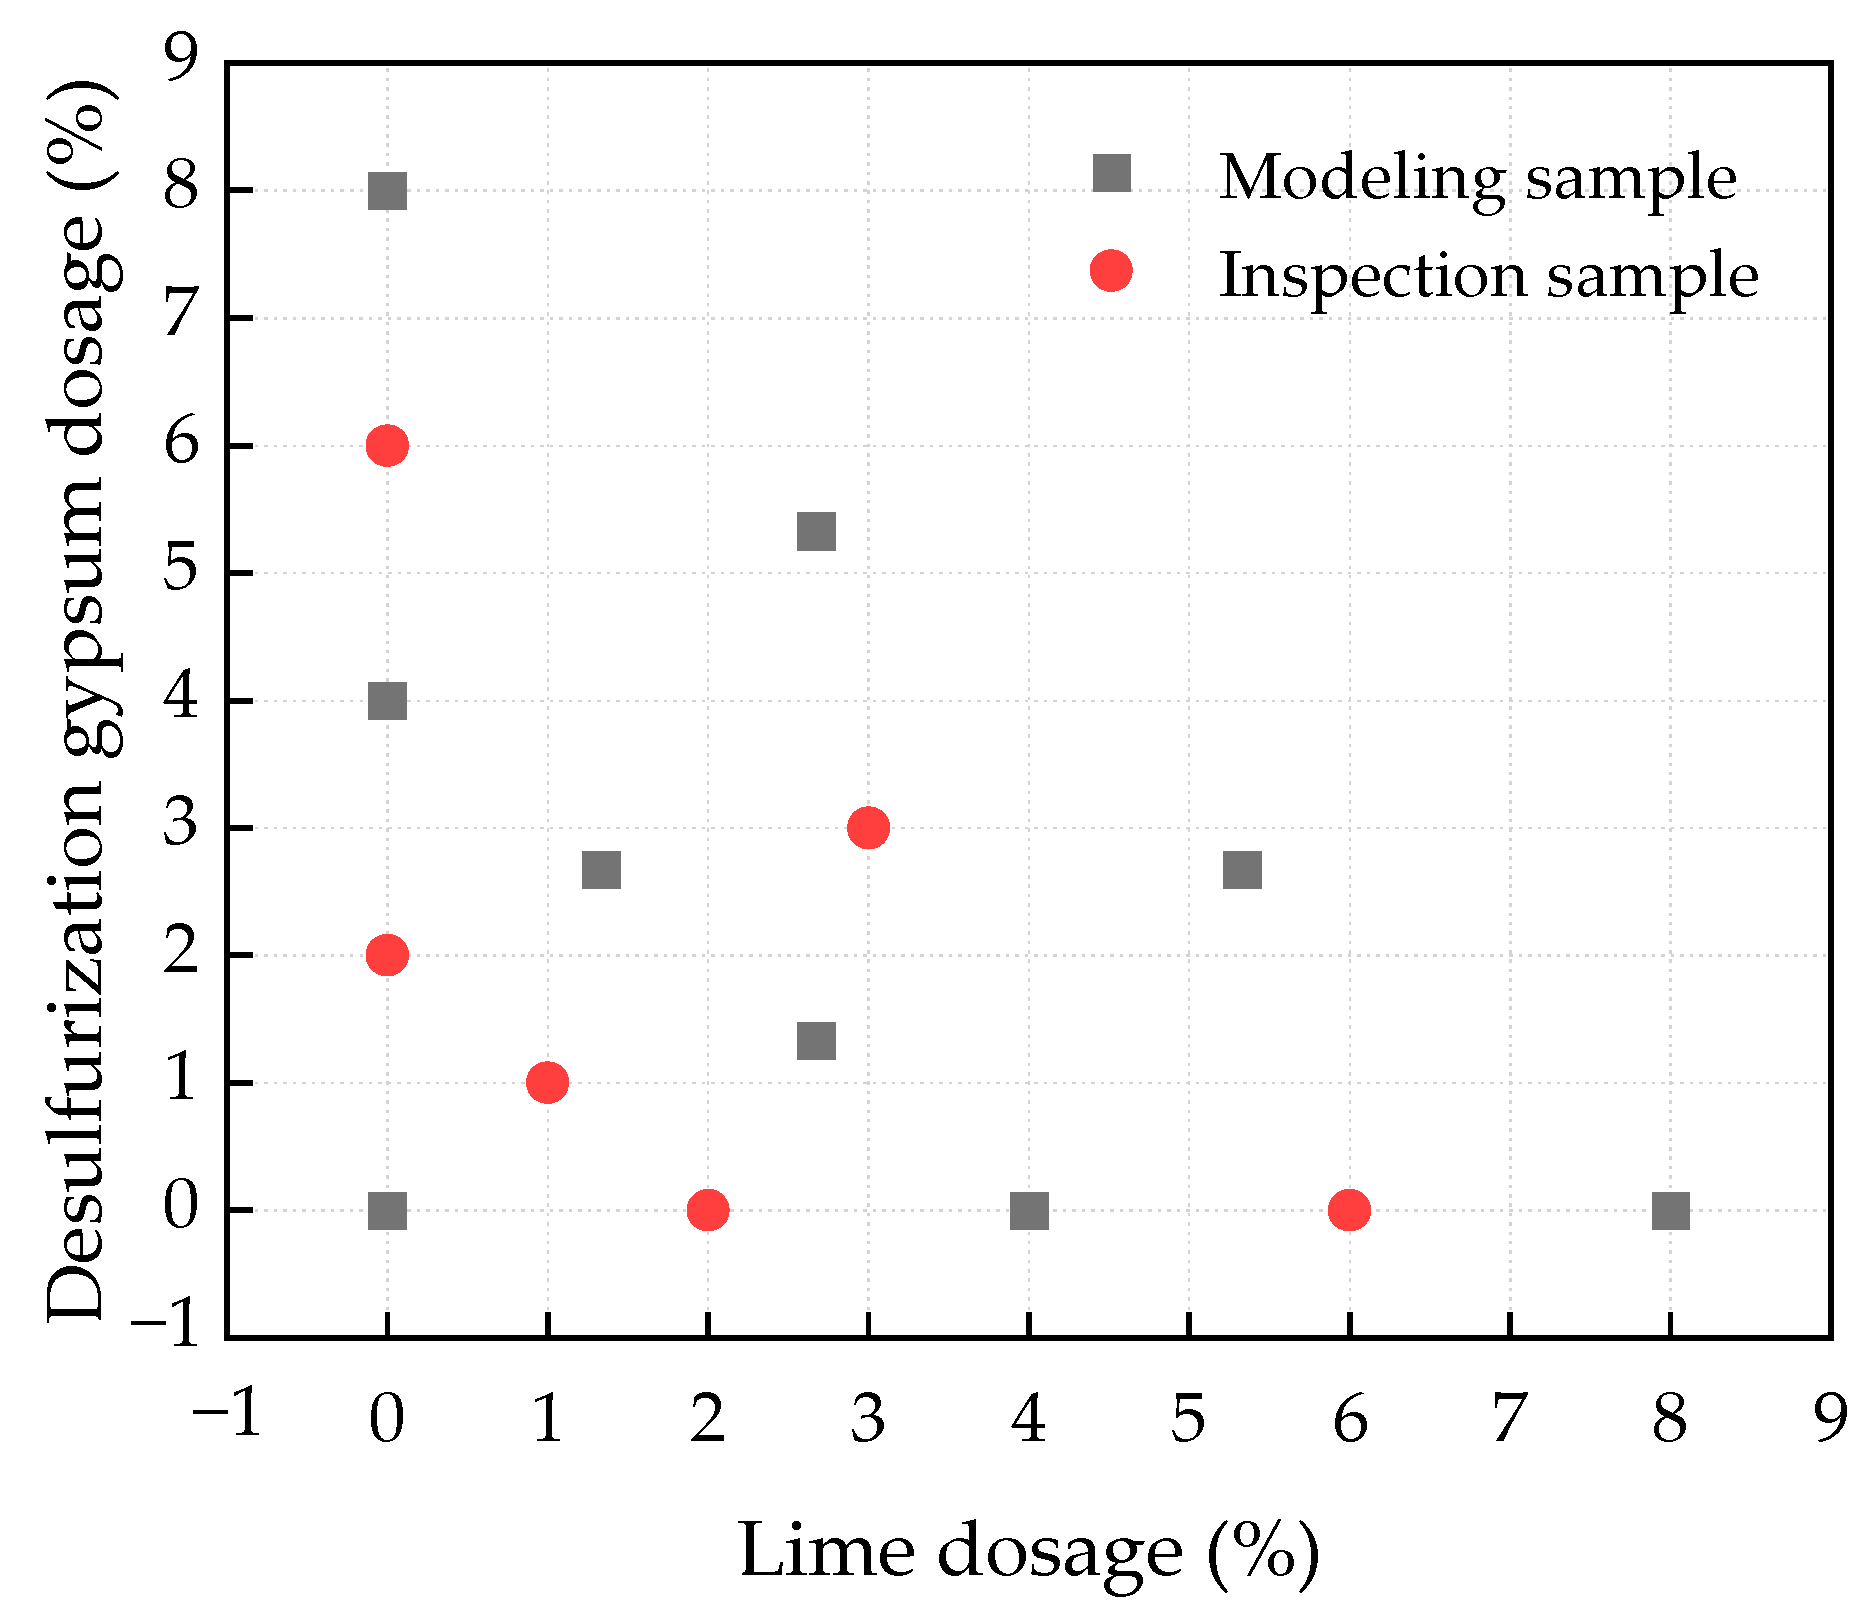
According to the research results of Gong et al. [14], the modeling samples should fully consider the boundary points of each test interval and make the distribution of each sample within the test interval as uniform as possible. In addition, their research also found that using nine modeling samples and six validation samples can achieve high-precision modeling when using PPR. Therefore, using lime content as the x-axis and desulfurized gypsum content as the y-axis, the experimental samples were established as shown in Figure 3, so that each sample point is evenly orthogonal within the test interval.
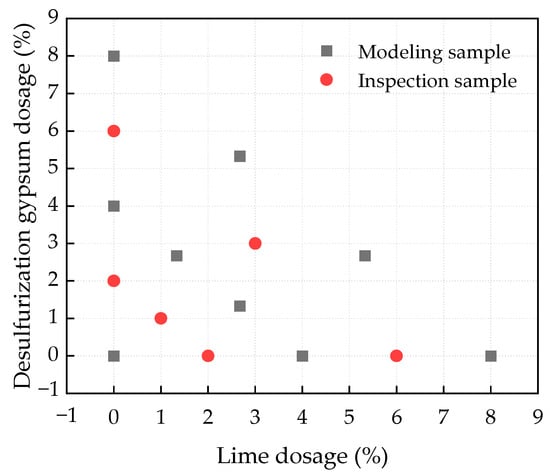
Figure 3.
Distribution of the modeling sample and the inspection sample.
Using the PPR program, modeling calculations of the 7-day and 28-day unconfined compressive strength and the BDR were conducted for the sample points in the experimental scheme shown in Figure 3. During the operation of the PPR program, four model projection parameters were determined as follows: the number of influencing factors, P, was set to 2; the smoothness coefficient, Span, was determined as 0.5, based on the precision of the experimental data; the upper limit of the ridge function, M, was set to 5; and the optimal number of ridge functions, Mu, was set to 3. Among these parameters, the smoothness coefficient, Span, is a parameter that determines the sensitivity of the PPR model. A smaller Span makes the PPR prediction model more sensitive, with the range of Span being 0 < Span < 1. The values of Span, M, Mu, and other parameters should satisfy the minimization criterion of Equation (5).
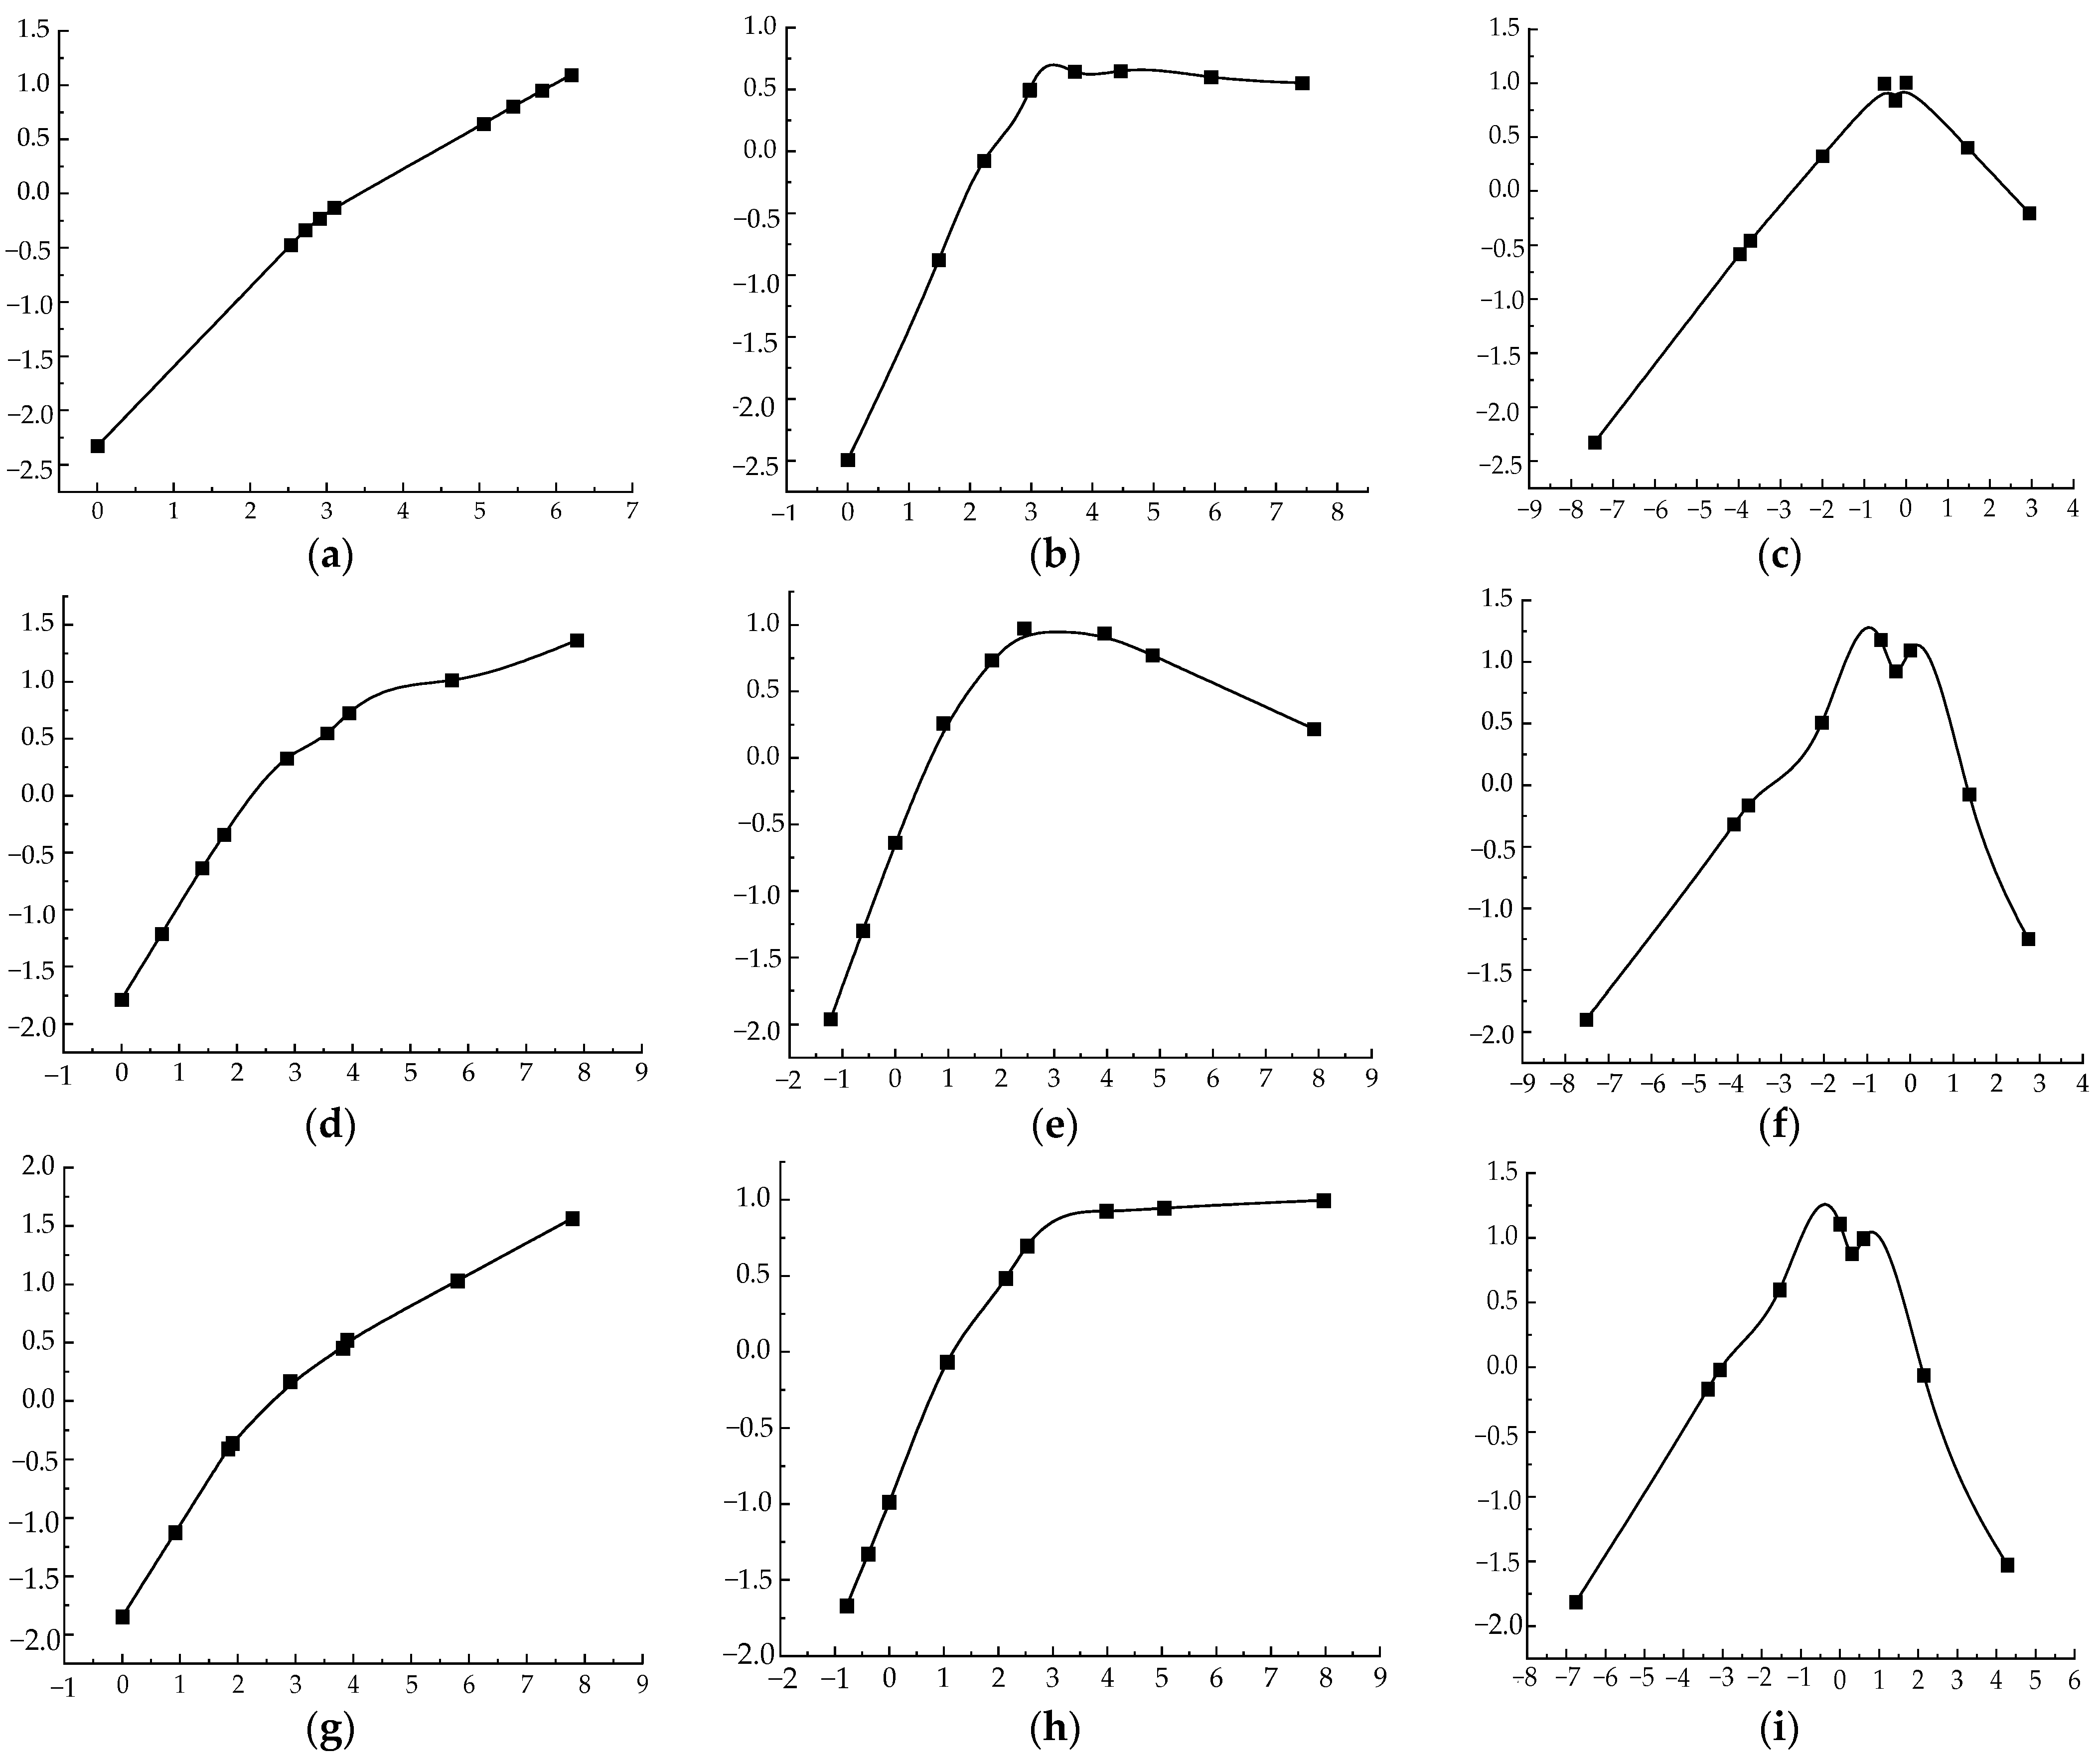
After calculations using the PPR program, the impact weight coefficients of the two types of activators, lime and desulfurized gypsum, on the unconfined compressive strength and BDR of the AASCSS at different ages were obtained (see Table 4). The ridge function images are presented in Figure 4. The projection direction α and the contribution weight coefficient β of the ridge functions are as follows:
Table 4.
Contribution of the weight coefficients of two influencing factors to the mechanical performance indicators and freeze–thaw resistance indicators.
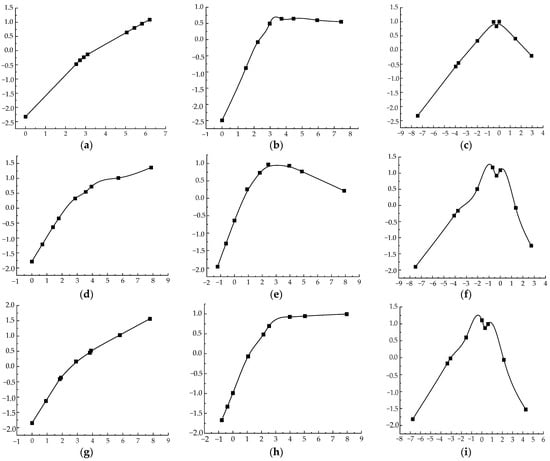
Figure 4.
Three optimal ridge function images of the mechanical performance and frost resistance. (a–c) are the three optimal ridge function images for the 7-day unconfined compressive strength of the mixture; (d–f) are the three optimal ridge function images for the 28-day unconfined compressive strength of the mixture; (g–i) are the three optimal ridge function images for the BDR.
If the abscissas of the 7-day unconfined compressive strength ridge function are denoted as G1, G2, and G3, then G1, G2, and G3 can be represented as
The three ridge functions of the 7-day unconfined compressive strength can be represented as f1(G1), f2(G2), and f3(G3).
By substituting the projection direction α, weight coefficient β, and the three optimal ridge functions shown in Figure 4 into Equation (4) and performing calculations, the PPR calculation model for the 7-day unconfined compressive strength is as follows:
F7d(g) = 5.5722 + 0.6426(0.88f1(G1) + 0.2745f2(G2) + 0.2607f3(G3))
Similarly, the PPR calculation models for the 28-day unconfined compressive strength and BDR are as follows:
F28d(g) = 7.46 + 0.3988(0.9275f4(G4) + 0.7149f5(G5) + 0.2646f6(G))
FBDR(g) = 92.37 + 1.47(0.81f7(G7) + 0.637f8(G8) + 0.5895f9(G9))
G4, G5, and G6 are the abscissas of the 28-day unconfined compressive strength ridge functions, and G7, G8, and G9 are the abscissas of the BDR ridge functions. f4(G4), f5(G5), and f6(G6) are the three ridge functions for the 28-day unconfined compressive strength, and f7(G7), f8(G8), and f9(G9) are the three ridge functions for the BDR.
Simultaneously, the weight coefficients for the two influencing factors, the lime dosage and the desulfurized gypsum dosage, were obtained for the 7-day and 28-day unconfined compressive strength and BDR, as shown in Table 4.
According to Table 4, desulfurized gypsum significantly influences the 7-day and 28-day unconfined compressive strength and BDR of the AASCSS, while lime has a relatively smaller impact on the unconfined compressive strength and BDR of the AASCS. In other words, desulfurized gypsum effectively enhances the mechanical performance and freeze–thaw resistance of AASCSS, while lime has a relatively minor effect on improving the mechanical and freeze–thaw resistance properties of AASCSS. This conclusion is consistent with the experimental results and analysis in Section 2.4.
3.3. PPR Model Calculation Accuracy and Error Analysis
In the model accuracy analysis, firstly, the “reverse fitting” calculation is performed on the modeling samples using the PPR calculation model established in Section 2.2, and the calculated results are set as the model prediction values. When the relative error between the model prediction values and the measured values satisfies the condition |δ| ≤ 10%, it is considered qualified, thus determining the qualification rate of this calculation model. Finally, the qualification rates of the modeling samples and validation samples are calculated by performing substitution calculations on the retained validation samples and determining the validation rate using the above judgment method. If the qualification rates of the modeling and validation samples are both high and close to each other, then the calculation model is considered to have good stability and reliability. According to the PPR modeling process described above, the model prediction values of the modeling samples and validation samples were calculated, and the calculated model prediction values were compared with the experimentally measured values, as shown in Figure 5. According to the above PPR modeling process, the model predictions for the modeling and test samples were calculated. The calculated model predictions were then compared with the experimentally measured values, as shown in Figure 5.
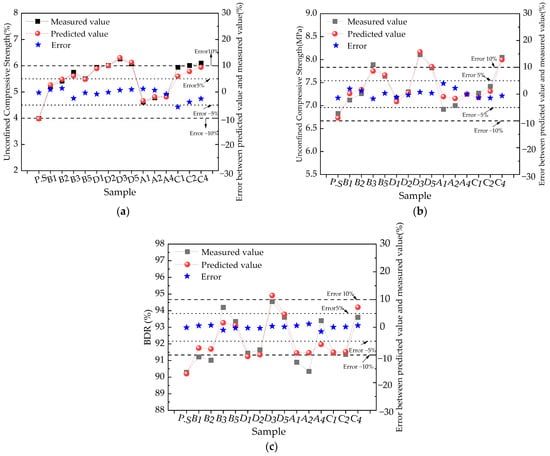
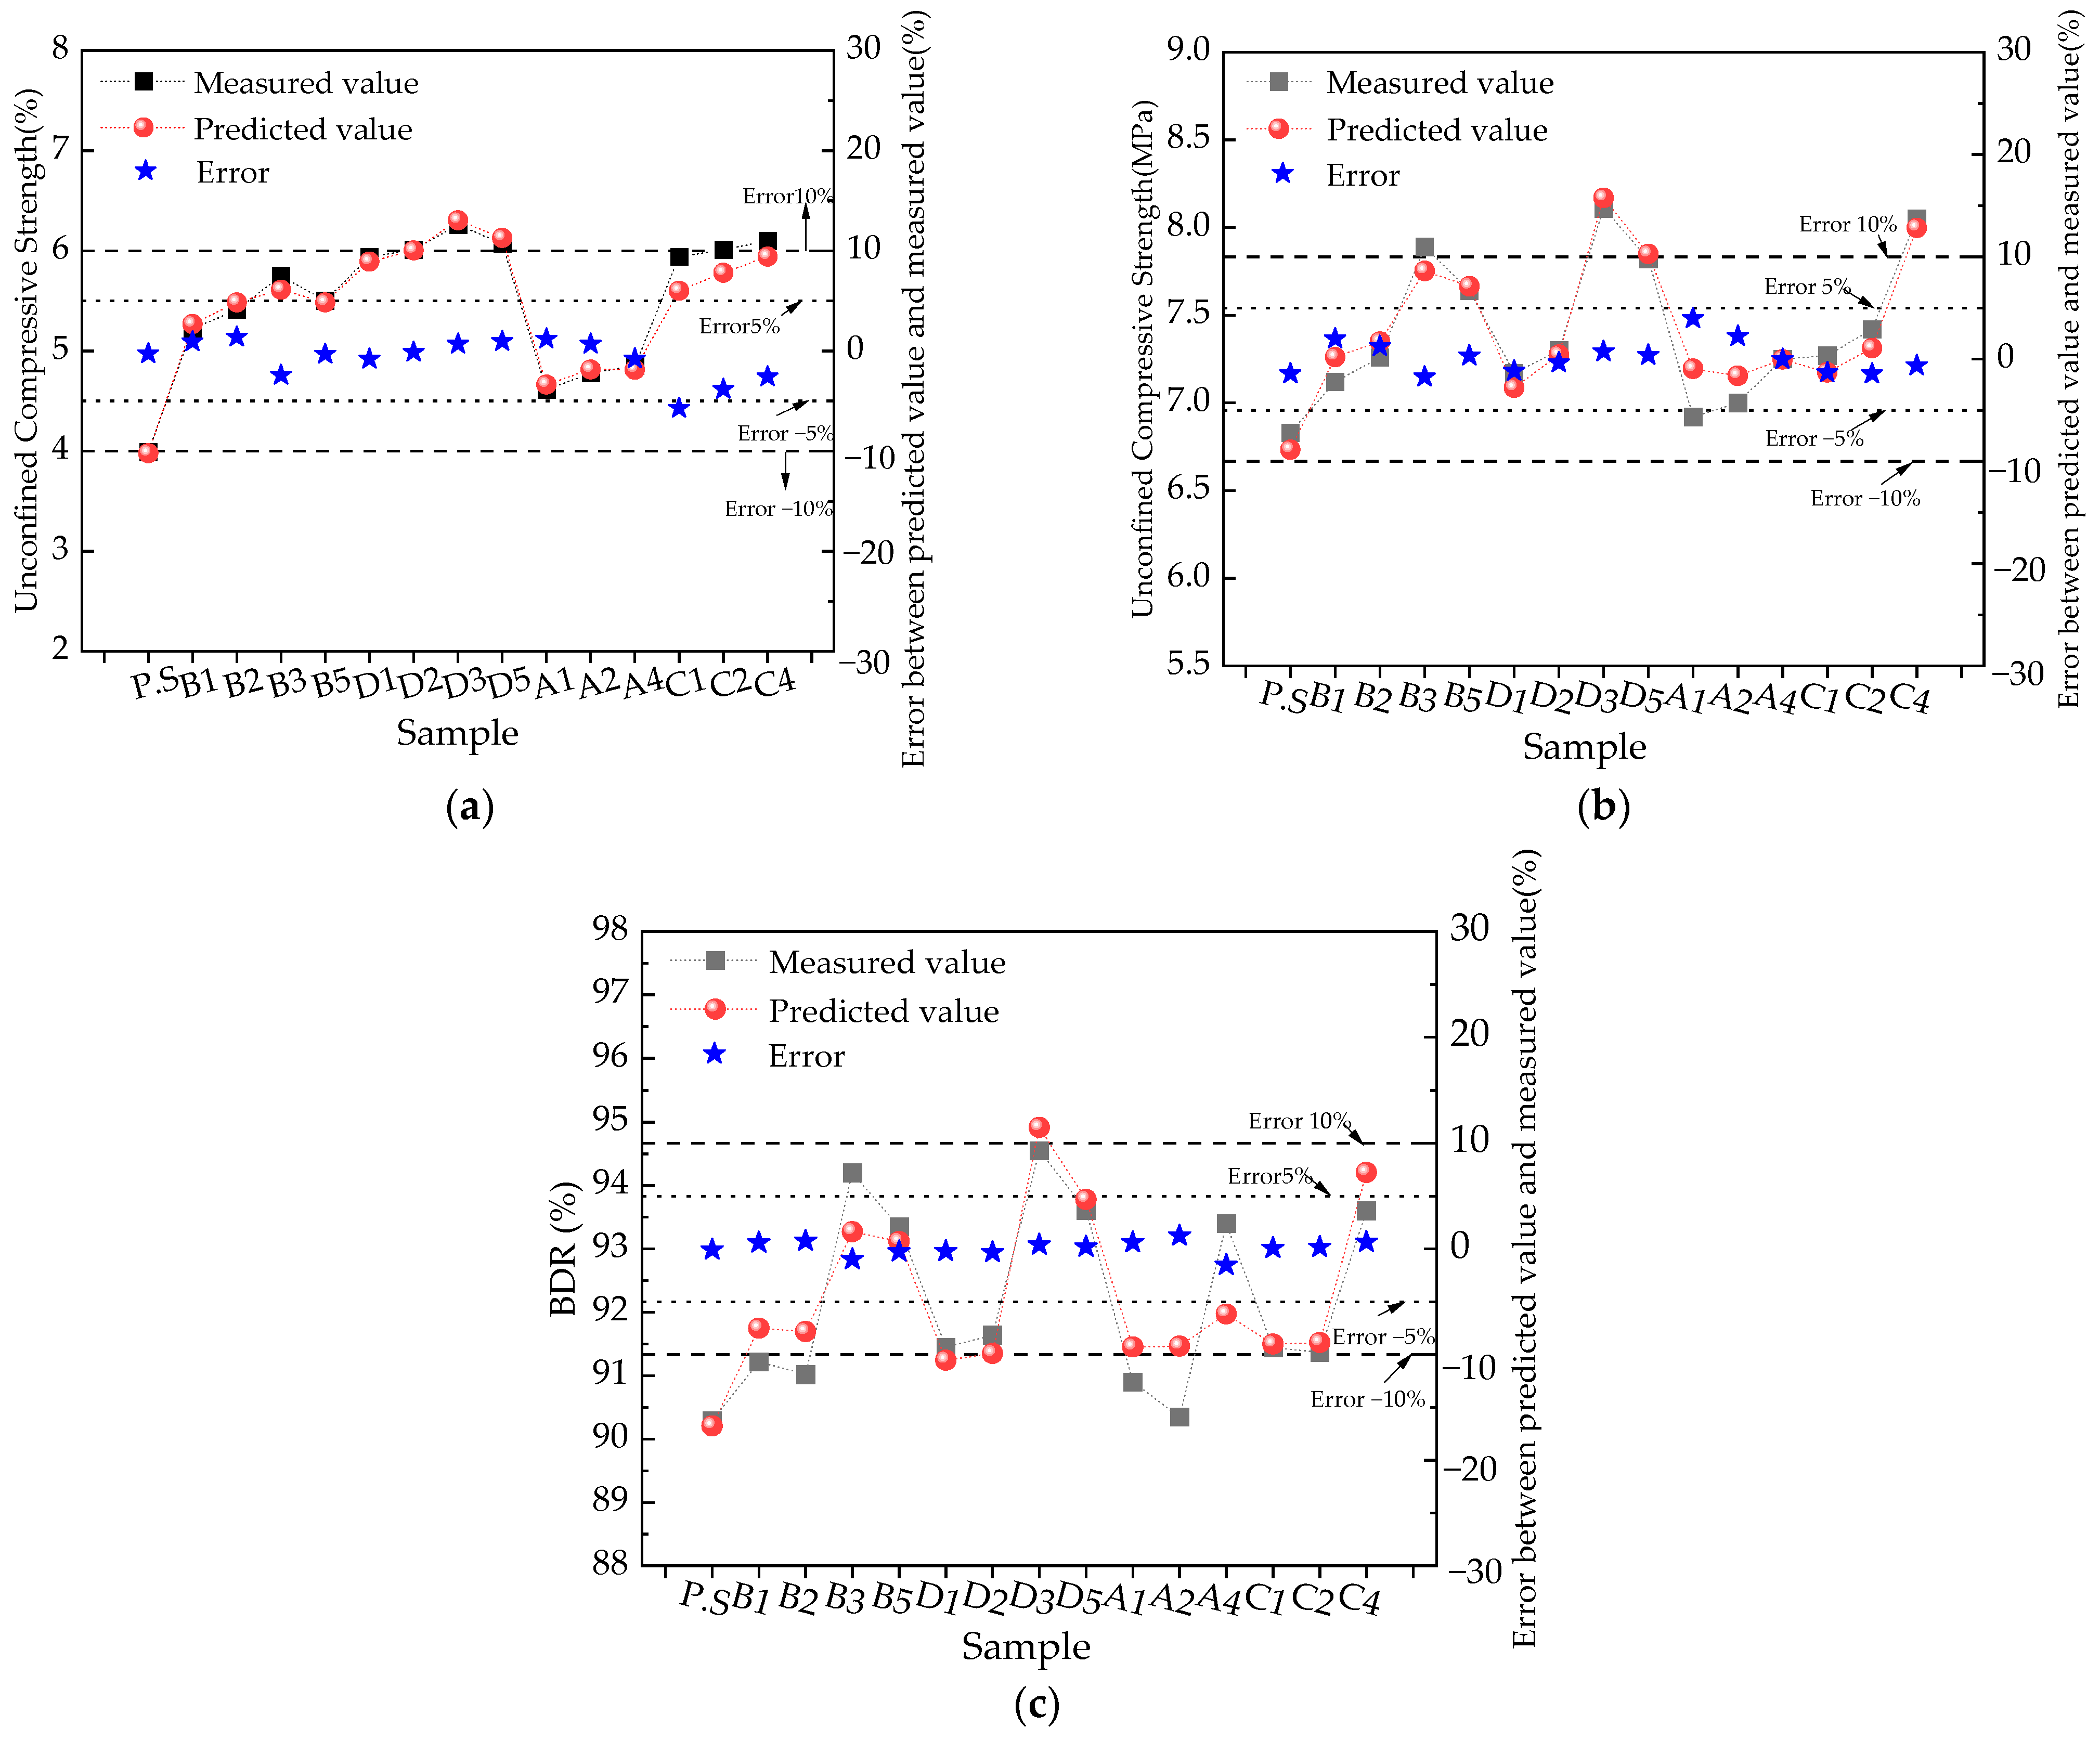
Figure 5.
The comparison between measured values from the modeling samples and verification samples with the calculated values of the model. (a) 7-day unconfined compressive strength for AAASCSS. (b) 28-day unconfined compressive strength for AAASCSS. (c) BDR for the AAASCSS.
Through calculation and analysis, it was found that the model predictions for the 7-day and 28-day unconfined compressive strength and BDR of the modeling samples and test samples exhibited small deviations from the measured values. The errors in the predictions and measured values mostly fell within the interval of [−5%, 5%], and they all satisfied the error condition of |δ| ≤ 10%. The qualification rates of the PPR model calculations for all modeling samples and test samples reached 100%. After calculation, the average relative errors for the modeling samples of 7-day unconfined compressive strength, 28-day unconfined compressive strength, and BDR were 0.88%, 1.03%, and 0.42%, respectively. The average relative errors for the test samples were 2.47%, 1.61%, and 0.71%, respectively. Therefore, the predictive calculation model established using the PPR method demonstrated small errors, high calculation accuracy, and stability and reliability characteristics.
3.4. Simulation Calculation
Using the PPR model established in Section 3.2, the 7-day and 28-day UCS and BDR of the AASCSS under 81 different admixture levels ranging from 0% to 8%, as shown in Figure 6, were simulated. Based on the simulation results, contour plots of AASCSS’s 7-day UCS-BDR and 28-day UCS-BDR were plotted with lime content as the x-axis and desulfurized gypsum content as the y-axis. Considering that in the construction of semi-rigid pavement base layers in road surface construction in China [38], the 7-day UCS is often used as the main control index for construction quality, only the contour plot of the 7-day UCS-BDR is presented in this paper, as shown in Figure 7 (solid lines represent the contour lines of AASCSS’s 7-day UCS, and dashed lines represent the BDR of the AASCSS).
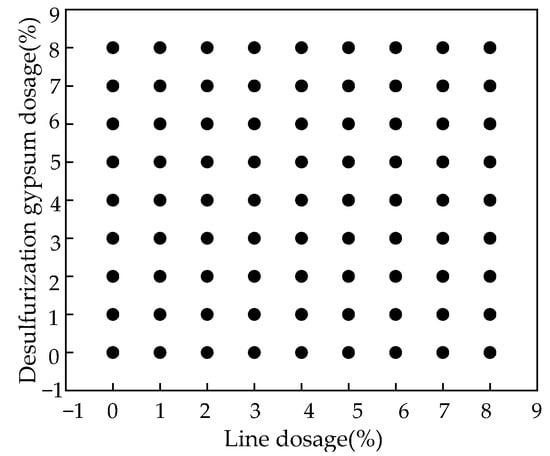
Figure 6.
Exciter composition scheme of the AASCSS.
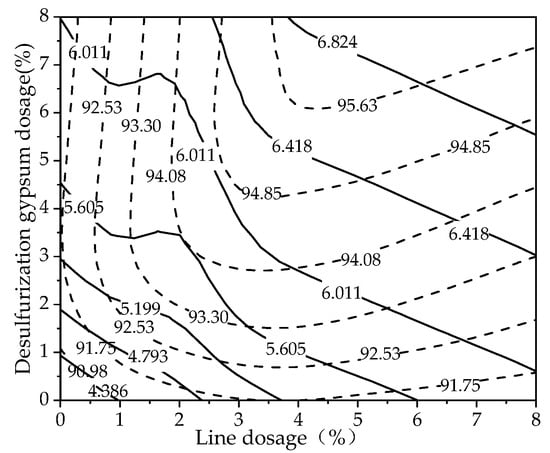
Figure 7.
Contour plot of the 7-day UCS versus the BDR of the AASCSS. Where the solid line represents the 7-day UCS contour and the dashed line represents the BDR contour.
4. AASCSS Comprehensive Performance Optimization Methodology
In road engineering, the comprehensive performance analysis of AASCSS often involves determining the material composition with the best frost resistance under a certain mechanical strength index or the highest mechanical strength under a certain frost-resistance index. In this case, based on the mechanical strength index or frost-resistance requirements, the desulfurized gypsum and lime content that meet different design criteria can be determined by analyzing the contour lines of the 7-day unconfined compressive strength and BDR of the AASCSS, as shown in Figure 8.
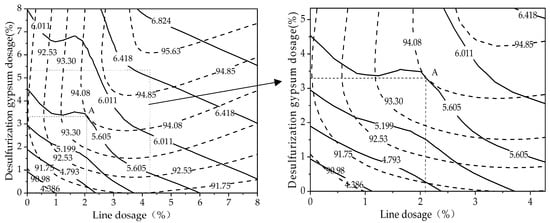
Figure 8.
Integrated optimization of mechanical properties and frost resistance. Where the solid line represents the 7-day UCS contour and the dashed line represents the BDR contour.
An example illustrates this analysis method: for a certain road engineering project, the required 7-day unconfined compressive strength of AASCSS is 5.6 MPa. By determining the intersection point (Point A in Figure 8) of the 5.605 MPa contour line of the 7-day unconfined compressive strength and the contour line of the BDR to the right of it, the maximum value of BDR is found to be 94.08%. The corresponding desulfurized gypsum and lime contents are 3.3% and 2.1%, respectively.
5. Discussion
Using alkali-activated slag cement-stabilized materials as road base materials offers several advantages, including promoting environmental protection and resource utilization, enhancing the mechanical performance and durability of the road base structure, and reducing the cost of road construction. These benefits align with the current development trend of green road construction [39,40]. When using PPR modeling analysis, the dosage range of each activator should first be determined through preliminary experiments. Then, PPR modeling should be employed to conduct multi-objective optimization analysis, ultimately determining the specific mix proportions. The existing design methods for mixed proportions of the AASCSS have shown significant advantages in optimizing single evaluation indicators. However, mixed proportion schemes in practical engineering often involve multiple evaluation indicators. The optimization process of the aforementioned methods requires manual intervention and relies on the decision-maker’s experience in mixed proportion design, which may lead to outcomes that deviate from the ideal solution. This study employed PPR modeling technology to establish a computational model for the mechanical and frost-resistance performance indicators of the AASCSS. By using the established PPR model for simulation calculations to generate contour maps of comprehensive performance, the analysis of these contour maps enables the direct determination of the dosages. In the mix proportions of AASCSS derived from the contour maps, the amount of cementitious materials in the AASCSS (Portland cement + ground granulated blast-furnace slag + alkaline activator) is equal to the amount of cement used in traditional cement-stabilized base materials. When the road engineering is located in a region with a warm climate and low requirements for freeze–thaw resistance, the focus should be primarily on the mechanical performance of the AASCSS. Conversely, when the road engineering is situated in a region with seasonal freezing and high requirements for freeze–thaw resistance, the emphasis should be on the freeze–thaw performance of the AASCSS. The mix-proportion schemes of AASCSS obtained through this method are more objective and reasonable. Compared with traditional design methods, the PPR modeling technique requires less experimental effort in designing AASCSS mix proportions. It can accurately predict the evaluation indicators of various mix-proportion schemes. This method can be used to study the patterns of change in factors and evaluation indicators, and to adjust the values of evaluation indicators accordingly. It also solves the problem of variability in the optimization results due to differences in decision-makers’ experience levels. Based on the analysis results of this study and in conjunction with the related literature [41,42,43,44,45], it is evident that optimizing mix-proportion schemes with a focus on comprehensive performance is feasible, both from objective theoretical calculations and subjective judgment. Since the constituent materials of sustainable pavement base materials such as geopolymer-stabilized soil or recycled aggregate mixtures are similar to those of AASCSS, and they exhibit comparable mechanical and durability properties, the PPR modeling method is also applicable to these sustainable pavement base materials. However, this study’s PPR modeling analysis method is only suitable for optimizing AASCSS mix proportions based on two main performance indicators. For road engineering in different regions, when using PPR modeling for optimization, it is also possible to consider multi-objective optimization by incorporating mechanical performance along with durability performance, such as shrinkage performance, sulfate resistance, and chloride resistance. When the number of performance indicators exceeds three, PPR modeling can be combined with the TOPSIS method or fuzzy comprehensive evaluation for multi-objective optimization [46,47]. Further research is recommended to validate the feasibility of these methods. In the practical engineering application of AASCSS, the material composition ratios of AASCSS should first be determined through preliminary experiments. When using alkaline activators such as NaOH and water glass, special attention should be paid to the setting time of the cementitious materials in the AASCSS to ensure sufficient time for mixing [48,49,50], transportation, laying, and compaction. Additionally, it is important to improve the uniformity of mixing during the AASCSS blending process.
6. Conclusions
This paper employed a combined experimental and theoretical analysis approach to investigate the mechanical properties and freeze–thaw resistance of AASCSS. A PPR model was established, transforming the multi-objective performance optimization issue of AASCSS into single-objective optimization problems for mechanical and freeze–thaw resistance properties. The main conclusions drawn are as follows:
- (1)
- Both desulfurization gypsum and lime were found to enhance the mechanical properties and freeze–thaw resistance of AASCSS; the effects were more pronounced when desulfurization gypsum and lime were used in combination. With an increase in the proportion of desulfurization gypsum, improvements in the mechanical properties and freeze–thaw resistance of the AASCSS were observed.
- (2)
- The models for the 7-day and 28-day unconfined compressive strength and BDR of AASCSS, established using projection-pursuit regression (PPR) technology, were characterized by low error, high computational accuracy, and excellent stability. This enabled highly accurate predictions of the 7-day and 28-day unconfined compressive strength and the BDR of the AASCSS. Furthermore, the computational results of the PPR model objectively reflected the influence patterns of activator types and dosages on the mechanical and freeze–thaw resistance properties of the AASCSS.
- (3)
- Practical evidence demonstrates that the PPR model and optimization methods are ideal engineering tools for predicting the performance of AASCSS and for optimizing its mix proportions. In engineering applications, it is recommended to optimize the mix proportions of the AASCSS based on durability indicators, such as shrinkage performance and erosion resistance, in conjunction with the geographical conditions of the specific road engineering site. When multiple evaluation indicators are involved, the PPR model can also be combined with TOPSIS or fuzzy comprehensive evaluation to conduct multi-objective optimization of AASCSS mix proportions.
Author Contributions
Conceptualization, Q.L. and Z.Z.; methodology, Q.L. and K.X.; software, K.X.; validation, D.H. and L.Z.; formal analysis, Q.L., K.X. and Z.Z.; data curation, Q.L., K.X. and Z.Z.; writing—original draft preparation, Q.L.; writing—review and editing, Q.J.; project administration, Q.J. and W.S.; funding acquisition, Q.J. and W.S. All authors have read and agreed to the published version of the manuscript.
Funding
This research was funded by the Xinjiang Huli Jiayuan Environmental Protection Technology Company Construction Foundation (grant numbers HLJY2023KY0313A and HLJY2023KY0315A) and the Xinjiang Key Laboratory of Hydraulic Engineering’s Security.
Data Availability Statement
All the data utilized in current research are available from the corresponding author upon reasonable request.
Conflicts of Interest
Author Wanzhong Su was employed by the company Xinjiang Huli Jiayuan Environmental Protection Technology Co. The remaining authors declare that the research was conducted in the absence of any commercial or financial relationships that could be construed as a potential conflict of interest. The authors declare that this study received funding from Xinjiang Huli Jiayuan Environmental Protection Technology Company Construction Foundation.
References
- Feng, Y.-H.; Zhang, Z.; Gao, J.; Feng, G.-P.; Qiu, L.; Feng, D.-L.; Zhang, X.-X.; Zhu, X. Research Status of Centrifugal Granulation, Physical Heat Recovery and Resource Utilization of Blast Furnace Slags. J. Anal. Appl. Pyrolysis 2021, 157, 105220. [Google Scholar] [CrossRef]
- Naresh, B.; Saravanan, M. Experimental Study of Replacement of Cement with Ground Granulated Blast Furnace Slag. Mater. Today Proc. 2022, 62, 3493–3496. [Google Scholar] [CrossRef]
- Chen, T.-T.; Wang, C.-C.; Hsiung, B.C.B.; Wang, H.-Y. Seven-Day Test Result Assessment of the Developed Strength in Composite Cement Mortar with Slag. Constr. Build. Mater. 2017, 152, 587–597. [Google Scholar] [CrossRef]
- Ahmad, J.; Majdi, A.; Babeker Elhag, A.; Deifalla, A.F.; Soomro, M.; Isleem, H.F.; Qaidi, S. A Step towards Sustainable Concrete with Substitution of Plastic Waste in Concrete: Overview on Mechanical, Durability and Microstructure Analysis. Crystals 2022, 12, 944. [Google Scholar] [CrossRef]
- Tao, Z.; Zhang, Y.; Chen, X.; Gu, X. Effects of Freeze-Thaw Cycles on the Mechanical Properties of Cement-Fiber Composite Treated Silty Clay. Constr. Build. Mater. 2022, 316, 125867. [Google Scholar] [CrossRef]
- Wen, H.; Suo, C.; Hao, Y.; Fan, P.; Dong, X. Effect of Freezing-Thawing Cycle on the Mechanical Properties and Micromechanism of Red Mud-Calcium-Based Composite Cemented Soil. Adv. Civ. Eng. 2020, 2020, 8825576. [Google Scholar] [CrossRef]
- Tekle, B.H.; Holschemacher, K.; Löber, P.; Heiden, B. Mechanical Behavior and Frost-Resistance of Alkali-Activated Cement Concrete with Blended Binder at Ambient Curing Condition. Buildings 2021, 11, 52. [Google Scholar] [CrossRef]
- Feng, L.; Yi, S.; Zhao, S.; Zhong, Q.; Ren, F.; Liu, C.; Zhang, Y.; Wang, W.; Xie, N.; Li, Z.; et al. Recycling of Aluminosilicate-Based Solid Wastes through Alkali-Activation: Preparation, Characterization, and Challenges. Buildings 2024, 14, 226. [Google Scholar] [CrossRef]
- Trejo, D.; Prasittisopin, L. Chemical Transformation of Rice Husk Ash Morphology. ACI Mater. J. 2015, 112, 385–392. [Google Scholar] [CrossRef]
- Prasittisopin, L.; Trejo, D. Performance Characteristics of Blended Cementitious Systems Incorporating Chemically Transformed Rice Husk Ash. Adv. Civ. Eng. Mater. 2017, 6, 17–35. [Google Scholar] [CrossRef]
- Wang, X.; Yan, Y.; Tong, X.; Gong, Y. Investigation of Mineral Admixtures on Mechanical Properties of Alkali-Activated Recycled Concrete Powders Cement. Buildings 2022, 12, 1234. [Google Scholar] [CrossRef]
- Li, M.; Huang, G.; Cui, Y.; Wang, B.; Zhang, S.; Wang, Q.; Feng, J. Improvement of Mechanical Properties and Condensation Behavior for Alkali-Activated Materials by Sodium Silicate. Crystals 2022, 12, 1018. [Google Scholar] [CrossRef]
- Kamath, M.; Prashant, S.; Ralegaonkar, R. Microstructure Properties of Popular Alkali-Activated Pastes Cured in Ambient Temperature. Buildings 2023, 13, 858. [Google Scholar] [CrossRef]
- Lee, S.; Shin, S. Prediction on Compressive and Split Tensile Strengths of GGBFS/FA Based GPC. Materials 2019, 12, 4198. [Google Scholar] [CrossRef] [PubMed]
- Nehdi, M.L. Optimization of Ternary Cementitious Mortar Blends Using Factorial Experimental Plans. Mater. Struct. 2002, 35, 495–503. [Google Scholar] [CrossRef]
- El-Hassan, H.; Hussein, A.; Medljy, J.; El-Maaddawy, T. Performance of Steel Fiber-Reinforced Alkali-Activated Slag-Fly Ash Blended Concrete Incorporating Recycled Concrete Aggregates and Dune Sand. Buildings 2021, 11, 327. [Google Scholar] [CrossRef]
- Algaifi, H.A.; Mustafa Mohamed, A.; Alsuhaibani, E.; Shahidan, S.; Alrshoudi, F.; Huseien, G.F.; Bakar, S.A. Optimisation of GBFS, Fly Ash, and Nano-Silica Contents in Alkali-Activated Mortars. Polymers 2021, 13, 2750. [Google Scholar] [CrossRef]
- Kakasor Ismael Jaf, D.; Ismael Abdulrahman, P.; Salih Mohammed, A.; Kurda, R.; Qaidi, S.M.A.; Asteris, P.G. Machine Learning Techniques and Multi-Scale Models to Evaluate the Impact of Silicon Dioxide (SiO2) and Calcium Oxide (CaO) in Fly Ash on the Compressive Strength of Green Concrete. Constr. Build. Mater. 2023, 400, 132604. [Google Scholar] [CrossRef]
- Tan, X.; Zhan, H.; Qin, X. Estimation of Projection Pursuit Regression via Alternating Linearization. Comput. Stat. Data Anal. 2023, 187, 107793. [Google Scholar] [CrossRef]
- Tao, H.; Wu, Z.; Yang, Y.; Li, Q.; Mahemujiang, A.; Jiang, Y.; Wei, J. Establishment of a Projection-Pursuit-Regression-Based Prediction Model for the Filtration Performance of a Micro-Pressure Filtration and Cleaning Tank for Micro-Irrigation. J. Clean. Prod. 2023, 388, 135992. [Google Scholar] [CrossRef]
- Gong, J.; Jiang, C.; Tang, X.; Zheng, Z.; Yang, L. Optimization of Mixture Proportions in Ternary Low-Heat Portland Cement-Based Cementitious Systems with Mortar Blends Based on Projection Pursuit Regression. Constr. Build. Mater. 2020, 238, 117666. [Google Scholar] [CrossRef]
- Gong, J.; Zhan, X.; Gong, M.; Wang, L.; Xie, G. Mechanical Strength Characteristics of Saline Soil Stabilized by All-Solid Waste Cementitious Material Based on Projection Pursuit Regression Modeling. J. Mater. Cycles Waste Manag. 2023, 25, 3490–3507. [Google Scholar] [CrossRef]
- Ju, C.; Liu, Y.; Yu, Z.; Yang, Y. Cement-Lime-Fly Ash Bound Macadam Pavement Base Material with Enhanced Early-Age Strength and Suppressed Drying Shrinkage via Incorporation of Slag and Gypsum. Adv. Civ. Eng. 2019, 2019, 8198021. [Google Scholar] [CrossRef]
- Wang, T.; Wu, K.; Wu, M. Development of Green Binder Systems Based on Flue Gas Desulfurization Gypsum and Fly Ash Incorporating Slag or Steel Slag Powders. Constr. Build. Mater. 2020, 265, 120275. [Google Scholar] [CrossRef]
- Xia, X.; Zhang, L.; Yuan, X.; Ma, C.; Song, Z.; Zhao, X. Integrated Assessment of the Environmental and Economic Effects of Resource Utilization Process for Lime/Gypsum Flue Gas Desulfurization Collaborative Desulfurized Gypsum. Environ. Eng. Sci. 2021, 38, 886–898. [Google Scholar] [CrossRef]
- JTG E51—2009; Material Test Methods of Materials Stabilized with Inorganic Highway Engineering. Ministry of Transportation Highway Research Institute: Beijing, China, 2009.
- Shi, P.; Falliano, D.; Yang, Z.; Marano, G.C.; Briseghella, B. Investigation on the Anti-Carbonation Properties of Alkali-Activated Slag Concrete: Effect of Activator Types and Dosages. J. Build. Eng. 2024, 91, 109552. [Google Scholar] [CrossRef]
- Shіshkina, A.; Piskun, I. Formation of the Strength of Fine-Grained Concrete Based on Modified Slag Portland Cement. East. Eur. J. Enterp. Technol. 2023, 5, 74–81. [Google Scholar] [CrossRef]
- Wei, L.; Yao, Z.; Li, H.; Guo, H.; Li, Y. Mechanical Properties of Aeolian Sand Concrete Made from Alkali-Treated Aeolian Sand and Zeolite Powder. Materials 2024, 17, 1537. [Google Scholar] [CrossRef]
- Oti, J.; Adeleke, B.O.; Mudiyanselage, P.R.; Kinuthia, J. A Comprehensive Performance Evaluation of GGBS-Based Geopolymer Concrete Activated by a Rice Husk Ash-Synthesised Sodium Silicate Solution and Sodium Hydroxide. Recycling 2024, 9, 23. [Google Scholar] [CrossRef]
- Amer, I.; Kohail, M.; El-Feky, M.S.; Rashad, A.; Khalaf, M.A. A Review on Alkali-Activated Slag Concrete. Ain Shams Eng. J. 2021, 12, 1475–1499. [Google Scholar] [CrossRef]
- Zhu, J.; Cui, H.; Cui, L.; Yang, S.; Zhang, C.; Liu, W.; Zheng, D. Mutual Activation Mechanism of Cement–GGBS–Steel Slag Ternary System Excited by Sodium Sulfate. Buildings 2024, 14, 631. [Google Scholar] [CrossRef]
- He, J.; Li, M.; Bai, W.; Sang, G.; Song, X. Effect of Slaked Lime on the Properties of Sodium Sulfate-Activated Alkali-Activated Slag Cement. Processes 2024, 12, 184. [Google Scholar] [CrossRef]
- Hossain, K.M.A.; Sood, D. Shrinkage, Permeation and Freeze–Thaw Characteristics of Ambient Cured High Calcium-Based Alkali-Activated Engineered Composites. Materials 2023, 16, 7101. [Google Scholar] [CrossRef] [PubMed]
- Zhong, J.; Cao, L.; Li, M.; Wang, S.; Liu, F.; Lv, X.; Peng, X. Mechanical Properties and Durability of Alkali-Activated Steel Slag–Blastfurnace Slag Cement. J. Iron Steel Res. Int. 2023, 30, 1342–1355. [Google Scholar] [CrossRef]
- Ye, G.; Qu, J.; Tao, J.; Dai, W.; Mao, Y.; Jin, Q. Autonomous Surface Crack Identification of Concrete Structures Based on the YOLOv7 Algorithm. J. Build. Eng. 2023, 73, 106688. [Google Scholar] [CrossRef]
- Ye, G.; Li, S.; Zhou, M.; Mao, Y.; Qu, J.; Shi, T.; Jin, Q. Pavement Crack Instance Segmentation Using YOLOv7-WMF with Connected Feature Fusion. Autom. Constr. 2024, 160, 105331. [Google Scholar] [CrossRef]
- JTG/T F20—2015; Technical Rules for Construction of Highway Pavement Base. Ministry of Transportation Highway Research Institute: Beijing, China, 2015.
- Zhong, W.L.; Sun, Y.H.; Zhao, X.; Fan, L.F. Study on Synthesis and Water Stability of Geopolymer Pavement Base Material Using Waste Sludge. J. Clean. Prod. 2024, 445, 141331. [Google Scholar] [CrossRef]
- Diliberto, C.; Chaouche, L.; Trauchessec, R.; El Bedoui, S.; Lecomte, A.; Reeb, P.; Arlt, K.-J. Modulation of Alpha Coefficient (α) and Reactivity in Granulated Blast Furnace Slag Binders Used in Road Construction. J. Sustain. Metall. 2018, 4, 326–332. [Google Scholar] [CrossRef]
- Zheng, X.; You, S.; Huang, H.; Lu, H.; Easa, S.; Yu, Y.; Jiang, Z.; Chen, Z.; Qiu, R. Performance Evaluation and Multi-Objective Optimization for Alkali-Activated Slag Concrete with Recycled Aggregate. Constr. Build. Mater. 2024, 411, 134318. [Google Scholar] [CrossRef]
- Cao, Y.; Zhao, P.; Chen, H.; Liu, Y.; Luo, H.; Qin, Y. Application of Hybrid Intelligent Algorithm for Multi-Objective Optimization of High Performance Concrete in Complex Alpine Environment Highway. Constr. Build. Mater. 2023, 406, 133376. [Google Scholar] [CrossRef]
- Wang, X.; Cui, F.; Cui, L.; Jiang, D. Research on a Multi-Objective Optimization Design for the Durability of High-Performance Fiber-Reinforced Concrete Based on a Hybrid Algorithm. Coatings 2023, 13, 2054. [Google Scholar] [CrossRef]
- Zheng, W.; Shui, Z.; Xu, Z.; Gao, X.; Zhang, S. Multi-Objective Optimization of Concrete Mix Design Based on Machine Learning. J. Build. Eng. 2023, 76, 107396. [Google Scholar] [CrossRef]
- Chen, H.; Deng, T.; Du, T.; Chen, B.; Skibniewski, M.J.; Zhang, L. An RF and LSSVM–NSGA-II Method for the Multi-Objective Optimization of High-Performance Concrete Durability. Cem. Concr. Compos. 2022, 129, 104446. [Google Scholar] [CrossRef]
- Zhou, J.; Xiahou, T.; Liu, Y. Multi-Objective Optimization-Based TOPSIS Method for Sustainable Product Design under Epistemic Uncertainty. Appl. Soft Comput. 2021, 98, 106850. [Google Scholar] [CrossRef]
- Wang, B.; Mo, C.; He, C.; Yan, Q. Fuzzy Synthetic Evaluation of the Long-Term Health of Tunnel Structures. Appl. Sci. 2017, 7, 203. [Google Scholar] [CrossRef]
- Nedeljković, M.; Li, Z.; Ye, G. Setting, Strength, and Autogenous Shrinkage of Alkali-Activated Fly Ash and Slag Pastes: Effect of Slag Content. Materials 2018, 11, 2121. [Google Scholar] [CrossRef] [PubMed]
- Nedunuri, A.S.S.S.; Muhammad, S. Fundamental Understanding of the Setting Behaviour of the Alkali Activated Binders Based on Ground Granulated Blast Furnace Slag and Fly Ash. Constr. Build. Mater. 2021, 291, 123243. [Google Scholar] [CrossRef]
- Li, S.; Chen, D.; Jia, Z.; Li, Y.; Li, P.; Yu, B. Effects of Mud Content on the Setting Time and Mechanical Properties of Alkali-Activated Slag Mortar. Materials 2023, 16, 3355. [Google Scholar] [CrossRef]


Disclaimer/Publisher’s Note: The statements, opinions and data contained in all publications are solely those of the individual author(s) and contributor(s) and not of MDPI and/or the editor(s). MDPI and/or the editor(s) disclaim responsibility for any injury to people or property resulting from any ideas, methods, instructions or products referred to in the content. |
© 2024 by the authors. Licensee MDPI, Basel, Switzerland. This article is an open access article distributed under the terms and conditions of the Creative Commons Attribution (CC BY) license (https://creativecommons.org/licenses/by/4.0/).