Article

Tensile-to-Shear Crack Transition in the Compression Failure of Steel-Fibre-Reinforced Concrete: Insights from Acoustic Emission Monitoring

Department of Civil Engineering and Smart Cities, Shantou University, Shantou 515063, China
*
Author to whom correspondence should be addressed.
Buildings 2024, 14(7), 2039; https://doi.org/10.3390/buildings14072039
Submission received: 17 June 2024 / Revised: 26 June 2024 / Accepted: 1 July 2024 / Published: 4 July 2024
(This article belongs to the Special Issue Brittle Behaviour of High-Performance Concrete Structures)

Abstract

:
Steel-fibre-reinforced concrete (SFRC) has been increasingly used in the field of engineering structures in recent years. Hence, the accurate monitoring of the fracturing process of in-service SFRC has considerable significance in terms of structural safety. This paper investigates the acoustic emission (AE) and digital image correlation (DIC) features characterising the damage behaviour of SFRC samples in compression. For all the tests, cumulated AE, b-value, βt coefficient, average frequency, and rise angle are considered to describe the actual SFRC failure mechanisms. The results show that SFRC exhibits enhanced toughness compared to normal concrete (NC), with an indicated transition from a brittle to a ductile structural behaviour. This improved behaviour can be attributed to the bridging effect of steel fibres, which also drives the progressive tensile-to-shear crack transition, thus being the main cause of the final SFRC failure. As the loading rate increases, there is a corresponding increase in the number of shear cracks, leading to a decrease in the overall ductility and toughness of SFRC. Moreover, since the number of shear cracks notably increases right before SFRC fracture, this can serve as a safety warning of the impending failure. Furthermore, the cumulated AE curve displays a strong discontinuity in the occurrence of an unstable fracturing process in SFRC, which can also be forecasted by the AE time-scaling coefficient βt. The AE and DIC features can be used as failure precursors in the field of structural surveying, offering an accurate technical support for engineering failure warnings.

1. Introduction

Steel-fibre-reinforced concrete (SFRC) is a composite material that can be utilized in civil engineering to enhance the overall performance of structures [1,2]. The incorporation of steel fibres enables concrete to maintain a certain level of strength and deformation capacity after cracking, substantially improving its toughness [3]. The toughening effect is closely linked to the elastic modulus, tensile strength, and interface bonding strength of the steel fibres [4]. Currently, SFRC has broad application prospects in bridge and structural engineering, and the SFRC deck overlay has been rapidly applied in both newly built and existing bridges. However, the in-service SFRC may suffer from damage, posing a risk to the long-term durability of the engineering structures. Therefore, monitoring the damage evolution of in-service concrete has considerable significance for structural safety. Uniaxial compression tests can replicate the stress conditions encountered in engineering scenarios, facilitating the evaluation of SFRC’s practical application potential in engineering structures. Given that cracking behaviour in SFRC is difficult to observe directly, acoustic emission (AE) technology provides a non-destructive monitoring method [5,6] useful to detect internal damage evolution [7,8]. AE waves can be measured by sensors placed on structural surfaces, providing crucial information on crack propagation [9,10,11,12]. On the other hand, digital image correlation (DIC) is a non-contact optical measurement method that tracks the motion of points on a surface, by analysing the randomly distributed speckle patterns, facilitating real-time observation of surface displacement and strain [13,14,15,16]. In addition, advanced technologies like deep learning for crack detection enhance the accuracy of damage detection and monitoring in concrete structures [17].
Considering the mechanical responses of SFRC under different loading conditions, AE technology offers better insights into the damage mechanisms of SFRC at the microscopic level. In particular, Meng et al. [18] investigated the mechanical properties of concrete reinforced with steel and polypropylene fibres under triaxial cyclic compression, revealing that changes in loading rates alter the crack size, propagation speed, deformation, and failure patterns in the concrete material. Li et al. [19] conducted axial compression tests and AE monitoring on SFRC samples by varying fibre volume fractions, then examining fracture evolution and fractal characteristics. Ren et al. [20] investigated the damage characteristics of SFRC with different steel fibre contents, detecting specific AE signal characteristics for the different post-cracking stages. In [21], the failure of plain concrete samples is found to be dominated by tensile cracks, changing to shear-crack failure by increasing the fibre volume fraction. Xu et al. [22] used waste porcelain as a coarse aggregate in rubber concrete containing steel fibres, investigating compressive strength, microstructure, and the evolution of damage using AE technology. Cai et al. [23] introduced a damage evolution model and examined the damage characteristics using AE. In recent studies, AE and DIC techniques have been used together to evaluate the fracture process, which depends on the characteristic structural size scale [24,25,26].
Concrete behaviour can be enhanced by adding fibre reinforcements: in this way, the transition from micro- to macro-cracks can be effectively inhibited, as shown in Figure 1, thus leading to a significant improvement in the mechanical properties of the material [27]. Fibres efficiently bridge the micro-cracks generated during loading and restrain the growth of the macro-cracks [28,29], as shown in Figure 2. Ning et al. [30] ascribed the enhancement of SFRC impact resistance to the strengthening effect due to steel fibres when micro-cracks propagate during the impact process. Nguyen et al. [31] investigated the effects of fibres on the tensile strength and the self-sensing capacity of SFRC.
Figure 3 shows a diagram of the meso-scale damage mechanism in SFRC, including matrix cracking, aggregate–matrix cracking, fibre debonding, and fibre slippage. Concrete damage is caused by the propagation of pre-existing internal cracks, which expand primarily along the weak interfaces of aggregate and mortar [32]. After primary crack initiation, the elastic–plastic deformation of fibres, fibre debonding, and fibre slippage become the main damage mechanisms. Fibres with a disordered distribution effectively limit the propagation and coalescence of cracks, causing a change in the direction of cracks, ultimately improving the cracking resistance of concrete.
Although several research studies have been conducted on the performance and properties of SFRC, these studies lack rigorous analyses of the failure mechanism responsible for the main variations in AE characteristics. In addition, the crucial role of AE signals, which are effective precursors of SFRC failures, has not yet been clarified. Furthermore, limited attention has been paid to the fracture evolution of SFRC using combined AE and DIC techniques. Therefore, further investigation on the effects of loading rate on damage behaviour of SFRC is necessary, as well as on the role of failure precursor of AE signals in SFRC. This paper conducted AE and DIC monitoring on SFRC samples in uniaxial compression and proposed a new interpretation of the bridging mechanisms of fibre reinforcements in concrete. For all the tests, cumulated AE, b-value, βt coefficient, average frequency, and rise angle are considered to describe the SFRC failure mechanisms. The findings can provide useful insights into the field of engineering failure warning.

2. Experimental Setup

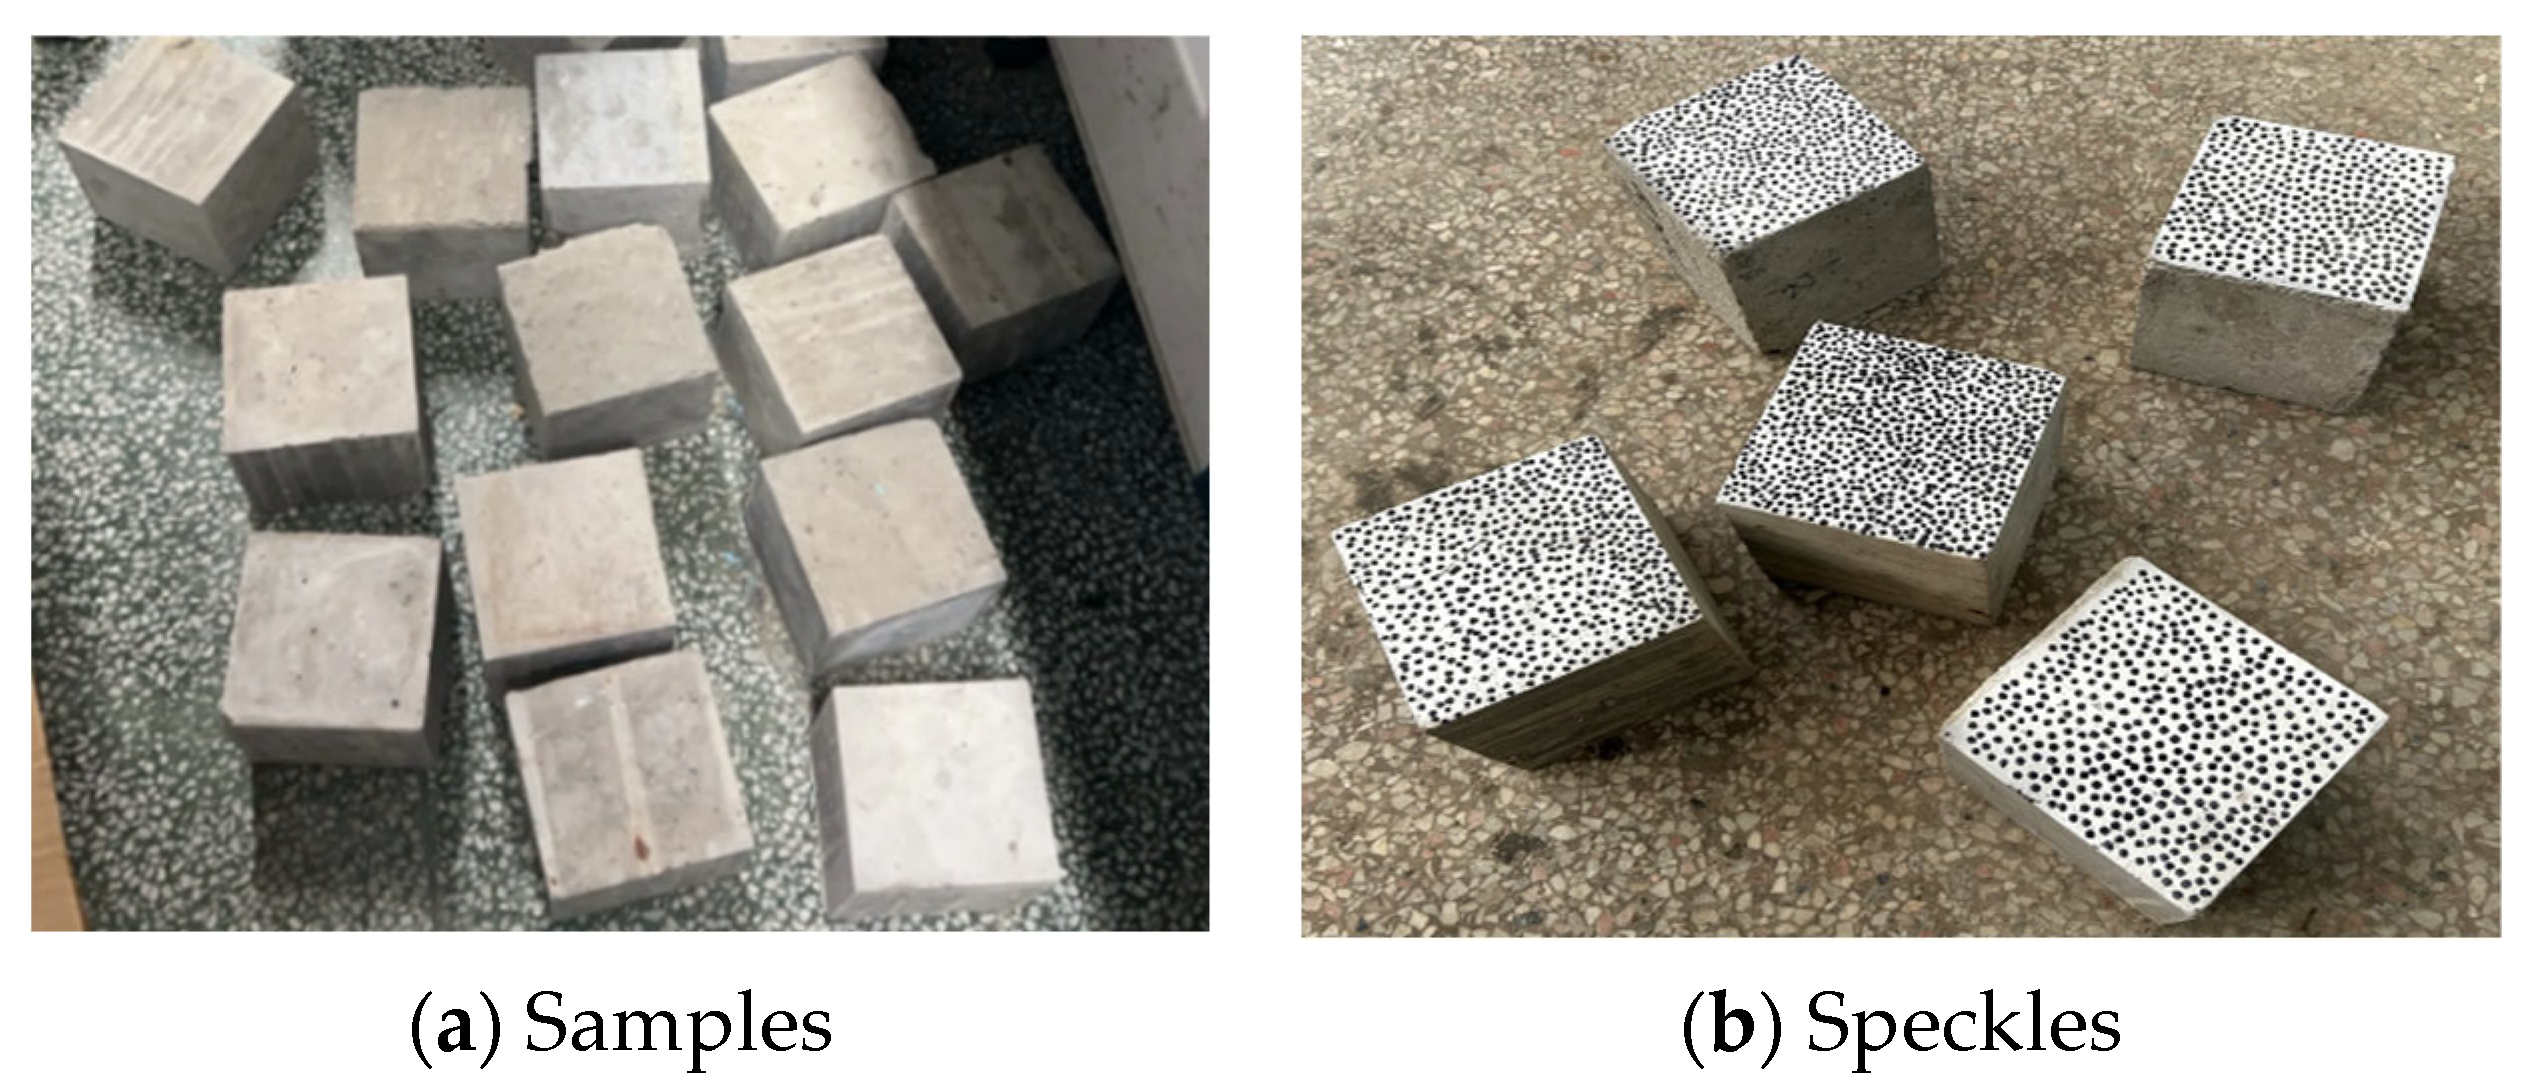
2.1. Sample Preparation

SFRC composited with orthotropic steel decks through shear studs can increase the stiffness of the bridge deck, improve its fatigue performance, and enhance the durability of the pavement layer. Based on the mix ratio of SFRC material used in bridge decks of a new bridge project, a set of SFRC samples in compression are made and tested in this study.
SFRC sample is mainly composed of cement, stone, sand, and randomly distributed short steel fibres, as shown in Figure 4. The concrete grade is C50. SFRC consists of ordinary Portland cement (grade 42.5), river sand with a fineness modulus of 3.0, granite crushed stone of 5–30 mm, and a high-efficiency carboxylate water reducer with a concentration of 10.8%. The mix ratio of cement/sand/stone/water is 1:1.49:2.51:0.32 (Table 1), with a water/cement ratio of 0.32. The normal concrete (NC) sample uses the C50 normal-strength concrete and the same mix ratio, without adding steel fibres. The steel fibres used in SFRC samples are the shear-wave type with a length of 38 mm, an aspect ratio of 60, and a fibre volume fraction of 1%. SFRC mechanical properties are listed in Table 2.
Figure 5 shows the prepared SFRC samples, which measure 100 × 100 × 100 mm. During the test preparation, the cement material and aggregate are first dry mixed for 2 min, and then, water is added to achieve a sticky consistency. The steel fibres are evenly poured into a 2 cm screen, and the final mix is obtained by stirring for another 2 min to prevent fibre clustering. The SFRC samples are demoulded 24 h after pouring and placed in a standard curing room for 28 days. After removal, they are dried in a natural environment, exhibiting a compressive strength equal to 64.8 MPa (Table 2). Before testing, matte black paint is applied to the sample surface to create speckle patterns (see Figure 5b), with a speckle size between 5 and 7 pixels.

2.2. Testing System

As shown in Figure 6, a 200 t MATEST actuator eproduced in Jinan, China is employed to conduct uniaxial compression tests on SFRC samples. The AE system utilized in this test is the Italy LUNITEK ÆMISSION® produced in LaSpezia, equipped with piezoelectric sensors (range: 10 kHz–1 MHz). Each AE channel has independent threshold triggers, automatically extracting AE signal parameters for continuous monitoring. One AE sensor is positioned on a vertical side of each SFRC sample, coupled with high-vacuum grease and fixed to the sample with tape as depicted in Figure 6b. The AE waves captured by the sensor undergo a 60 dB amplification before processing, with the acquisition threshold set to 2 mV.
Additionally, the DIC equipment is simultaneously employed for real-time recording, as shown in Figure 6d. The speckle patterns are analysed through the image analysis system to detect the surface displacement and to calculate the related strain.
The entire loading process adopts displacement-controlled loading, with rates of 0.4 mm/min, 0.8 mm/min, and 1.2 mm/min, respectively (see Figure 7). Both AE and DIC techniques are set on continuous and real-time data acquisition during the fracturing process, allowing the initiation and growth of micro-cracks to be monitored during the whole loading process.

2.3. AE Analysis

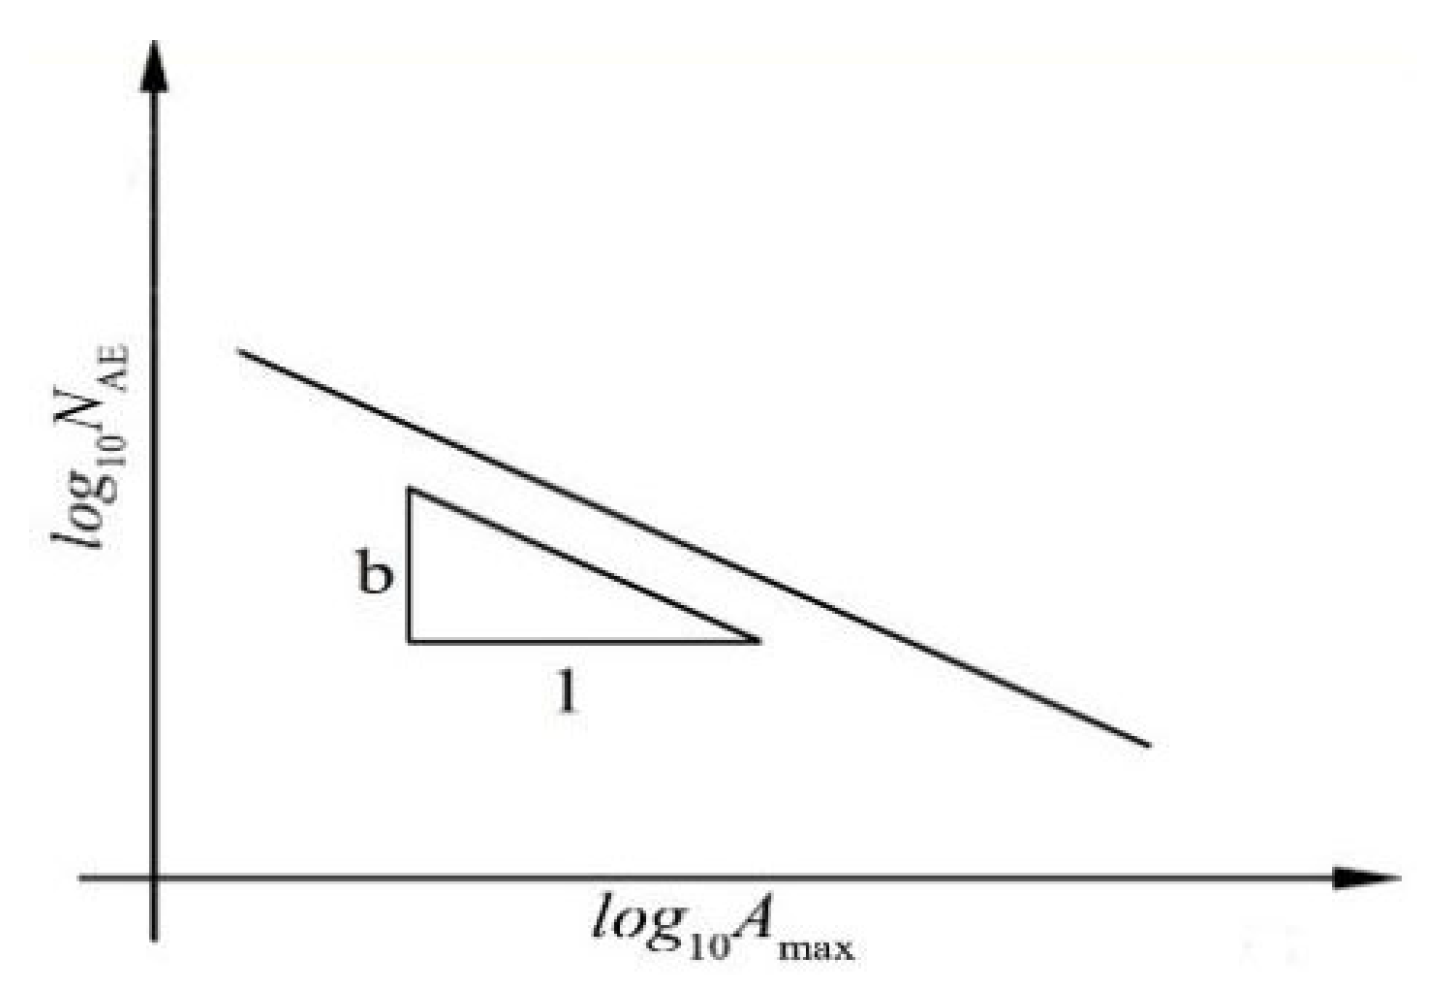
2.3.1. βt and b-Value
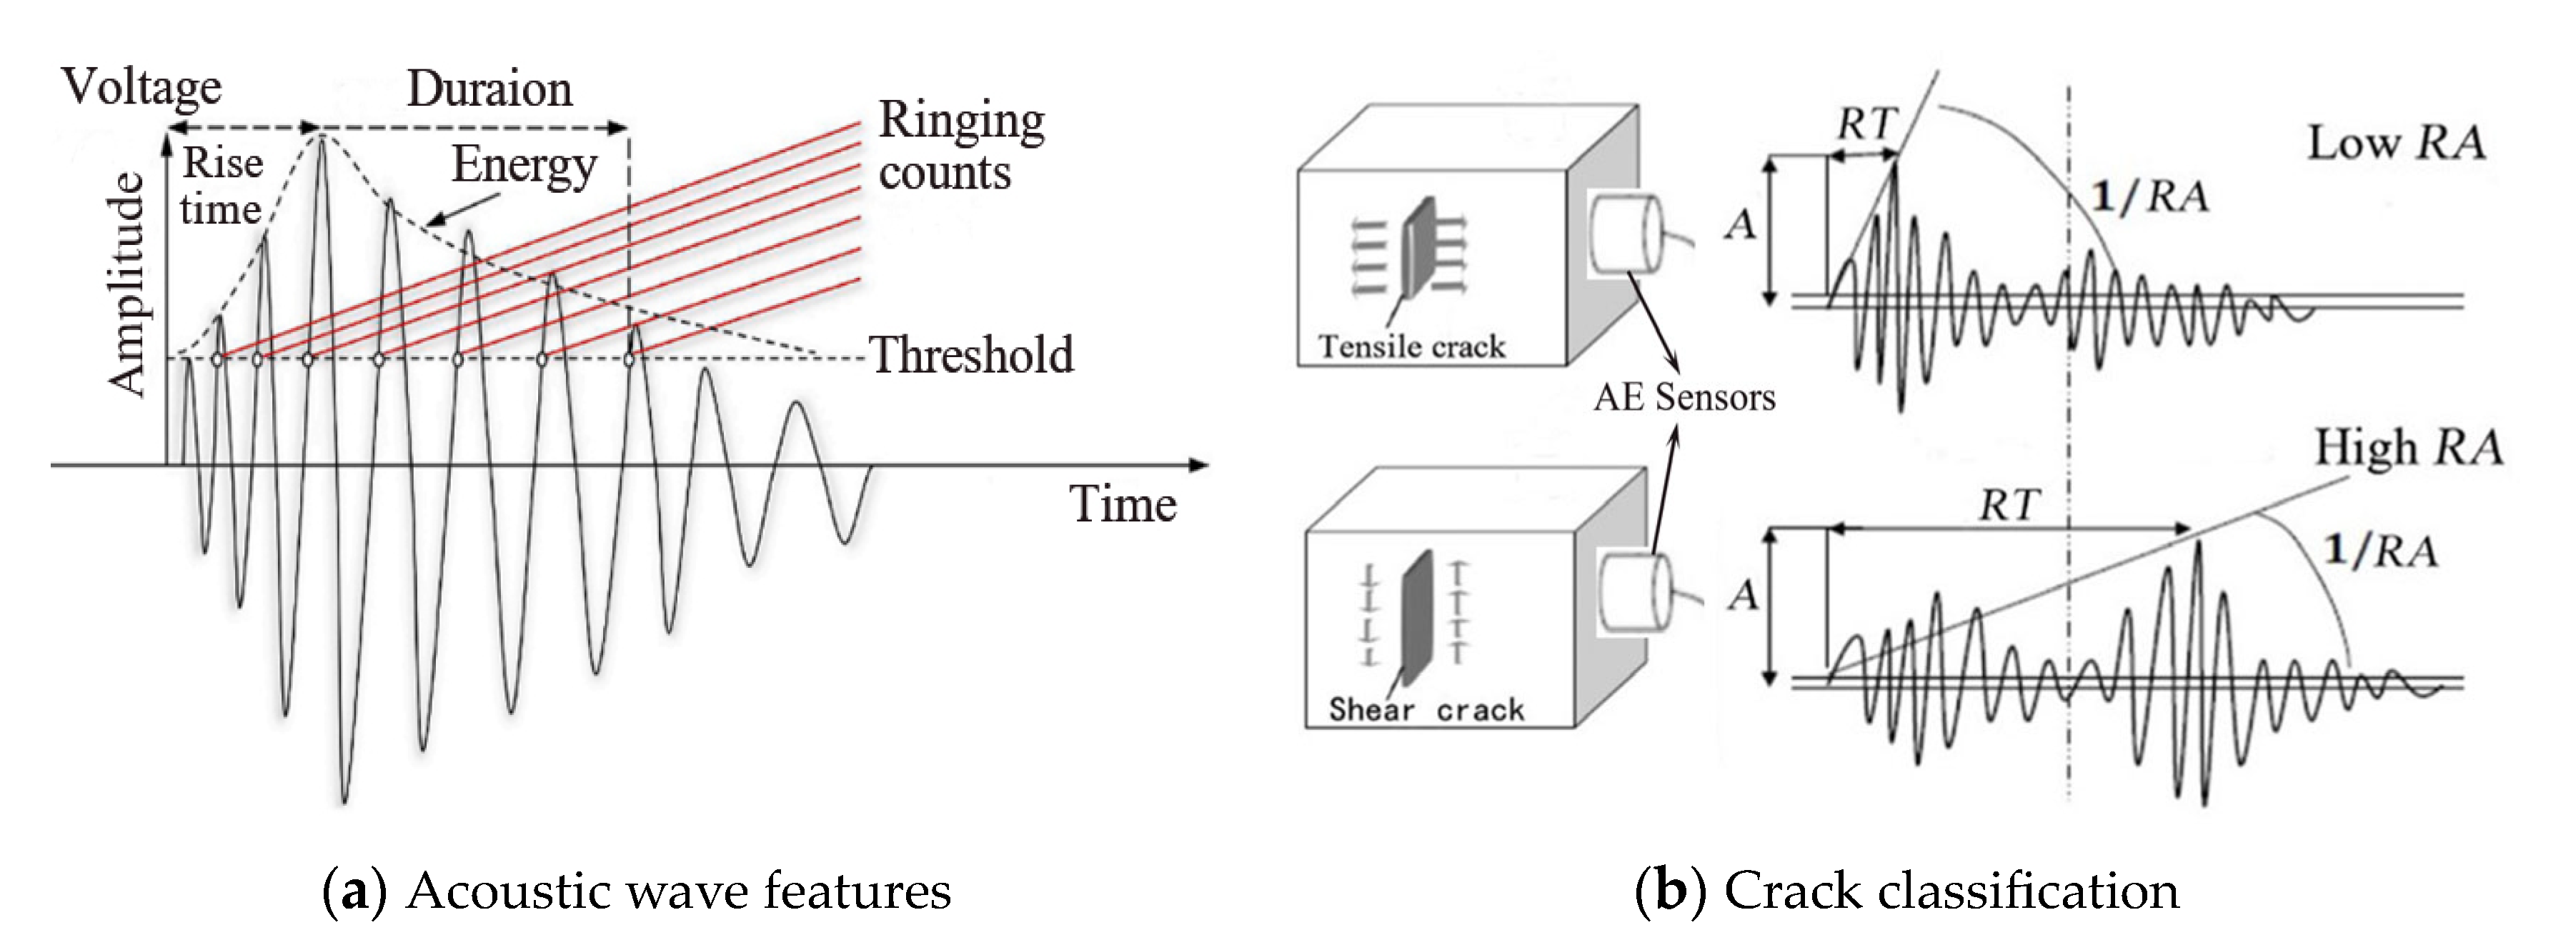
The number N and the total number Nd of AE events recorded up to the end of the monitoring period are expressed as dimensionless functions of time, t, thus defining the evolution of damage as follows [33]:
η = N N d = t t d β t
where βt is the time-scaling coefficient that characterizes the time evolution of the damage process. βt > 1 reveals unstable crack propagation, whereas βt < 1 indicates that the damaging process slows down [33].
On the other hand, b-value is obtained by the statistical distribution of the AE signal magnitudes fitted by the GR law [34]:
log 10 ( N A E ) = a b M
where Amax is the signal peak amplitude, and NAE is the number of AE events with a magnitude greater than M. The b-value represents the negative slope of the GR law (Figure 8), which can be fitted by means of the least-squares method. b-value usually ranges from 1.5 to 1, revealing the transition from a distribution of micro-cracks in the sample volume (3-D) to a dominant macro-crack (crack surface, 2-D) [35].

2.3.2. AF and RA

The main AE characteristic parameters deduced from the acoustic waves are shown in Figure 9a, with some qualitative information about crack classification, such as average frequency (AF) and rise angle (RA), being obtained. According to JCMS-III B57066 [36], AF versus RA can be calculated based on the following relationships [37]:
  A F = R C ( R i n g i n g C o u n t ) D T ( D urationTime )
R A = R T ( R i s e T i m e ) A max ( A mplitude )
In Equations (3) and (4), RC represents the number of signal oscillations greater than the AE threshold, DT is the time elapsed between the first and the last signal oscillation above the AE threshold, RT is the time between the first signal oscillation crossing the threshold and the maximum signal amplitude, and Amax is the signal peak amplitude. AF is measured in kHz, whereas RA is measured in ms/V. Following the RILEM Recommendation [38], shear cracks are characterized by relatively low AF and high RA values, whereas tensile cracks are characterised by higher AF and lower RA values, as shown in Figure 9. AE signals from tensile cracks exhibit characteristics of high ringing counts, large amplitude, and short rise time. This is because a significant amount of energy is released at tensile crack initiation. In contrast, the AE signals from shear crack emissions have fewer ringing counts, longer rise times, and longer durations [39].

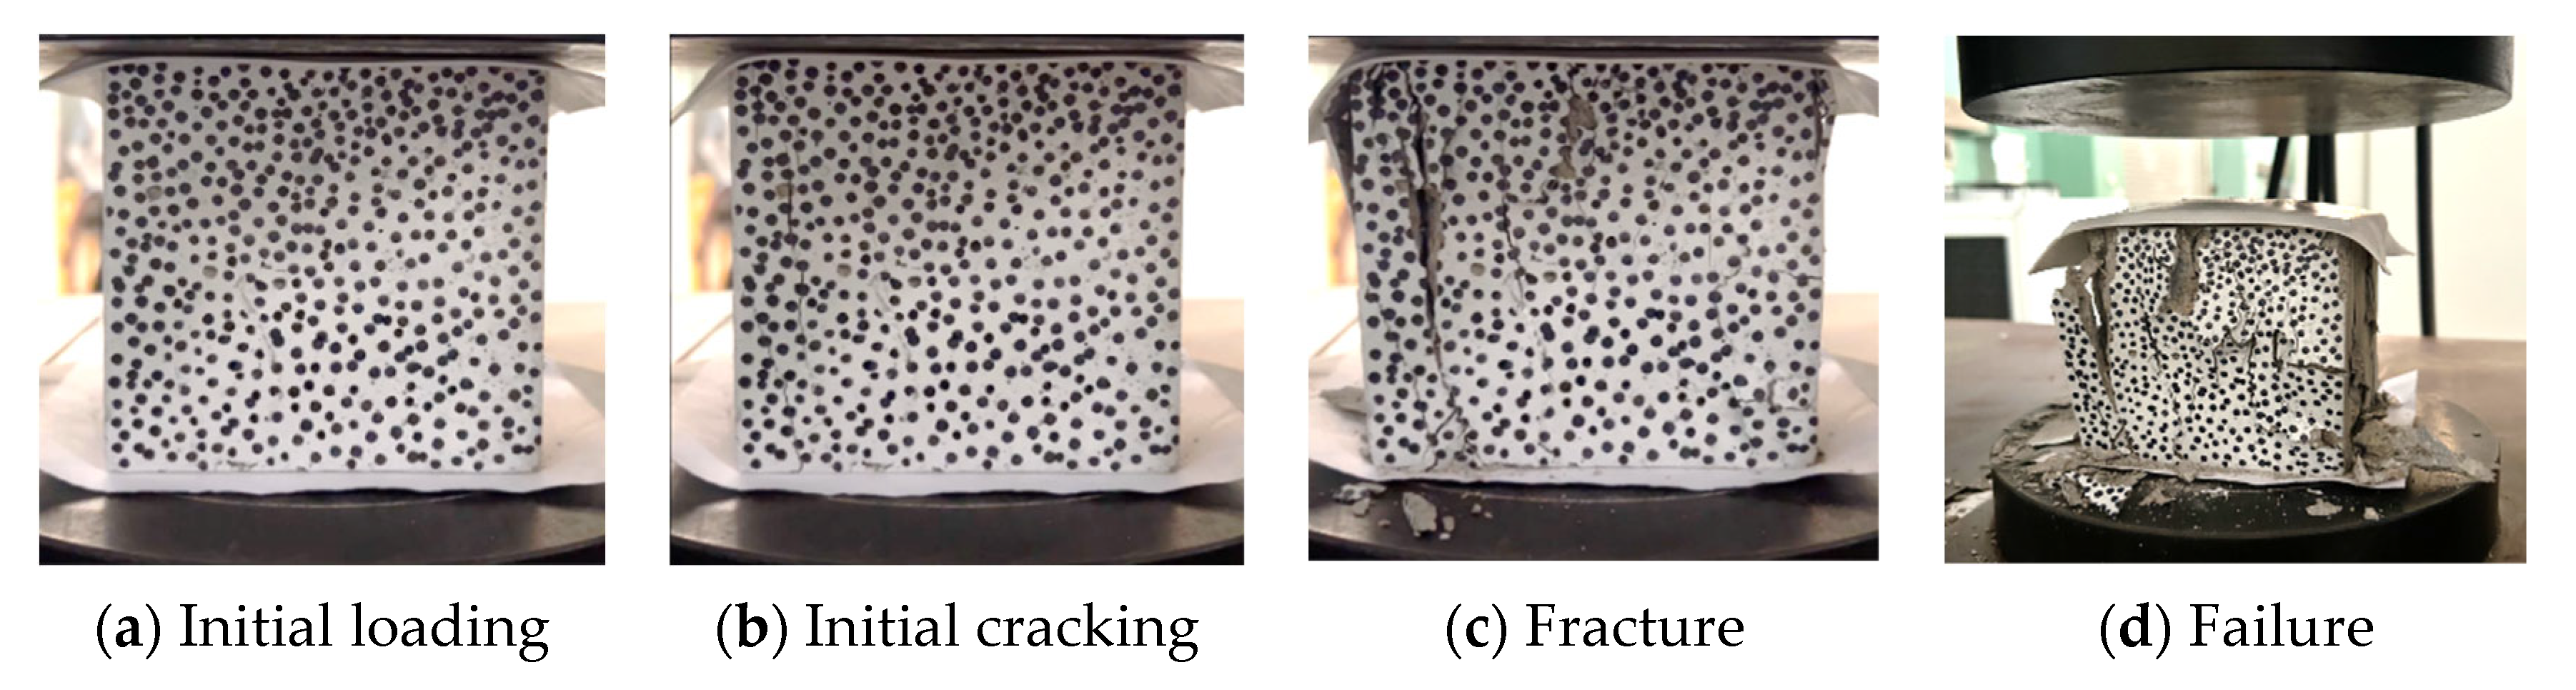
3. Experimental Observations

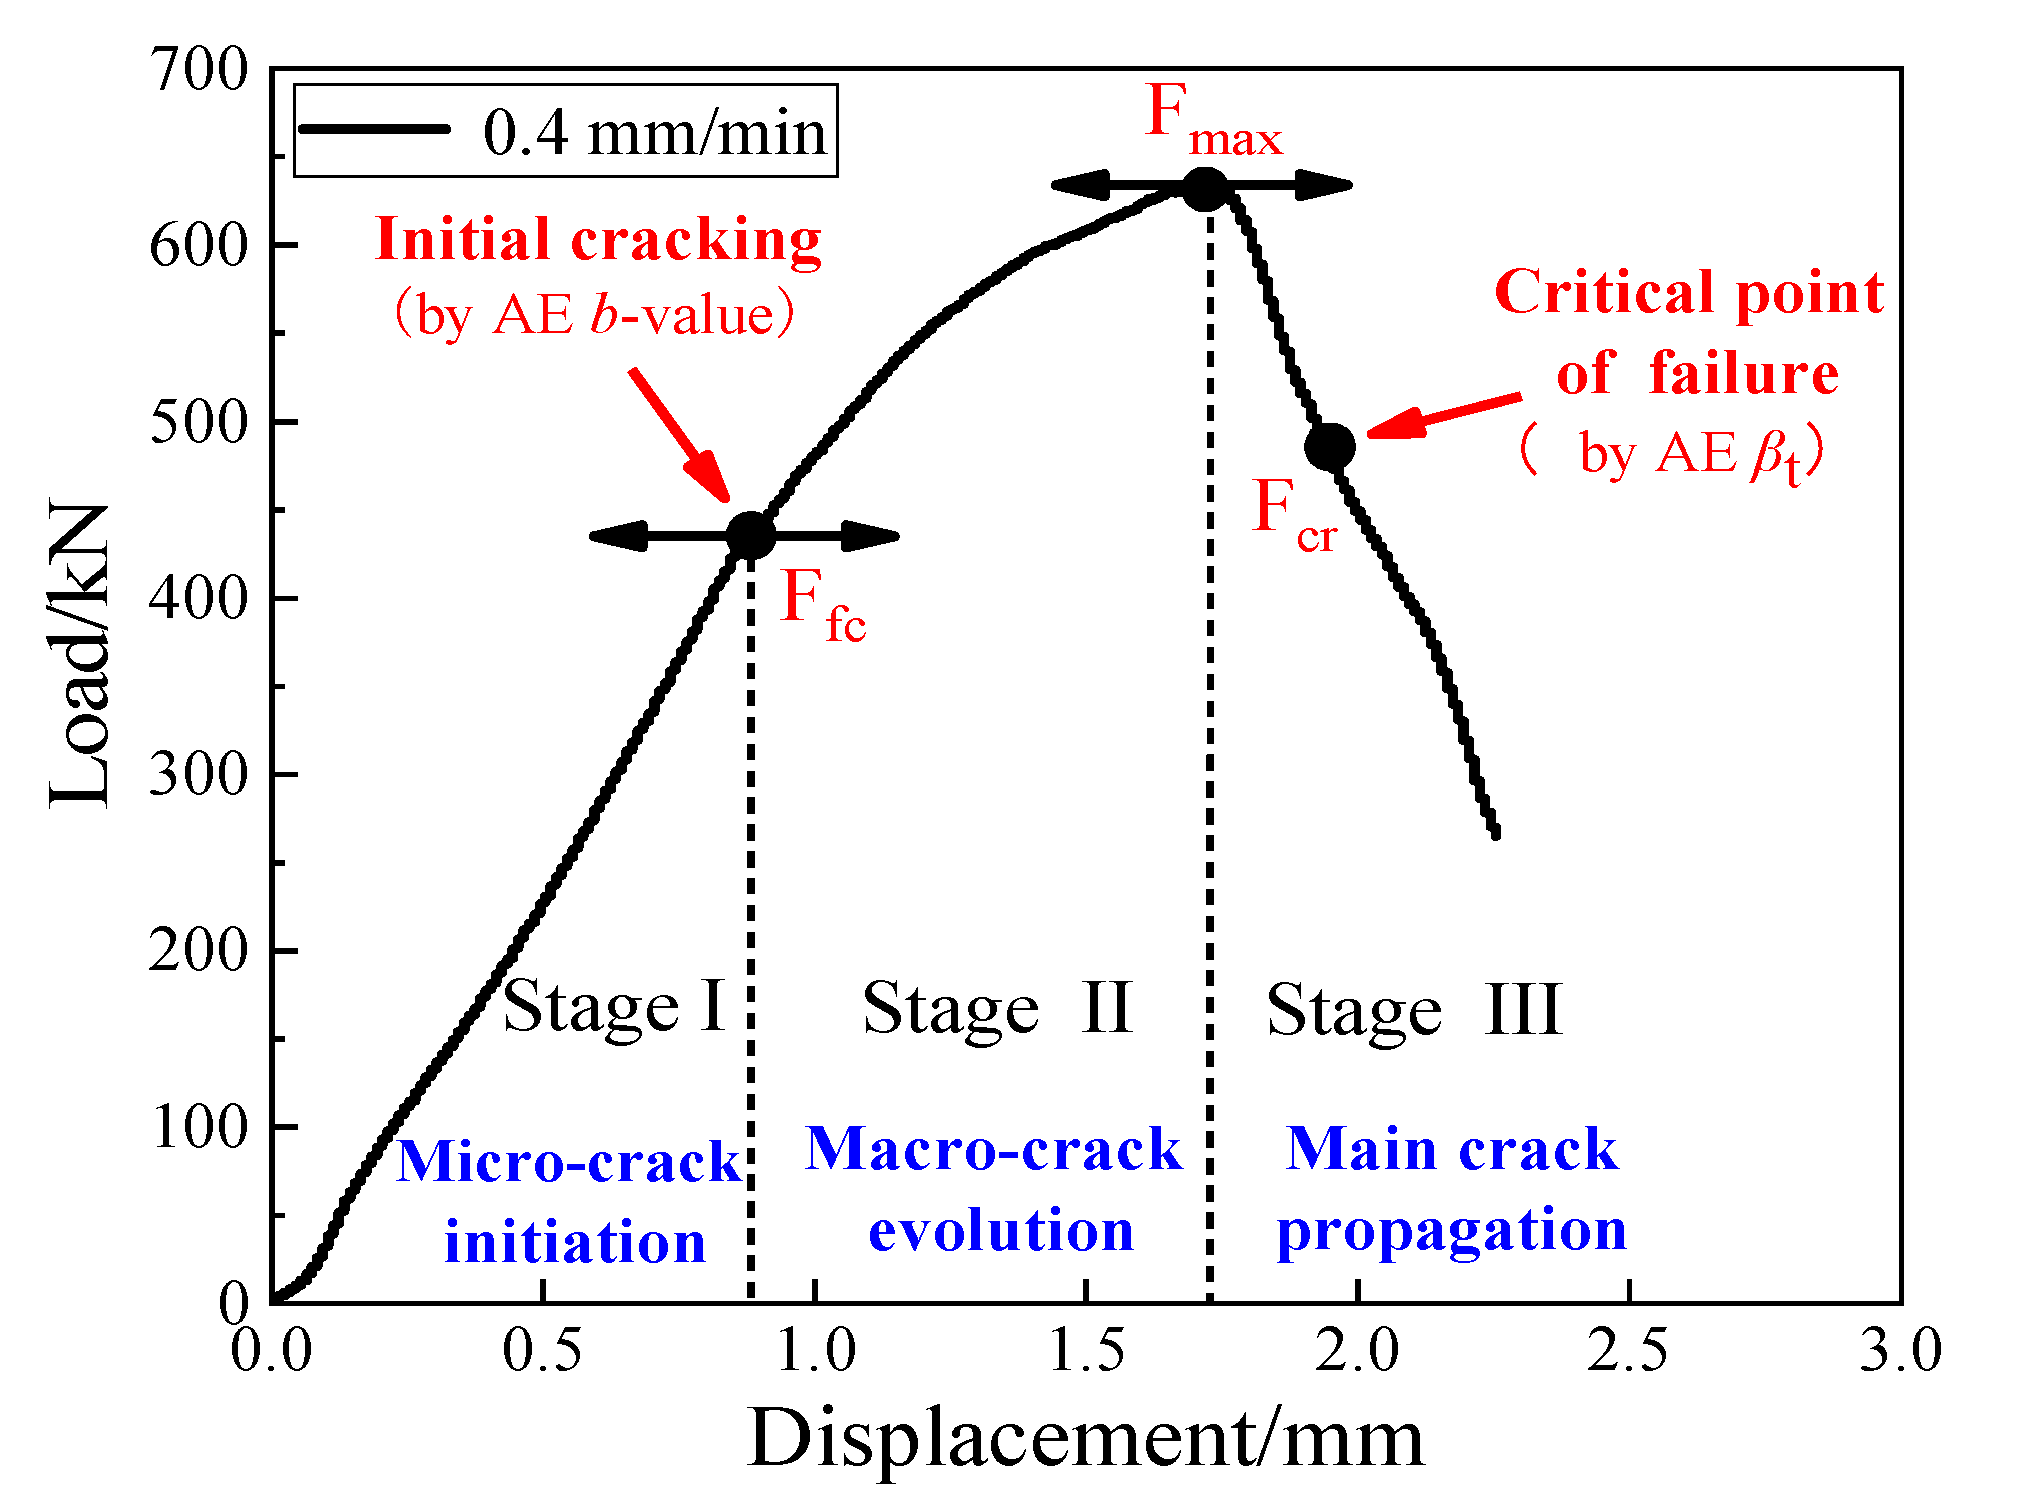
3.1. Damage Stages and Thresholds

Concrete fracture is a multi-scale phenomenon that begins with the initiation and propagation of micro-cracks and continues with the development and propagation of macro-cracks, eventually resulting in a catastrophic failure depending on the structural brittleness. Although the AE data obtained at various loading rates exhibit some differences, they consistently indicate patterns in line with the different damage stages. Thus, the load–displacement curve of SFRC (Figure 10) can be divided into three distinct stages, characterised by the first cracking load (Ffc) and the ultimate load (Fmax). Additionally, the critical load in stage III (Fcr) is also highlighted in Figure 10.
Stage I involves the micro-crack initiation (see Figure 2a). As the external load increases, the elastic stage takes place, characterized by a linear increase in the load–displacement curve. The matrix predominantly bears the external load, and the fibres do not play a significant role. The source of AE signals is attributed to a complex mechanism, including matrix cracking and aggregate-to-matrix cracking (see Figure 3).
Stage II entails the macro-crack evolution (see Figure 2b). After reaching the macro-crack initiation point, that is, the first cracking load (Ffc), the micro-cracks transform into localized macro-cracks, for which fibres significantly restrict the growth, as shown in Figure 1. Then, the slope of the load–displacement curve continues to decrease, displaying an upward convex growth until reaching the ultimate load (Fmax). Meanwhile, the primary source of AE signals is attributed to the fibre debonding and deformation (see Figure 3).
Stage III involves the main crack propagation. After the peak load, the SFRC sample presents considerable ductility thanks to the softening branch envisaged by the fibre slippage into the concrete matrix [40]. The slope of the load–displacement curve presents a relatively rapid decline until reaching the critical load (Fcr), then culminating in the final failure. Throughout this stage, the AE signals primarily originate from fibre slippage or pull-out (see Figure 3).

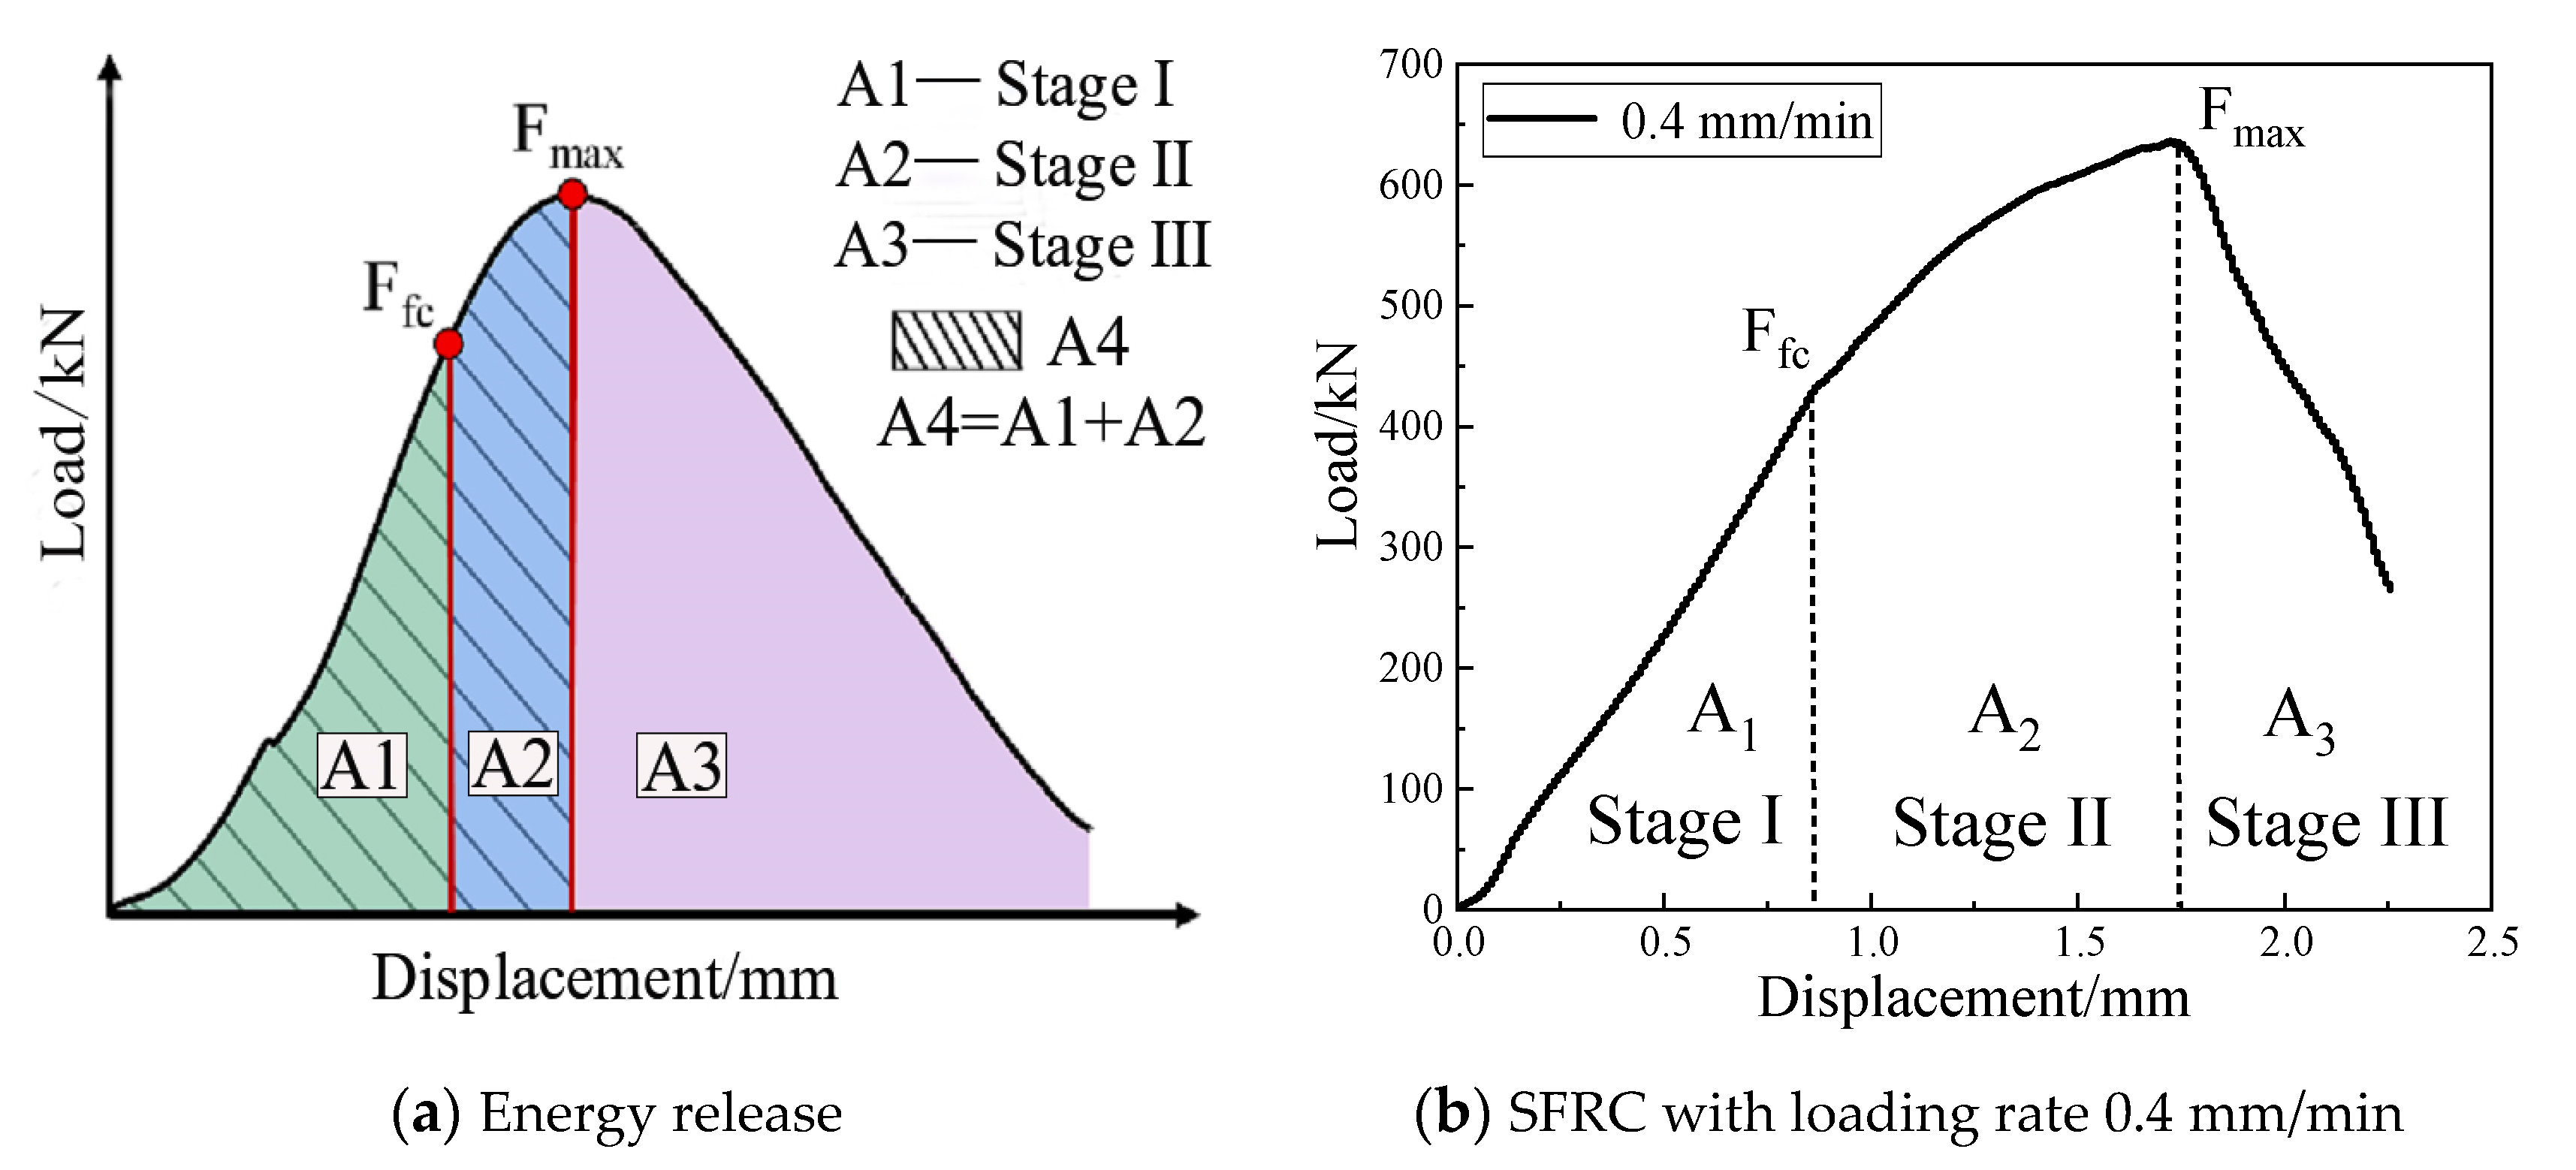
3.2. Compressive Toughness Index (CTI)
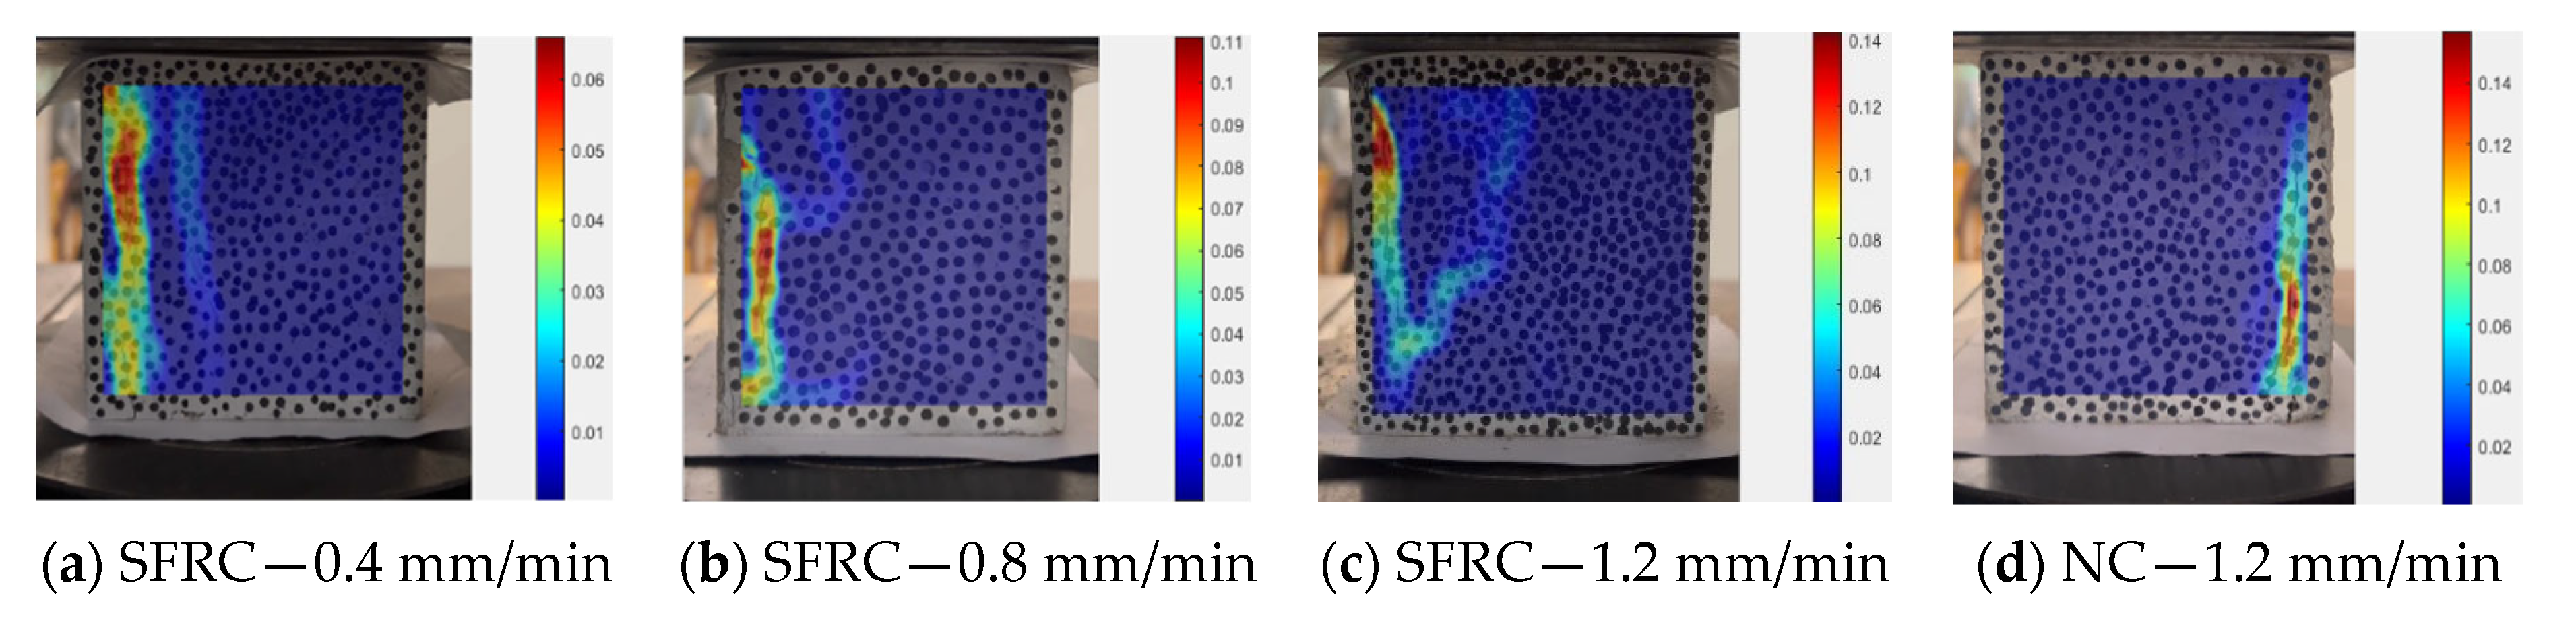
In uniaxial compression testing, the first cracking load (Ffc) and the ultimate load (Fmax) of SFRC samples hold significant importance. The approach outlined by Khan and Qin [41,42,43] and Carpinteri et al. [44,45] enables a quantitative depiction of the bearing capacity of SFRC. This method defines the areas enclosed by the load–displacement curve as the released energy equal to the summation of dissipated and emitted ones and equivalent to the integral of the curve. By drawing parallel lines to the Y-axis through points (Ffc and Fmax), the enclosed area is partitioned into three segments: energy released by cracks before initial cracking (A1), energy released from initial cracking to peak (A2), and energy released until failure (A3), as illustrated in Figure 11. The sum of A1 and A2 yields A4, representing the released energy preceding the ultimate load. In Table 3, A1 and A2 vary during the pre-peak stage of each sample, with A2 gradually diminishing as the loading rate increases, whereas A1 concurrently rises. Elevated loading rates increase the energy dissipation for crack propagation, consequently augmenting A1.
Moreover, the Compressive Toughness Index (CTI), representing the ratio of A4 to A1, indicates the crack resistance of SFRC, offering a quantification of the toughening effect exerted by steel fibres in concrete [46]. Under uniaxial compression, steel fibres constrain the transverse deformation of SFRC samples through bridging action, thereby enhancing SFRC toughness [47]. Table 3 shows that, at loading rates of 0.4 mm/min, 0.8 mm/min, and 1.2 mm/min, the SFRC CTI is 3.84, 3.33, and 2.77, respectively. This suggests that the energy required for cracking increases as the loading rate decreases. The loading rate significantly influences the toughness of SFRC. At a low loading rate, steel fibres effectively diminish brittle cracking and enhance overall integrity and ductility, whereas higher rates may entail brittle fractures.

3.3. DIC Monitoring

In Figure 12, the SFRC damage process is represented throughout various stages. Initially, the surface of the SFRC samples exhibits no cracks (Figure 12a), and as the loading increases, micro-cracks emerge gradually and spread within the sample volume. As the macro-cracks initiate (Figure 12b), the deformation of samples becomes increasingly governed by the fibre-bridging action. During this stage, there is a rattling sound of fibres detaching from the concrete matrix. The surface of the samples is slightly bulging outwards, and there are only a few debris falling. In the final failure (Figure 12c,d), the sample retains its integrity, and the fibre-bridging effect inhibits the main crack propagation, transforming the SFRC samples from a brittle fracture to a relatively ductile failure mode.
Figure 13 and Figure 14 present the results of the DIC strain analysis. A comparison between SFRC and NC in Figure 13c,d and Figure 14c,d reveals that the SFRC samples exhibit multiple dense and slender cracks, whereas NC samples during the damage process show a single vertical crack with a larger width (Figure 14d and Figure 15b). Results of SFRC at different loading rates in Figure 13a–c and Figure 14a–c show that, under low loading rates, the main cracks in the SFRC samples are tensile types. The observed number of surface cracks is relatively small, and samples have slight transverse deformation, with no evident fragment detachment from the surface layer, as depicted in Figure 13a and Figure 14a. Conversely, under high loading rates, the number of surface cracks in the SFRC samples increases. The main cracks are both tensile and shear types, accompanied by local fragment detachment at the edges, with severe transverse deformation of samples, as illustrated in Figure 13c and Figure 14c. In addition, some new inclined shear cracks appear with the evolution of the damage process.

4. AE Monitoring Results

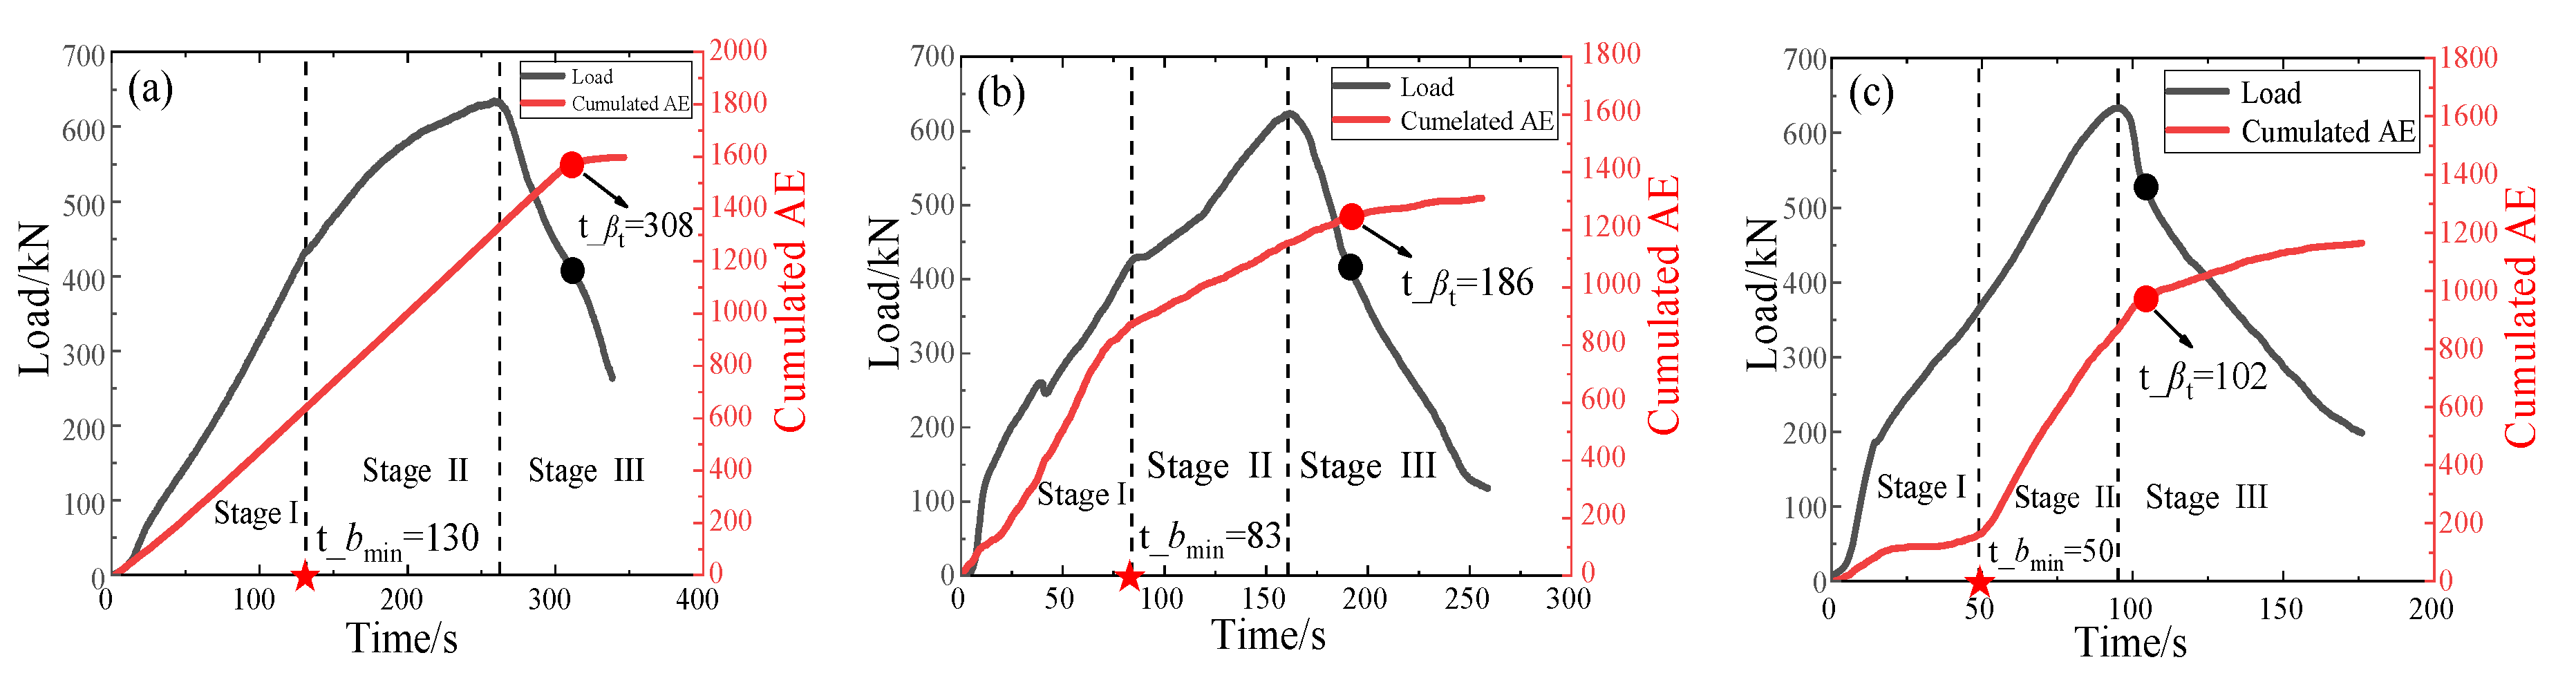
4.1. βt and b-Values

The AE events are fitted into groups of 100 events to obtain βt and b-value. Figure 16a–c depicts the evolution of βt and b-value in SFRC samples, and dashed lines represent the regression curve of b-values, and the average b-value decreases as the loading rate increases. It can be observed that, at high loading rates, the regression curve of b-values shows a decreasing trend, indicating unstable crack propagation. Conversely, at low loading rates, samples exhibit relatively stable crack propagation, with an almost constant b-value.
During the initial loading stage, there are fluctuations in the b-value, exhibiting a pattern of initial decrease followed by an increase, consistent with the damage behaviour of concrete. The point at which the b-value reaches its minimum corresponds to the transition from micro- to macro-cracks, denoted as t_bmin, as illustrated in Figure 16a–c.
Specifically, at a rate of 0.4 mm/min (see Figure 16a), the SFRC sample reaches t_bmin at 130 s, with bmin = 0.9 and βt = 2.5 (βt > 1), representing the coalescence of micro-cracks (indicated by the dashed line in Figure 16a). Similarly, at a rate of 0.8 mm/min (Figure 16b), we have bmin ≈ 1.0 at 83 s, with βt = 2.7 (βt > 1), whereas under a loading rate of 1.2 mm/min (Figure 16c), we have bmin = 0.9 at 50 s, with βt = 2.6 (βt > 1). It is evident that t_bmin reveals an unstable damage condition with numerous micro-crack coalescence in a main fracture surface, forming several macro-cracks on the SFRC sample surfaces.
The βt curves depicted in Figure 16a–c exhibit a decreasing trend. The critical points are marked as t_βt (see Figure 16). In addition, as illustrated in Figure 17, the critical time obtained from the βt coefficient corresponds to the occurrence of the unstable fracturing process, with all the micro-cracks organizing on the main fracture surface. These findings confirm that in the AE time series preceding the critical point t_βt, βt >1 indicate unstable crack propagation, whereas, after reaching the critical point t_βt, βt <1, the main energy dissipation occurs.

4.2. Cumulated AE and Loading History

Figure 17 shows the cumulated AE and the loading history under different loading rates. Additionally, t_βt and t_bmin, determined by βt and b-values, are also highlighted in Figure 17.
In stage I, the cumulated AE curve grows linearly. In stage II, when the concrete matrix initially cracks, the steel fibres bridge the crack faces in the concrete. As the load increases, extensive cracking occurs in the samples around the peak load. In stage III, the samples suffer severe damage, and the load-bearing capacity tends to decrease. The cumulated AE in this stage decreases, and eventually, no AE signals appear, indicating a decay period.
At a low loading rate, there is an increase in the total number of AE events (Figure 17a), signifying the initiation of numerous micro-cracks in the SFRC. Conversely, as the loading rate increases, SFRC indicates relatively more brittle behaviour, leading to sudden cracking and increased AE events, thereby indicating that the SFRC forms cracks with a larger width (Figure 17b,c).
The t_βt determines the occurrence of an unstable fracturing process, marked by a significant inflection point in the cumulated AE, signalling a decrease in AE event growth. It is evident that, by increasing the loading rate, the post-peak softening branch becomes steeper, indicating a transition from ductile to relatively brittle behaviours (Figure 17c).

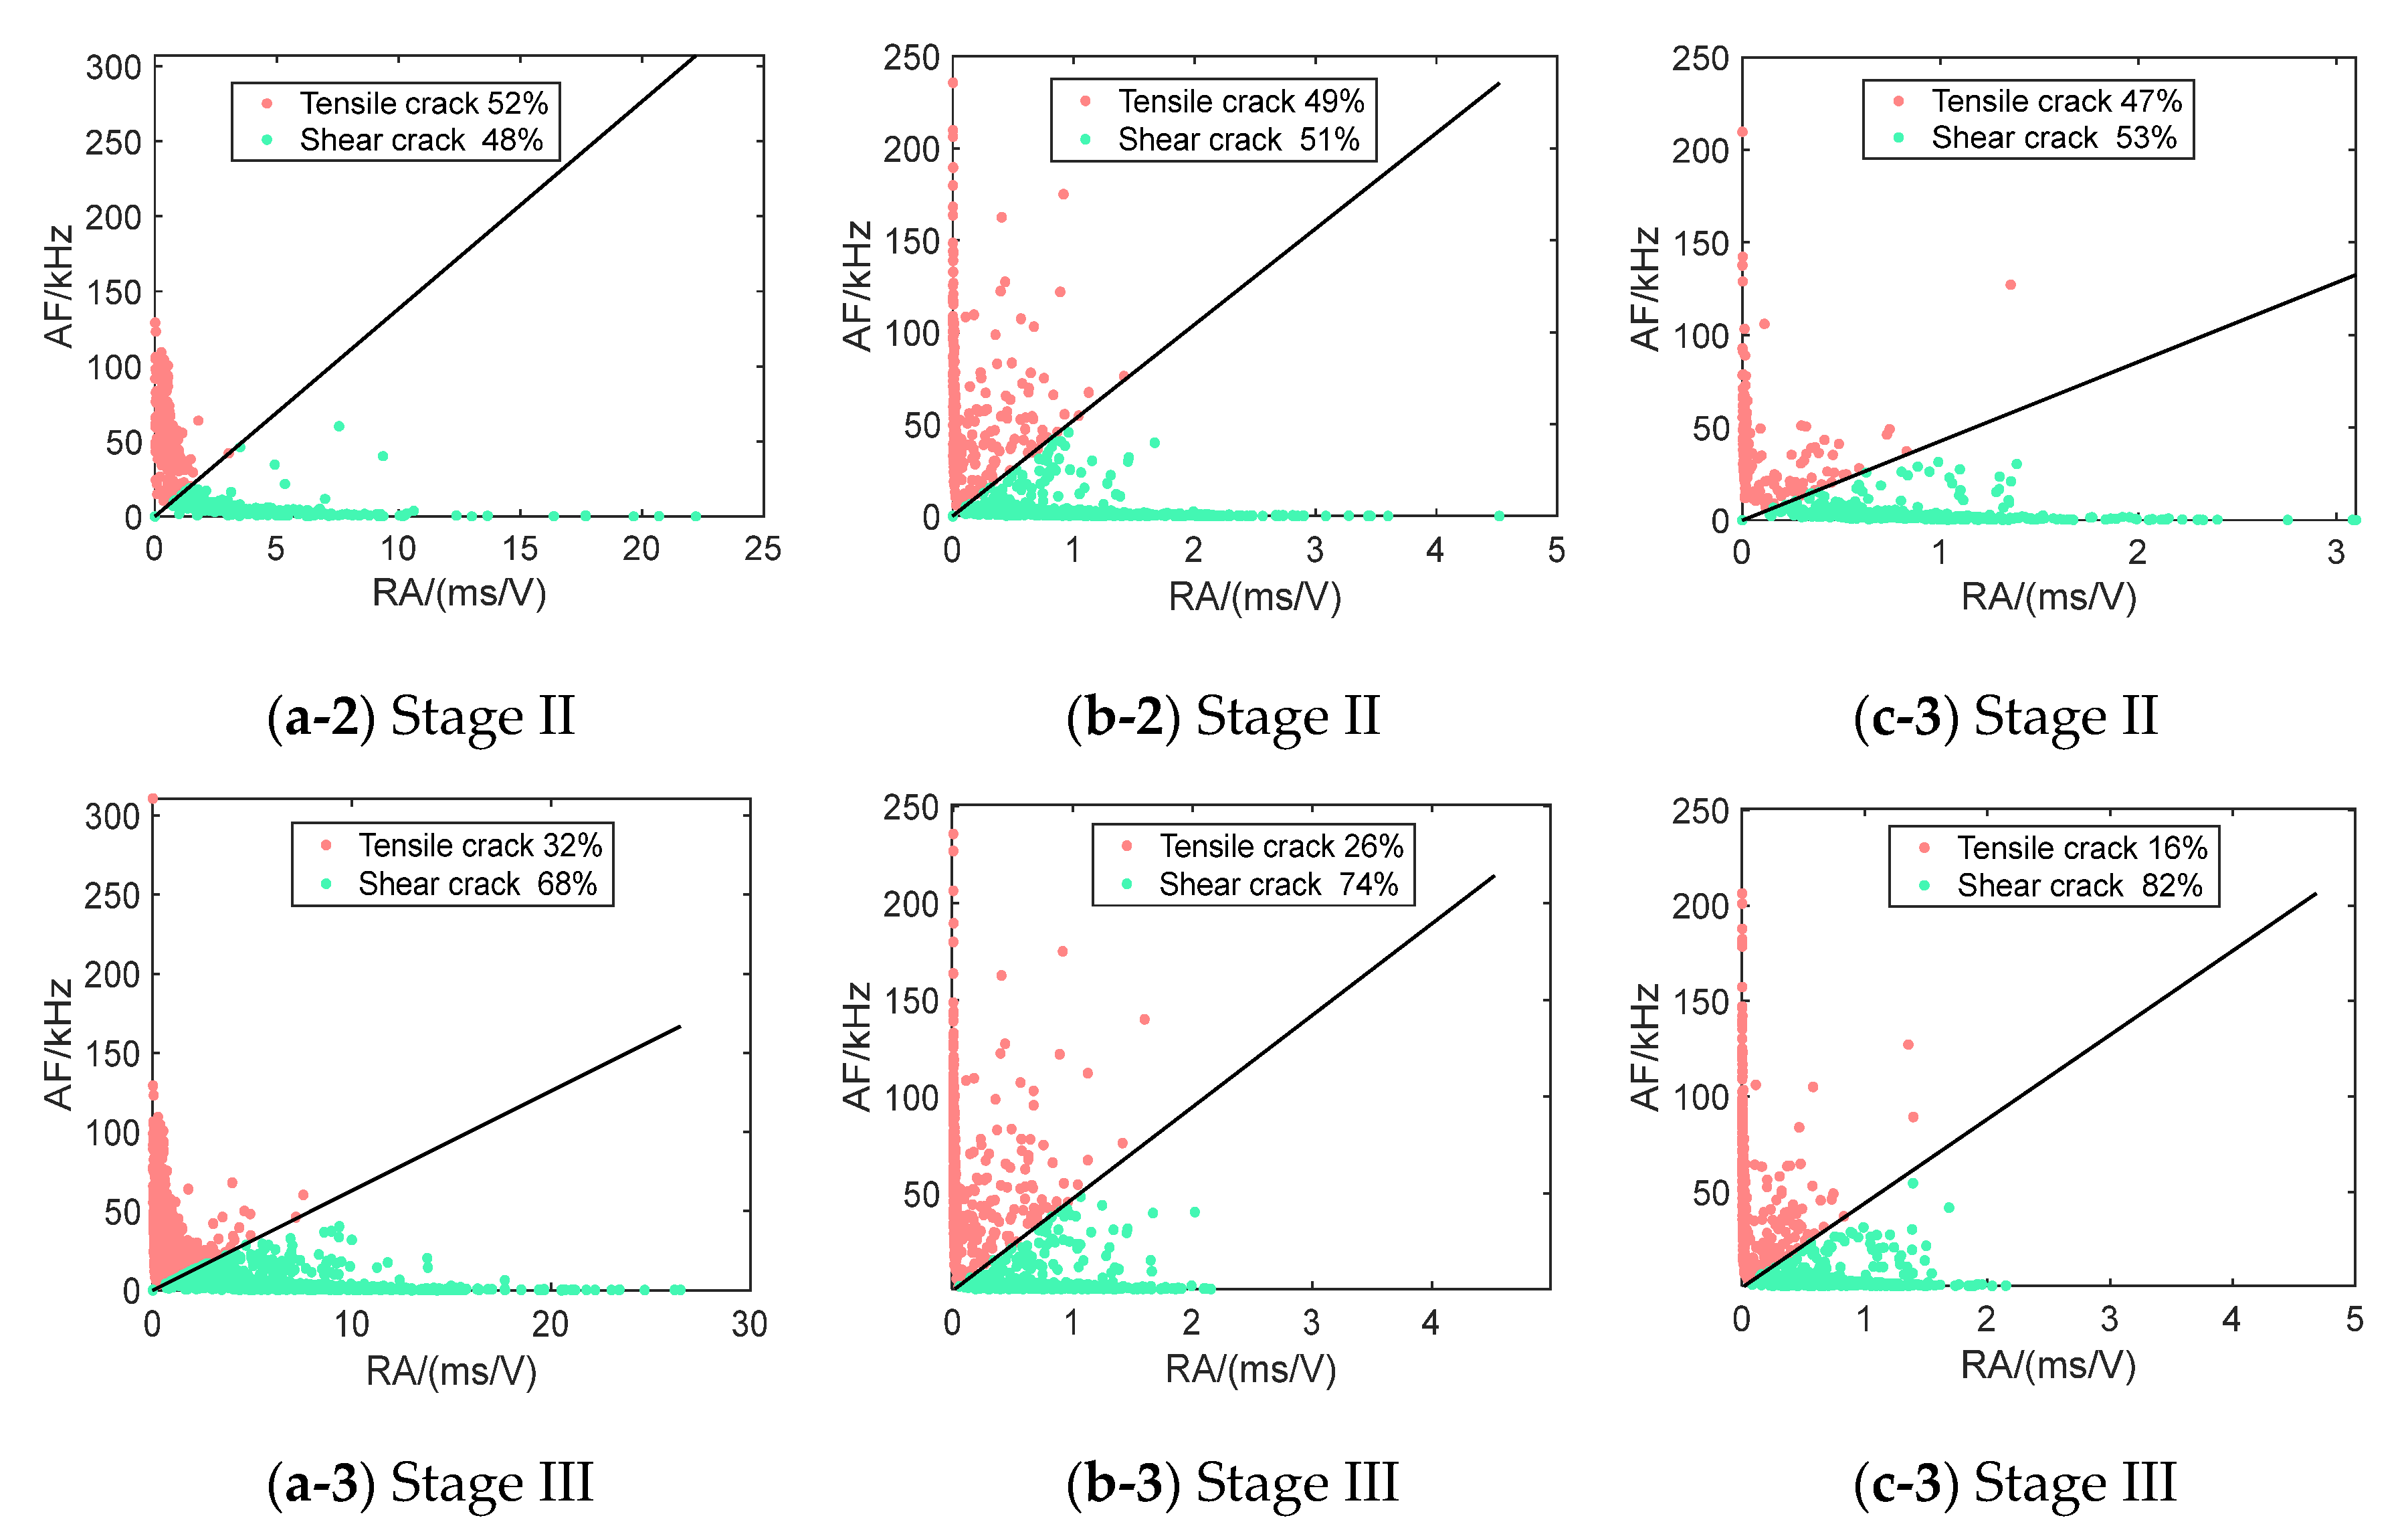
4.3. Crack Mechanisms Analysed by AF and RA

The classification of cracks in concrete materials holds significant importance in predicting the types of damage under diverse loading conditions. The damage process, as defined in the previous sections (Figure 10 and Figure 17), can be analysed by AF and RA (Figure 18 and Figure 19).
As depicted in Figure 19, the proportions of shear cracks in SFRC present a consistent change in each stage by considering different loading rates: a gradual transition from tensile cracks to shear cracks can be detected. In stage I, the nascent cracks are mainly tensile. For instance, at a loading rate of 0.4 mm/min, the ratio of tensile cracks to shear cracks is approximately 7:3, corresponding to the cracking of aggregate and matrix. In stage II, a significant number of new cracks emerge. The most noticeable change occurs in the proportion shift from tensile to shear cracks, and the number of shear and tensile cracks becomes roughly equal, with a ratio close to 1:1. In stage III, shear cracks begin to dominate, and the ratio of tensile cracks to shear cracks is approximately 1:2. Here, shear cracks represent 68%, 74%, and 82% of the total damage, at loading rates of 0.4, 0.8, and 1.2 mm/min, respectively. The analysis indicates that, by increasing the loading rate, the proportion of shear cracks increases, confirming that the high loading rate reduces the overall ductility of SFRC samples.

5. Failure Mechanisms

The combined AE and DIC results can explain the final failure mechanisms of the SFRC samples.
As depicted in Figure 20, during the early stage I, the initial damage primarily results from tensile fracture, indicating the onset of matrix cracking. At this stage, fibre reinforcements are not engaged in reinforcing the matrix (Figure 20a). In the following stage II, with the increase in crack propagation, the fibres provide their action to bridge the tensile cracks (Figure 20b). At the same time, the quantity of shear cracks begins to increase. In the final stage III, as the shear stiffness of the fibres is relatively small, with the further increase in the load, the matrix fractures along the shear plane; thus, the quantity of shear cracks begins to dominate (Figure 20c).
Therefore, at different loading rates, the cracks in the whole process gradually change from the tensile to the shear mode (Figure 21), the latter being the main cause of the SFRC failure, as also evidenced by the DIC results. The tensile-to-shear crack transition is essential for the SFRC failure precursor under different loading conditions.
The incorporation of fibres significantly enhances the toughness and ductility of SFRC compared to NC. This improvement can be attributed to the bridging effect of the fibres, which effectively delay the transition from micro-cracks to macro-cracks, thus providing additional energy absorption capacity [1,2,48]. The evidences offered by the tensile-to-shear crack transition observed in SFRC represent critical aspect of the material failure mechanism. This transition is driven by the load redistribution facilitated by the action of the fibres, which enhances the concrete ability to withstand higher loads before failing.
The use of AE monitoring in this study provides reliable precursors for predicting the imminent failure of SFRC. Parameters such as the cumulated AE curve and the AE time-scaling coefficient βt are effective in forecasting the unstable fracturing processes. The consistent results coming from the application of these AE tools, also considering different loading rates, further validates their reliability as early warning indicators. The loading rate has a substantial impact on the number of shear cracks, and consequently on the ductility and toughness of SFRC. Higher loading rates lead to an increase in the number of shear cracks and reduced the ductility (brittle failure mode). Conversely, lower loading rates result in dominant tensile cracks and large energy absorption, leading to enhanced ductility and toughness. While this study focuses on SFRC, the underlying principles of fibre-reinforcement mechanical behaviour, such as crack bridging and energy dissipation, are applicable to other types of fibre-reinforced brittle-matrix composites [49] and structural schemes.

6. Conclusions

The present study investigates the AE and DIC features during damage in SFRC samples under different loading rates. The following conclusions can be outlined as follows:
(1)
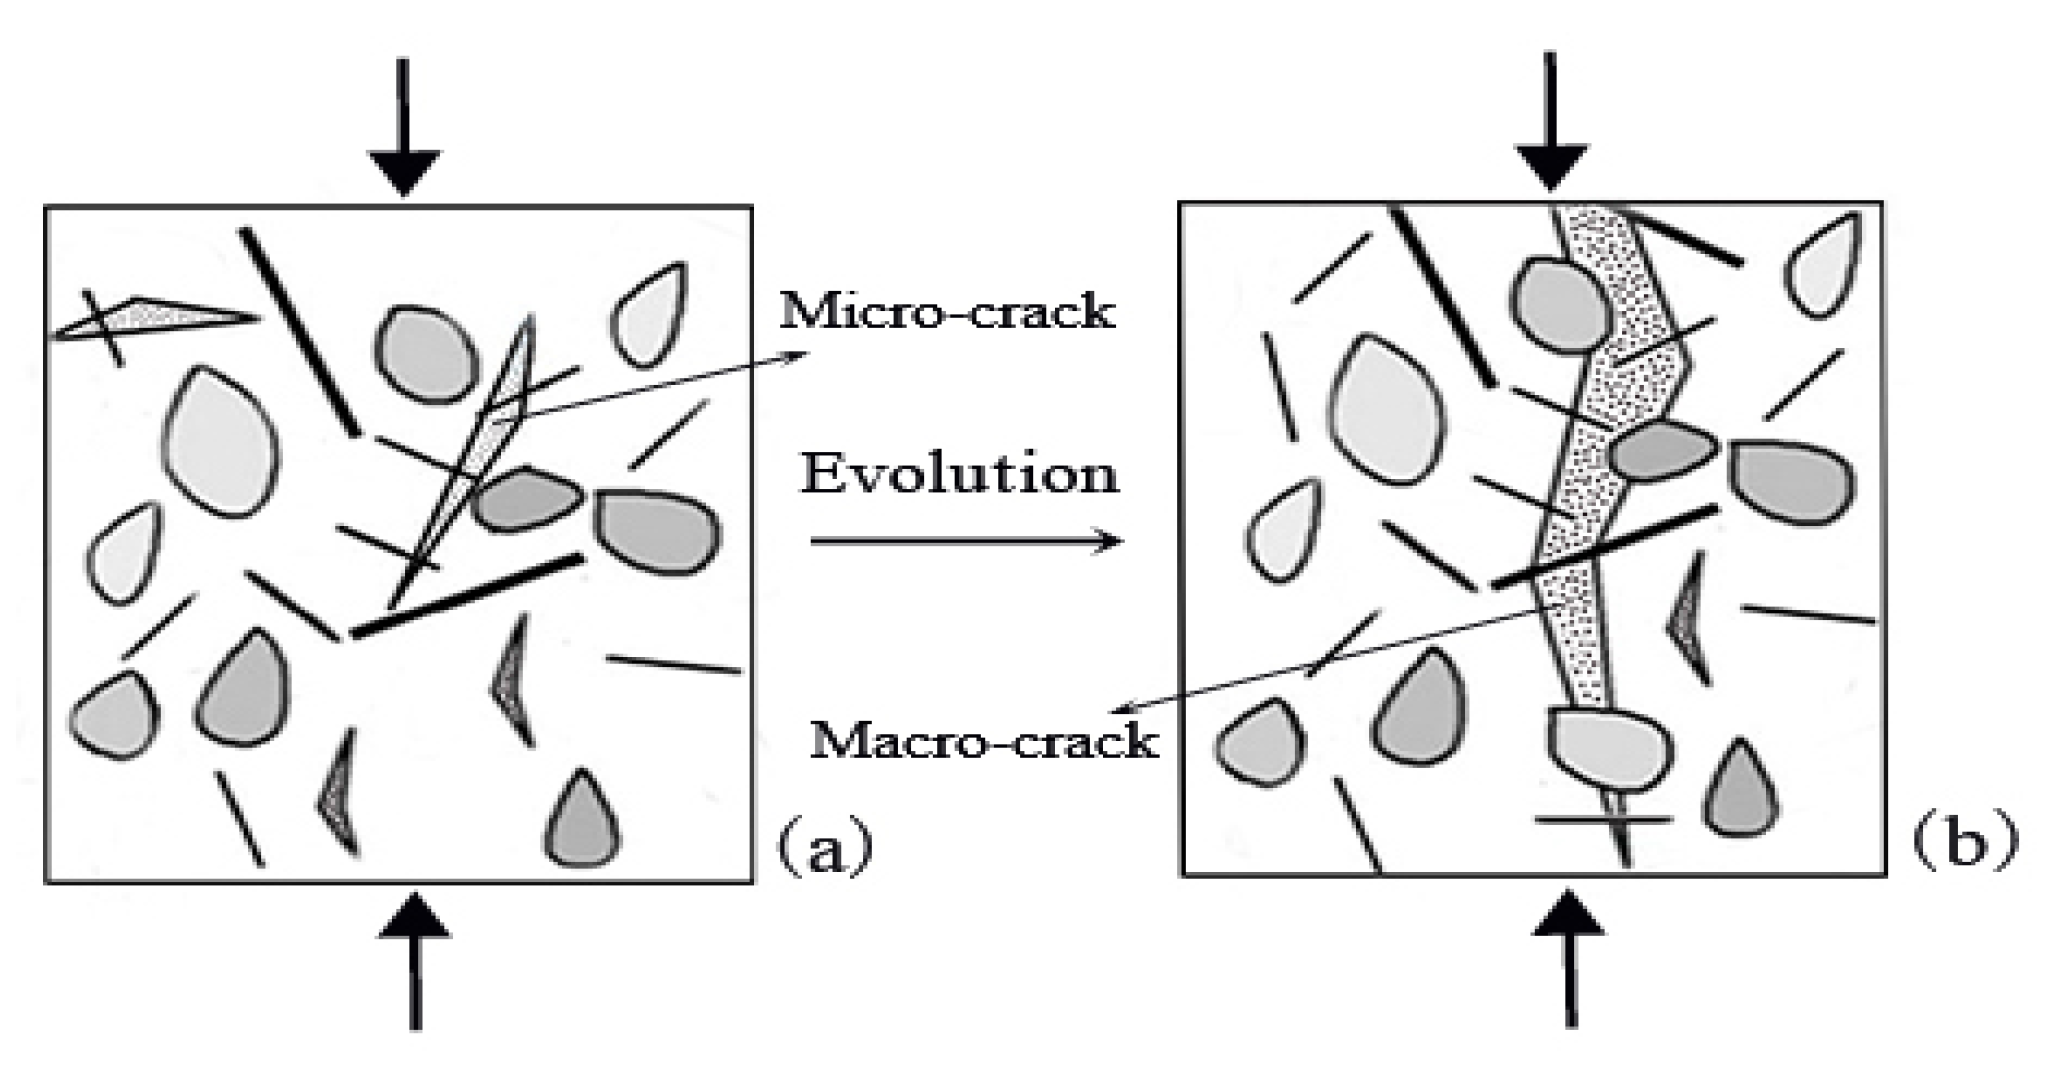
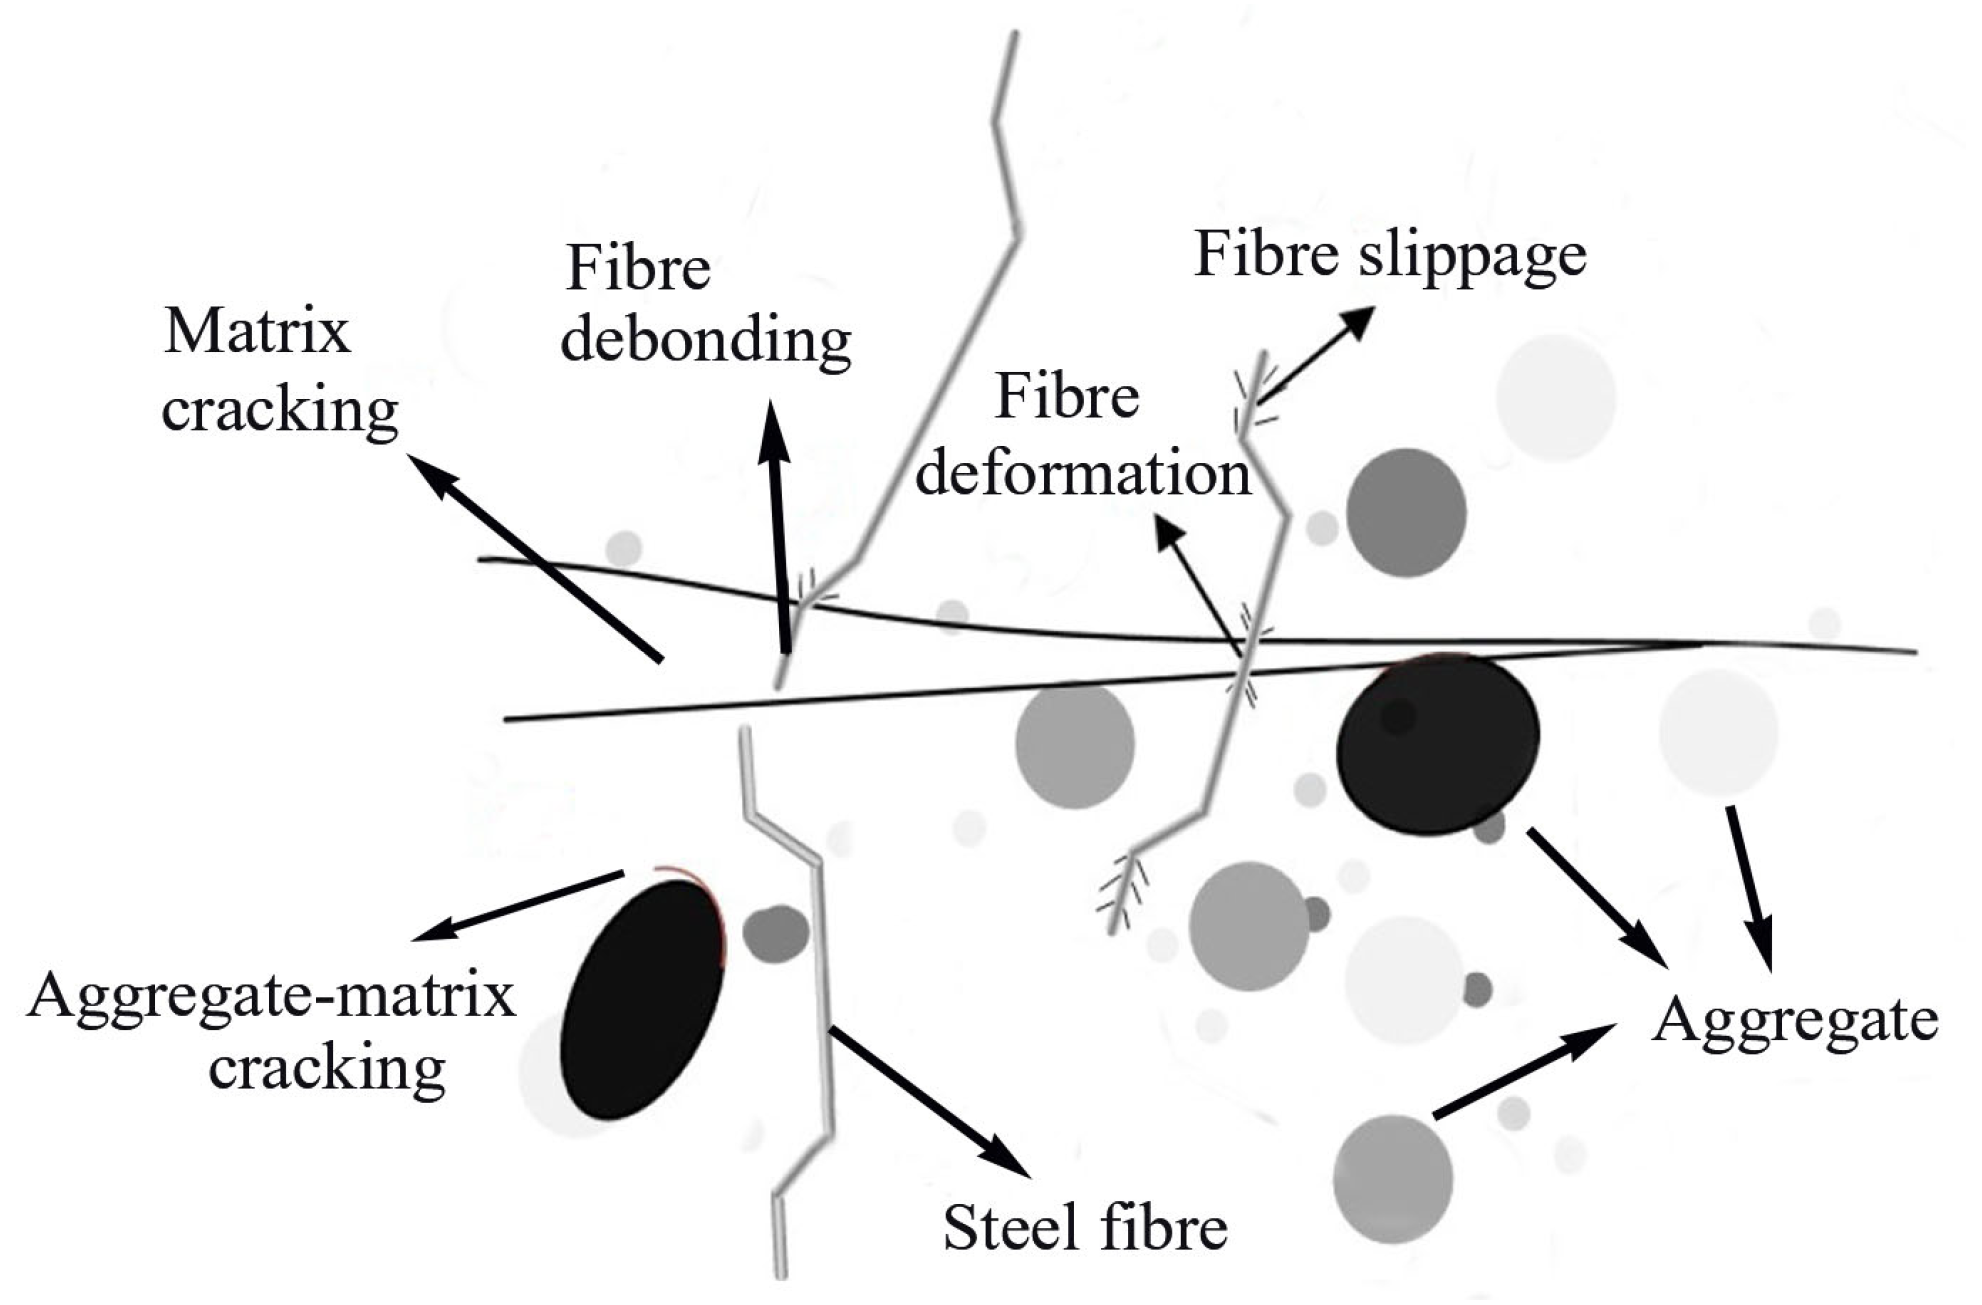
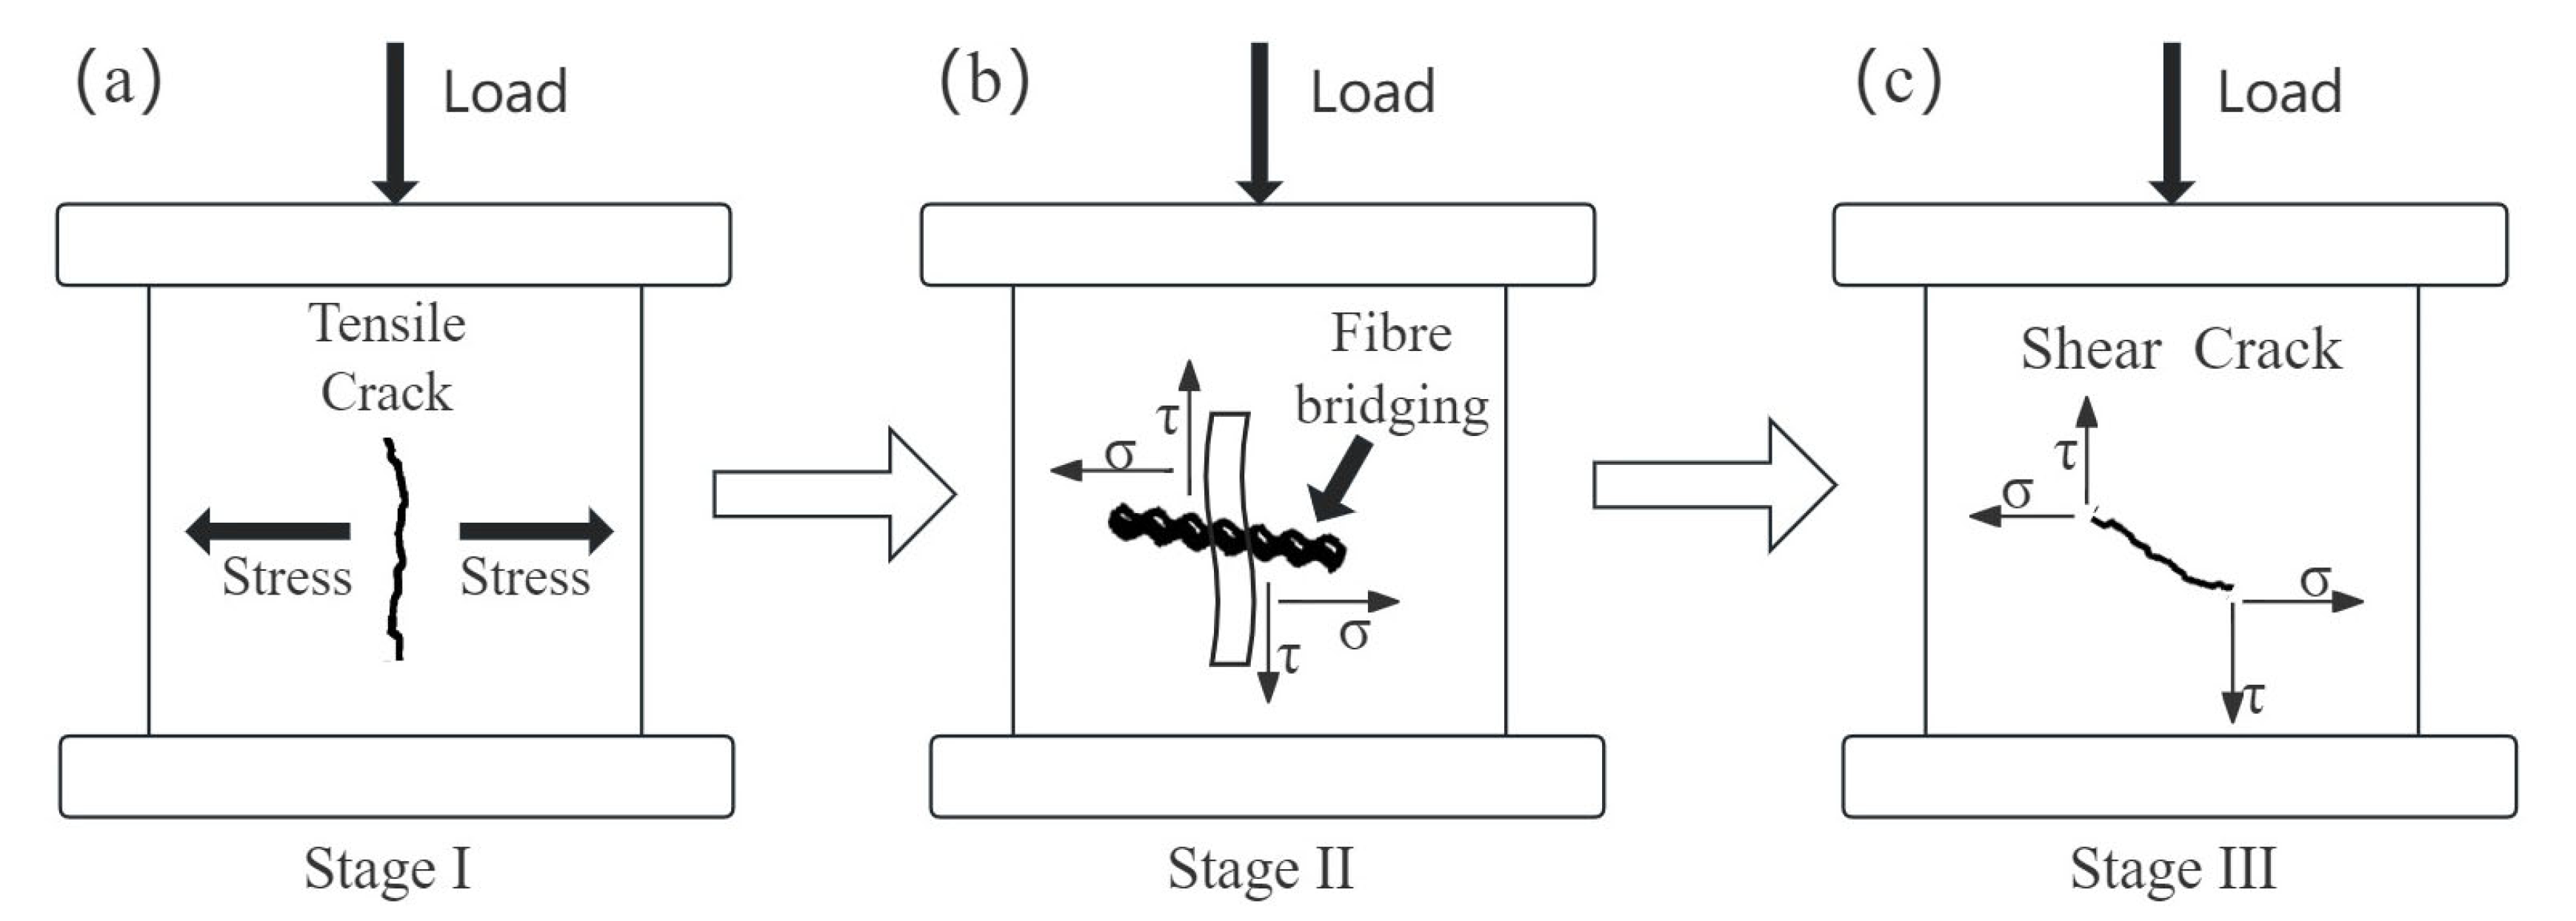
In the early fracturing stage, fibres did not exert their toughening effects, with the AE signals originating from the matrix and aggregate–matrix interface cracking. In the intermediate stage, as macro-cracks extend, fibres begin to restrain the crack propagation, whereas AE arises from the fibre debonding. In the final stage, the fibre bridging action prevents large-scale fracture surfaces, with AE originating from fibre slippage or pull-out.
(2)
The Compressive Toughness Index serves as a damage parameter to assess the impact of fibres on the toughness of the concrete matrix. The toughness of SFRC is influenced by the loading rate, where high loading rates lead to relatively brittle fracturing, whereas low loading rates allow the samples to release energy in a more ductile way.
(3)
DIC monitoring reveals that SFRC exhibits better integrity compared to NC when damaged, shifting from brittle to ductile behaviour. SFRC cracks display dense and slender morphology, whereas NC presents a single vertical crack with a larger width. As the loading rate increases, the dominant cracks in SFRC shift from tensile to shear, accompanied by large transverse deformations.
(4)
AE b-value can determine the exact time of initial cracking in SFRC, whereas βt can determine the occurrence of unstable fracturing process. As the loading rate increases, the regression curve of the b-value shows a downward trend, revealing unstable crack propagation.
(5)
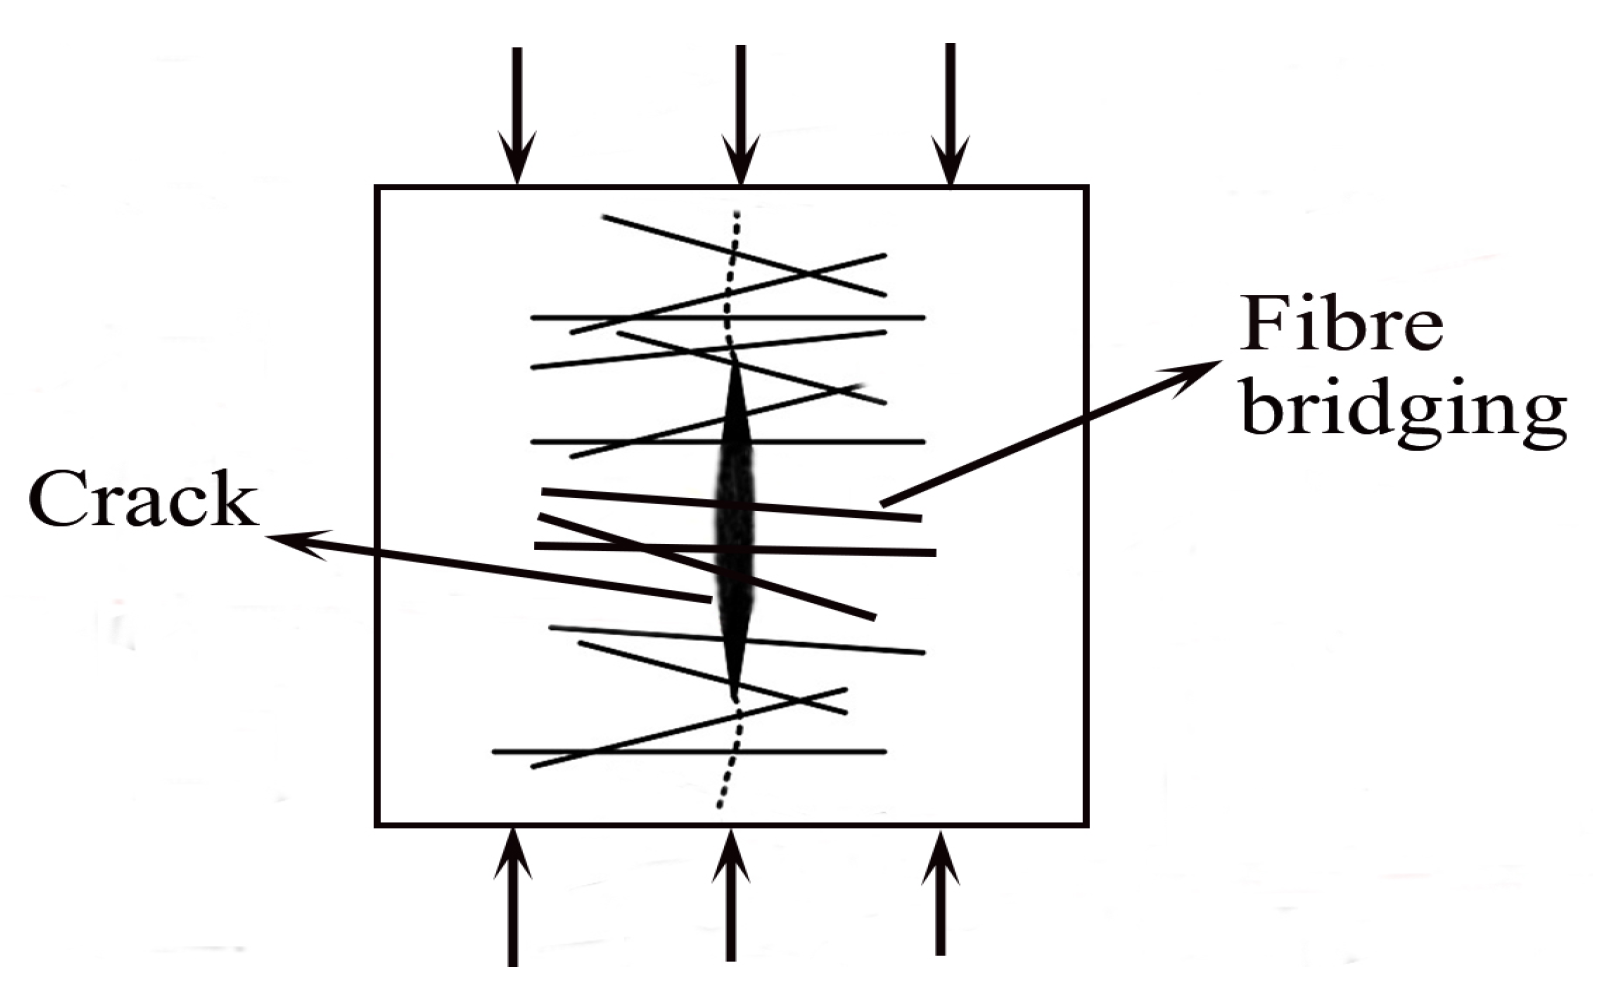
The fibre bridging action facilitates the shift from tensile to shear cracks, thus becoming the main cause of SFRC failure. AF and RA analysis describes a progressive tensile-to-shear crack transition. Since the quantity of shear cracks significantly increases before SFRC failure, this can serve as a safety warning. As the loading rate increases, there is a corresponding increase in the quantity of shear cracks, leading to a decrease in the overall ductility and toughness of SFRC.

Author Contributions

Z.J.: writing—original draft, methodology, investigation, data curation, and conceptualization. Z.Z.: writing—review and editing, writing—original draft, methodology, investigation, data curation, and conceptualization. F.A.: methodology, supervision, and conceptualization, writing—review and editing. All authors have read and agreed to the published version of the manuscript.

Funding

This research was funded by National Natural Science Foundation of China (52278509) and Natural Science Foundation of Guangdong Province (2022A1515 010261) (Zhiwen Zhu), and STU Outstanding Talent Grant N. 140-09423016 (Federico Accornero).

Data Availability Statement

The raw data supporting the conclusions of this article will be made available by the authors on request.

Conflicts of Interest

The authors declare that they have no known competing financial interests or personal relationships that could have appeared to influence the work reported in this paper.

References

  1. Accornero, F.; Rubino, A.; Carpinteri, A. Post-cracking regimes in the flexural behaviour of fibre-reinforced concrete beams. Int. J. Solids Struct. 2022, 248, 111637. [Google Scholar] [CrossRef]
  2. Accornero, F.; Rubino, A.; Carpinteri, A. Ultra-low cycle fatigue (ULCF) in fibre-reinforced concrete beams. Theor. Appl. Fract. Mech. 2022, 120, 103392. [Google Scholar] [CrossRef]
  3. Zhou, M.; He, X.; Wang, H.; Wu, C.; He, J. Mesoscale modeling of polypropylene fiber reinforced concrete under split tension using discrete element method. Constr. Build. Mater. 2023, 404, 133274. [Google Scholar] [CrossRef]
  4. Yoo, D.-Y.; Kim, J.-J.; Park, J.-J. Effect of fiber spacing on dynamic pullout behavior of multiple straight steel fibers in ultra-high-performance concrete. Constr. Build. Mater. 2019, 210, 461–472. [Google Scholar] [CrossRef]
  5. Zheng, Q.; Li, C.; He, B.; Jiang, Z. Revealing the effect of silica fume on the flexural behavior of ultra-high-performance fiber-reinforced concrete by acoustic emission technique. Cem. Concr. Compos. 2022, 131, 104563. [Google Scholar] [CrossRef]
  6. Han, Q.; Yang, G.; Xu, J.; Fu, Z.; Lacidogna, G.; Carpinteri, A. Acoustic emission data analyses based on crumb rubber concrete beam bending tests. Eng. Fract. Mech. 2019, 210, 189–202. [Google Scholar] [CrossRef]
  7. Lacidogna, G.; Piana, G.; Accornero, F.; Carpinteri, A. Multi-technique damage monitoring of concrete beams: Acoustic Emission, Digital Image Correlation, Dynamic Identification. Constr. Build. Mater. 2020, 242, 118114. [Google Scholar] [CrossRef]
  8. Li, W.; Jiang, Z.; Yu, Q. Multiple damaging and self-healing properties of cement paste incorporating microcapsules. Constr. Build. Mater. 2020, 255, 119302. [Google Scholar] [CrossRef]
  9. Carpinteri, A.; Lacidogna, G.; Accornero, F. Fluctuations of 1/f Noise in Damaging Structures Analyzed by Acoustic Emission. Appl. Sci. 2018, 8, 1685. [Google Scholar] [CrossRef]
  10. Aggelis, D.G. Classification of cracking mode in concrete by acoustic emission parameters. Mech. Res. Commun. 2011, 38, 153–157. [Google Scholar] [CrossRef]
  11. Aggelis, D.; Mpalaskas, A.; Matikas, T. Investigation of different fracture modes in cement-based materials by acoustic emission. Cem. Concr. Res. 2013, 48, 1–8. [Google Scholar] [CrossRef]
  12. Rasheed, M.A.; Prakash, S.S.; Raju, G.; Kawasaki, Y. Fracture studies on synthetic fiber reinforced cellular concrete using acoustic emission technique. Constr. Build. Mater. 2018, 169, 100–112. [Google Scholar] [CrossRef]
  13. Golewski, G.L. Measurement of fracture mechanics parameters of concrete containing fly ash thanks to use of Digital Image Correlation (DIC) method. Measurement 2019, 135, 96–105. [Google Scholar] [CrossRef]
  14. Huang, Z.; Tu, Y.; Meng, S.; Sabau, C.; Popescu, C.; Sas, G. Experimental study on shear deformation of reinforced concrete beams using digital image correlation. Eng. Struct. 2018, 181, 670–698. [Google Scholar] [CrossRef]
  15. Bello, I.; González-Fonteboa, B.; Wardeh, G.; Martínez-Abella, F. Characterization of concrete behavior under cyclic loading using 2D digital image correlation. J. Build. Eng. 2023, 78, 107709. [Google Scholar] [CrossRef]
  16. Liu, J.; Kanwal, H.; Tang, C.; Hao, W. Study on flexural properties of 3D printed lattice-reinforced concrete structures using acoustic emission and digital image correlation. Constr. Build. Mater. 2022, 333, 127418. [Google Scholar] [CrossRef]
  17. Andrushia, A.D.; Lubloy, E. Deep learning based thermal crack detection on structural concrete exposed to elevated temperature. Adv. Struct. Eng. 2021, 24, 1896–1909. [Google Scholar] [CrossRef]
  18. Meng, K.; Xu, L.; Chi, Y. Experimental investigation on the mechanical behavior of hybrid steel-polypropylene fiber reinforced concrete under conventional triaxial cyclic compression. Constr. Build. Mater. 2021, 291, 123262. [Google Scholar] [CrossRef]
  19. Li, H.; Li, X.; Fu, J.; Zhu, N.; Chen, D.; Wang, Y.; Ding, S. Experimental study on compressive behavior and failure characteristics of imitation steel fiber concrete under uniaxial load. Constr. Build. Mater. 2023, 399, 132599. [Google Scholar] [CrossRef]
  20. Ren, H.; Li, T.; Ning, J.; Song, S. Analysis of damage characteristics of steel fiber-reinforced concrete based on acoustic emission. Eng. Fail. Anal. 2023, 148, 107166. [Google Scholar] [CrossRef]
  21. Li, B.; Xu, L.; Shi, Y.; Chi, Y.; Liu, Q.; Li, C. Effects of fiber type, volume fraction and aspect ratio on the flexural and acoustic emission behaviors of steel fiber reinforced concrete. Constr. Build. Mater. 2018, 181, 474–486. [Google Scholar] [CrossRef]
  22. Xu, J.; Houndehou, J.D.; Wang, Z.; Ma, Q. Experimental investigation on the mechanical properties and damage evolution of steel-fiber-reinforced crumb rubber concrete with porcelain tile waste. Constr. Build. Mater. 2023, 370, 130643. [Google Scholar] [CrossRef]
  23. Cai, B.; Li, K.; Fu, F. Flexural behavior of steel fiber-reinforced coal gangue aggregate concrete beams. Structures 2023, 52, 131–145. [Google Scholar] [CrossRef]
  24. Boniface, A.; Saliba, J.; Sbartaï, Z.M.; Ranaivomanana, N.; Balayssac, J.P. Evaluation of the acoustic emission 3D localisation accuracy for the mechanical damage monitoring in concrete. Eng. Fract. Mech. 2020, 223, 106742. [Google Scholar] [CrossRef]
  25. Zhou, W.; Lv, Z.H.; Li, Z.Y.; Song, X. Acoustic emission response and micro-deformation behavior for compressive buckling failure of multi-delaminated composites. J. Strain Anal. Eng. Des. 2016, 51, 397–407. [Google Scholar] [CrossRef]
  26. Alam, S.; Loukili, A.; Grondin, F.; Rozière, E. Use of the digital image correlation and acoustic emission technique to study the effect of structural size on cracking of reinforced concrete. Eng. Fract. Mech. 2015, 143, 17–31. [Google Scholar] [CrossRef]
  27. Zhang, P.; Wang, C.; Gao, Z.; Wang, F. A review on fracture properties of steel fiber reinforced concrete. J. Build. Eng. 2023, 67, 105975. [Google Scholar] [CrossRef]
  28. Cui, K.; Xu, L.; Tao, T.; Huang, L.; Li, J.; Hong, J.; Li, H.; Chi, Y. Mechanical behavior of multiscale hybrid fiber reinforced recycled aggregate concrete subject to uniaxial compression. J. Build. Eng. 2023, 71, 106504. [Google Scholar] [CrossRef]
  29. Rooholamini, H.; Hassani, A.; Aliha, M. Fracture properties of hybrid fibre-reinforced roller-compacted concrete in mode I with consideration of possible kinked crack. Constr. Build. Mater. 2018, 187, 248–256. [Google Scholar] [CrossRef]
  30. Li, N.; Jin, Z.; Long, G.; Chen, L.; Fu, Q.; Yu, Y.; Zhang, X.; Xiong, C. Impact resistance of steel fiber-reinforced self-compacting concrete (SCC) at high strain rates. J. Build. Eng. 2021, 38, 102212. [Google Scholar] [CrossRef]
  31. Nguyen, D.-L.; Lam, M.N.-T.; Kim, D.-J.; Song, J. Direct tensile self-sensing and fracture energy of steel-fiber-reinforced concretes. Compos. B Eng. 2020, 183, 107714. [Google Scholar] [CrossRef]
  32. Yin, Y.; Ren, Q.; Shen, L. Study on the effect of aggregate distribution on mechanical properties and damage cracks of concrete based on multifractal theory. Constr. Build. Mater. 2020, 262, 120086. [Google Scholar] [CrossRef]
  33. Lacidogna, G.; Manuello, A.; Niccolini, G.; Accornero, F.; Carpinteri, A. Acoustic emission wireless monitoring of structures. In Acoustic Emission and Related Non-Destructive Evaluation Techniques in the Fracture Mechanics of Concrete; Woodhead Publishing: Cambridge, UK, 2015; pp. 15–40. [Google Scholar]
  34. Colombo, I.S.; Main, I.G.; Forde, M.C. Assessing damage of reinforced concrete beam using “b-value” analysis of acoustic emission signals. J. Mater. Civ. Eng. 2003, 15, 280–286. [Google Scholar] [CrossRef]
  35. Carpinteri, A.; Xu, J.; Lacidogna, G.; Manuello, A. Reliable onset time determination and source location of acoustic emissions in concrete structures. Cem. Concr. Compos. 2012, 34, 529–537. [Google Scholar] [CrossRef]
  36. JCMS-III B5706; Monitoring Method for Active Cracks in Concrete by Acoustic Emission. Federation of Construction Materials Industries: Tokyo, Japan, 2003.
  37. Ohtsu, M. Recommendation of RILEM TC 212-ACD: Acoustic emission and related nde techniques for crack detection and damage evaluation in concrete: Test method for classification of active cracks in concrete by acoustic emission. Mater. Struct. 2010, 43, 1187–1189. [Google Scholar] [CrossRef]
  38. Noorsuhada, M. An overview on fatigue damage assessment of reinforced concrete structures with the aid of acoustic emission technique. Constr. Build. Mater. 2016, 112, 424–439. [Google Scholar] [CrossRef]
  39. Xu, J.; Niu, X.; Ma, Q.; Han, Q. Mechanical properties and damage analysis of rubber cement mortar mixed with ceramic waste aggregate based on acoustic emission monitoring technology. Constr. Build. Mater. 2021, 309, 125084. [Google Scholar] [CrossRef]
  40. Mousavinejad, S.H.G.; Gashti, M.F. Effects of alkaline solution to binder ratio on fracture parameters of steel fiber reinforced heavyweight geopolymer concrete. Theor. Appl. Fract. Mech. 2021, 113, 102967. [Google Scholar] [CrossRef]
  41. Khan, M.; Ali, M. Use of glass and nylon fibers in concrete for controlling early age micro cracking in bridge decks. Constr. Build. Mater. 2016, 125, 800–808. [Google Scholar] [CrossRef]
  42. Khan, M.; Ali, M. Effectiveness of hair and wave polypropylene fibers for concrete roads. Constr. Build. Mater. 2018, 166, 581–591. [Google Scholar] [CrossRef]
  43. Qin, Y.; Zhang, X.; Chai, J.; Xu, Z.; Li, S. Experimental study of compressive behavior of polypropylene-fiber-reinforced and polypropylene-fiber-fabric-reinforced concrete. Constr. Build. Mater. 2019, 194, 216–225. [Google Scholar] [CrossRef]
  44. Carpinteri, A.; Accornero, F. Multiple snap-back instabilities in progressive microcracking coalescence. Eng. Fract. Mech. 2018, 187, 272–281. [Google Scholar] [CrossRef]
  45. Lacidogna, G.; Accornero, F.; Carpinteri, A. Influence of snap-back instabilities on Acoustic Emission damage monitoring. Eng. Fract. Mech. 2019, 210, 3–12. [Google Scholar] [CrossRef]
  46. Jang, S.-J.; Yun, H.-D. Combined effects of steel fiber and coarse aggregate size on the compressive and flexural toughness of high-strength concrete. Compos. Struct. 2018, 185, 203–211. [Google Scholar] [CrossRef]
  47. Ran, J.; Li, T.; Chen, D.; Shang, L.; Li, W.; Zhu, Q. Mechanical properties of concrete reinforced with corrugated steel fiber under uniaxial compression and tension. Structures 2021, 34, 1890–1902. [Google Scholar] [CrossRef]
  48. Carpinteri, A.; Accornero, F. Residual crack opening in fibre-reinforced structural elements subjected to cyclic loading. Strength. Fract. Comp. 2020, 12, 63–74. [Google Scholar] [CrossRef]
  49. Carpinteri, A.; Accornero, F.; Rubino, A. Scale effects in the post-cracking behaviour of fibre-reinforced concrete beams. Int. J. Fract. 2023, 240, 1–16. [Google Scholar] [CrossRef]
Figure 1. Bridging mechanism of fibre reinforcements.
Buildings 14 02039 g001
Figure 2. Micro- and macro-cracks bridged by fibres. (a) Micro-crack stage; (b) Macro-crack stage.
Buildings 14 02039 g002
Figure 3. Meso-scale damage of SFRC.
Buildings 14 02039 g003
Figure 4. Main components of SFRC: (a) Aggregate; (b) Sand; (c) Cement; and (d) Steel fibres.
Buildings 14 02039 g004
Figure 5. Overview of test samples.
Buildings 14 02039 g005
Figure 6. Test setup.
Buildings 14 02039 g006
Figure 7. Loading regimes.
Buildings 14 02039 g007
Figure 8. GR’s law and AE events.
Buildings 14 02039 g008
Figure 9. Crack type and AE.
Buildings 14 02039 g009
Figure 10. Load–displacement curve with indicated three stages.
Buildings 14 02039 g010
Figure 11. SFRC compressive toughness.
Buildings 14 02039 g011
Figure 12. SFRC damage evolution (loading rate: 0.4 mm/min).
Buildings 14 02039 g012
Figure 13. DIC strain analysis at initial cracking with different loading rates.
Buildings 14 02039 g013
Figure 14. DIC strain analysis at fracturing with different loading rates.
Buildings 14 02039 g014
Figure 15. Comparison of SFRC and NC sample failures.
Buildings 14 02039 g015
Figure 16. βt and b-values at different loading rates.
Buildings 14 02039 g016
Figure 17. Cumulated AE and loading history at loading rates of (a) 0.4 mm/min, (b) 0.8 mm/min, and (c) 1.2 mm/min.
Buildings 14 02039 g017
Figure 18. AF and RA in SFRC samples: (a-1a-3) 0.4 mm/min, (b-1b-3) 0.8 mm/min, and (c-1c-3) 1.2 mm/min.
Buildings 14 02039 g018aBuildings 14 02039 g018b
Figure 19. Shear cracks in each damage stage and at different loading rates.
Buildings 14 02039 g019
Figure 20. Tensile-to-shear crack transition. (a) Stage I; (b) Stage II; (c) Stage III.
Buildings 14 02039 g020
Figure 21. Variation in waveforms and crack modes during the fracturing process.
Buildings 14 02039 g021
Table 1. SFRC mix proportion (kg/m3).
ComponentCementSandStoneWaterSteel FibreCarboxylate Water Reducer
Dosage4807131032155759.6
Table 2. SFRC mechanical properties.
MaterialCompression Strength (MPa)Elastic Modulus (GPa)Flexural Strength (MPa)Splitting Strength (MPa)
SFRC64.839.06.84.6
Table 3. Compressive Toughness Index (CTI).
Loading RateA1/(kN·mm)A2/(kN·mm)A4/(kN·mm)CTI (A4/A1)
0.4 mm/min1734926653.84
0.8 mm/min2104907003.33
1.2 mm/min2754897642.77
Disclaimer/Publisher’s Note: The statements, opinions and data contained in all publications are solely those of the individual author(s) and contributor(s) and not of MDPI and/or the editor(s). MDPI and/or the editor(s) disclaim responsibility for any injury to people or property resulting from any ideas, methods, instructions or products referred to in the content.

