Abstract
The Patagonian region of Argentina has great wind potential. In this geographical area of complex terrain, the local wind is influenced by the proximity of the Andes Mountain chain, and it is very intense and turbulent. The wind profiles, turbulence intensity, and average wind speeds at the site do not meet the recommended values in the standards. This issue could have a significant impact on the design loads for structures installed in the region. The objective of this work was to compare the behavior under extreme wind load on different types of towers for multi-MW wind turbines in situ. For this, a hybrid tower, a concrete tower, and a steel tower of equal dimensions were compared. Additionally, we analyzed the influence of the cross-sectional shape of concrete on hybrid towers. The flow pattern around the structures was studied using a solid wall model. As for the towers, we implemented a stress–strain elastic analysis. We calculated the stress fields, displacement fields, and aerodynamic behavior for each tower. We conclude that hybrid towers present the most optimal behavior. Among the different cross-sectional shapes analyzed for this type of tower, we found that all of them show advantages and disadvantages, with the circular section being the one that has the highest average performance from the resistance and aerodynamic standpoint.
1. Introduction
Argentina features an important wind resource in the Patagonian region (Figure 1). The Auquinco area, located in the north of Patagonia, is where the provincial government has carried out feasibility studies for the installation of wind farms with multi-MW wind turbines [1].
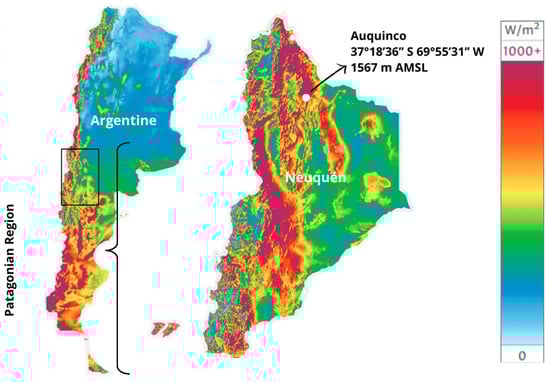
Figure 1.
Power density map at 50 m height in the Patagonia region [2].
In Argentina, the design of wind turbines is not regulated, so its structural calculation must comply with International Standards. Among them, the International Electronical Commission Standard 61400-1 (IEC 61400-1) [3] and the European Wind Turbine Standard II (EWTS II) are the most common ones [4].
Specific studies carried out in Patagonia describe the local wind as intense and highly turbulent, with gusts per yaw that exceed 120 degrees in the change of direction for 3 min [5,6,7]. For this type of wind, the IEC 61400-1 and EWTS II Standards recommend carrying out an on-site wind assessment.
The maximum extractable wind power of a turbine is proportional to the radius of its rotor and the wind speed measured at the level of its axis. It is fairly common in the wind industry to build more powerful wind turbines using towers to support them that need to be increasingly taller. Its structural design constitutes a challenge by having to simultaneously satisfy the requirements of height, strength, rigidity, construction feasibility, transportation, assembly, maintenance, environmental impact, and costs.
Towers for multi-MW wind turbines can be made of steel, concrete, or a hybrid, which is a combination of both materials, where the lower section is made of concrete, and the upper section is made of steel. In hybrid towers, the concrete section can be built with different cross-sectional shapes.
Steel towers are the most traditional ones, but for those whose rotor axes are greater than 85 m high, they present difficulties in balancing the vibrations generated by the wind. Concrete towers can reach greater heights and natural frequencies that avoid resonance with the wind frequency, but they are more susceptible to cracks caused by temperature variation, which leads to lower levels of rigidity [8]. They also have disadvantages in terms of transportation and assembly because of their weight. Hybrid towers combine the best of both materials: Concrete provides rigidity to the lower section, and steel lightens the weight of the upper sections. This combination also reduces construction, transportation, and assembly costs [9].
The use of a cylindrical shape with a variable diameter is frequent due to its ability to optimize the efficient use of materials. The conicity of the tower produces three-dimensional effects on the wake flow that are not yet fully understood [10]. These effects translate into vortex shedding and wake movements that generate loads on the tower depending on the characteristics of the ongoing flow. Additionally, the displacements of the tower provide momentum to the surrounding flow, and this generates a complex fluid–structure interaction [11].
The design of cross-sections plays a crucial role in determining the aerodynamic properties of structures, thereby influencing the surrounding flow dynamics. Studies have been conducted on this phenomenon in tall buildings, identifying the flow pattern around them [12,13,14]. Manufacturers of wind turbine towers solve this issue by building prototypes of different materials and geometries to evaluate their structural design. This is the case for the following factories: Advanced Tower Systems (ATS), Nordex Group, Postensa, Arcosa Wind Towers, and Wuxiao Group, among others.
To consider the influence of local winds on the flow pattern surrounding the structure, wind data collected through on-site measurements can be incorporated into computational fluid dynamics (CFD) simulations. Hu et al. [15] concluded that this methodology is well suited for determining the spatial distribution of wind velocity for a wind farm situated in complex terrain. In a comparable terrain setting, Letzugs et al. [16] reported the effects of local winds on the flow field around the wind turbine and its wake using CFD.
Recent research on the structural behavior of wind turbine towers focuses mostly on methodologies for design optimization [17], analysis of the performance of the towers as a function of height [18], and fatigue analysis of different structural elements [19]. A review of the latest developments in tower structural analysis and design for wind turbines can be consulted in the work carried out by Hernández Estrada and others [20]. For this particular research, the background lies in the characterization of the flow around an 80 m steel tower using wind values measured in the region [11].
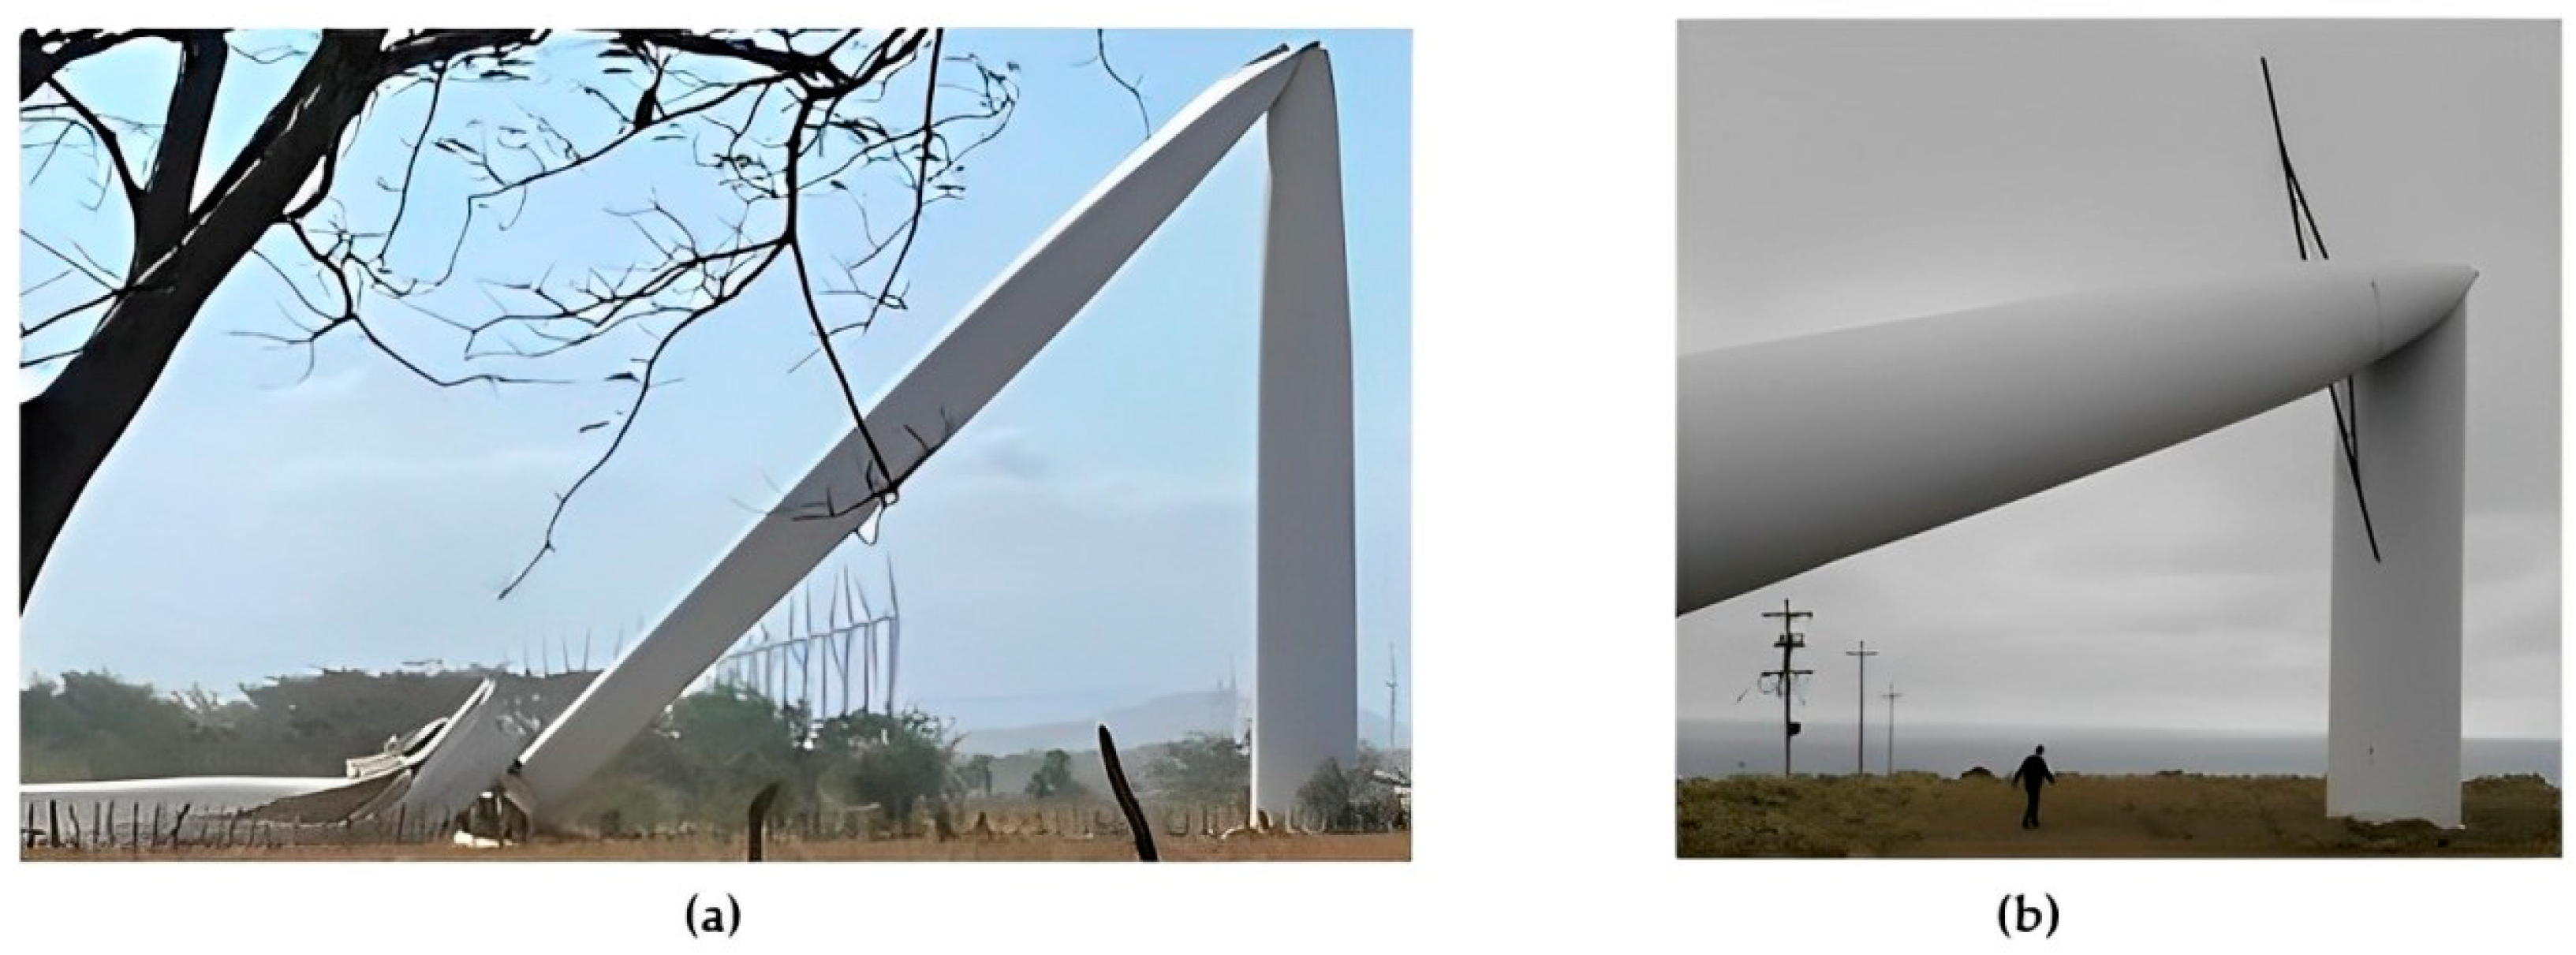
Storms and extreme wind events constitute a critical state of load in which the turbine control mechanisms brake the rotor to avoid mechanical or structural failures due to fatigue processes. In high-power generators, the braking operation includes the rotation of the blades until the trailing edge is aligned with the direction of the wind, reaching the so-called “flagged” position. Once the rotor has stopped, the blades are randomly positioned in front of the tower, thus facing large wind loads. Intense and turbulent winds can lead the tower to collapse, causing operational problems in the wind farm. Cases of tower collapses during intense wind events have been reported. The case of the wind turbines installed in the Patagonian region, which failed due to local wind dynamics after a year of use, was well known in Argentina in the 1980s. Some recent cases of collapse around other parts of the world occurred in Oaxaca (Mexico) in 2023 [21], Maragatería (Spain) in 2022 [22], and Comodoro Rivadavia (Argentina) in 2020 [23], to name a few. Two of these collapsed towers are shown in Figure 2.

Figure 2.
(a) Collapsed wind turbine tower in Maragatería, Spain [22]. (b) Collapsed wind turbine tower in Comodoro Rivadavia, Argentina [23].
Taking into consideration the growth of the wind industry in Argentina, the special characteristics of the wind in the Patagonian area, and its described conditions, the objective of this research is to compare different types of wind turbine towers under wind load using data from in situ extreme wind measurements.
There has been no prior research or literature on modelling these structures using local wind data, making this research the first of its kind. By examining the behavior of various types of wind turbine towers under local wind conditions in the Patagonian region, this research will provide valuable insights. The potential for future analysis and comparisons in this field is boundless. Although the simulations in this study are based on certain simplifying assumptions, the results obtained will help refine the models and set the stage for future research.
2. Materials and Methods
2.1. Site Selection
The Auquinco area (37°18′36″ S 69°55′31″ W 1567 MSL) was selected for its great eolic potential and because the site shall soon feature the installation of an interesting number of wind farms.
2.2. Wind Data Collection
To estimate wind speed parameters, samples were obtained by installing a meteorological station at the Auquinco location. The measurement system consists of an NRG System Symphonie model datalogger, two NRG#40-speed sensors located at 10 and 30 m high, an NRG#200P direction sensor located at 30 m, and an NRG 110S temperature sensor located at 3 m. The equipment records the average, minimum, maximum, and standard deviation values of each sensor in a 10 min interval series.
2.3. Dimensions and Materials Adopted for the Towers to Be Modelled
All dimensions and materials were chosen taking into account the trend in towers installed for multi-MW wind turbines and those marketed by different manufacturers. Table 1 indicates the characteristics of the materials used in the modelling.

Table 1.
Materials used in modelling.
For material comparison, the towers are truncated, conical, and with a height of 100 m. They have an external diameter of 4 m at the base and an external diameter of 3 m at the top. Constant thickness is considered throughout the length. The hybrid tower in this comparison has a 40 m concrete lower span and a 60 m steel upper span. Different cases are shown, varying the characteristic resistance of the concrete and the thicknesses of the towers (Table 2).
Table 2.
Cases analyzed to compare steel, concrete, and hybrid towers.
A cross-section comparison of a 160 m total length hybrid tower is considered. The top of the tower is 60 m high, with a truncated, conical, circular steel section. The 100 m lower section is made of concrete with a joint diameter of 4.3 m and 8.5 m at its base. The material for all cases is a high-performance concrete of 80 MPa strength and maintains a hollow section of 40 cm of constant thickness throughout its entire length. Three types of cross sections were considered: circular, triangular, and cross (Table 3).
Table 3.
Cases analyzed to compare different cross sections of concrete in a hybrid tower.
2.4. Wind Characterization from Measured Data
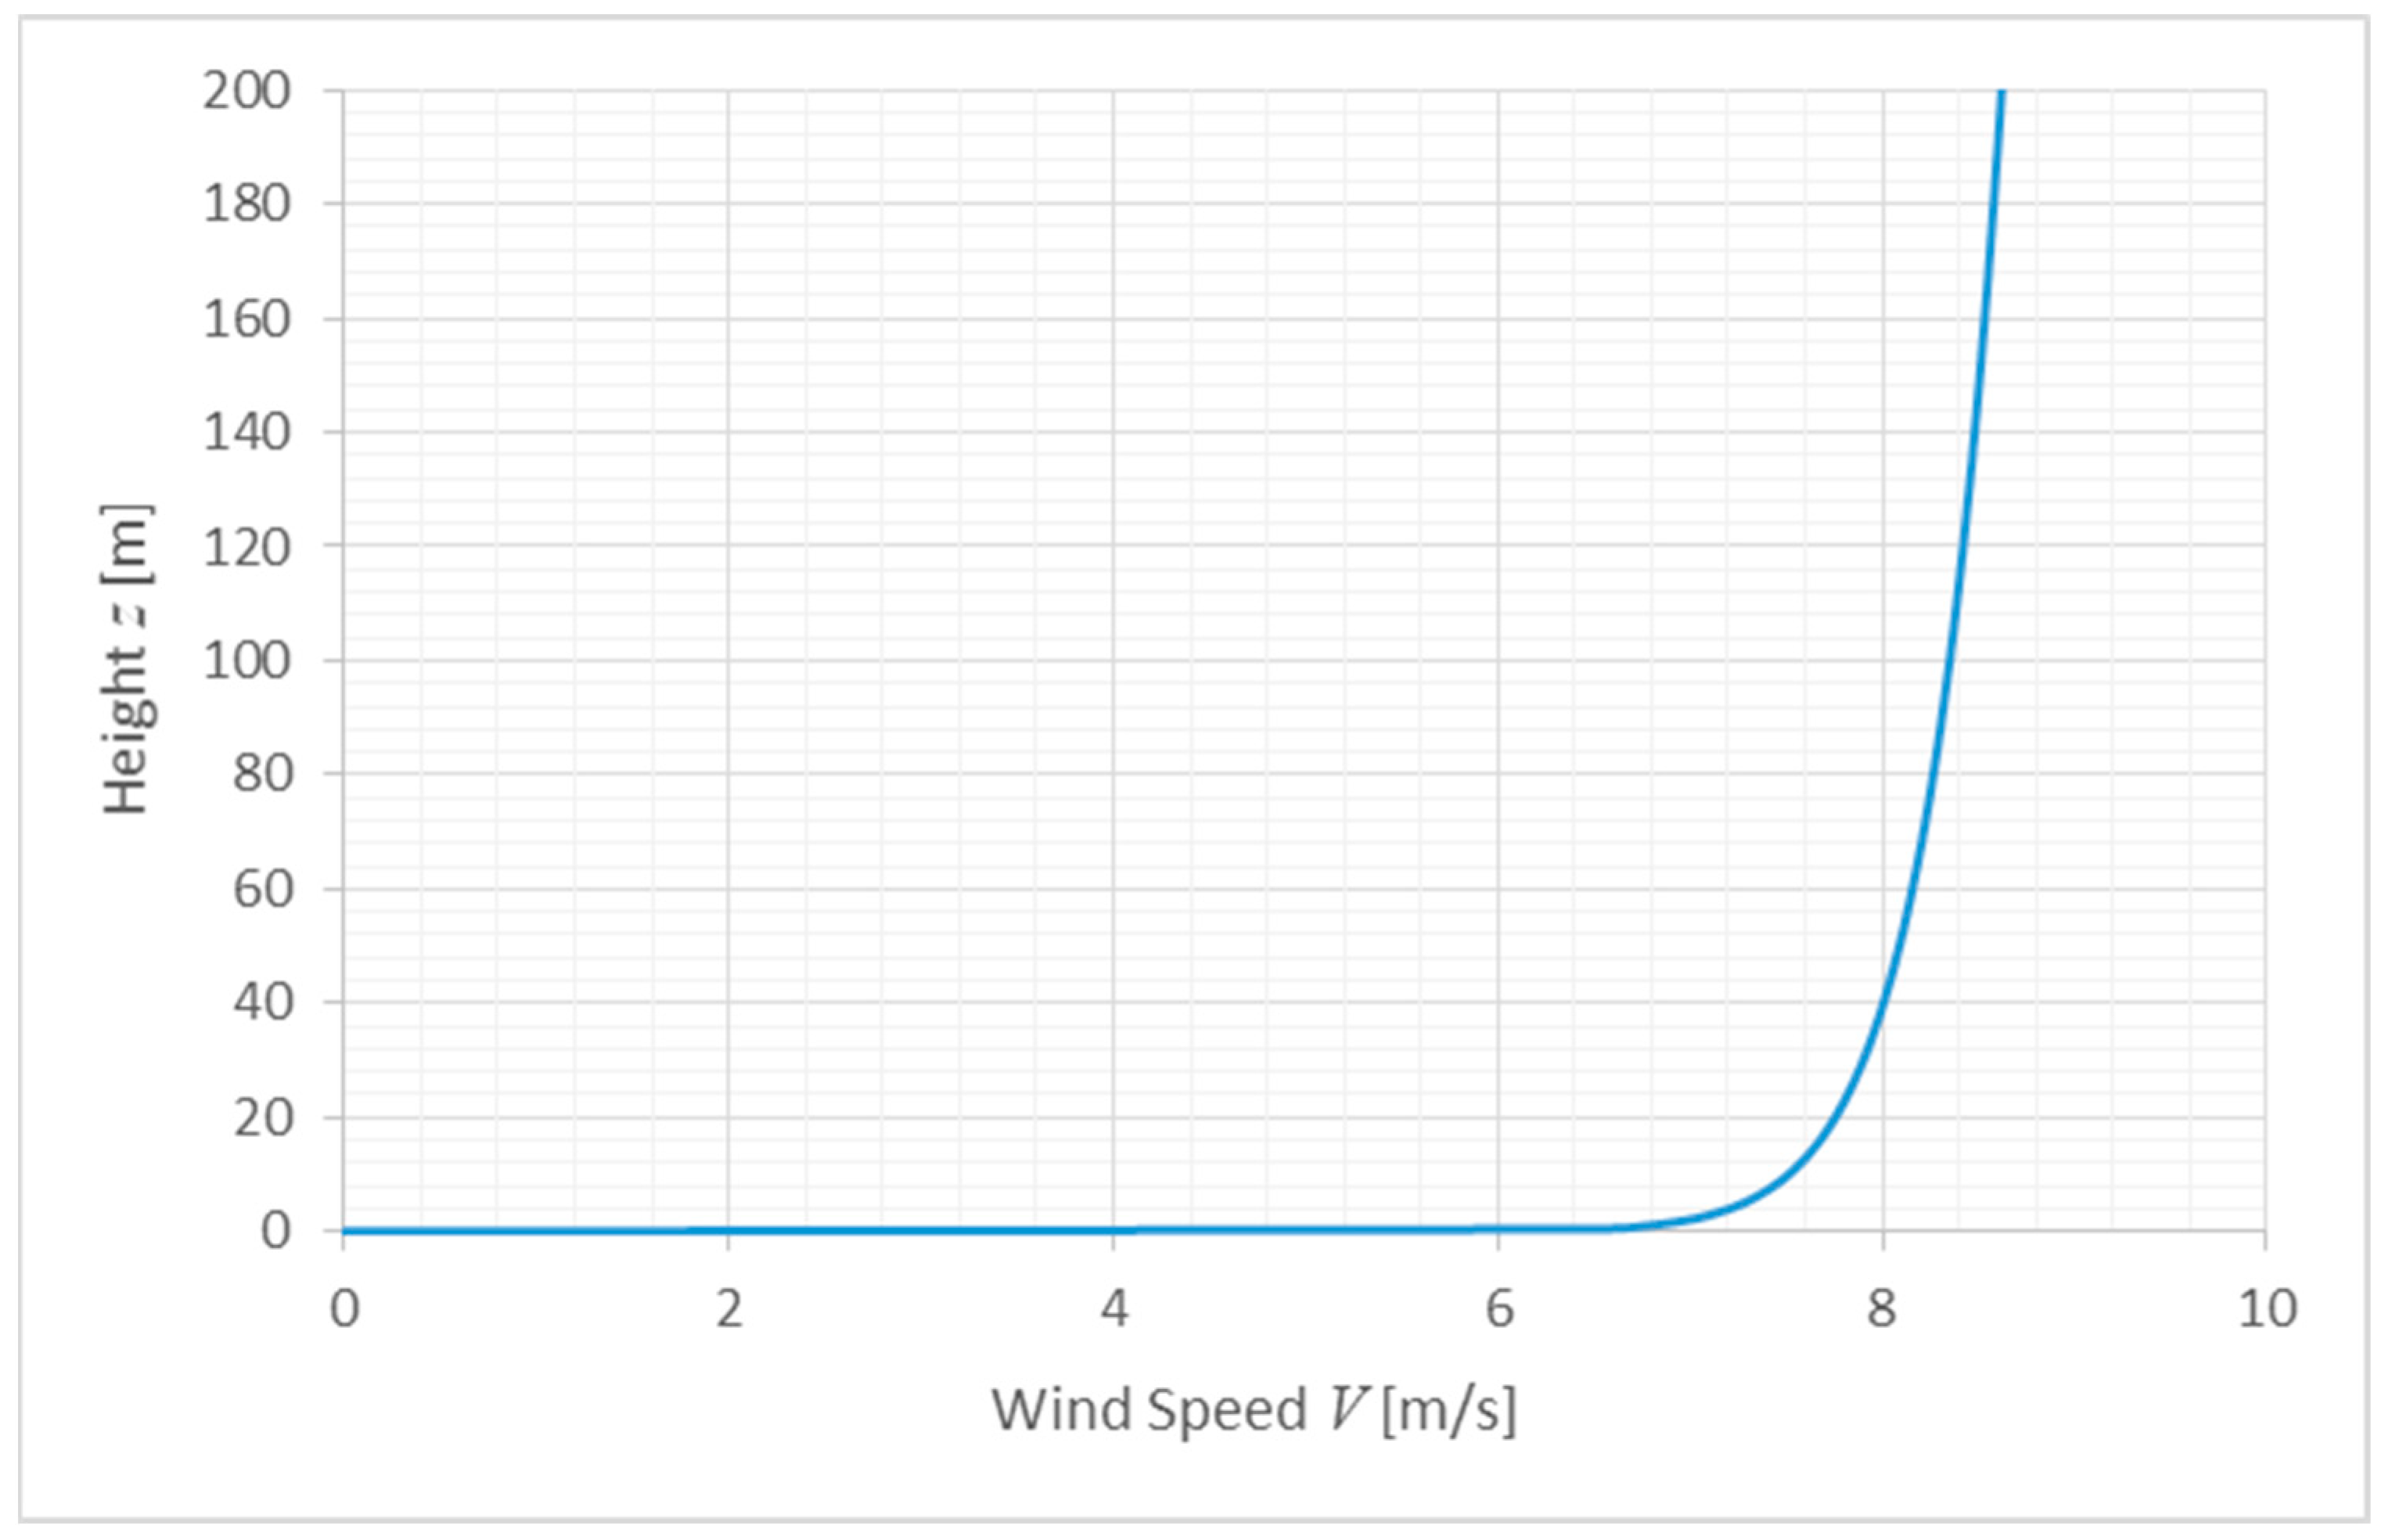
After field measurements, the power law [24,25] for the wind profile proved to be as follows:
where z is the height above ground level, and V(z) is the wind speed at height z. Figure 3 shows the profile obtained.
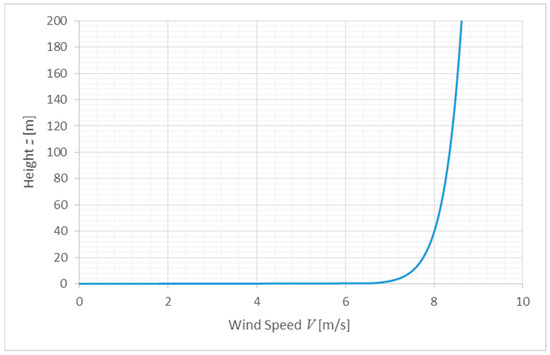
Figure 3.
Wind profile.
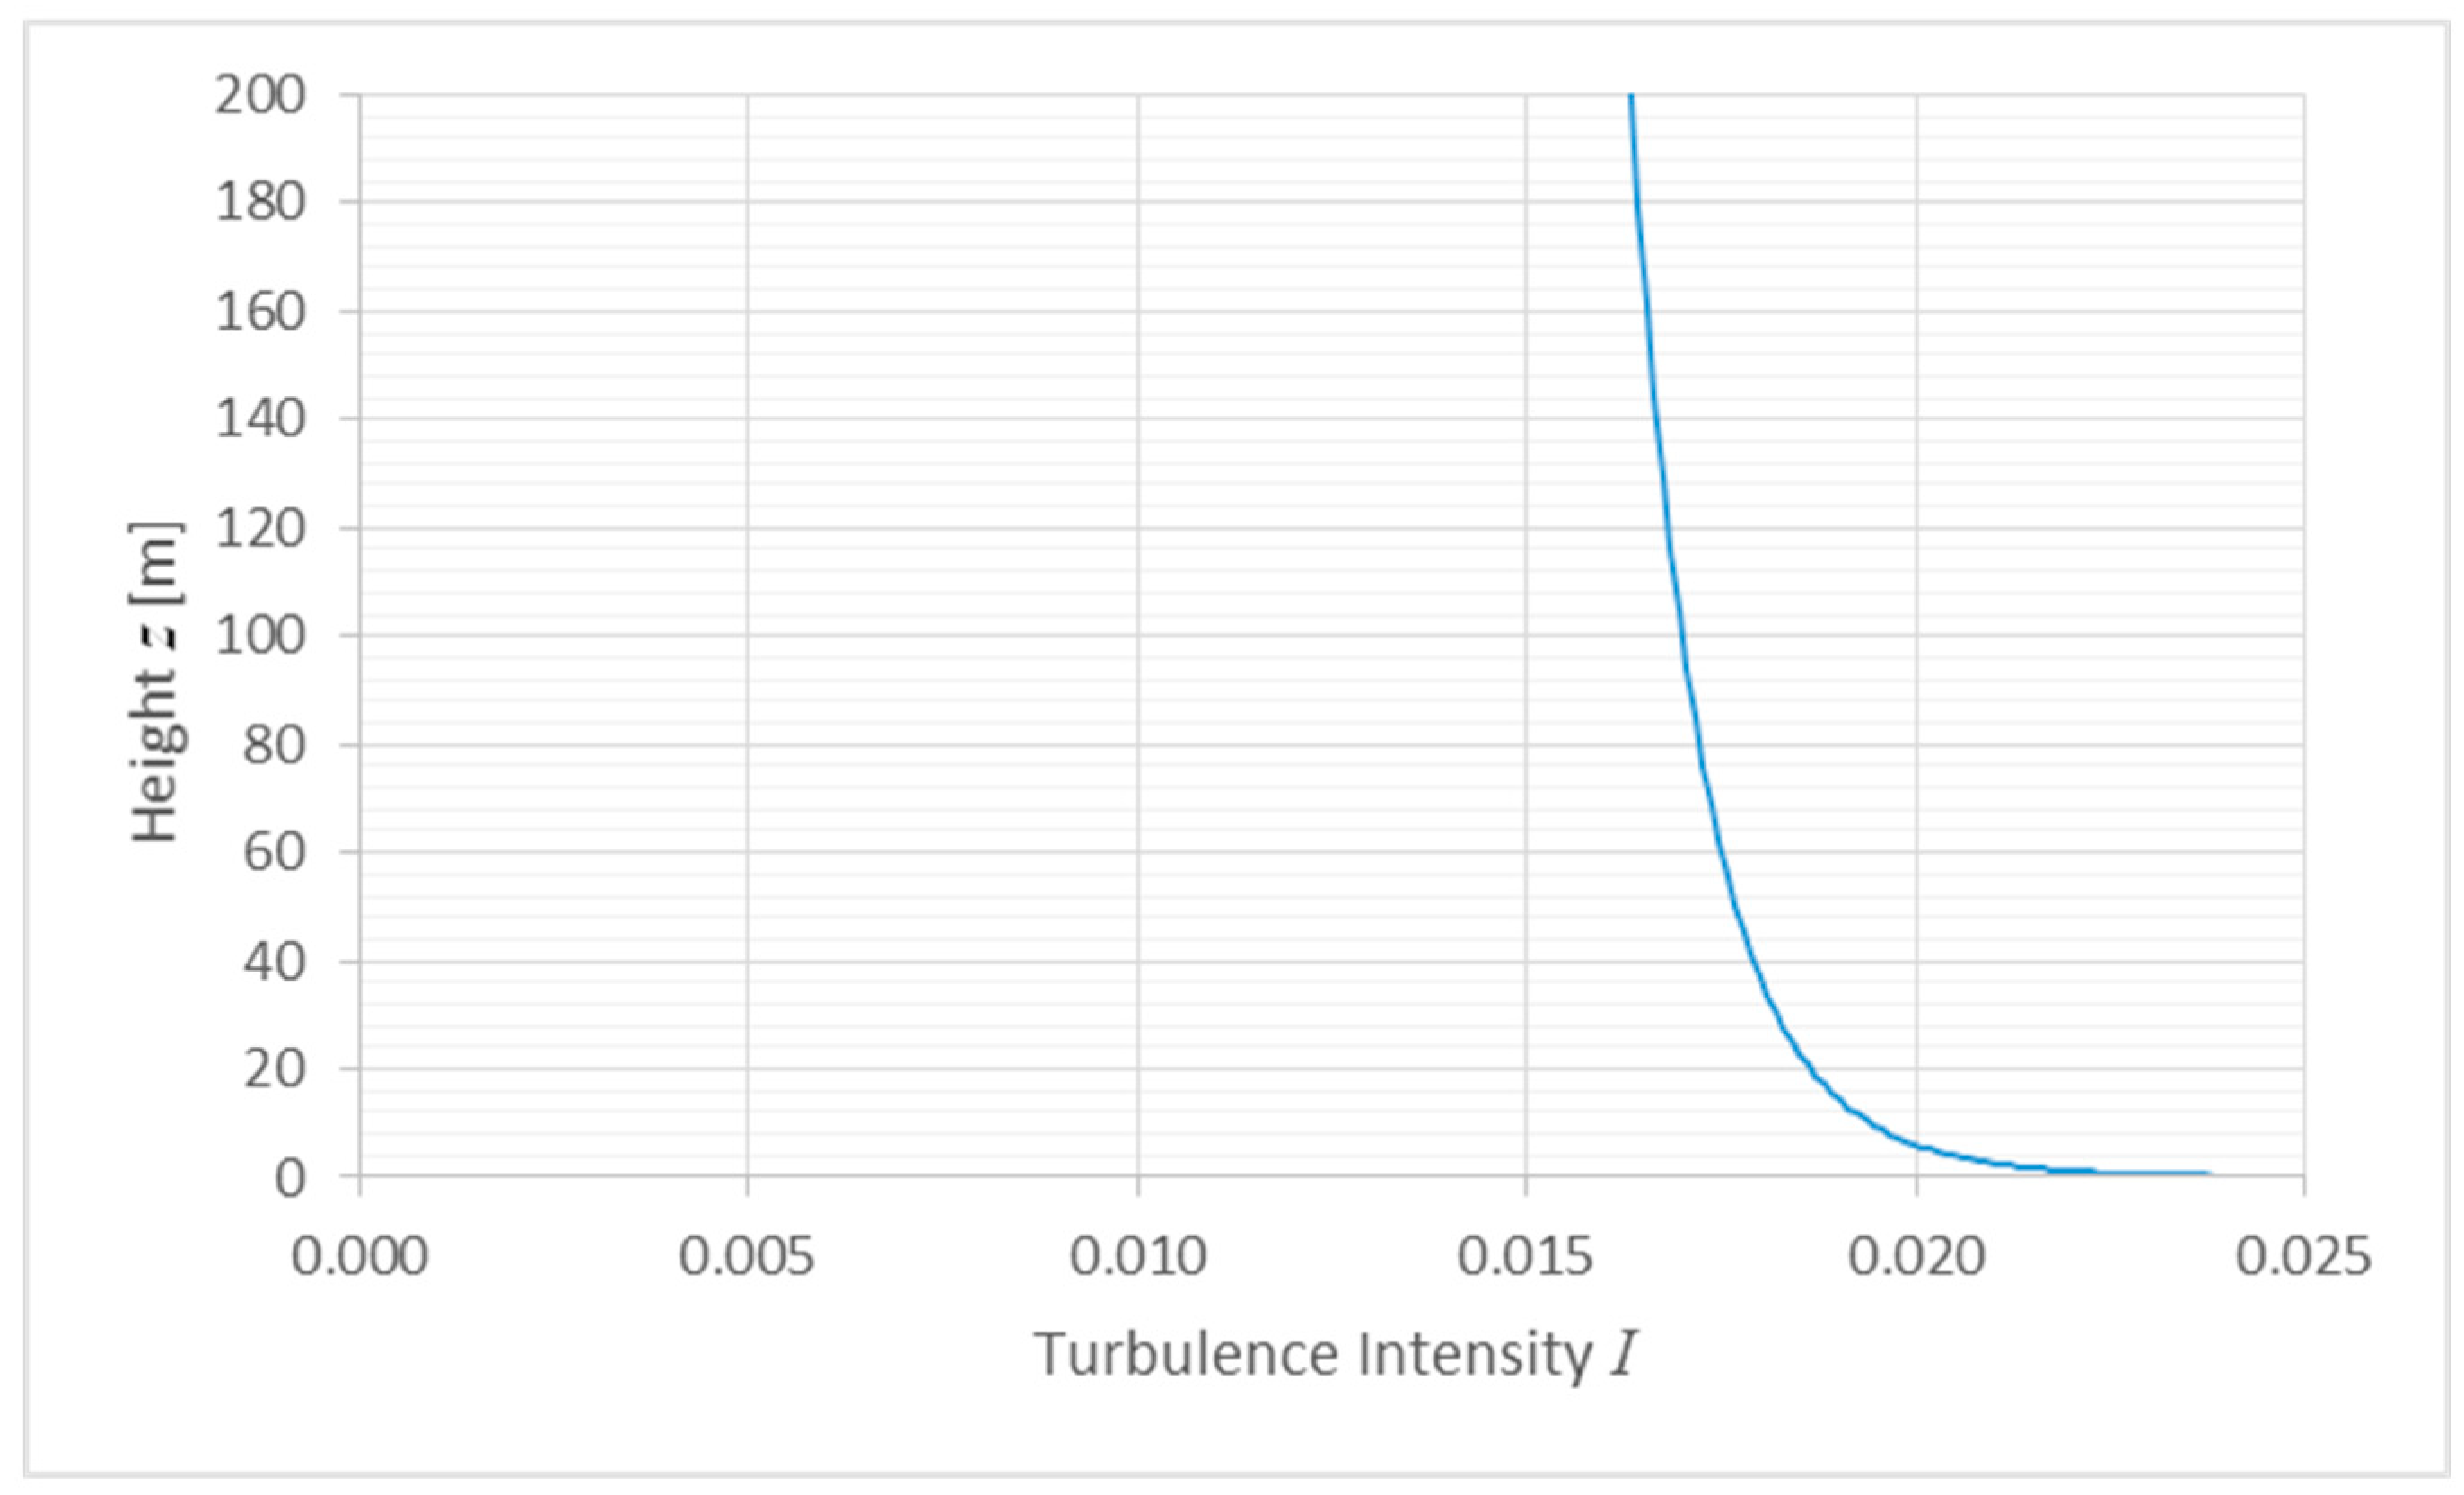
The turbulence intensity profile was built from data measured in situ at 10 m and 30 m, using specialized software (Figure 4).
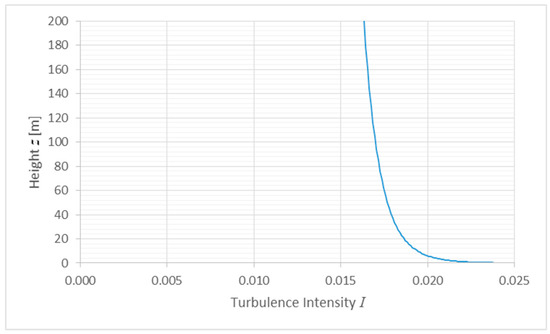
Figure 4.
Turbulence intensity profile.
The IEC 61400-1 Standard requires the calculation of a reference speed Vref and turbulence intensity Iref to classify the type of wind turbine suitable for the site.
The reference speed Vref is defined as the mean extreme speed of 10 min with a return period of 50 years, at the height of the turbine hub (zhub). This was determined using the power law (1). The IEC 61400-1 Standard establishes that for regular turbines, the reference speed is five times higher than the average [3] (p. 24). With this consideration, for towers #1 to #18, Vref = 42.28 m/s (at zhub = 100 m) was obtained, while for towers #19 to #21, Vref was 43.20 m/s (at zhub = 160 m). Other methodologies and results for extreme wind calculations in the region can be consulted in Lassig, J.; Palese C.; and Apcarian A. [26].
The turbulence intensity of reference Iref coincides with the corresponding value at the height of the hub. This value was obtained directly from the profile built from the measurements (Figure 4). For towers #1 to #18, it was Iref =0.17, and for towers #19 to #21, it was Iref = 0.16.
2.5. Selection of Wind Turbines
The IEC 61400-1 Standard determines the type of wind turbine to be installed according to the intensity and turbulence of the wind at the location and the tower height. In this case, IEC II-A/IEC I-A class wind turbines were selected.
When comparing materials, we selected the AW-116/3000 (IEC II-A wind class) wind turbine from the ACCIONA Company. When comparing the hybrid towers, we selected the SG 3.4-132 (IEC I-A/IEC II-A wind class) from Siemmens Gamesa. There were difficulties in accessing specific technical data on wind turbines because the manufacturers considered it confidential information. The selection of these wind turbines is simply because information regarding the weights, dimensions, and materials of all their components are in the public domain. These data are required to carry out the numerical model. Both models are suitable for the wind characteristics in the region and have rotor dimensions according to the height of the tower.
2.6. Design Loads
For structural modelling and analysis, we considered the gravitational loads (PP) of the aerogenerator self-weight and the wind loads (W) produced by the action of the wind over the entire wind turbine. Operational, ice, snow, impact, thermal, or earthquake loads were not considered. Although these are loads that affect wind turbine towers, this research focuses solely on the action of the wind.
To determine wind loads, the IEC 61400-1 Standard establishes an extreme wind model (EWM) and a normal turbulence model (NTM), both depending on the reference speed Vref. The extreme wind model calculates coefficients for the extreme wind profile for steady or turbulent flow. In this case study, we consider turbulent flow conditions. Therefore, the following extreme wind profiles provided by the IEC 61400-1 Standard are shown:
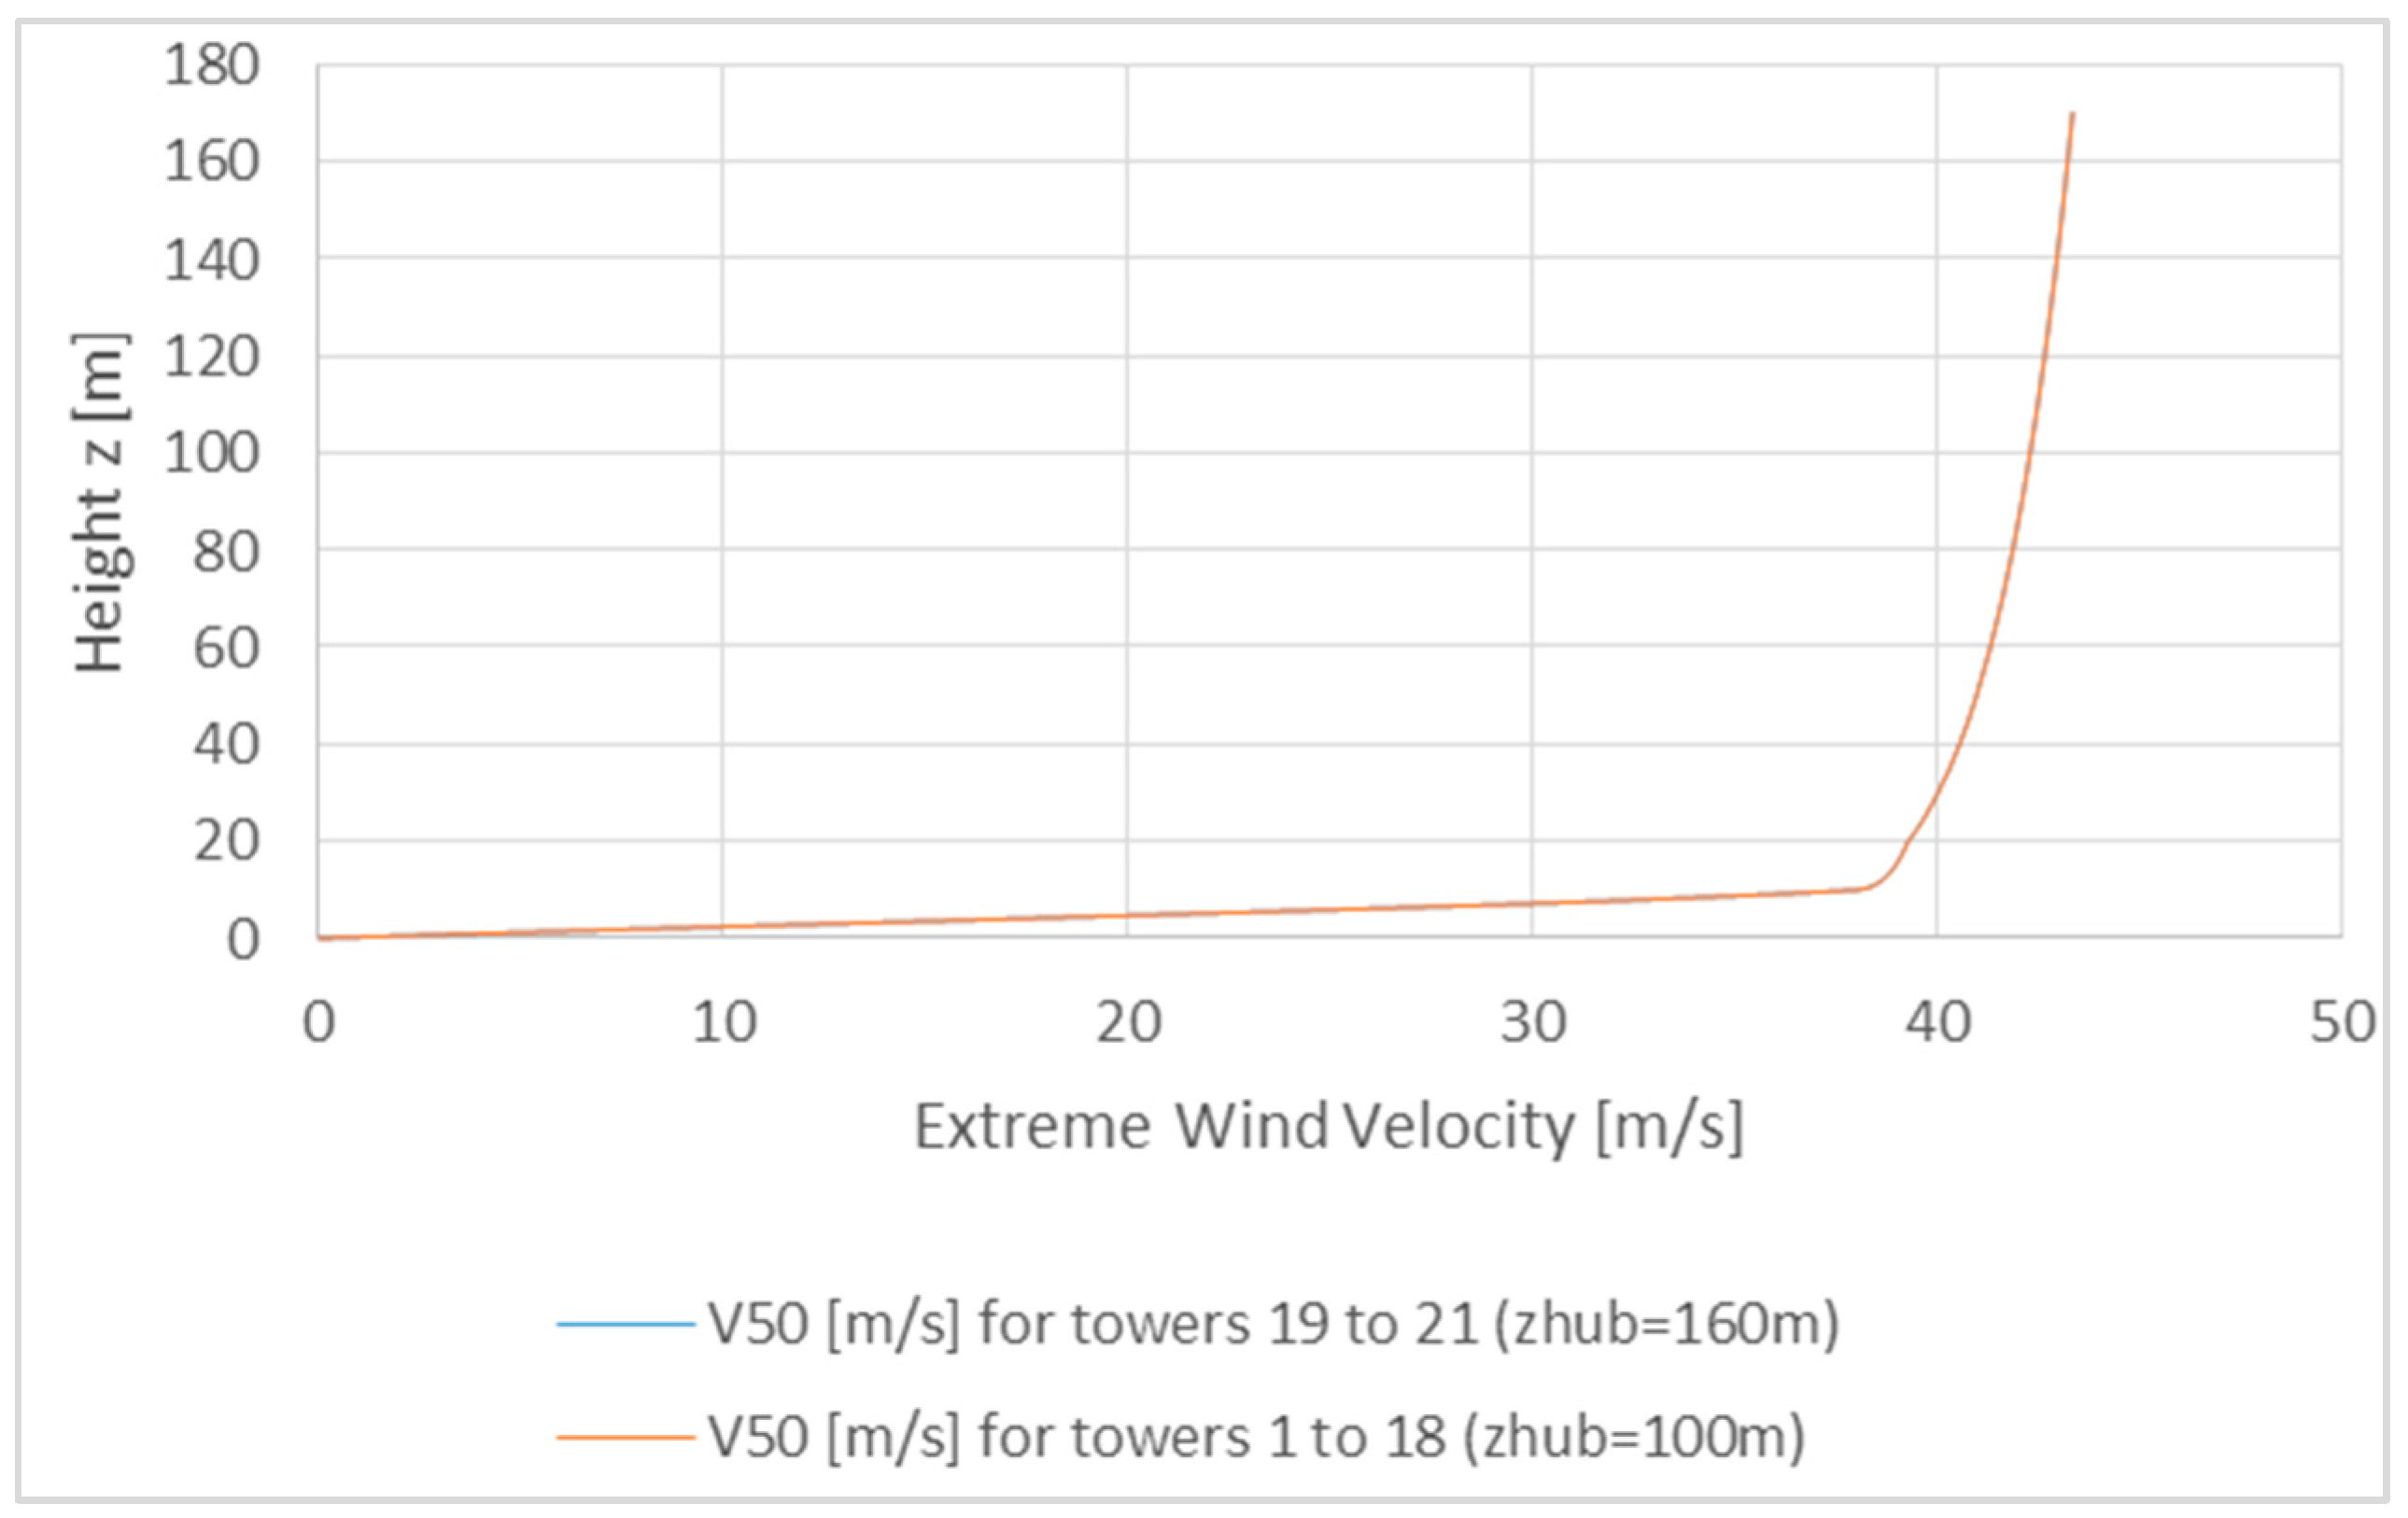
where V50(z) and V1(z) are the average extreme wind speeds within 10 min with a return period of 50 years and 1 year, respectively, as a function of height z. The power law exponent expressed in Equation (2) has a value of 0.11 because the IEC-61400-1 Standard establishes that this value should be based on wind studies and measurements on the European continent. In this study, this coefficient is replaced by α = 0.046, calculated from in situ measurements. Considering that wind speeds are lower if the return period is shorter, we adopt the profile defined in (1), as it would be the most unfavorable condition (Figure 5).
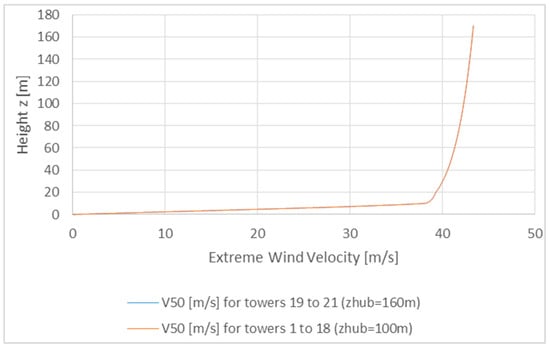
Figure 5.
Wind profile—EMW turbulent model.
2.7. Load Combinations
The IEC 61400-1 Standard considers different design scenarios with different wind conditions (extreme or normal). Normal conditions are those that frequently occur during the normal operation of the wind turbine. Extreme conditions are dangerous wind situations, which can occur with a recurrence period that ranges between 1 and 50 years (rare). For each design condition scenario, the Standard establishes the type of analysis to be performed (ultimate limit states or fatigue) and the safety coefficients that should apply. This research focuses on the case of an extreme wind event, where the rotor is stopped by the power control mechanisms. The Standard identifies these design conditions as “parked” and recommends applying the “extreme” wind condition. The load case results were as follows:
- Case C1: 1.35 × PP + 1.35 * W;
- Case C2: 1.10 × PP + 1.10 * W.
2.8. Model
The structures are modelled with the finite element software RFEM v.5.25.01 based on the following simplifying hypotheses:
- A first-order linear analysis is carried out to be able to apply the principle of superposition of effects;
- The materials are isotropic and linear elastic;
- The design and/or calculation of structural joints or fixing elements (joints, flanges, etc.) are not taken into account. Joints constitute a field of engineering detail that is not part of this work;
- The shape of the nacelle and rotor is modelled in a simplified and approximate manner to correctly simulate their weight and to transmit the wind loads that act on the rotor of the tower. The structural behavior of these elements is not analyzed;
- The tower foundation is modelled as an embedment in the base of the tower.
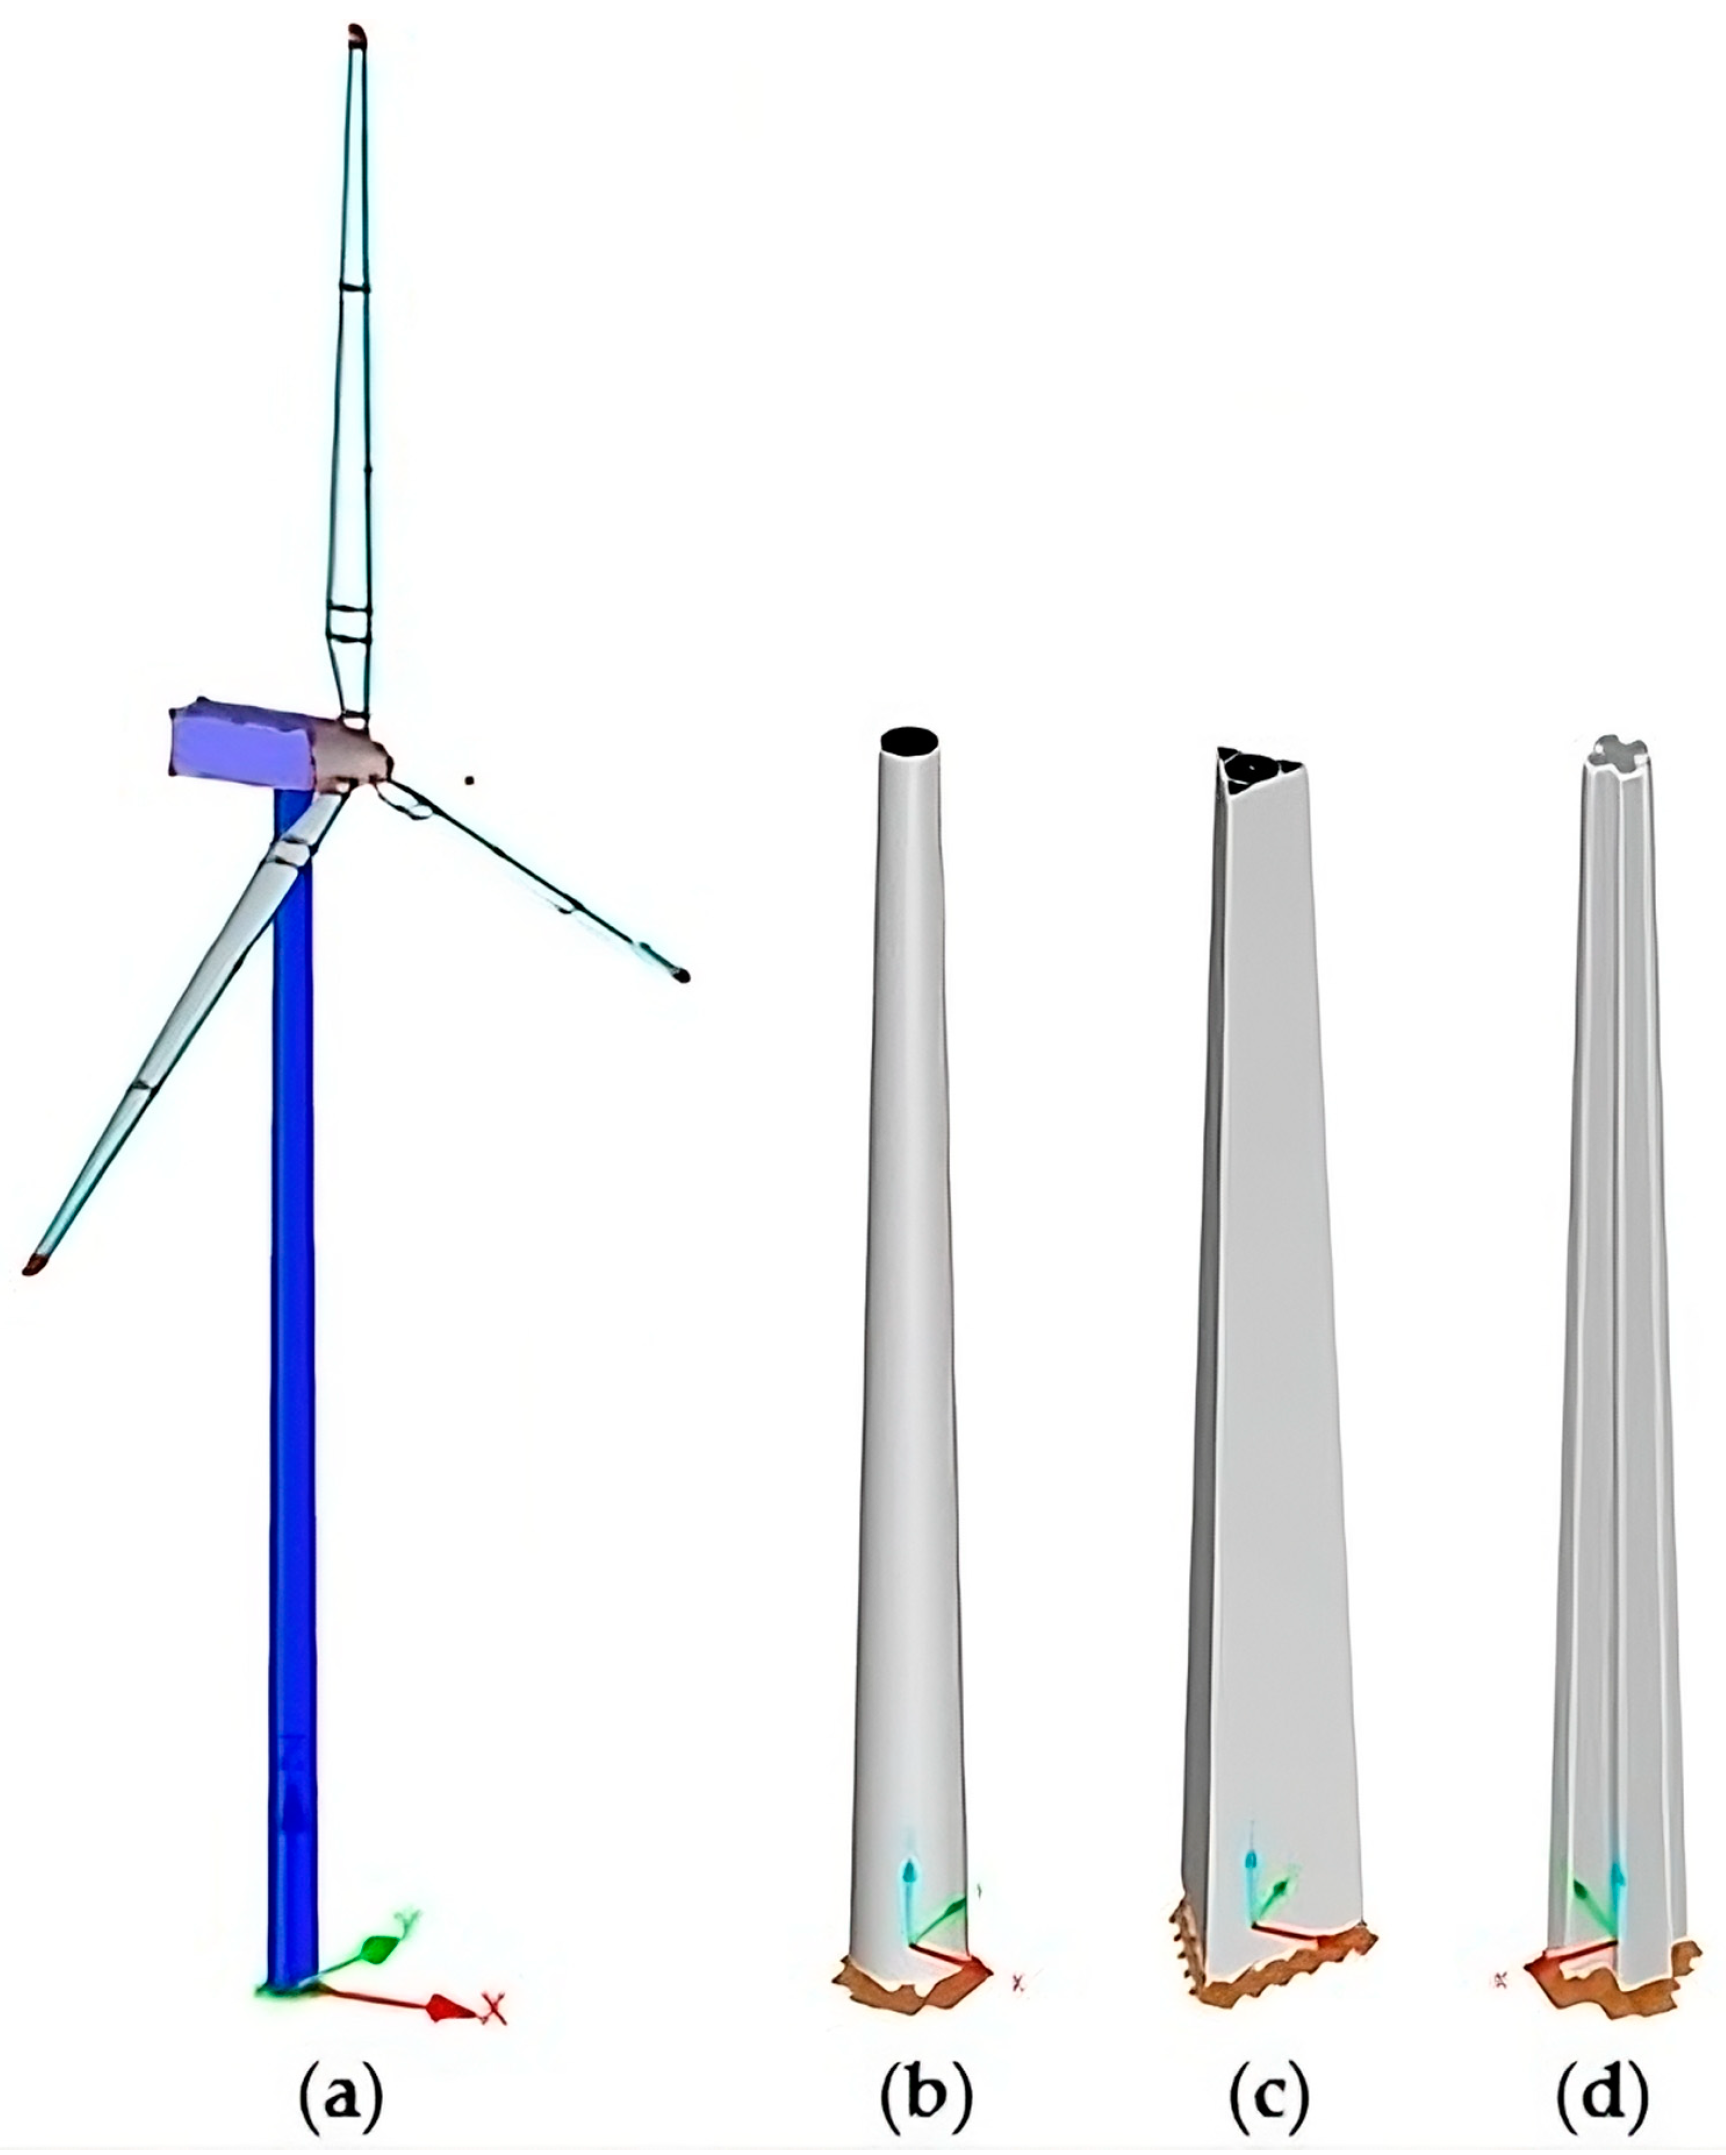
The components of the wind turbines (hub, nacelle, and blades) were modelled with an approximate geometry based on their actual dimensions. For each of them, their weight and material were taken from the data provided by the manufacturers. The blades were modelled in a flag position. The components fulfilled the function of simulating the load transmission to the tower in the most realistic way possible, even though they were not subjected to a structural behavior analysis. The RFEM v.5.25.01 software provides a default size for the finite element mesh. This parameter was not modified because changing to a smaller mesh would largely increase the necessary computational power. Considering that the number of nodes and elements is not excessively high, that the calculation time is adequate, and that the approximation is sufficiently realistic, the size of the elements was maintained at 0.5 m. Rectangular and triangular elements were used, keeping the default configuration of the software. Parts of the models are shown in Figure 6, Figure 7, Figure 8 and Figure 9.
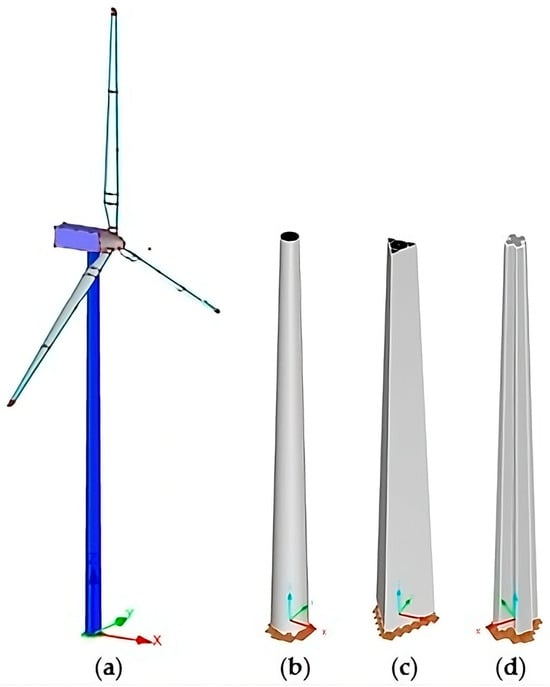
Figure 6.
(a) Model for towers 1 to 18. (b) The lower section of tower #19 model. (c) Lower section of tower #20 model. (d) Lower section of tower #21 model.

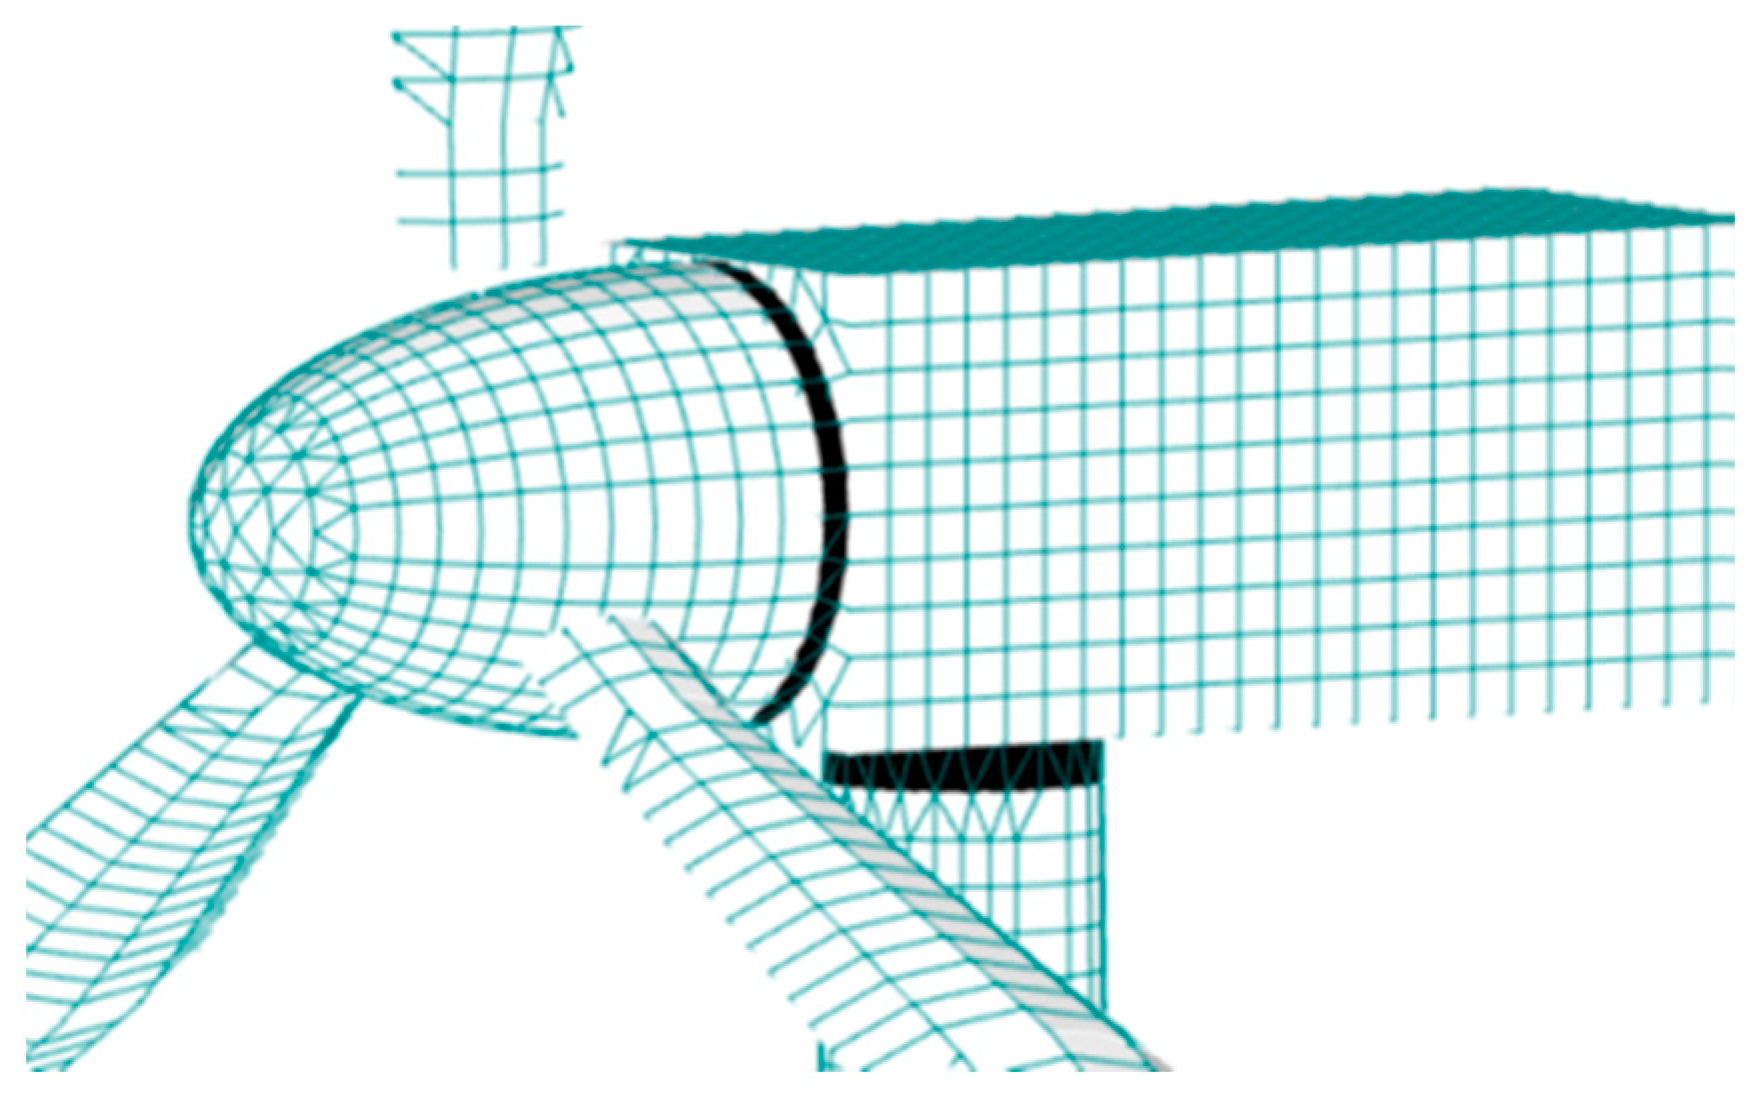
Figure 7.
Finite element meshing of the rotor and nacelle of the SG 3.4-132 wind turbine (towers 19 to 21).
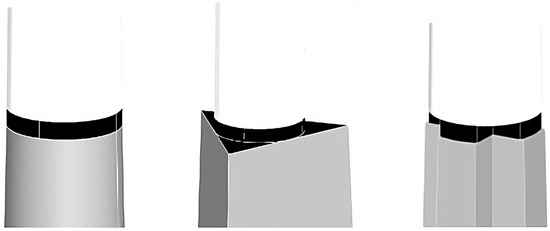
Figure 8.
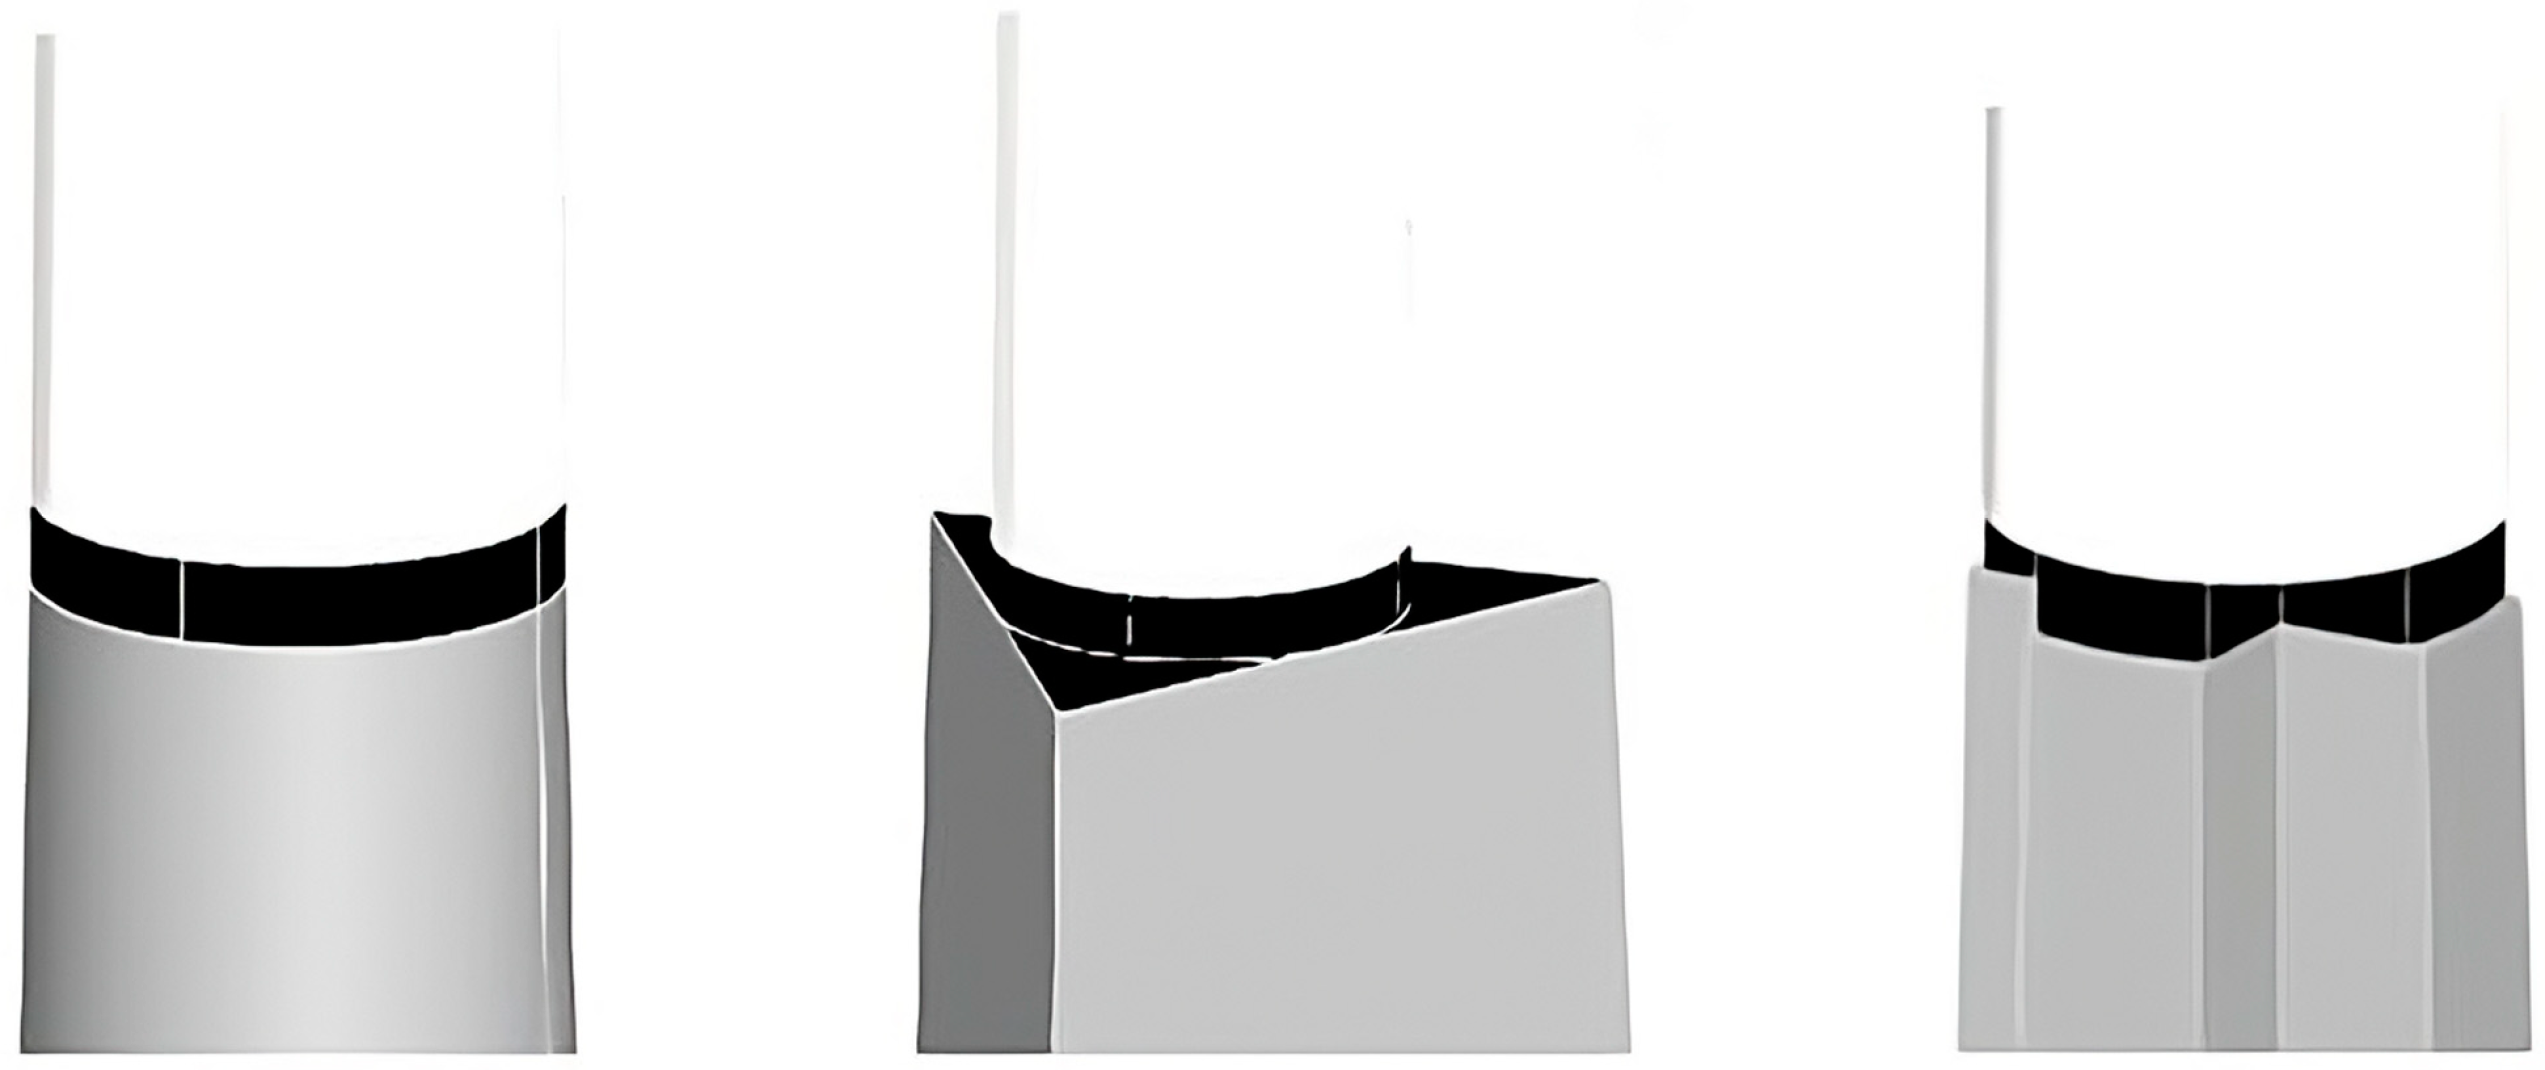
Modeling of the joints between the concrete and steel sections in towers 19 to 21.

Figure 9.
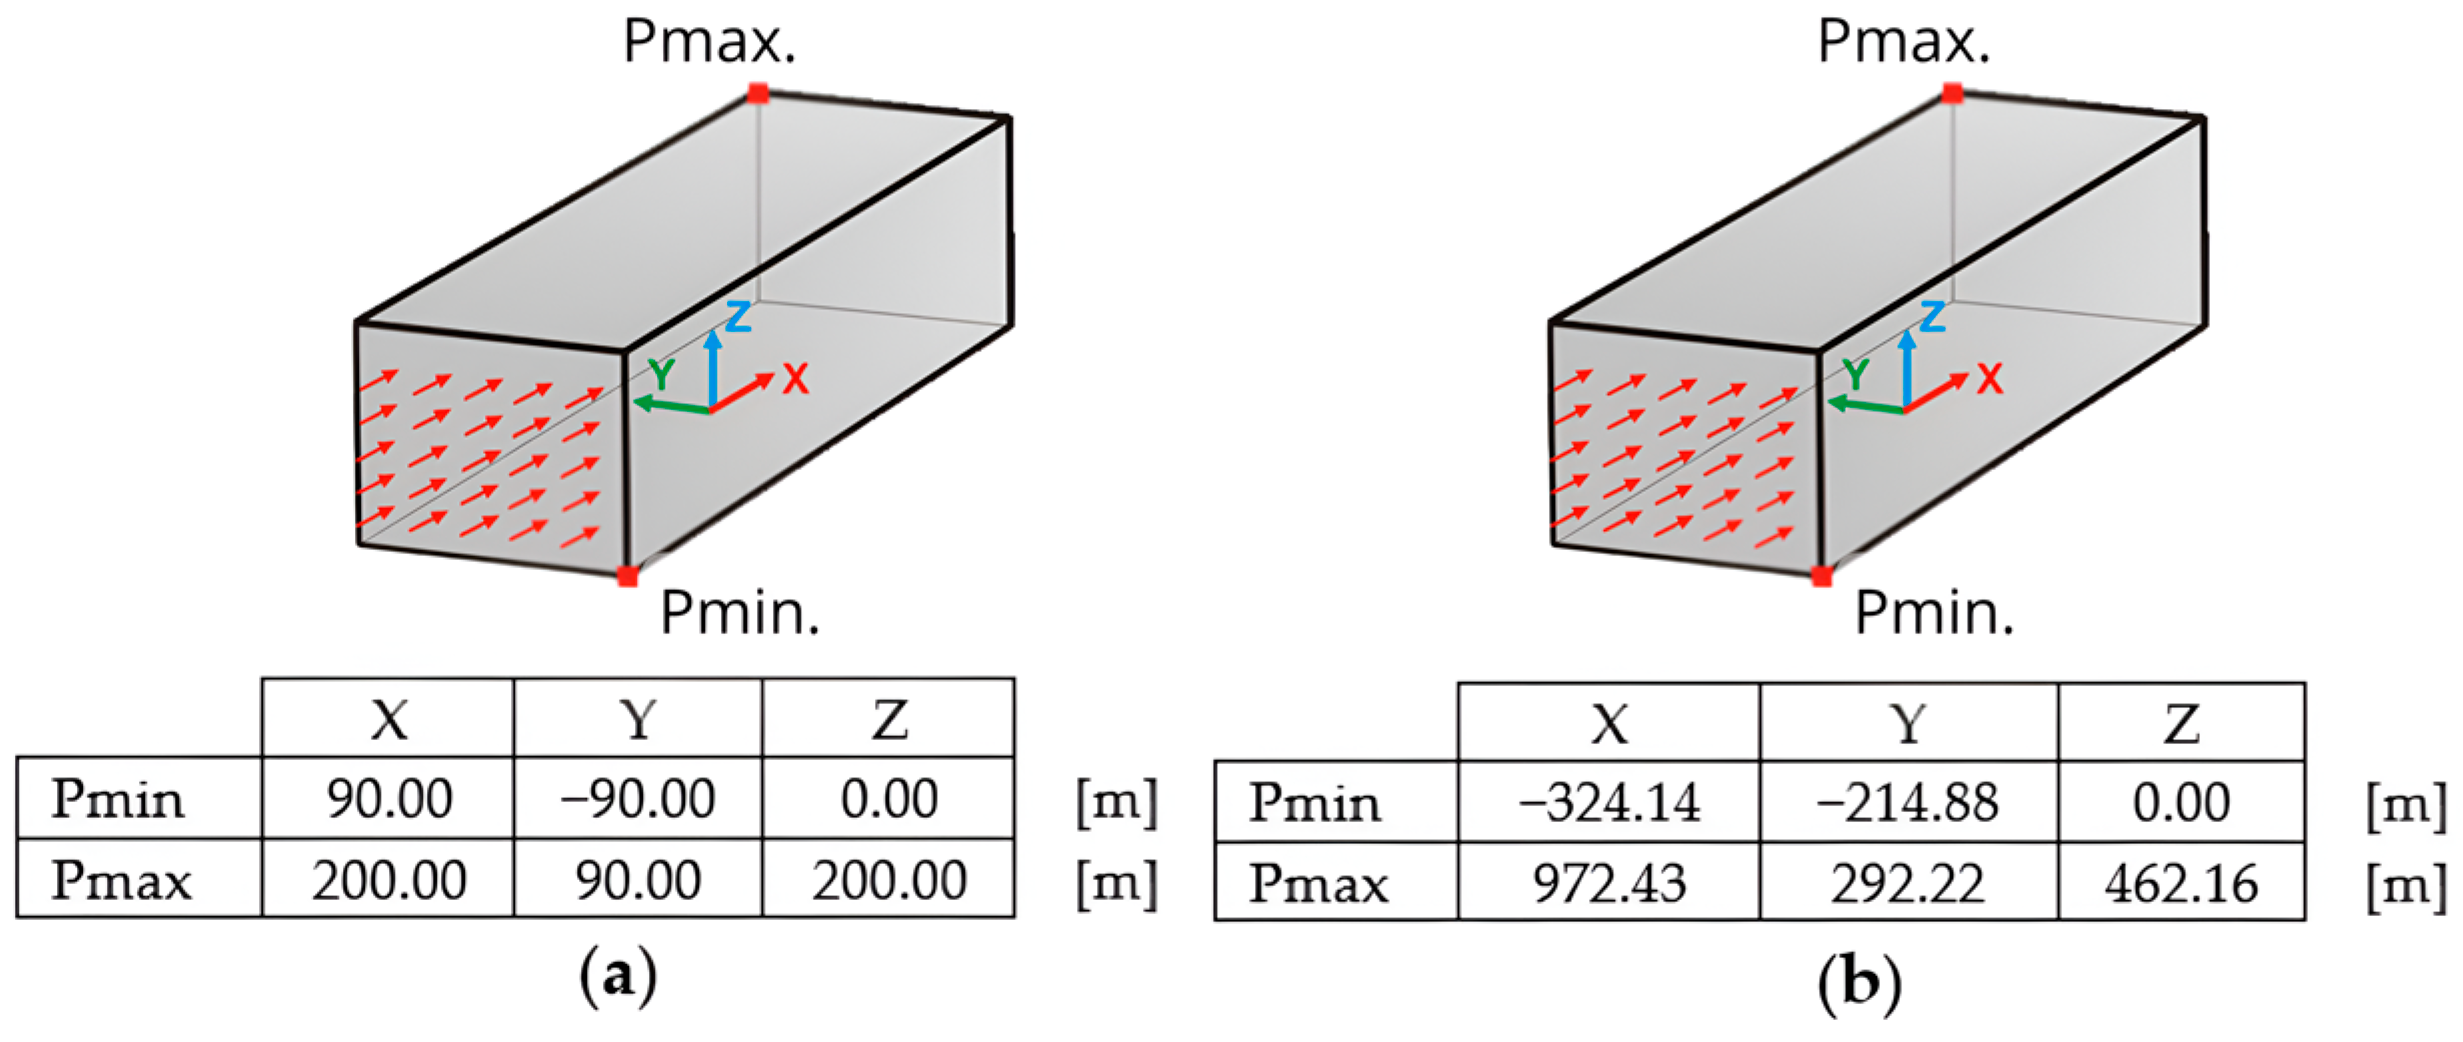
Dimensions of the virtual wind tunnels used in the simulations. (a) For towers 1 to 18. (b) For towers 19 to 21.
2.9. Computational Fluid Dynamic Simulation
RWind Simulation v.1.24, virtual wind tunnel software was used to analyze the aerodynamic behavior of the towers.
This software uses the Reynolds’s-averaged Navier–Stoke equations (RANS) method and provides two turbulence models: k-epsilon and k-omega. These models predict the turbulent energy flow from two transport equations. The k-epsilon model solves for turbulent kinetic energy (k) and its dissipation rate (ε). The k-omega model solves for turbulent kinetic energy (k) and its specific dissipation rate (ω), which involves the conversion of turbulence kinetic energy to turbulence internal thermal energy. The primary distinction between the two models lies in the way turbulent viscosity is understood across various region flows. The k-epsilon model tends to exhibit numerical instability near walls when viscosity effects are disregarded. In contrast, the k-omega model shows greater efficiency when replicating flow within the boundary layer. Consequently, selecting the k-omega model in the simulation proved beneficial due to its greater ability to manage flow separation.
As input data, the following parameters were selected: the model of the tower and its wind turbine, the air density at the height of the placement site, the turbulence intensity profiles (Figure 4), and the extreme wind scenario (Figure 5). The software considers the introduced model as a rigid body with no roughness. This allows adjusting the size of the wind tunnel according to the size of the object being tested. Figure 9 shows the dimensions of the wind tunnels used in the simulations.
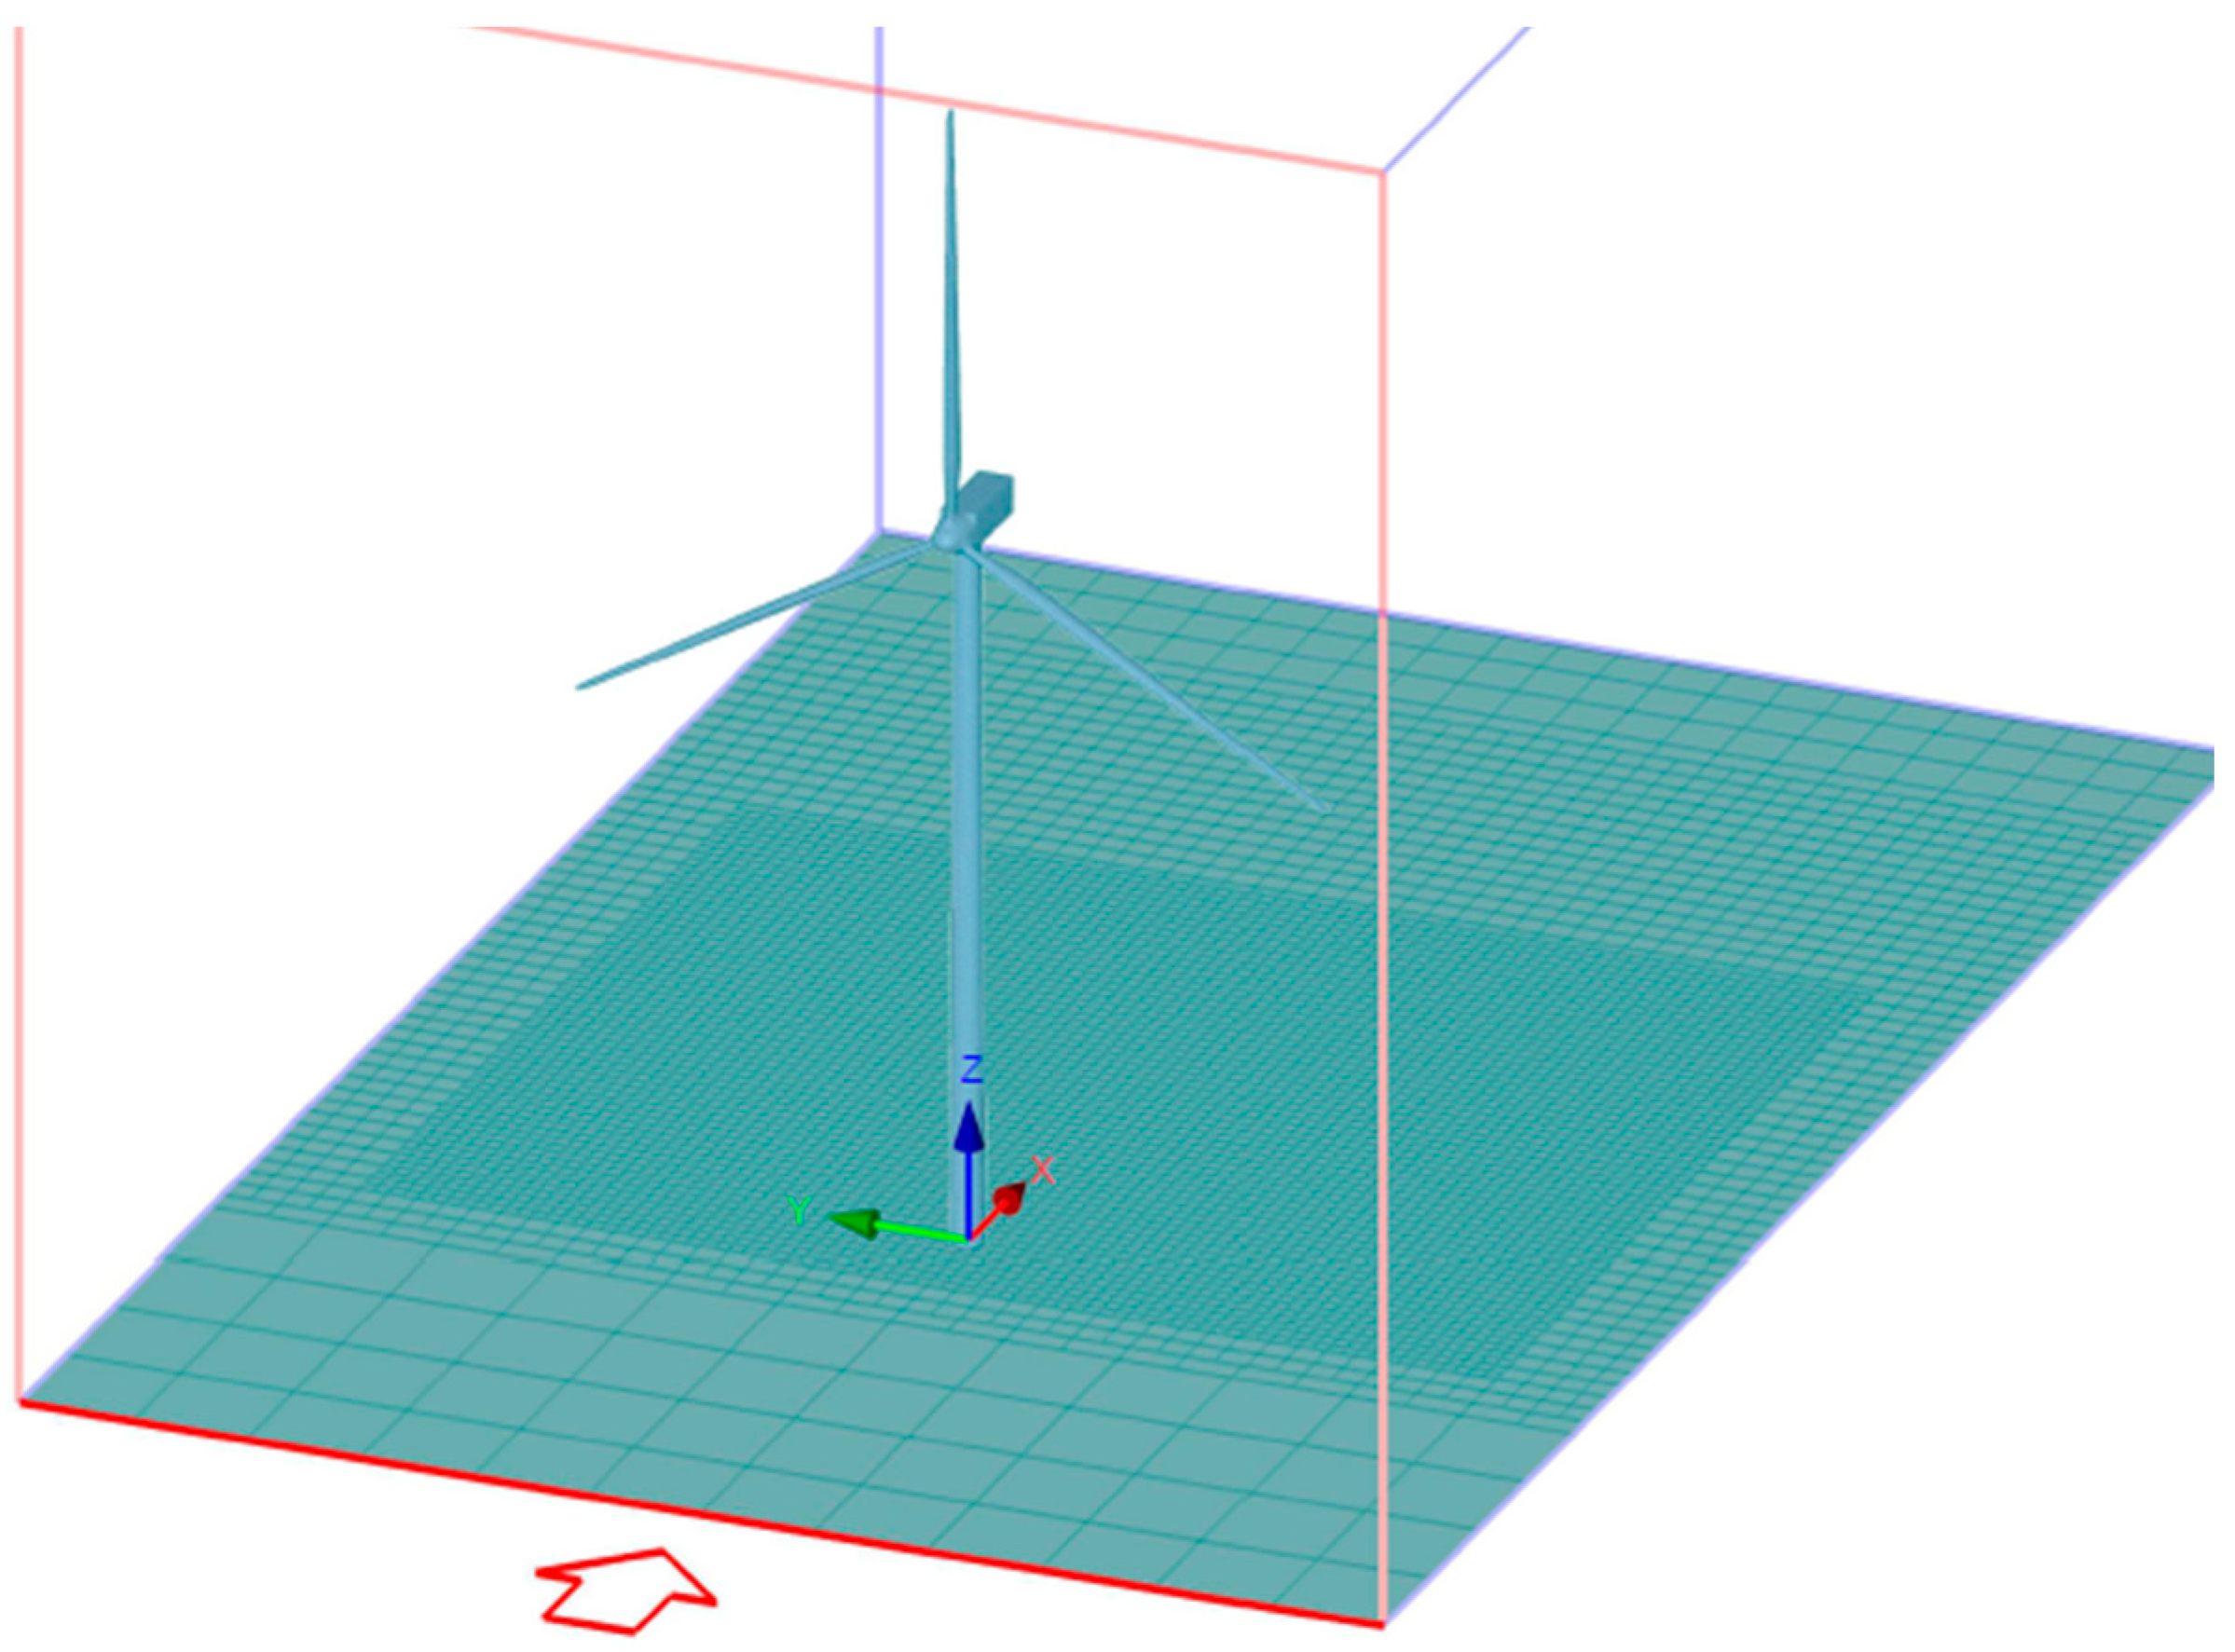
The program allows performing densification of the finite element mesh in the tunnel but cannot establish the region where the mesh needs to be refined. Thus, we used a mesh density default value of 20% to obtain good approximations without overloading the hardware. Figure 10 shows the finite element mesh of the wind tunnel used in the simulations for towers #1 to #18.
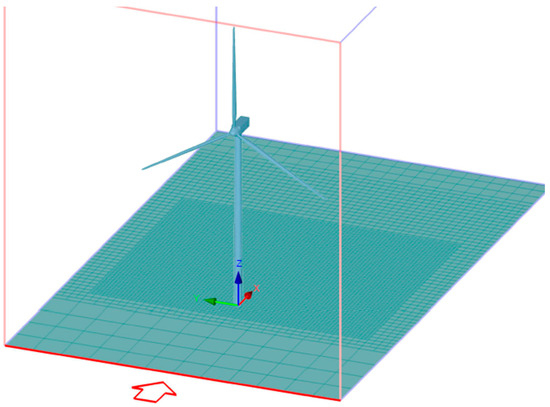
Figure 10.
Finite element mesh in the virtual wind tunnel.
From the CFD simulations, we obtained the values of the pressure coefficient on the tower, the velocity and pressure fields around it, and the parameter k of the k-omega model, which is indicative of the turbulent kinetic energy of the wake.
2.10. Structural Analysis
Once the wind tunnel simulation was carried out in RWind Simulation v.1.24, the resulting wind loads were transferred to the RFEM v.5.25.01 finite element software. This is where the tower models were entered according to the considerations made in 2.8 and the load cases analyzed in Section 2.7. A first-order calculation was carried out with a relative error of 0.01 and 500 iterations as a convergence criterion. For each tower, the stress and displacement fields were calculated. The RF-DYMAN Pro module of the RFEM v.5.25.01 program was used to find the vibration modes and natural frequencies of each tower.
3. Results
3.1. Computational Fluid Dynamics Simulation with RWind Simulation v.1.24
3.1.1. Velocity Fields
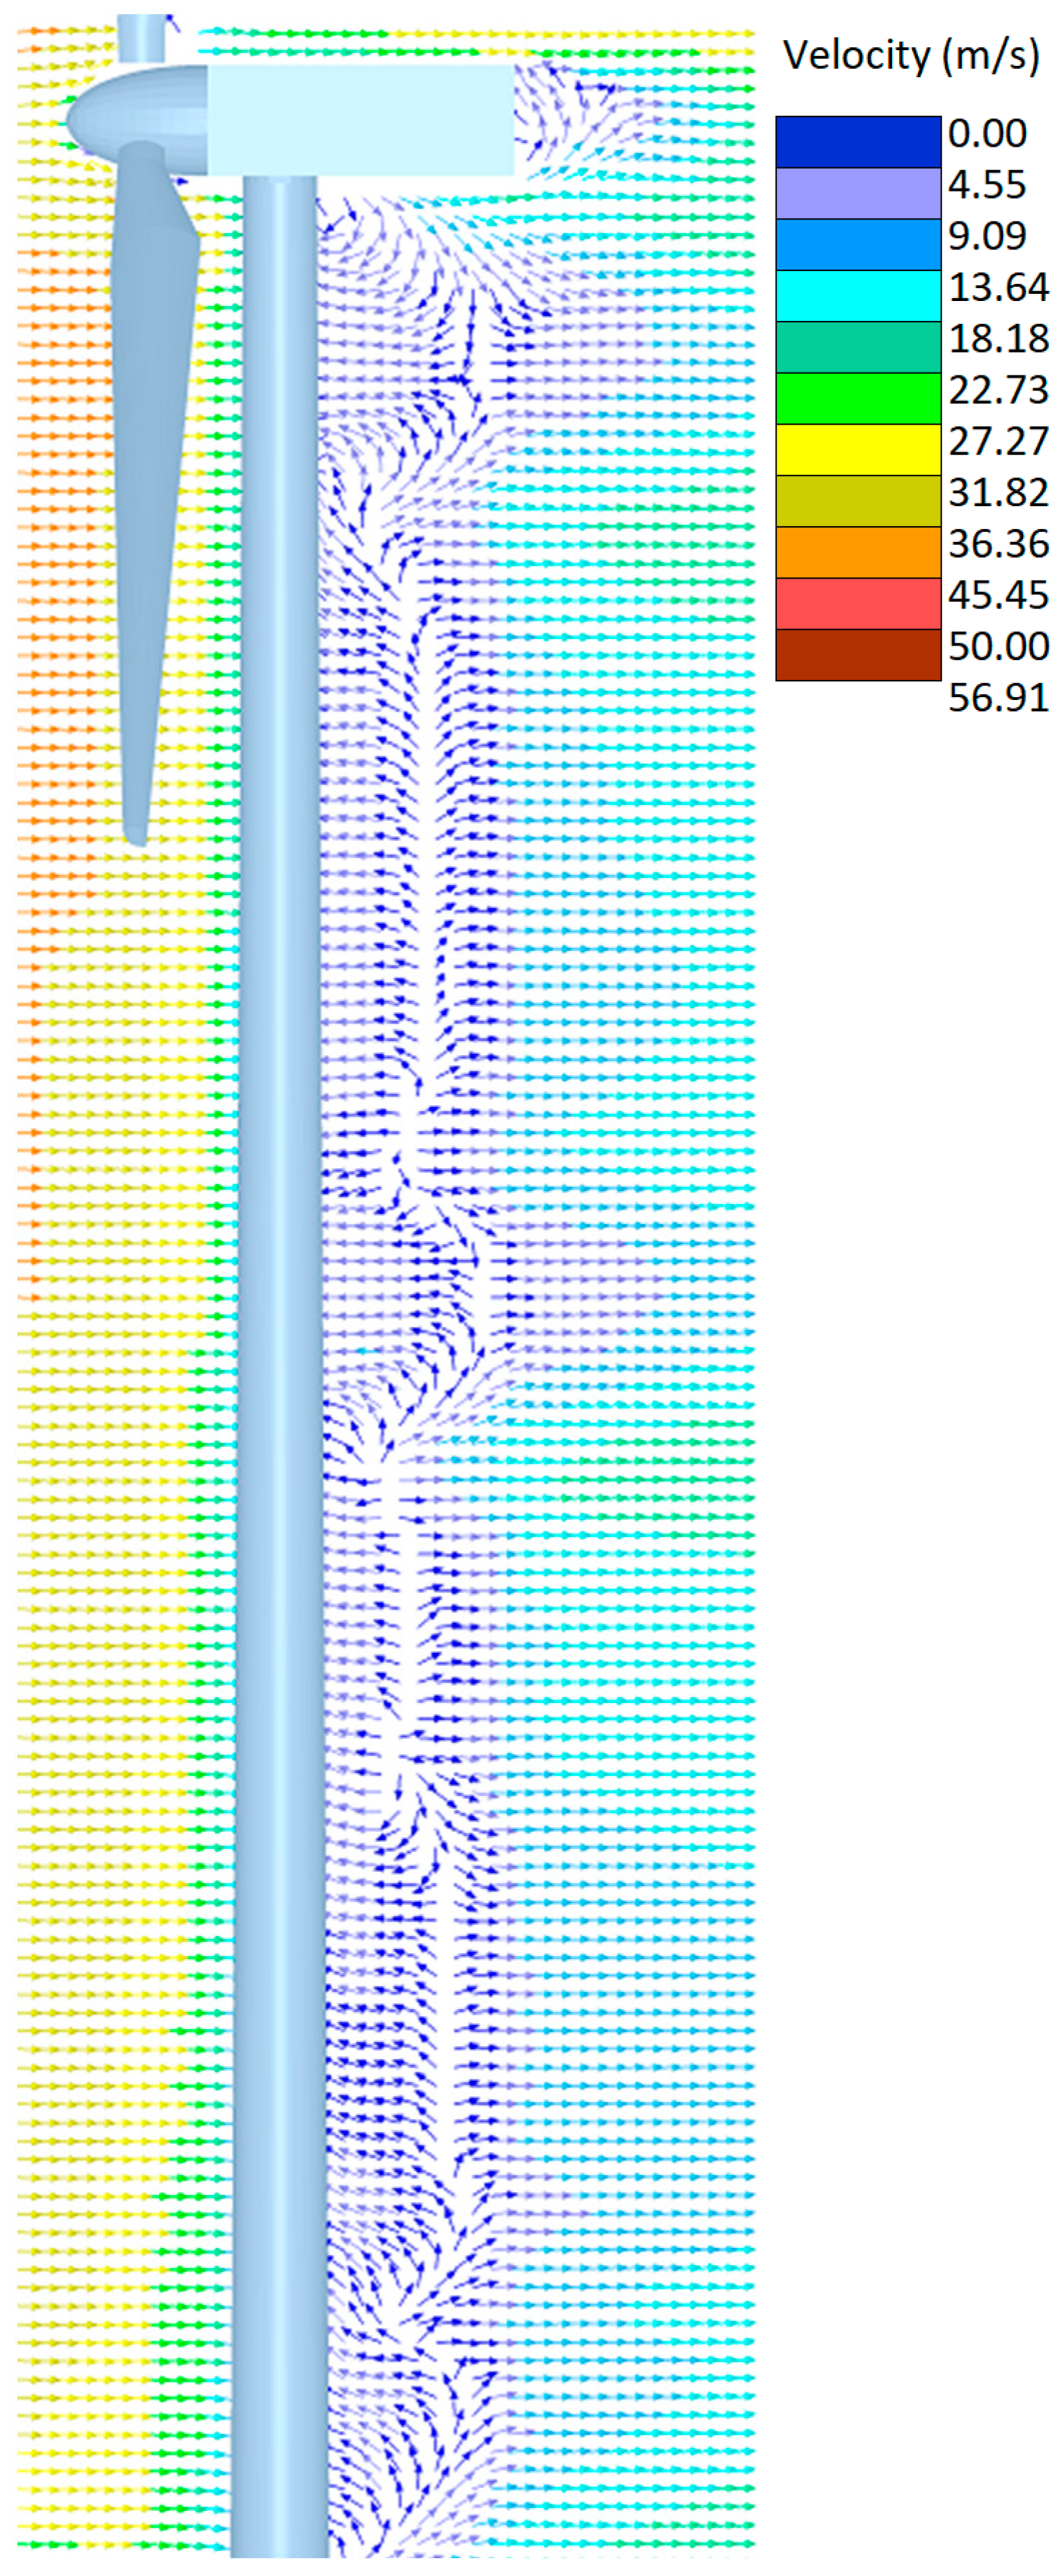
Figure 11 shows the velocity field in the vectorial form. To the lee of the tower, we observed that the velocity vectors vary their direction upwards and downwards throughout their height and, to an approximate extent, twice the lower diameter of the tower (8 m).
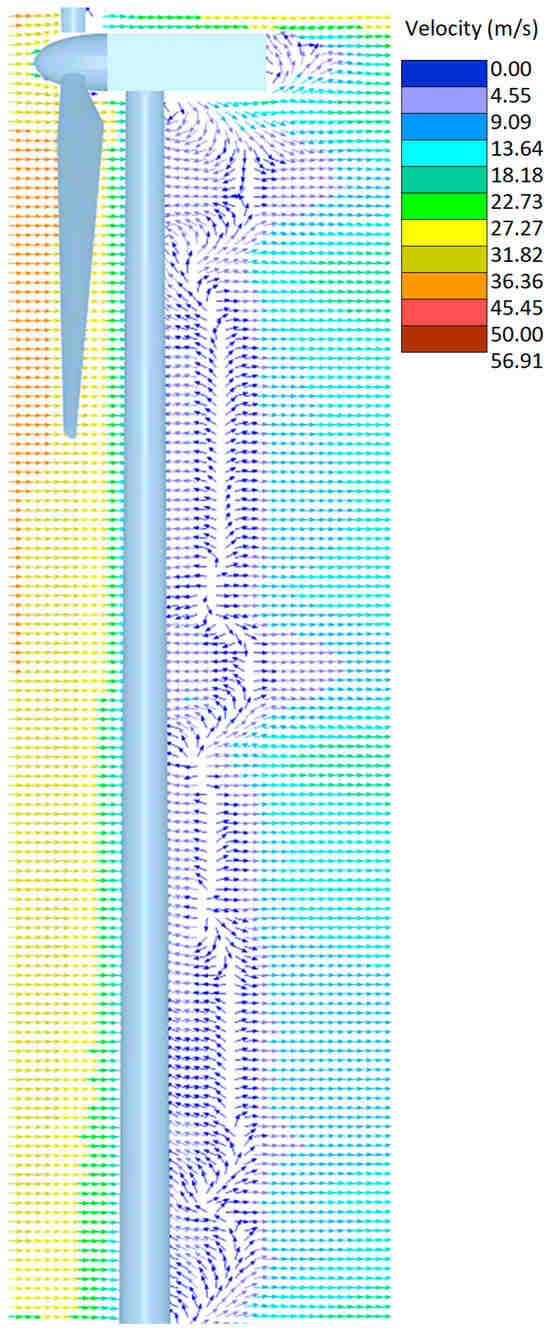
Figure 11.
Velocity field (m/s) for towers 1 to 18 (vectors).
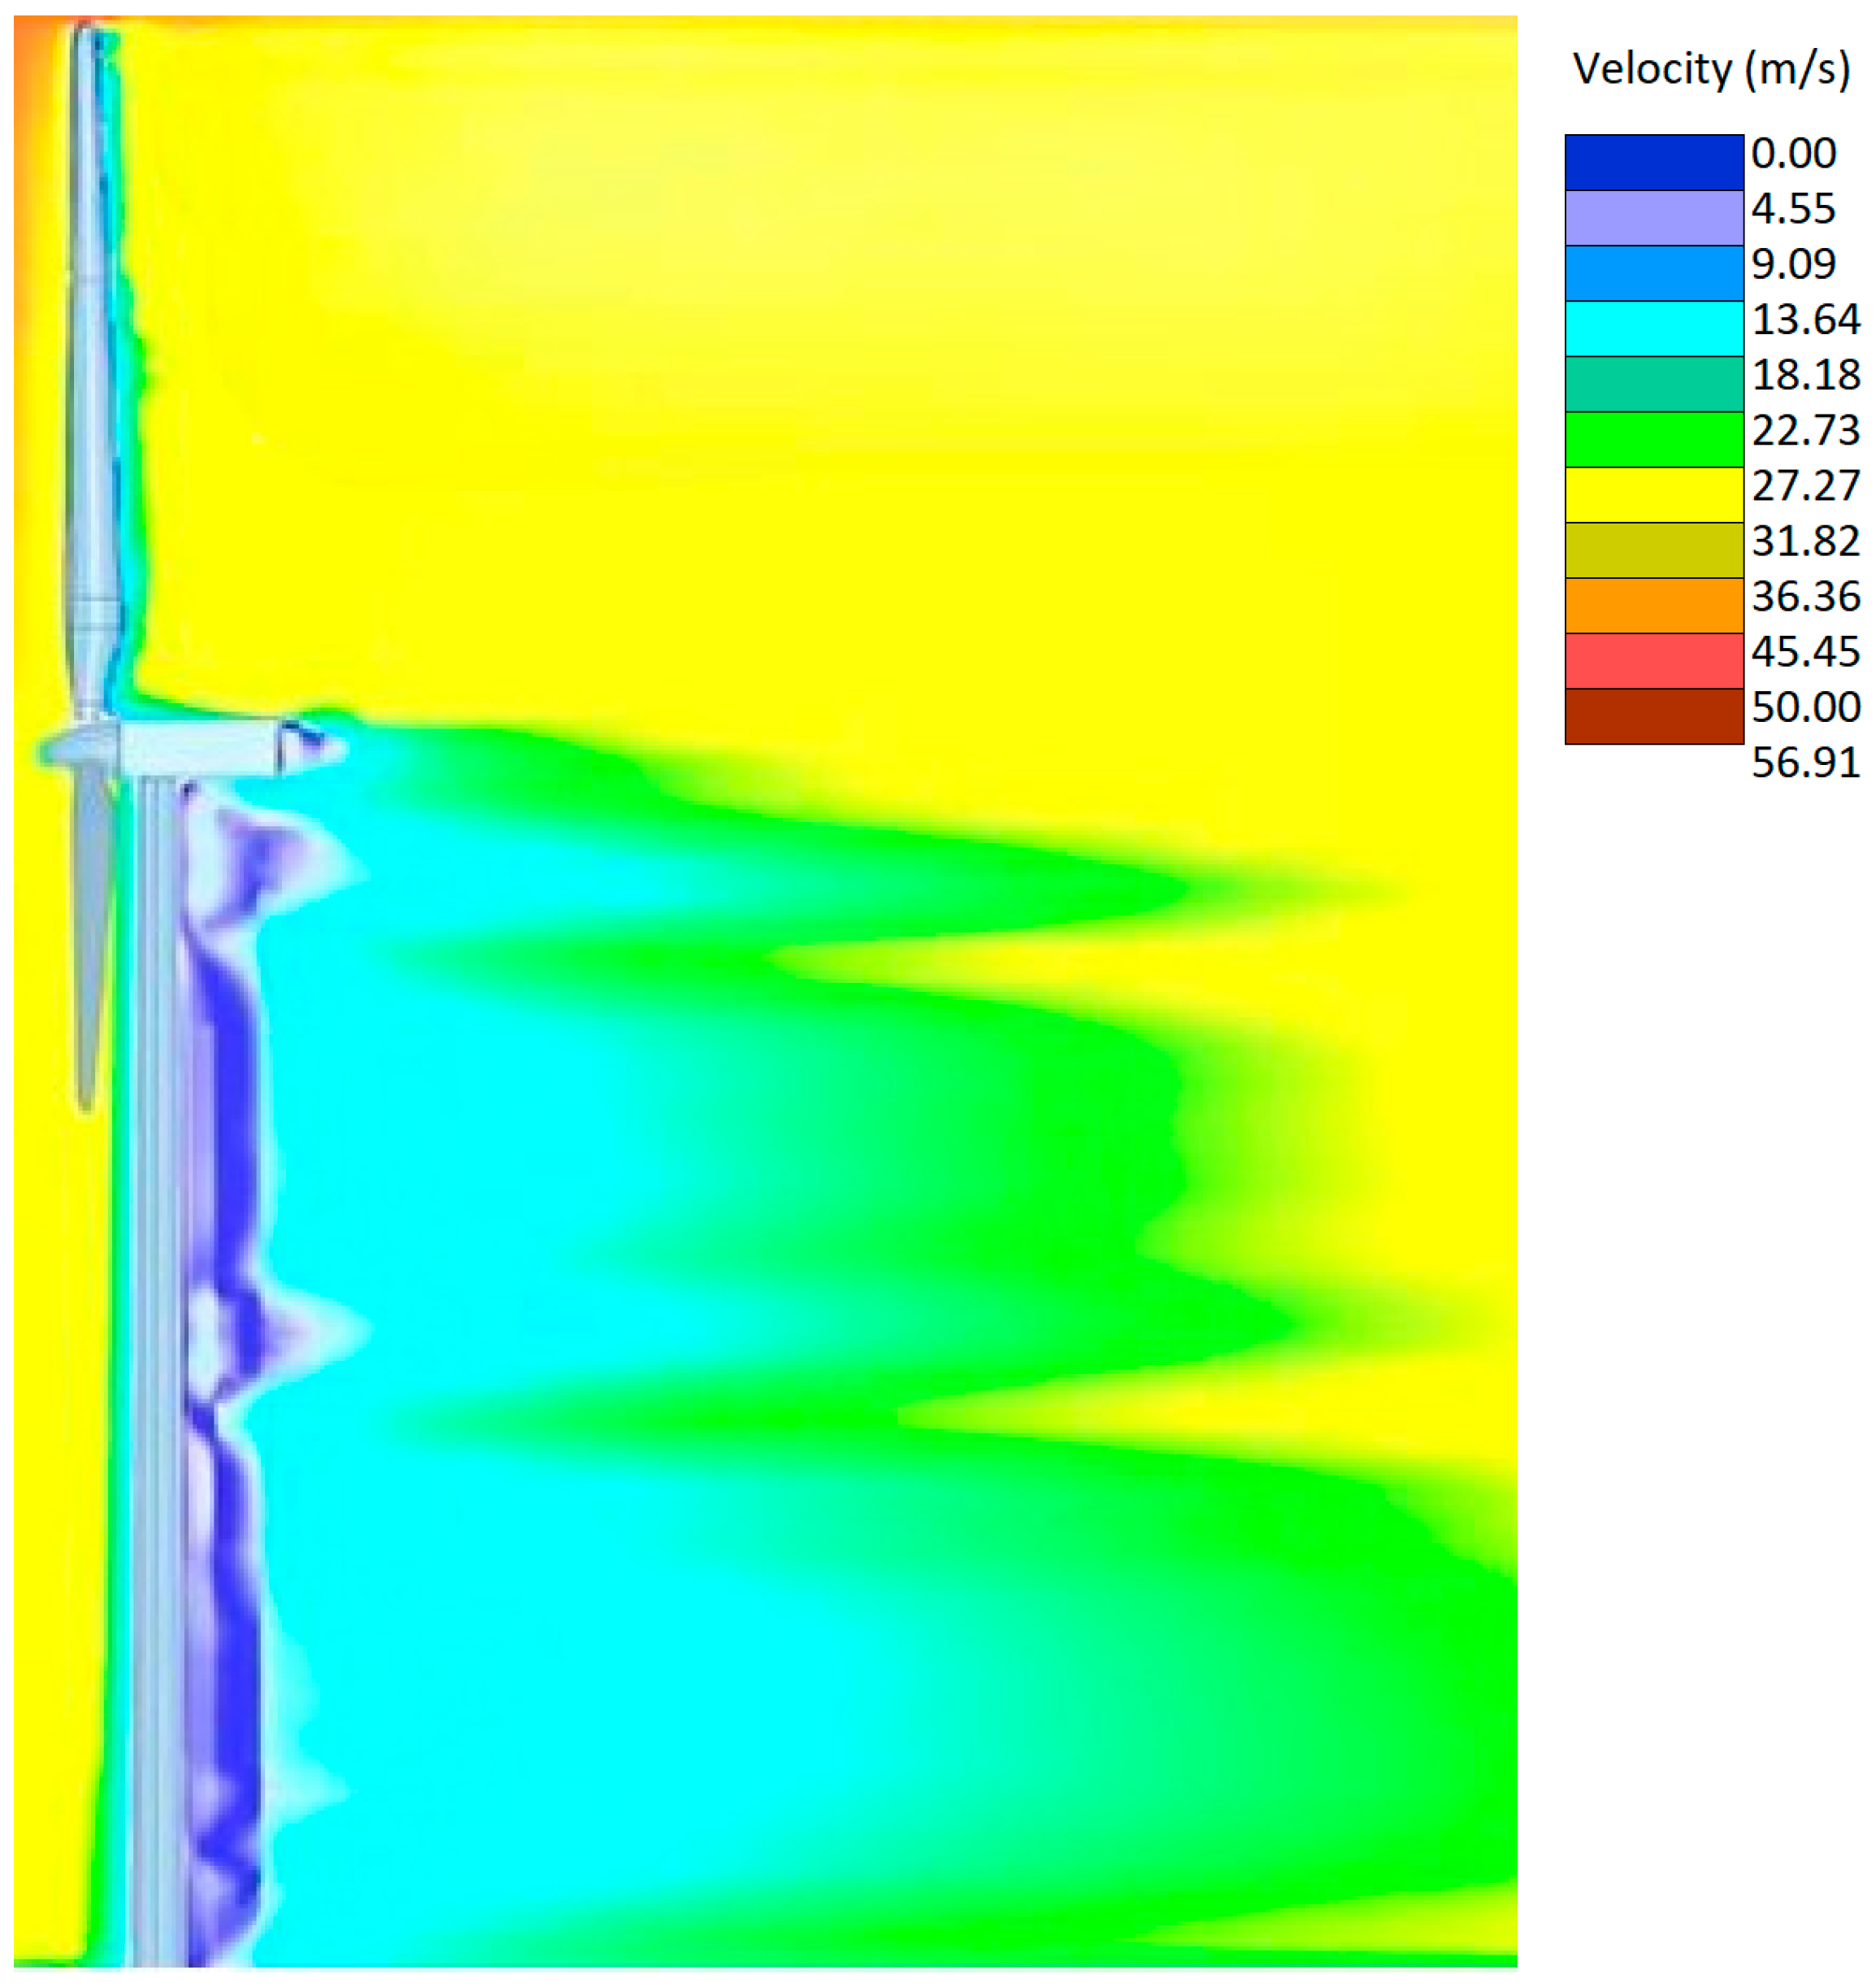
Figure 12 shows that the velocity field obtained for towers #1 to #18 remains the same because the software considers the model as a rigid object. It is possible to see that to the lee of the tower the wind speed decreases with height. This wind deceleration reflects the shape of a lee wake, whose length varies with the height of the tower. A visible wake was considered for a wind speed reduction below 30 m/s. With this criterion, the maximum length of the steel is approximately 115 m. Considering the lower external diameter of the tower of 4 m, the wake length is approximately 29 diameters.
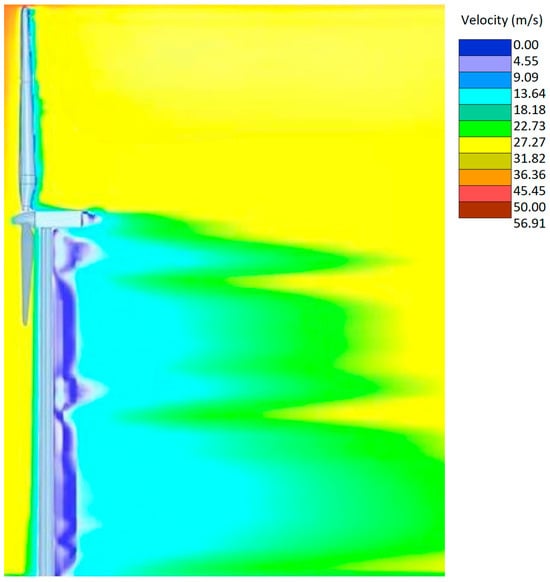
Figure 12.
Velocity Field (m/s) for towers 1 to 18.
Towers #19 to #21 generated different flow fields (Figure 13) according to their geometry. Greater velocities occurred on the sides of the triangular and cruciform towers rather than in the circular tower. The wakes differed in the distribution of the backwater zones and maximum speeds (Figure 14, Figure 15 and Figure 16).
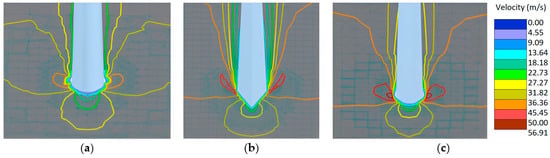
Figure 13.
Isotachs at the base of the towers. (a) Tower #19 (circular). (b) Tower #20 (triangular). (c) Tower #21 (cruciform).
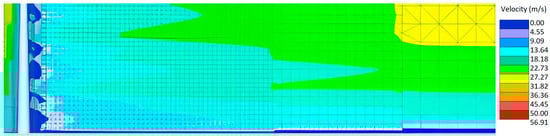
Figure 14.
Leeward velocity field at the concrete section of tower #19 (circular).
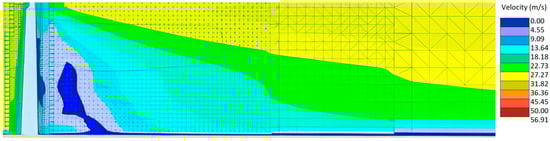
Figure 15.
Leeward velocity field at the concrete section of tower #20 (triangular).
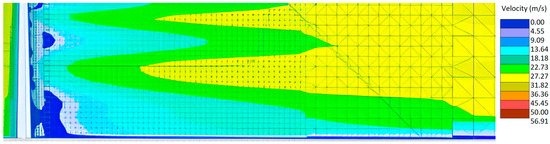
Figure 16.
Leeward velocity field at the concrete section of tower #20 (cruciform).
In the tower with a circular cross-section, backwater areas were observed next to the tower distributed throughout the height, extending in the wake for a length approximately equal to the tower’s average diameter.
In the cruciform tower, a backwater area was located in the center of the height, small and adjacent to the tower. Further down, another larger one formed, extending from the tower’s middle to the ground.
Behind the tower with a triangular cross-section, the flow velocity on the tower surface was zero throughout its height. Two recirculation zones appeared in the wake: a small one at the height of the last third, separated from the tower, and a larger one in the first third of the tower. The latter was similar to the backwater generated near the ground in the cruciform tower, but it extended to reach the tower instead of being detached.
The leeward velocity field was uniformly intense with height in the tower with a circular cross-section. Other typologies show a more pronounced velocity gradient at height and higher flow intensity.
3.1.2. Turbulent Kinetic Energy
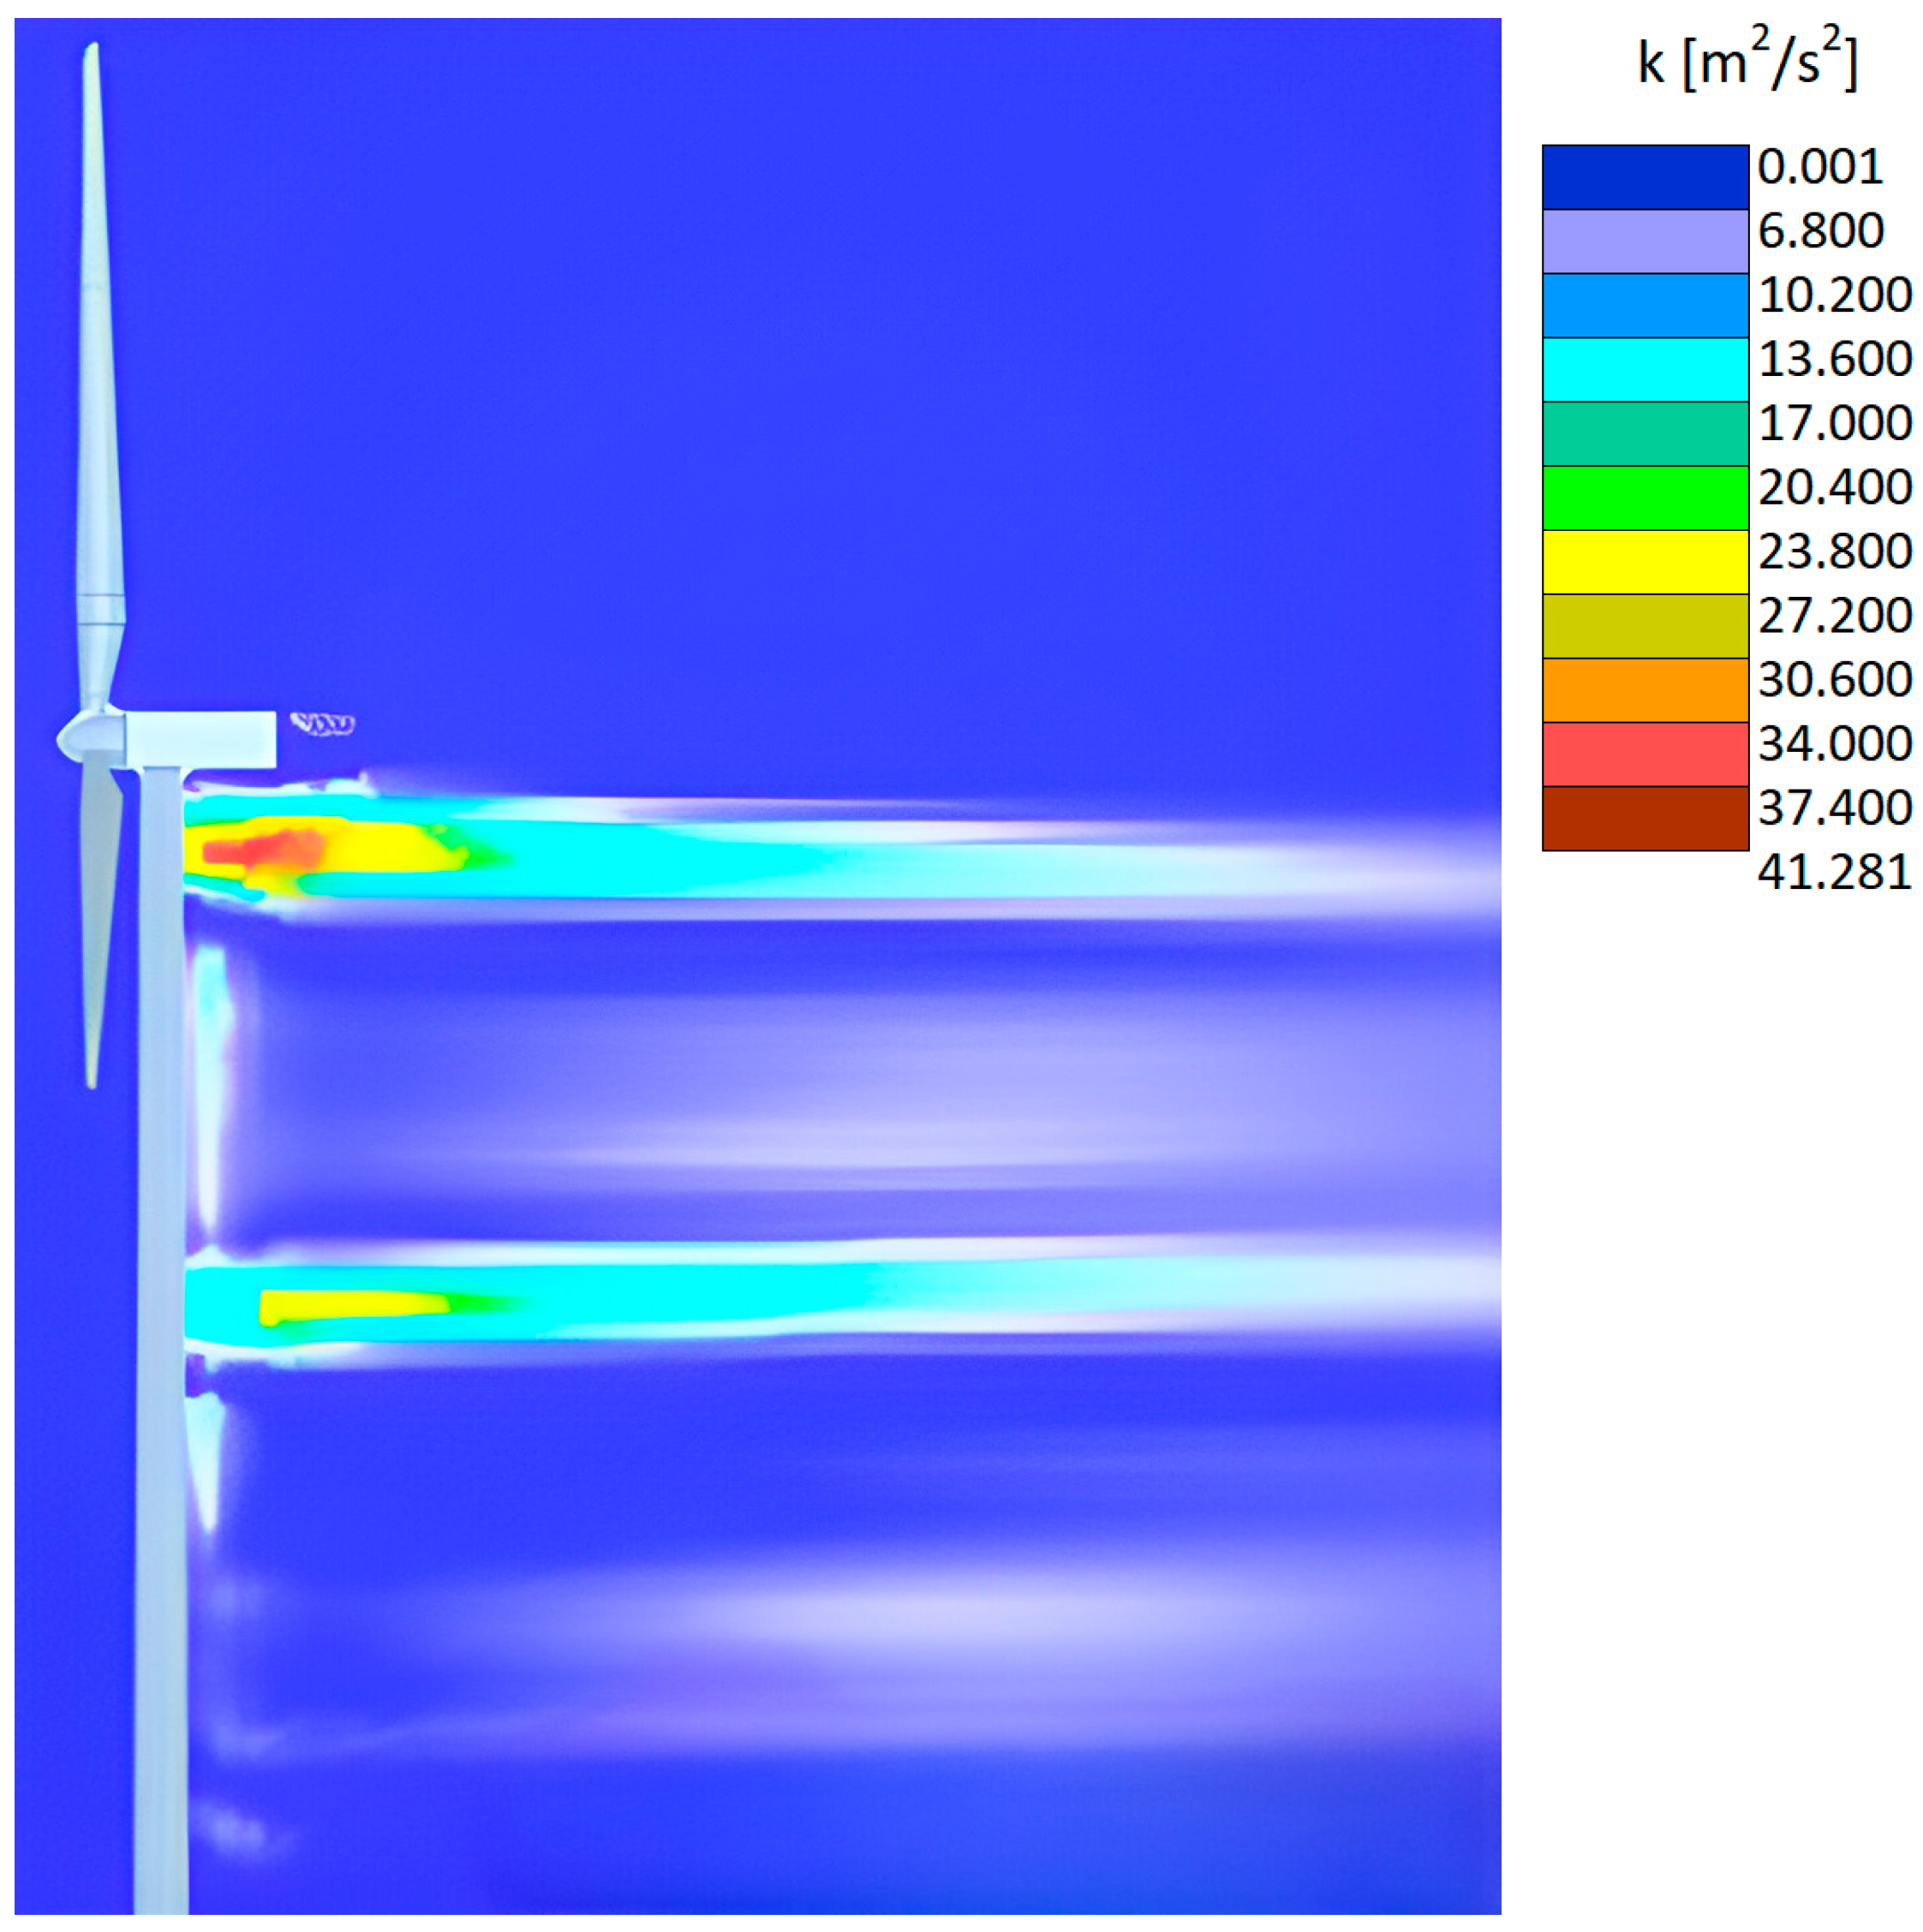
The k parameter of the k-omega turbulent model describes the behavior and distribution of turbulence within the generated wake. For towers #1 to #18, turbulence concentration in the middle of the tower and at the upper end is shown. Both turbulent zones have the same length. Figure 17, Figure 18, Figure 19 and Figure 20 show the k parameter fields for each tower.
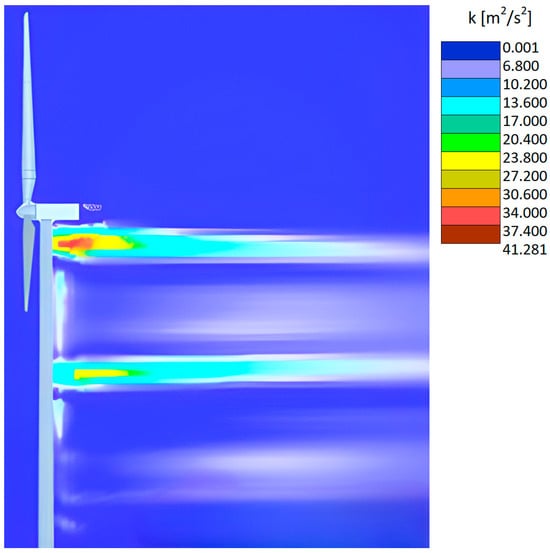
Figure 17.
k parameter for towers #1 to #18.
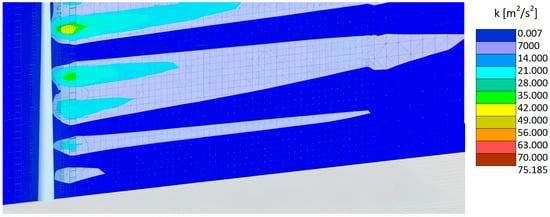
Figure 18.
k parameter for concrete section of tower #19 (circular).
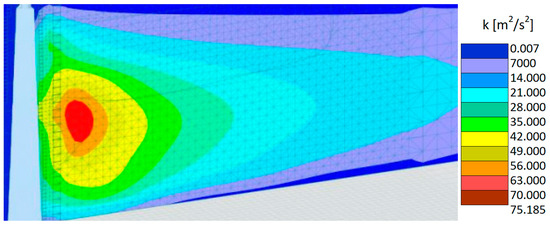
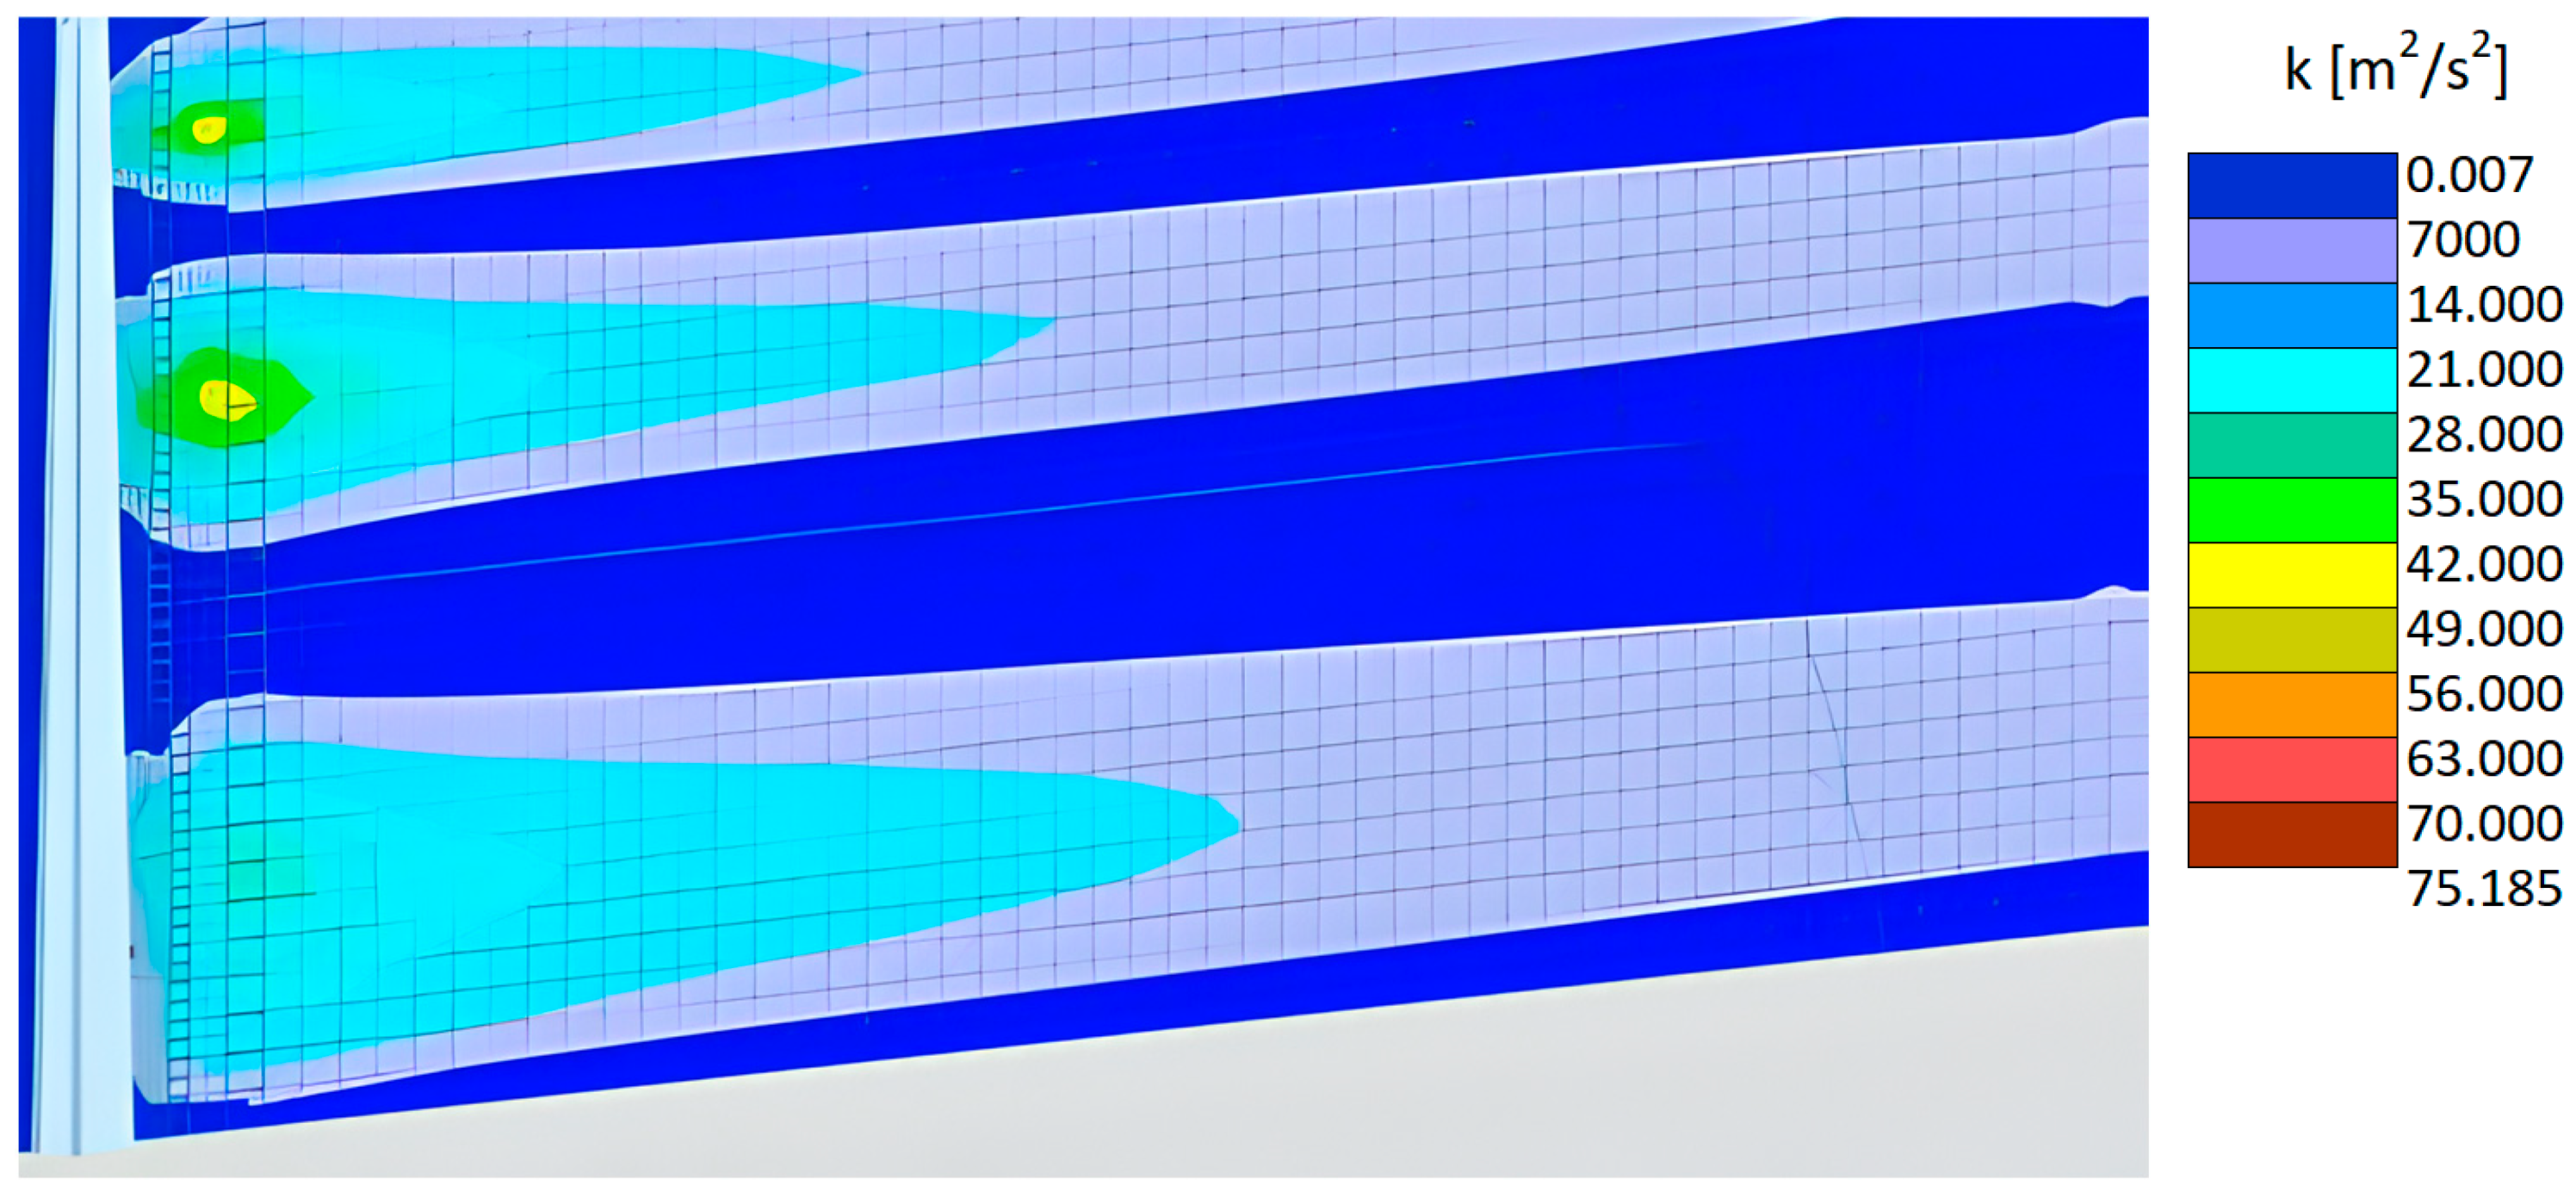
Figure 19.
k parameter for concrete section of tower #20 (triangular).
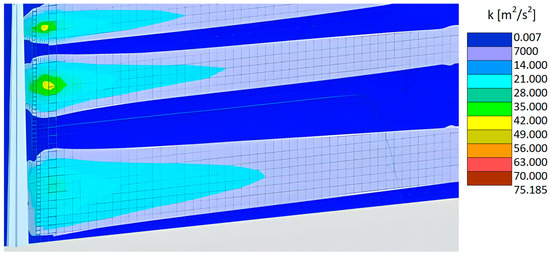
Figure 20.
k parameter for the concrete section of tower #21 (cruciform).
In the concrete sections of the compared hybrid towers, it can be seen that the triangular-sectioned tower had a high concentration of turbulence leeward after a third of its length. The cross-shaped tower shows less concentration in several places, which makes it look more localized. The circular section tower features progressive turbulence growth throughout the entire tower, with low intensities highly similar to the ones on the cross-section.
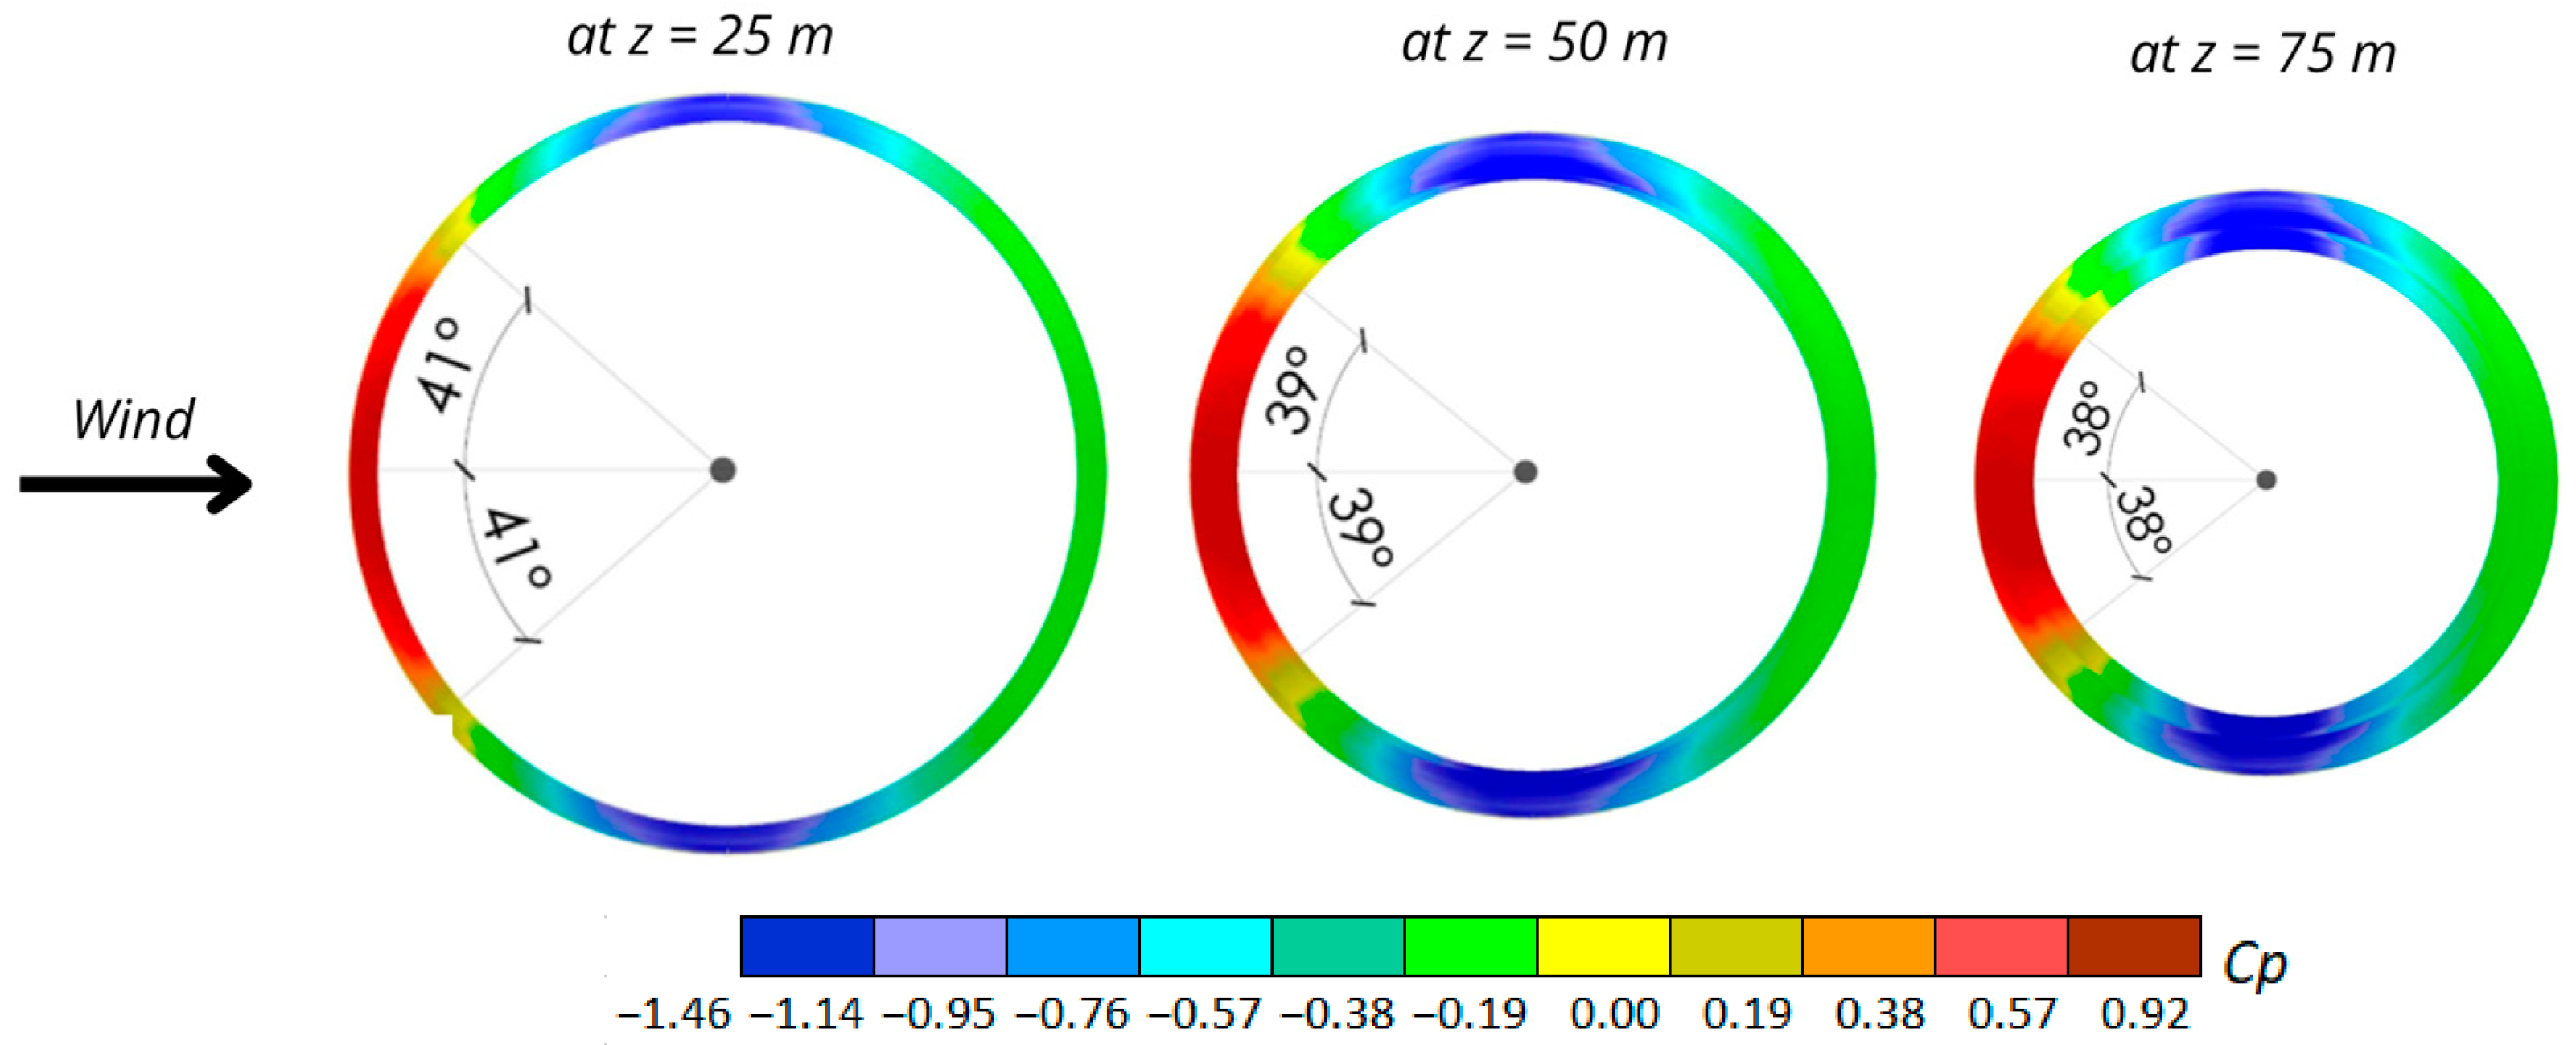
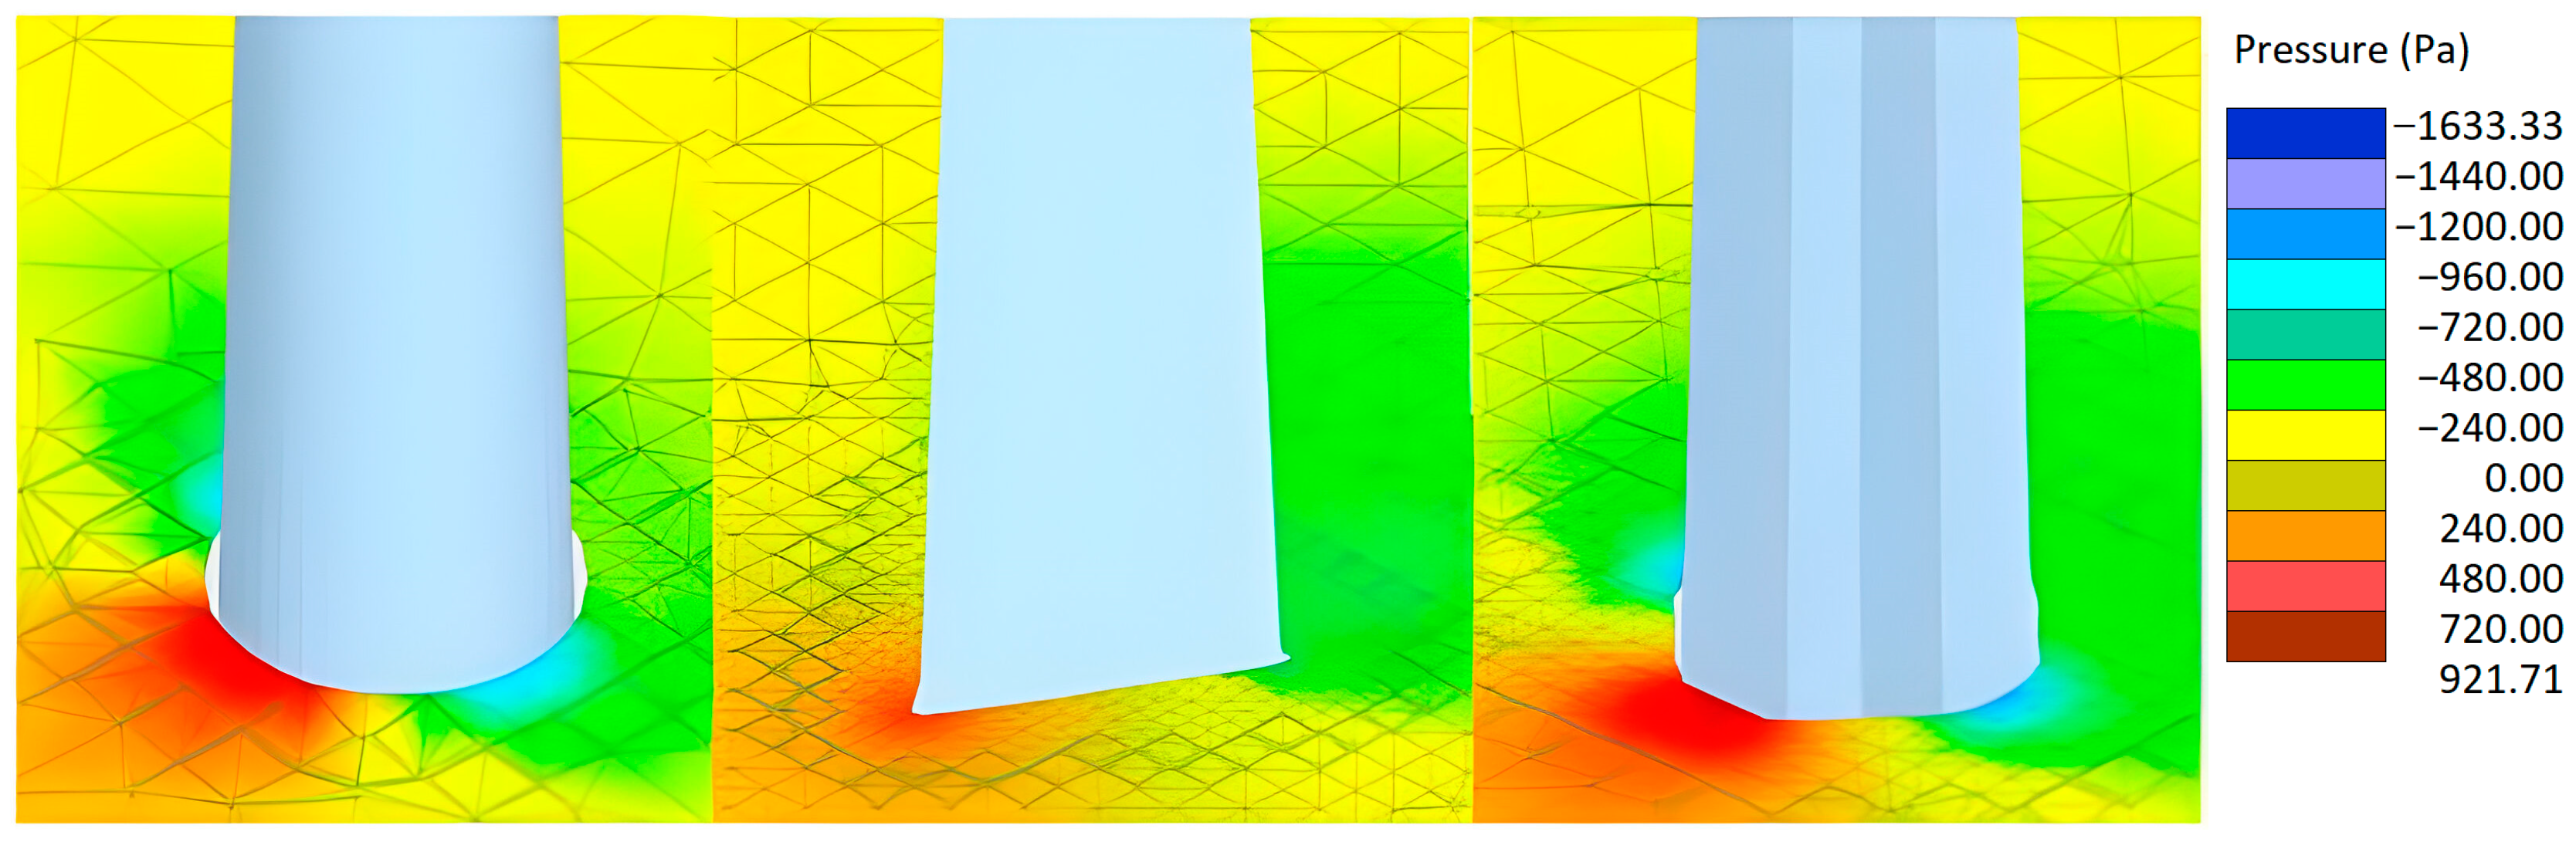
3.1.3. Pressure Coefficients and Pressure Field on the Tower
RWind Simulation v.1.24, shows the pressure coefficients and the pressure field obtained for each tower. These results allow the towers to be loaded with real wind data at the placement site in the structural analysis stage. Figure 21 indicates the pressure coefficient for towers #1 to #28. Figure 22 shows its variation in the perimeter of the tower at different heights, indicating the angular distribution of the areas with positive and negative pressure (suction). Figure 23 shows the pressure field at the base of towers #19 to #21.

Figure 21.
Pressure coefficient for towers #1 to #18.
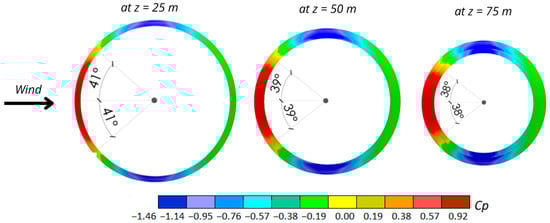
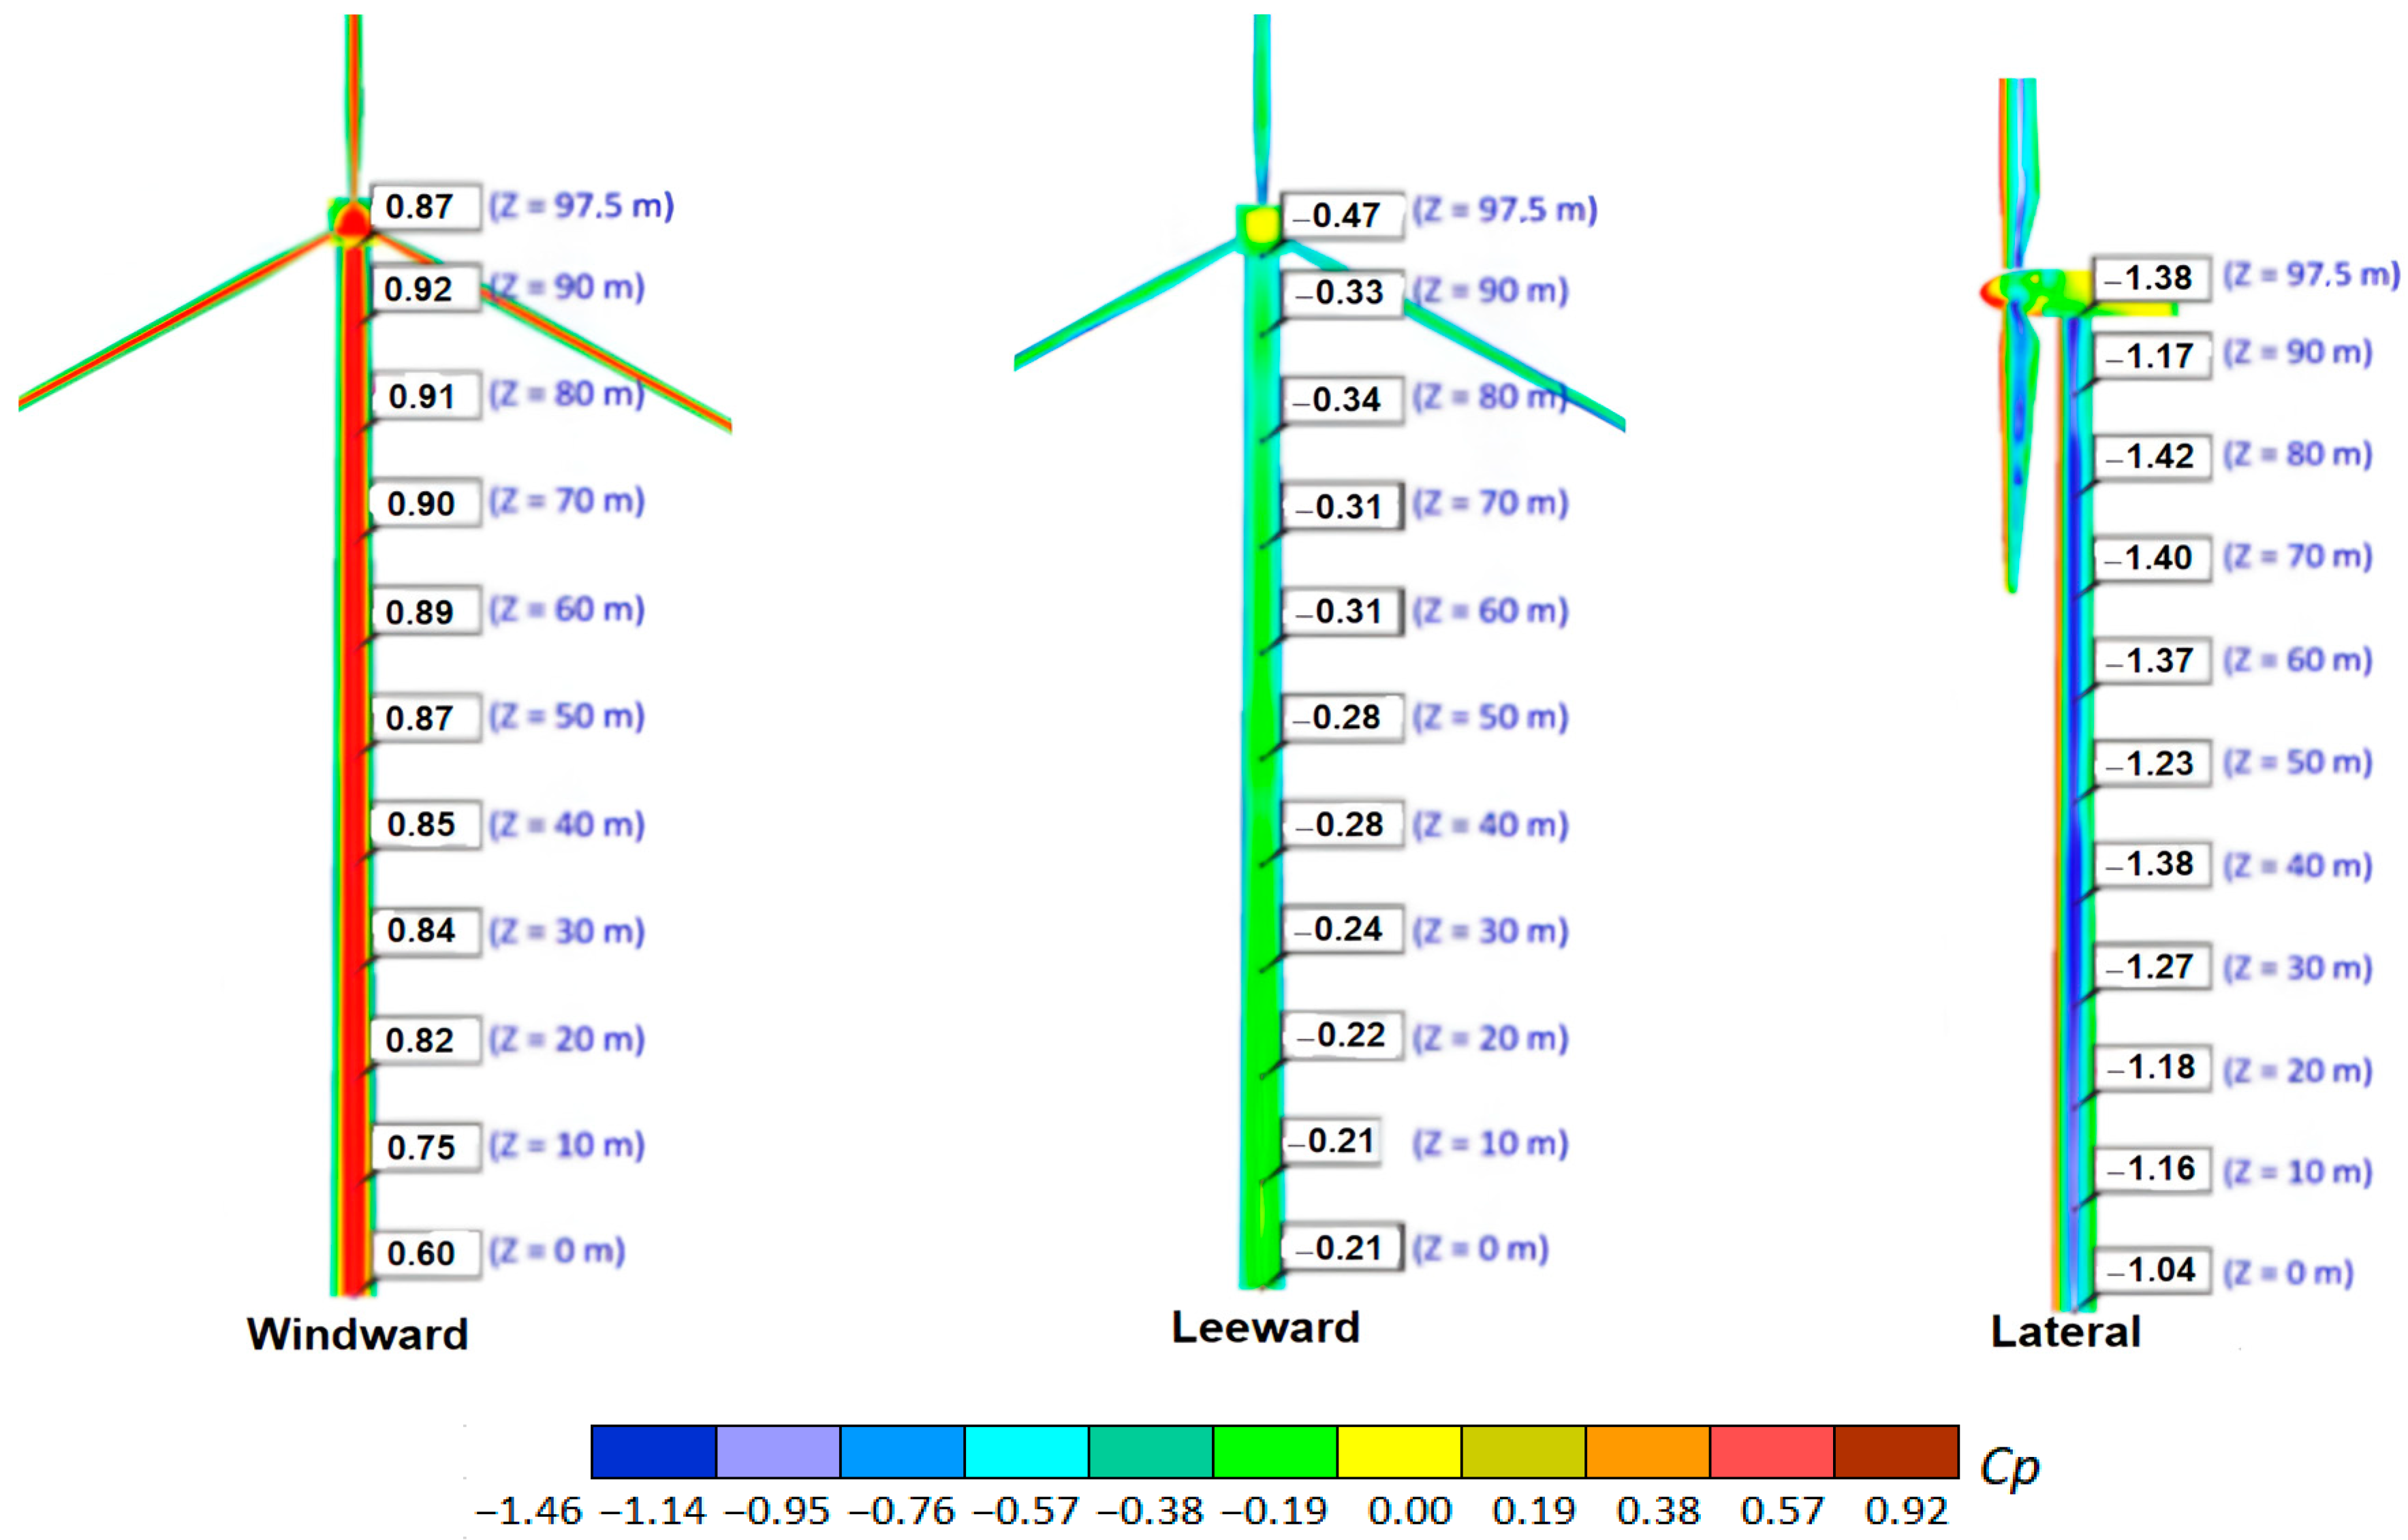
Figure 22.
Distribution of the pressure coefficient on the surface of towers #1 to #18 at different heights.
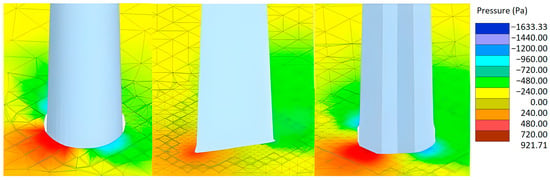
Figure 23.
Pressure field at the base of towers #19 a #21.
3.2. Structural Calculation with RFEM v.5.25.01
When calculating the structures with the load cases established in 2.7, it was found that load case 1 (1.35 × PP + 1.35W, where PP: self-weight and W: extreme wind) is more unfavorable. The results presented correspond to this load case.
3.2.1. Displacement Field
The maximum horizontal displacements occur at the upper end of the towers.
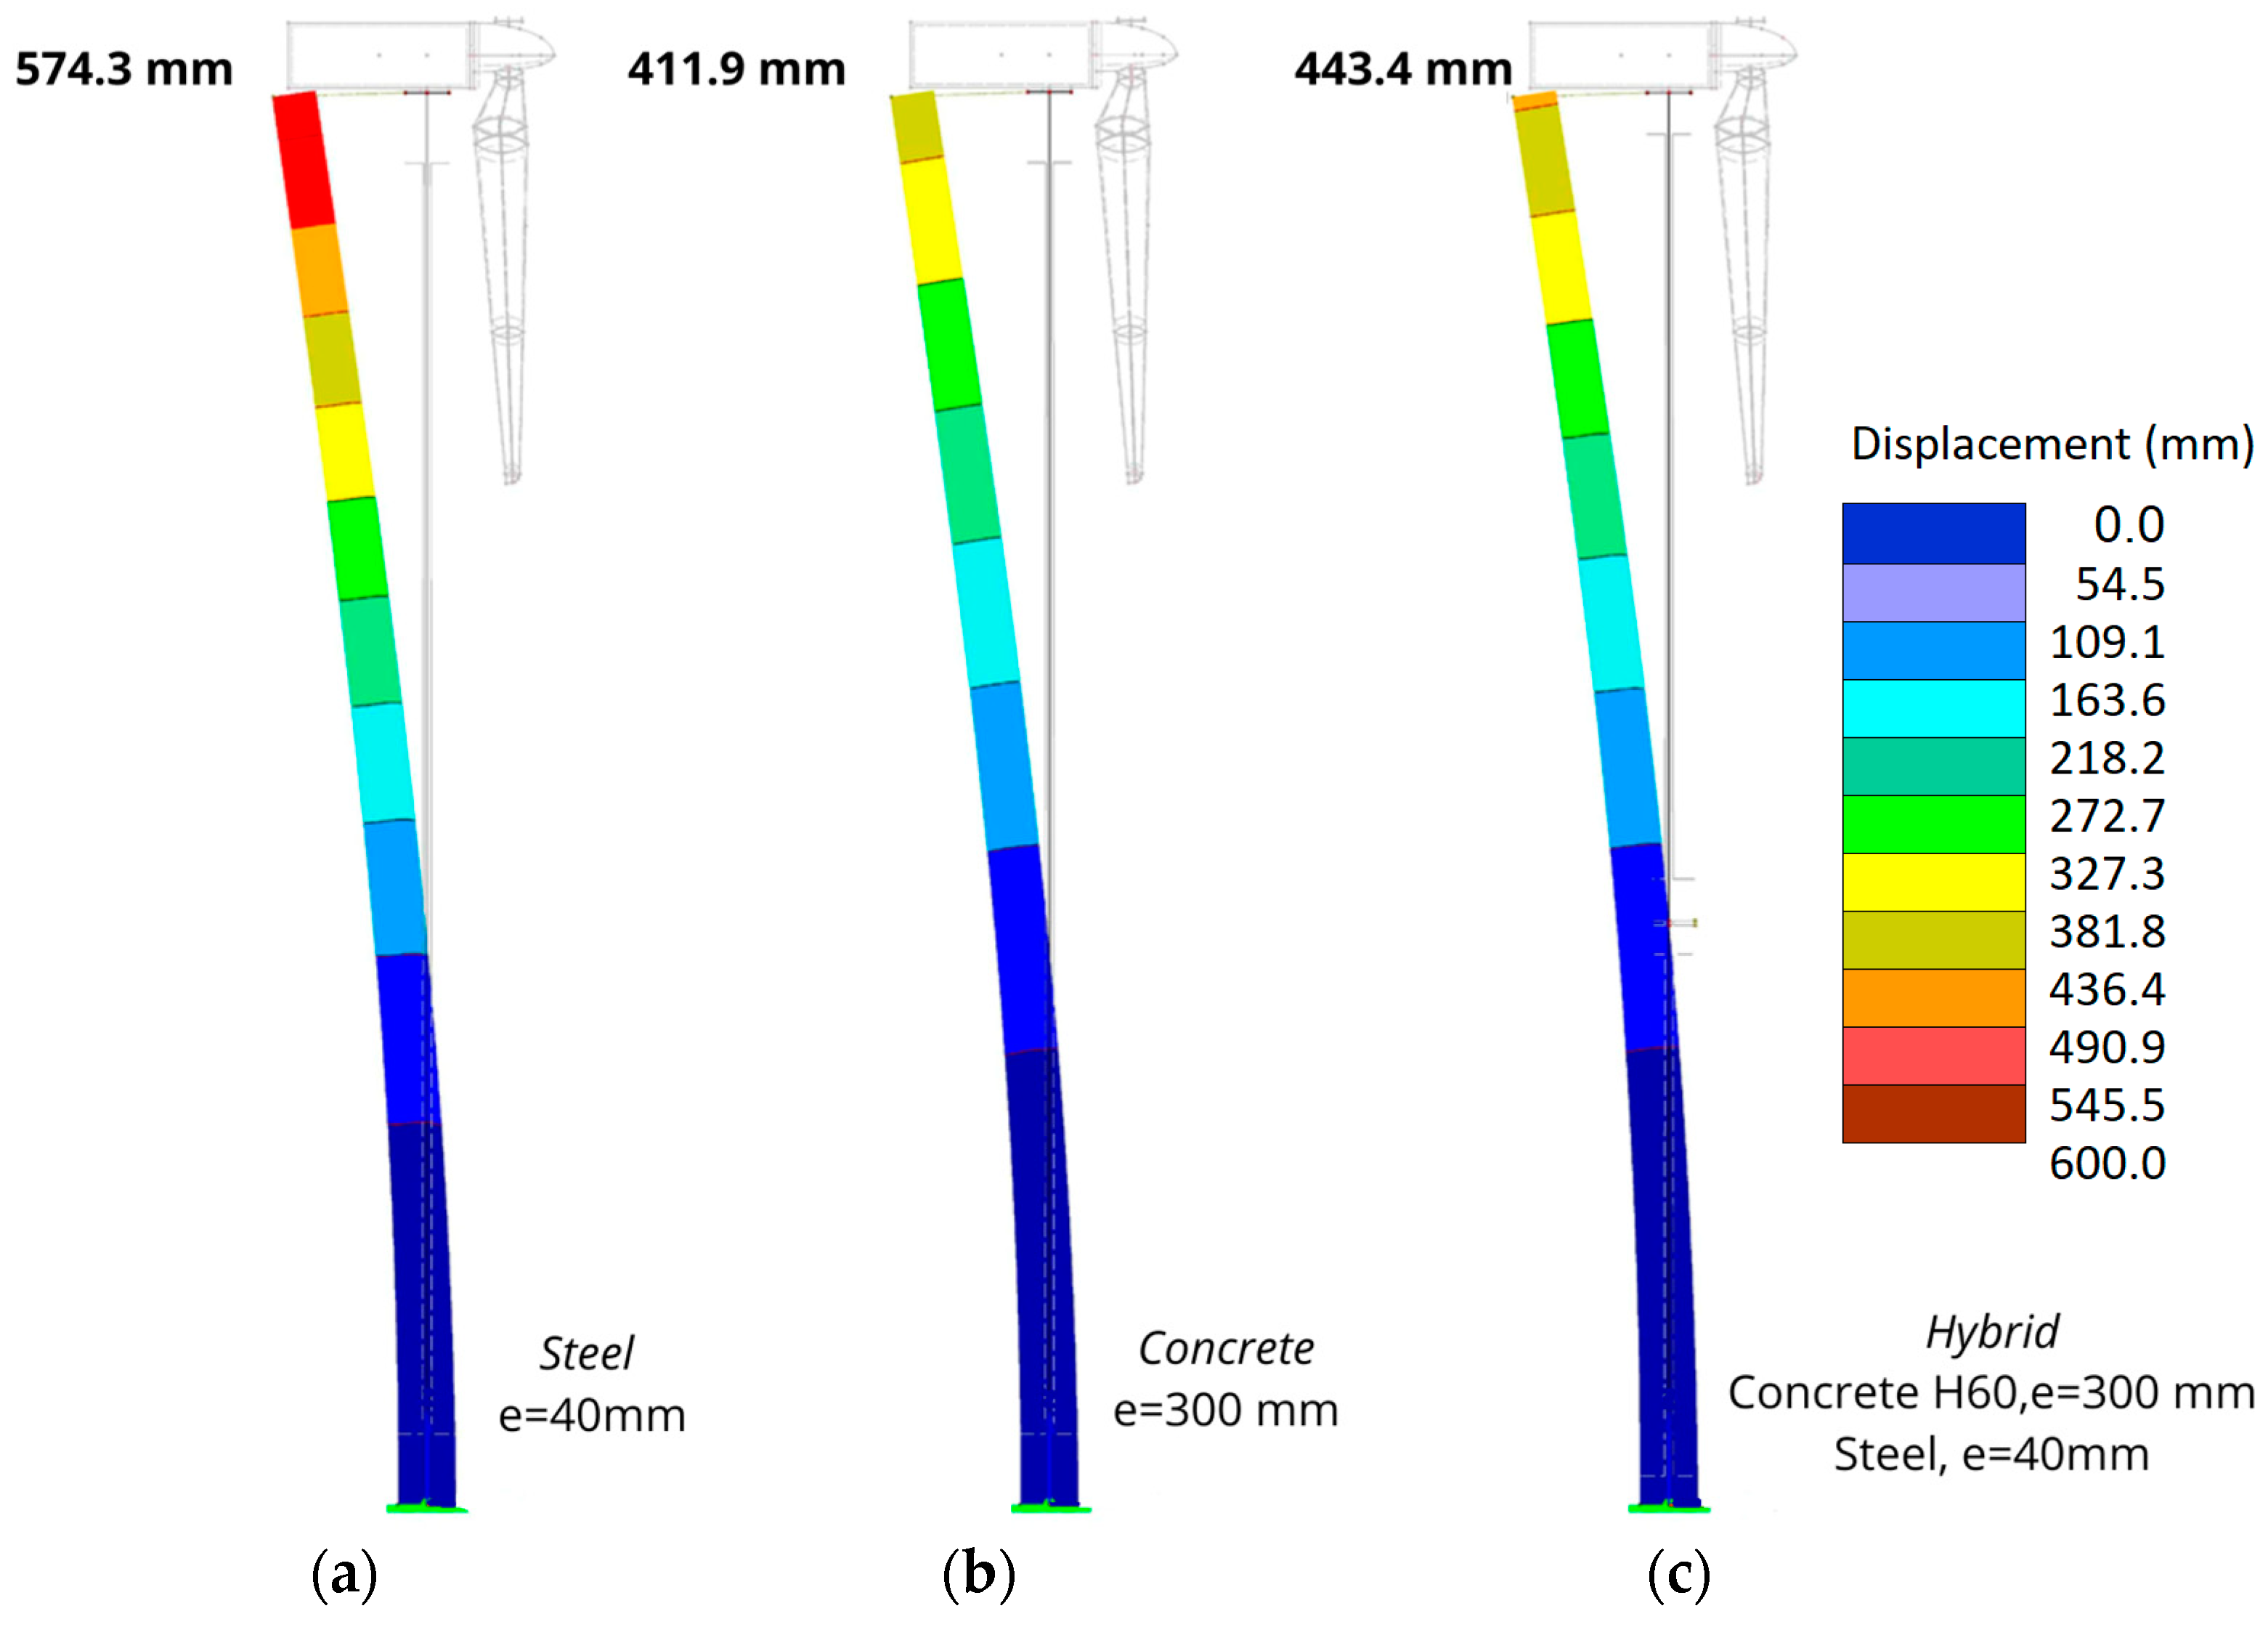
Table 4 shows the displacements obtained for towers #1 to #18. Their percentage value concerning the total length of the tower is also indicated. It was observed that in the case of steel towers, smaller displacements are obtained in tower #3 (thickness = 40 mm). For concrete towers, tower #9 (H60 concrete, thickness = 300 mm) present the best performance. In the case of hybrid towers, the smallest displacement is obtained in tower #18 (H60 concrete, steel thickness = 40 mm, concrete thickness 300 mm). Figure 24 shows the displacement field for each of these towers.
Table 4.
Maximum horizontal displacements for towers #1 to #18 and percentage of displacement concerning the total length of the tower.
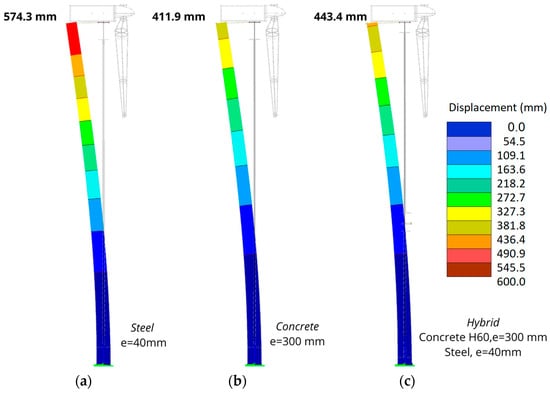
Figure 24.
Displacement field. (a) Tower 3. (b) Tower 9. (c) Tower 18.
For the analysis of hybrid towers with different cross sections, the results obtained are shown in Table 5. The table indicates the maximum displacement values for the steel and concrete tower sections and their ratio according to the length of the section. Figure 25 shows the displacement fields. For greater clarity, only the lower section of the tower is represented in the image. The upper section of steel is the same in all three cases.
Table 5.
Maximum horizontal displacements in the concrete and steel sections of towers #19 to #21 and percentage of displacement concerning the length of each section.
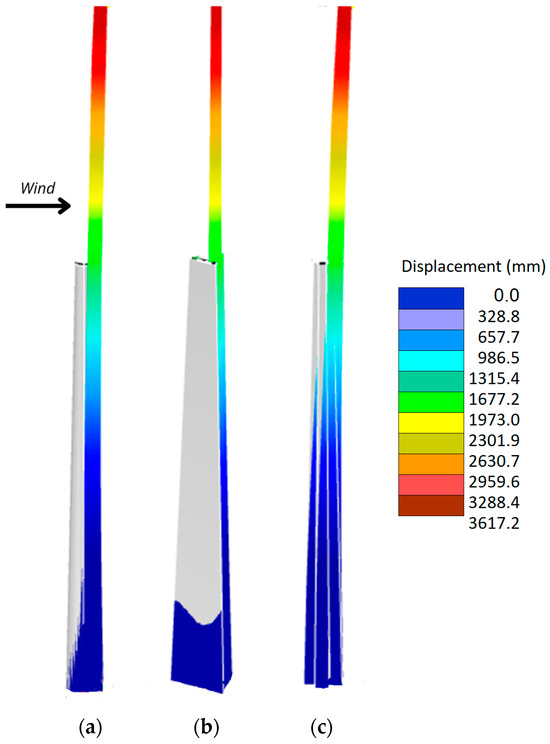
Figure 25.
Displacement field. (a) Tower #19. (b) Tower #20. (c) Tower #21.
It can be seen that the smallest displacements occurred for the tower with a triangular concrete section (tower #20), followed by the tower with a cruciform concrete section (tower #21), and the circular section tower (tower #19) presented maximum displacements. In all cases, the maximum displacements occurred at the upper end of the steel section.
3.2.2. Main Stresses
The main stress fields for each tower were obtained on the external surface of the towers. Table 6 shows the windward and leeward values of the external surface for towers #1 to #9. Table 7 presents the results for towers #10 to #18.
Table 6.
Main windward and leeward stresses of towers #1 to #9.
Table 7.
Main windward and leeward stresses of towers #10 to #18.
In the case of hybrid towers (towers #10 to #18), the highest stress concentration occurred in the joint between the concrete and the steel.
Comparing steel, concrete, and hybrid towers, steel towers have the highest main stresses both windward and leeward, while concrete towers are the least stressed. Hybrid towers have intermediate behavior, where the most stressed section can be found on the steel section. It was observed that the stress distribution in the concrete tower is quite uniform, unlike the other analyzed typologies, which show a more variable field of main stresses along the span of the tower.
S335 J2 steel was used for the different steel and hybrid towers case studies. This type of steel features a yield stress of 355 MPa. None of the simulated and calculated steel or hybrid towers presented principal stresses, either windward or leeward, that exceeded the yield stress of the steel. On the other hand, the concrete chosen for the different case studies of reinforced concrete and hybrid towers has a characteristic strength of 40 MPa, 50 MPa, and 60 MPa. The main leeward stresses never exceeded the characteristic resistance of the proposed concretes in any of the reinforced concrete in hybrid towers.
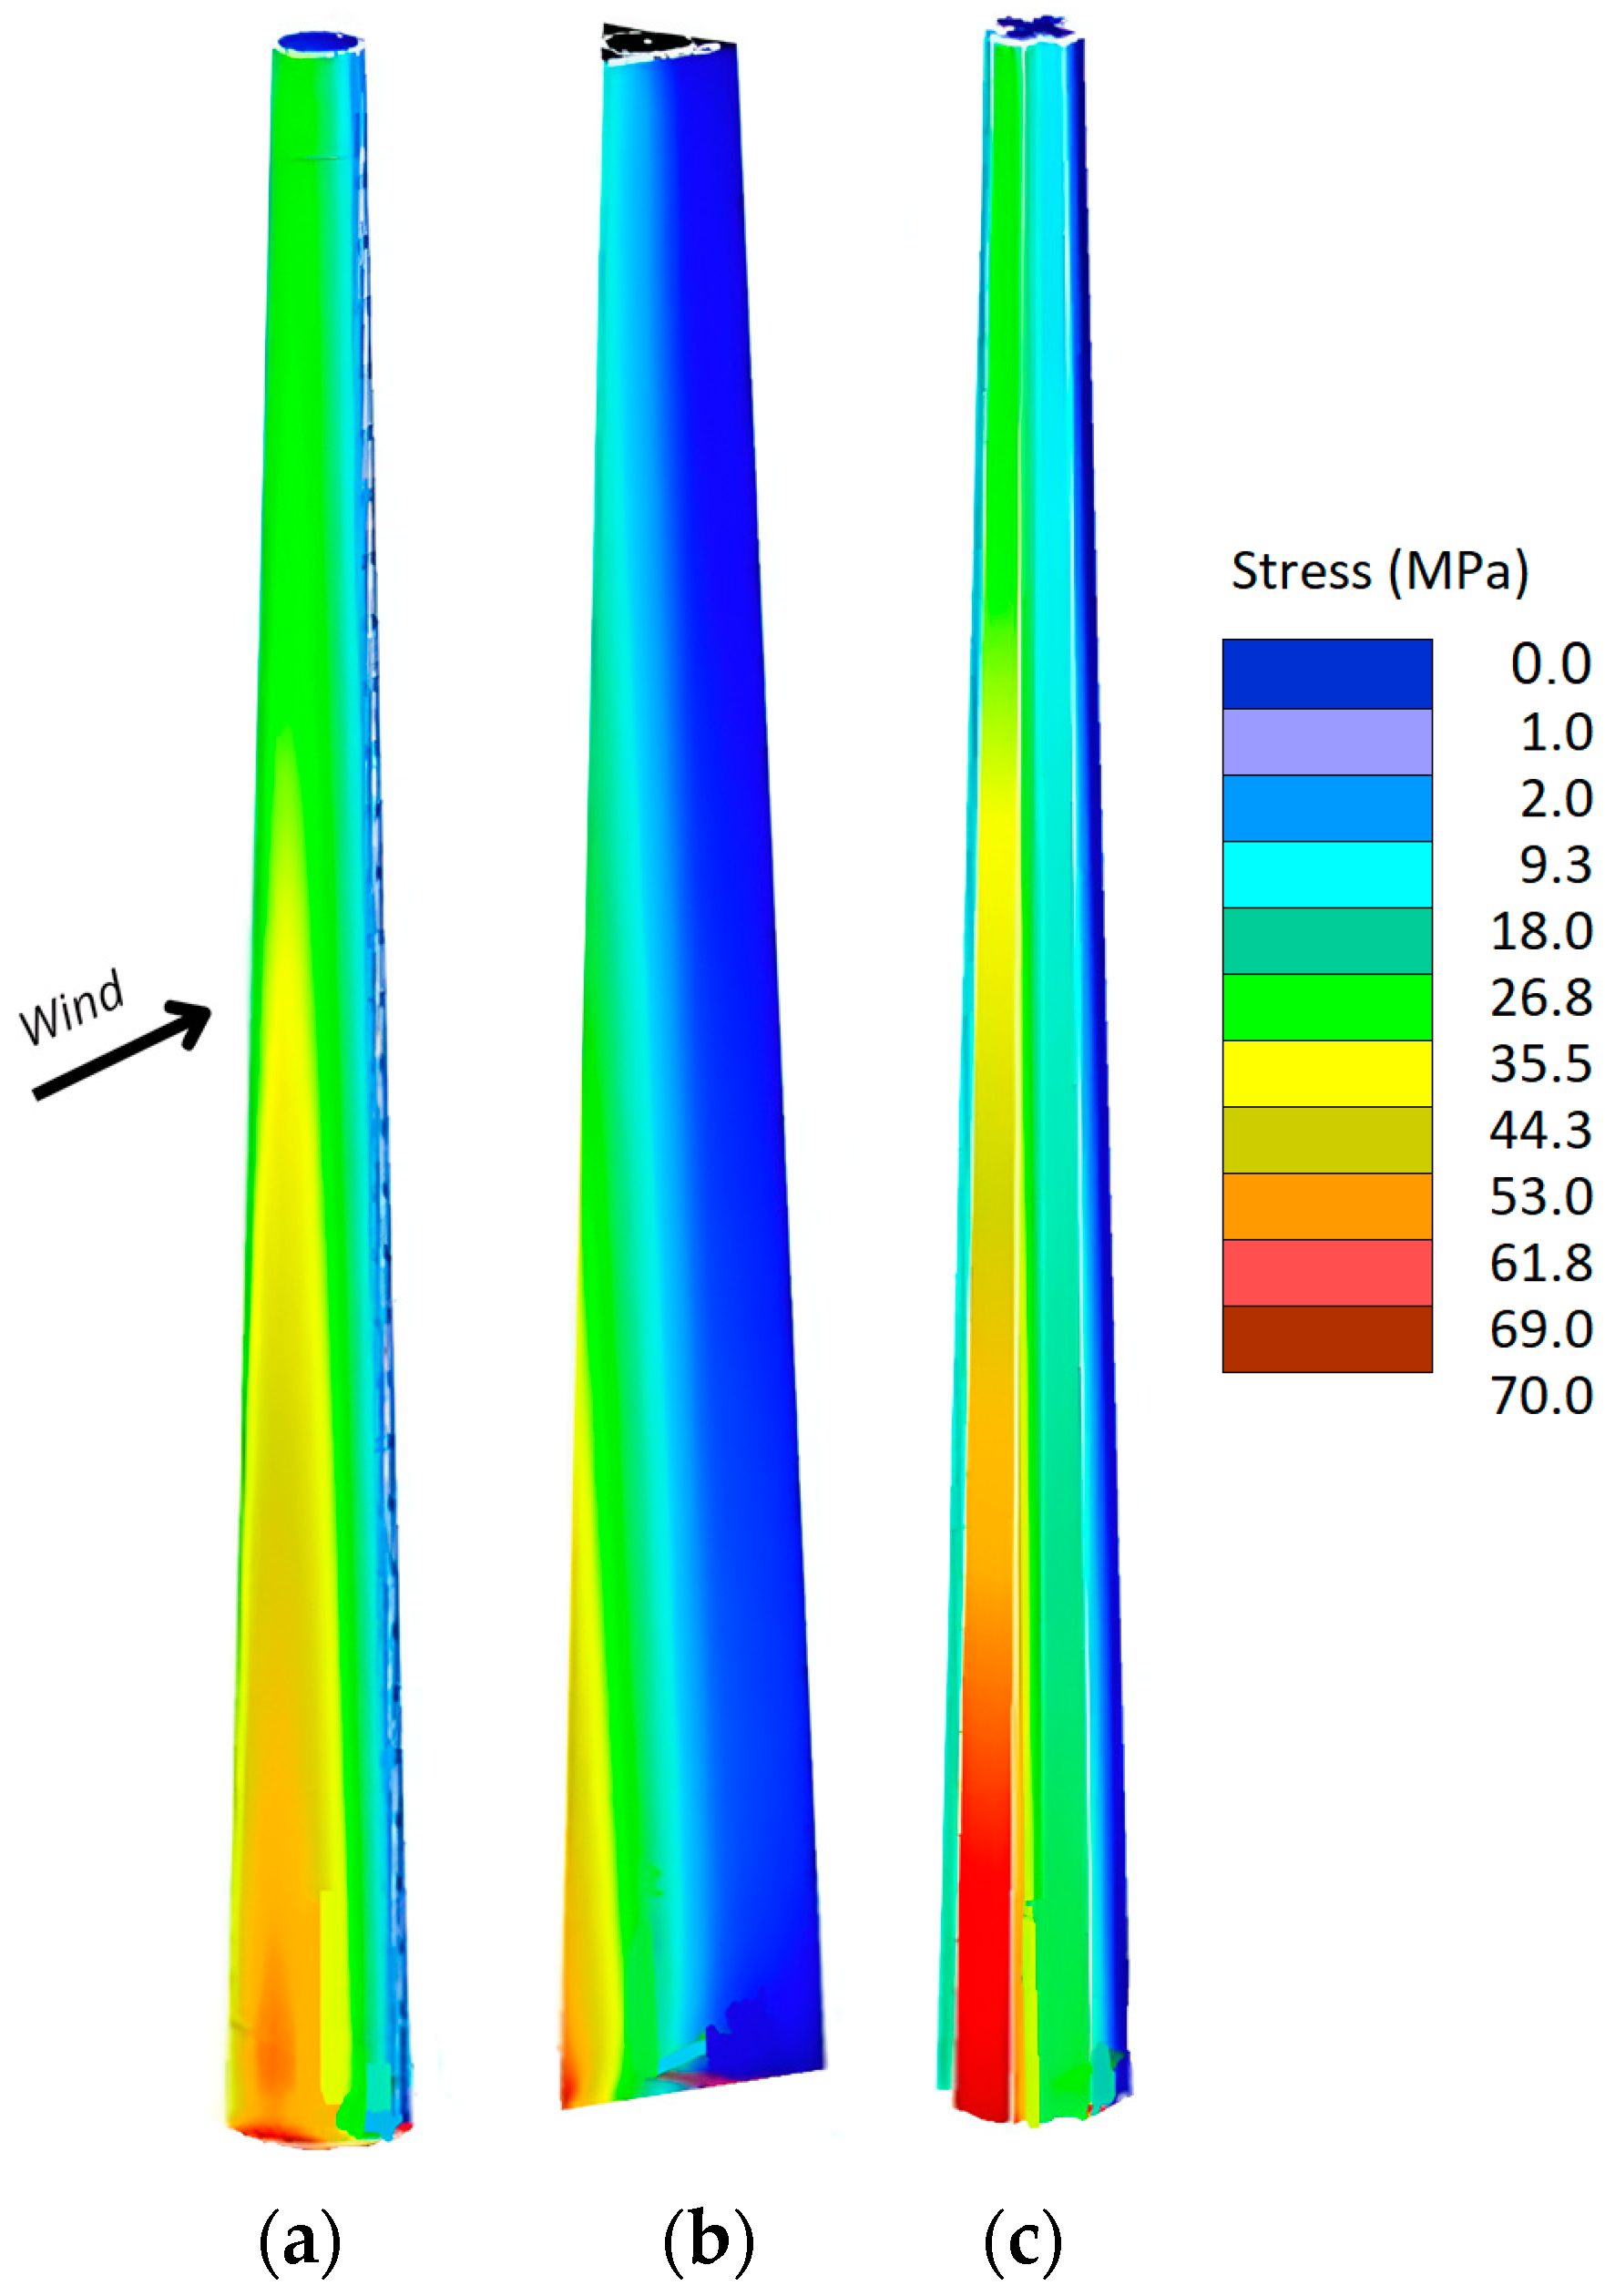
For the analysis of the impact of the concrete cross-section on the bearing capacity of the hybrid towers, the maximum stress values of towers #19 to #21 were compared (Figure 26). The results show that the cruciform section was the least resistant. The circular section presented the best behavior, while the triangular one showed an intermediate load-bearing capacity. In all three cases, the maximum main stress did not exceed the characteristic strength of the concrete selected (80 MPa).

Figure 26.
Maximum main stress. (a) Tower #19. (b) Tower #20. (c) Tower #21.
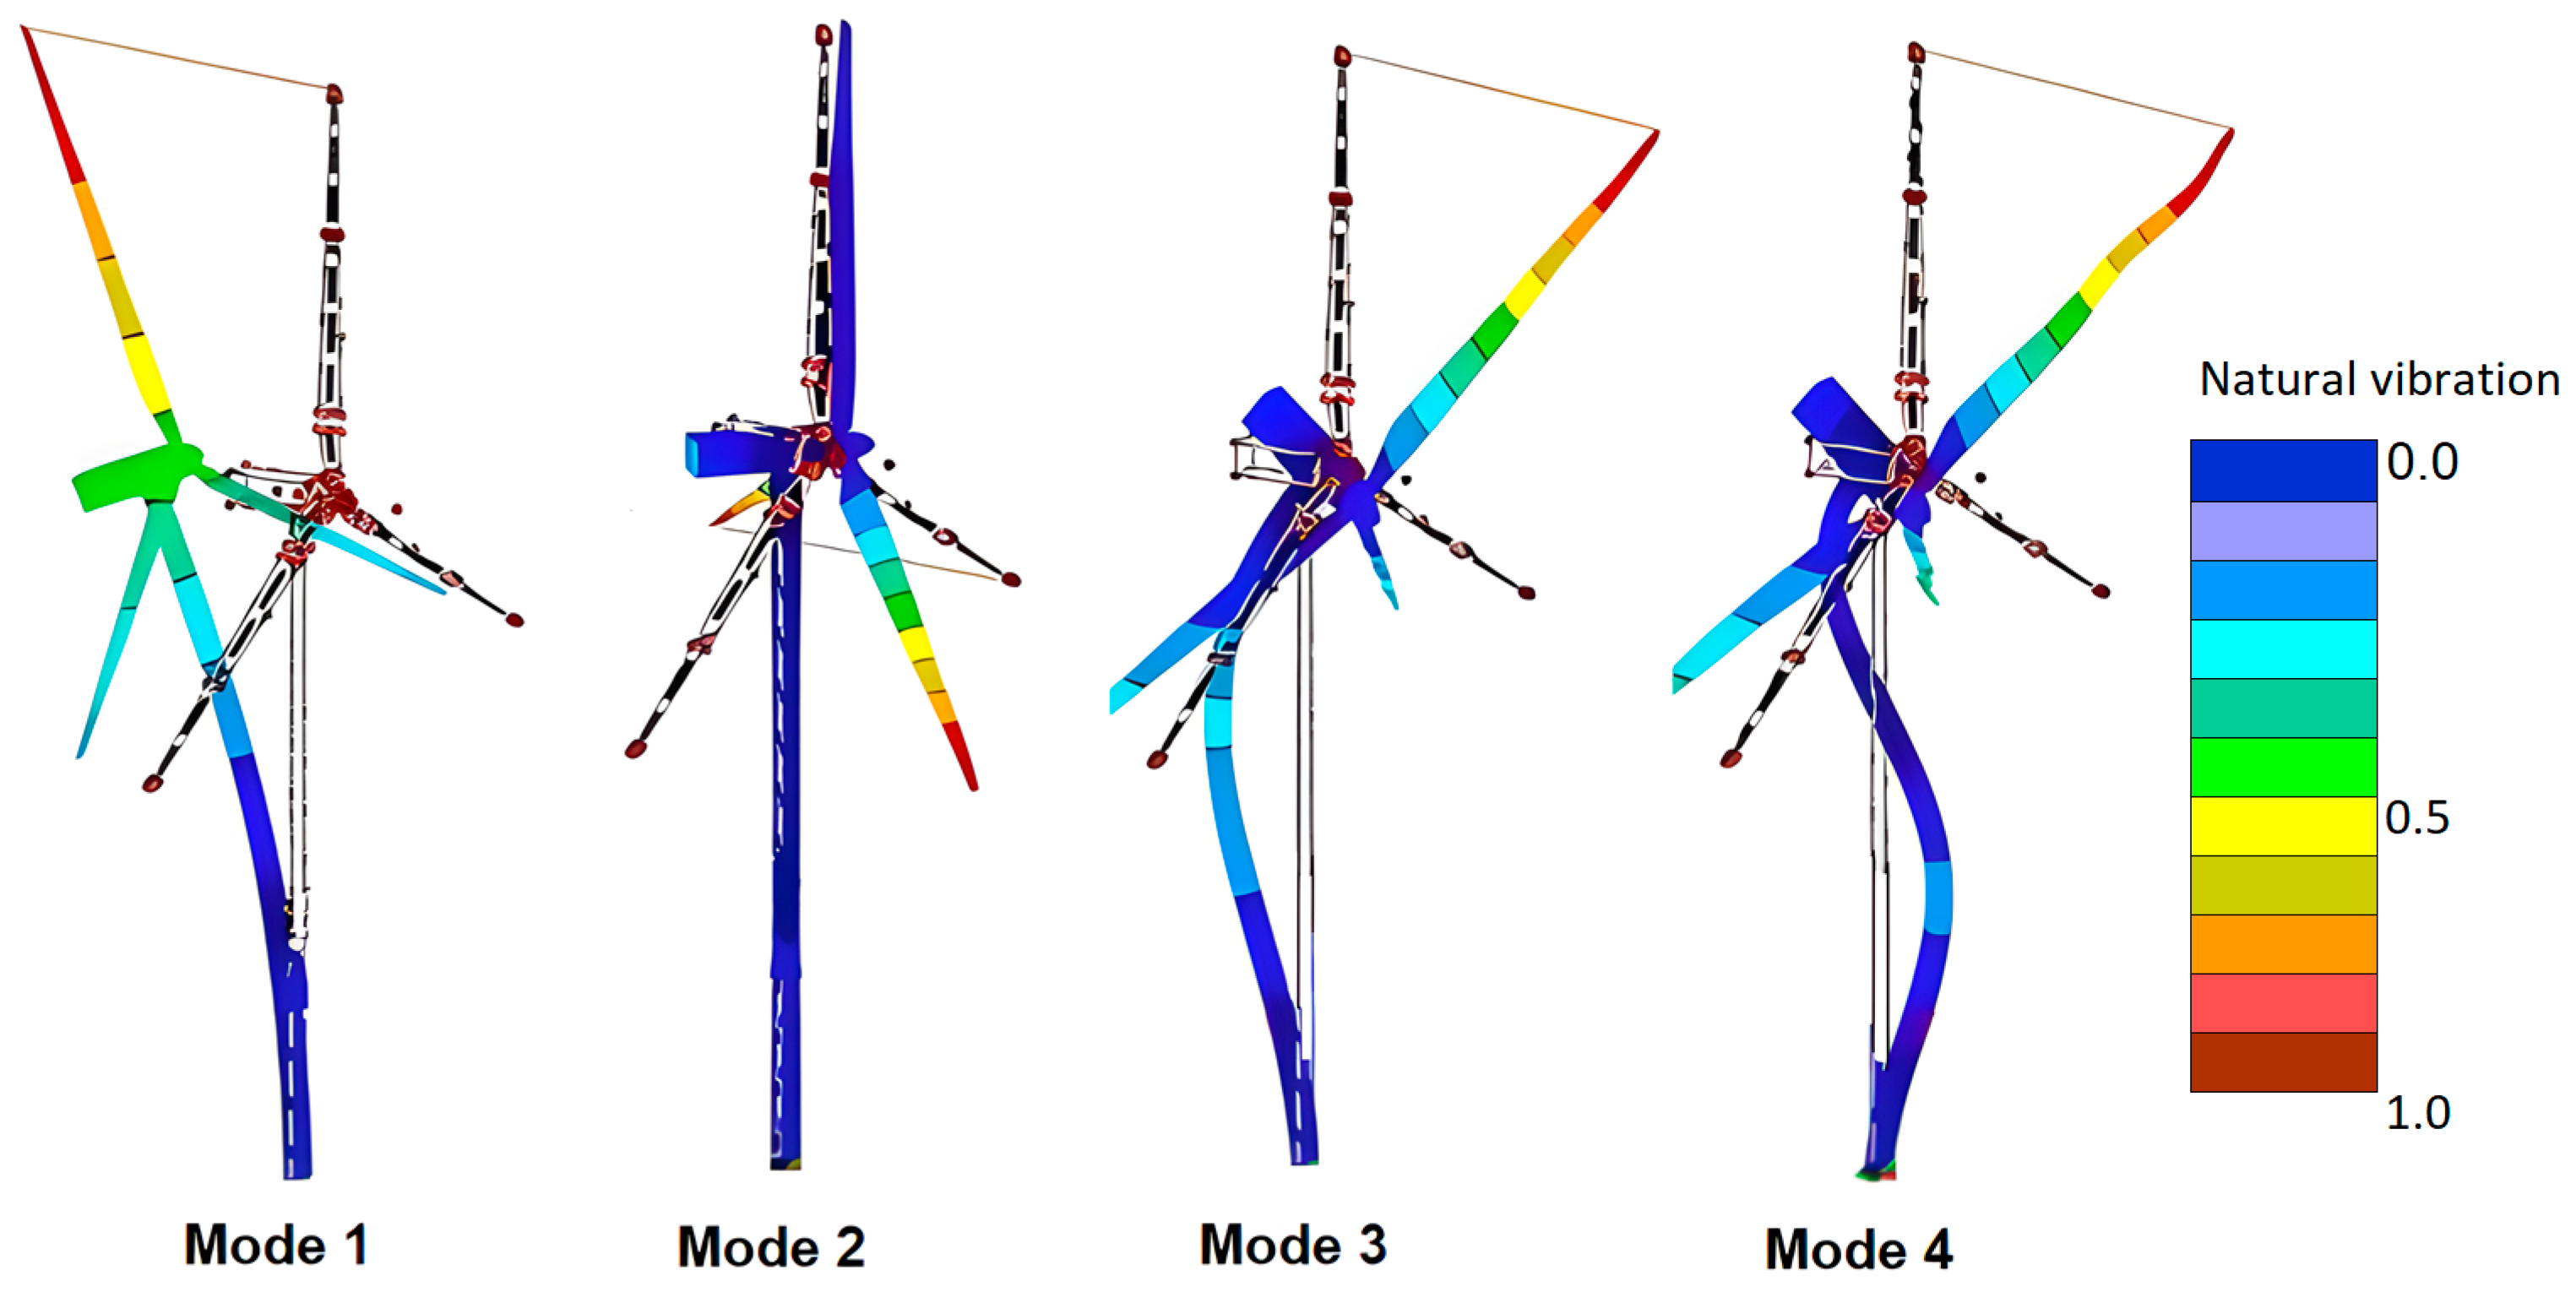
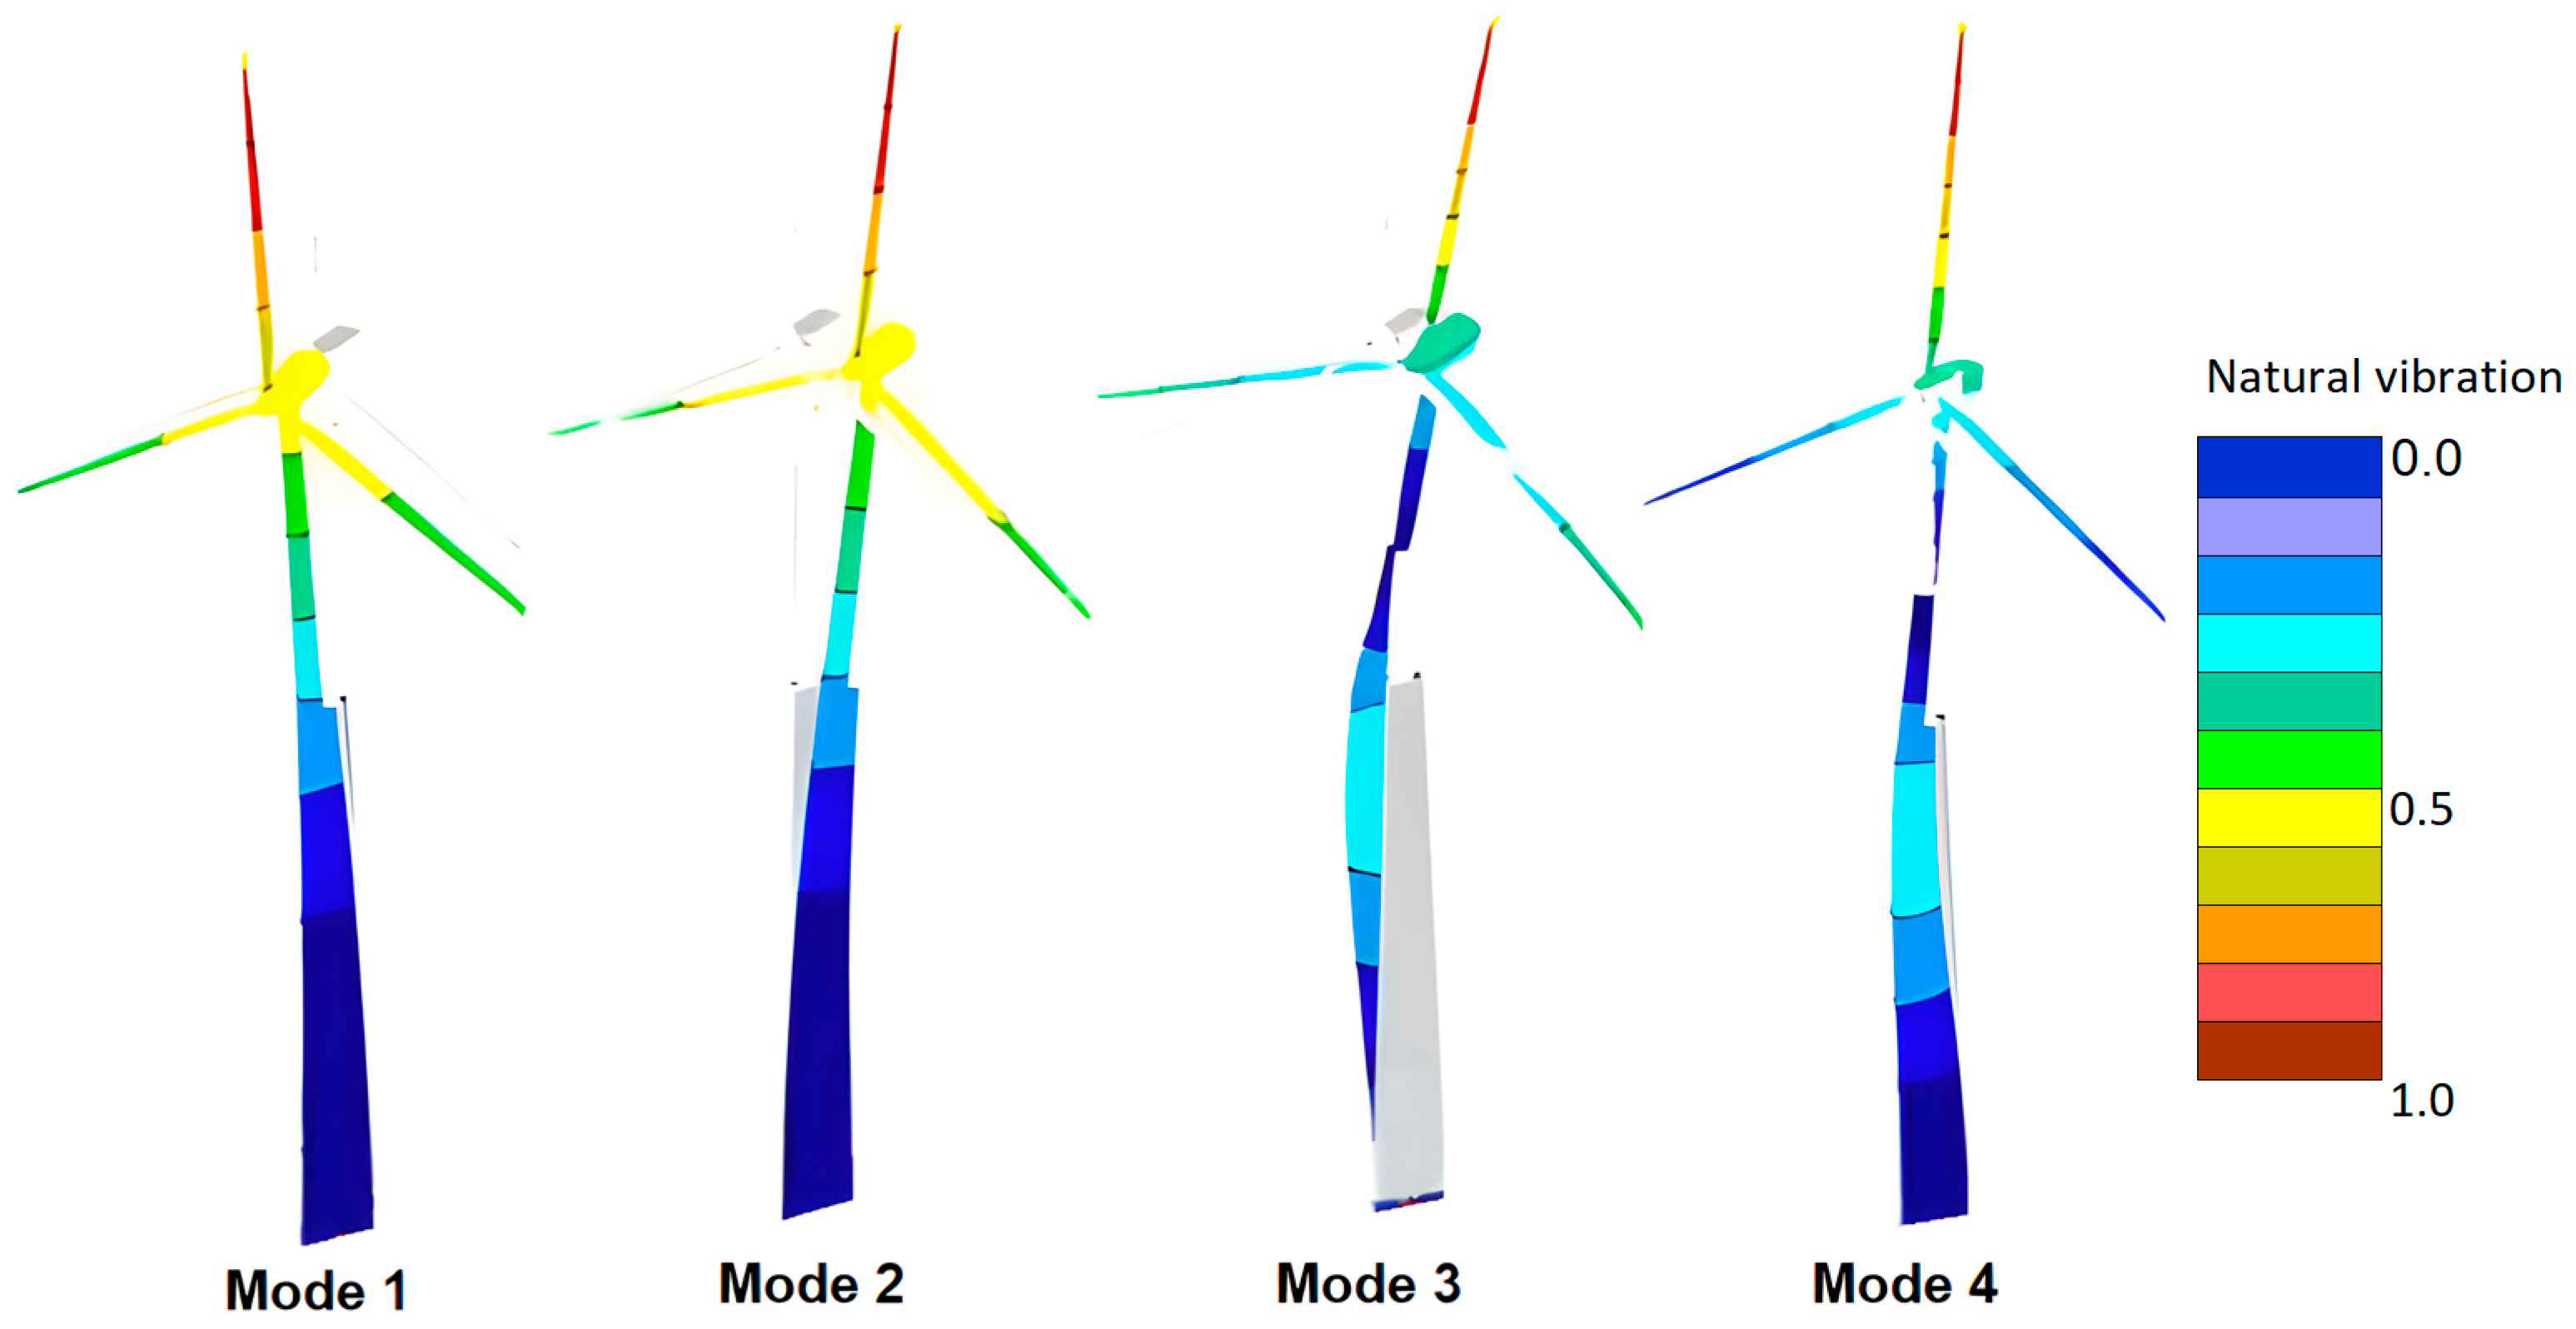
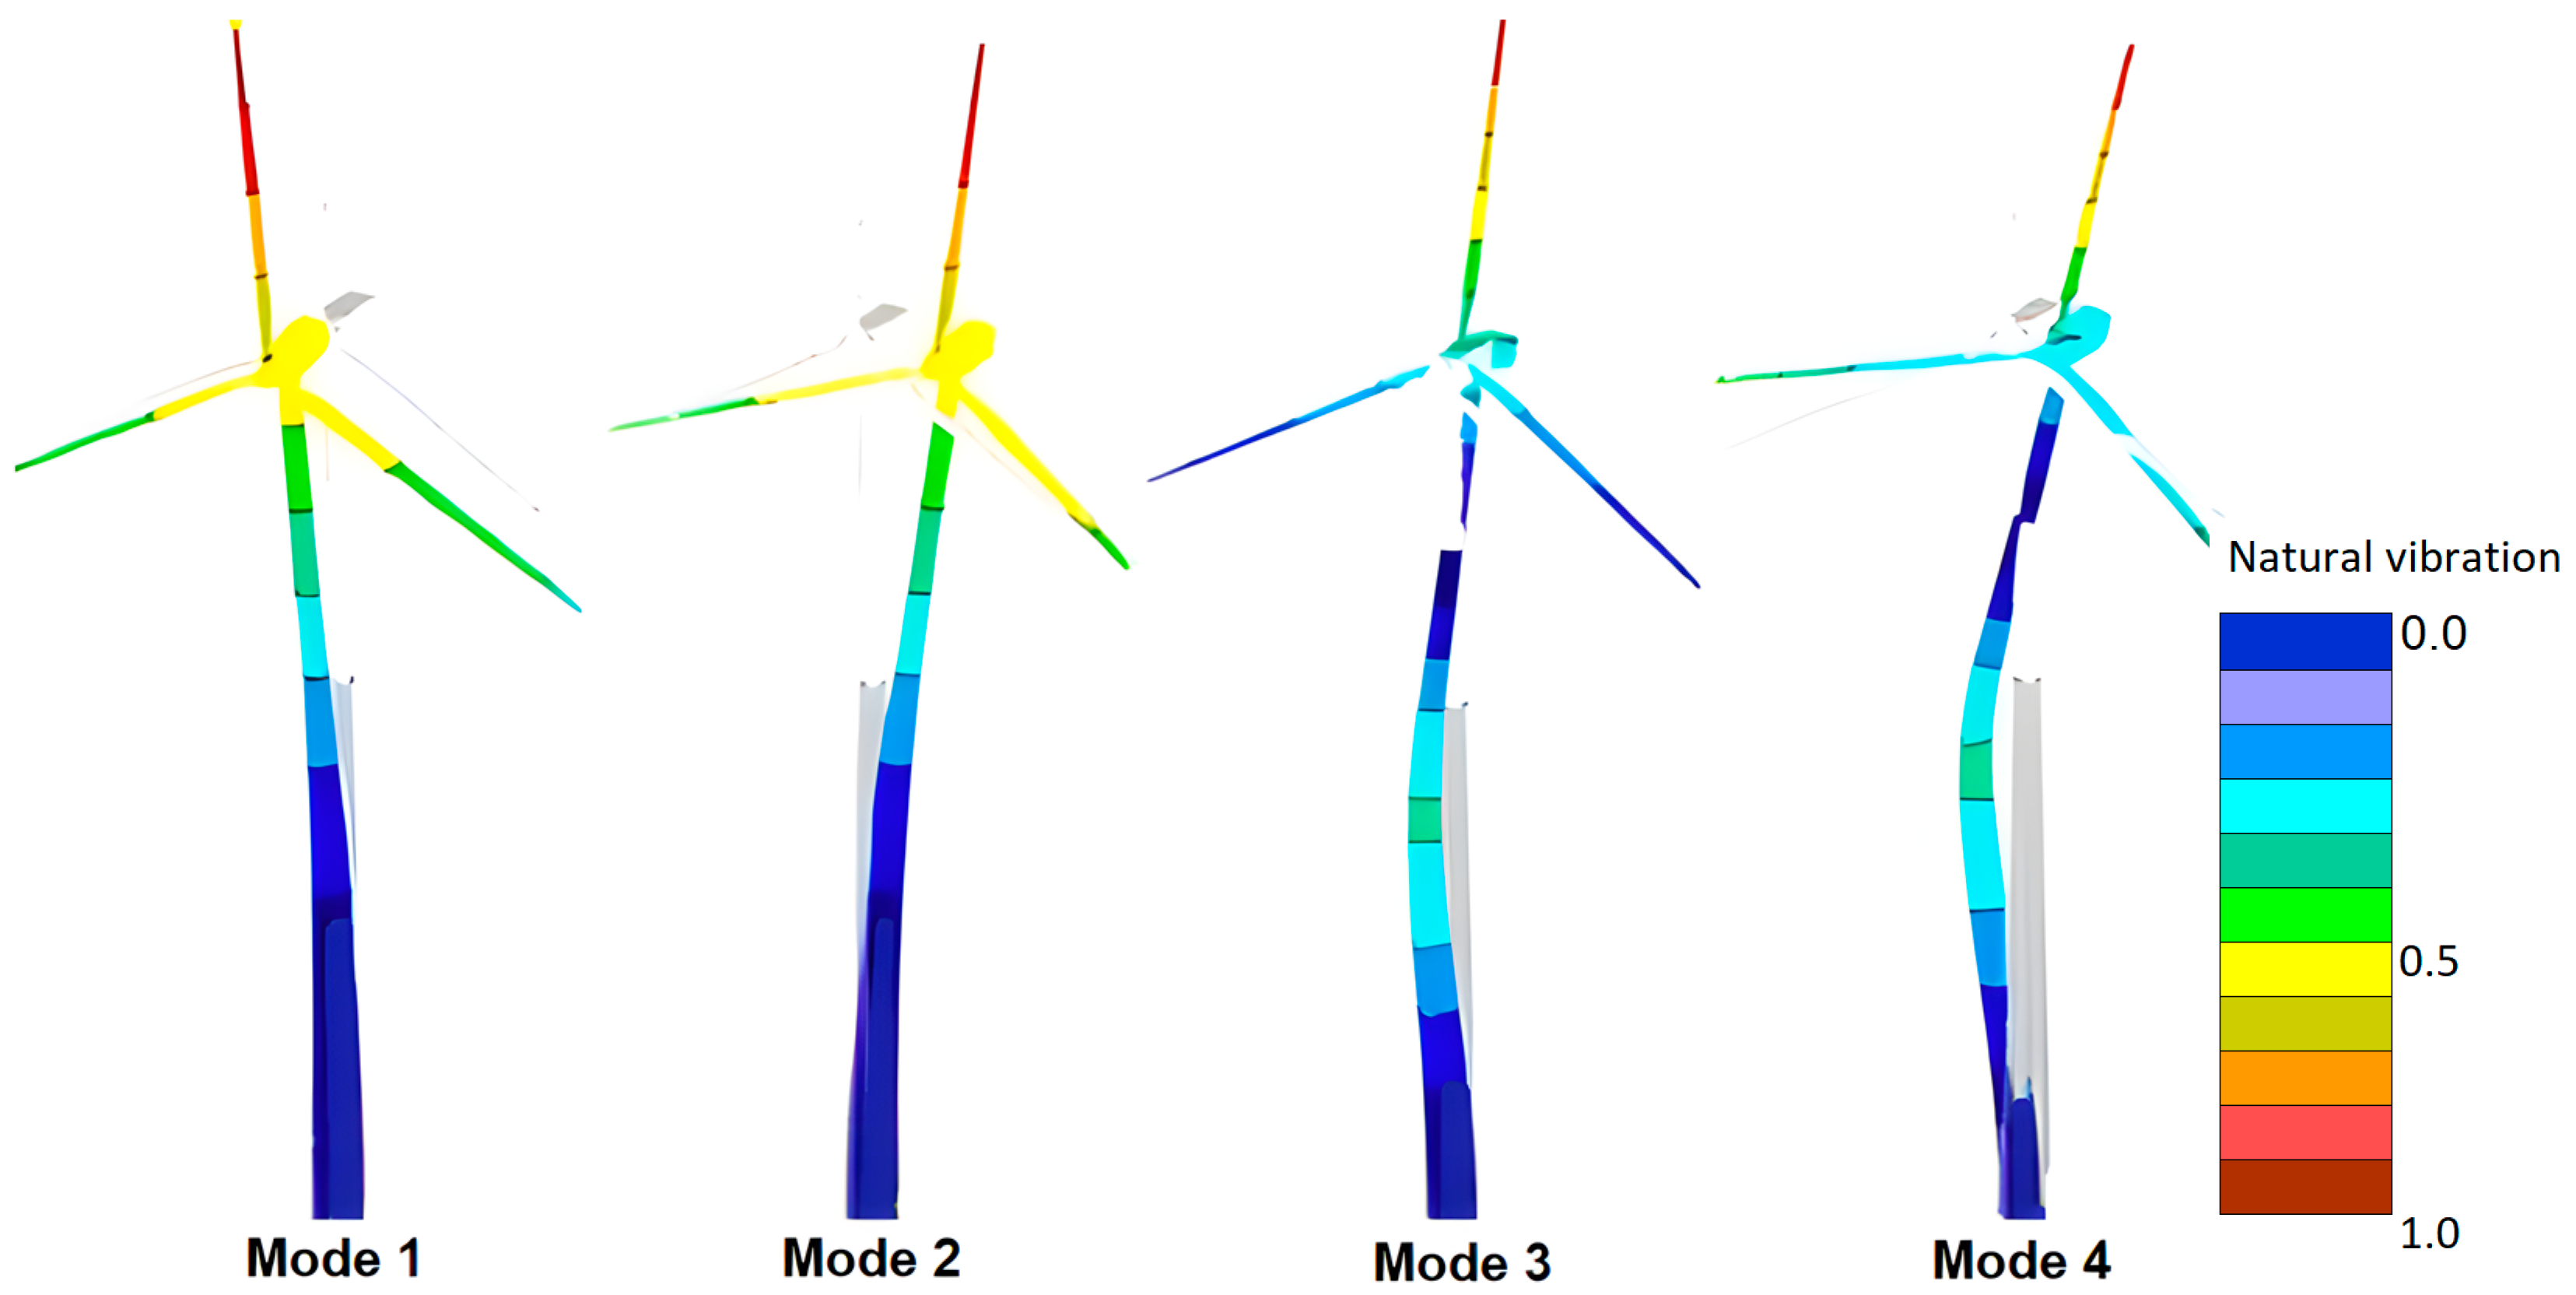
3.2.3. Natural Frequencies
The results of the first four vibration modes are presented for each modelled typology (Figure 26, Figure 27, Figure 28, Figure 29, Figure 30, Figure 31 and Figure 32). As in any pendulum structure, the most important vibration mode is 1. Natural frequencies for mode 1 are presented in Table 8. According to the analyzed case studies, it was observed that hybrid towers present higher natural frequencies compared to concrete and steel towers. Among the hybrid ones, the tower with the highest natural frequency is the one with a triangular concrete cross-section.

Figure 27.
Natural vibration modes for tower #3 (steel, thickness = 40 mm).
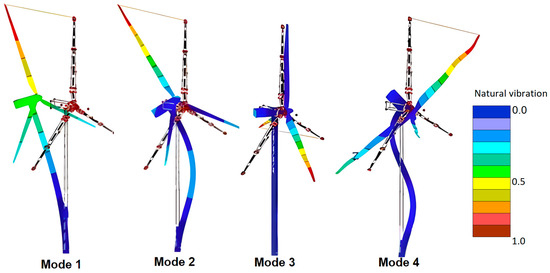
Figure 28.
Natural vibration modes for tower #6 (concrete, thickness 300 mm).
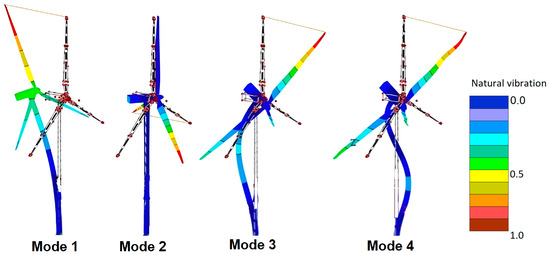
Figure 29.
Natural vibration modes for tower #9 (hybrid, concrete thickness = 300 mm, steel thickness = 40 mm).
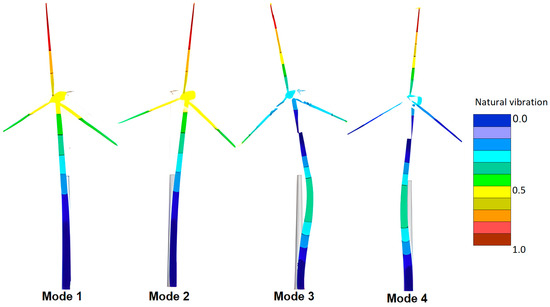
Figure 30.
Natural vibration modes for tower #19 (hybrid, circular concrete cross-section).
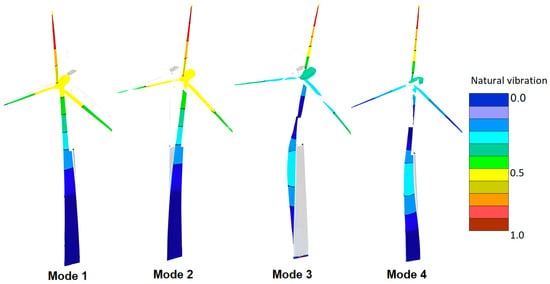
Figure 31.
Natural vibration modes for tower #20 (hybrid, concrete thickness = 300 mm, steel thickness = 40 mm).
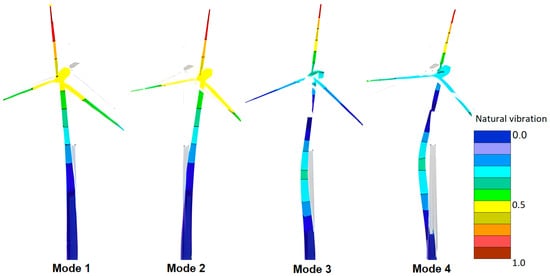
Figure 32.
Natural vibration modes for tower #21 (hybrid, concrete thickness = 300 mm, steel thickness = 40 mm).
Table 8.
Natural frequencies for mode 1.
4. Discussion
Twenty-one wind turbines were modelled to compare the performance of their towers against wind load in the north of the Patagonian region. For this, 18 tubular, 100 m high towers made of different materials and thicknesses were considered. The conical cylindrical geometry was kept at a conicity ratio of 0.75.
Three other tubular towers 160 m high were modelled, maintaining the upper 60 m of the conical cylindrical section of steel while varying the shape of the cross-section in the lower 100 m of concrete and maintaining the same thickness. In this case, a circular cross-section, a triangular cross-section, and a cruciform cross-section were compared.
Real parameters of materials, densities, masses, and dimensions were applied in all models.
Each tower model was tested in a virtual wind tunnel under the turbulence intensity profile and the extreme wind (EWM) profile based on the IEC 61400-1 Standard, which was calculated from background data and using in situ measurements from the region. The results provide information on the characteristics of these towers, e.g., their natural frequencies, principal stresses, deformations, generated turbulences, and behaviors resulting from the fluid–structure interaction.
Comparing the leeward flow in the 100 m high, circular, cross-sectioned, concrete tower (tower #9) with the lower section of the 160 m circular, cross-sectioned, hybrid tower (tower #19), the incidence of the conicity can be observed in the turbulent structures generated. Both towers have the same length and cross-sectional shape but a different lower-to-upper-diameter ratio. This variation is reflected in the distribution of the turbulent kinetic energy across the wake (Figure 17 and Figure 19). The tapered shape produces three-dimensional effects in the wake whose complexity increases with a higher Reynolds number [10,27,28]. Among these phenomena, cellular vortex shedding occurs [29,30], which could explain the concentration of turbulent kinetic energy in various localized sections of the towers (Figure 17, Figure 18 and Figure 20). The visualization of the velocity vector field behind the tower (Figure 12) shows a downward flow that was also detected in previous investigations on wind turbine towers subjected to regional winds [11].
In the case of the hybrid tower concrete section comparison, the most unfavorable case from the aerodynamic standpoint is the triangular section. The most favorable section is the cruciform one. The circular section presented an intermediate behavior.
Obtaining the natural frequencies of the towers allows the possibility of evaluating resonance with the frequencies of vortex shedding and the rotation frequency of the rotor under normal operating conditions. The rotor rotation frequency of the modelled turbines is 0.205 Hz for the AW-116/3000 wind turbine (towers 1 to 18) and 0.11–0.18 Hz for the SG 3.4-132 turbine (towers 19 to 21) (data provided by the manufacturer). Comparing values, in the first case, the steel and concrete towers with lower rigidities (towers #1, #4, #6, and #8) presented a risk of resonance in the first vibration mode, while the hybrid ones (towers #9 to #18) are safer. In the second case, for the hybrid towers with the SG 3.4-132 turbine, there is no risk of resonance, but the cruciform section is the one that brings its natural frequency closest to the rotation frequency of the rotor. Regarding the evaluation of resonance caused by vortex shedding, although shedding frequencies could not be obtained in this research, the frequencies of towers #1 to #8 were compared with shedding frequencies obtained experimentally in an 80 m conical cylinder tower under regional wind [11]. Risk of resonance was found in vibration modes 3 and 4.
The increase in rigidity in any of the analyzed tower typologies favors their structural behavior: By increasing the thickness of the towers, the displacements and principal stresses on the structure’s surface decrease, and its natural frequency increases. In addition, the stress concentration is lower at the base, which would allow smaller foundations. In the case of concrete towers, thickness seems to be a more determining design parameter than its characteristic resistance.
The hybrid tower combines the best characteristics of the two selected materials (steel and concrete), featuring intermediate displacements and lower principal stresses compared to an entire steel or concrete tower. Under the current calculation hypotheses, the displacements obtained for the studied tower typologies are relatively small compared to the length of the tower.
In the concrete cross-section hybrid towers’ comparison, the tower with a triangular section is the one that structurally works at its best since a greater moment of inertia promotes optimum stress absorption; thus, lower stresses and displacements occur. In other words, it supports the efforts effectively, although at the cost of a not-so-favorable aerodynamic performance. The cruciform tower is the one that best adapts to the wind conditions tested, but structurally speaking, its behavior remains inferior. The standard tower with a truncated conical circular section shows intermediate behavior and adequate resistance to principal stresses, with a favorable adaptation to fluid passage, generating moderate wakes. However, it is the one that suffers the most deformation.
The RWind Simulation v.1.24, software is an accurate tool for calculating wind loads on structures, simulating the real conditions of the atmosphere, and allowing the exportation of the results to RFEM v5.25.01 to obtain their structural calculation.
CFD methods are primarily sensitive to the configuration of the turbulence models and the selection of the size and resolution of the mesh used to discretize the problem domain. To ensure the accuracy of the results obtained in this research, it is recommended to conduct simulations using different turbulence models, meshes, and grid scales. It would also be ideal to compare the obtained results with the experimental data collected.
As with any study involving wind action on structures, the most precise outcomes will be achieved through a combination of CFD methods, wind tunnel simulations, and in situ measurements. Carrying out meteorological measurements at the height of the turbine hub in sites of wind interest is essential to achieve an accurate assessment of the aerodynamic loads on the towers.
The RANS model used is not the most suitable for large structures under high Reynolds number flows, as is the case under study. Therefore, it was not possible to visualize the vortex patterns around the towers and determine their shedding frequencies. However, relevant information could be extracted about the configuration of the wake. These issues require further research that could be conducted through physical wind tunnel testing. For a better understanding of the flow dynamics over these structures, it is necessary to carry out tests focused on vortex formation, shedding, and interaction along the entire length of the tower section.
Although the field of application is limited to the hypotheses adopted, the obtained values and observed behaviors are consistent with research conducted by other authors [31,32,33].
5. Conclusions
When comparing a steel tower, a concrete tower, and a hybrid steel–concrete tower under extreme wind load in Patagonia, the hybrid towers stood out for their best structural behavior. The determining parameter in structural design is bending rigidity.
Regarding the shape of the cross-section in the concrete section of hybrid towers, it was found that there is no best tower, but they all present behaviors that stand out in some aspects compared to the rest of the models.
The study compares different geometries from the linear elasticity standpoint as a first approach to tackling the problem. The steel stress values obtained were below the yield limit. The same occurred for concrete, where values fell below their characteristic resistance. This analysis suggests that the material will not reach the plastic phase for the loads considered, confirming the validity of the linearity premise.
Within the framework of the established assumptions, this study provides a view of possible alternatives for wind turbine towers set up in northern Patagonia, based on local conditions and structural design main parameters.
Since there are no precedents on this topic with in situ data, this research paves the way for future regional studies. Future analyses should contemplate possible nonlinearities and the inclusion of other load states specified in the IEC 61400-1 Standard.
Author Contributions
Conceptualization, resources, supervision, and project administration, A.A.; methodology, formal analysis, and investigation, A.A. (extreme winds), G.C. and J.M.L. (towers 1 to 18) and E.Q. (towers 19 to 21). All authors were involved in the writing and reviewing process. All authors have read and agreed to the published version of the manuscript.
Funding
This research received no external funding.
Data Availability Statement
Data will be made available on request.
Acknowledgments
Jorge Lässig, Claudia Palese, and Dublal Latinoamerica for technical support. Lynn Van Brook for English translation assistance.
Conflicts of Interest
The authors declare no conflicts of interest.
References
- Entre Provincial de Neuquén. Prefactibilidad Técnica y Prediseño de Parque Eólico en Auquinco; EPEN: Neuquén, Argentine, 2010.
- Global Wind Atlas. Available online: https://globalwindatlas.info/en/area/Argentina (accessed on 15 August 2023).
- IEC 61400-1; Wind Turbine Generator Systems. Part 1: Safety Requirements. IEC: Geneva, Italy, 2005.
- European Wind Turbine Standard II; ECN Solar & Wind Energy: Amsterdam, The Netherlands, 1998.
- Palese, C.; Lässig, J. Mapa eólico de la provincia del Neuquén. Hidrored Red Latinoam. Micro Hidroenergía 2006, 2, 3–11. [Google Scholar]
- Palese, C.; Lässig, J.L.; Cogliati, M.G.; Bastanski, M.A. Wind Regime and Wind Power in North Patagonia, Argentina. Wind Eng. 2000, 24, 361–377. [Google Scholar] [CrossRef]
- Lässig, J.; Palese, C.; Cogliati, M.; Bastanski, M. Wind characteristics in Neuquén, North Patagonia, Argentina. J. Wind. Eng. Ind. Aerodyn. 1999, 79, 183–199. [Google Scholar] [CrossRef]
- Harte, R.; Van Zijl, G. Structural Stability of Concrete Wind Turbines and Solar Chimney Towers exposed to Dynamic Wind Action. J. Wind. Eng. Ind. Aerodyn. 2007, 95, 1079–1096. [Google Scholar] [CrossRef]
- De Vries, E. Concrete-Steel Hybrid Tower from ATS. Renew. Energy World 2009, 12, 109–111. [Google Scholar]
- Williamson, C.H.K. Vortex Dynamics in the wake of a cylinder. In Fluid Mechanics and Its Applications: Fluid Vortices; Springer Science Bussiness Media: Dordrecht, The Netherlands, 1995; pp. 125–291. [Google Scholar] [CrossRef]
- Apcarian, A. Patrones de Vórtice a Sotavento de una Torre de Aerogenerador Multi-MW, en Condiciones de Viento Extremo. Ph.D. Thesis, Universidad Nacional de La Plata, La Plata, Argentina, 2019. [Google Scholar]
- Kasana, D.; Tayal, W.; Choudhary, D.; Raj, R.; Kumar Meena, R.; Anbukumar, S. Evaluation of aerodynamic effects on a tall building with various cross-section shapes having equal area. Forces Mech. 2022, 9, 100134. [Google Scholar] [CrossRef]
- Bandi, E.K.; Tamura, Y.; Yoshida, A.; Kim, Y.C.; Yang, Q. Experimental investigation on aerodynamic characteristics of various triangular-section high-rise buildings. J. Wind. Eng. Ind. Aerodyn. 2013, 122, 60–68. [Google Scholar] [CrossRef]
- Tamura, Y.; Kim, Y.C.; Tanaka, H.; Bandi, E.K.; Yoshida, A.; Otake, K. Aerodynamic and Response Characteristics of Supertall Buildings with various configurations. In Proceedings of the Eighth Asia-Pacific Conference on Wind Engineering, Chennai, India, 10–14 December 2013; pp. 219–243. [Google Scholar]
- Hu, W.; Yang, Q.; Yuan, Z.; Yang, F. Wind farm layout optimization in complex terrain based on CFD and IGA-PSO. Energy 2024, 288, 129745. [Google Scholar] [CrossRef]
- Letzugs, P.; Guma, G.; Lutz, T. Computational fluid dynamics studies on wind turbine interactions with the turbulent local flow field influenced by complex topography and thermal stratification. Wind Energy Sci. 2022, 7, 1151–1573. [Google Scholar] [CrossRef]
- Ma, H.; Meng, R. Optimization Design of Prestressed Concrete Wind Turbine Tower. Sci. China Technol. Sci. 2014, 57, 414–422. [Google Scholar] [CrossRef]
- Lantz, E.J.; Roberts, J.O.; Nunemaker, J.; DeMeo, E.; Dykes, K.L.; Scott, G.N. Increasing Wind Turbine Tower Heights: Opportunities and Challenges; Technical Report; National Renewable Energy Lab: Golden, CO, USA, 2019. [Google Scholar] [CrossRef]
- Fu, B.; Zhao, J.; Li, B.; Yao, J.; Mouafo Teifouet, A.R.; Sun, L.; Wang, Z. Fatigue reliability analysis of wind turbine tower under random wind load. Struct. Saf. 2020, 87, 110447. [Google Scholar] [CrossRef]
- Hernandez Estrada, E.; Lastres Danguillecourt, O.; Robles Ocampo, J.B.; López López, A.; Sevilla Camacho, P.Y.; Pérez Sariñana, B.Y.; Dorrego Portela, J.R. Considerations for the structural analysis and design of wind turbine towers: A review. Renew. Sustain. Energy Rev. 2021, 137, 101982. [Google Scholar] [CrossRef]
- Excelsior. Available online: https://www.excelsior.com.mx/nacional/fuerza-del-viento-dobla-torre-de-aerogenerador-en-parque-eolico-del-istmo/1570940 (accessed on 20 April 2023).
- Ileon. Available online: https://ileon.eldiario.es/actualidad/aerogenerador-desplome-75-metros-parques-eolicos-leon_1_9735355.html (accessed on 15 December 2022).
- Energía Estratégica. Available online: https://www.energiaestrategica.com/por-los-fuertes-vientos-se-cayo-un-aerogenerador-eolico-en-comodoro-rivadavia (accessed on 15 August 2020).
- Peterson, E.W.; Hennesey, J.P. On the Use of Powers Laws for Estimates of Wind Power Potential. J. Appl. Meteorol. 1978, 17, 390–394. [Google Scholar] [CrossRef]
- Guevara Díaz, J.M. Cuantificación del perfil del viento hasta 100 m de altura desde la superficie y su incidencia en la climatología eólica. Terra Nueva Etapa 2013, 29, 81–101. Available online: http://ve.scielo.org/scielo.php?pid=S1012-70892013000200006&script=sci_arttext (accessed on 20 April 2023).
- Lässig, J.L.; Palese, C.; Apcarian, A. Vientos extremos en la provincia de Neuquén. Meteorológica 2011, 36, 83–93. Available online: http://www.scielo.org.ar/scielo.php?script=sci_arttext&pid=S1850-468X2011000200003&lng=es&tlng=es (accessed on 20 April 2023).
- Braza, A.; Perrin, R.; Hoarau, Y. Turbulence properties in the cylinder wake at high Reynolds numbers. Fluids Struct. 2006, 2, 757–771. [Google Scholar] [CrossRef]
- Dunn, W.; Tavoularis, S. Experimental studies of vortices shed from cylinders with a step-change in diameter. J. Fluid Mech. 2006, 555, 409–437. [Google Scholar] [CrossRef]
- Hsiao, F.; Chiang, C. Experimental Study of Cellular Shedding Vortices behind a Tapered Cylinder. Exp. Therm. Fluid Sci. 1998, 17, 179–188. [Google Scholar] [CrossRef]
- Mittal, S.; Pandi, J.S.S.; Hore, M. Cellular vortex shedding from a cylinder at low Reynolds number. J. Fluid Mech. 2021, 915, A74. [Google Scholar] [CrossRef]
- Núñez Ayala, I. Diseño y Cálculo de la Torre y la Cimentación de un Aerogenerador. Bachelor’s Thesis, University of País Vasco, Bilbao, Spain, 2015. [Google Scholar]
- Rodríguez Buenestado, J.F. Análisis y Diseño de un Aerogenerador Mediante Simulación 3d de Dinámica Computacional de Fluidos. Bachelor’s Thesis, Carlos III de Madrid University, Madrid, Spain, 2017. [Google Scholar]
- Galvez Román, R. Diseño y Cálculo Estructural de la Torre de un Aerogenerador. Bachelor’s Thesis, Carlos III de Madrid University, Madrid, Spain, 2005. [Google Scholar]


Disclaimer/Publisher’s Note: The statements, opinions and data contained in all publications are solely those of the individual author(s) and contributor(s) and not of MDPI and/or the editor(s). MDPI and/or the editor(s) disclaim responsibility for any injury to people or property resulting from any ideas, methods, instructions or products referred to in the content. |
© 2024 by the authors. Licensee MDPI, Basel, Switzerland. This article is an open access article distributed under the terms and conditions of the Creative Commons Attribution (CC BY) license (https://creativecommons.org/licenses/by/4.0/).