
Wind-Induced Response Analysis and Fatigue Reliability Study of a Steel–Concrete Composite Wind Turbine Tower


Abstract
1. Introduction
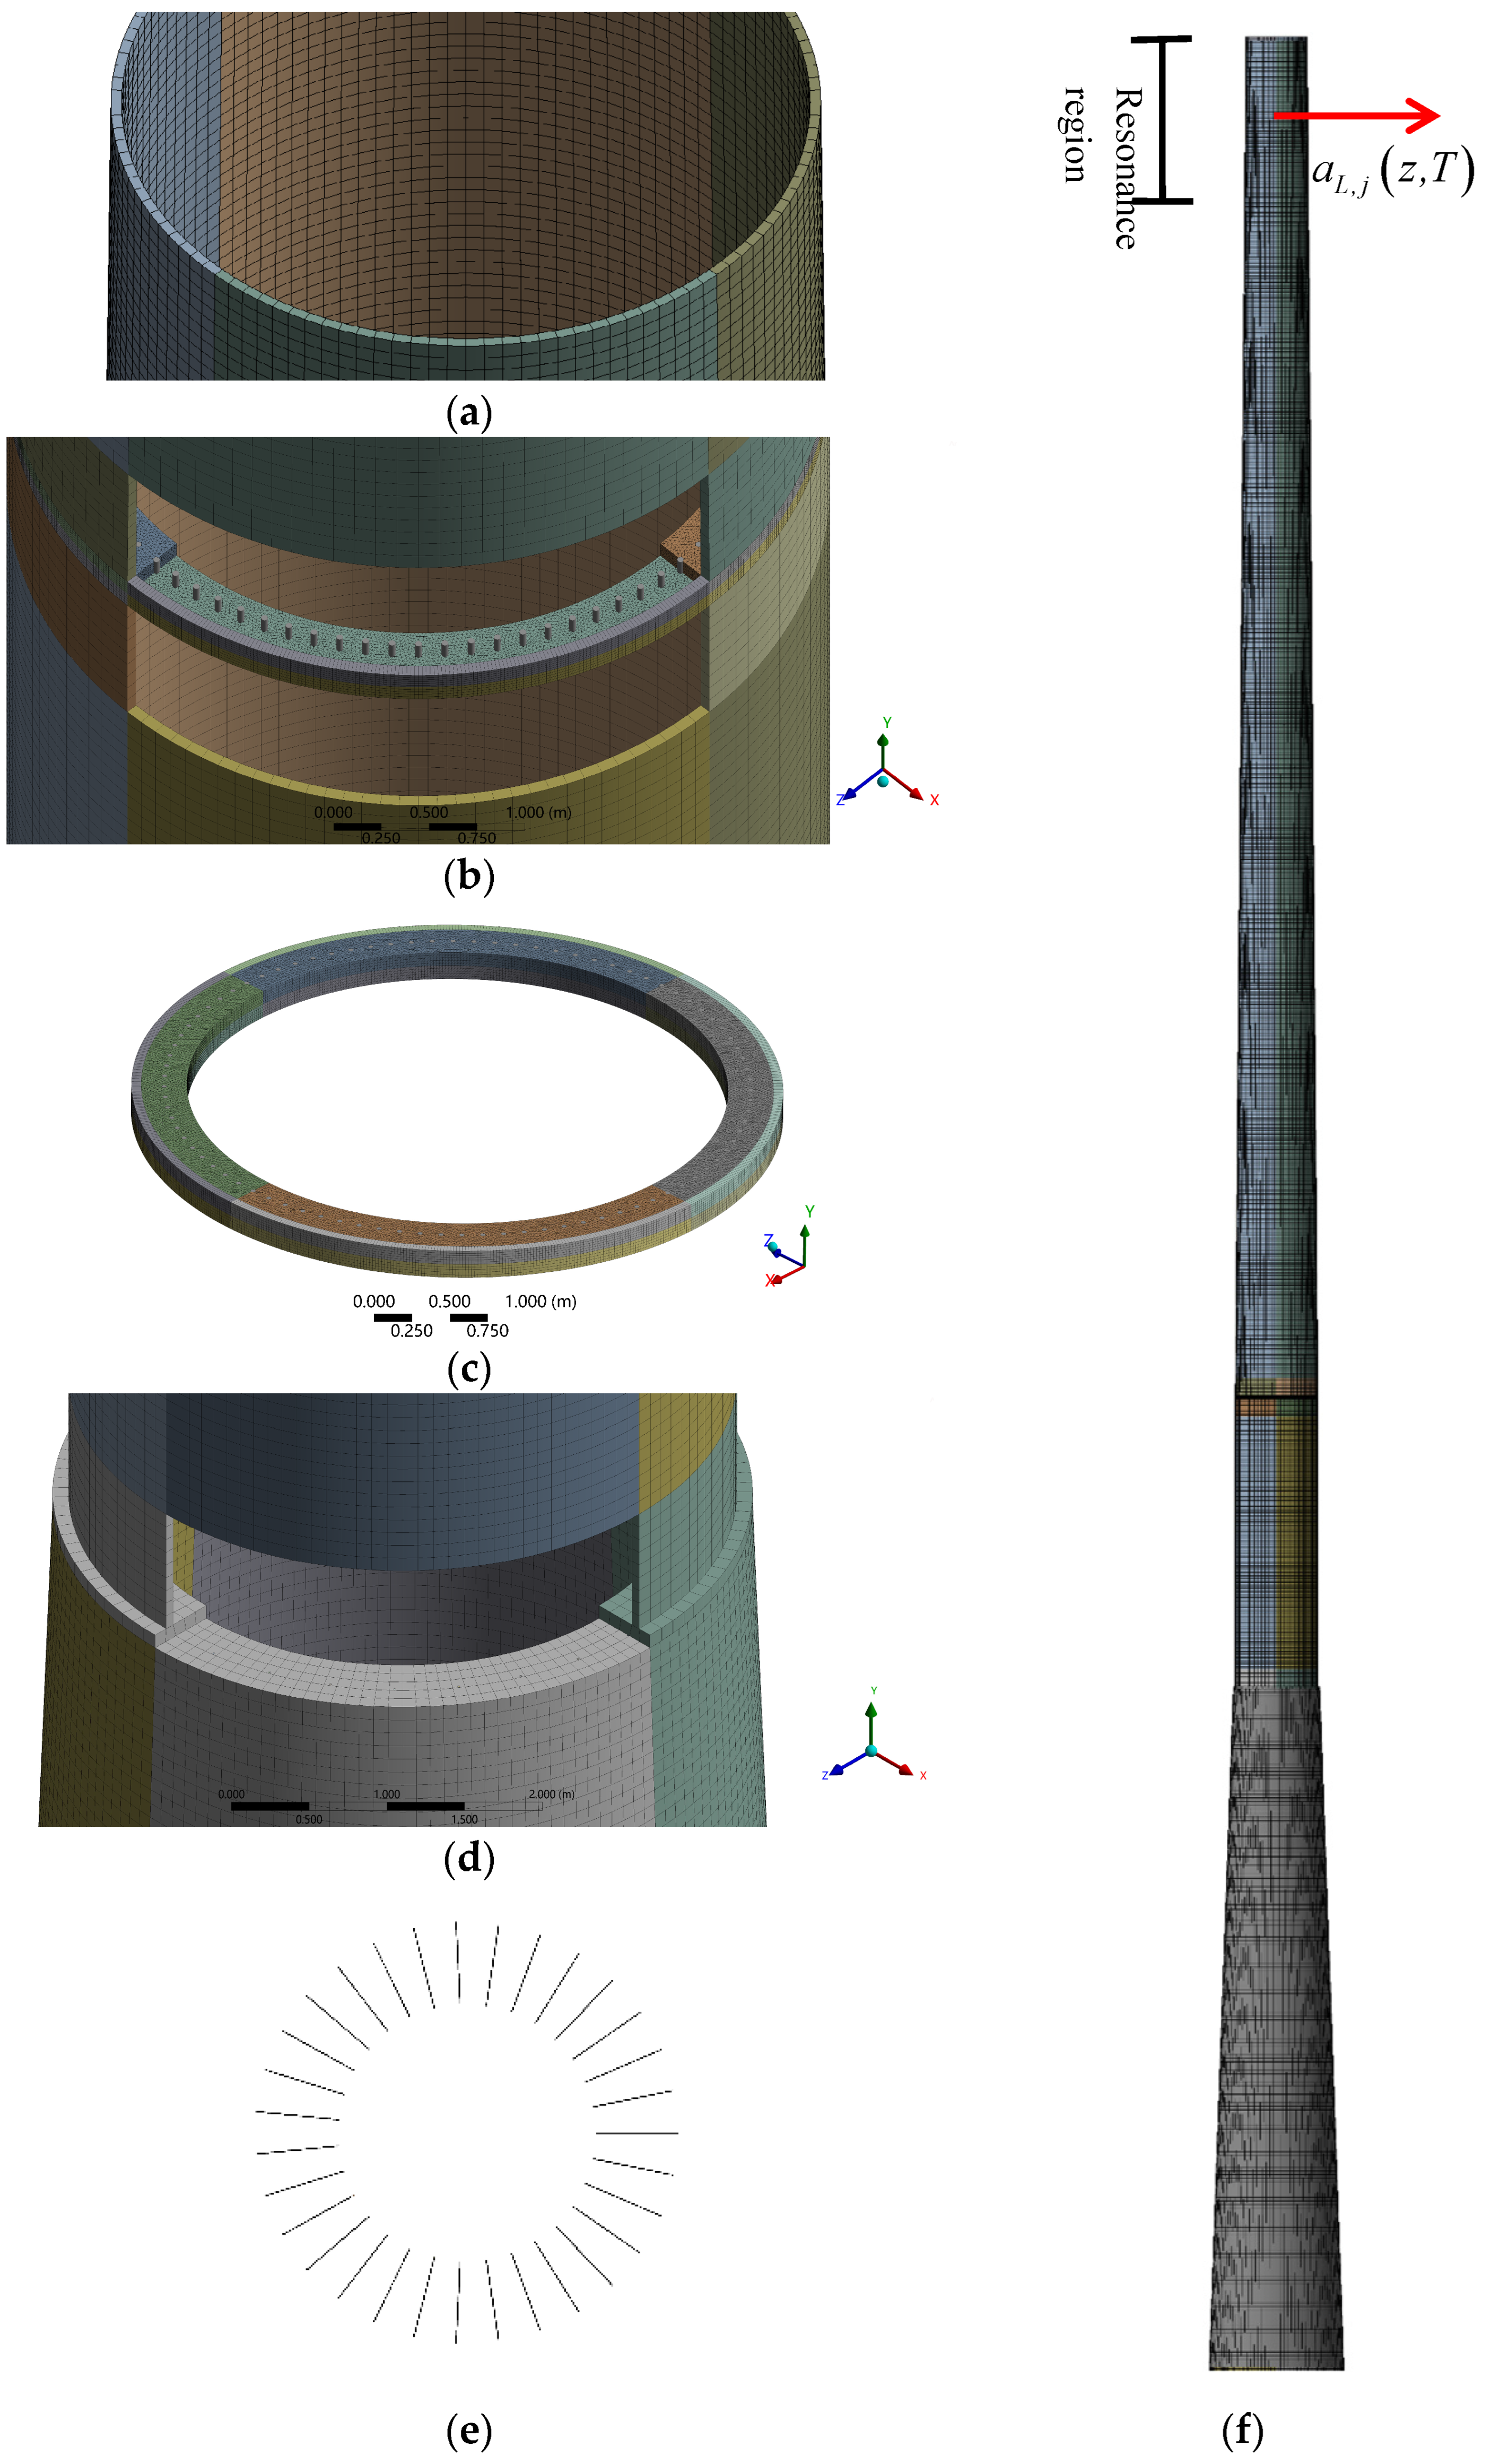
2. Finite Element Modeling and Modal Analysis of the Steel–Concrete Composite Wind Turbine Tower
3. Wind Loads and Static Bearing Capacity of the Steel–Concrete Composite Wind Turbine Tower
3.1. Wind Loads on the Tower
3.1.1. Aerodynamic Loads of the Blades
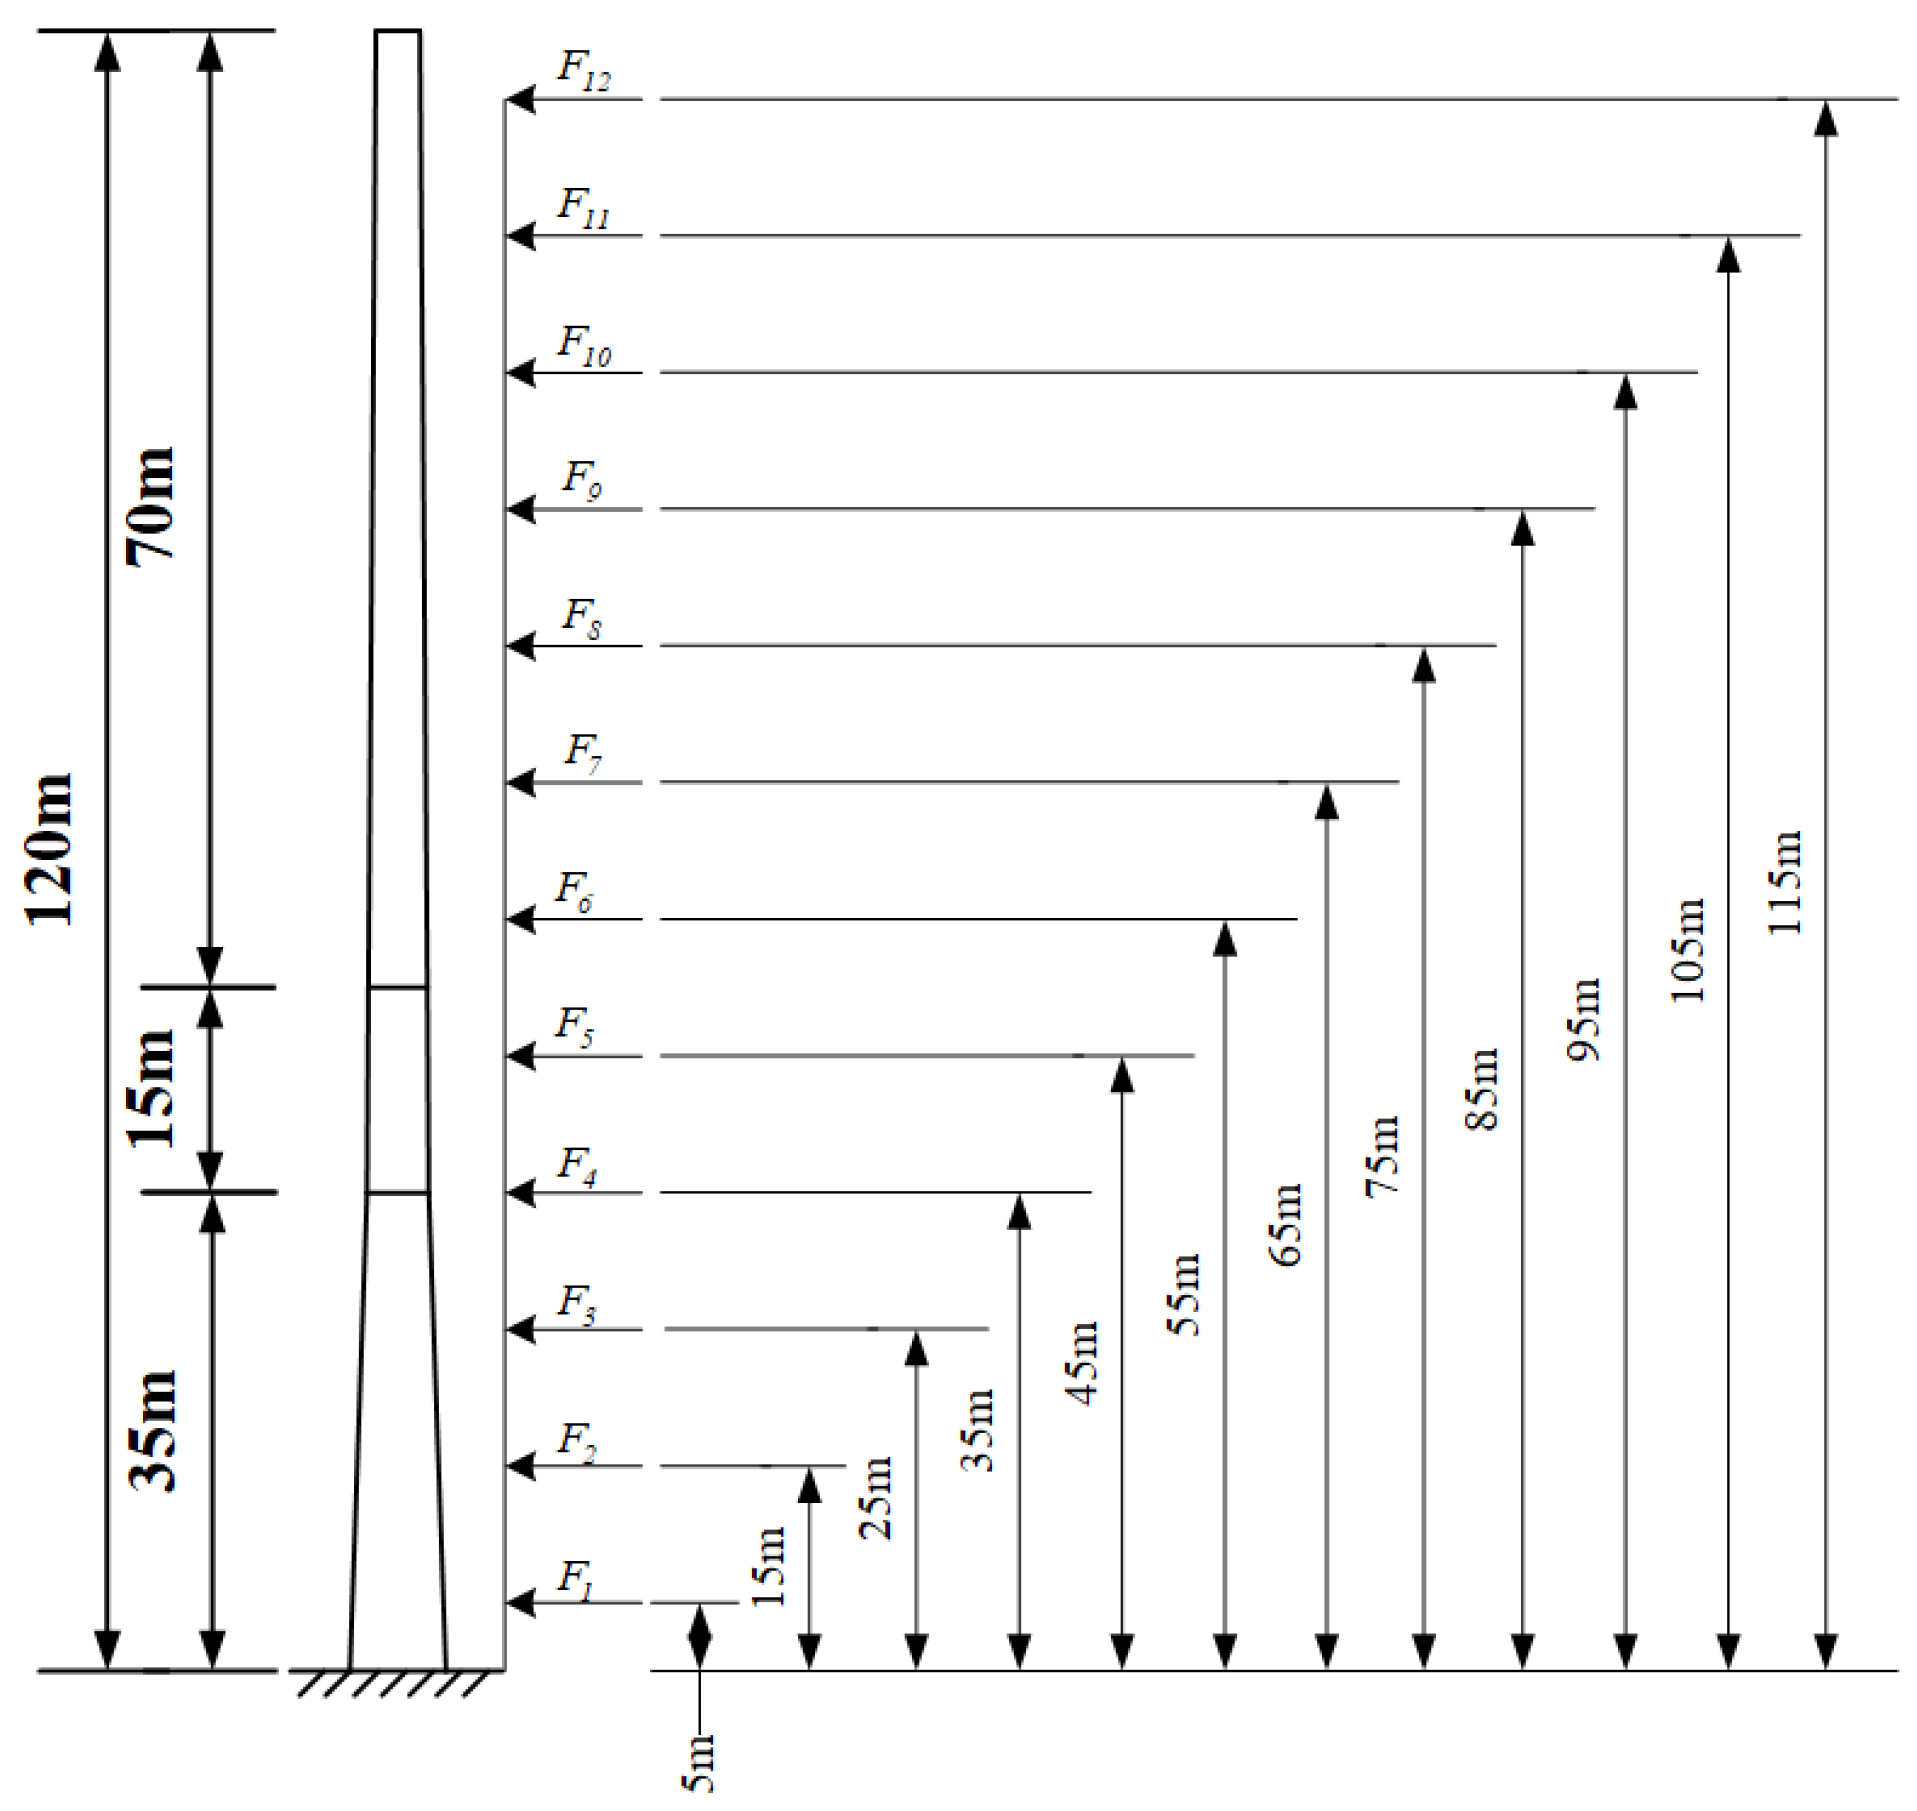
3.1.2. Natural Wind Loads
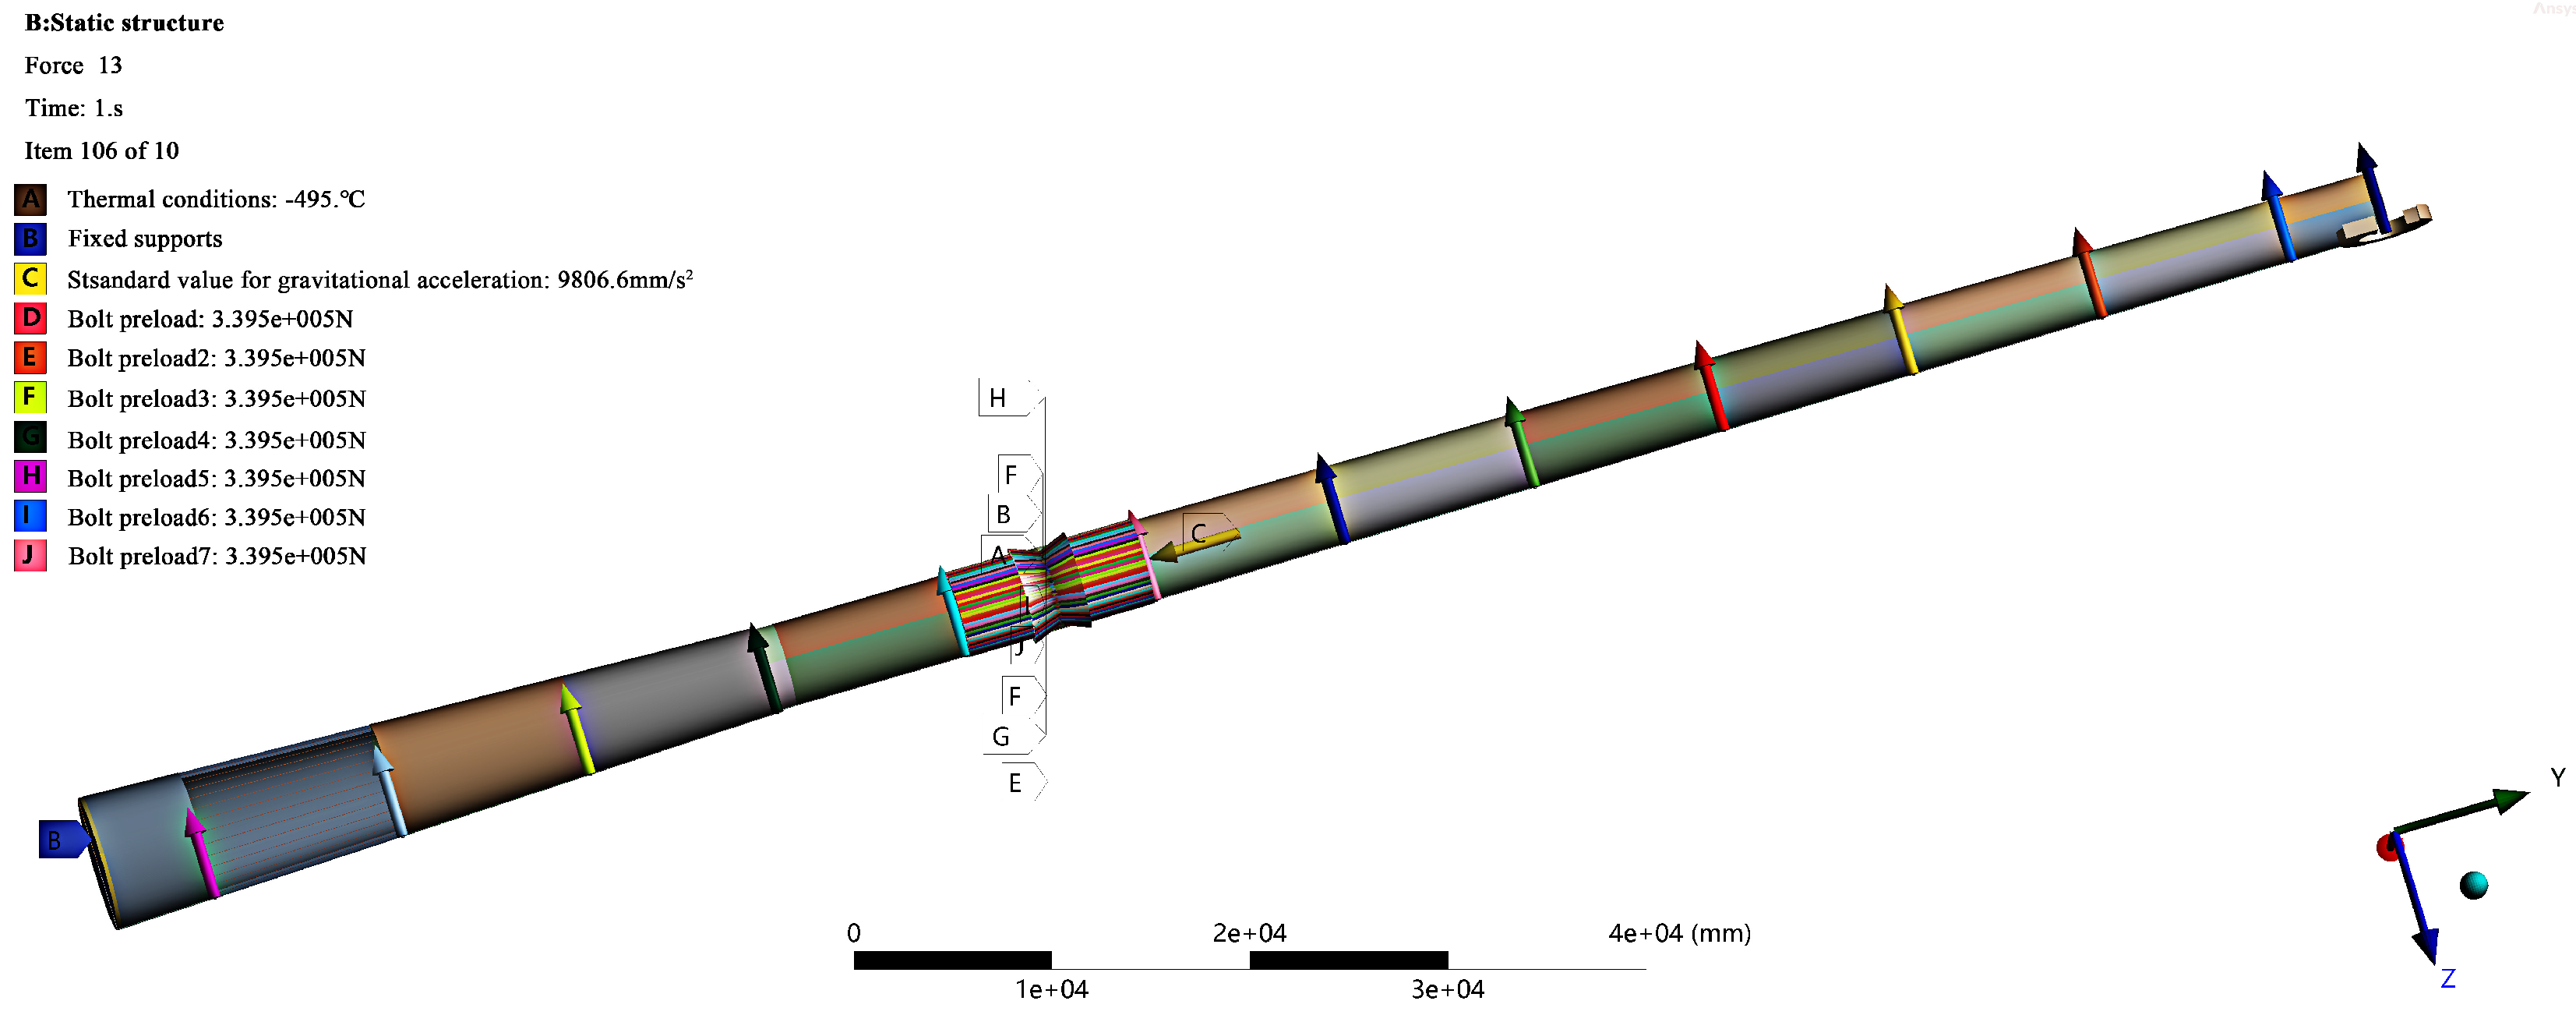
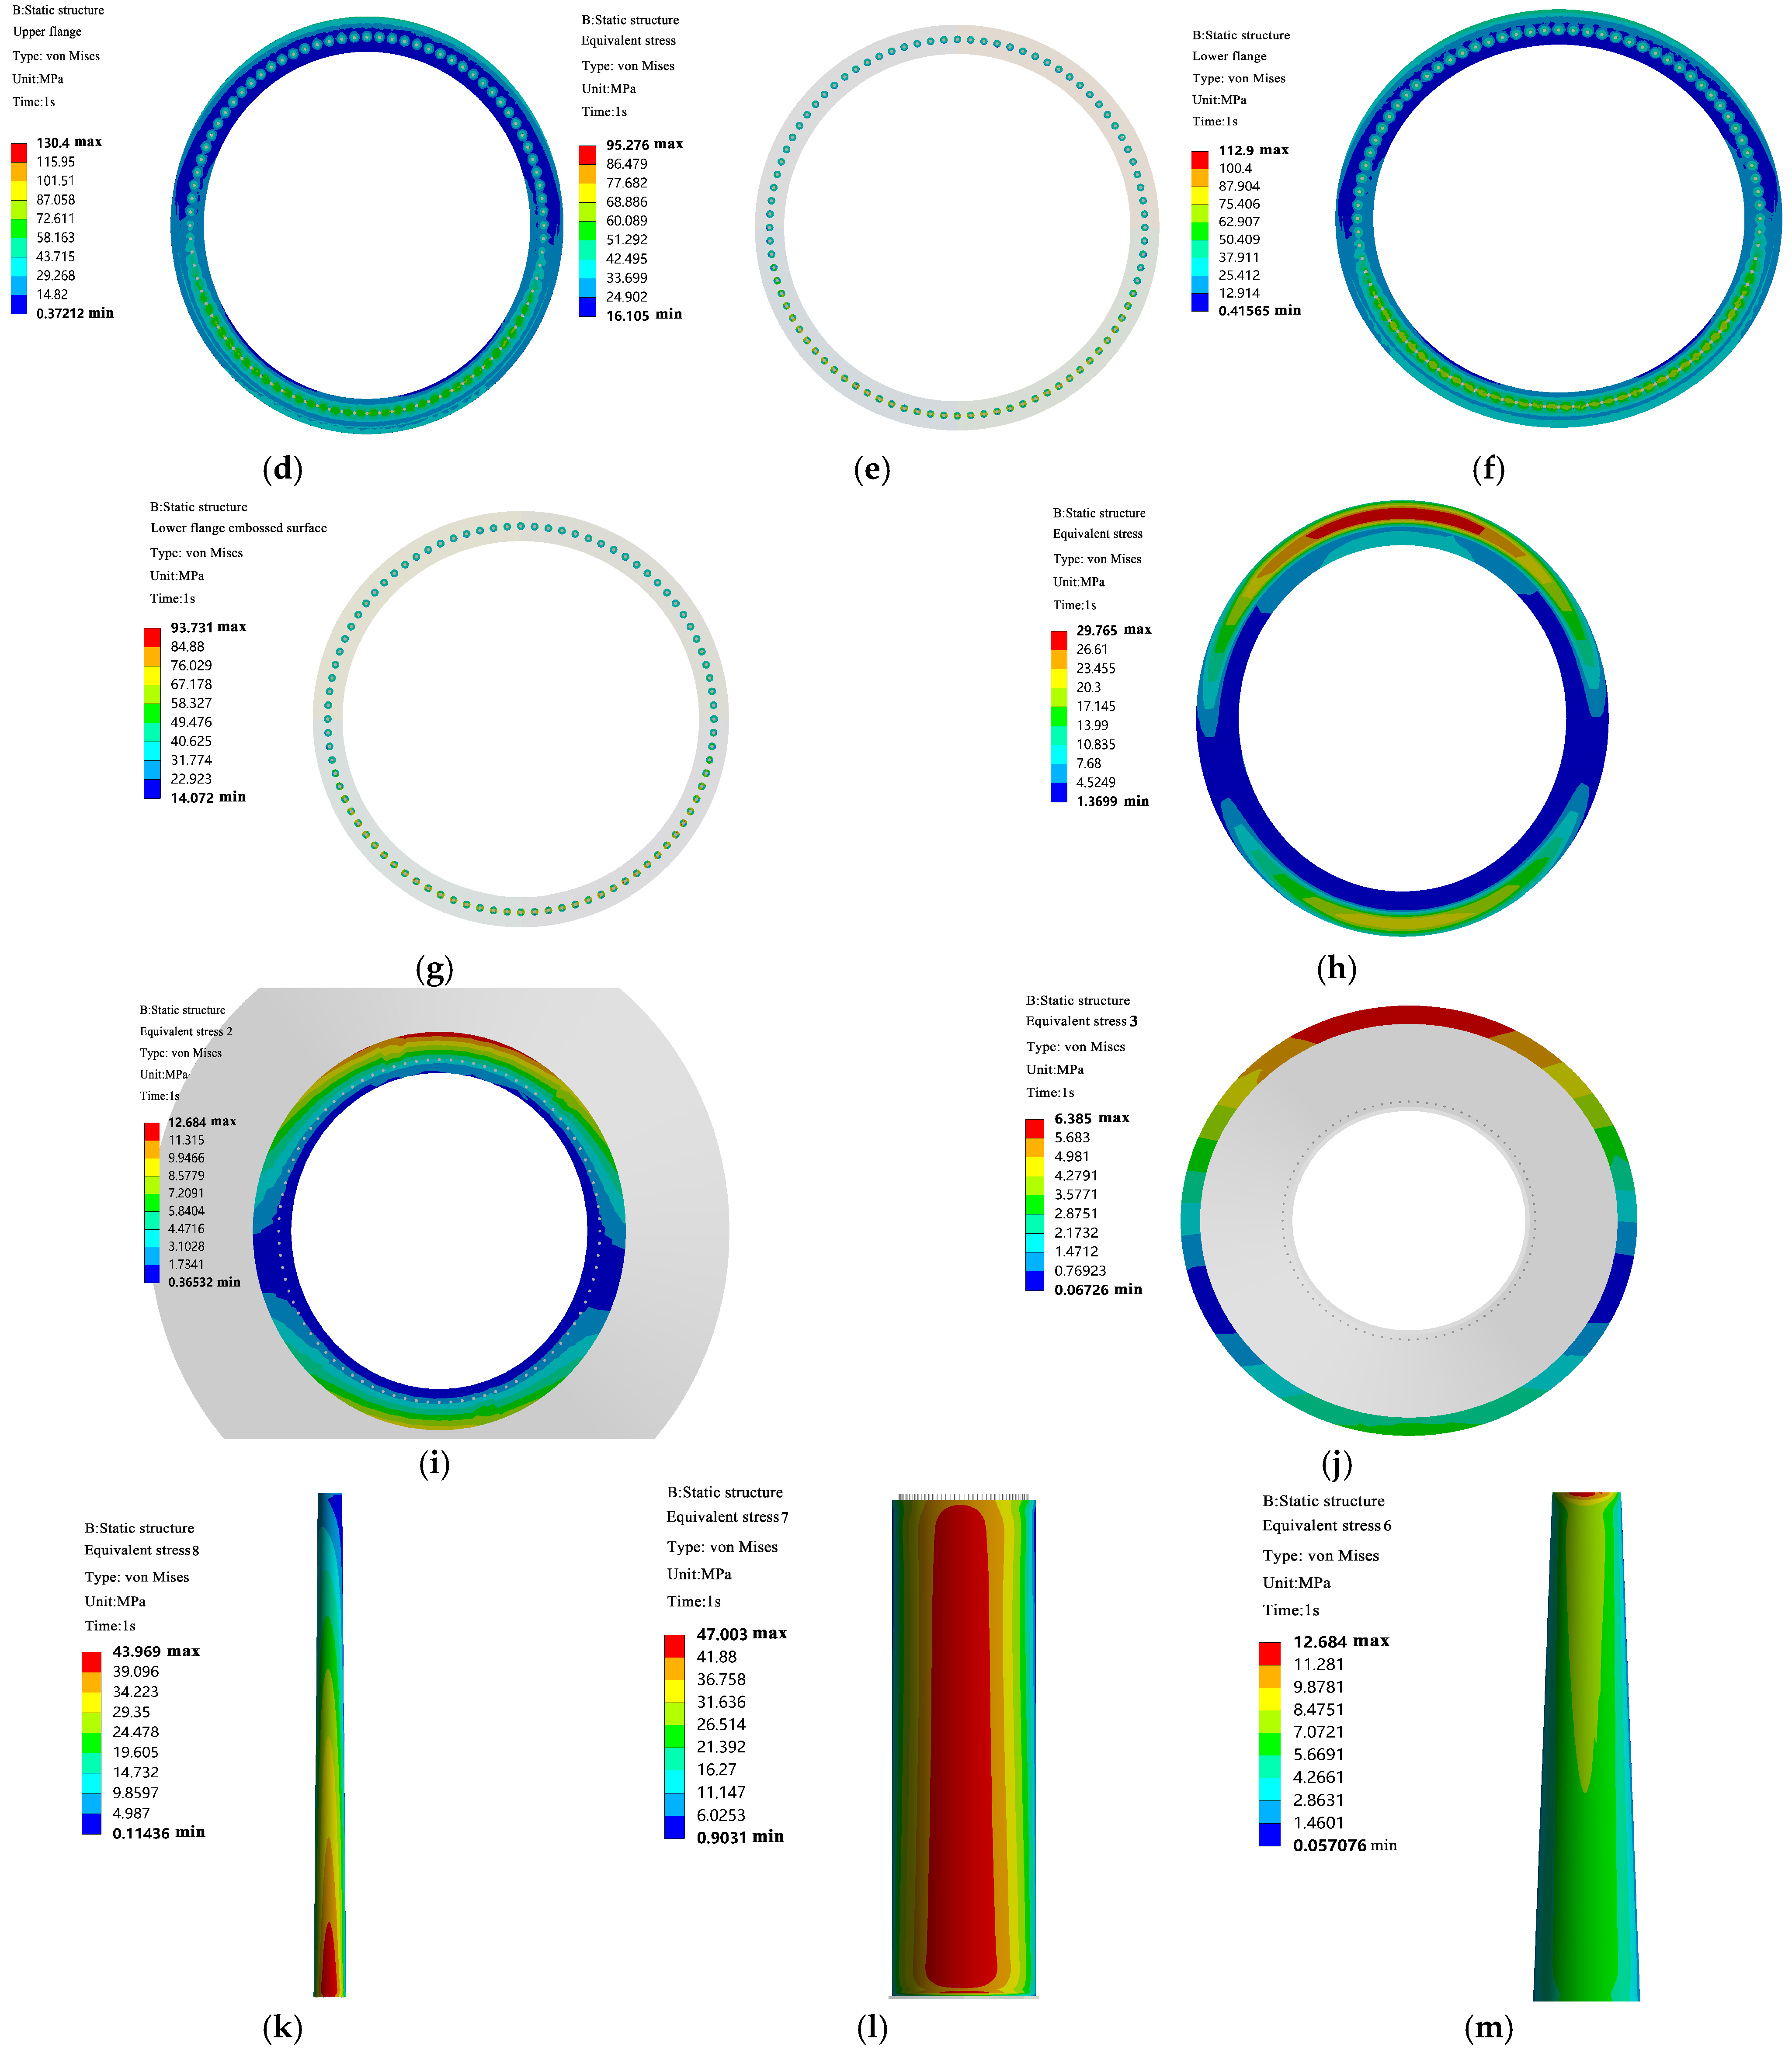
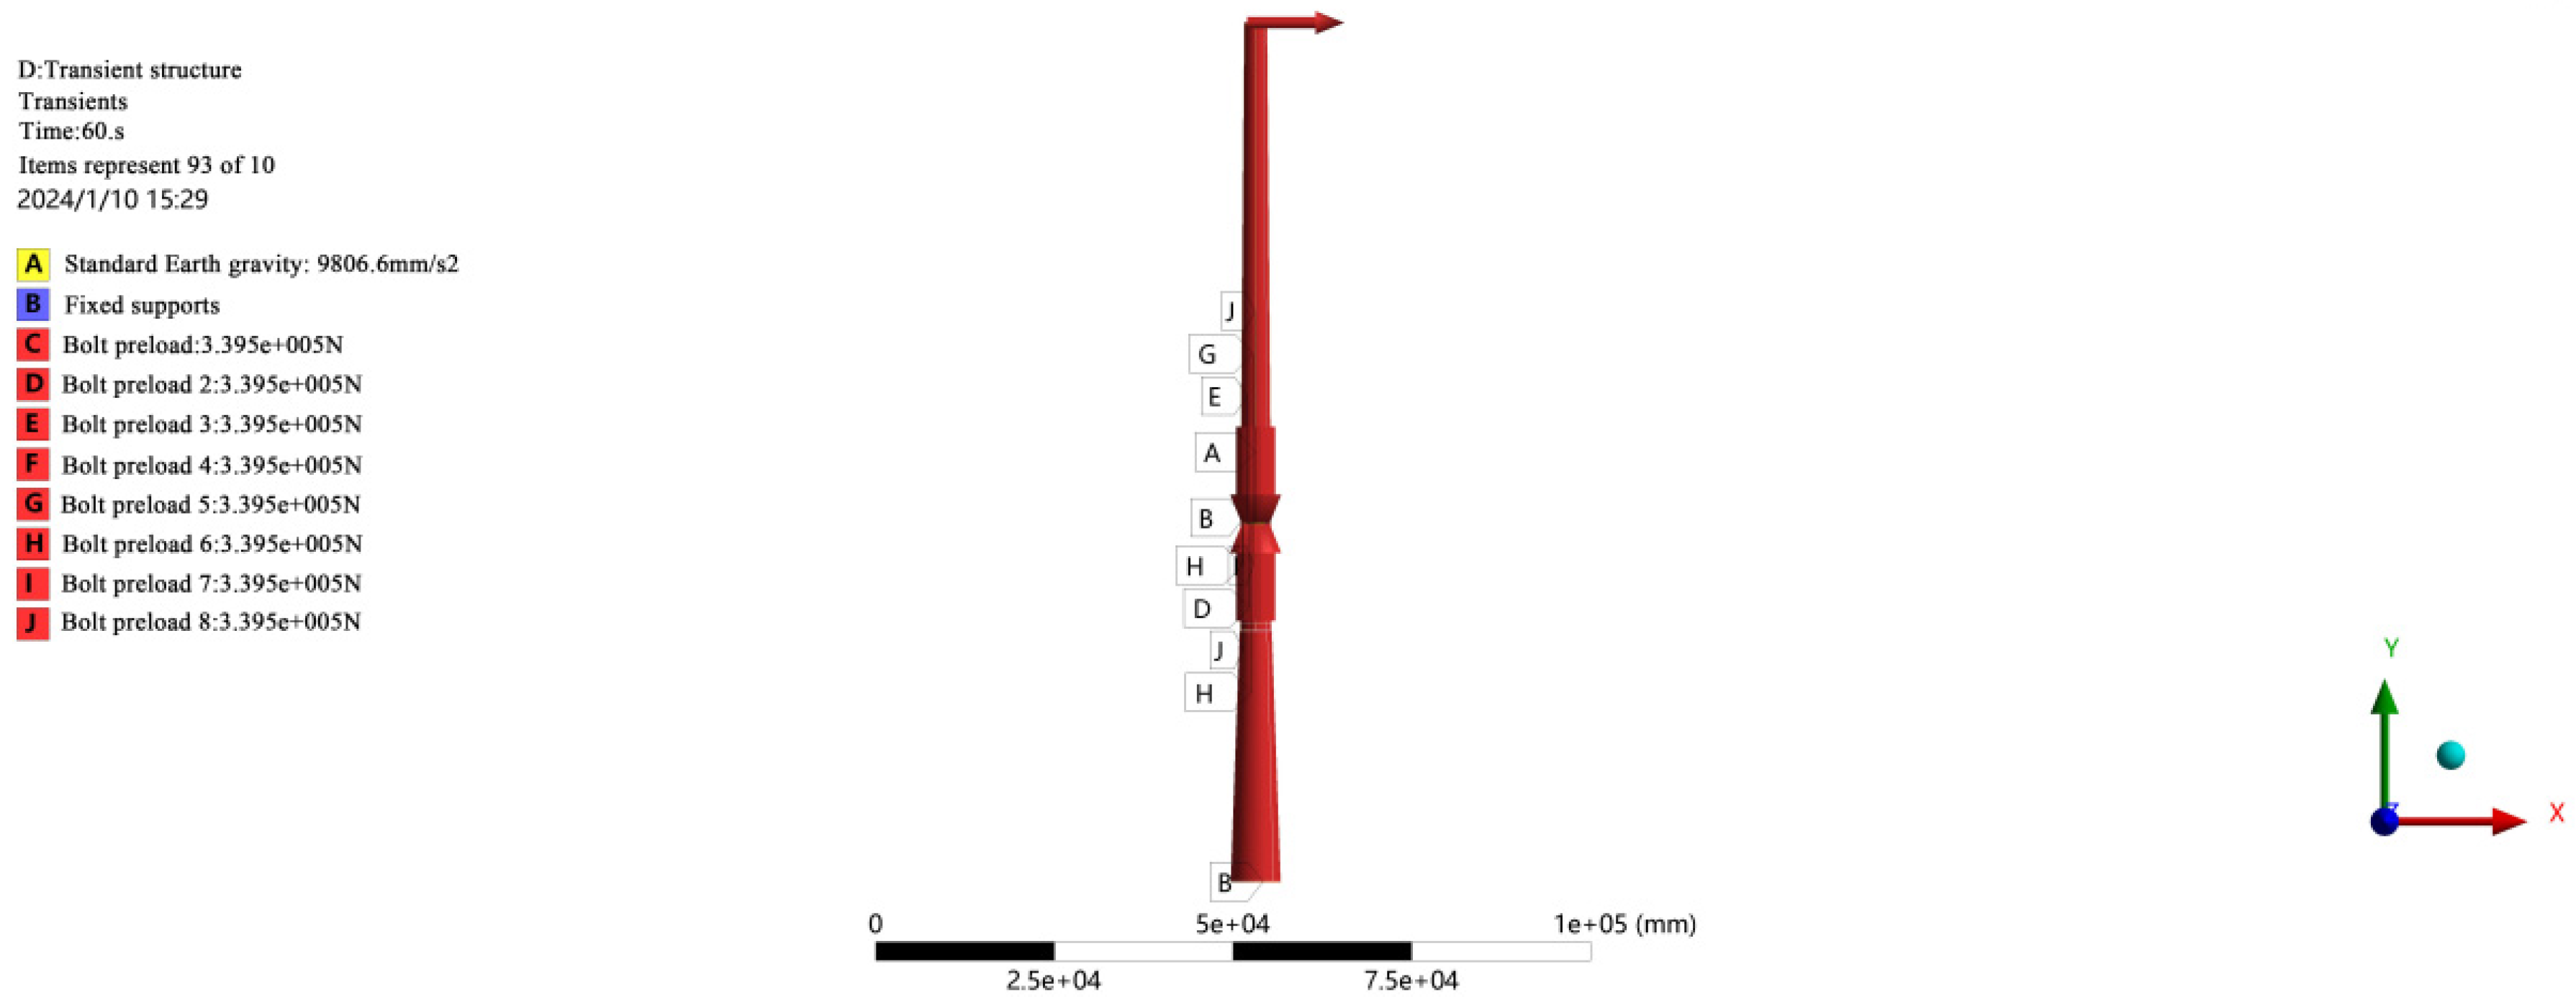
3.2. Static Bearing Capacity
4. Dynamic Response Analysis of the Steel–Concrete Composite Wind Turbine Tower Based on the Fluid–Structure Interaction Method
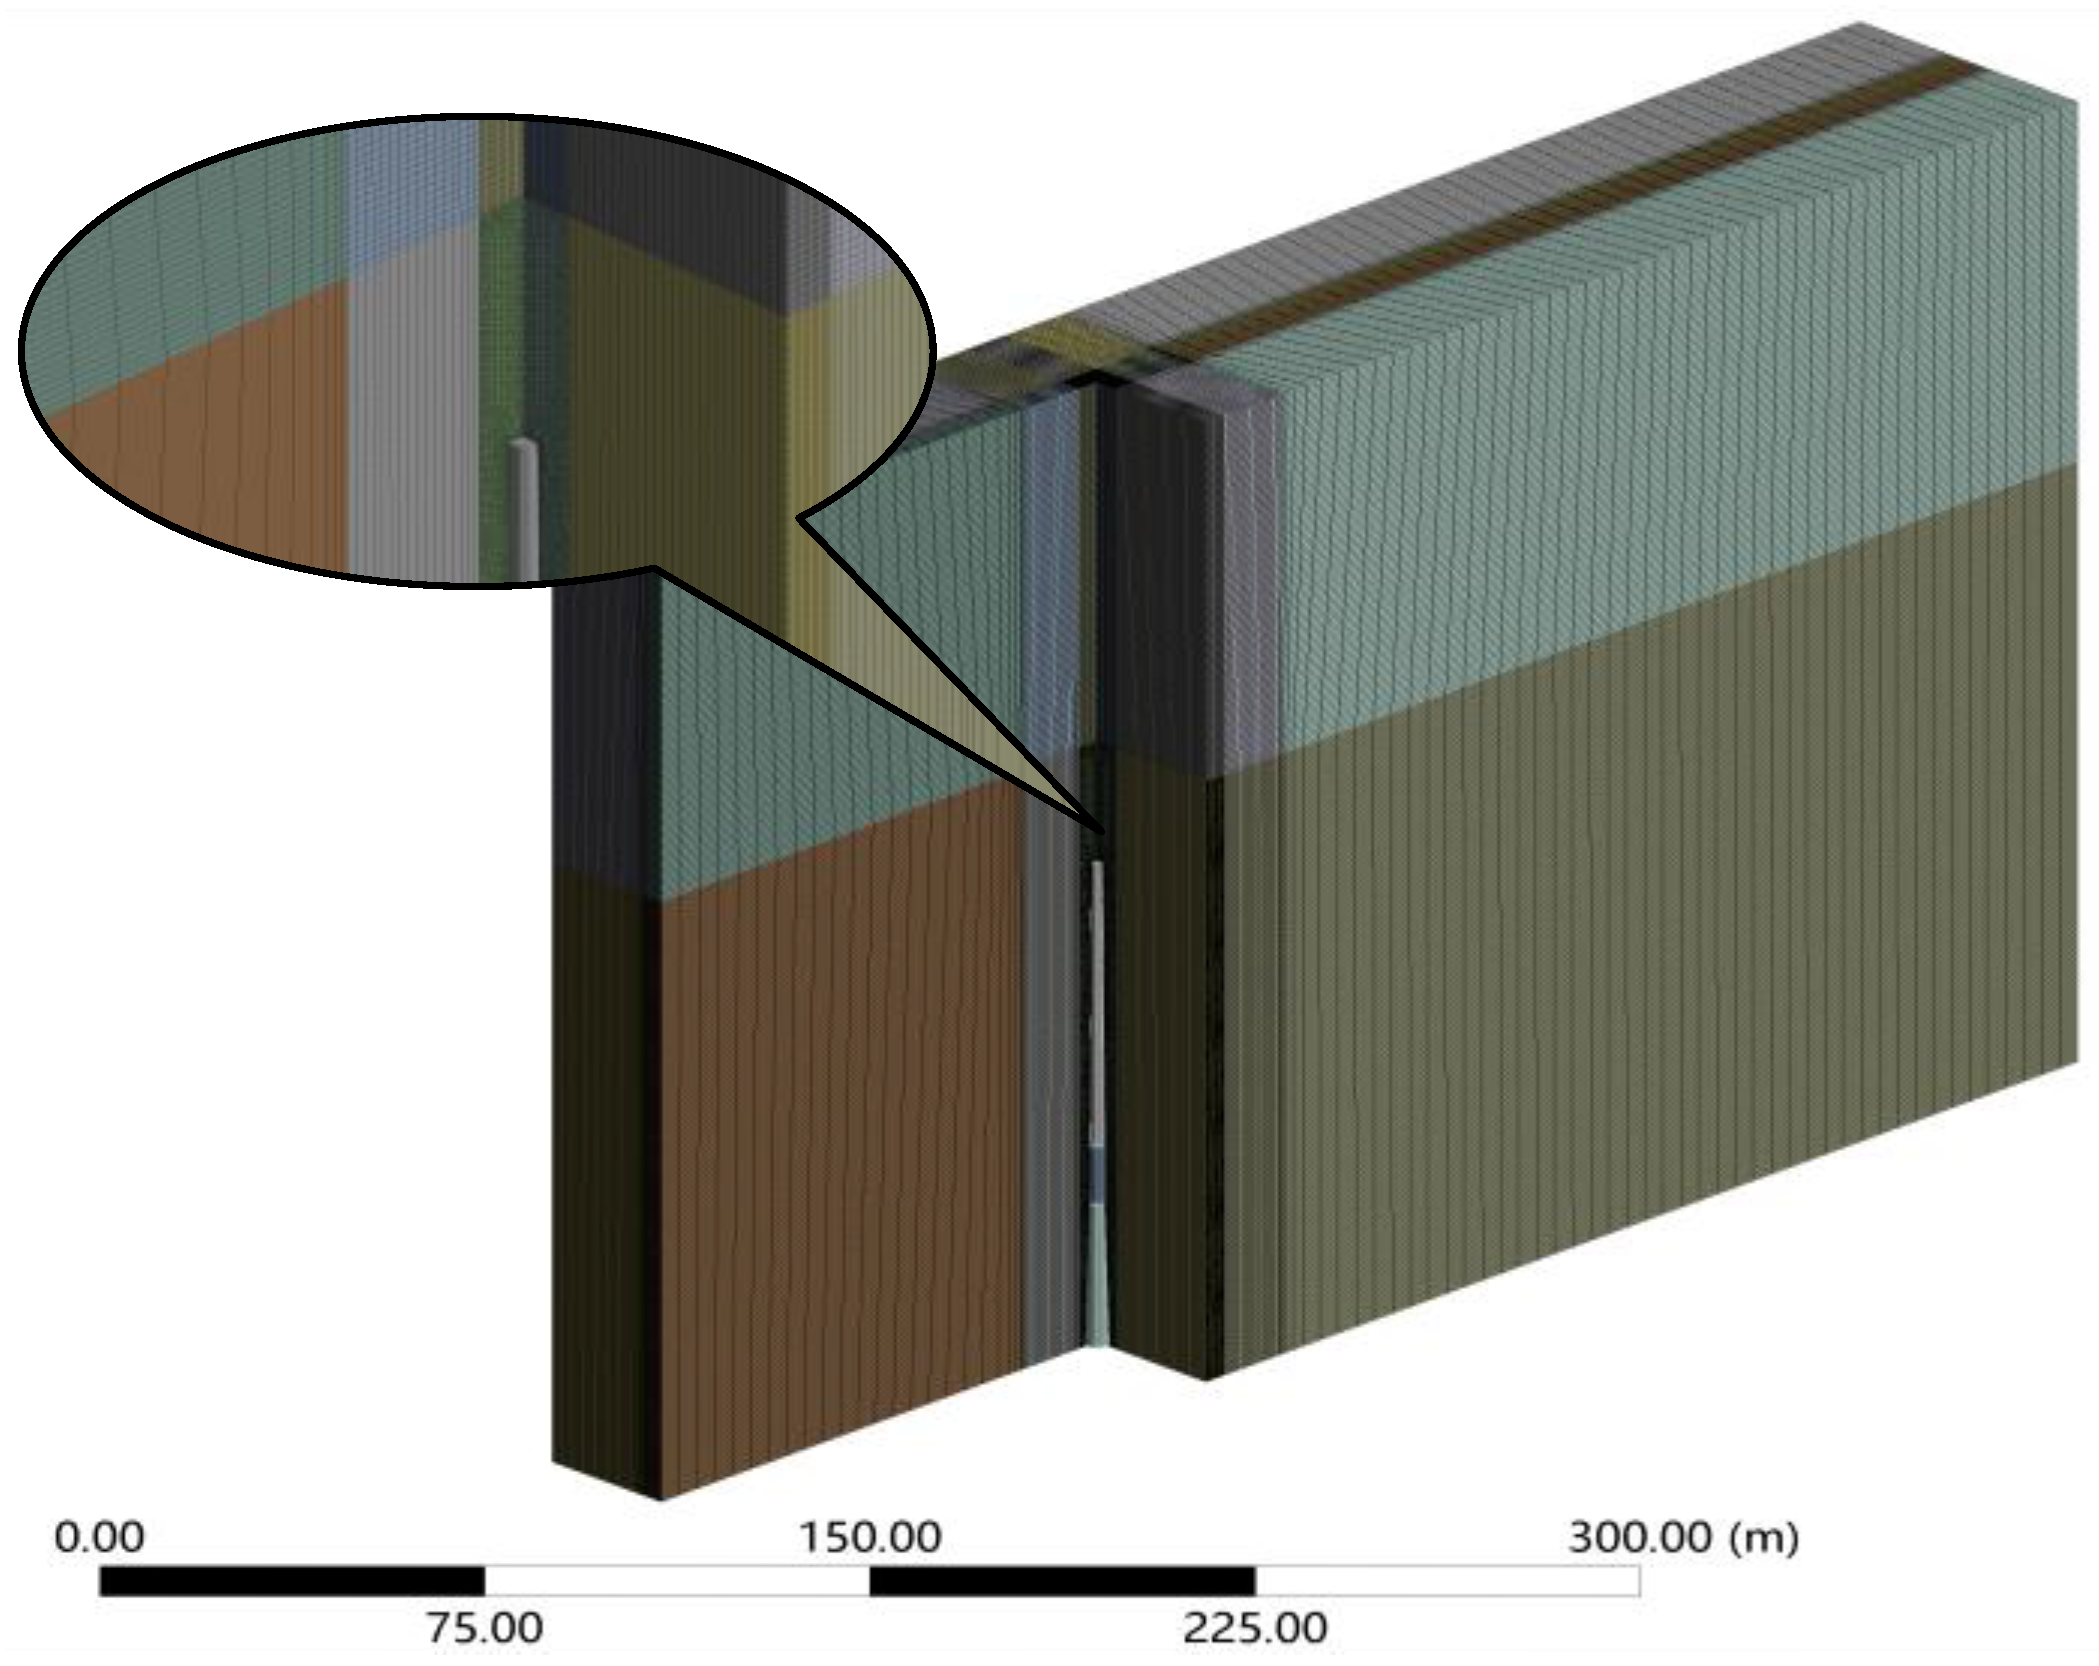
4.1. Fluid–Structure Interaction Model
4.2. Wind-Induced Time History Response of the Steel–Concrete Composite Wind Turbine Tower
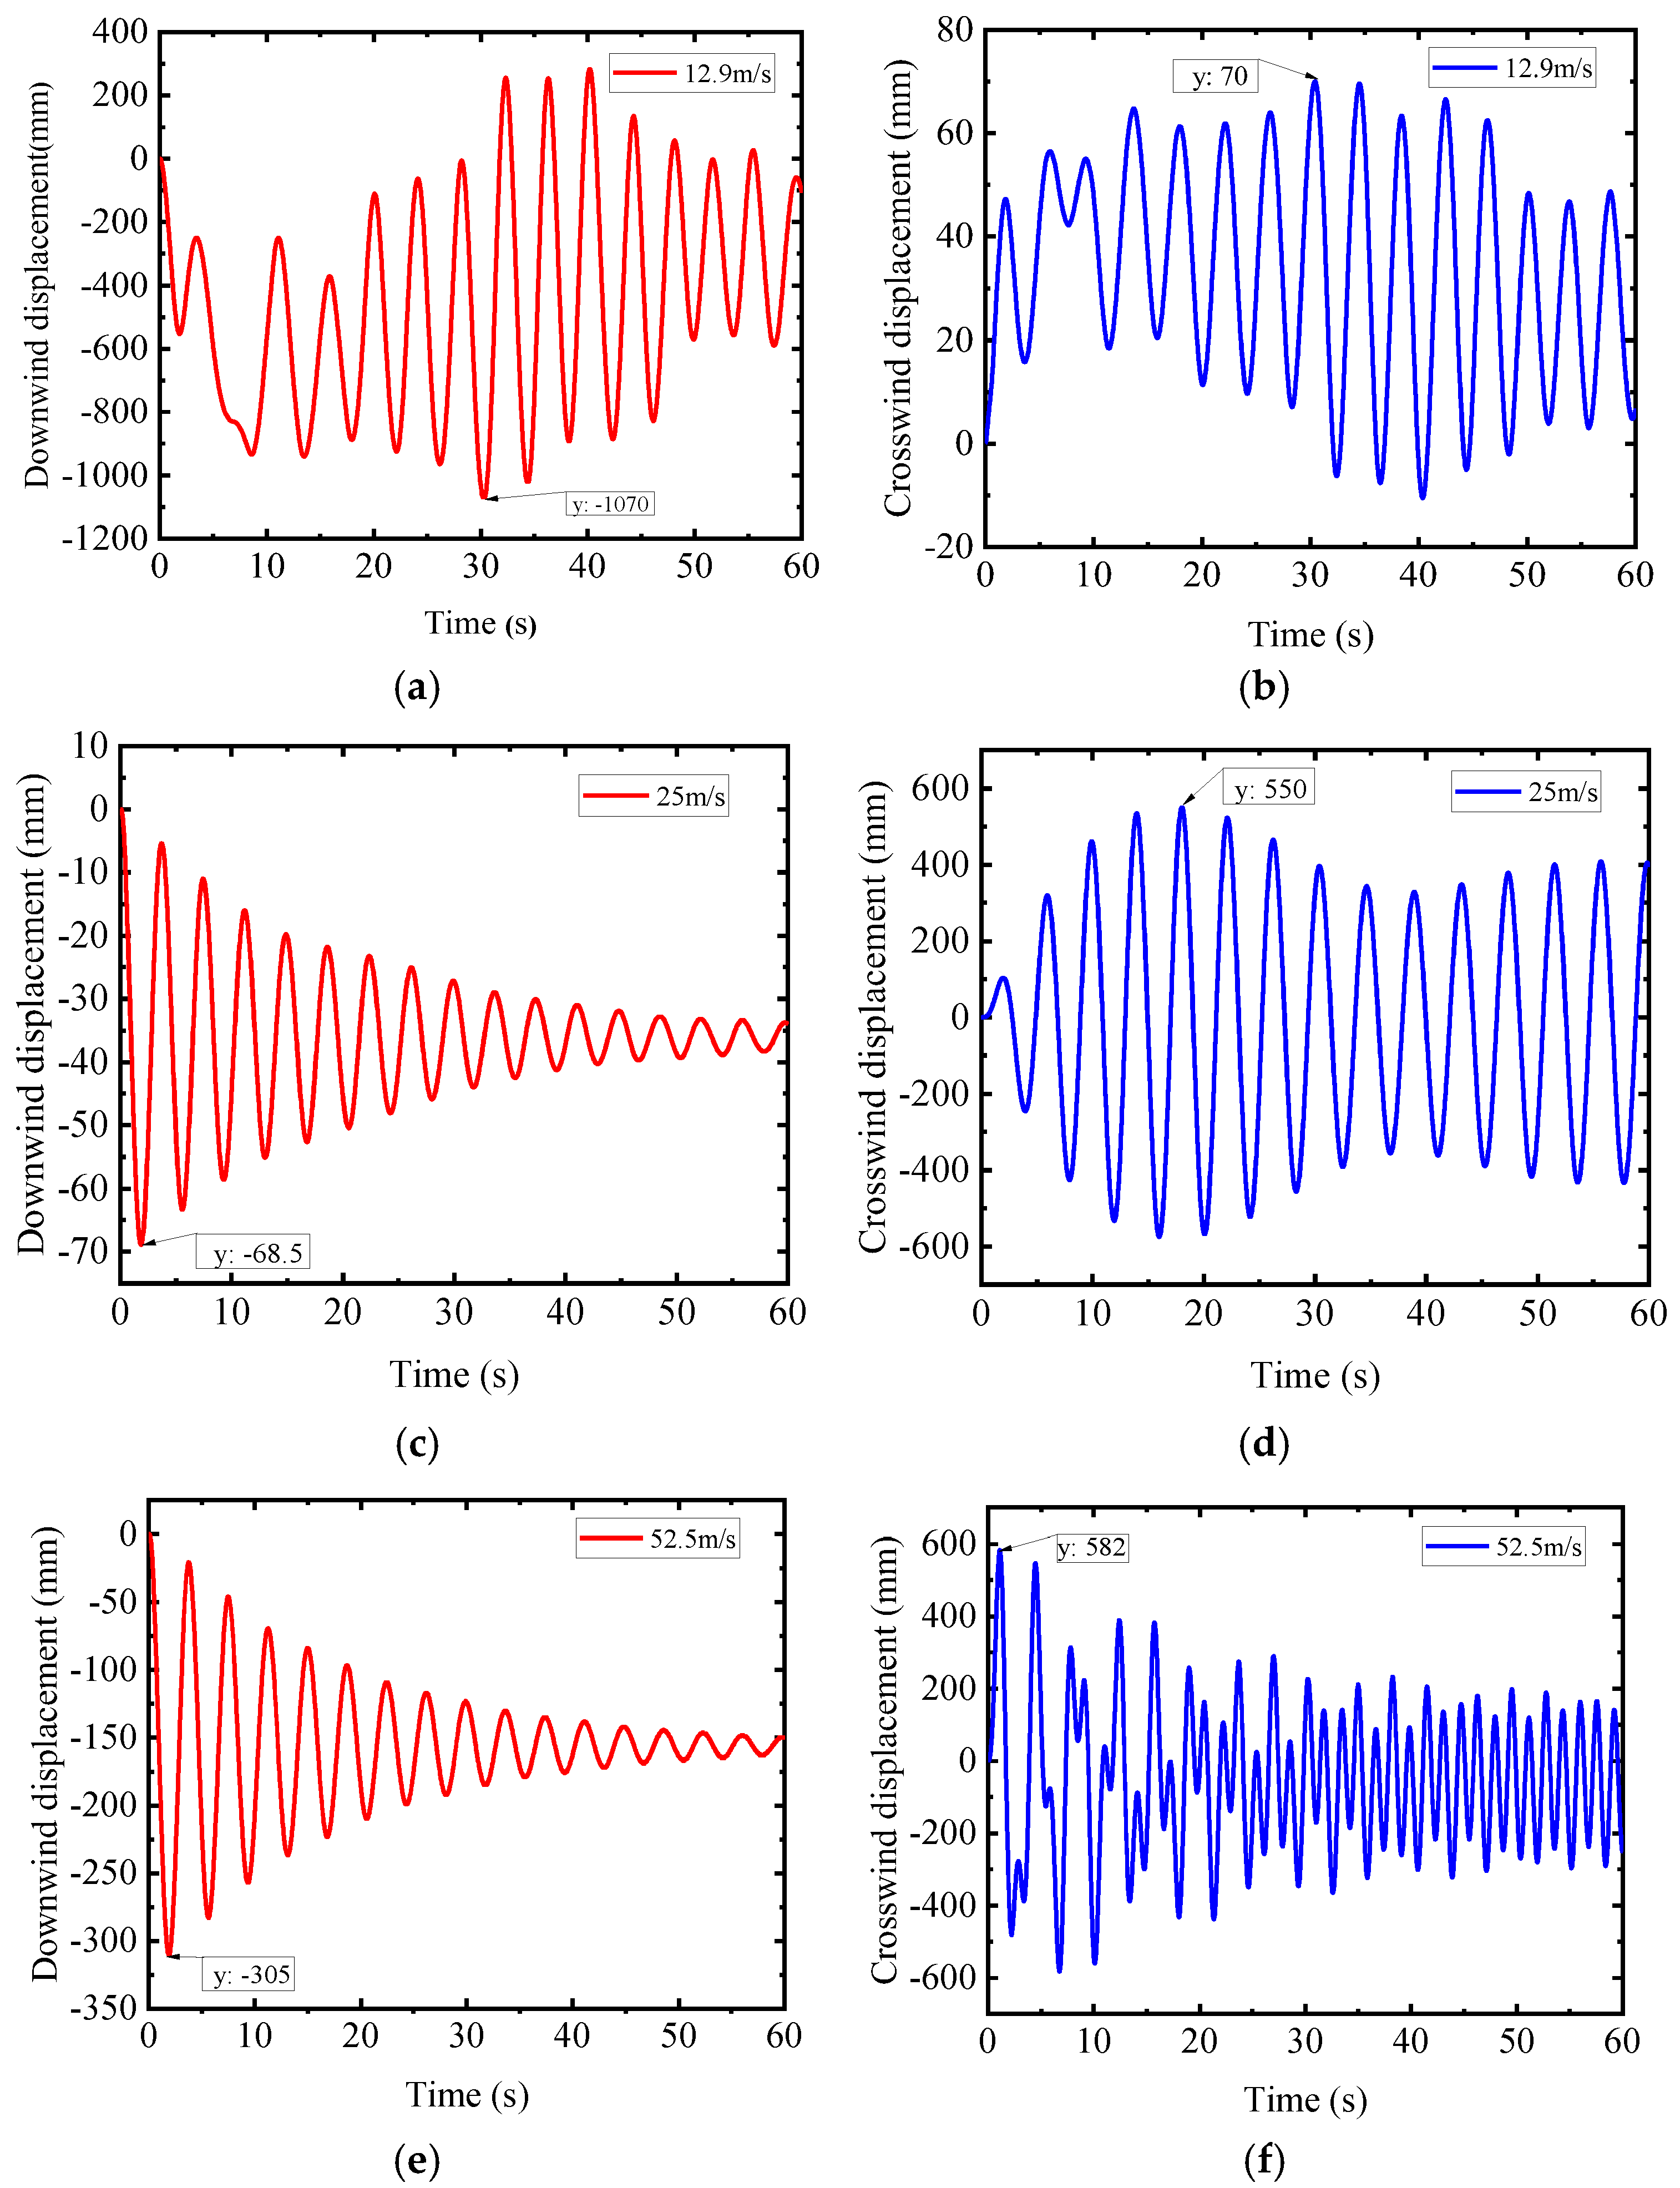
4.2.1. Time History of the Displacement at the Top of the Tower
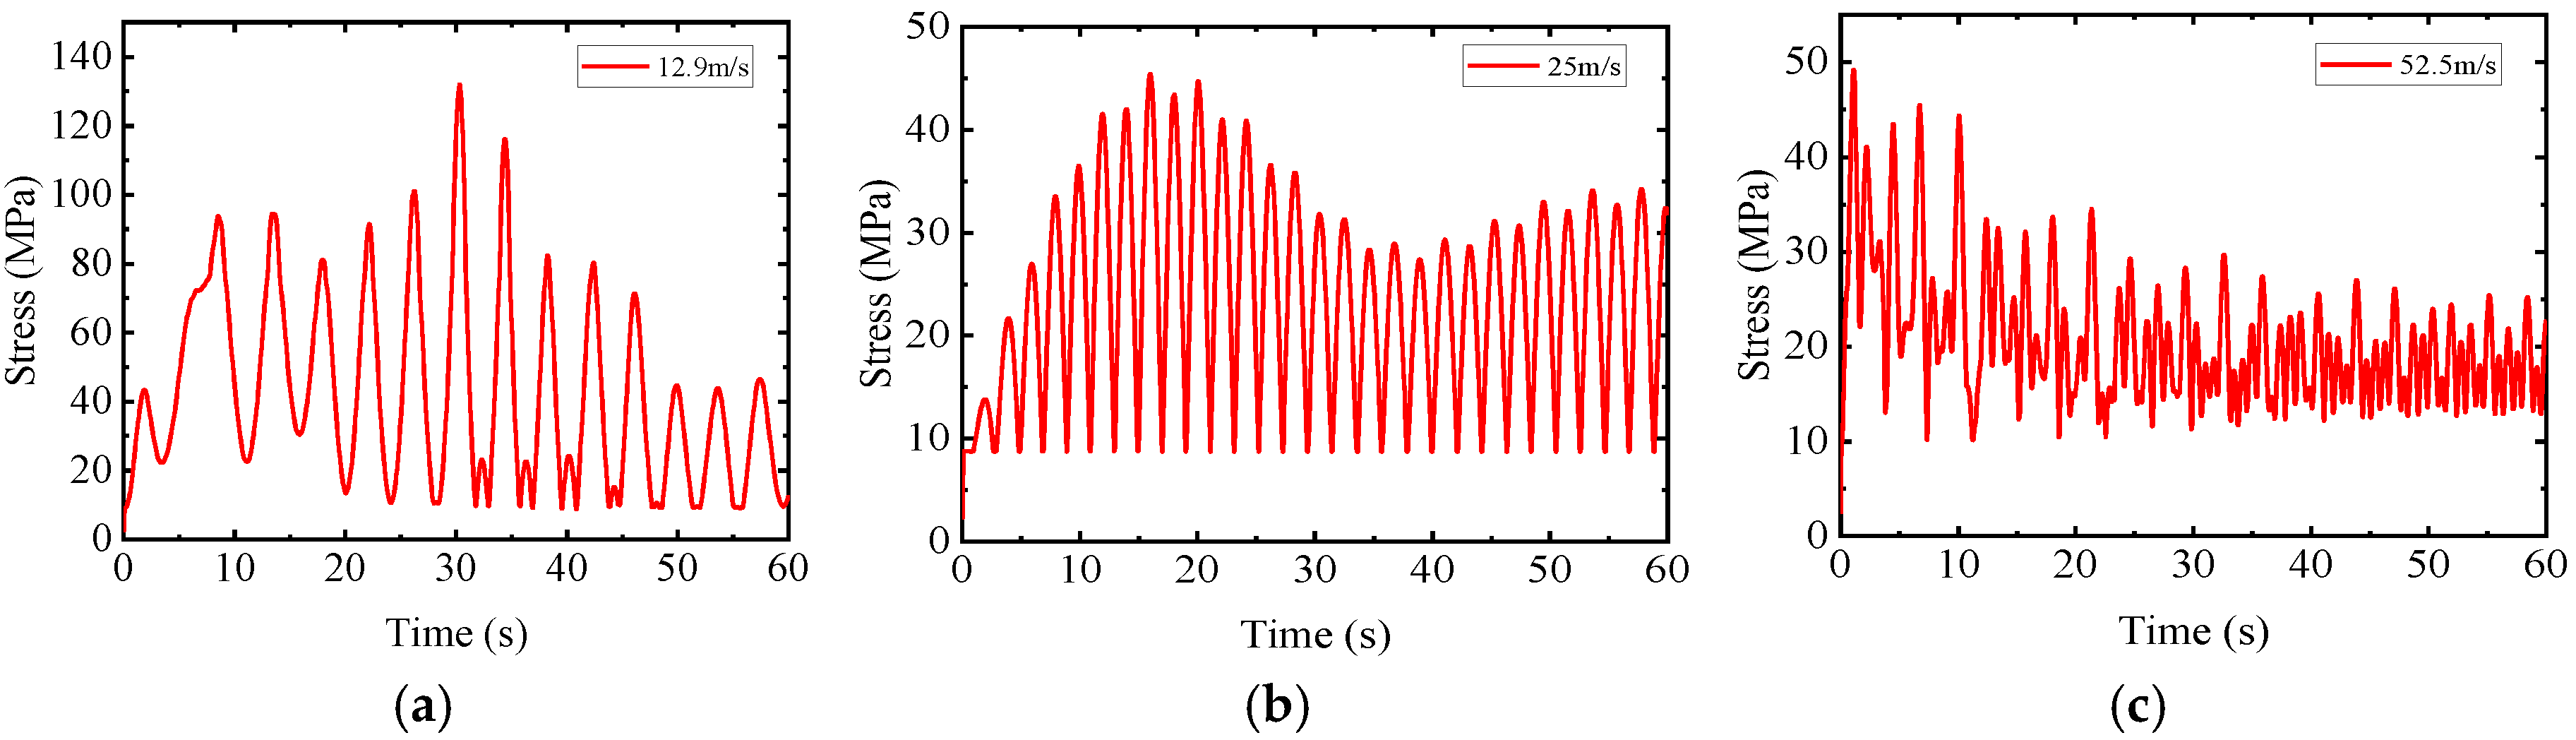
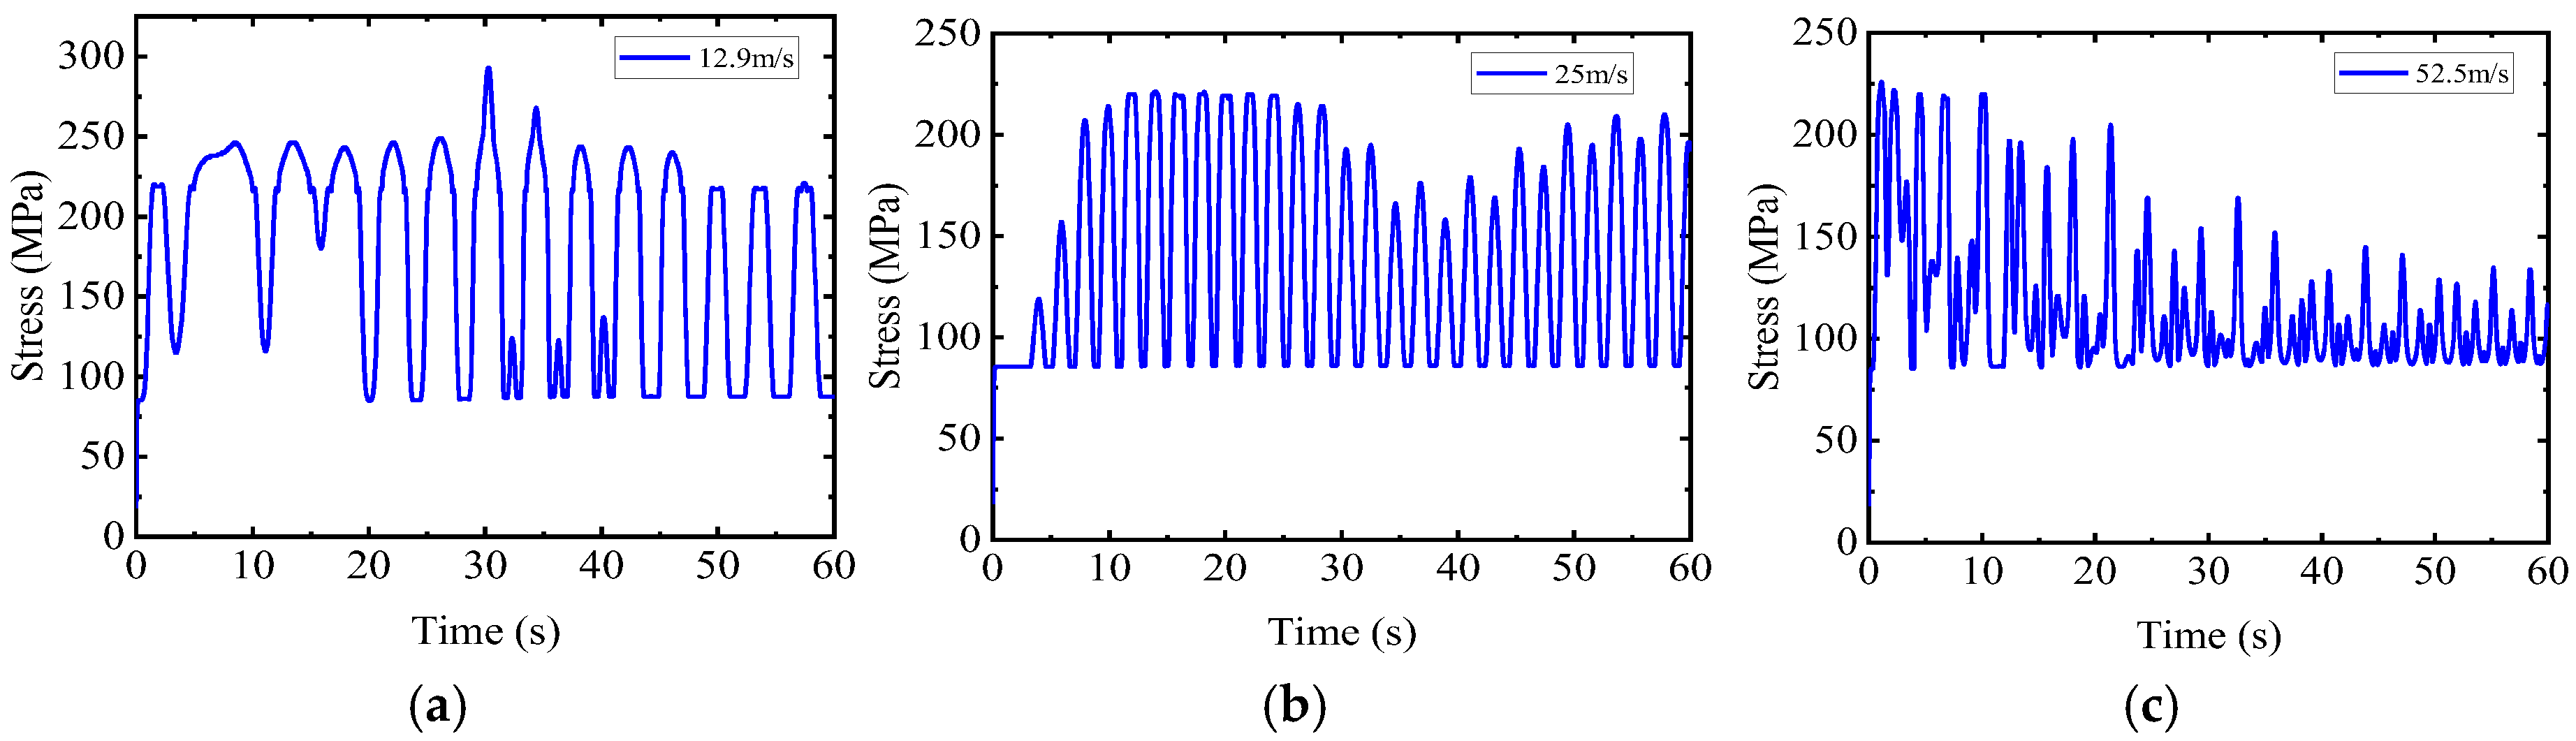
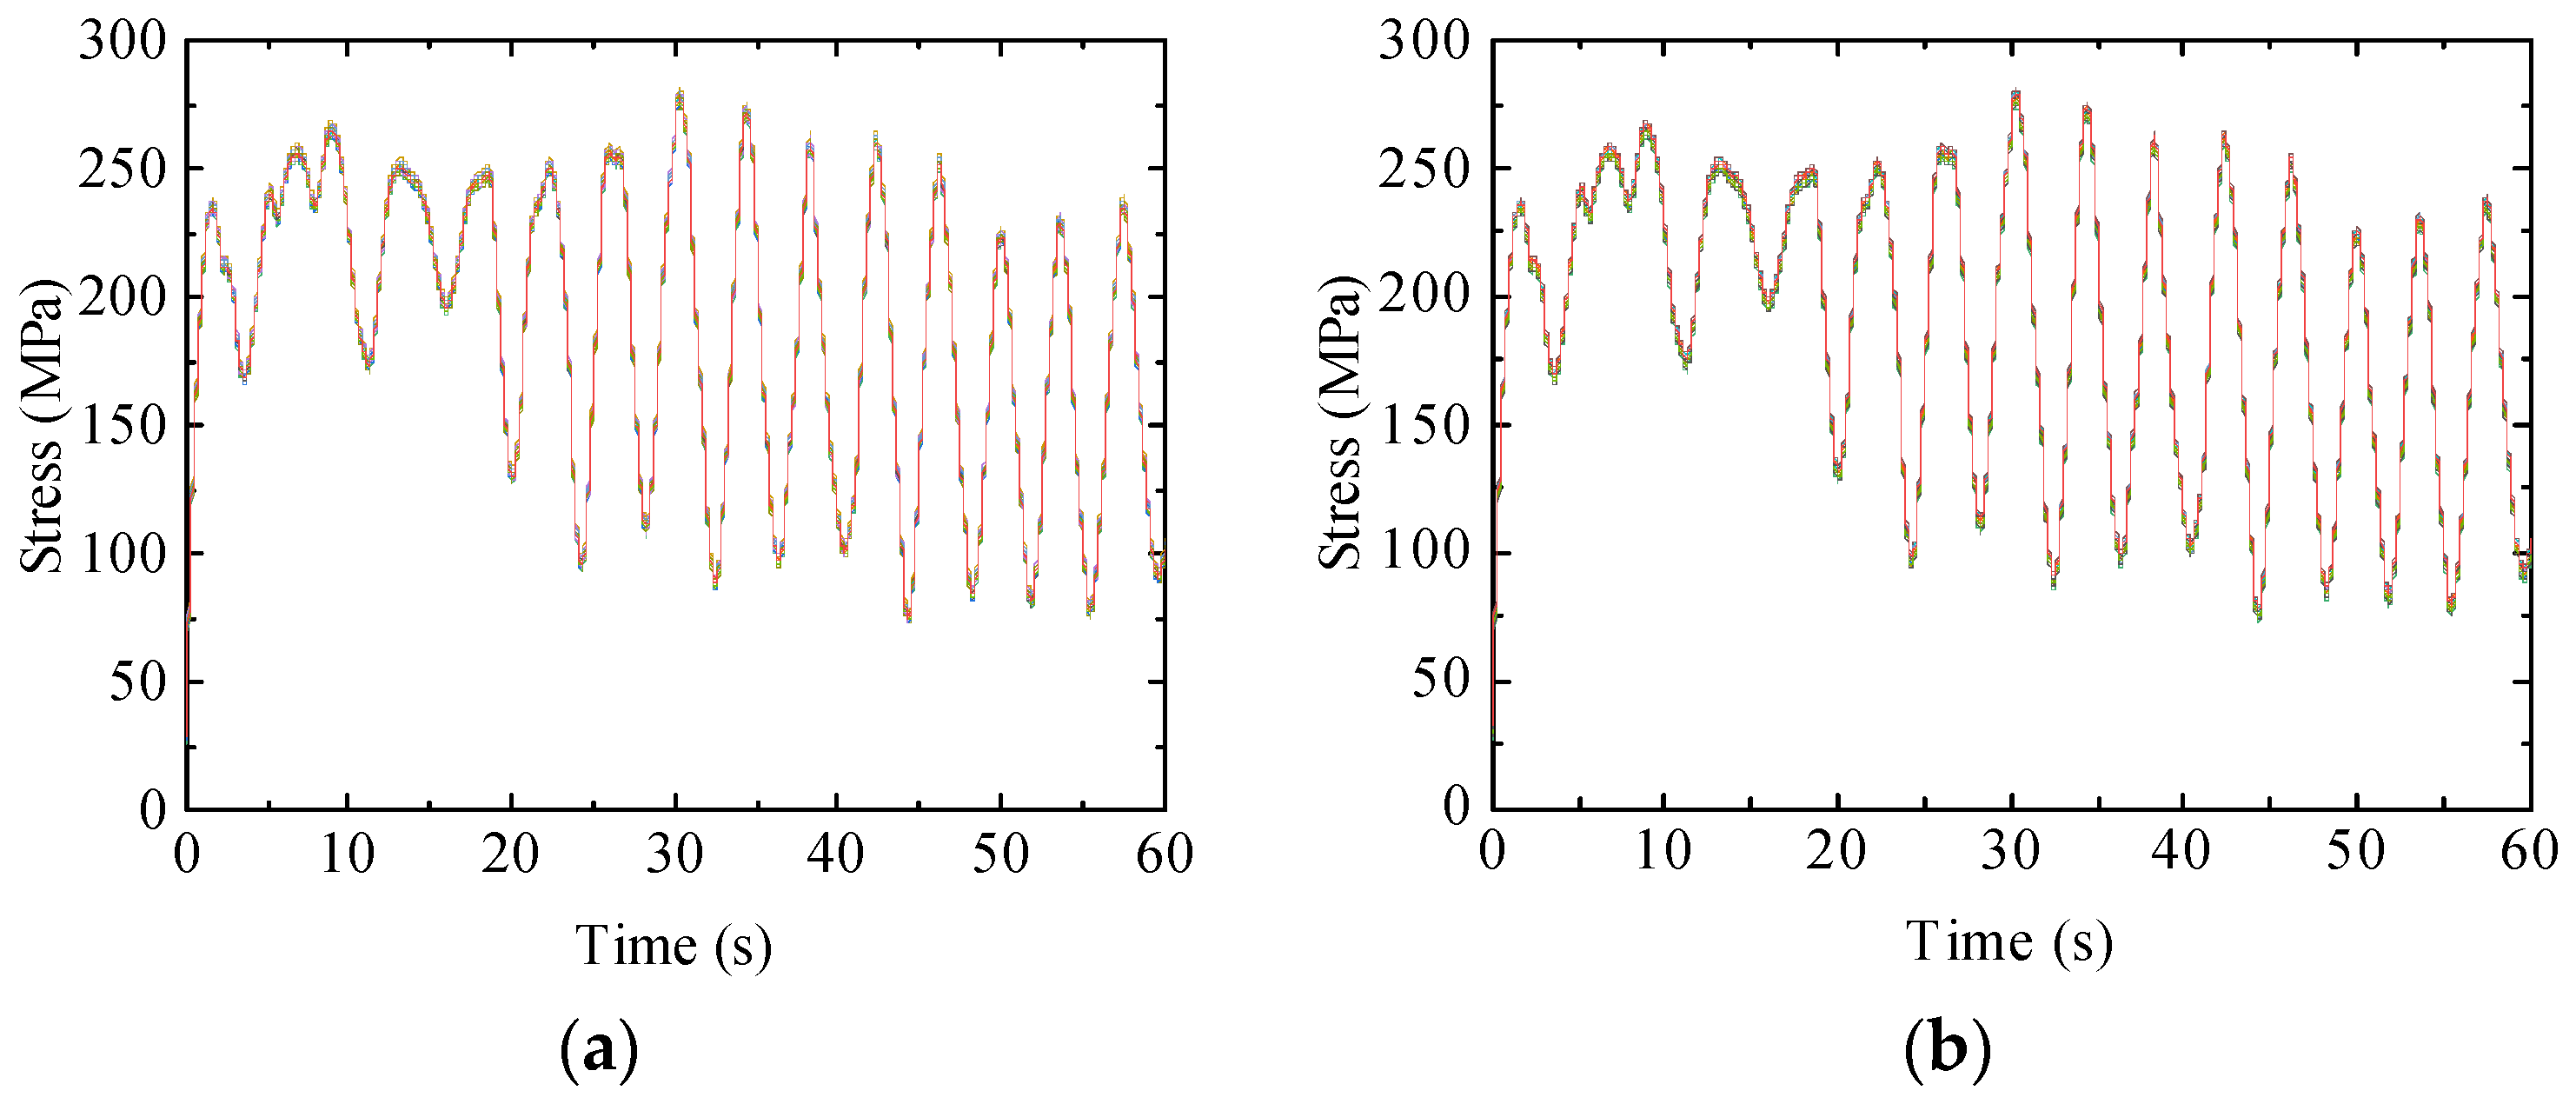
4.2.2. Time History of Stress at the Most Unfavorable Locations of the Structure
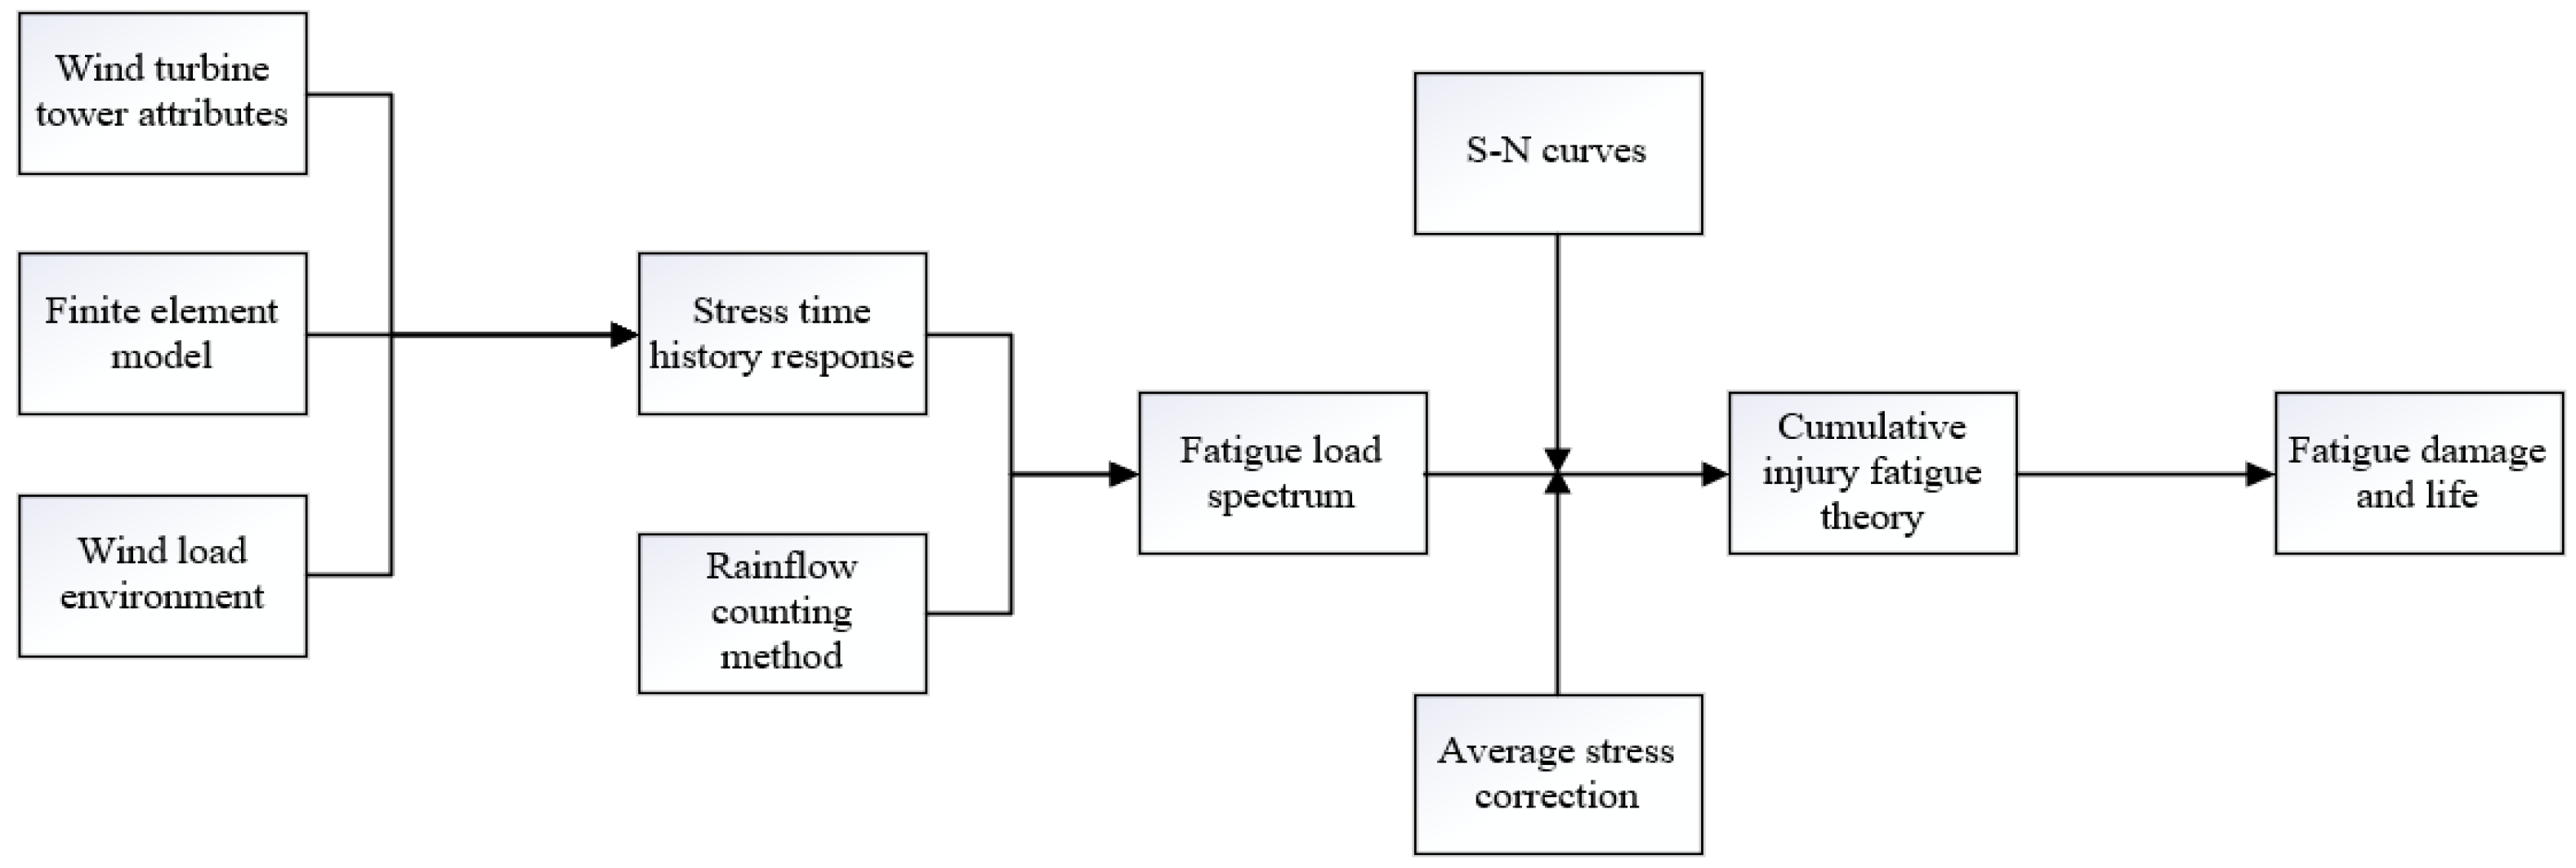
5. Fatigue Life Analysis and Fatigue Reliability Assessment of the Steel–Concrete Composite Wind Turbine Tower
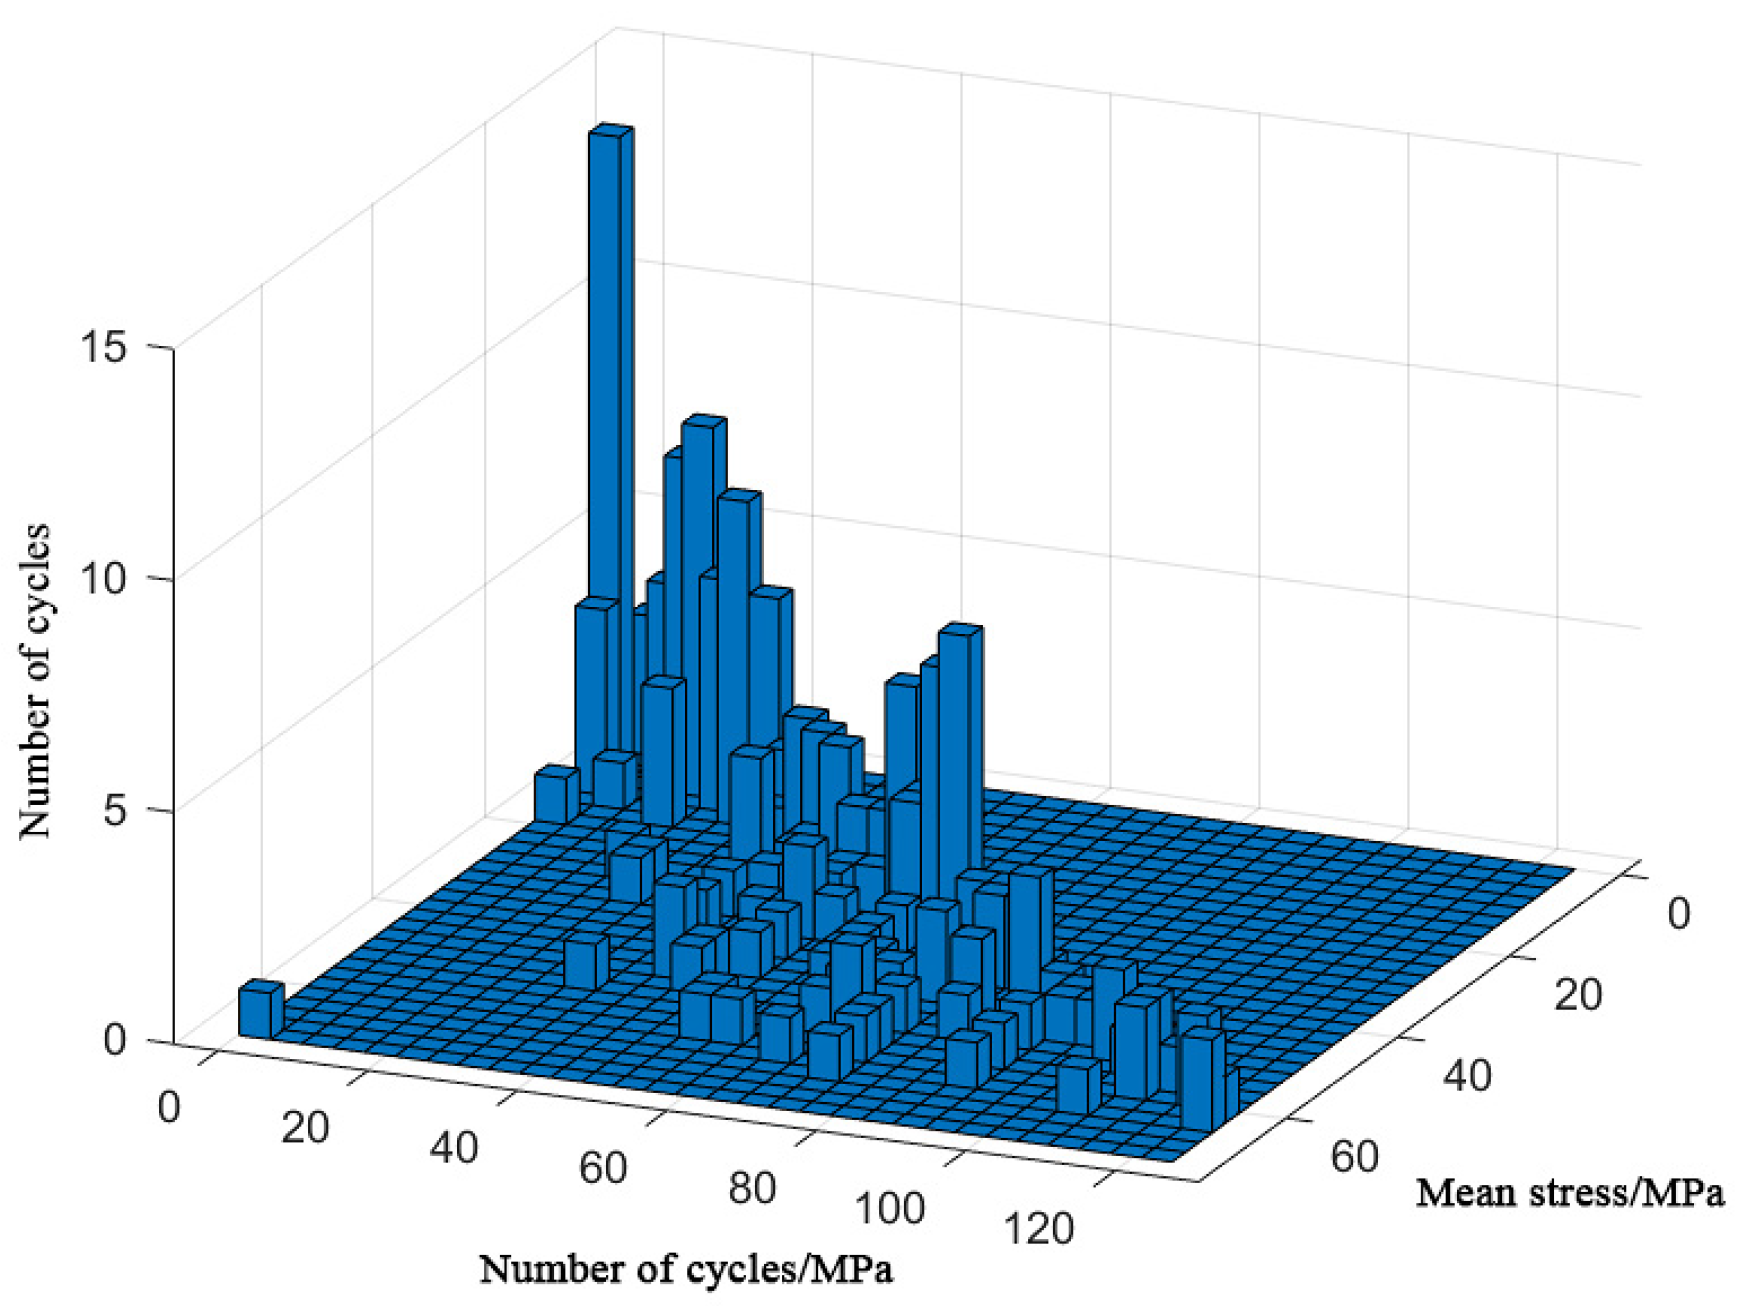
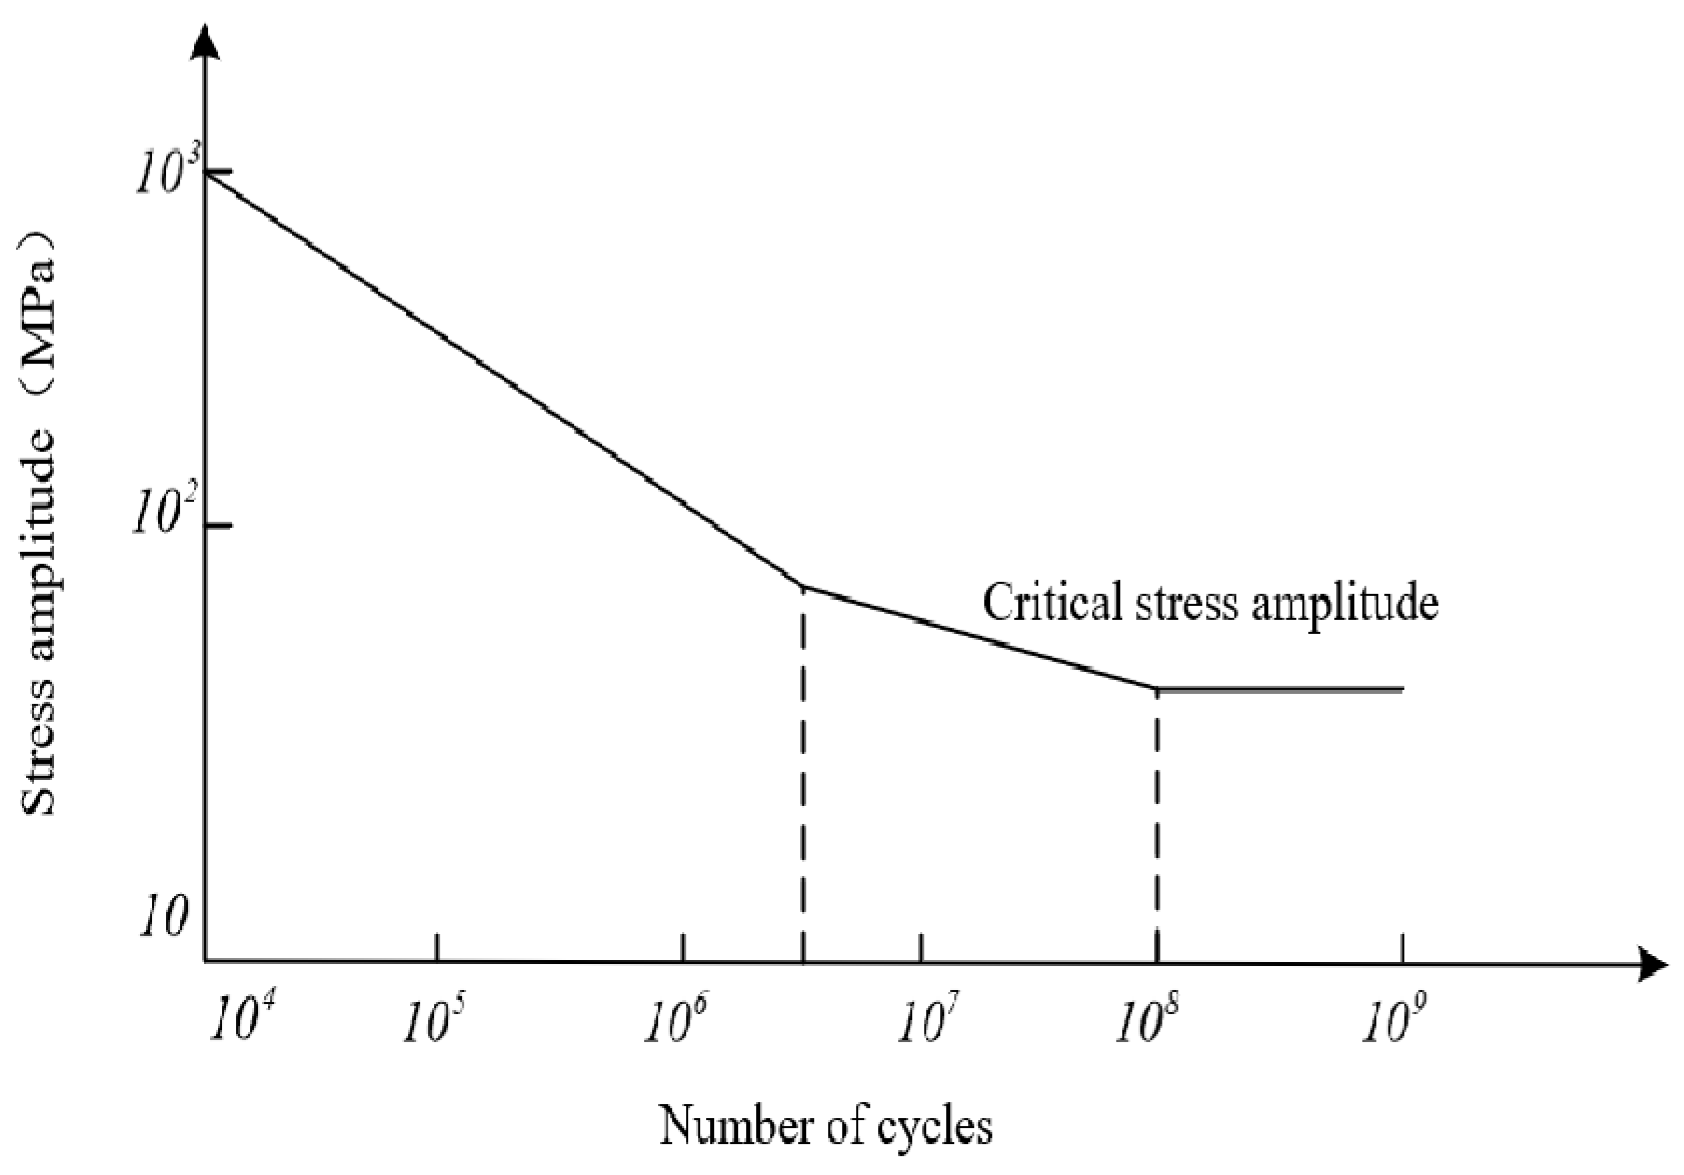
5.1. Fatigue Life Prediction of the Tower
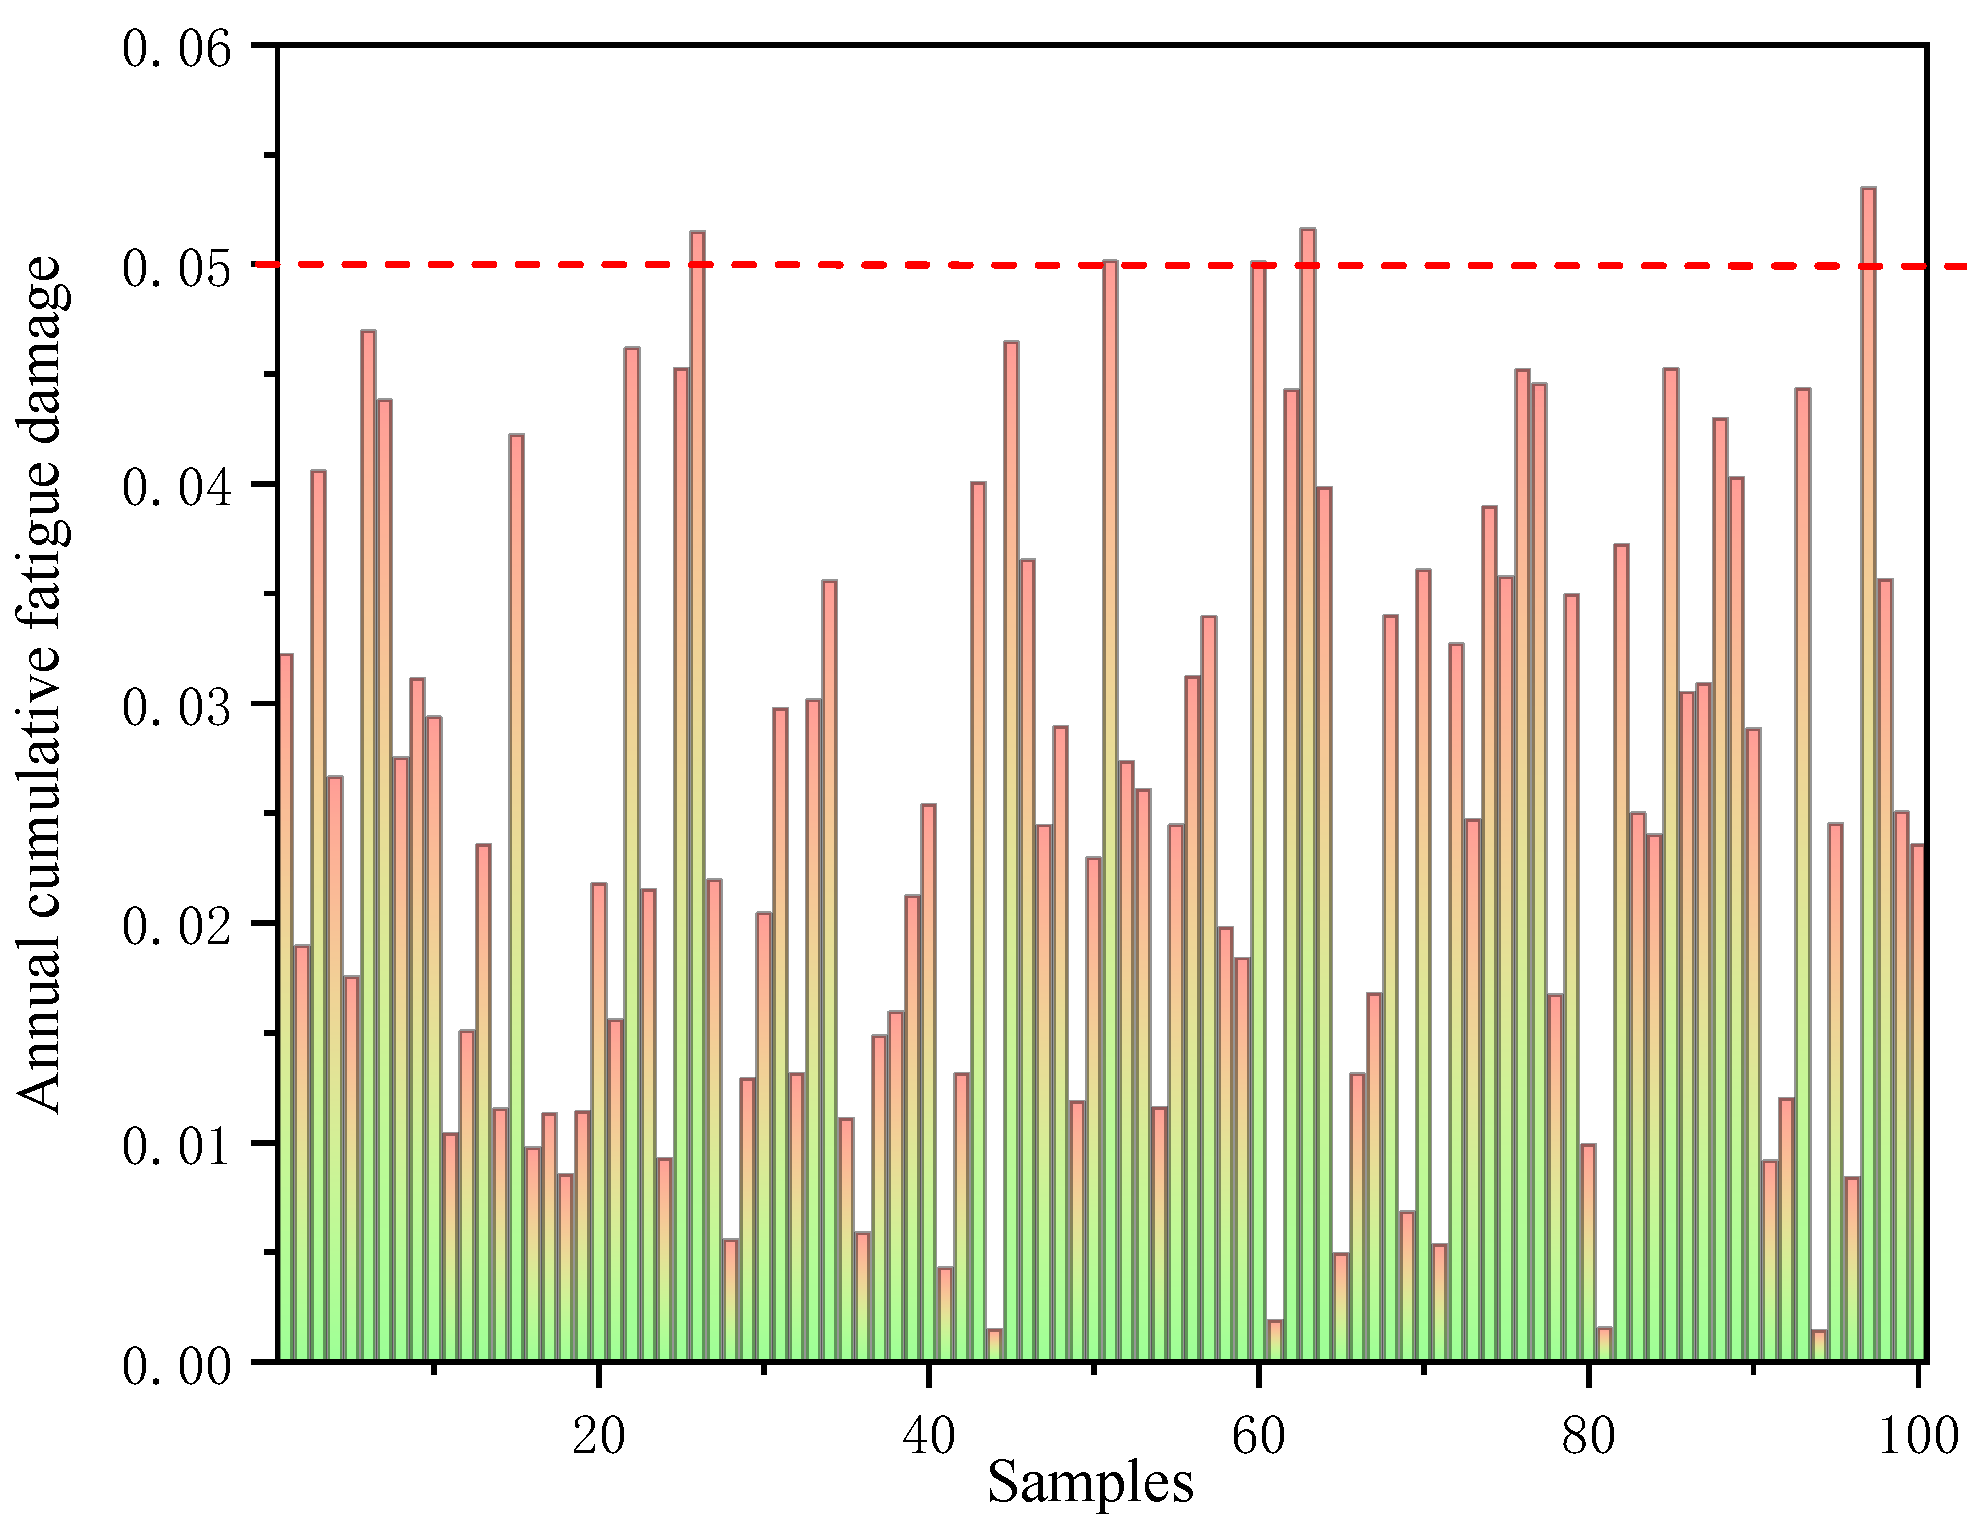
5.2. Fatigue Reliability Assessment of the Tower
- (1)
- The Latin hypercube sampling method is used to obtain n sample points, which are regarded as the initial points, and the response of the structure is obtained via the finite element method.
- (2)
- A kriging model is constructed based on the initial points, and a kriging surrogate model is obtained using the DACE toolbox in MATLAB.
- (3)
- N random samples are generated via the Monte Carlo method, and the response values of the samples are predicted via the kriging surrogate model to obtain the conditional probabilities P0 and NP0.
- (4)
- The samples obtained in step 3 are processed by the MCMC method, and the corresponding failure probability under given conditions can be obtained.
6. Conclusions
- (1)
- The parts of the steel–concrete composite wind turbine towers that are most likely to fail are as follows: the bottom of the leeward side of the upper steel tube, the flange of the steel tube, the bolt-hole imprinting surface of the flange, the leeward side of the transition tube, and the top of the leeward side of the concrete tube.
- (2)
- Under the rated wind speed, the along-wind displacement of the tower was relatively large, while the cross-wind displacement was relatively small, approximately 1/15 of the corresponding along-wind displacement. This indicates that the aerodynamic thrust generated by the blades is the main factor causing the wind-induced vibration of the tower. Under the conditions of cutting out wind speed and survival wind speed, the cross-wind displacement was relatively larger than the along-wind displacement, which was mainly due to the vortex-induced vibration of the tower.
- (3)
- For the tower analyzed in this study, the mean fatigue lives of the most unfavorable locations are all greater than 20 years, which meets the design service life requirements. However, from the perspective of probability, the failure risk of the flange of the upper steel tube and the bolt-hole imprinting surface of the flange is relatively high, followed by that of the transition tube. This indicates that special attention should be given to these parts in design and daily maintenance. In practice, the fatigue resistance of a tower can be enhanced by improving the strength of the flange plate, increasing the number of bolts, or strengthening the transition tube. A comparison of the transition tube, the upper steel tube and the lower concrete tube shows that the fatigue reliability of the transition tube is slightly lower than that of the adjacent steel tube and concrete tube. Therefore, special attention should also be given to this area. In contrast, the fatigue reliabilities of the steel tube and the concrete tube both exceed 95%, indicating that these two parts of the structure have sufficient fatigue resistance under normal operation conditions.
- (4)
- When designing a steel–concrete composite wind turbine tower in practical engineering, the following suggestions can be given: The flange plate should be subjected to a detailed fatigue analysis to ensure its safety. The material strength and quality of the transition tube should be appropriately improved. Attention should be given to the processing and construction of steel tubes and concrete tubes to reduce the risk of fatigue failure.
Author Contributions
Funding
Institutional Review Board Statement
Informed Consent Statement
Data Availability Statement
Conflicts of Interest
References
- Zhu, Z.; Tong, F.; Guo, Z.; Wang, L.; Zhang, J.; Chen, J. Model test on long-term dynamic characteristics study of gravity foundation onshore wind turbine. J. Zhejiang Univ. (Eng. Sci.) 2021, 55, 1744–1751. [Google Scholar]
- Lu, D.; Wang, G.; Du, X.; Wang, Y. A nonlinear dynamic uniaxial strength criterion that considers the ultimate dynamic strength of concrete. Int. J. Impact Eng. 2017, 103, 124–137. [Google Scholar] [CrossRef]
- Wang, L. Study on Mechanical Behavior of Concrete-Filled Double Steel Tube Wind Turbine Tower. Master’s Thesis, Lanzhou University of Technology, Lanzhou, China, 2021. [Google Scholar]
- Chao, C.; Xiujiang, S.; Zheng, Z.; Xugang, H. Feasibility study of a steel-UHPFRC hybrid tower for offshore wind turbines. Ocean Eng. 2023, 288, 116140. [Google Scholar]
- Alves, L.J.; Magalhães, J.P.A.A.; Almeida, M.C.; Almeida, M.A.L.M.; Carlos, A.J.A.; Silveira, B.R.M. Behavior study of prestressed concrete wind-turbine tower in circular cross-section. Eng. Struct. 2021, 227, 111403. [Google Scholar]
- Pan, P.P.; Chen, C.Z.; Yu, S.B.; Meng, Q. Analysis of Dynamic Characteristics of 1.5 MW Wind Turbine Tower. Appl. Mech. Mater. 2013, 2370, 793–796. [Google Scholar] [CrossRef]
- Robert, F.; Frank, K.; Markus, F.; Stefan, W.; Ralf, S. Along-Wind Aerodynamic Damping of Wind Turbine Towers: Determination by Wind Tunnel Tests and Impact on Tower Lifetime. Energies 2022, 15, 1984. [Google Scholar]
- Chen, J.; Gao, J.; Zhao, B.; Yang, R. Comprehensive Analysis Dynamic Response of Steel And Steel-concerete Combined Wind Turbine Towers. Acta Energiae Solaris Sin. 2023, 44, 225–231. [Google Scholar]
- Huo, T.; Tong, L. Wind-induced response analysis of wind turbine tubular towers with consideration of rotating effect of blades. Adv. Struct. Eng. 2020, 23, 289–306. [Google Scholar] [CrossRef]
- Ren, W.; Deng, R.; Zhou, X.-H.; Wang, Y.-H.; Cao, F.; Jin, K.-Y. Compressive behavior of the steel–concrete composite adapter for wind turbine hybrid towers. Eng. Struct. 2023, 280, 115703. [Google Scholar] [CrossRef]
- Chen, F.; Zhang, H.; Li, Z.; Luo, Y.; Xiao, X.; Liu, Y. Residual stresses effects on fatigue crack growth behavior of rib-to-deck double-sided welded joints in orthotropic steel decks. Adv. Struct. Eng. 2024, 27, 35–50. [Google Scholar] [CrossRef]
- Luo, Y.; Liu, X.; Chen, F.; Zhang, H.; Xiao, X. Numerical simulation on crack–inclusion interaction for rib-to-deck welded joints in orthotropic steel deck. Metals 2023, 13, 1402. [Google Scholar] [CrossRef]
- Li, W.; Guo, S.; Zhang, G.; Du, Y. Assessment on Wind-Induced Fatigue Life of Wind Turbine Tower Considering Joint Probability Distribution of Wind Speed And Wind Direction. Acta Energiae Solaris Sin. 2022, 43, 278–286. [Google Scholar]
- Aitor, S.A.; Alain, U.; Gabriel, I.-B.; Jon, S. Floating wind turbine energy and fatigue loads estimation according to climate period scaled wind and waves. Energy Convers. Manag. 2022, 271, 116303. [Google Scholar]
- Stavridou, N.; Efthymiou, E.; Baniotopoulos, C.C. Welded Connections of Wind Turbine Towers under Fatigue Loading: Finite Element Analysis and Comparative Study. Am. J. Eng. Appl. Sci. 2015, 8, 489–503. [Google Scholar] [CrossRef]
- Alonso-Martinez, M.; Adam, J.M.; Alvarez-Rabanal, F.P.; del Coz Díaz, J.J. Wind turbine tower collapse due to flange failure: FEM and DOE analyses. Eng. Fail. Anal. 2019, 104, 932–949. [Google Scholar] [CrossRef]
- Fu, B.; Zhao, J.; Li, B.; Yao, J.; Teifouet, A.R.M.; Sun, L.; Wang, Z. Fatigue reliability analysis of wind turbine tower under random wind load. Struct. Saf. 2020, 87, 101982. [Google Scholar] [CrossRef]
- Cui, W.; Caracoglia, L.; Zhao, L.; Ge, Y. Examination of occurrence probability of vortex-induced vibration of long-span bridge decks by Fokker–Planck–Kolmogorov equation. Struct. Saf. 2023, 105, 102369. [Google Scholar] [CrossRef]
- He, L.; Wang, Z.; Akebono, H.; Sugeta, A. Machine learning-based predictions of fatigue life and fatigue limit for steels. J. Mater. Sci. Technol. 2021, 90, 9–19. [Google Scholar] [CrossRef]
- Dong, W.; Moan, T.; Gao, Z. Fatigue reliability analysis of the jacket support structure for offshore wind turbine considering the effect of corrosion and inspection. Reliab. Eng. Syst. Saf. 2012, 106, 11–27. [Google Scholar] [CrossRef]
- Ding, Y.; Xu, Y.; Bai, G. Reliability assessment for hybrid solar tower under near-fault pulse-like ground motions using Kriging surrogate and subset simulation. J. Vib. Control 2023, 30, 2271–2282. [Google Scholar] [CrossRef]
- Shi, W. Study on Wind-Induced Fatigue Reliability of A Steel–Concrete Composite Wind Tower. Master’s Thesis, Xi’an University of Architecture and Technology, Xi’an, China, 2022. [Google Scholar]
- Rinker, J.; Dykes, K.L. Windpact Reference Wind Turbines; National Renewable Energy Laboratory (NREL): Golden, CO, USA, 2018. [Google Scholar]
- Gkantou, M.; Rebelo, C.; Baniotopoulos, C. Life cycle assessment of tall onshore hybrid steel wind turbine towers. Energies 2020, 13, 3950. [Google Scholar] [CrossRef]
- GB 50009-2012; Load Code for Building Structures. National Standard of the People’s Republic of China: Beijing, China, 2012.
- Rumman, W.S. Basic structural design of concrete chimneys. J. Power Div. 1970, 96, 309–318. [Google Scholar] [CrossRef]
- Yang, S. Research on the Bearing Capacity of Steel Chimney under the Combined Action of along and Cross Wind Loads. Master’s Thesis, Jiangnan University, Wuxi, China, 2022. [Google Scholar]
- Belver, A.V.; Koo, K.; Ibán, A.L.; Brownjohn, J.M.W.; Goddard, C. Enhanced Vortex Shedding in a 183 m Industrial Chimney. Adv. Struct. Eng. 2014, 17, 951–960. [Google Scholar] [CrossRef]
- Castellani, F.; Astolfi, D.; Becchetti, M.; Berno, F.; Cianetti, F.; Cetrini, A. Experimental and Numerical Vibrational Analysis of a Horizontal-Axis Micro-Wind Turbine. Energies 2018, 11, 456. [Google Scholar] [CrossRef]
- Chizfahm, A.; Yazdi, E.A.; Eghtesad, M. Dynamic modeling of vortex induced vibration wind turbines. Renew. Energy 2018, 121, 632–643. [Google Scholar] [CrossRef]
- Kang, S.; Shi, L.; Dai, L.; Fan, Z. Analyze of CFD Simulation Error And Study of Grid Convergence. J. Eng. Thermophys. 2010, 31, 2009–2013. [Google Scholar]
- Miner, M.A. Cumulative damage in fatigue. J. Appl. Mech. 1945, 12, A159–A164. [Google Scholar] [CrossRef]
- E1049-85; Standard Practice for Cycle Counting in Fatigue Analysis. America Society for Testing and Materials Standards: West Conshohocken, PA, USA, 1985.
- GB 50017-2017; Standard for Design of Steel Structures. National Standard of the People’s Republic of China: Beijing, China, 2017.
- Nicholas, T.; Zuiker, J. On the use of the Goodman diagram for high cycle fatigue design. Int. J. Fract. 1996, 80, 219–235. [Google Scholar] [CrossRef]
- Au, S.-K.; Beck, J.L. Estimation of small failure probabilities in high dimensions by subset simulation. Probabilistic Eng. Mech. 2001, 16, 263–277. [Google Scholar] [CrossRef]


| Upper Steel Tube | Transition Tube | Lower Concrete Tube | |||
|---|---|---|---|---|---|
| Material | Steel (grade Q345) | Material | steel (Grade Q345) | Material | Concrete (grade C60) |
| Length | 70 m | Length | 15 m | Length | 35 m |
| Diameter of the tube top | 3.2 m | Diameter of the tube | 4.3 m | Diameter of the tube top | 4.5 m |
| Diameter of the tube bottom | 4.3 m | Diameter of the tube bottom | 7.0 m | ||
| Wall thickness | 64 mm | Wall thickness | 64 mm | Wall thickness at the top of the tube | 400 mm |
| Wall thickness at the bottom of the tube | 300 mm | ||||
| Type of element | Solid | Type of element | Solid, beam | Type of element | Solid, linear |
| Damping ratio | 3.4% | Damping ratio | 3.4% | Damping ratio | 3.4% |
| Mass | 270 t | Mass | 30 t | Mass | 402 t |
| Other | -- | High-strength bolts | M36 (grade 10.9) | Steel strands | Φ15.2 (grade 1860) |
| Type | Items | Value |
|---|---|---|
| Operating parameters | Rated speed | 14.469 r/min |
| Rated wind speed | 12.9 m/s | |
| Cut-in wind speed | 3 m/s | |
| Cut-out wind speed | 25 m/s | |
| Blades | Number | 3 |
| Material | Fiberglass and wood | |
| Mass | 13.2238 t | |
| Radius | 49. 5 m | |
| Hub and nacelle | Mass of hub | 61.67 t |
| Mass of nacelle | 132.598 t | |
| Coordinates of the center of mass of nacelle relative to the center of the tower top | (−0.226 m, 0 m, 1861 m) | |
| Coordinates of the center of mass of hub relative to the center of the tower top | (4.650 m, 0 m, 2.270 m) |
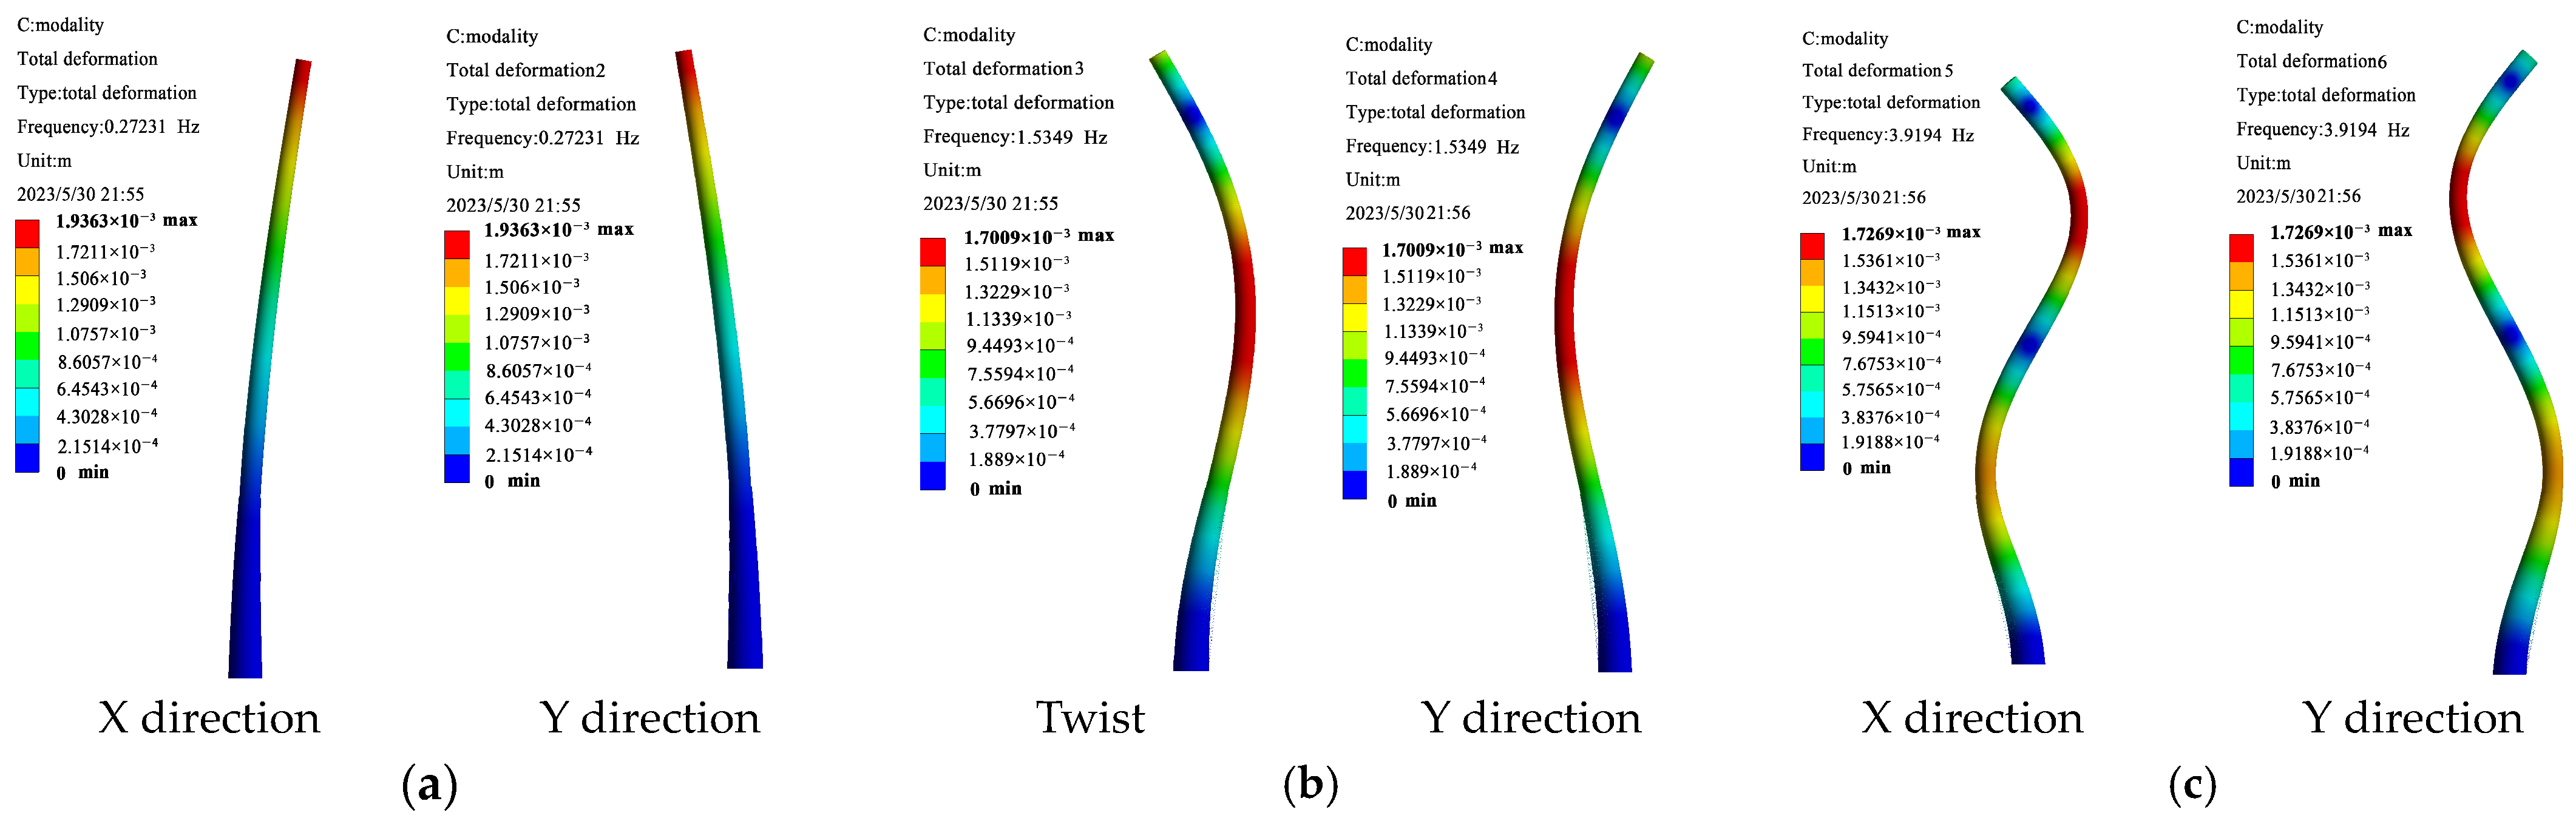
| Mode Order | Simulated Frequency in the Present Study (Hz) f0 | Reference Frequency Results (Shi et al.) (Hz) f | Relative Deviation (%) |(f0 − f)/f0| |
|---|---|---|---|
| 1 | 0.272 | 0.258 | 5.1 |
| 2 | 1.535 | 1.584 | 3.2 |
| 3 | 3.919 | 3.823 | 2.4 |
| Z (m) | 5 | 15 | 25 | 35 | 45 | 55 | 65 | 75 | 85 | 95 | 105 | 115 |
|---|---|---|---|---|---|---|---|---|---|---|---|---|
| Fk (kN) | 0.197 | 0.237 | 0.315 | 0.435 | 0.571 | 0.730 | 0.921 | 1.165 | 1.551 | 1.805 | 2.157 | 2.493 |
| Natural Frequency (Hz) | Critical Wind Speed (m/s) | “Lock-In” Wind Speed Range (m/s) | Height Range of the Resonance Region (m) | |
|---|---|---|---|---|
| First order | 0.272 | 4.48 | 3.77~5.82 | - |
| Second order | 1.535 | 24 | 20~32.2 | 27.1~120 |
| Third order | 3.919 | 62.4 | 52~81.1 | 112.6~120 |
| Item | Boundary Layer Mesh Size (mm) | Mesh Size in Refinement Zone (mm) | Theoretical Value (mm) (a) | Calculated Value by Fluid–Structure Interaction Method (mm) (b) | Relative Error (%) |(a) − (b)|/(a) |
|---|---|---|---|---|---|
| Coarse grid | 50 | 100 | 1148 | 1011.45 | 13.5 |
| Medium grid | 20 | 60 | 1087.11 | 5.6 | |
| Fine grid | 10 | 40 | 1113.48 | 3.1 |
| Stress Amplitude (MPa) | Mean Stress (MPa) | Corrected Stress Amplitude (MPa) | Actual Annual Number of Stress Cycles | Theoretical Annual Number of Stress Cycles | Annual Fatigue Damage Coefficient |
|---|---|---|---|---|---|
| 2.32 | 7.22 | 2.29 | 32 | - | - |
| 14.94 | 14.03 | 14.53 | 26 | - | - |
| 24.01 | 25.90 | 22.83 | 19 | - | - |
| 35.41 | 34.39 | 33.13 | 17 | - | - |
| 45.52 | 45.07 | 41.76 | 18 | 3.50 × 10¹⁰ | 8.35 × 10⁻⁷ |
| 55.19 | 54.97 | 49.72 | 15 | 2.94 × 10¹⁰ | 1.19 × 10⁻⁶ |
| 64.64 | 62.60 | 57.45 | 28 | 2.54 × 10¹⁰ | 7.39 × 10⁻⁷ |
| 73.75 | 72.29 | 64.43 | 17 | 2.27 × 10¹⁰ | 1.36 × 10⁻⁶ |
| 84.25 | 0 | 84.25 | 11 | 1.26 × 10⁸ | 3.79 × 10⁻⁴ |
| 94.08 | 0 | 94.08 | 4 | 8.12 × 10⁷ | 1.62 × 10⁻³ |
| 104.38 | 0 | 104.38 | 7 | 5.36 × 10⁷ | 1.40 × 10⁻³ |
| 114.21 | 0 | 114.21 | 6 | 3.74 × 10⁷ | 2.34 × 10⁻³ |
| 123.86 | 0 | 123.86 | 3 | 2.70 × 10⁷ | 6.48 × 10⁻³ |
| Annual fatigue cumulative damage coefficient: 0.01223 | |||||
| Part of the Tower | Annual Cumulative Fatigue Damage Factor | Fatigue Life (Year) |
|---|---|---|
| upper steel tube | 0.01223 | 81.76 |
| transition tube | 0.03141 | 31.84 |
| lower concrete tube | 0.00419 | 238.66 |
| flange of the upper steel tube | 0.04462 | 22.41 |
| imprinting surface of the bolt holes in the flange of the upper steel tube | 0.04855 | 20.60 |
| Part of the Tower | Mean Value for the Annual Accumulative Fatigue Damage Coefficient of 100 Groups Results | Mean Fatigue Life (Years) | Failure Probability | Fatigue Reliability |
|---|---|---|---|---|
| upper steel tube | 0.013257 | 75.43 | 3.26% | 96.74% |
| transition tube | 0.020197 | 49.51 | 5.35% | 94.65% |
| lower concrete tube | 0.008436 | 118.54 | 1.71% | 98.29% |
| flange of the upper steel tube | 0.026731 | 37.41 | 8.8% | 91.2% |
| imprinting surface of the bolt holes in the flange of the upper steel tube | 0.028754 | 34.78 | 9.2% | 90.8% |
Disclaimer/Publisher’s Note: The statements, opinions and data contained in all publications are solely those of the individual author(s) and contributor(s) and not of MDPI and/or the editor(s). MDPI and/or the editor(s) disclaim responsibility for any injury to people or property resulting from any ideas, methods, instructions or products referred to in the content. |
© 2024 by the authors. Licensee MDPI, Basel, Switzerland. This article is an open access article distributed under the terms and conditions of the Creative Commons Attribution (CC BY) license (https://creativecommons.org/licenses/by/4.0/).
Share and Cite
Zhang, M.; Liu, B.; Gao, C.; Hossain, M.N.; Zhao, G. Wind-Induced Response Analysis and Fatigue Reliability Study of a Steel–Concrete Composite Wind Turbine Tower. Buildings 2024, 14, 1740. https://doi.org/10.3390/buildings14061740
Zhang M, Liu B, Gao C, Hossain MN, Zhao G. Wind-Induced Response Analysis and Fatigue Reliability Study of a Steel–Concrete Composite Wind Turbine Tower. Buildings. 2024; 14(6):1740. https://doi.org/10.3390/buildings14061740
Chicago/Turabian StyleZhang, Meng, Bing Liu, Chongqi Gao, Md Nayim Hossain, and Guifeng Zhao. 2024. "Wind-Induced Response Analysis and Fatigue Reliability Study of a Steel–Concrete Composite Wind Turbine Tower" Buildings 14, no. 6: 1740. https://doi.org/10.3390/buildings14061740
APA StyleZhang, M., Liu, B., Gao, C., Hossain, M. N., & Zhao, G. (2024). Wind-Induced Response Analysis and Fatigue Reliability Study of a Steel–Concrete Composite Wind Turbine Tower. Buildings, 14(6), 1740. https://doi.org/10.3390/buildings14061740