Article

Integrating Internet of Things (IoT) Approach to Post-Occupancy Evaluation (POE): An Experimental At-the-Moment Occupant Comfort Control System

School of Built Environment, Massey University, Auckland 0632, New Zealand
*
Author to whom correspondence should be addressed.
Buildings 2024, 14(7), 2095; https://doi.org/10.3390/buildings14072095
Submission received: 12 May 2024 / Revised: 18 June 2024 / Accepted: 3 July 2024 / Published: 9 July 2024
(This article belongs to the Special Issue Energy Consumption and Environmental Comfort in Buildings)

Abstract

:
This paper describes an empirical experiment of Internet of Things (IoT)’s integration in the Post-Occupancy Evaluation (POE) process. The experiment aimed to trial a novel IoT approach to enabling building user responsiveness to prevalent IEQ for individualised comfort. The purpose is to provide a system that mitigates a common issue of centralised air conditioning that limits occupants’ control over their immediate environment. To achieve this, an IoT platform was developed with smart IEQ monitoring sensors and wearable devices and trialled with PhD researchers in a shared university workspace. The findings provided empirical evidence of IoT’s enhanced benefits to improving user control over their individual comfort and enabling positive energy behaviour in buildings. Specifically, the IoT system provided real-time insight into CO2 concentration data while enabling responsive occupant interaction with their immediate environment and at-the-moment mitigation actions. Outputs of the experiment showed that the perceptions of participants about the stuffiness of the air, productivity, and healthy environment were significantly better after taking the mitigation action compared to before. Also, we found a significant relationship between measured CO2 concentration readings and perceived air stuffiness (p = 0.004) and productivity (p = 0.006) and a non-significant relationship between CO2 concentration readings and perceived healthy environment (p = 0.058). Interestingly, we observed that irrespective of the similarities in recorded CO2 concentration readings being within acceptable ranges (632–712 ppm), the perception of air stuffiness significantly differed (p = 0.018) before and after the mitigation actions. The effectiveness of the developed IoT platform was evidenced as most of the participants found the process very easy to participate in with little interruptions to their work as little time was consumed. The results are useful in modifying approaches to building occupant comfort and energy behaviour in commercial and residential settings.

1. Introduction

People spend more than 90% of their time indoors [1], yet less than 10% of building users are satisfied with the prevalent Indoor Environment Quality (IEQ) [2]. This dissatisfaction persists irrespective of the significant energy used by building systems to achieve a comfortable IEQ.
Accounts of poor IEQ (especially temperature and air quality) in office environments and its impact on worker comfort and productivity have long been documented before the COVID-19 breakout [2,3,4,5,6]. Terms like Sick Building Syndrome, impaired performance, and absenteeism are common and well-known effects of poorly designed and managed IEQ work environments [7,8,9,10,11]. Studies indicate that unfavourable work environments are associated with depressed moods, difficulty focusing, and lower levels of motivation and productivity among employees [3]. The World Health Organization [12] identifies indoor air pollution as the world’s single most significant environmental health risk. Poor IAQ costs the American economy an indirect cost estimated at USD 168 billion annually [13]. These costs include lost pay from sickness, absenteeism, and work output from missed workdays. In New Zealand, prevalent office building designs are said not to prioritise worker productivity [14] or these IEQ factors that affect it. In 2016, the World Green Building Council (WGBC) called for better working environments to support improved health and productivity outcomes [15].
On the other hand, the built environment contributes significantly to greenhouse gas emissions, especially during the operational phase of buildings. In 2022, the International Energy Agency (IEA) noted that buildings were responsible for 36% of the world’s total energy consumption [16]. Thirty per cent (30%) of this share is attributed to the use and operation of buildings [16].
Most buildings rely on the extensive use of energy to operate. In fact, the operational energy usage of buildings is a silent yet significant contributor to emissions, reaching a high of approximately 10 gigatons of carbon dioxide (CO2) in 2021 [9]. Depending on users’ comfort expectations, the energy consumed by building systems such as heating, cooling, and lighting can be substantial, especially in fully air-conditioned buildings. These buildings require this energy to keep the IEQ within acceptable levels. As Byrd et al. [17] advised, reducing air conditioning demand in buildings will improve energy security and reduce greenhouse gas emissions. At the same time, achieving user comfort in fully air-conditioned spaces is limited by the variability in users’ expectations and satisfaction. For instance, studies show that occupants of air-conditioned spaces are often uncomfortable with reduced productivity and satisfaction levels as these spaces are commonly too cold, especially in office spaces [8,11]. As such, it is a persistent challenge to reduce air conditioning demand without compromising user comfort in buildings.
The study reported in this paper is a trial experiment exploring how bespoke occupant comfort can be achieved in air-conditioned spaces without increasing energy use.

2. Background

Buildings are designed and constructed to meet users’ needs, which affects how they are operated to achieve occupant comfort and satisfaction. As such, maintaining the optimal levels of IEQ for occupant comfort and health while achieving energy efficiency in building operations relies on occupant behaviour and expectations, up-to-date and reliable information on how buildings perform, how occupants want to be comfortable, and how they use the buildings. Hong et al. [18] noted that users’ behaviour accounts for up to 80% of operational energy use. Rasheed et al. [19] emphasised that the way users interact with their spatial and physical indoor environment has an effect not just on comfort, health, and even productivity but also on the energy performance of buildings. User comfort-related actions significantly affect energy consumption [19,20,21] and are crucial for responsive designs and overall improvements in building operations.
Post-Occupancy Evaluation (POE) provides valuable feedback [22] and feeds forward user behaviour and interactions to enhance the utility of future building design and construction through retrospective ‘lessons learned’ [23,24,25,26]. In this era of environmental sustainability, POE has been instrumental in balancing the environmental impacts of buildings with economic viability [10,27]. Lolli et al. [28] noted the benefits of POE, including analysing the interaction between the factors that make up the IEQ and the users of buildings and subsequent energy consumption. Rasheed et al. [19] highlighted the benefits of regular POEs in reducing long-term operational and maintenance costs. However, post-occupancy performance monitoring of buildings is not commonly practised in the industry despite its importance in ensuring sustainability and optimal performance. Alborz and Berardi [29] noted that despite the proven benefits of POE implementation, regular and systematic use of this largely voluntary feedback mechanism still needs to be discovered in practice.
The consequence is the persistent lack of up-to-date and usable information on building operation practices, which hinders practical measures for efficient energy use and user comfort measures or strategies. Even when building owners and organisations have sustainable energy efficiency and user comfort strategies, they struggle to translate them into practical plans due to the unavailability of the required information and the associated complexities. This is because current methods for energy efficiency focus on building systems and envelopes. As such, user impact on building performance and energy use is often underestimated.
The reason is not far-fetched, as conventional POE methods are poised with various limitations. For example, traditional POE methods consisting of paper-based questionnaires and interviews focus on perception-based information on how buildings perform and required changes to meet users’ needs. While useful, these methods have limitations regarding time consumption, biases, and data accuracy [30], significantly reducing the quality of the collected data. Also, these methods do not necessarily allow for the critical analysis of retrieved POE data. According to Onyeizu [8], POE analyses are often based on the overall perception of the building performance, ignoring occupants’ perceptions of individual factors such as the temperature, air quality, or lighting during specific climatic seasons. Bordass and Leaman [31] observed that in their study of green buildings, there were better ratings for more all-embracing summary variables such as “comfort overall”. However, when these are divided into components, the favourable responses are less clear-cut [31].
As an extension, digitised POE methods using web links and app formats rather than traditional paper-based questionnaires to limit these challenges by improving participation, reducing bias, and providing more reliable building performance data. Popular modern POE tools such as the Building Use Studies (BUS) methodology [32], Center for Built Environment (CBE) Occupant Survey [33], and Building Occupants Survey System Australia (BOSSA) [34] are available as online platforms for improving the POE process.
A further extension is the digitalised POE, which focuses on addressing the limitations of digitised POE by allowing more accurate inferential exploration of POE data. It provides valuable insights into building performance against KPIs and identifies improvement opportunities, thus enhancing understanding and facilitating actionable insights for sustainable building operations and energy efficiency improvements. Examples of such technological improvements on POE, like energy auditing, performance assessment, and simulations, are useful in analysing and predicting how a building uses energy to provide a conducive IEQ. Tools such as Building Energy Modelling (BEM) software, combined with Building Information Modelling (BIM) [35] and Building Management Systems (BMS) [36], can produce building energy models that analyse energy use and implement energy efficiency measures effectively. Green BIM, an energy intervention measure, integrates Building Energy Models with BIM to support green projects [37]. These tools are some of the POE technological improvements that have contributed to well-established and sometimes effective energy efficiency in buildings.
However, with the advent of COVID-19 and related environmental issues, these tools are now insufficient for post-COVID working arrangements, which require continuous monitoring of IEQ for more proactive mitigation measures, in particular, temperature and CO2 readings. For instance, these tools do not capture accurate real-time data, as participants are expected to rate their perception of the temperature and air quality based on past experiences.
Also, the energy intervention measures emerging from these tools may not lead to further significant improvements when the most impactful measures have been implemented. This is especially evident in air-conditioned spaces where the use of HVAC systems can be said to have plateaued due to the inherent efficiency of these technologies. Surma et al. [38] pointed out that traditional industry approaches to monitoring workplace design and management do not fully reflect the recent shift to hybrid work patterns. Tripathi et al. [39] stated that a paradigm shift from independent to continuous evaluations is required to improve the overall efficiency of POE.
Accounting for the variability in user preference, behaviour, interactions, and comfort expectations [40,41] in air-conditioned spaces is a key challenge of prevalent technologies. They cannot account for individual occupant–energy behaviour as they rely on generalised comfort metrics. Hence, most of these tools do not provide individualised at-the-moment mitigation measures for identified issues affecting specific user comfort. As noted by Rafsanjani et al. [42], any changes to building users’ energy habits require timely, clear, and consistent knowledge-based interventions.
Despite being overlooked and under-researched, incorporating use behaviour into energy building monitoring and intervention strategies offers more reliable and real-time information on the overall energy performance of buildings [19]. It addresses the limitations of conventional energy performance assessment methods in terms of accuracy, implementation time, and cost. This is where the integration of the Internet of Things (IoT) to POE offers a novel approach to retrieving real-time information on users’ energy behaviour and providing bespoke intervention measures that are energy-wise and satisfy building users.
Integrating advanced technologies like IoT revolutionises how POE is practised and how buildings are assessed and managed [43]. IoT enables efficient monitoring of buildings, facilitating proactive measures for optimal performance, such as in automated processes that can improve energy efficiency, thus enhancing decision-making and creating energy improvement opportunities. IoT incorporates components like sensors, actuators, cloud services, communication tools, and diverse protocols [44] that contribute uniquely to the IoT ecosystem’s functionality, enabling the seamless interconnection of different components over the internet [45]. The capabilities of IoT lay the groundwork for realising smart building objectives and integrating ambient intelligence by establishing a global network that supports ubiquitous computing [46]. Additionally, IoT facilitates context awareness among devices [47], further enhancing the potential of IoT-enabled indoor environments toward energy-efficient measures.
The introduction of IoT in the POE process has significantly reduced data-related errors and biases by facilitating the integration and interactions between smart technologies. For instance, Jia et al. [45] maintain that IoT enables real-time accurate data collection and analysis, revolutionising the approach to understanding building performance and user experience [45]. Also, research shows that IoT platforms support the deployment of many sensors and devices that can continuously monitor environmental parameters, providing more accurate feedback for optimising user comfort and energy efficiency [48,49,50]. A related Spanish case study evidenced the use of IoT monitoring to enhance the energy performance of heating, ventilation, and air conditioning (HVAC) systems in university buildings and user comfort [51].
Research has shown that user behaviour significantly impacts building energy use [21,52,53]. Ma et al. [54] and Mi et al. [55] observed different energy consumption habits and pro-environmental behaviours. In the New Zealand context, Stephenson [52,53] identified opportunities for behaviour change through cognitive norms, energy practices, material culture, and external influences on energy consumption behaviour. Weerasinghe et al. [21] recommended creating an intelligent environmental control system loop with eco-feedback as important for establishing occupant-centric buildings or features. Deductively, we hypothesise that IoT-integrated POE of air-conditioned spaces can enable more user responsiveness, active interaction, and positive energy behaviour while achieving individualised thermal comfort and desired Indoor Air Quality (IAQ).
Past works have designed dedicated IoT platforms for monitoring these two IEQ parameters, specifically temperature and IAQ. For instance, Jo et al. [56] developed an IoT-based IAQ monitoring platform for Volatile Organic Compounds (VOCs), carbon monoxide (CO), and CO2. Firdhous et al. [57] designed an IoT-based IAQ monitoring system to track O3 concentrations. The monitoring system could generate warnings when pollution exceeded a predetermined threshold. Kureshi et al. [58] developed a digital platform for IAQ data visualisation as a trigger for building user behavioural change. Marques and Pitama [59] developed an IoT architecture named iAQ Plus for a historical analysis of laboratory environmental conditions.
While these works offer extended benefits of IoT, limited studies have explored the IoT’s multi-faced capabilities for prompting individualised energy-wise user comfort behaviour when integrated with POE. In this study, we explored the capabilities of IoT to achieve a multi-faced POE process by capturing real-time IEQ data, retrieving user comfort perception, and providing energy-wise at-the-moment comfort mitigation measures. According to Jo et al. [56], IoT allows smart sensors to sense, process, and execute tasks based on real-time changes to environmental conditions, which could help to inform people to take preventive action (Figure 1).
Our study recognises and incorporates user behaviour as a solution to energy efficiency by providing users control over their comfort. As noted by past works, giving users control over their environmental comfort is essential to their perceived comfort and satisfaction [8,10,11,20] and impacts their energy behaviour [20,21]. As such, we aimed to extend the beneficial use of IoT to a system that collects and reports accurate user-specific data on temperature and IAQ and provides individualised energy-wise comfort mitigation measures.
With an IoT-enhanced POE, our study aimed to facilitate building users’ interaction and control of their immediate indoor environment to achieve user comfort while reducing energy use.

3. Materials and Methods

This study aimed to develop an IoT platform that not only monitors and reports environmental conditions but also provides bespoke comfort intervention measures, thus promoting individualised energy-wise user behaviour in office spaces. Drawing insights from past studies, our IoT platform was designed to achieve four tasks—to enable user alerts when a desired environmental parameter breaches a set threshold, initiate a questionnaire survey on users’ comfort and productivity prompted by the alerts, provide subsequent mitigation measures for the users, and provide a follow-up questionnaire that closes the IoT system loop.

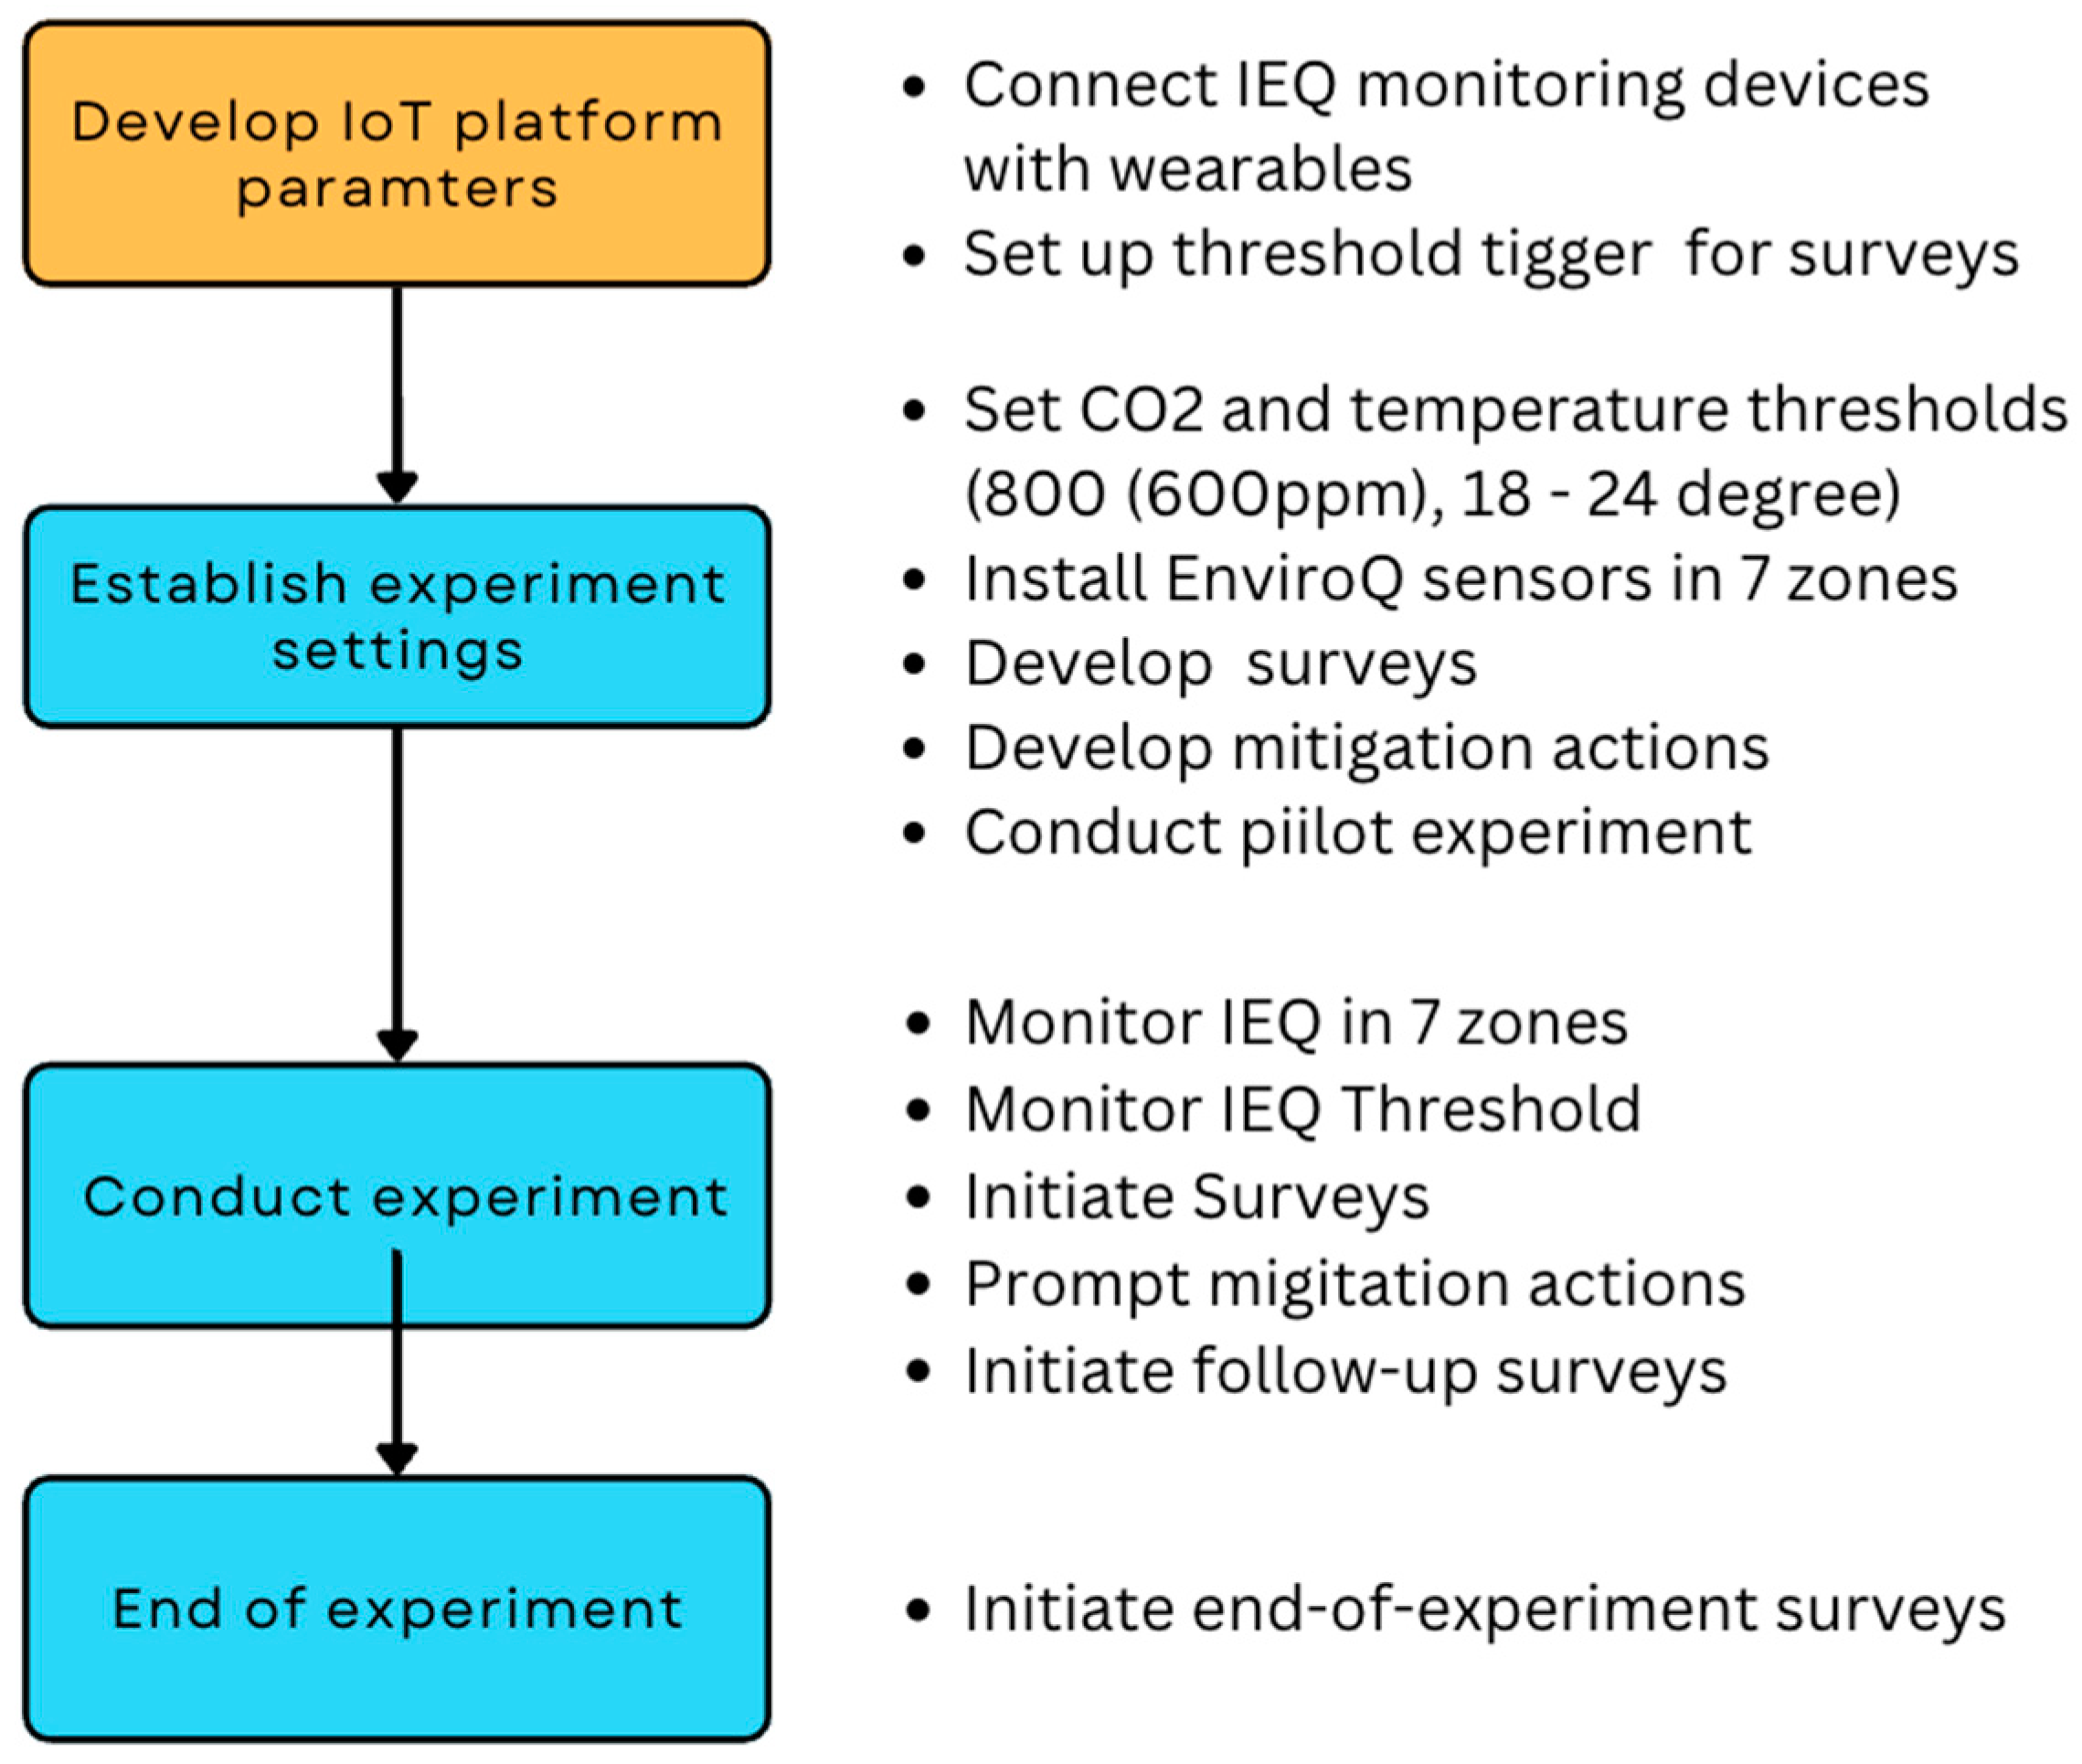
3.1. Experiment Preliminaries

To achieve these tasks, an IoT platform was designed to enable the connectivity and integration of environmental monitoring smart devices with wearable and hand-held devices [58,59]. This facilitated the real-time monitoring and interrelation between objective and subjective (perceived) measurements. The IoT platform aided the right-here-right-now collection of comfort-related data and the deployment of mitigation measures to ratify unsatisfactory IEQ levels immediately, as perceived by users.
The location for the experiment was an open-plan office dedicated to PhD researchers within a university (Figure 2). The office space is fully air-conditioned but has openable windows on the west and north sides of the space. The room has LED lighting, four ventilation units, and heaters installed on the external walls. All windows were kept shut during the experiment to ensure uniformity of the Indoor Air Quality (IAQ).
Smart sensors for monitoring IEQ (termed “EnviroQ Sensors”) were set up strategically in the shared office space (Figure 3). EnviroQ sensors monitor IEQ levels, including CO2 concentration, humidity, dew point, light intensity, and atmospheric pressure at 2 min intervals [60]. For this experiment, temperature and CO2 concentration levels were the IEQ variables tested. These two variables are the most common IEQ variables reported to have an evident effect on user comfort, productivity, and energy behaviour [2,11,20,61,62]. For instance, Laurent et al. [61] found that higher CO2 levels in office buildings were associated with decreased performance. Sadick et al. [62] noted the varied impact of thermal comfort on productivity amongst university employees. Also, limiting the number of variables tested in the experiment reduced the number of alerts participants would receive, limiting the associated distraction and annoyance from their work.
As the office space is air-conditioned, the centralised HVAC system constantly conditioned the space so as not to breach the CO2 concentration threshold of 800 ppm [63,64] and the temperature of 18–23 degrees [60,64,65,66]. Hence, we set the platform to set off an alert every time environmental conditions breach these thresholds.
To collect right-here-right-now user perceptions of their environment, a Micro-Ecological Momentary Assessments (Micro-EMAs) questionnaire was developed [65,67]. The questionnaire was designed to take less than 2 min to answer and was made of questions on how they felt when the CO2 concentration exceeded the 800 ppm threshold (air stuffiness) and how productive and healthy they felt. The participants completed the questions on the relevant smart device the participant had (an Apple Watch for iPhone users and a mobile phone for Android users).
The questions on IEQ were followed with suggestions on possible measures the participants could undertake to improve their perceived comfort and IEQ levels. These measures included opening the doors, taking off or putting on extra clothing, and leaving the rooms for a short break [21]. A follow-up survey was administered to the participants 20 min later to confirm a change in perception.
An end-of-experiment feedback survey was conducted to validate the overall IoT interaction and experience. The survey consisted of closed-ended and open-ended questions covering their perception of the experiment and suggestions for improvements. The surveys were provided to the participants at the end of the experiment.

3.2. Pilot Study

Before deployment of the developed platform, a pilot study was conducted with 3 participants (2 iPhone users and 1 Android phone user) for 2 working days. The iPhone participants were required to wear Apple watches throughout the pilot experiment. During this period, the variables (CO2 and temperature) and threshold were tested for the alert frequencies without any other controls. This was performed to ensure that there were limited external influences from variables not considered in the experiment. Several changes were made to the IoT platform setup based on the pilot findings.
We observed that the CO2 concentration threshold was not triggered frequently (less than once per day on average). This was because the CO2 readings did not exceed this threshold, as the office is a centrally controlled air-conditioned space. It was not a surprise that the ventilation system was set not to exceed this threshold. As such, we reduced the alert threshold from 800 ppm to 600 ppm for the sole purpose of enabling frequent triggering. This CO2 threshold aligns with past works that recommend lower CO2 concentrations for indoor air quality [61,68]. For instance, a Harvard COGfx Study by Laurent et al. [61] suggests that increasing ventilation in buildings, such that CO2 readings are kept at or under 600 ppm, may significantly improve cognitive function.
Also, no alert trigger was observed for temperature, as the temperature readings for the duration of the experiment did not breach the minimum and maximum temperature threshold. Like the CO2 readings, the temperature readings in this air-conditioned space were set not to exceed these thresholds. We did not adjust the threshold as this would result in temperature readings that are not unachievable in air-conditioned spaces, which would be uncomfortable for participants and may impact the real-world applicability of the study. Since the success of this experiment relies on environmental thresholds being exceeded and the prevalent temperature threshold should not be exceeded, we removed temperature as a variable for the experiment.
Finally, the experiment duration was increased to 5 working days (Monday to Friday) to ensure we retrieved sufficient data for analysis.

3.3. Experiment Process

For the experiment, a low-risk ethics approval from the university human ethics committee was obtained, and 10 participants were recruited from the office space. A Participant Information Sheet was provided, and a meeting was held with the participants before the experiment, during which they had the opportunity to ask questions and sign a consent form to participate. As required, the participants had the right to exit the experiment whenever they chose to.
The participants were 6 male and 4 female adults (over the age of 18 years) who had spent more than 6 months in the office space. In total, 7 participants completed the experiment using the Apple Watch, while 3 completed the experiments on an Android smartphone (Table 1).
The space was divided into seven (7) zones. In each zone, an EnviroQ was installed on the wall at a height of 120 cm from the floor. Different participants were allocated workstations near the relevant sensors in each zone, as shown in Table 1.
The devices were configured to trigger an alarm if the CO2 reading exceeded 600 ppm and initiate the perception survey for the participants in the relevant zone through their smartwatch or smartphone. Upon alarm trigger, the participants’ devices (Apple Watches and Android phones) prompted them to answer questions about the air quality and temperature in their designated zones. Subsequently, the system suggested relevant mitigation measures. After 20 min, another set of follow-up questions was asked to explore the effectiveness of the suggested mitigation actions. Figure 4 provides photos of the EnviroQ sensor and Apple Watch used for the experiment.
The experiment was conducted in July during the winter season in New Zealand for the duration of 5 days from 10 AM to 4 PM. All the participants were required to perform their normal work activities for the experiment. Short breaks of 10–20 min were permitted to ensure the participants were in the office space when the alerts happened. The short breaks were noted, and any alerts during these breaks were ignored. At the end of the experiment, a final set of questions was asked to investigate the participants’ experience with the experiment. Figure 5 below provides an overview of the steps taken in this experiment.

4. Results

4.1. Overall Environmental Performance

The overall environmental performance metrics were retrieved from the EnviroQ monitoring dashboard, which provides a real-time visual representation of the Health Score (how healthy the building is), airborne index (the risk of airborne virus transmission), focus index (the impact on cognitive function), comfort index (how the building makes users feels), and mould index (the risk of mould growth in the space) [69]. As expected in an air-conditioned office space, the environmental readings were very good during the experiment week, with a health score of 10/10, 100% airborne index, and 0% of the time spent at an unproductive level. For the comfort index, only 14% of the time was spent in cold conditions. The office had no mould risk.

4.2. CO2 Concentration Readings in the Office Space and at the Different Zones

The real-time CO2 concentration reading was recorded at the time of alarm triggers. Figure 6 shows the minimum, maximum, and median for each zone. The analysis of the recorded data shows CO2 concentration readings ranged between 632 to 712 ppm with an overall median of 649 ppm.

4.3. Number of Alert Triggers

Sixty-two alerts were triggered during the five days of the experiment at the seven zones combined. Different zones experienced different numbers of alerts per day (Table 2).
We examined whether there was any statistically significant difference between these zones. First, a normality test with a significance value of 0.05 was conducted for the CO2 concentration reading to identify the type of distribution for this variable. The result shows the p-value < 0.001, which means that the null hypothesis of this test is rejected, and the data are not normally distributed. Consequently, the Kruskal–Wallis test was chosen to analyse the differences among zones. The result shows a p-value of 0.705, which is above the significance value of 0.05. Therefore, we conclude that there is no statistically significant difference between the seven zones in terms of CO2 concentration reading.

4.4. Perception of Indoor Air Quality and Its Productivity Level upon CO2 Alert Trigger

Overall, 64 responses to the first round of surveys were submitted for comfort perception. In the follow-up survey from the respondents of the first round, only 52 responses were received and analysed.
In the first round of the survey, upon the trigger of the CO2 concentration alert, participants were asked to express how they felt on a scale of 1 (low) to 5 (high) about the stuffiness of the air, their productivity level, and their perception of how healthy the environment is. The analysis (Table 3) indicates that, overall, the respondents felt neutral about all three areas. Specifically, the air quality was perceived to be slightly above average (m = 2.79), which coincided with the CO2 concentration readings measured being slightly above the acceptable threshold (632–712 ppm). While this did not significantly affect their productivity and health, the participants were not at their highest productivity and healthy readings (m = 3.29; 3.31, respectively).

4.5. Correlation between CO2 Concentration Reading and the Perception of Participants about Stuffiness of Indoor Air, Productivity Level, and Health of the Environment

According to Khamis [70], the Spearman rank correlation coefficient can be used to examine the existence and strength of association between the two variables when one of the variables is continuous (CO2 concentration reading) and the other is ordinal (Likert scale of 1 to 5) with a large number of levels (5 and above). Therefore, this test used SPSS to examine the relationship between CO2 concentration reading and participants’ perception of the air’s stuffiness. The result (Table 4) shows the p-value = 0.004 (below the significance level of 0.01), which means that we can reject the null hypothesis and conclude that there is a statistically significant correlation between the two variables. The correlation coefficient (r) = 0.395 suggests that this relationship is positive and moderate.
A similar test was conducted to investigate the relationship between CO2 concentration reading and the productivity of the participants. The p-value of 0.006 and the correlation coefficient (r) of −0.379 suggest a moderate negative relationship between the two, which is statistically significant.
However, concerning the association between CO2 concentration reading and perception of healthiness of the environment, the analysis found no statistically significant relationship (p-value = 0.058).

4.6. Effectiveness of Mitigation Measures

Among the 52 responses to the second round of the survey, mitigation actions were only taken 24 times. In 15 out of the 52 responses, participants wanted to take mitigation actions but could not do so due to the limitation of their work requirements. For 13 responses, they did not take any mitigation action as it was not perceived as necessary. This indicates that work requirements and expectations can limit user–building interaction and subsequent energy use management.
Hence, we analysed the remaining 24 responses for the effect of the mitigation action on perceived air stuffiness, productivity, and a healthy environment. We conducted a Wilcoxon Test to compare the scores of pre-mitigation and post-mitigation perceptions. The results (see Table 5) revealed that the perception of participants about the stuffiness of the air, productivity, and a healthy environment was significantly better after taking the mitigation action. Specifically, the participants perceived the air stuffiness to be less (M = 2.58; SD = 0.717), the office environment to be healthier (M = 3.63; SD = 0.647), and their productivity to be higher (M = 3.42; SD = 0.584).
The test also showed that while there was a significant difference between the participants’ perception of air stuffiness (p = 0.018) before and after the mitigation actions, no statistically significant difference was found between participants’ productivity level (p = 0.132) and their perception of a healthy environment (p = 0.059) before and after mitigation actions.

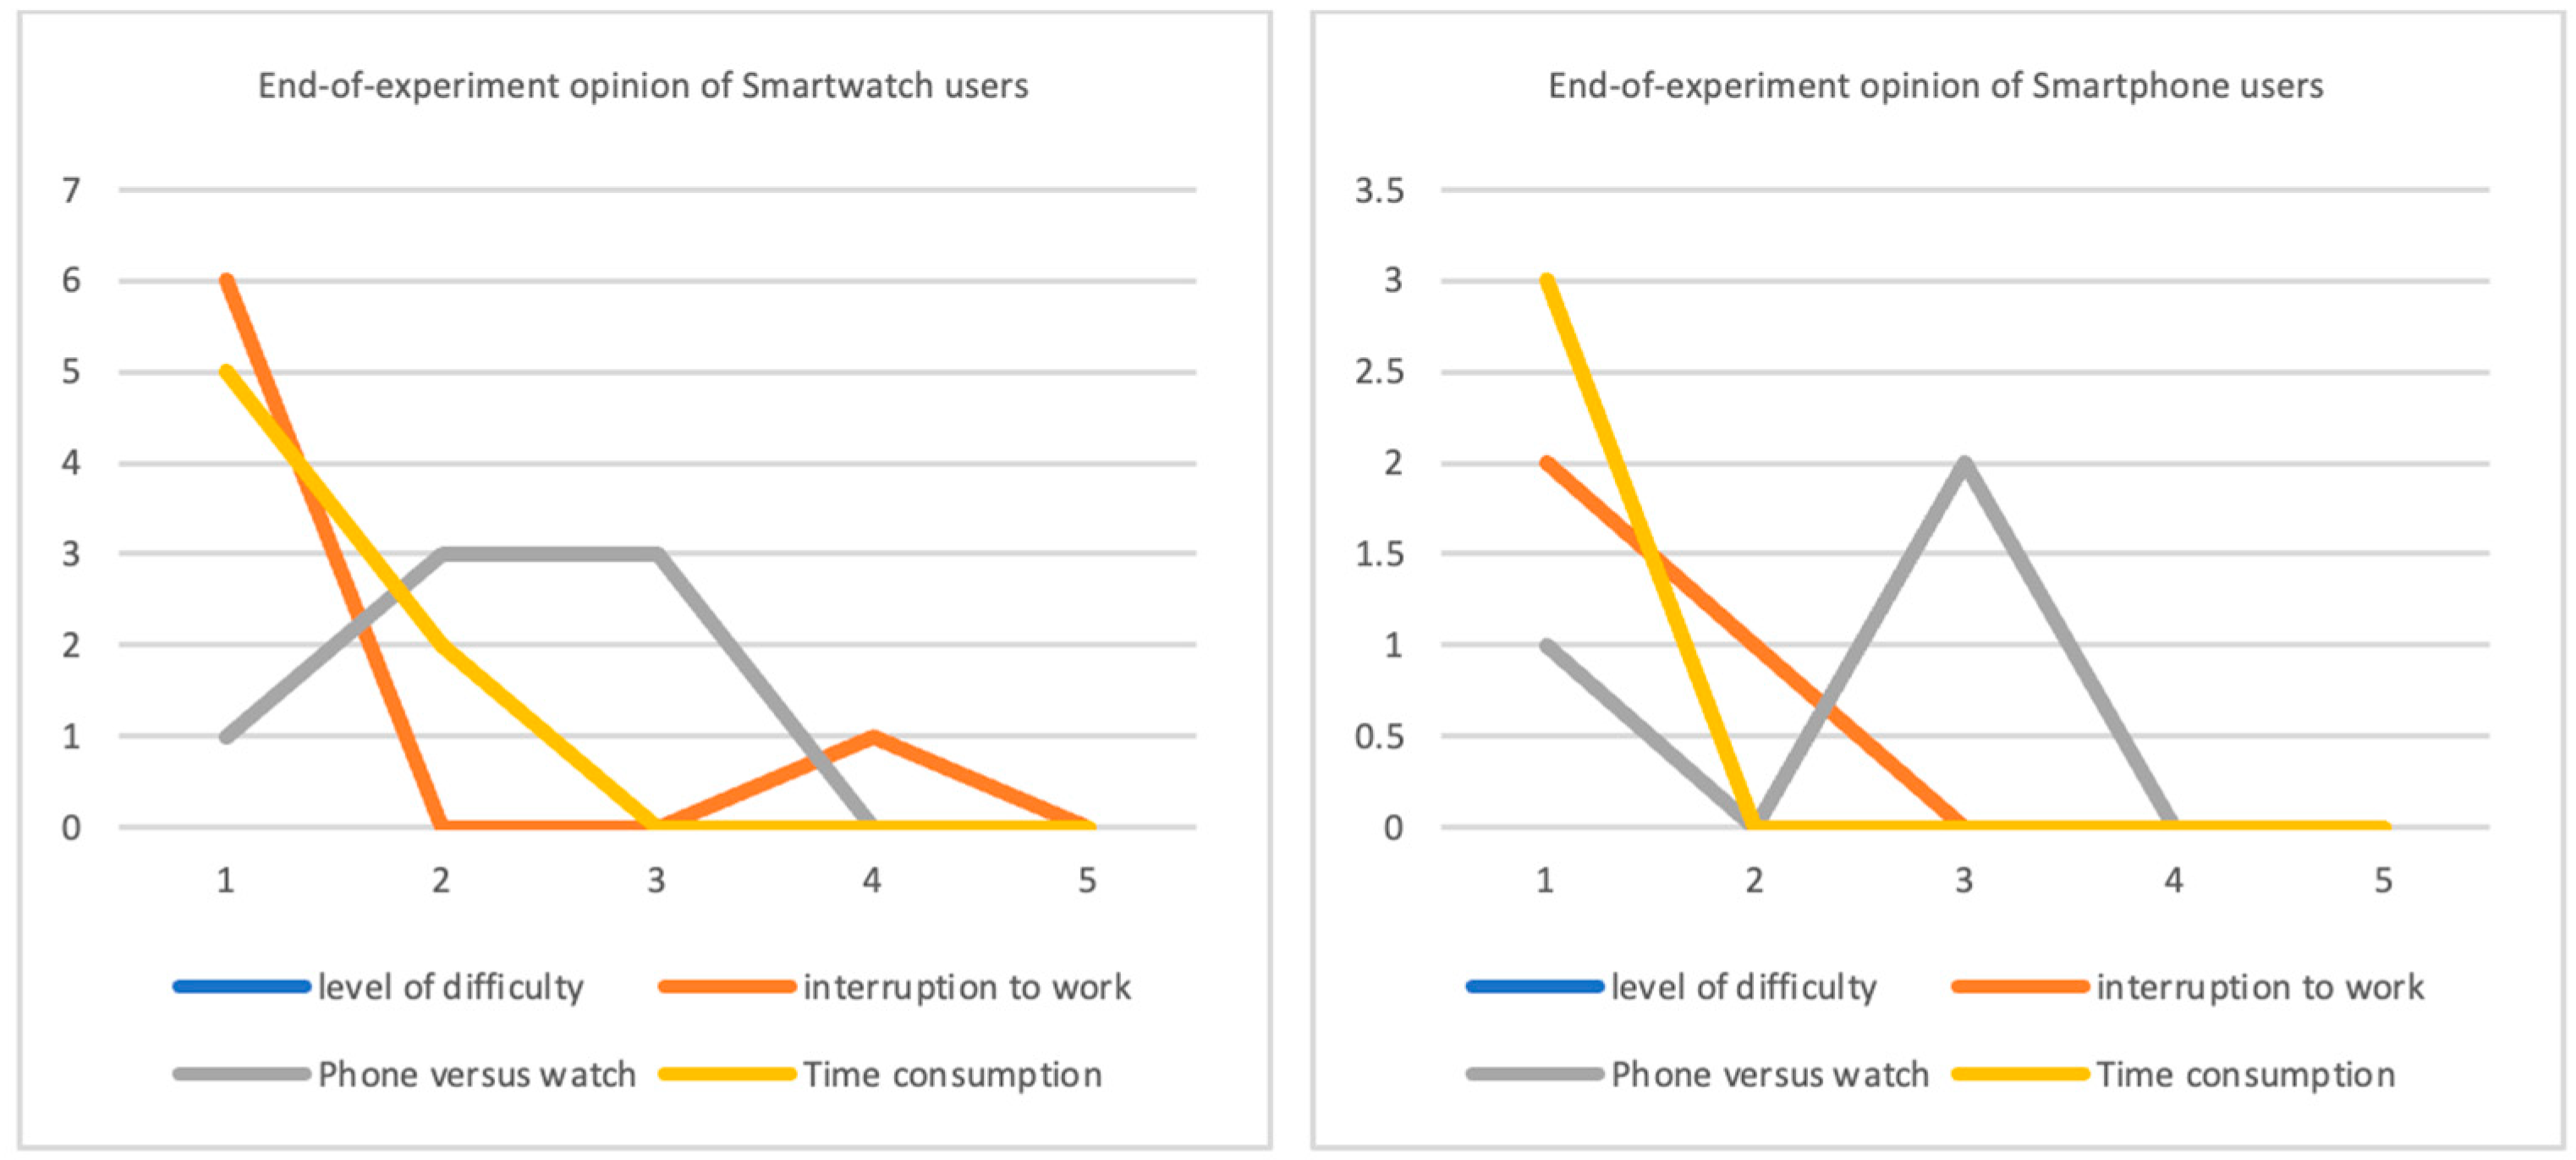
4.7. Participants’ Perception of User Friendliness of the Developed IoT Platform

At the end of the survey, the participants were provided with a questionnaire to gather feedback on their survey experience (Figure 7). The participants were asked to respond on a Likert scale ranging from 1 to 5, where 1 corresponded to “very easy”, 2 to “easy”, 3 to “neither easy nor difficult”, 4 to “difficult”, and 5 to “very difficult” for evaluating their experience with the experiment. Among the seven Apple watch users, six indicated that using the smartwatches for the survey was very easy, whereas one reported it was easy. Similarly, among the three smartphone users, two found it was very easy to use the smartphone for the survey, and one found it easy.
Furthermore, participants were queried about the extent to which they felt interrupted during the survey. The Likert scale included options such as 1 for “very less interrupted”, 2 for “little interrupted”, 3 for “neither interrupted nor uninterrupted”, 4 for “interrupted”, and 5 for “more interrupted”. Six smartwatch users mentioned feeling very less interrupted, while one reported feeling interrupted during the survey. On the other hand, two smartphone users stated feeling very less interrupted, while one reported feeling little interrupted.
Regardless of their device type, most participants found it easy to use during the trial. Additionally, a significant portion of smartwatch and smartphone users felt significantly very less interrupted during the survey.
To analyse the experiment’s user-friendliness, participants were asked to consider their hypothetical experience with the alternative device (smartwatch users contemplating smartphone usage and vice versa) and its potential impact on interruption. Most smartwatch users acknowledged that they would likely feel less interrupted if using phones to answer the survey. In contrast, smartphone users indicated they would feel neither interrupted nor uninterrupted with smartwatches compared to smartphones.
Finally, participants were asked about the use of time. For assessing time consumption, participants were instructed to use the Likert scale with 1 indicating “very less time consumed”, 2 for “little time consumed”, 3 for “neither little nor much time consumed”, 4 for “much time consumed”, and 5 for “very much time consumed”. Considering the participants’ use of time, despite the device, participants stated that answering the surveys resulted in very little time consumed throughout the trial period.

5. Discussion

Using IoT for building monitoring and feedback provides a comprehensive and intelligent approach to operational energy efficiency, reduced maintenance costs, enhanced occupant comfort, and even sustainability. Our study provides experimental evidence of IoT’s enhanced benefits to the future of facilities management and energy efficiency in buildings.
We discuss the findings of our experiment cautiously, noting the limitations of experimental studies that do not represent real-life scenarios [71] and the various biases associated with self-evaluations [30]. That said, research has shown the usefulness of experiments in addressing real-world environmental problems [67,72]. Maisha et al. [67] experimented with the use of wearable technology to facilitate occupant collaborations in flexible workspaces. Zhao et al. [72] developed a novel IAQ detector integrated with multiple communications interfaces for office environments. Such experimental studies provide the essential basis for further application of novel approaches that address real-world problems such as energy efficiency. Our findings will lay a good foundation for further studies that encourage more user energy-efficient interactions with buildings.
Firstly, our findings showed a significant relationship between measured CO2 concentration readings and perceived air stuffiness (p = 0.004) and productivity (p = 0.006). While not significant, we also observed a relationship between CO2 concentration readings and perceived healthy environment (p = 0.058)
Most importantly, our experiment indicated improvements in user perception of the air quality as a result of the energy-efficient comfort mitigation actions. Our findings showed that the perception of participants about the stuffiness of the air was significantly better after taking the mitigation action. This can be associated with the perceived control the experiment enabled the participants to adjust their behaviour when required. Existing research supports our findings and shows the relationship between perceived control and IEQ satisfaction and comfort. For instance, Altomonte et al. [73] noted that personal control can provide significant opportunities for enriched comfort, energy performance, and enhanced satisfaction with the indoor environment. Pastore and Andersen [74] observed that the amount of personal control on façade operation can impact the occupants’ perception of the indoor environmental quality. Weerasinghe et al. [20] maintained that the availability of specific user controls was the main predictor of most occupant energy behaviours.
Furthermore, we found no statistically significant difference between participants’ productivity level and their perception of a healthy environment before and after mitigation actions. It is important to note that this experiment was conducted in an air-conditioned shared office space wherein the environmental variables are centrally controlled. This means the CO2 and temperature readings were kept at acceptable levels, and no high concentration readings were recorded (temperature = 20–23 degrees, CO2 = 632–712 ppm). These levels coincided with the participants’ perceived positive air quality, productivity, and healthy environment, as the perception scores were not alarmingly poor. However, none of these variables were perceived to be at optimal levels, indicating notable discomfort and dissatisfaction amongst the participants. Also, it was noteworthy to observe that irrespective of the similarities in recorded CO2 concentration readings being within acceptable ranges, the perception of air stuffiness differed amongst the participants. This shows support for past works that maintain the differences in user expectations and characteristics that influence their comfort perceptions [8,11].
Also, we noted that the relationship between CO2 concentration and perceived air quality, productivity, and health was interesting. A significant positive relationship was found between CO2 concentration and perceived air quality, indicating that the higher the CO2 concentration, the stuffier the air quality was perceived to be. Also, a negative relationship existed between CO2 concentration and productivity, suggesting that the higher the CO2 concentration, the less productive the participants perceived they were. These results support past works [61,68]. Laurent et al. [61] found that higher PM2.5 and lower ventilation rates, as assessed by CO2 concentration, were associated with slower response times and reduced accuracy. Satish et al. [68] also found effects of CO2, independent of ventilation, when concentrations exceeded 1000 and 2500 ppm relative to a 600 ppm baseline. Notably, there are other findings that oppose this relationship [6,75]. For instance, Cao et al. [75] found that elevated CO2 concentration below 5000 ppm did not affect the participants’ perception and short-term working memory. Chen et al. [6] observed no clear link between pure CO2 levels below 2100 ppm and cognitive performance, perceived indoor environment quality and health symptoms. A plausible explanation could be the dissimilarities in experimental settings between these studies and ours. The participants in these experiments were exposed to pure CO2 concentration, whereas our study measured the prevalent CO2 concentration in a real-life office space. Also, it is possible that the participants perceived air quality as not the sole function of the CO2 concentration, as existing studies have highlighted the influence of other variables that may not be environmental on building users’ perceptions [8,71].
In contrast, no significant relationship was observed between CO2 concentration and health, insinuating that the CO2 concentration was not at levels perceived to be detrimental to the participant’s health. These findings suggest that while the CO2 concentration may not be perceived as critical by occupants in an indoor space, it still impacts their productivity.
While providing real-time insight into indoor temperature and CO2 concentration data, our experiment extends this further by enabling responsive occupant interaction with their immediate environment and comfort. The participants of this study were able to take the suggested mitigation measures as they suited them. Providing at-the-moment mitigation measures in relation to the prevailing IEQ accords building users’ control over their comfort and satisfaction. It also reduces the need to centrally adjust the IEQ, especially in air-conditioned indoor environments.
Considering the effectiveness of the developed IoT platform, it was a success to note that most participants found the process very easy to participate in. They noted there was very little time consumed and significantly fewer interruptions.

Lessons Learned

Despite the success of this experiment, we note some lessons learned during the process that would be useful for future studies and industry applications. We observed that the developed IoT system best suits individual user interaction and meditation actions. For large-scale use to retrieve accurate data that can inform large-scale decision-making on the facility’s management, external variables influencing users’ comfort and productivity should be minimised.
Also, we note that focusing on only one type of variable (and controlling the others as much as possible) and alert triggers made finding correlations in the resulting data set much easier. Further studies could explore the capabilities of including more IEQ parameters to see if there are significant changes in resultant comfort mitigation actions recommended. For instance, the potential influence of other factors, such as metabolic rate, clothing insulation, age, sex, etc., could impact the findings of future studies.
This experiment highlights various applications for the industry. Firstly, it can be used as an effective reporting medium for individual user comfort perceptions and energy behaviour. This is useful to facilitate proactive measures for energy management and user comfort in buildings. Also, by providing users with bespoke energy-wise comfort mitigation actions, user impact on energy use during building operation is significantly reduced, and user comfort is increased, enabling the positive energy management of buildings. Furthermore, its application extends beyond office environments as it can be applied in residential settings to promote energy-wise user behaviour in homes, especially in large-scale apartments and residential units.

6. Conclusions

This paper outlines a study on the development of an IoT-enhanced POE that enables positive energy behaviour of building users while achieving comfort in office environments, using responsiveness to real-time IEQ monitoring for user comfort and productivity mitigation measures. The purpose was to provide a system that mitigates the common issue of centralised air conditioning that limits occupants’ control over their immediate environment.
We designed an IoT platform to collect real-time IEQ data, prompt alert triggers for IEQ variables exceeding acceptable thresholds, collect user comfort data, and provide at-the-moment comfort mitigation actions. The results give insight into the benefits of IoT integration in POE exercises, especially for individual building users. This study also highlighted the importance of maintaining a conducive indoor environment by examining how variations in air quality, particularly CO2 levels, affect workers’ perception of their productivity and healthy environments in this shared office layout.
Specifically, we observed that IAQ perception does differ amongst users irrespective of the similarities in recorded CO2 levels being within acceptable ranges. Also, with the integration of our IoT system, the participants’ perceptions of the stuffiness of the air were significantly lowered after taking the energy-wise comfort mitigation action. This was because these were individualised and bespoke at-the-moment actions at the control and discretion of the participants. As such, we evidenced the benefits of user behaviour and interactions in achieving comfort while reducing energy use in buildings.
In future work, larger case study deployments across different building types with diverse sets of occupants could be used to compare the IoT design features. For instance, testing this approach on commercial office settings would be beneficial in comparing any differences between user characteristics and environmental settings. In addition, there are opportunities to measure other IEQ variables and include occupants’ biometrics, providing richer data for the management of buildings. The results may influence methods for improving air quality and, in turn, improve the conditions under which students learn and work in comparable educational environments. This study can also be extended to residential settings to improve occupants’ interaction and encourage positive energy behaviour in homes.

Author Contributions

Conceptualisation, E.R.; Methodology, E.R.; Experiment Process, E.R., K.W. and A.H.; Formal Analysis, M.M. and K.P.; Data Curation, E.R., M.M. and K.P.; Writing—Original Draft Preparation, E.R., M.M. and K.P.; Writing—Review and Editing, E.R. All authors have read and agreed to the published version of the manuscript.

Funding

No funding information is to be declared.

Institutional Review Board Statement

All subjects gave their informed consent for inclusion before they participated in the study. The study was conducted in accordance with the protocol approved by the Massey University Human Ethics Committee (MUHEC) (4000026459).

Data Availability Statement

The data sets presented in this article are not readily available because the data are part of an ongoing study.

Acknowledgments

We are indebted to the IT specialist who worked on this project with the research team—Liam Fitzmaurice. We are also grateful to the students at the School of Built Environment, Massey University, who participated in this experiment.

Conflicts of Interest

The authors declare no conflicts of interest.

References

  1. Marchetti, N.; Cavazzini, A.; Pasti, L.; Catani, M.; Malagù, C.; Guidi, V. A campus sustainability initiative: Indoor air quality monitoring in classrooms. In Proceedings of the 2015 XVIII AISEM Annual Conference, Trento, Italy, 3–5 February 2015; pp. 1–4. [Google Scholar] [CrossRef]
  2. Dai, C.; Zhang, H.; Arens, E.; Lian, Z. Machine learning approaches to predict thermal demands using skin temperatures: Steady-state conditions. Build. Environ. 2017, 114, 1–10. [Google Scholar] [CrossRef]
  3. Al Horr, Y.; Arif, M.; Kaushik, A.; Mazroei, A.; Katafygiotou, M.; Elsarrag, E. Occupant productivity and office indoor environment quality: A review of the literature. Build. Environ. 2016, 105, 369–389. [Google Scholar] [CrossRef]
  4. Agoplan, N. Don’t Breathe Easy: The Adverse Effects of Poor Indoor Air Quality. RenewAire Energy Recovery Ventilation. Available online: https://www.renewaire.com/wp-content/uploads/2017/09/MAR_LIT_107_RGB_White_Paper_Adverse_Effects_of_Poor_Indoor_Air_Quality.pdf (accessed on 6 June 2024).
  5. Salthammer, T.; Morrison, G.C. Temperature and indoor environments. Indoor Air 2022, 32, e13022. [Google Scholar] [CrossRef]
  6. Chen, D.; Huebner, G.; Bagkeris, E.; Ucci, M.; Mumovic, D. Effects of short-term exposure to moderate pure carbon dioxide levels on cognitive performance, health symptoms and perceived indoor environment quality. Build. Environ. 2023, 245, 110967. [Google Scholar] [CrossRef]
  7. Joshi, S.M. The sick building syndrome. Indian J. Occup. Environ. Med. 2008, 12, 61–64. [Google Scholar] [CrossRef]
  8. Onyeizu, E. Can Architecture Increase Productivity? A Case of Green Buildings. Ph.D. Thesis, The University of Auckland, Auckland, New Zealand, 2014. [Google Scholar]
  9. UNEP. 2022 Global Status Report for Buildings and Construction; UNEP: Nairobi, Kenya, 2022. [Google Scholar]
  10. Rasheed, E.O.; Khoshbakht, M.; Baird, G. Does the Number of Occupants in an Office Influence Individual Perceptions of Comfort and Productivity?-New Evidence from 5000 Office Workers. Buildings 2019, 9, 73. [Google Scholar] [CrossRef]
  11. Rasheed, E.O.; Khoshbakht, M.; Baird, G. “Do office workers’ comments corroborate the ratings they give their buildings?” A qualitative analysis of comments on operational factors in the workplace. Facilities 2024, 42, 274–320. [Google Scholar] [CrossRef]
  12. World Health Organization [WHO]. Global Action Plan on Physical Activity 2018–2030: More Active People for a Healthier World; World Health Organization: Geneva, Switzerland, 2019.
  13. NoVA Environmental Solutions (2024) the True Cost of Poor Indoor Air Quality. Available online: https://www.novaenvironmentalsolutions.com/the-true-cost-of-poor-indoor-air-quality/ (accessed on 6 June 2024).
  14. Berg, B.L.; Dowdell, D.C.; Curtis, M.D. New Zealand Whole-Building Whole-of-Life Framework: Development of Reference Office Buildings for Use in Early Design; BRANZ: Porirua, New Zealand, 2016. [Google Scholar]
  15. World Green Building Council [WorldGBC]. Building the Business Case: Health, Wellbeing and Productivity in Green Offices. 2016. Available online: https://worldgbc.org/article/building-the-business-case-health-wellbeing-and-productivity-in-green-offices/ (accessed on 6 June 2024).
  16. IEA. Tracking Clean Energy Progress 2023; IEA: Paris, France, 2023. [Google Scholar]
  17. Byrd, H.; Matthewman, S.; Rasheed, E. Air-conditioning in New Zealand: Power and policy. Build. Cities 2022, 3, 1–9. [Google Scholar] [CrossRef]
  18. Hong, T.; Taylor-Lange, S.C.; D’Oca, S.; Yan, D.; Corgnati, S.P. Advances in research and applications of energy-related occupant behavior in buildings. Energy Build. 2016, 116, 694–702. [Google Scholar] [CrossRef]
  19. Rasheed, E.; Rotimi, J.; Vilasini, N.; Weerasinghe, A. Proactive post-occupancy evaluation. Build 2021, 185, 68–69. [Google Scholar]
  20. Weerasinghe, A.S.; Rasheed, E.O.; Rotimi, J.O. Occupants’ Decision-Making of Their Energy Behaviours in Office Environments: A Case of New Zealand. Sustainability 2022, 15, 2305. [Google Scholar] [CrossRef]
  21. Weerasinghe, A.; Rotimi, J.; Rasheed, E.O. Modelling of underlying social psychological effects on occupant energy-related behaviours. Build. Environ. 2023, 231, 110055. [Google Scholar] [CrossRef]
  22. Lou, H.; Ou, D. The effects of speech intelligibility on English scientific literature reading in Chinese open-plan offices. J. Acoust. Soc. Am. 2020, 147, EL1–EL6. [Google Scholar] [CrossRef] [PubMed]
  23. Roberts, C.J.; Edwards, D.J.; Sing, M.C.P.; Aigbavboa, C. Post-Occupancy Evaluation: Process Delineation and Implementation Trends in the UK Higher Education Sector. Archit. Eng. Des. Manag. 2021, 19, 125–147. [Google Scholar] [CrossRef]
  24. Zimring, C.; Rosenheck, T. Getting It Right the Second or Third Time Rather than the Sixth or Seventh. California Department of General Services. DGS POE Program. 2001. Available online: http://www.poe.dgs.ca.gov/info/ffctalk.asp (accessed on 6 June 2024).
  25. Zimmerman, A.; Martin, M. Post-occupancy evaluation: Benefits and barriers. Build. Res. Inf. 2001, 29, 168–174. [Google Scholar] [CrossRef]
  26. Ahmed, H.; Edwards, D.J.; Lai, J.H.K.; Roberts, C.; Debrah, C.; Owusu-Manu, D.-G.; Thwala, W.D. Post occupancy evaluation of school refurbishment projects: Multiple case study in the, U.K. Buildings 2021, 11, 169. [Google Scholar] [CrossRef]
  27. Pomponi, F.; Moncaster, A. Circular economy for the built environment: A research framework. J. Clean. Prod. 2017, 143, 710–718. [Google Scholar] [CrossRef]
  28. Lolli, F.; Marinello, S.; Coruzzolo, A.M.; Butturi, M.A. Post-Occupancy Evaluation’s (POE) Applications for Improving Indoor Environment Quality (IEQ). Toxics 2022, 10, 626. [Google Scholar] [CrossRef]
  29. Alborz, N.; Berardi, U. A post occupancy evaluation framework for LEED certified U.S higher education residence Halls. Procedia Eng. 2015, 118, 19–27. [Google Scholar] [CrossRef]
  30. Rasheed, E.; Byrd, H. Can self-evaluation measure the effect of IEQ on productivity? A review of literature. Facilities 2017, 35, 601–621. [Google Scholar] [CrossRef]
  31. Bordass, B.; Leaman, A. Making feedback and post-occupancy evaluation routine 3: Case studies of the use of techniques in the feedback portfolio. Build. Res. Inf. 2005, 33, 361–375. [Google Scholar] [CrossRef]
  32. BUS Methodology. Occupant Satisfaction Evaluation. 2017. Available online: https://busmethodology.org.uk/ (accessed on 26 March 2024).
  33. Center for the Built Environment (CBE). CBE Occupant Survey. Available online: https://cbe.berkeley.edu/resources/occupant-survey/ (accessed on 13 February 2024).
  34. Building Occupants Survey System Australia (BOSSA). Post Occupancy Evaluation (POE): BOSSA Time-Lapse. Available online: http://www.bossasystem.com/postoccupancy-evaluation (accessed on 13 February 2024).
  35. Alhammad, M.; Eames, M.; Vinai, R. Enhancing Building Energy Efficiency through Building Information Modeling (BIM) and Building Energy Modeling (BEM) Integration: A Systematic Review. Buildings 2024, 14, 581. [Google Scholar] [CrossRef]
  36. Gerrish, T.; Ruikar, K.; Cook, M.; Johnson, M.; Phillip, M.; Lowry, C. BIM application to building energy performance visualisation and management: Challenges and potential. Energy Build. 2017, 144, 218–228. [Google Scholar] [CrossRef]
  37. Srivastava & Parvez. GREEN BIM—It’s Various Aspects and Future Potential for Construction of Green Building Projects. Paper Uploaded to ResearchGate. 2021. Available online: https://www.researchgate.net/publication/349026585_GREEN_BIM_-It’s_Various_Aspects_and_Future_Potential_for_Construction_of_Green_Building_Projects (accessed on 6 June 2024).
  38. Surma, M.J.; Nunes, R.J.; Rook, C.; Loder, A. Assessing Employee Engagement in a Post-COVID-19 Workplace Ecosystem. Sustainability 2020, 13, 11443. [Google Scholar] [CrossRef]
  39. Tripathi, I.; Froese, T.M. Applicability of BIM-IoT-GIS integrated digital twins for post-occupancy evaluations. Front. Built Environ. 2023, 9, 1103743. [Google Scholar] [CrossRef]
  40. Lou, H.; Ou, D. A comparative field study of indoor environmental quality in two types of open-plan offices: Open-plan administrative offices and open-plan research offices. Build. Environ. 2019, 148, 394–404. [Google Scholar] [CrossRef]
  41. Kok, G.; Lo, S.H.; Peters, G.J.Y.; Ruiter, R.A. Changing energy-related behavior: An Intervention Mapping approach. Energy Policy 2011, 39, 5280–5286. [Google Scholar] [CrossRef]
  42. Rafsanjani, H.N.; Moayedi, S.; Ahn, C.R.; Alahmad, M. A load-disaggregation framework to sense personalized energy-use information in commercial buildings. Energy Build. 2020, 207, 109633. [Google Scholar] [CrossRef]
  43. Pan, Y.; Zhang, L.M. A BIM-data mining integrated digital twin framework for advanced project management. Autom. Constr. 2021, 124, 103564. [Google Scholar] [CrossRef]
  44. Kor, M.; Yitmen, I.; Alizadehsalehi, S. An investigation for integration of deep learning and digital twins towards Construction 4.0. Smart Sustain. Built Environ. 2022, 12, 461–487. [Google Scholar] [CrossRef]
  45. Jia, M.; Komeily, A.; Wang, Y.; Srinivasan, R.S. Adopting Internet of Things for the development of smart buildings: A review of enabling technologies and applications. Autom. Constr. 2019, 101, 111–126. [Google Scholar] [CrossRef]
  46. Bandyopadhyay, D.; Sen, J. Internet of things: Applications and challenges in technology and standardization. Wirel. Pers. Commun. 2011, 58, 49–69. [Google Scholar] [CrossRef]
  47. Whitmore, A.; Agarwal, A.; Da Xu, L. The internet of things-a survey of topics and trends. Inf. Syst. Front. 2015, 17, 261–274. [Google Scholar] [CrossRef]
  48. Nandanwar, H.; Chauhan, A. IoT-based smart environment monitoring systems: A key to smart and clean urban living spaces. In Proceedings of the 2021 Asian Conference on Innovation in Technology (ASIANCON), Pune, India, 27–29 August 2021; pp. 1–9. [Google Scholar] [CrossRef]
  49. Parmar, G.; Lakhani, S.; Chattopadhyay, M.K. An IoT-based low-cost air pollution monitoring system. In Proceedings of the 2017 International Conference on Recent Innovations in Signal Processing and Embedded Systems (RISE), Bhopal, India, 27–29 October 2017; pp. 524–528. [Google Scholar] [CrossRef]
  50. Rinaldi, S.; Flammini, A.; Tagliabue, L.C.; Ciribini, A.L. On the use of IoT sensors for indoor conditions assessment tuning of occupancy rates models. In Proceedings of the 2018 Workshop on Metrology for Industry, 4.0. and IoT, Brescia, Italy, 16–18 April 2018; pp. 123–128. [Google Scholar] [CrossRef]
  51. García-Monge, M.; Zalba, B.; Casas, R.; Cano, E.; Guillén-Lambea, S.; López-Mesa, B.; Martínez, I. Is IoT monitoring key to improve building energy efficiency? Case study of a smart campus in Spain. Energy Build. 2023, 285, 112882. [Google Scholar] [CrossRef]
  52. Stephenson, J.; Barton, B.; Carrington, G.; Gnoth, D.; Lawson, R.; Thorsnes, P. Energy cultures: A framework for understanding energy behaviours. Energy Pol. 2010, 38, 6120–6129. [Google Scholar] [CrossRef]
  53. Stephenson, J.; Barton, B.; Carrington, G.; Doering, A.; Ford, R.; Hopkins, D.; Wooliscroft, B. The energy cultures framework: Exploring the role of norms, practices, and material culture in shaping energy behaviour in New Zealand. Energy Res. Soc. Sci. 2015, 7, 117–123. [Google Scholar] [CrossRef]
  54. Ma, G.; Andrews-Speed, P.; Zhang, J. Chinese consumer attitudes towards energy saving: The case of household electrical appliances in Chongqing. Energy Pol. 2013, 56, 591–602. [Google Scholar] [CrossRef]
  55. Mi, L.; Xu, T.; Sun, Y.; Yang, H.; Wang, B.; Gan, X.; Qiao, L. Promoting differentiated energy savings: Analysis of the psychological motivation of households with different energy consumption levels. Energy 2021, 218, 119563. [Google Scholar] [CrossRef]
  56. Jo, S.S.; Lee, S.H.; Leem, Y. Temporal Changes in Air Quality According to Land-Use Using Real Time Big Data from Smart Sensors in Korea. Sensors 2019, 20, 6374. [Google Scholar] [CrossRef] [PubMed]
  57. Firdhous, M.F.M.; Sudantha, B.H.; Karunaratne, P.M. IoT enabled proactive indoor air quality monitoring system for sustainable health management. In Proceedings of the 2017 2nd International Conference on Computing and Communications Technologies (ICCCT), Chennai, India, 23–24 February 2017; pp. 216–221. [Google Scholar] [CrossRef]
  58. Kureshi, R.R.; Thakker, D.; Mishra, B.K.; Barnes, J. From Raising Awareness to a Behavioural Change: A Case Study of Indoor Air Quality Improvement Using IoT and COM-B Model. Sensors 2023, 23, 3613. [Google Scholar] [CrossRef]
  59. Marques, G.; Pitarma, R. An Internet of Things-Based Environmental Quality Management System to Supervise the Indoor Laboratory Conditions. Appl. Sci. 2018, 9, 438. [Google Scholar] [CrossRef]
  60. World Health Organization Air Quality Guidelines (WHO AQG). WHO Global Air Quality Guidelines: Particulate Matter (PM2.5 and PM10)‚ Ozone, Nitrogen Dioxide, Sulfur Dioxide and Carbon Monoxide. 2021. Available online: https://www.who.int/publications/i/item/9789240034228 (accessed on 1 June 2024).
  61. Laurent, J.; MacNaughton, P.; Jones, E.; Young, A.; Bliss, M.; Flanigan, S.; Vallarino, J.; Chen, L.; Cao, X.; Allen, J. Associations between acute exposures to PM2.5 and carbon dioxide indoors and cognitive function in office workers: A multicountry longitudinal prospective observational study. Environ. Res. Lett. 2021, 16, 094047. [Google Scholar] [CrossRef] [PubMed]
  62. Sadick, A.-M.; Kpamma, Z.E.; Agyefi-Mensah, S. Impact of indoor environmental quality on job satisfaction and self-reported productivity of university employees in a tropical African climate. Build. Environ. 2020, 181, 107102. [Google Scholar] [CrossRef]
  63. CIBSE. TM57 Integrated School Design; CIBSE: London, UK, 2015. [Google Scholar]
  64. NZ DQLS. Designing Quality Learning Spaces (DQLS). Indoor Air Quality & Thermal Comfort; Version 2.0; New Zealand Ministry of Education: Wellington, New Zealand, 2022. [Google Scholar]
  65. Jayathissa, P.; Quintana, M.; Sood, T.; Nazarian, N.; Miller, C. Is your clock-face cozie? A smartwatch methodology for the in-situ collection of occupant comfort data. J. Phys. Conf. Ser. 2019, 1343, 012145. [Google Scholar] [CrossRef]
  66. Arya, V.K.; Rasheed, E.O.; Samarasinghe, D.A.; Wilkinson, S. Comparative Analysis of Indoor Air Quality and Thermal Comfort Standards in School Buildings across New Zealand with Other OECD Countries. Buildings 2024, 14, 1556. [Google Scholar] [CrossRef]
  67. Maisha, K.; Frei, M.; Quintana, M.; Chua, Y.; Jain, R.; Miller, C. Utilizing wearable technology to characterize facilitate occupant collaborations in flexible workspaces. J. Phys. Conf. Ser. 2023, 2600 , 142009. [Google Scholar]
  68. Satish, U.; Mendell, M.J.; Shekhar, K.; Hotchi, T.; Sullivan, D.; Streufert, S.; Fisk, W.J. Is CO2 an indoor pollutant? Direct effects of low-to-moderate CO2 concentrations on human decision-making performance. Environ. Health Perspect. 2012, 120, 1671. [Google Scholar] [CrossRef] [PubMed]
  69. Tether, N.Z. Our Smart IoT Devices. 2024. Available online: https://www.tetherhq.com/products (accessed on 6 June 2024).
  70. Khamis, H. Measures of association: How to choose? J. Diagn. Med. Sonogr. 2008, 24, 155–162. [Google Scholar] [CrossRef]
  71. Byrd, H.; Rasheed, E.O. The Productivity Paradox in Green Buildings. Sustainability 2016, 8, 347. [Google Scholar] [CrossRef]
  72. Zhao, L.; Wu, W.; Li, S. Design and Implementation of an IoT-Based Indoor Air Quality Detector With Multiple Communication Interfaces. IEEE Internet Things J. 2019, 6, 9621–9632. [Google Scholar] [CrossRef]
  73. Altomonte, S.; Schiavon, S.; Kent, M.G.; Brager, G. Indoor environmental quality and occupant satisfaction in green-certified buildings. Build. Res. Inf. 2019, 47, 255–274. [Google Scholar] [CrossRef]
  74. Pastore, L.; Andersen, M. The influence of façade and space design on building occupants’ indoor experience. J. Build. Eng. 2022, 46, 103663. [Google Scholar] [CrossRef]
  75. Cao, X.; Li, P.; Zhang, J.; Pang, L. Effects of carbon dioxide exposure on human cognitive abilities in an enclosed workplace environment. E3S Web Conf. 2022, 356, 05041. [Google Scholar] [CrossRef]
Figure 1. Conceptual framework of the integrated IoT platform in POE. Source: Authors.
Buildings 14 02095 g001
Figure 2. PhD shared spaces layout. S1–S7 are the zones where the EnviroQ sensors were located.
Buildings 14 02095 g002
Figure 3. A photo of the PhD shared office space.
Buildings 14 02095 g003
Figure 4. The EnviroQ sensor and Apple Watches used for the experiment. Source: Authors.
Buildings 14 02095 g004
Figure 5. The steps taken in the experiment. Source: Authors.
Buildings 14 02095 g005
Figure 6. CO2 concentration readings in each zone. Note: *60 in the boxplot indicates an outlier (and its position) in the CO2 levels for Zone 2.
Buildings 14 02095 g006
Figure 7. End-of-experiment opinion of smartwatch and smartphone users. NB: The levels of difficulty (blue line) and time consumption (orange) had the same ratings and are represented on the same line in the chart.
Buildings 14 02095 g007
Table 1. Participants of each zone.
ZonesUserGenderType of Smart Device
Smart WatchSmart Phone
Zone 1User 1Male
Zone 2User 2Male
Zone 3User 3Male
Zone 4User 4Female
User 5Female
User 6Female
Zone 5User 7Male
Zone 6User 8Female
User 9Male
Zone 7User 10Male
Table 2. Number of alarms per day for each zone.
ZoneNumber of Alarms in Zones
Day 1Day 2Day 3Day 4Day 5Total
Zone 14124011
Zone 22311310
Zone 3311128
Zone 4411219
Zone 5122038
Zone 6500106
Zone 72213210
Total22108121162
Table 3. Participant’s perception scores of IAQ and their performance.
Stuffiness of the AirProductivity LevelPerception of a Healthy Environment
Number525252
Mean2.793.293.31
Median3.003.003.00
Std. Deviation0.8930.8000.701
Table 4. Spearman rank correlation coefficient test result.
Stuffiness of the AirProductivity LevelPerception about a Healthy Environment
CO2 Readingp-value0.0040.0060.058
Correlation Coefficient (r)0.395−0.379−0.264
Table 5. Wilcoxon test result.
No = 24 ResponsesStuffiness of the AirProductivity LevelPerception of a Healthy Environment
Before AfterBeforeAfterBeforeAfter
Mean3.002.583.213.423.293.63
Median3.003.003.003.003.004.00
Std. Deviation0.8850.7170.6580.5840.6900.647
p-value0.0180.1320.059
z−2.357−1.508−1.886
r0.48--
Disclaimer/Publisher’s Note: The statements, opinions and data contained in all publications are solely those of the individual author(s) and contributor(s) and not of MDPI and/or the editor(s). MDPI and/or the editor(s) disclaim responsibility for any injury to people or property resulting from any ideas, methods, instructions or products referred to in the content.

