
The Inclusion and Initial Damage Inspection of Intelligent Cementitious Materials Containing Graphene Using Electrical Resistivity Tomography (ERT)


Abstract
1. Introduction
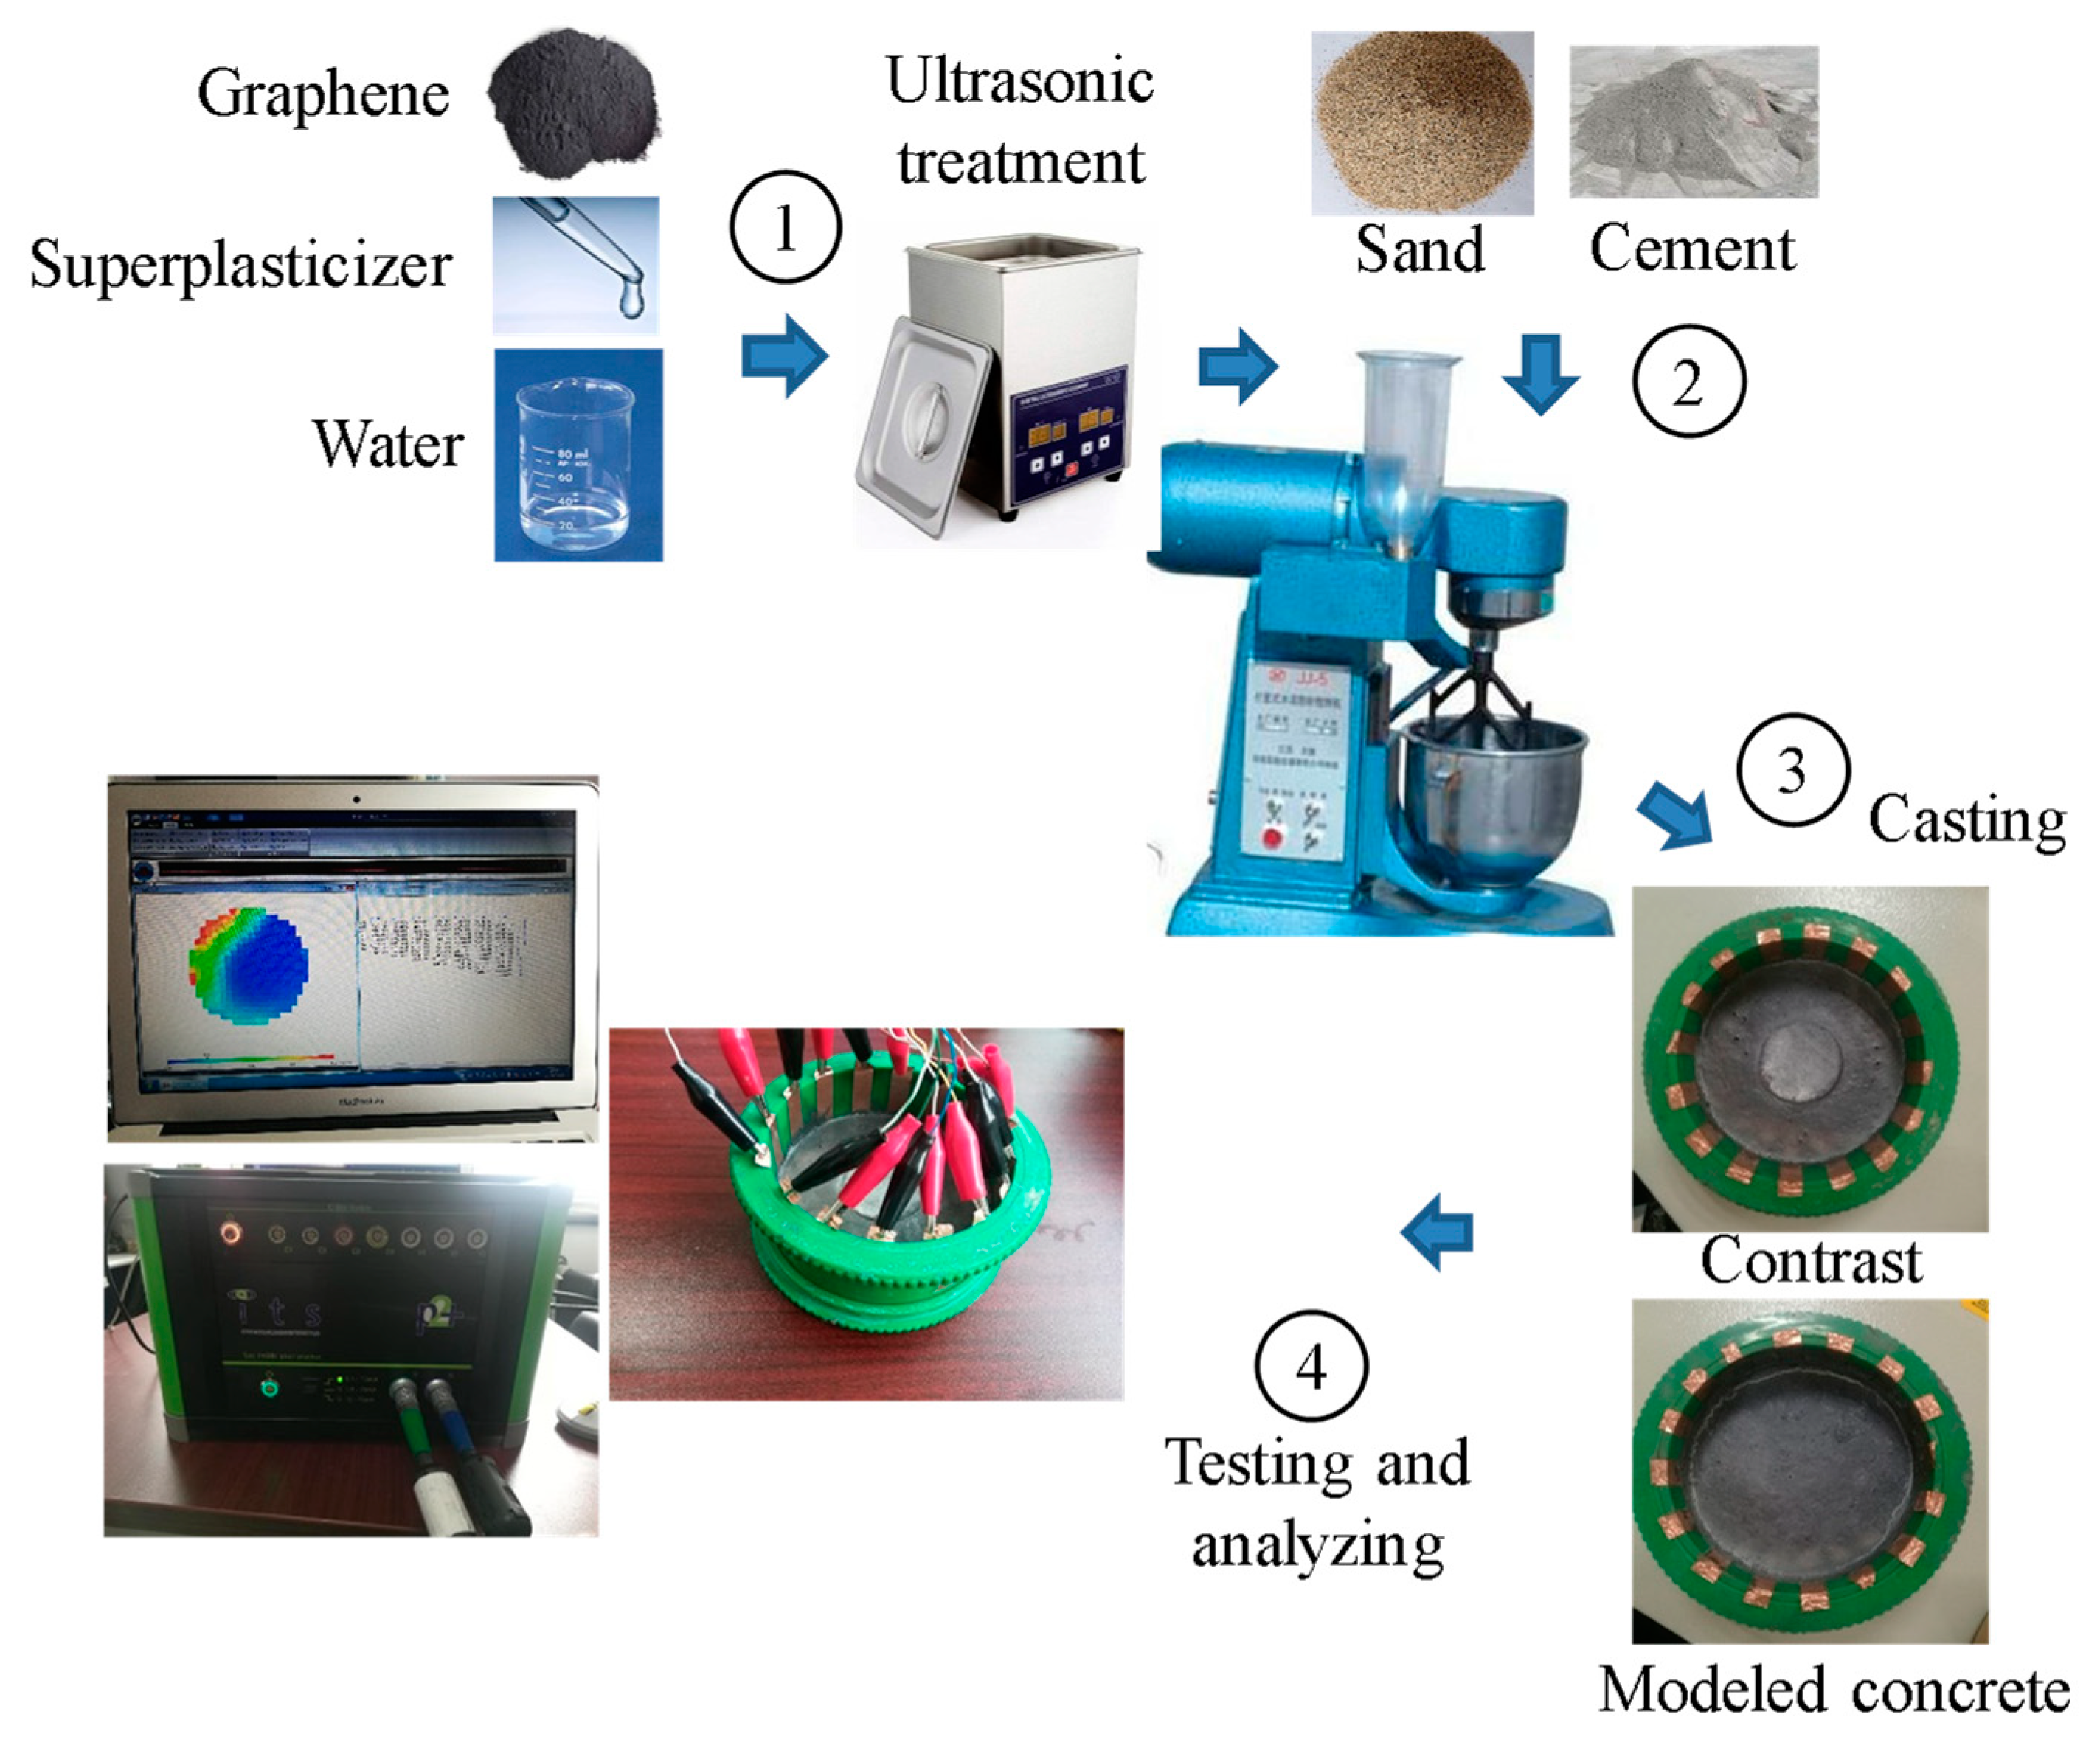
2. Materials and Methods
2.1. Materials
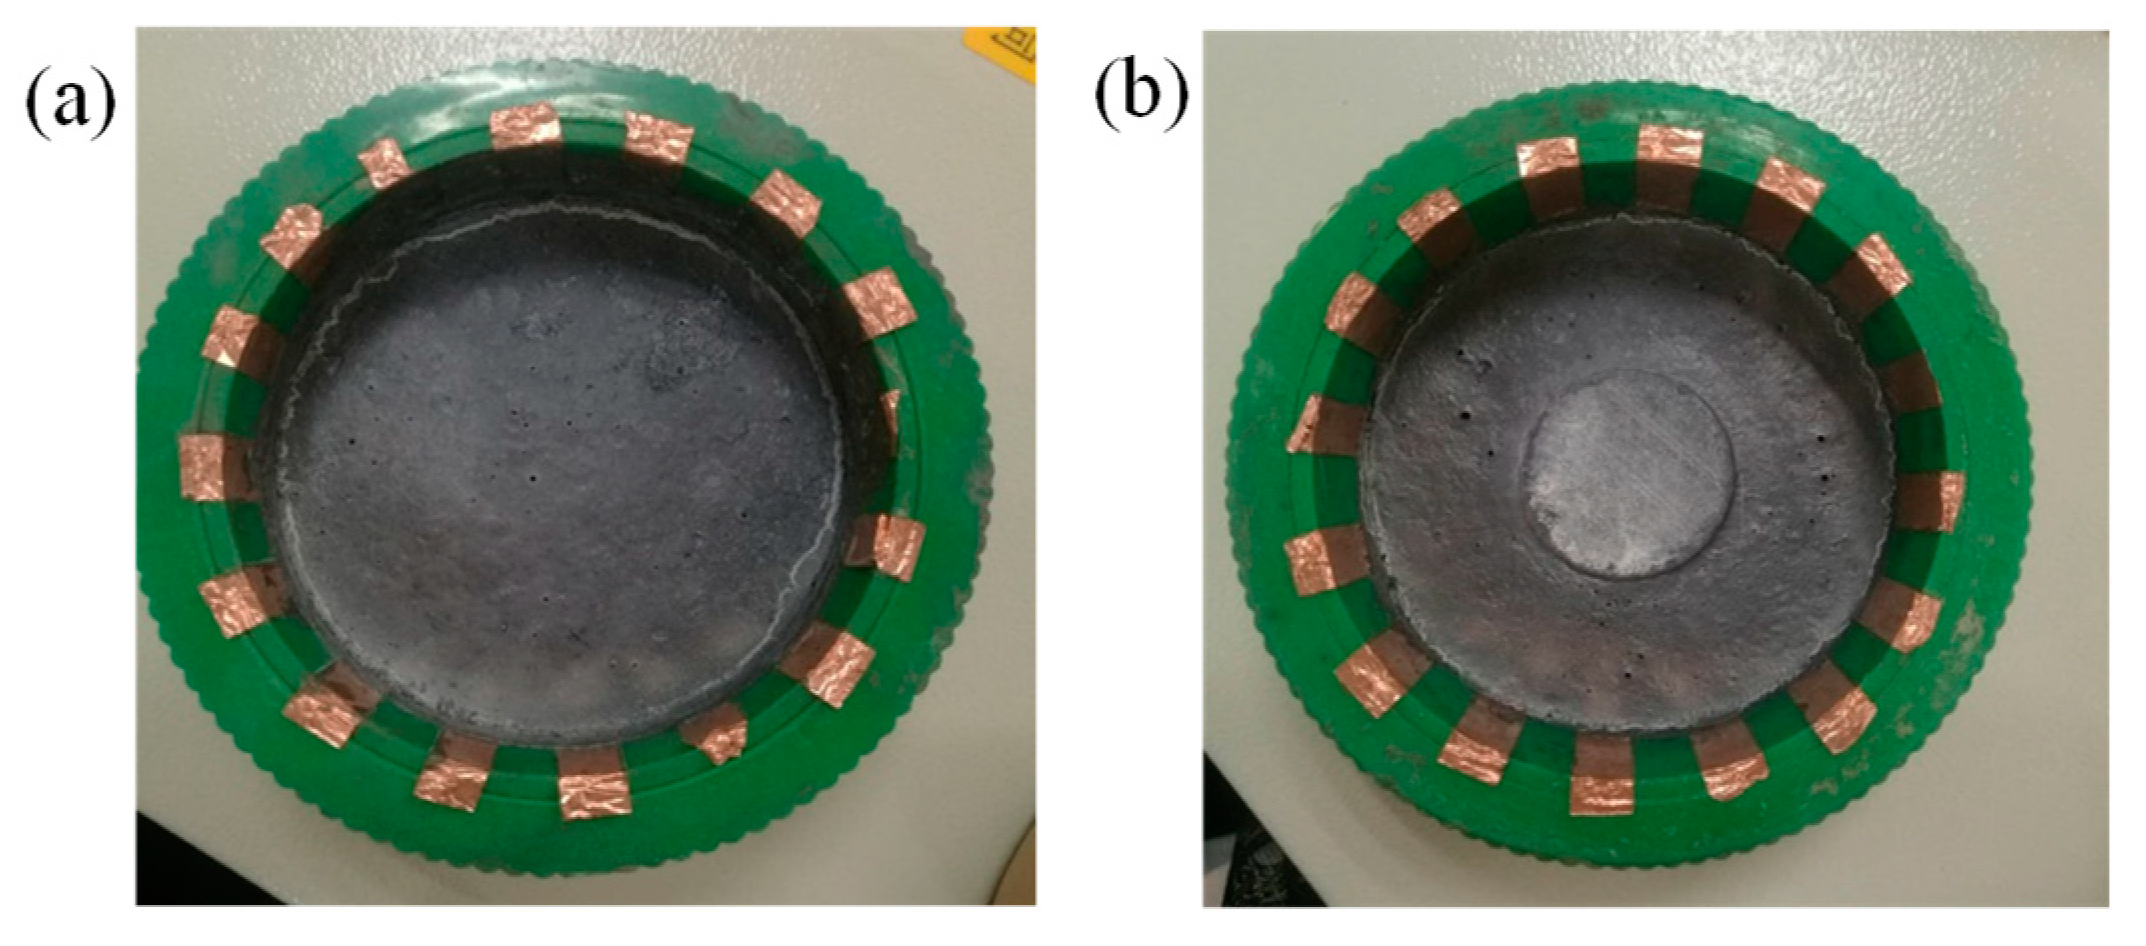
2.2. Samples
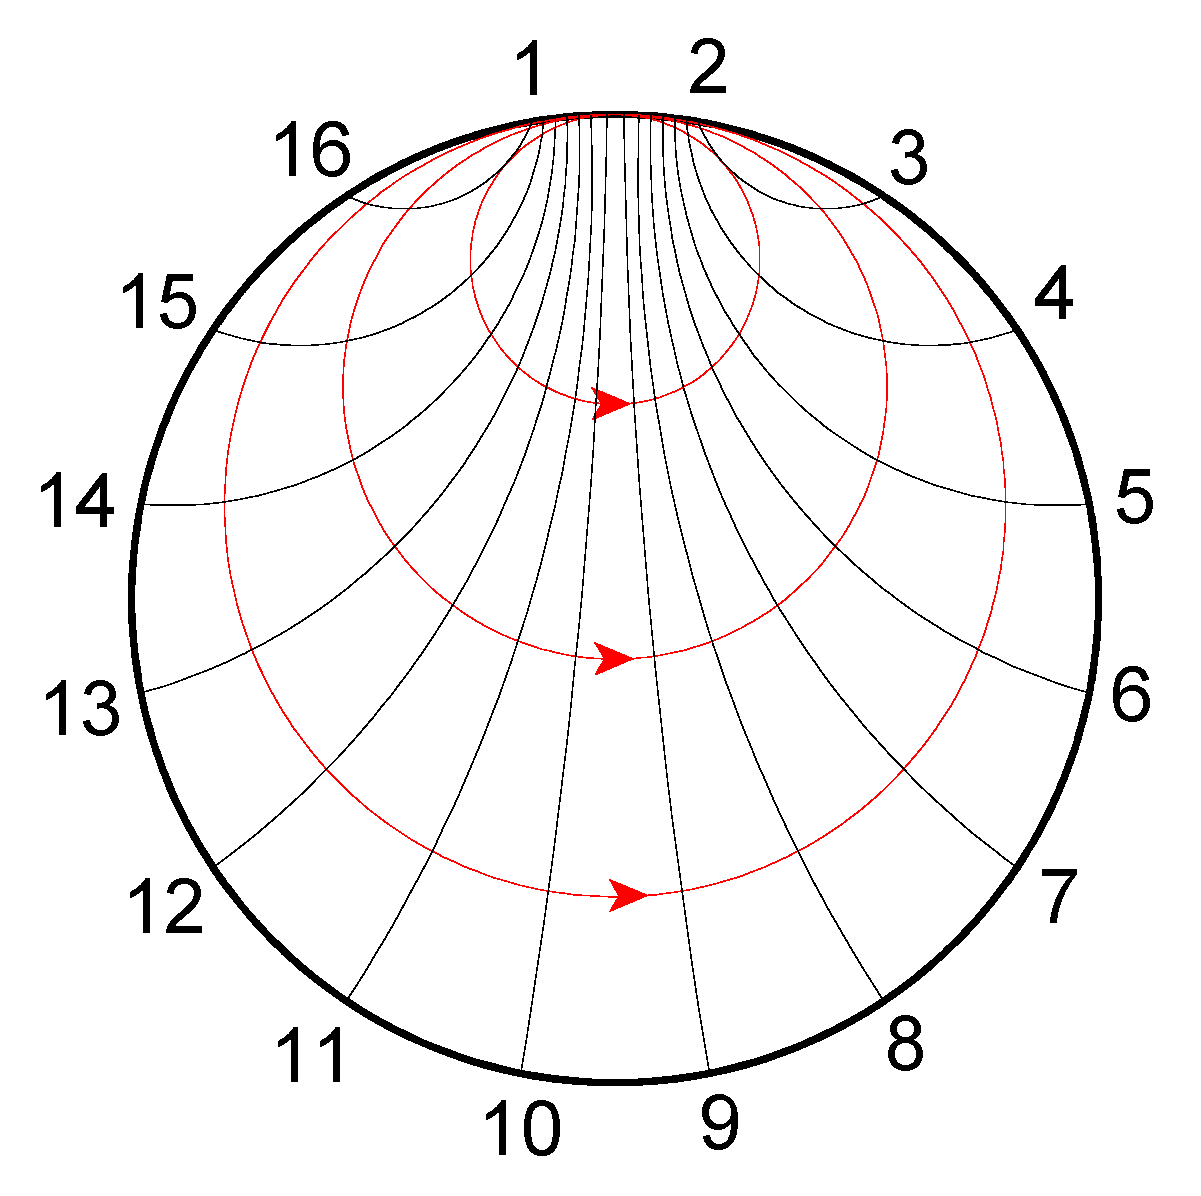
2.3. Test Method
3. Results
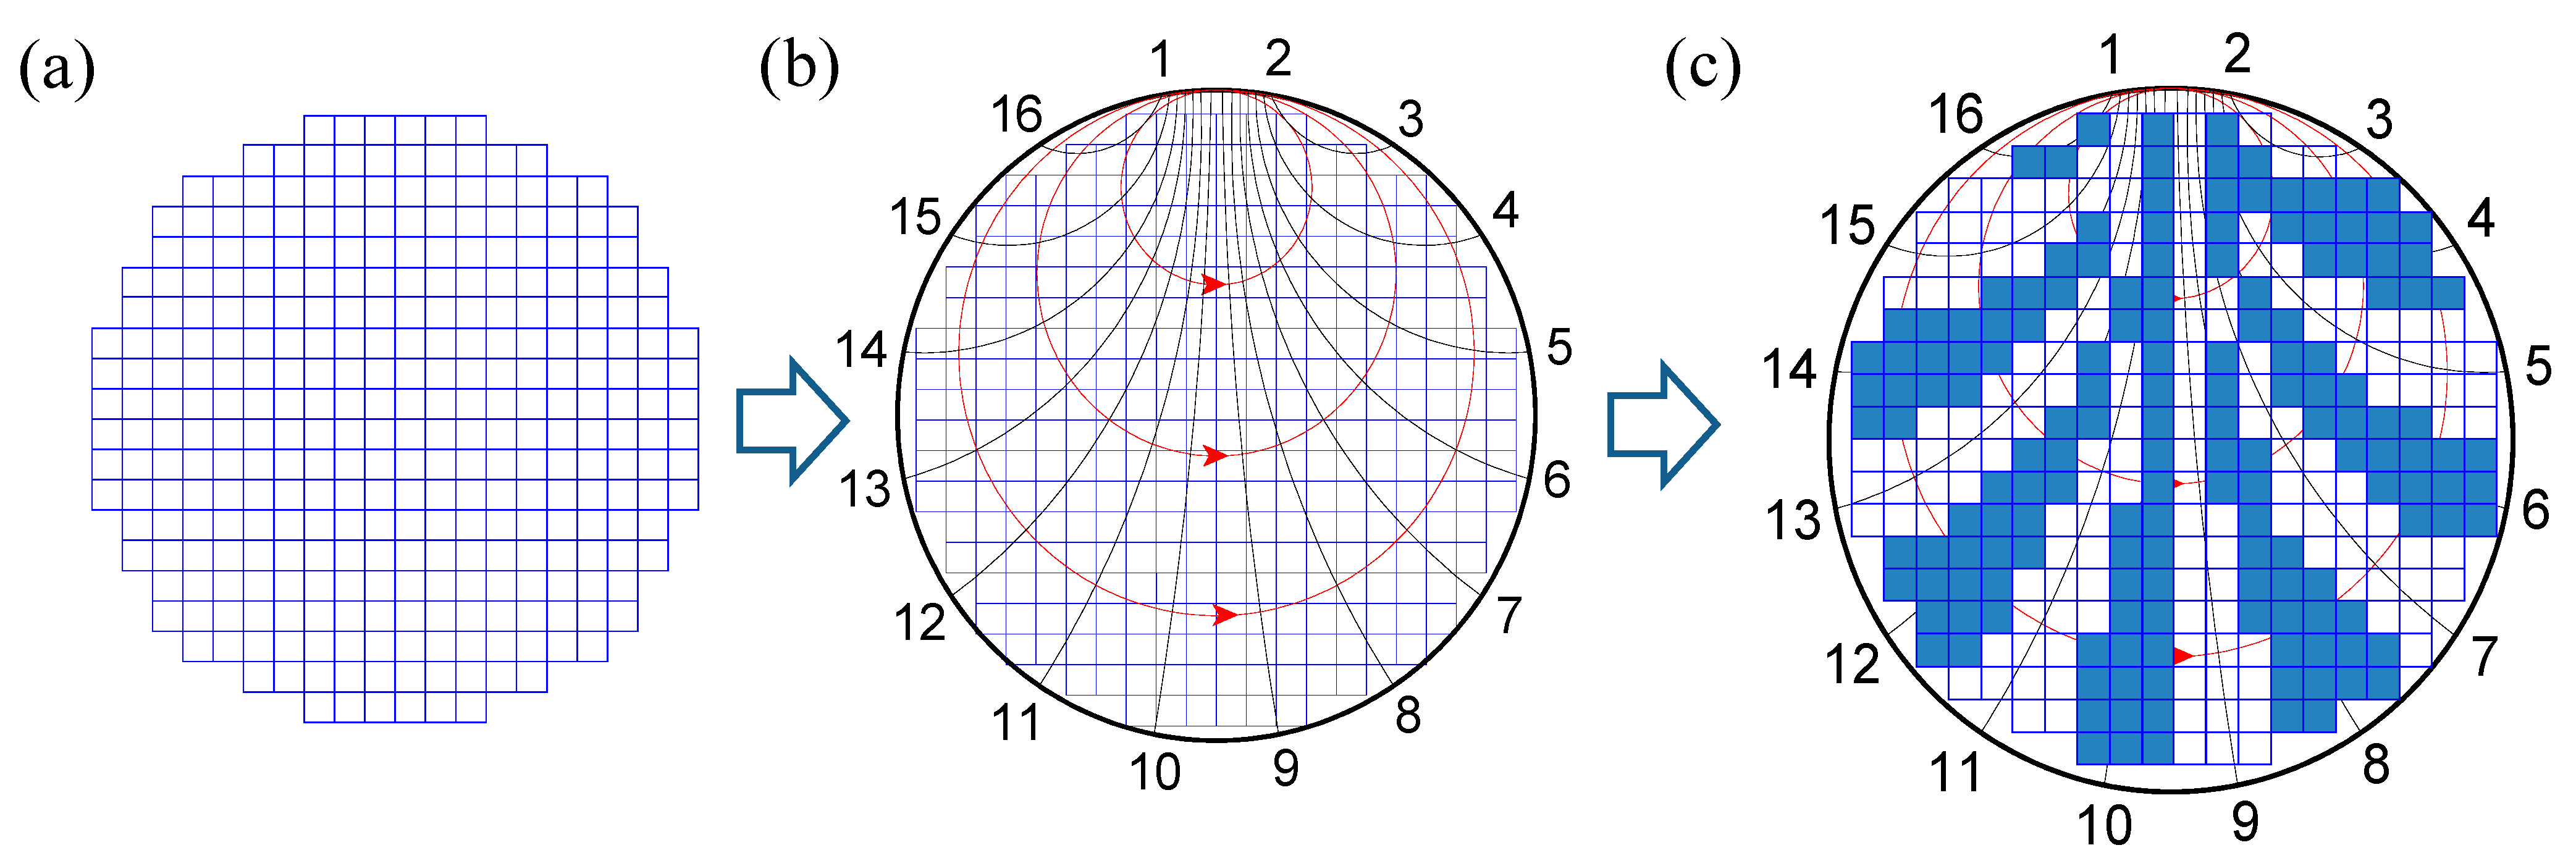
3.1. Inverse Problem Analysis
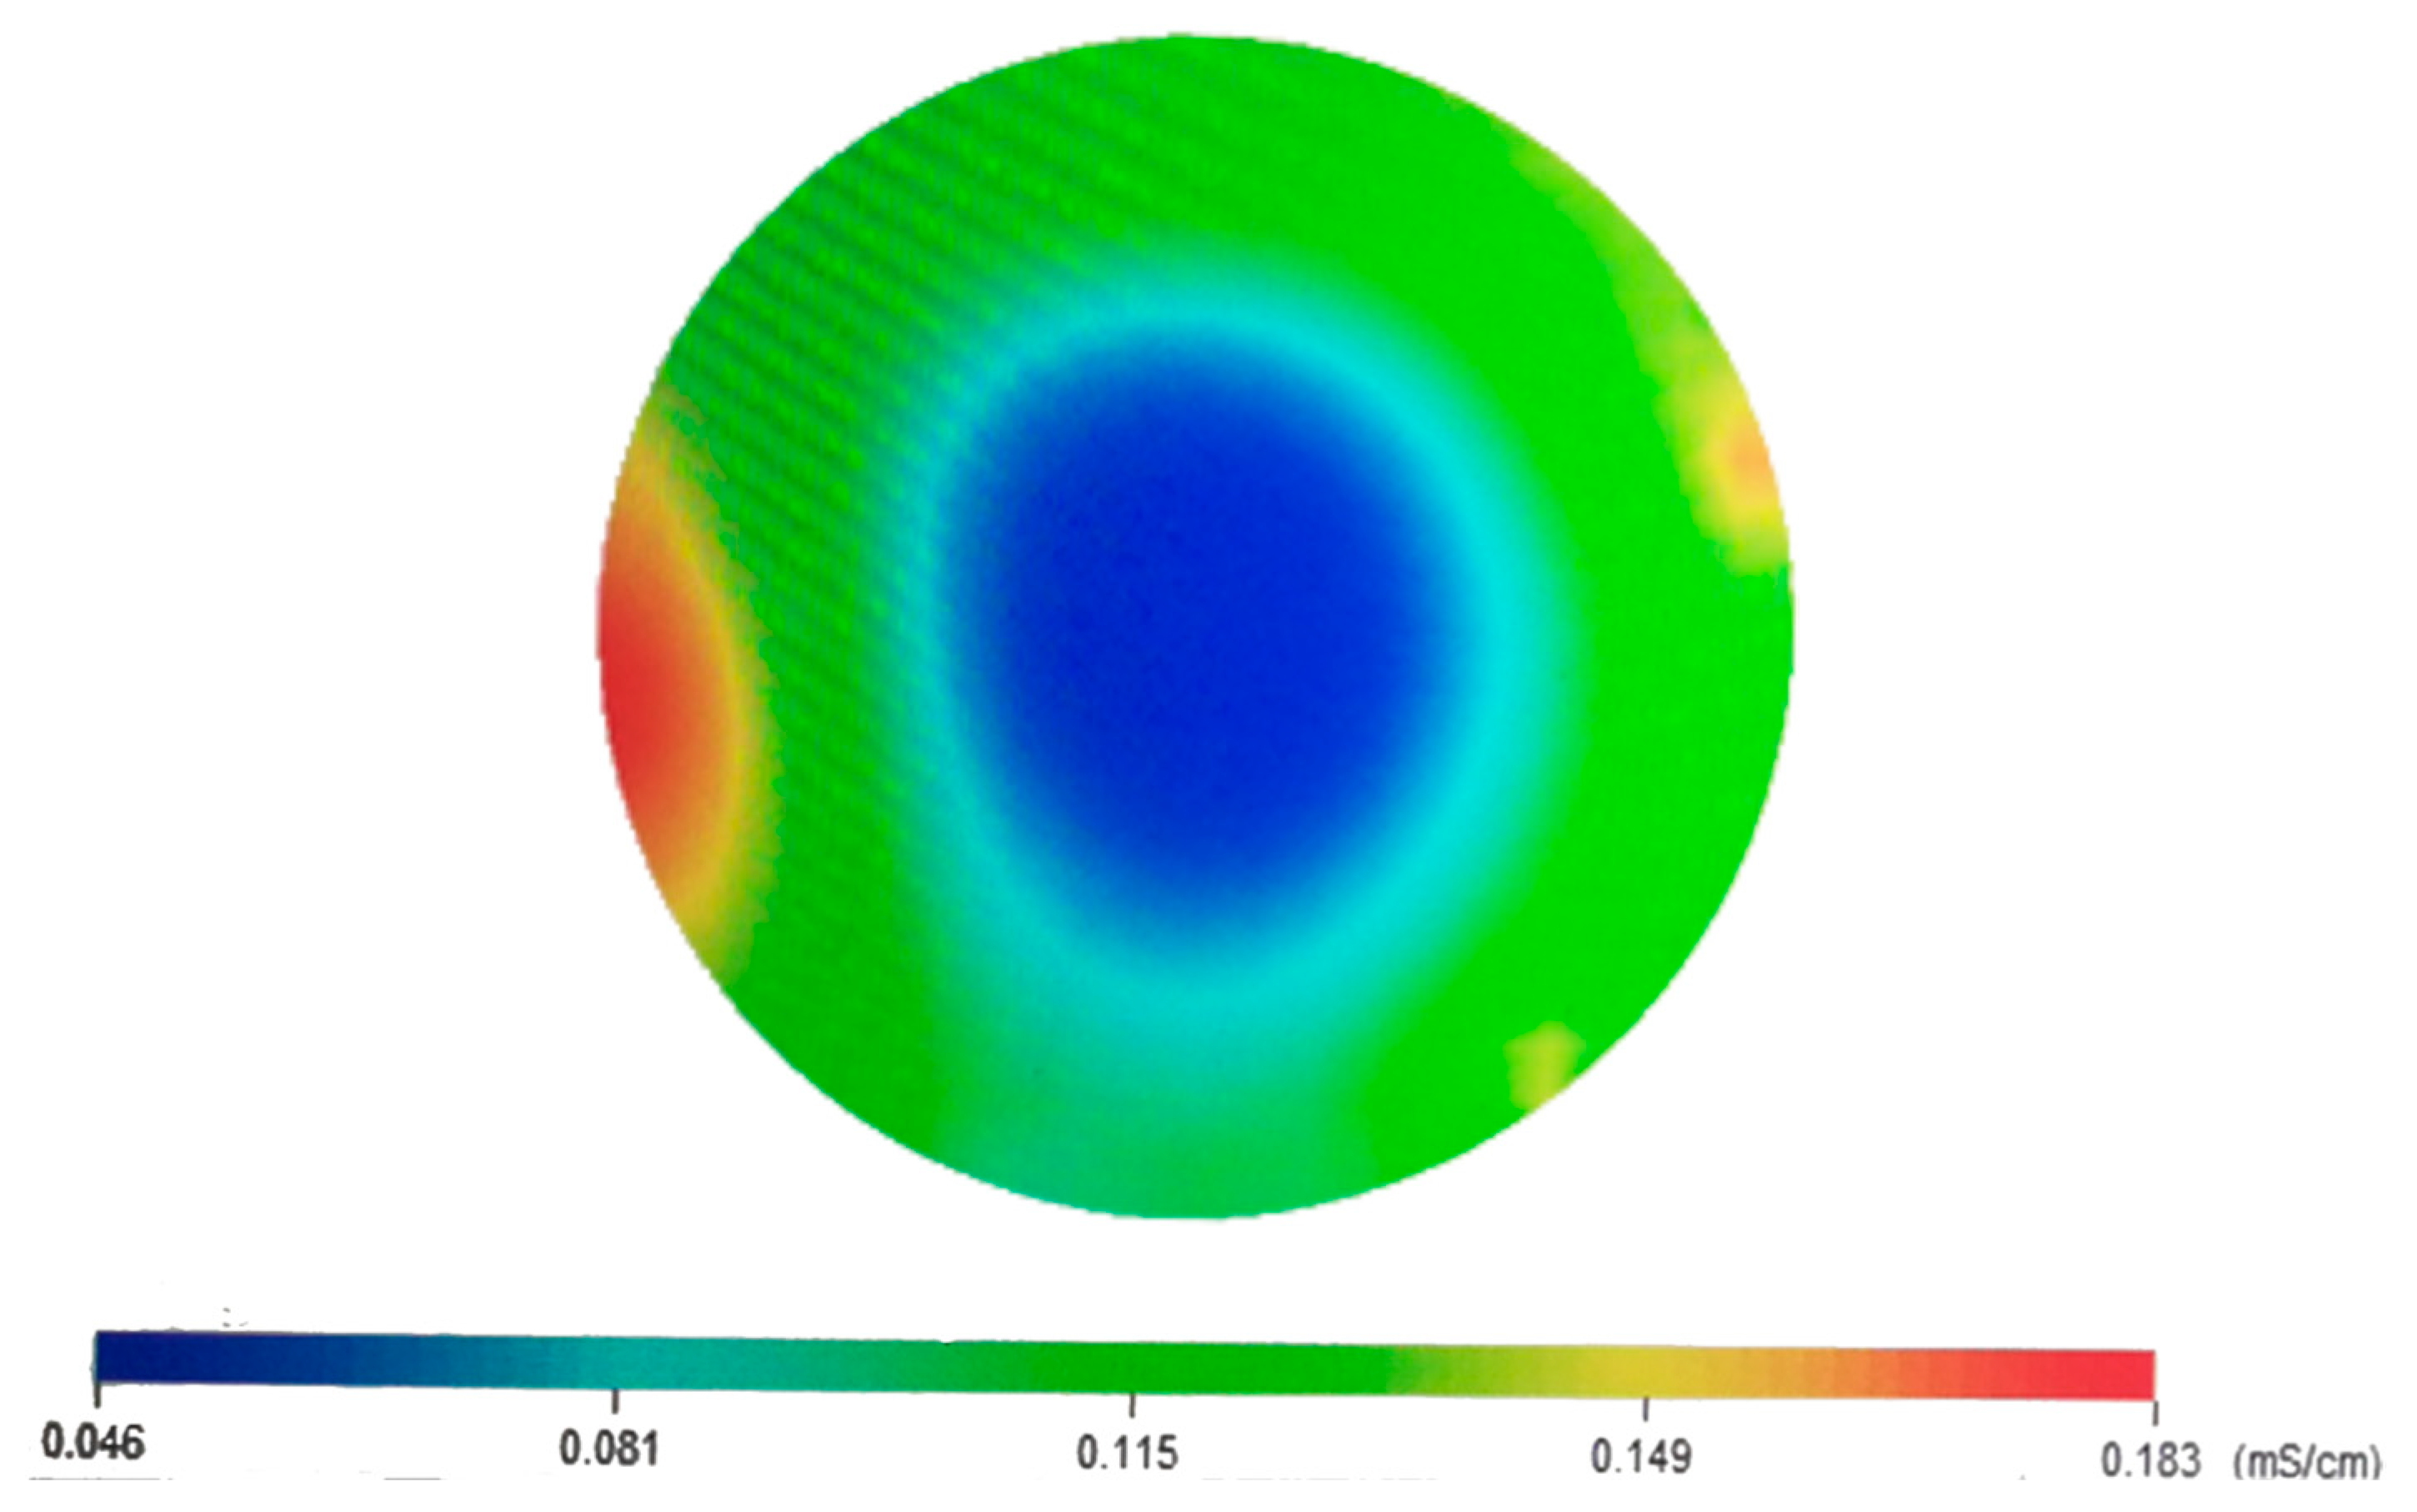
3.2. Conductivity Image Tomography and Discussion
4. Discussion
5. Conclusions
Author Contributions
Funding
Data Availability Statement
Conflicts of Interest
References
- Azarsa, P.; Gupta, R. Electrical Resistivity of Concrete for Durability Evaluation: A Review. Adv. Mater. Sci. 2017, 2017, 8453095. [Google Scholar] [CrossRef]
- Azhari, F.; Banthia, N. Cement-based sensors with carbon fibers and carbon nanotubes for piezoresistive sensing. Cem. Concr. Compos. 2012, 34, 866–873. [Google Scholar] [CrossRef]
- Chen, P.; Chung, D.D.L. Concrete as a new strain/stress sensor. Compos. B Eng. 1996, 27, 11–23. [Google Scholar] [CrossRef]
- Cuong, L.P.; Van Tho, L.; Juzsakova, T.; Rédey, Á.; Hai, H. Imaging the movement of toxic pollutants with 2D electrical resistivity tomography (ERT) in the geological environment of the Hoa Khanh Industrial Park, Da Nang. Vietnam. Environ. Earth. Sci. 2016, 75, 286. [Google Scholar] [CrossRef]
- Hallaji, M.; Pour-Ghaz, M. A new sensing skin for qualitative damage detection in concrete elements: Rapid difference imaging with electrical resistance tomography. NDT E Int. 2014, 68, 12–21. [Google Scholar] [CrossRef]
- Han, B.; Ding, S. Intrinsic self-sensing concrete and structures: A review. Measurement 2015, 59, 110–128. [Google Scholar] [CrossRef]
- Han, B.; Yu, X.; Ou, J. Piezoresistive Characteristic Model of Nickel/Cement Composites Based on Field Emission Effect and Inter-Particle Separation. Sens. Lett. 2009, 7, 1044–1050. [Google Scholar] [CrossRef]
- Han, B.; Yu, X.; Ou, J. Effect of water content on the piezoresistivity of MWNT/cement composites. J. Mater. Sci. 2010, 45, 3714–3719. [Google Scholar] [CrossRef]
- Karhunen, K.; Seppänen, A.; Lehikoinen, A.; Monteiro, P.J.; Kaipio, J.P. Electrical Resistance Tomography imaging of concrete. Cem. Concr. Res. 2010, 40, 137–145. [Google Scholar] [CrossRef]
- Kazakis, N.; Pavlou, A.; Vargemezis, G.; Voudouris, K.S.; Soulios, G.; Pliakas, F.; Tsokas, G. Seawater intrusion mapping using electrical resistivity tomography and hydrochemical data. An application in the coastal area of eastern Thermaikos Gulf, Greece. Sci. Total Environ. 2016, 543, 373–387. [Google Scholar] [CrossRef]
- Konsta-Gdoutos, M.; Chrysoula, A. Self sensing carbon nanotube (CNT) and nanofiber (CNF) cementitious composites for real time damage assessment in smart structures. Cem. Concr. Compos. 2014, 53, 162–169. [Google Scholar] [CrossRef]
- Lataste, J.F.; De Larrard, T.; Benboudjema, F.; Semenadisse, J. Study of electrical resistivity: Variability assessment on two concretes: Protocol study in laboratory and assessment on site. Eur. J. Environ. Civ. Eng. 2012, 16, 298–310. [Google Scholar] [CrossRef]
- Liu, Q.; Wu, W.; Xiao, J.; Tian, Y.; Chen, J.; Singh, A. Correlation between damage evolution and resistivity reaction of concrete in-filled with graphene nanoplatelets. Constr. Build. Mater. 2019, 208, 482–491. [Google Scholar] [CrossRef]
- Liu, Q.; Xu, Q.; Yu, Q.; Gao, R.; Tong, T. Experimental investigation on mechanical and piezoresistive properties of cementitious materials containing graphene and graphene oxide nanoplatelets. Constr. Build. Mater. 2016, 127, 565–576. [Google Scholar] [CrossRef]
- de Castro Martins, T.; Sato, A.K.; de Moura, F.S.; de Camargo, E.D.L.B.; Silva, O.L.; Santos, T.B.R.; Zhao, Z.; Möeller, K.; Amato, M.B.P.; Mueller, J.L.; et al. A review of electrical impedance tomography in lung applications: Theory and algorithms for absolute images. Annu. Rev. Control. 2019, 48, 442–471. [Google Scholar] [CrossRef] [PubMed]
- McKee, S.L.; Williams, R.A.; Boxman, A. Development of solid-liquid mixing models using tomographic techniques. Chem. Eng. J. Biochem. Eng. 1995, 56, 101–107. [Google Scholar] [CrossRef]
- Priou, J.; Lecieux, Y.; Chevreuil, M.; Gaillard, V.; Lupi, C.; Leduc, D.; Rozière, E.; Guyard, R.; Schoefs, F. In situ DC electrical resistivity mapping performed in a reinforced concrete wharf using embedded sensors. Constr. Build. Mater. 2019, 211, 244–260. [Google Scholar] [CrossRef]
- Rodrigues, R.; Gaboreau, S.; Gance, J.; Ignatiadis, I.; Betelu, S. Reinforced concrete structures: A review of corrosion mechanisms and advances in electrical methods for corrosion monitoring. Constr. Build. Mater. 2021, 269, 121240. [Google Scholar] [CrossRef]
- Hallaji, M.; Seppänen, A.; Pour-Ghaz, M. Electrical resistance tomography to monitor unsaturated moisture flow in cementitious materials. Cem. Concr. Res. 2015, 69, 10–18. [Google Scholar] [CrossRef]
- Xiao, H.; Li, H.; Ou, J. Modeling of piezoresistivity of carbon black filled cement-based composites under multi-axial strain. Sens. Actuator A Phys. 2010, 160, 87–93. [Google Scholar] [CrossRef]
- Xu, J.; Zhong, W.; Yao, W. Modeling of conductivity in carbon fiber-reinforced cement-based composite. J. Mater. Sci. 2010, 45, 3538–3546. [Google Scholar] [CrossRef]
- Yang, W.Q.; Spink, D.M.; York, T.A.; Mccann, H. Effect of Progesterone Receptor Blockade on Renin Synthesis and Secretion from Endometrial Stromal Cells: Pulse Experiment. Am. J. Obstet. Gynec. 1999, 166, 294. [Google Scholar]
- Zhou, Z.; Liu, W.; Huang, Y.; Wang, H.; He, J.; Huang, M.; Ou, J. Optical fiber Bragg grating sensor assembly for 3D strain monitoring and its case study in highway pavement. Mech. Syst. Signal Process 2012, 28, 36–49. [Google Scholar]
- Yoon, S.; Kim, M.K.; Kim, T.U.; Jeon, D.; Song, H.; Suh, J.-I.; Oh, J.E.; Kim, D.J. Enhancing image resolution in single-side electrical resistance tomography (ERT) by utilizing theoretical sensitivity analysis: Experimental validation and application to cement mortar. J. Build. 2024, 84, 108480. [Google Scholar]
- Gupta, S.; Lin, Y.; Lee, H. In situ crack mapping of large-scale self-sensing concrete pavements using electrical resistance tomography. Cem. Concr. Compos. 2021, 122, 104154. [Google Scholar]
- Jeon, D.; Kim, M.K.; Jeong, Y.; Oh, J.E.; Moon, J.; Kim, D.J.; Yoon, S. High-accuracy rebar position detection using deep learning–based frequency-difference electrical resistance tomography. Autom. Constr. 2022, 135, 104116. [Google Scholar]
- Movahedi, S.; Taghizadieh, N. Efficiency improvement of radial basis function meshless method in conjunction with bayesian theorem for electrical tomography of heterogeneous concrete. Eng. Anal Bound Elem. 2022, 135, 382–393. [Google Scholar]
- Dalton, L.E.; Räsänen, M.; Voss, A.; Seppänen, A.; Pourghaz, M. Investigating the use of electrical capacitance tomography to image rapid transient moisture flow through cracks in concrete. Cem. Concr. Compos. 2023, 140, 105070. [Google Scholar] [CrossRef]
- Achrafi MK, E.; Bonnet, S.; Villain, G. Electrical resistivity tomography results analyzed with two inversion methods to determine chloride profiles on BFS concrete having very high electrical resistivity. Constr. Build. Mater. 2023, 407, 133361. [Google Scholar] [CrossRef]
- GB 175-2020; Common Portland Cement. Chinese National Standards: Beijing, China, 2020. (In Chinese)

| Cao | Si2O | MgO | SO3 | Al2O3 | K2O | Na2O | Fe2O3 | Ignition Loss |
|---|---|---|---|---|---|---|---|---|
| 63.80 | 20.78 | 1.50 | 2.02 | 4.57 | 0.65 | 0.23 | 5.12 | 1.31 |
| Size | Density (kg/m3) | Specific Surface Area (m2/g) | Appearance |
|---|---|---|---|
| In-plane diameter: 5–15 μm; Thickness: 2–3 nm | 1400 | 190 | Dark powder |
| Cement | Water | Sand | Graphene | Superplasticizer |
|---|---|---|---|---|
| 100 | 60 | 300 | 6.4 | 6.4 |
| Electro-de Pair | Electrode Pair for Voltage Measurement/mV | ||||||||||||||
|---|---|---|---|---|---|---|---|---|---|---|---|---|---|---|---|
| 1–2 | 2–3 | 3–4 | 4–5 | 5–6 | 6–7 | 7–8 | 8–9 | 9–10 | 10–11 | 11–12 | 12–13 | 13–14 | 14–15 | 15–16 | |
| 16–1 | 1557 | 951.4 | 415.5 | 229.9 | 168.3 | 145.1 | 142.2 | 156.6 | 168.5 | 296.8 | 677.2 | 1112 | 1948 | ||
| 1–2 | 2139 | 969.0 | 469.1 | 294.4 | 190.3 | 139.5 | 159.9 | 167.2 | 193.5 | 290.5 | 588.6 | 863.5 | 1879 | ||
| 2–3 | 1678 | 775.6 | 404.5 | 306.3 | 220.6 | 170.4 | 167.9 | 169.0 | 248.9 | 381.1 | 761.6 | 1271 | |||
| 3–4 | 1990 | 962.4 | 495.9 | 346.3 | 254.4 | 214.6 | 174.0 | 211.4 | 262.1 | 379.9 | 730.7 | ||||
| 4–5 | 1918 | 889.9 | 574.2 | 412.9 | 327.4 | 214.2 | 182.5 | 162.8 | 154.1 | 456.8 | |||||
| 5–6 | 1779 | 989.9 | 661.8 | 349.0 | 268.2 | 203.6 | 154.1 | 151.2 | 398.8 | ||||||
| 6–7 | 1933 | 943.8 | 583.3 | 461.6 | 329.3 | 220.5 | 179.8 | 149.4 | |||||||
| 7–8 | 1655 | 758.0 | 521.5 | 385.2 | 298.8 | 231.4 | 182.5 | ||||||||
| 8–9 | 1855 | 922.9 | 622.2 | 462.8 | 367.9 | 310.5 | |||||||||
| 9–10 | 1944 | 936.1 | 598.6 | 436.3 | 354.6 | ||||||||||
| 10–11 | 1905 | 876.7 | 518.8 | 379.8 | |||||||||||
| 11–12 | 2076 | 863.5 | 515.4 | ||||||||||||
| 12–13 | 1800 | 751.4 | |||||||||||||
| 13–14 | 1582 | ||||||||||||||
| 14–15 | |||||||||||||||
| 15–16 | |||||||||||||||
| Electro-de Pair | Electrode Pair for Voltage Measurement/mV | ||||||||||||||
|---|---|---|---|---|---|---|---|---|---|---|---|---|---|---|---|
| 1–2 | 2–3 | 3–4 | 4–5 | 5–6 | 6–7 | 7–8 | 8–9 | 9–10 | 10–11 | 11–12 | 12–13 | 13–14 | 14–15 | 15–16 | |
| 16–1 | 1079 | 556.6 | 426.3 | 355.5 | 287.6 | 233.4 | 204.6 | 219.7 | 228.5 | 293.9 | 353.5 | 527.3 | 1147 | ||
| 1–2 | 1362 | 717.8 | 495.6 | 366.2 | 289.1 | 251.5 | 266.6 | 272.0 | 335.9 | 363.3 | 436.0 | 639.6 | 1318 | ||
| 2–3 | 1465 | 722.7 | 447.8 | 323.2 | 267.1 | 274.4 | 272.5 | 325.2 | 332.5 | 356.4 | 416.0 | 571.3 | |||
| 3–4 | 1548 | 712.9 | 441.4 | 330.6 | 321.8 | 307.1 | 351.1 | 341.8 | 342.3 | 355.5 | 393.1 | ||||
| 4–5 | 1421 | 659.2 | 425.3 | 379.9 | 346.2 | 380.9 | 357.4 | 342.8 | 336.4 | 338.4 | |||||
| 5–6 | 1392 | 659.2 | 490.2 | 406.7 | 420.9 | 373.0 | 336.4 | 312.0 | 295.4 | ||||||
| 6–7 | 1284 | 625.0 | 432.1 | 416.0 | 355.0 | 311.5 | 281.3 | 258.8 | |||||||
| 7–8 | 1226 | 561.5 | 460.4 | 359.4 | 295.4 | 252.9 | 224.1 | ||||||||
| 8–9 | 1152 | 683.6 | 460.9 | 342.8 | 272.5 | 230.0 | |||||||||
| 9–10 | 1440 | 693.4 | 443.4 | 323.2 | 262.7 | ||||||||||
| 10–11 | 1411 | 649.4 | 384.3 | 281.3 | |||||||||||
| 11–12 | 1538 | 639.6 | 381.8 | ||||||||||||
| 12–13 | 1333 | 556.6 | |||||||||||||
| 13–14 | 1172 | ||||||||||||||
| 14–15 | |||||||||||||||
| 15–16 | |||||||||||||||
Disclaimer/Publisher’s Note: The statements, opinions and data contained in all publications are solely those of the individual author(s) and contributor(s) and not of MDPI and/or the editor(s). MDPI and/or the editor(s) disclaim responsibility for any injury to people or property resulting from any ideas, methods, instructions or products referred to in the content. |
© 2024 by the authors. Licensee MDPI, Basel, Switzerland. This article is an open access article distributed under the terms and conditions of the Creative Commons Attribution (CC BY) license (https://creativecommons.org/licenses/by/4.0/).
Share and Cite
Wang, S.; Peng, S.; Liu, Q.; Li, W. The Inclusion and Initial Damage Inspection of Intelligent Cementitious Materials Containing Graphene Using Electrical Resistivity Tomography (ERT). Buildings 2024, 14, 2098. https://doi.org/10.3390/buildings14072098
Wang S, Peng S, Liu Q, Li W. The Inclusion and Initial Damage Inspection of Intelligent Cementitious Materials Containing Graphene Using Electrical Resistivity Tomography (ERT). Buildings. 2024; 14(7):2098. https://doi.org/10.3390/buildings14072098
Chicago/Turabian StyleWang, Shijun, Shengjiang Peng, Qiong Liu, and Wanwei Li. 2024. "The Inclusion and Initial Damage Inspection of Intelligent Cementitious Materials Containing Graphene Using Electrical Resistivity Tomography (ERT)" Buildings 14, no. 7: 2098. https://doi.org/10.3390/buildings14072098
APA StyleWang, S., Peng, S., Liu, Q., & Li, W. (2024). The Inclusion and Initial Damage Inspection of Intelligent Cementitious Materials Containing Graphene Using Electrical Resistivity Tomography (ERT). Buildings, 14(7), 2098. https://doi.org/10.3390/buildings14072098