Article

The Relationship between Molecular Structure and Foaming of Poly(ethylene glycol)—Poly(propylene glycol) Triblock Surfactants in Cementitious Materials

by
Mohammad Sadegh Tale Masoule
and
Ali Ghahremaninezhad
*
Department of Civil and Architectural Engineering, University of Miami, Coral Gables, FL 33146, USA
*
Author to whom correspondence should be addressed.
Buildings 2024, 14(7), 2100; https://doi.org/10.3390/buildings14072100
Submission received: 29 May 2024 / Revised: 28 June 2024 / Accepted: 5 July 2024 / Published: 9 July 2024
(This article belongs to the Section Building Materials, and Repair & Renovation)

Abstract

:
This study investigates the relationship between the molecular structure and foaming of poly(ethylene glycol) and poly(propylene glycol) triblock copolymers in Portland cement pastes. Four copolymers with different molecular structures were studied at varying concentrations. All copolymers showed a reduction in surface tension of the cement pore solution; however, only some of them demonstrated foaming and air entraining in cement paste. The results indicated that the molecular structure parameter, hydrophilic-to-lipophilic balance (HLB), has a direct relationship with the foaming and air-entraining performance of the copolymers. The total organic carbon measurements showed very small adsorption of these non-ionic copolymers on hydrating cement particles due to the lack of surface charge needed to interact with the heterogeneously charged surface of hydrating cement. In addition, these copolymers did not seem to affect the flow of cement paste due to a lack of adsorption on cement particles. The cement paste modified with the copolymers showed increased water sorption compared to the control paste due to the increased capillary porosity and slight increase in pore surface hydrophilicity. However, the freeze-thaw resistance was shown to improve with an increase in the number of air voids in the modified cement pastes. The findings establish the relationship between molecular properties of copolymers and their air-entraining performance in cement paste to mitigate the damages caused by freeze-thaw action.

1. Introduction

1.1. Air Entrainment in Concrete

The concrete microstructure plays a crucial role in determining its durability against various environmental hazards [1,2], with freeze-thaw damage being a major concern. A widely accepted theory, initially proposed by Powers and later Helmuth [3,4,5], states that when concrete reaches a certain degree of saturation, the freezing of water inside the capillary pores generates substantial hydraulic pressure that damages the concrete matrix over repeated cycles of freezing and thawing. Entraining the concrete with small, well-dispersed air voids within the concrete provides a relief mechanism for this hydraulic pressure and significantly improves its resistance to freeze-thaw action [6]. Key microstructural properties affecting concrete’s performance in freeze-thaw conditions include the volume of entrained air voids, overall distance between voids and void size [7]. To enhance concrete’s resistance to freeze-thaw damage in various practical applications, a small volume of air (typically in the range of 4–7%, depending on the specific standards or guidelines [7,8]) is incorporated into the concrete using air-entraining admixtures (AEAs).
There are several methods of classifying AEAs, including wood resins or fatty acids and others [7]. However, a mechanistic classification, proposed by Chatterji [8], categorizes AEAs based on their surface activity. In this classification, the first category includes AEAs like resins and sodium oleate, which do not reduce surface tension but instead react with the calcium ions in cement pore solution to produce hydrophobic calcium salts. These salts improve air entrainment by stabilizing air-water-particle interfaces through Pickering stabilization [7]. The second category comprises of AEAs that reduce surface tension by adsorbing on the bubble interface, giving it elastic properties that increase its stability [7]. AEAs in this category often have a surfactant-type molecular structure, consisting of an ionic or nonionic polar head and a hydrophobic hydrocarbon tail. It is worth noting that the term “surfactant” typically refers to molecular structures with both polar heads and hydrophobic tails, but in this context, it is extended to include any amphipathic polymeric structure that reduces surface tension in the pore solutions of cementitious materials, including proteins [9] or the PEG-PPG triblock copolymers discussed in this study.

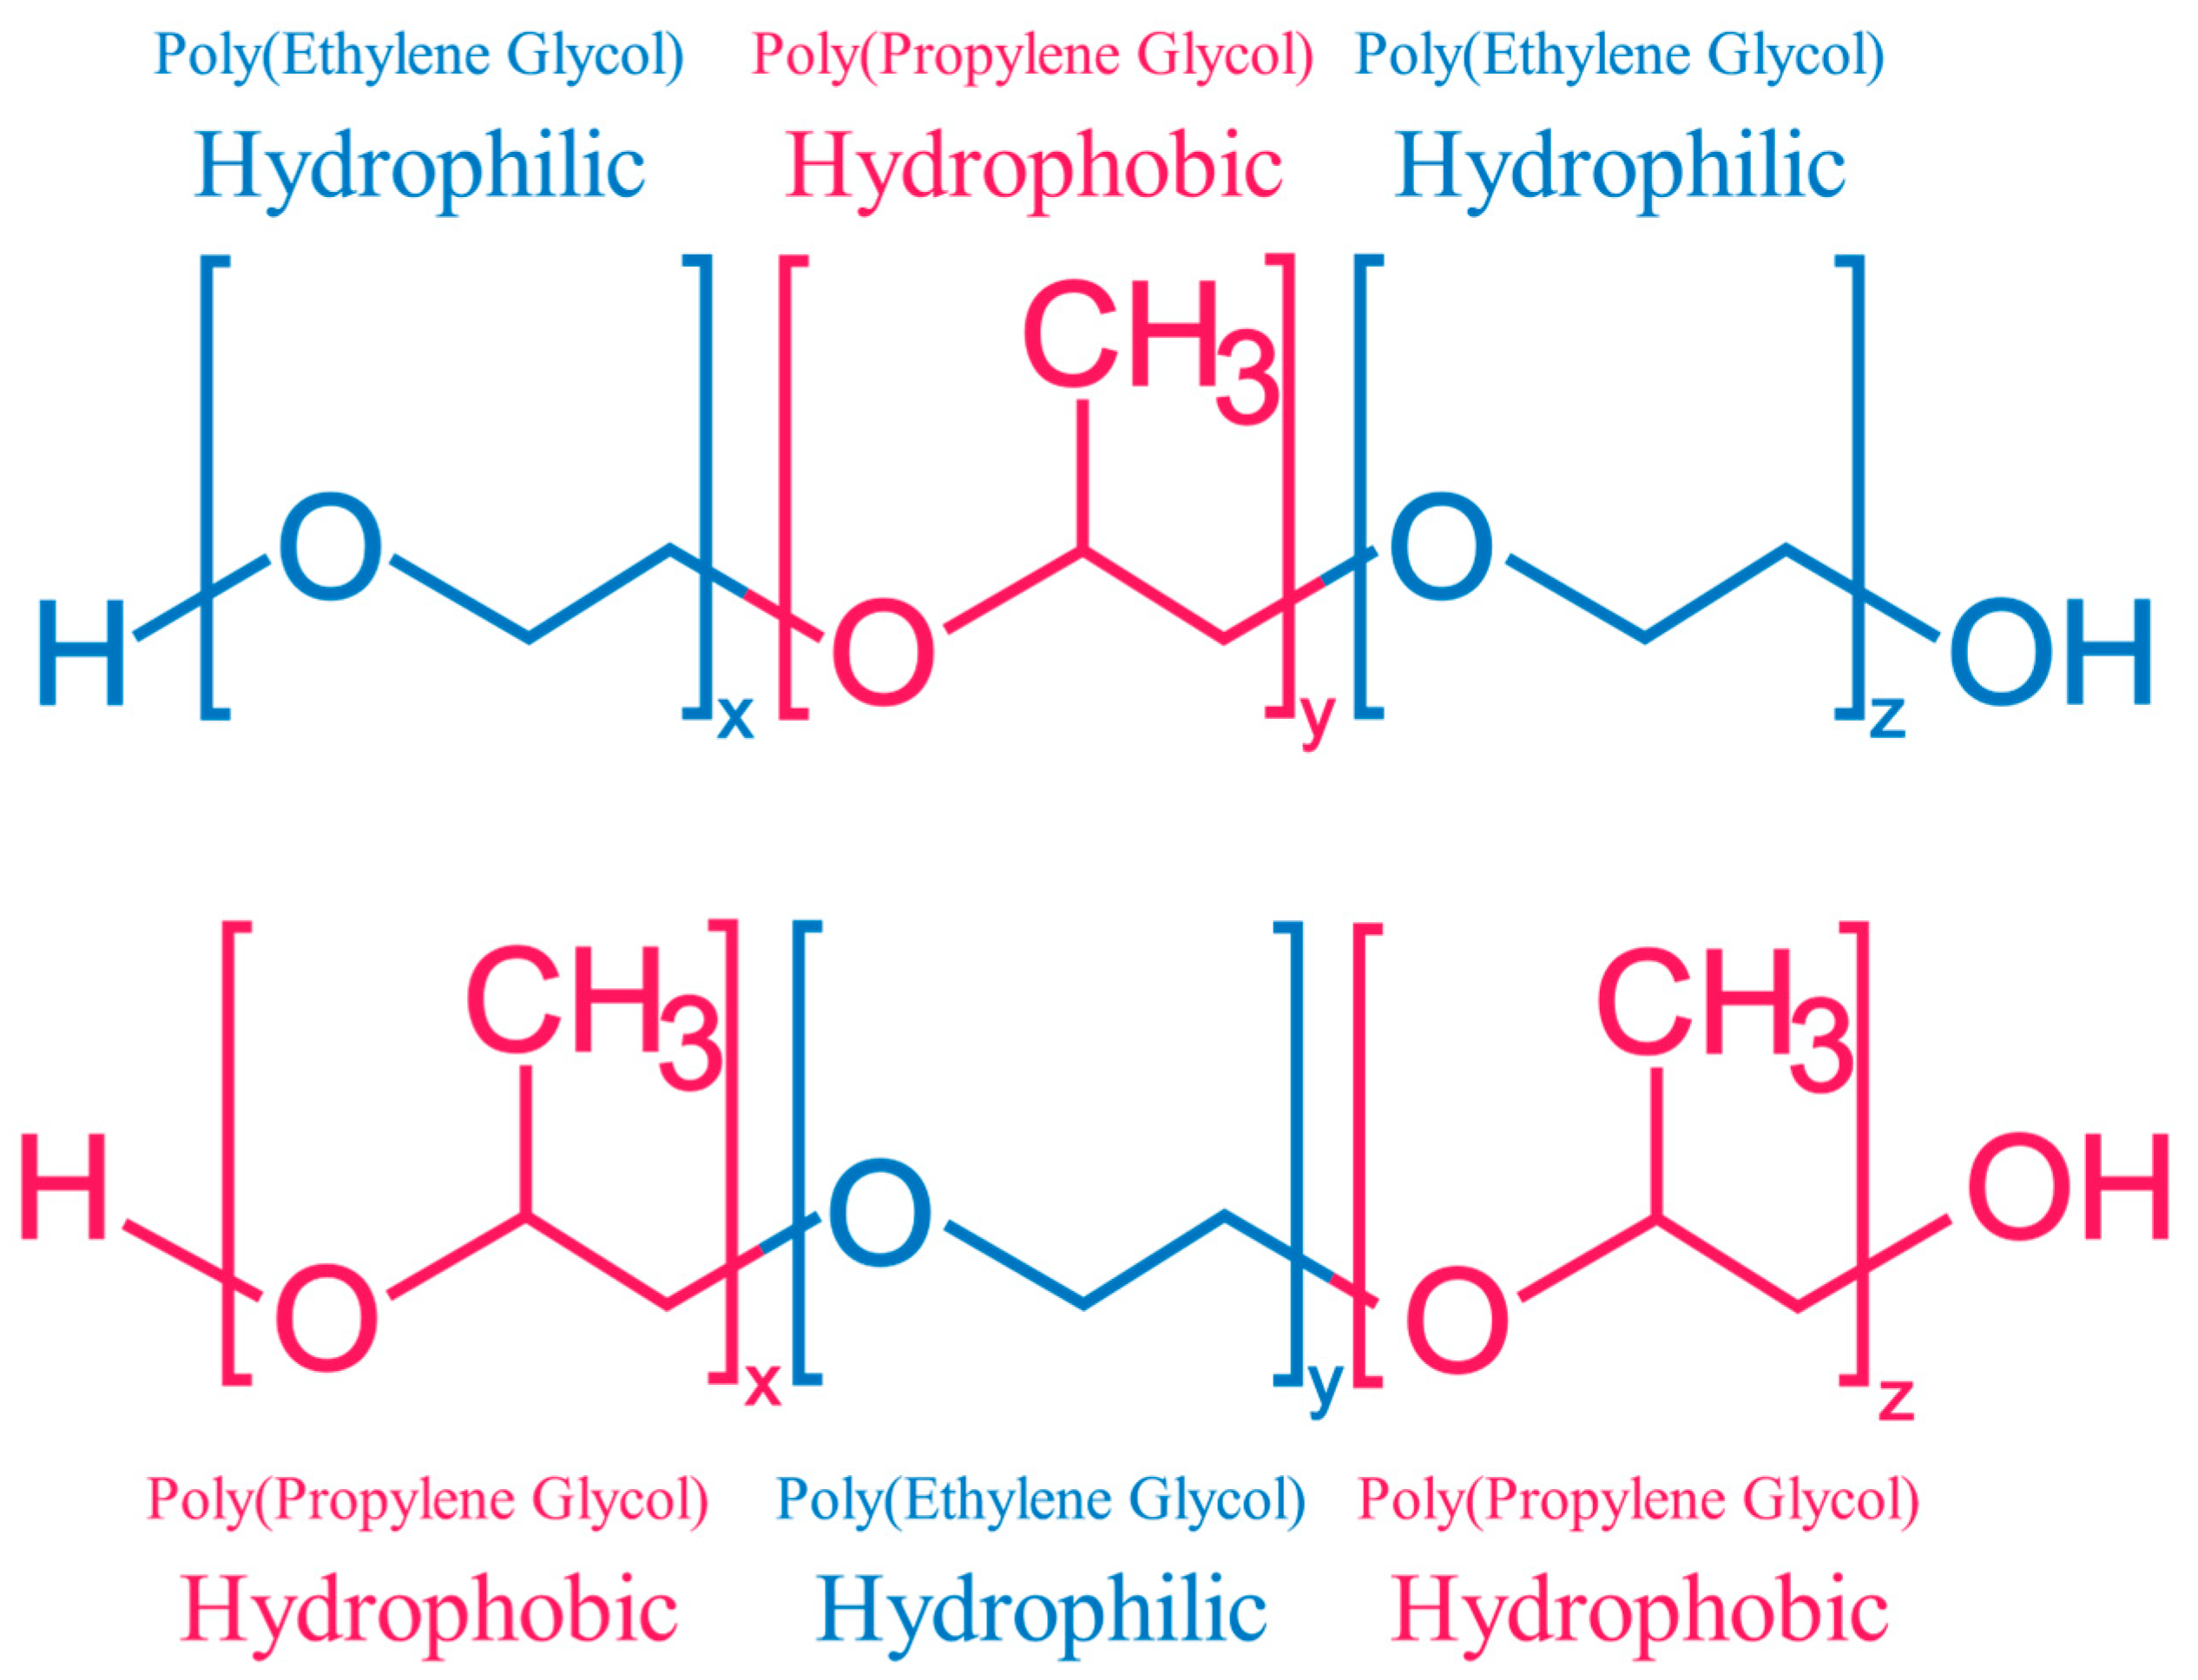
1.2. Chemical Structure of Triblock Copolymers

Poloxamer A-B-A triblock copolymers, also known as Pluronic® or Synperonic®, are a class of nonionic amphiphilic polymers with different physical forms and molecular weights ranging from approximately 1000 up to 15,000 Da [10,11]. These copolymers typically consist of A blocks, which are hydrophilic poly(ethylene glycol) (PEG), and B blocks, which are hydrophobic poly(propylene glycol) (PPG). However, some variations have inverted orders of A and B blocks, known as “reversed” copolymers. The molecular structure of these copolymers is shown in Figure 1.
The number and ratio of PEG to PPG blocks significantly influence the physical and chemical properties of these copolymers, including their physical state, surface activity, solubility, hydropathicity, and molecular weight [10]. Hydrophilic–Lipophilic Balance (HLB) is an important parameter used to quantify the overall hydropathicity of the copolymer, representing the balance between its hydrophobic and hydrophilic components [12]. A lower HLB value indicates higher hydrophobicity, while a higher HLB value corresponds to greater hydrophilicity [12]. The physicochemical properties of the copolymers used in this study, including HLB, are summarized in Table 1. Very high molecular weights in copolymers can reduce dissolution rates and transform the physical state from liquid to solid, mainly due to the increased propensity for large copolymers to form hydrogen bonds with each other [11]. These copolymers have found widespread use in different research areas, including drug delivery, gene therapy, and therapeutics [10,13,14], foaming, emulsifying, and dispersing agents in pharmaceuticals and cosmetics [10,11,14], as well as many other applications [11,14].
These copolymers have not been studied in the context of Portland cement applications, and their potential applications in this field remain largely unexplored. Previous research has mainly focused on their use in other types of biomedical cements, such as brushite or polymethylmethacrylate cements employed in bone tissue treatment [15,16]. These studies have demonstrated the potential of certain copolymers to create stable foams and generate highly porous microstructures. Therefore, it is of great interest to investigate the compatibility and effectiveness of these polymers with Portland cement. In a previous study, we investigated these copolymers for their physical properties and shrinkage [17]. In this study, four distinct PEG-PPG triblock copolymers were carefully selected and examined in a Portland cement paste environment. Their physicochemical properties, including hydrodynamic size and surface activity in cement pore solution, have been measured. Furthermore, various characteristics of fresh and hardened cement paste were evaluated using a wide range of experimental techniques, including foaming behavior, adsorption to cement particles, flow, air-entrained void microstructure, and water sorption tests. Finally, the impact of alterations in microstructures resulting from the copolymer addition was assessed through freeze-thaw experiments.

2. Experiments

2.1. Materials

The four PEG-PPG triblock copolymers (three regular poloxamers and one reverse) were purchased from MilliporeSigma and used without further modification. Their Pluronic® identifier, along with physical and chemical properties, are summarized in Table 1. Henceforth in this paper, the term copolymer refers to PEG-PPG triblock copolymers and not any general copolymer molecule. Therefore, mentions of the term PEG-PPG triblock copolymers will be only for emphasis on the type of copolymers.
Polymer solution tests were performed in either deionized water (DI) or filtrate pore solution (FPS). FPS was obtained by pouring fresh cement paste in 50 mL tubes after 30 min and double centrifuging for 5 min at the speed of 4400 rpm. The pH of these solutions was measured to be in the range of 12.6 to 12.9. Copolymer solutions are identified with COP- followed by their corresponding molecular weight, as shown in Table 1.
Portland cement was acquired from Cemex and used in the preparation of cement paste, with the oxide composition reported in Table 2. Samples were cast into 12 by 1 inch prism molds, vibrated for 30 s, and wrapped in a plastic foil to prevent evaporation. After 24 h, they were demolded and sealed in double-layer plastic bags and cured for 7 to 28 days. Fresh and hardened cement pastes are identified with a CEM-, followed by the added copolymer.

2.2. Experimental Methods

2.2.1. Adsorption of Copolymer on Cement Particles

The adsorption of copolymers on cement particles is carried out using a Shimadzu TOC-Vwp total organic carbon (TOC) analyzer. The device can measure the carbon content in the range of 0–3500 mg/L with a detection accuracy of 0.5 μg/L. The non-purgeable organic carbon (NPOC) method was used, which consists of acidifying the sample with phosphoric acid and sparging in order to remove the inorganic carbon content. After that, the total carbon equaling the organic carbon content was measured and reported.
By comparing the organic carbon content in the copolymer solution with the cement pore solution extracted from cement paste with copolymer added during mixing, it is possible to determine the number of copolymers that have adsorbed on cement particles. The copolymers were added in different concentrations to DI and mixed for 10 min at low speed to prevent foaming. A total of 20 mL of this solution was added to 40 g of cement inside a 50 mL centrifuge tube, agitated for 30 s by hand, and mixed for 5 min using a 180 rpm rotary wobbler. The tubes were then centrifuged at 4400 rpm to extract the solution, filtered through a 0.22 μm VWR syringe film to remove large particles, and diluted to a lower concentration before the TOC analysis. Finally, the adsorption amount Q was calculated based on the concentration of carbon in DI C 0 and in pore solution C 1 , volume of the dilute solution V and the mass of cement m . The trace amount of carbon in the control cement paste was also measured and deducted from the C 1 values of the cement pore solution samples.
Q = C 0 C 1 V m

2.2.2. Paste Flowability

The flow of fresh cement paste modified with copolymers was measured using a mini-cone setup. The cone has dimensions of 10 cm and 7 cm in diameter and 5 cm in height. The cone was placed on a tray, filled with a 10 min old paste, and tamped by hand, after which the cone was removed. The tray was dropped from a height of 5 cm 25 times during a 15 s duration, and the average diameter of the spread paste was recorded and reported for three repetitions.

2.2.3. Foaming Measurements

Foam Index Test

To measure the foam compatibility of copolymers in a cement system, 10 g of cement and 25 mL of DI were mixed into a 50 mL centrifuge bottle (W/C of 2.5) and capped. The bottle was shaken for 30 s in frequencies of two shakes per second in a 20 cm amplitude. A drop of the 5% copolymer solution, with a known quantity of 2–20 μL based on the copolymer type, was pipetted into the tubes and noted. The container was shaken for 15 s and laid on its side to rest for another 15 s. For the duration of the 3rd 15 s period, the foams were observed for two characteristics, that they cover the entire air–water surface, and are stable for the entire 15 s period. This cycle continued until the foams satisfied the criteria, at which point the number of drops were recorded for that specific copolymer. This procedure was adopted with slight changes from the literature [18,19].
Finally, the specific foam index (SFI) expressed in terms of ml AEA/100 kg of cementitious material was adopted from Harris et al. [18]
S F I = 100   D V C 100   M C
where D , V , C , and M C are the number of drops, volume of each droplet (μL), concentration of the copolymer solution (%), and the mass of the cementitious material (g). This index quantifies the effectiveness of copolymers in terms of foam generation and stabilization in cementitious environments.

Foam Volume

The foaming properties of copolymers in the ionic environment of cement pore solution was evaluated by adding 10 mL of extracted FPS to a 50 mL capped graduated cylinder and adding 0.25% (w/w cement or 0.5% w/w solution for a W/C of 0.5) and shaking vigorously for 15 s. The foam volume was recorded at 0 min and then at 10 and 20 min to assess the foamability and foaming stability of copolymers in FPS.

2.2.4. Physicochemical Measurements

Surface tension was measured with a BZY 201 tensiometer using the platinum plate method and the results were reported as an average of five repetitions. For FPS measurements, the pore solution of a cement mixture with W/C = 0.5 was extracted by centrifugation at 4400 rpm from the mixture hydrating for 30–60 min. The specified concentrations of copolymers were then added to the FPS and mixed thoroughly before performing the surface tension test.
The hydrodynamic size of copolymers was measured through the dynamic light-scattering (DLS) technique with Malvern Zetasizer Nano ZS at a concentration of 0.2% w/w of the solution at a temperature of 25 °C. The DLS technique measures the scattered light intensities when it passes through a suspension of fluctuating particles to find the translational diffusion coefficient D , which can give the hydrodynamic particle diameter D H when plugged into Stokes–Einstein equation,
D H = k T 3 π η D
in which η , k , and T are the dynamic viscosity, Boltzmann’s constant, and temperature, respectively. The distribution of particle size can be quantified through the polydispersity index (PDI), which varies in the range of 0 to 1.

2.2.5. Fourier Transform Infrared Spectroscopy (FTIR)

Mid-range FTIR spectroscopy was conducted with a PerkinElmer Frontier spectrometer on 20% w/w aqueous solutions of copolymers. Aqueous solutions were chosen to eliminate the bias between copolymers in powder vs. liquid form that was observed in preliminary scans, and high concentration was needed to achieve a good signal and distinct peaks. A resolution of 2 cm−1, 16 accumulations, three repetitions, and a rate of 0.1 Hz was selected for the scans.

2.2.6. Micro-Computed Tomography (Micro-CT)

Hardened cement paste samples were cut into 10 mm cubes and scanned using a Bruker Skyscan 1273 micro-CT instrument. The machine has a Varex 2315 detector and a Hamamatsu L9181-02 X-ray source, capable of outputting a matrix of 3072 by 1944 pixels and pixel sizes as small as a few μm. The scans were performed at a pixel size of 8 μm, with a copper filter of 0.3 mm thickness, and at 110 kV and 72 μA. Projections were taken at steps of 0.4 degrees and averaged 15 times. For reconstruction, a beam-hardening correction of 15%, ring artifact correction of 10, and dynamic range of 0–0.02 was applied using the Bruker NRecon software v1.7. Finally, voids were selected in the greyscale range of 0–80 and void structure analysis was performed using the CTAn software v1.23.0.2.

2.2.7. Gravimetric Water Sorption

Cement paste cubes of 1-inch dimensions were cut from the cement paste prisms at the age of 28 days and dried at 40 °C for 24 h. The sides of the samples were covered with aluminum foil to limit sorption from only one surface. Samples were submerged 4 mm deep into the water and put on top of a perforated plastic scaffolding. The weight was measured at different intervals and compared to the initial dry weight, and the intrinsic sorption I was measured using Farnam et al.’s equation [20], a modified version of ASTM C1585’s equation [21], which considers parameters including porosity, degree of initial saturation, and the liquid’s surface tension and viscosity. Because the absorbing solution in this work is water and the samples are assumed to be completely dry, Farnam’s equation is simplified as
I = m i m 0 A   ·   Φ ·   ρ w
where m 0 and m i denote initial dry mass and mass at time i in grams, A is the exposed area in mm2, Φ is the porosity of the sample as volume fraction, and   ρ w is the density of water in g/mm3.

2.2.8. Water Sorption Using Micro-CT

To study the sorption of water into cement paste samples modified with different copolymers, water sorption was monitored using micro-CT. A 10% w/w dopant CsCO3 solution was used because CsCO3 has high attenuation with X-ray and makes it possible to distinguish water-based solution from the cement paste matrix in the micro-CT scans. The setup and interpretation procedure for this experiment is shown in Figure 2. As Figure 2a shows, the dried cement paste sample is sealed on the sides with aluminum foil tape and glued to the cap and suspended a few millimeters deep in CsCO3 solution. The tube is then placed on the stage of the micro-CT machine and scanned quickly at various times. Figure 2b displays the average greyscale value of all the pixels in each cross-section of the sample of different scans that correspond to the solution. It is important to note that Figure 2b does not display the full greyscale spectrum of cement paste and CsCO3 solution; instead, it only shows the absorbed CsCO3 solution in the paste. To achieve this, cement paste’s dynamic range was removed through thresholding (range of 130–255 greyscale values), and then an averaging was conducted only on cross-sections of CsCO3 solution.
This way, only the changes in CsCO3 solution intensity are reflected in the graphs. The number of cross-sections between the first peak and the final point is the farthest distance that water has penetrated. Multiplying this number by the pixel size and then repeating for various times of exposure results in Figure 2c, which shows the water sorption behavior for one of the repetitions of the CEM-COP3300 sample in the first 24 h. The results obtained from this method were validated with those calculated through the methodology described by Moradllo, Hu, and Ley [22,23,24].

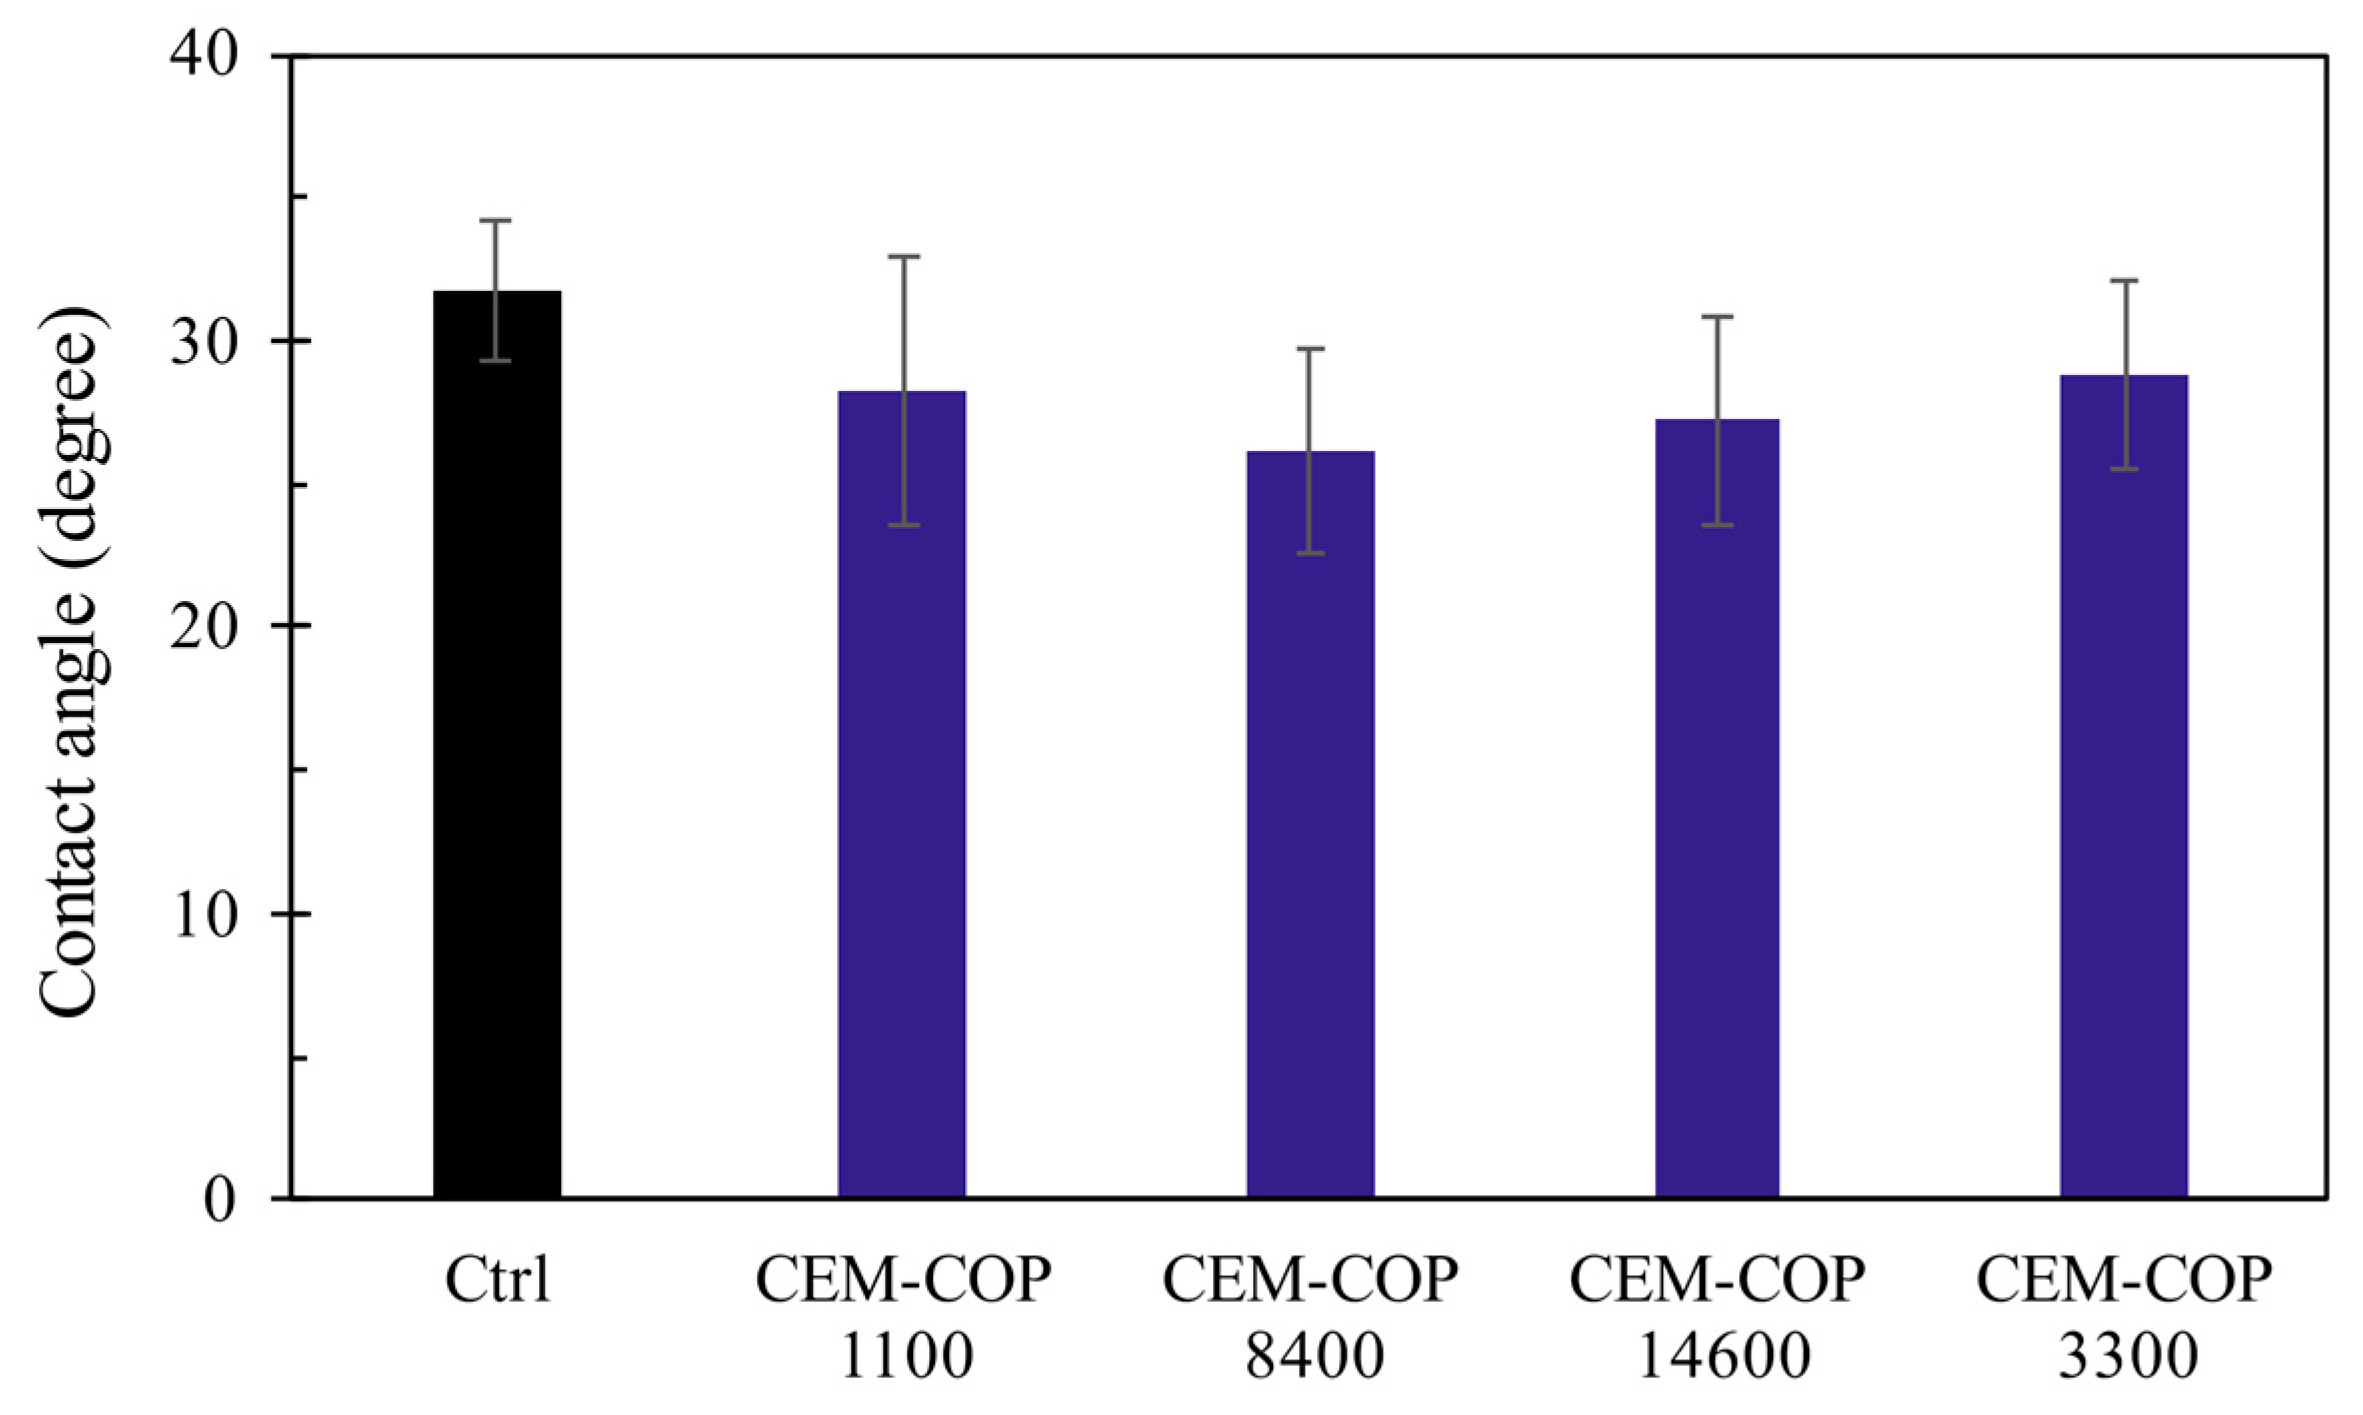
2.2.9. Contact Angle Measurements

The contact angle experiment was performed on 1-inch cement paste samples at the age of 28 days. Samples were oven-dried for 24 h prior to cutting, and the internal surfaces were dry-polished with silicon carbide sandpapers with grit numbers of 180, 320, 600, and 1200. A total of 2.5 μL water droplets were placed on the polished surfaces and images were captured and analyzed using Attention Theta Flex. The Young–Laplace equation was used to fit a curve to the droplet’s outline and calculate the angles.

2.2.10. Freeze-Thaw

The freeze-thaw experiment was performed on four replicates of 1-inch cube samples of hardened cement paste containing 0.25% copolymers. Samples were oven-dried at 50 °C for 24 h and then submerged in water in the metallic containers in the freeze-thaw instrument. Samples were then subjected to freeze-thaw action between −18 °C and 12 °C with a Humboldt freeze-thaw cabinet. The average rate of temperature change was around 3 °C/h with 1 h of rest at 12 °C and −18 °C, which made two cycles per day possible. The control unit of the instrument was connected to a thermocouple that was placed directly in the water.

3. Results and Discussion

3.1. Physicochemical Properties of PEG-PPG Triblock Copolymers

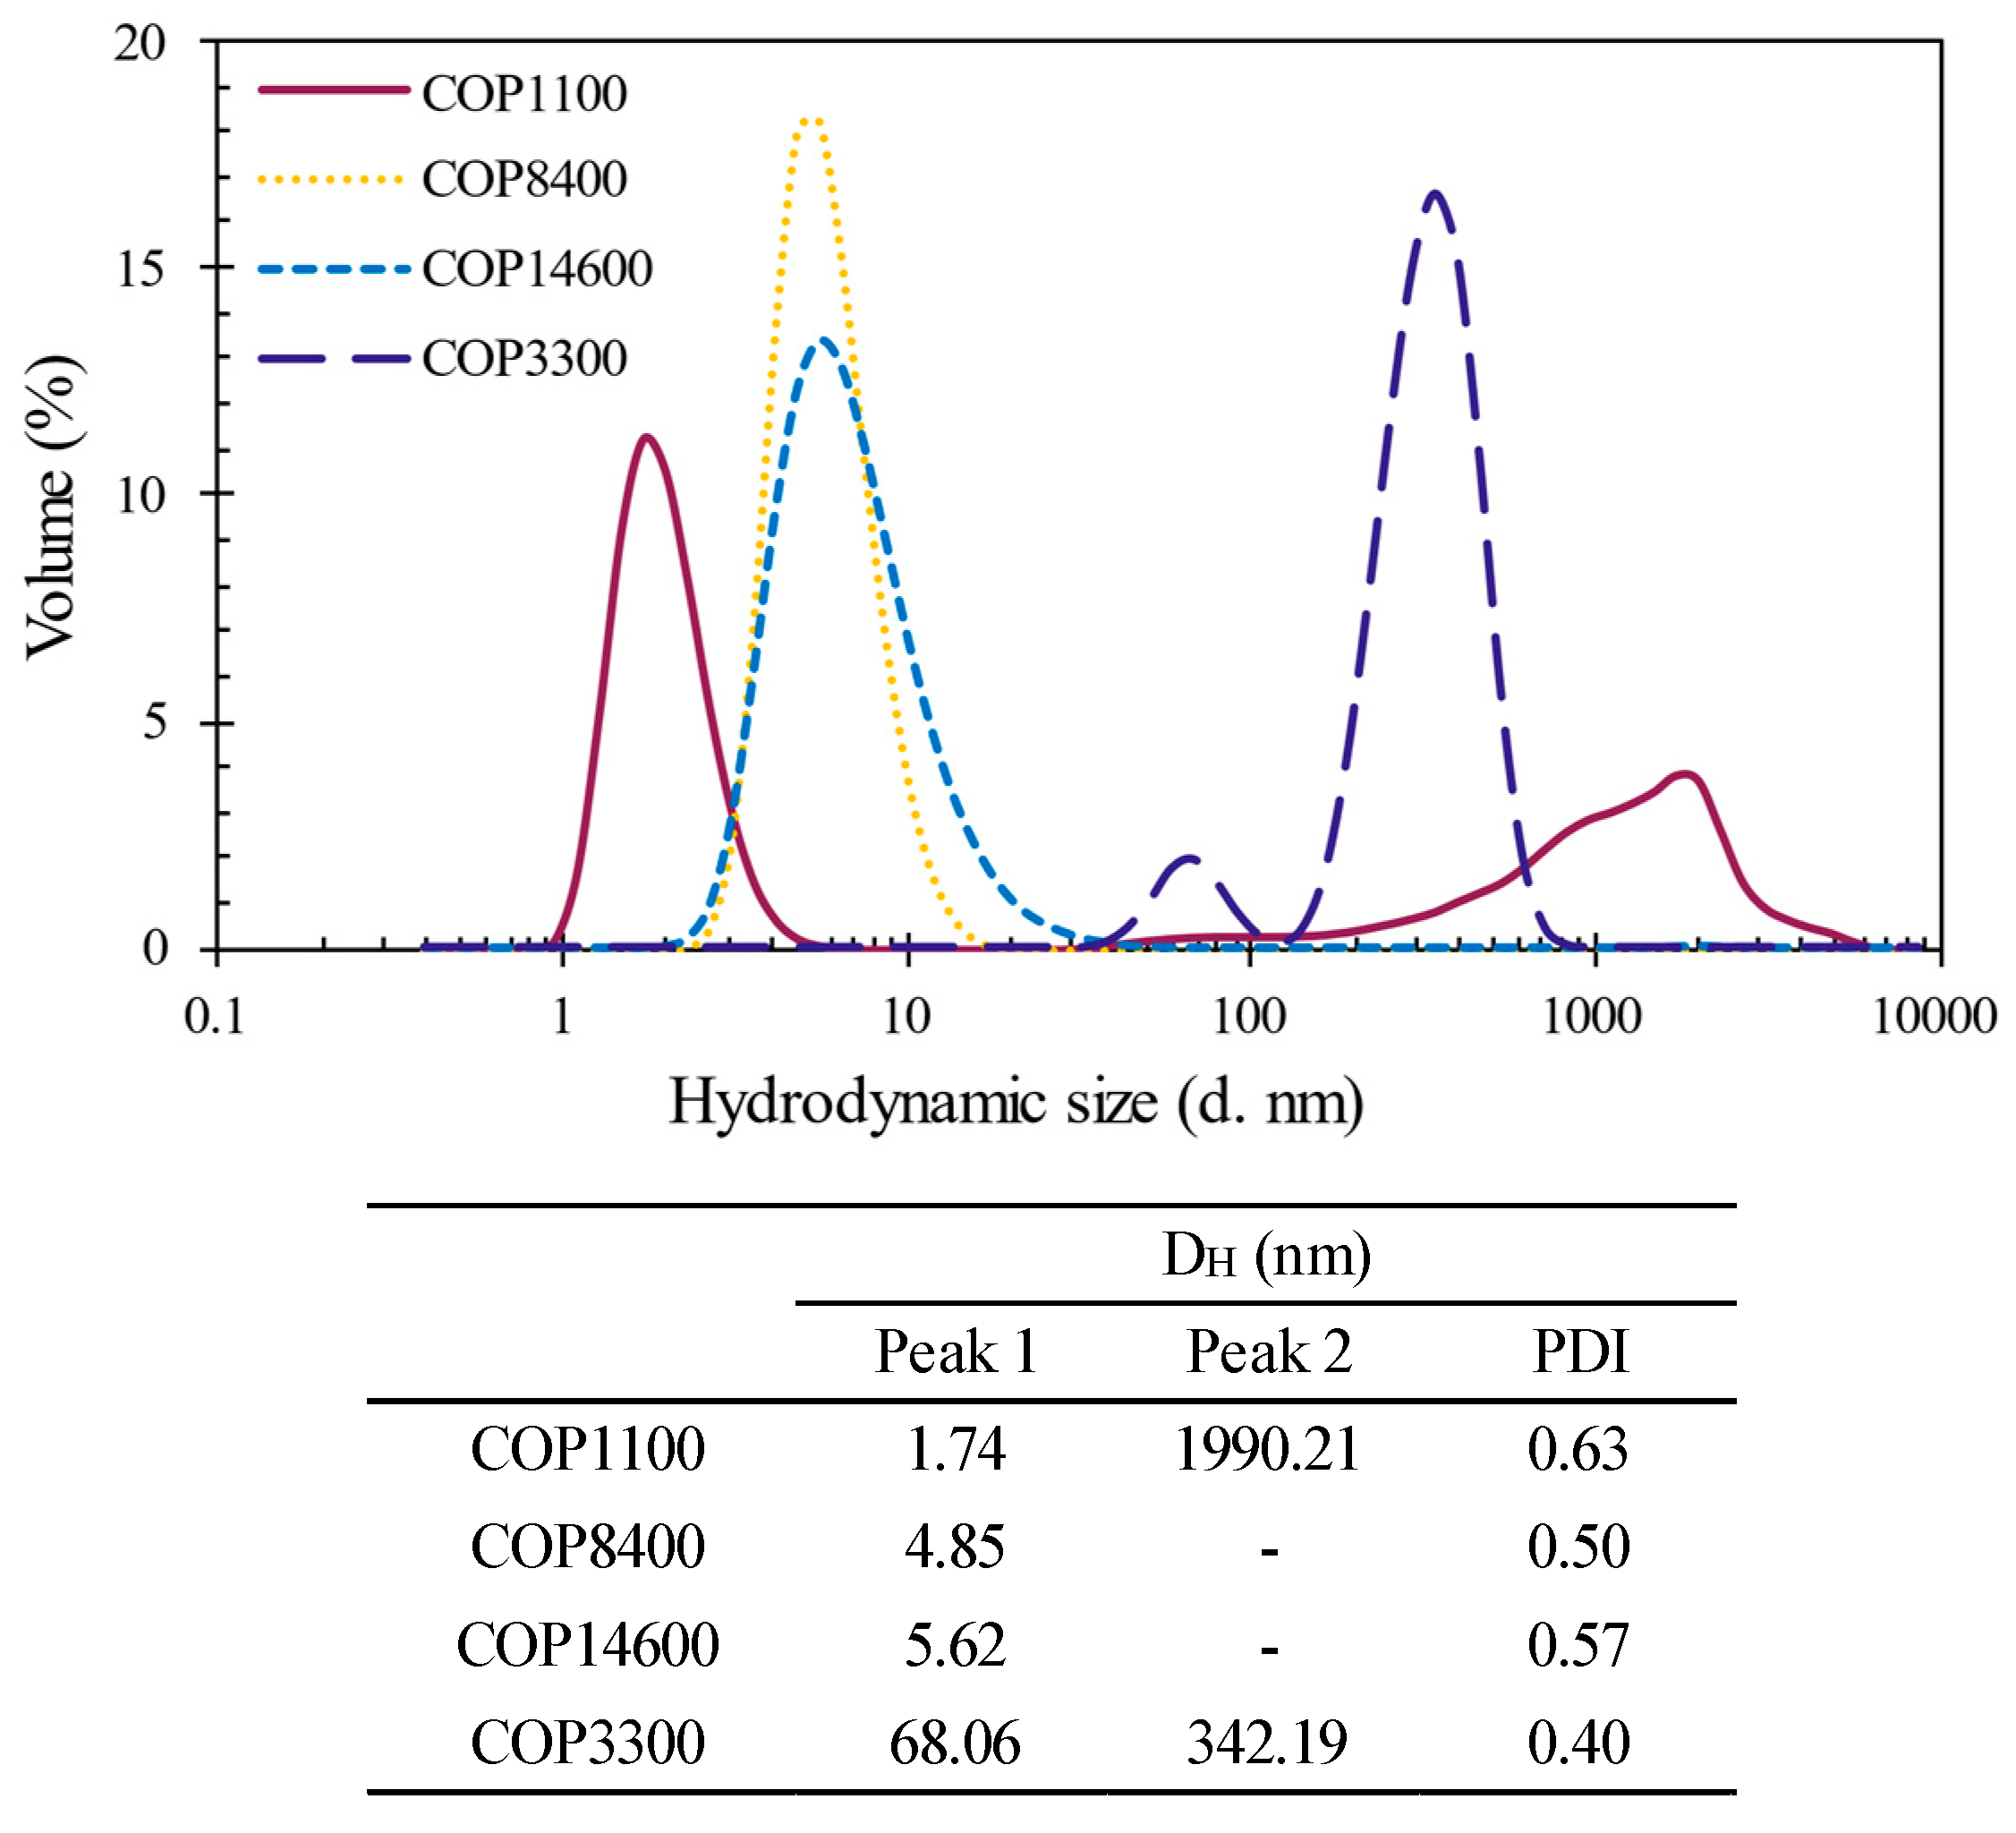
3.1.1. Hydrodynamic Size of Copolymers

The average hydrodynamic size of the copolymers is illustrated and summarized in Figure 3. The hydrodynamic size of these molecules is influenced by various parameters, including concentration and temperature. Generally, light-scattering techniques indicate a hydrodynamic size around a few nanometers for most copolymers at room temperature and low concentration [11]. In this study, the hydrodynamic size of COP8400 was measured to be 4.85 nm, closely matching the 4.6 nm reported by Zhou and Chu at room temperature [25]. COP8400 and COP14600 exhibited a single major peak in the DLS experiments, while COP1100 and COP3300 had multiple peaks, indicating a significant degree of micellization. This observation is expected, given the very high hydrophobic attractive forces generated in COP1100 and COP3300 copolymers because of their low PEG/PPG. Particularly in COP3300, where the A blocks are hydrophobic PPGs, extensive aggregation is observed. While there is a small peak at 68 nm, a much larger peak at 342 nm is observed, characterized by the lowest PDI, indicating a narrow band of particle size.
Although COP8400 and COP14600 exhibit much lower hydrophobic micellization and lack multiple peaks in the DLS measurements, they show noticeable polydispersity in their distributions, as seen in Figure 3. Previous studies [11,25] attributed this high PDI to copolymers’ very large molecular weight. Overall, the average polydispersity observed in this study is slightly high at around 0.5, indicating a relatively high degree of non-uniformity in the distributions. Nevertheless, PDIs around 0.5 obtained from DLS are common in the literature for these copolymers [12].
The PEG/PPG and the length of the blocks can determine the overall shape of the micelle, including spherical, cylindrical, and lamellar conformations [26]. Micellization, driven by the hydrophobic blocks, can form micelles with an aggregation number ranging from 3 to 65 and a hydrodynamic size of approximately 5–15 nm for different PEG-PPG-PEG types [11]. Although limited data are available for reverse copolymers of PPG-PEG-PPG, their micelle size in Figure 3 indicates the potential for even higher aggregation numbers. Micelle formation in copolymers with a high PEG content is less feasible at room temperature due to their low hydrophobic forces [11]. Therefore, micellization is more anticipated in COP1100 and COP3300 than in the other two copolymers. The formation of micelles for these copolymers above their CMC happens with hydrophobic PPGs as the core and the hydrophilic PEGs as the outer shell/corona [10,27].

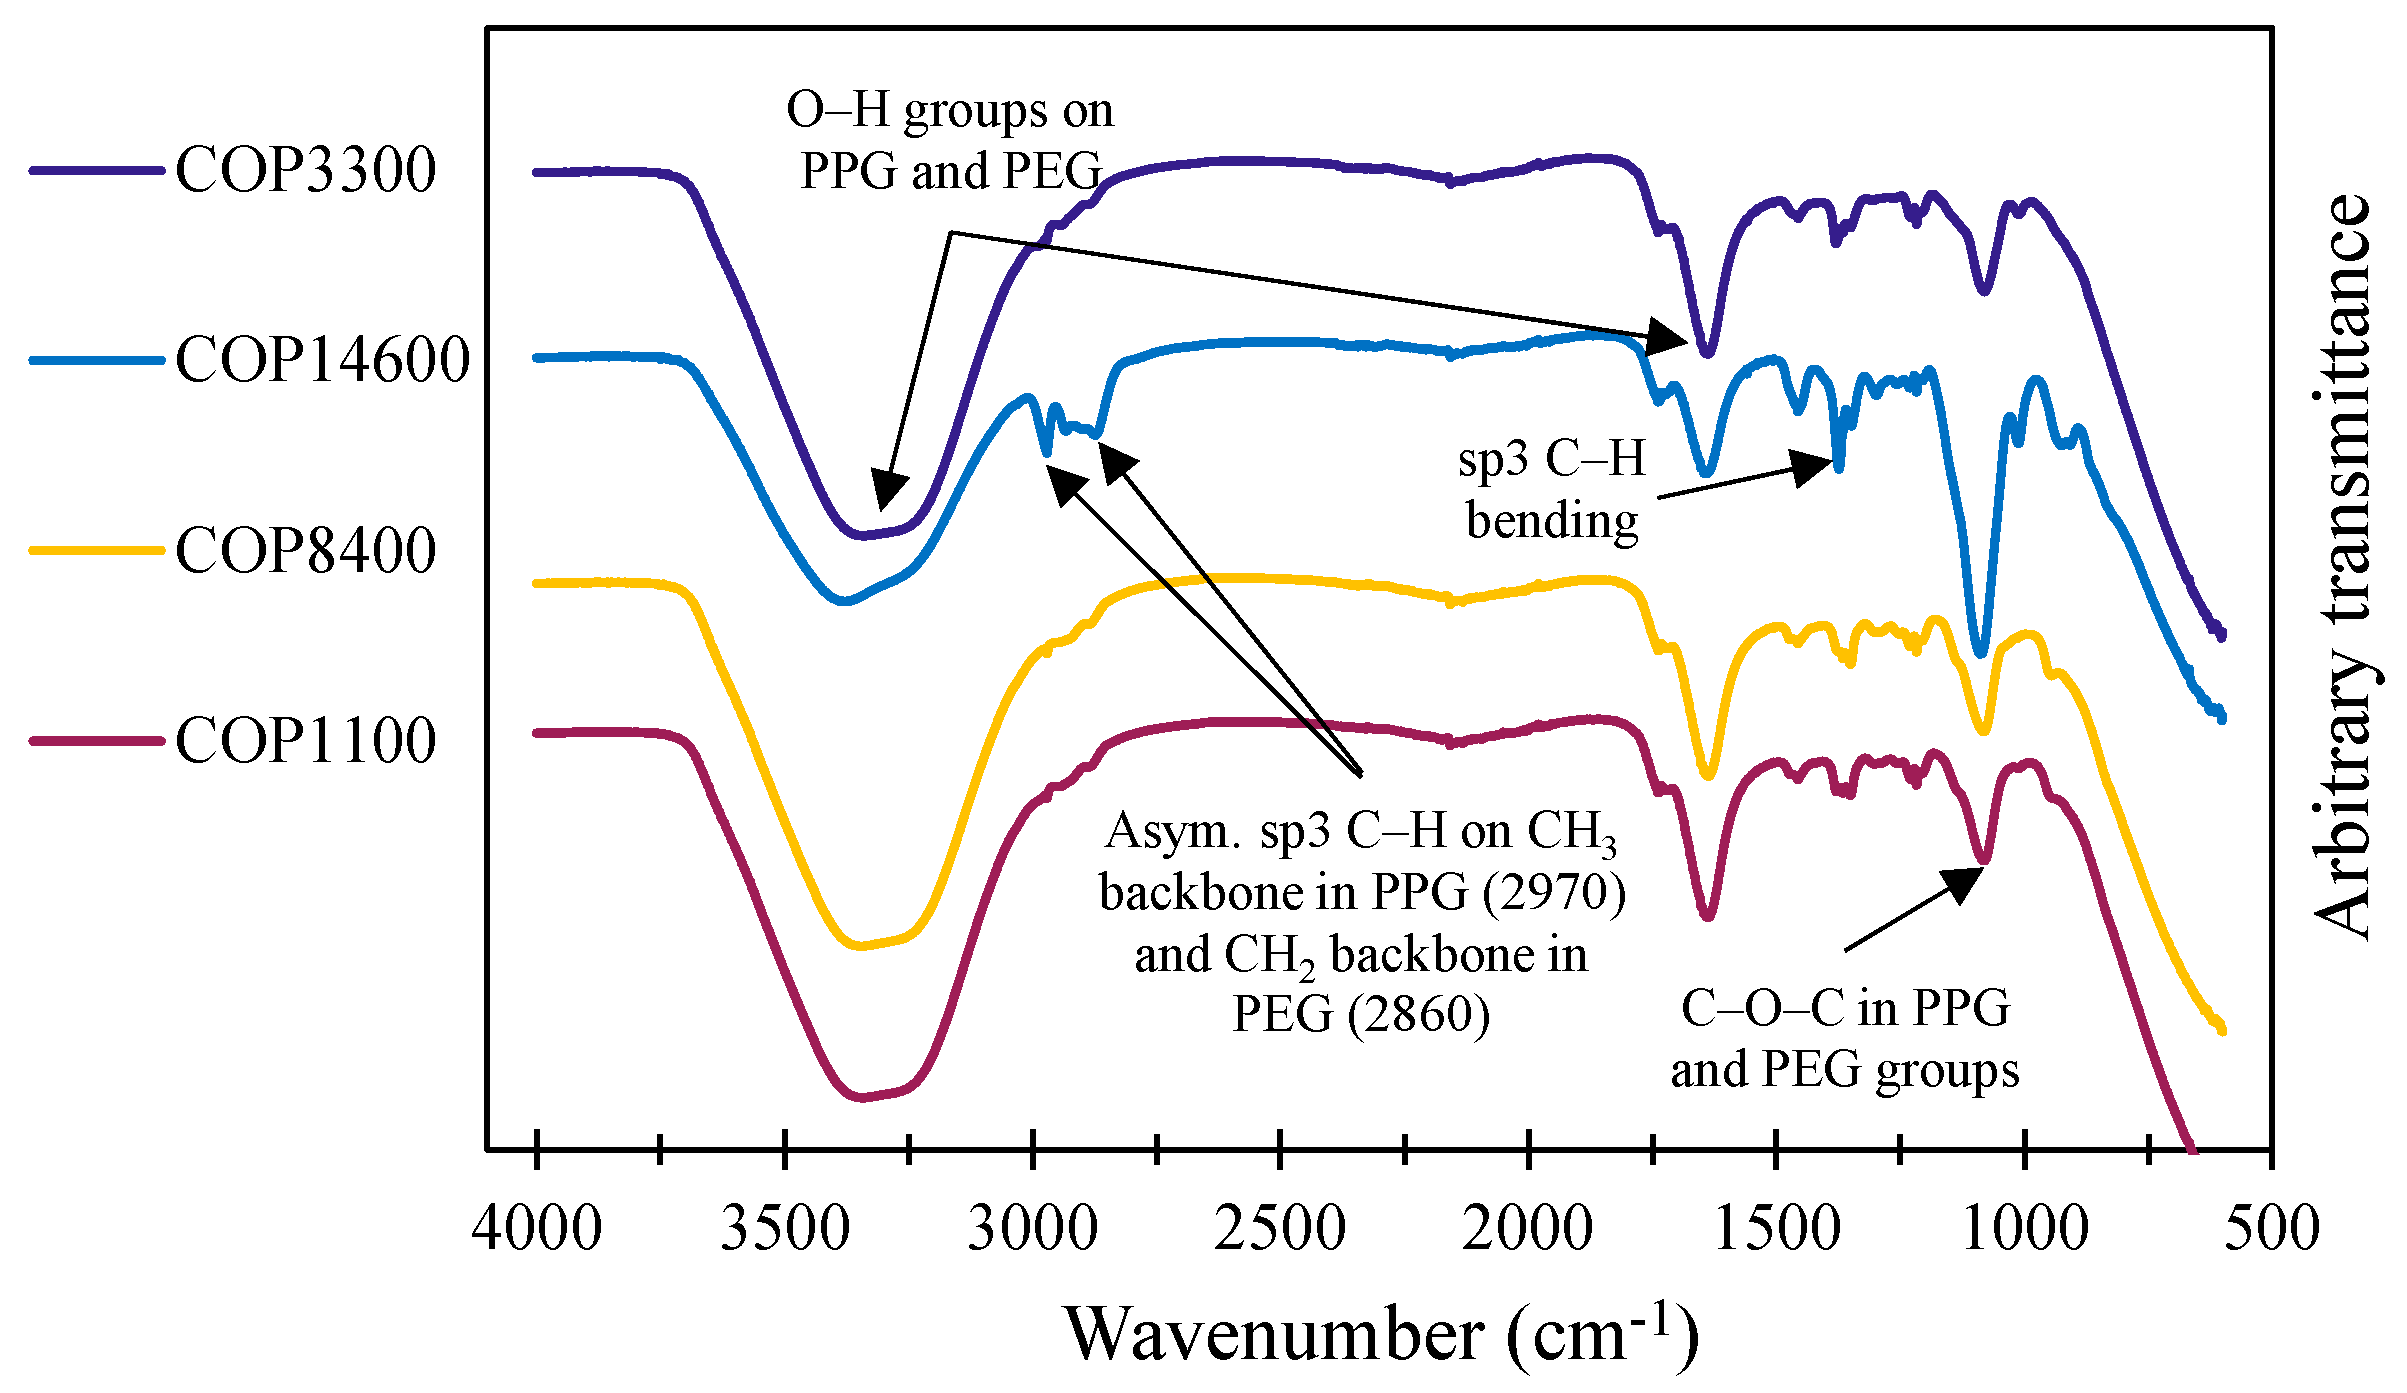
3.1.2. FTIR in Solution

The FTIR study was conducted to identify the main functional groups of the copolymers in an aqueous solution, with the result presented in Figure 4. The major peaks observed at 3300 cm−1 and 1640 cm−1 correspond to O–H stretching and bending bands, respectively, indicative of both the solvent and the O–H groups being present in the PPG and PEG monomers of the copolymer backbone [28]. Notably, there was no significant alteration of O–H groups at 3300 cm−1 due to the copolymer addition, while the region at 1640 cm−1 exhibited an apparent change, consistent with findings from prior studies [29]. Particularly in COP14600, a decrease in peak amplitude at 1640 cm−1 and an increase in 1750 cm−1 are observed.
The peaks at approximately 2970 cm−1 and 2860 cm−1 are representative of stretching vibrations of C–H groups in the respective CH3 and CH2 backbones of both PPG and PEG monomers [29]. Although these peaks are somewhat concealed in lower molecular weights, in COP14600, both peaks are distinctly spotted. Other major peaks are seen around 1090 cm−1, corresponding to C–O in-plane stretching bonds connecting the CH2 groups in PPG and PEG monomers [30], and at 1370 cm−1, denoting C–H bending groups. The C–O groups in COP14600 exhibit very high transmittance compared to copolymers with lower molecular weights, showing a significantly higher quantity of these bonds and a longer hydrocarbon backbone in COP14600.

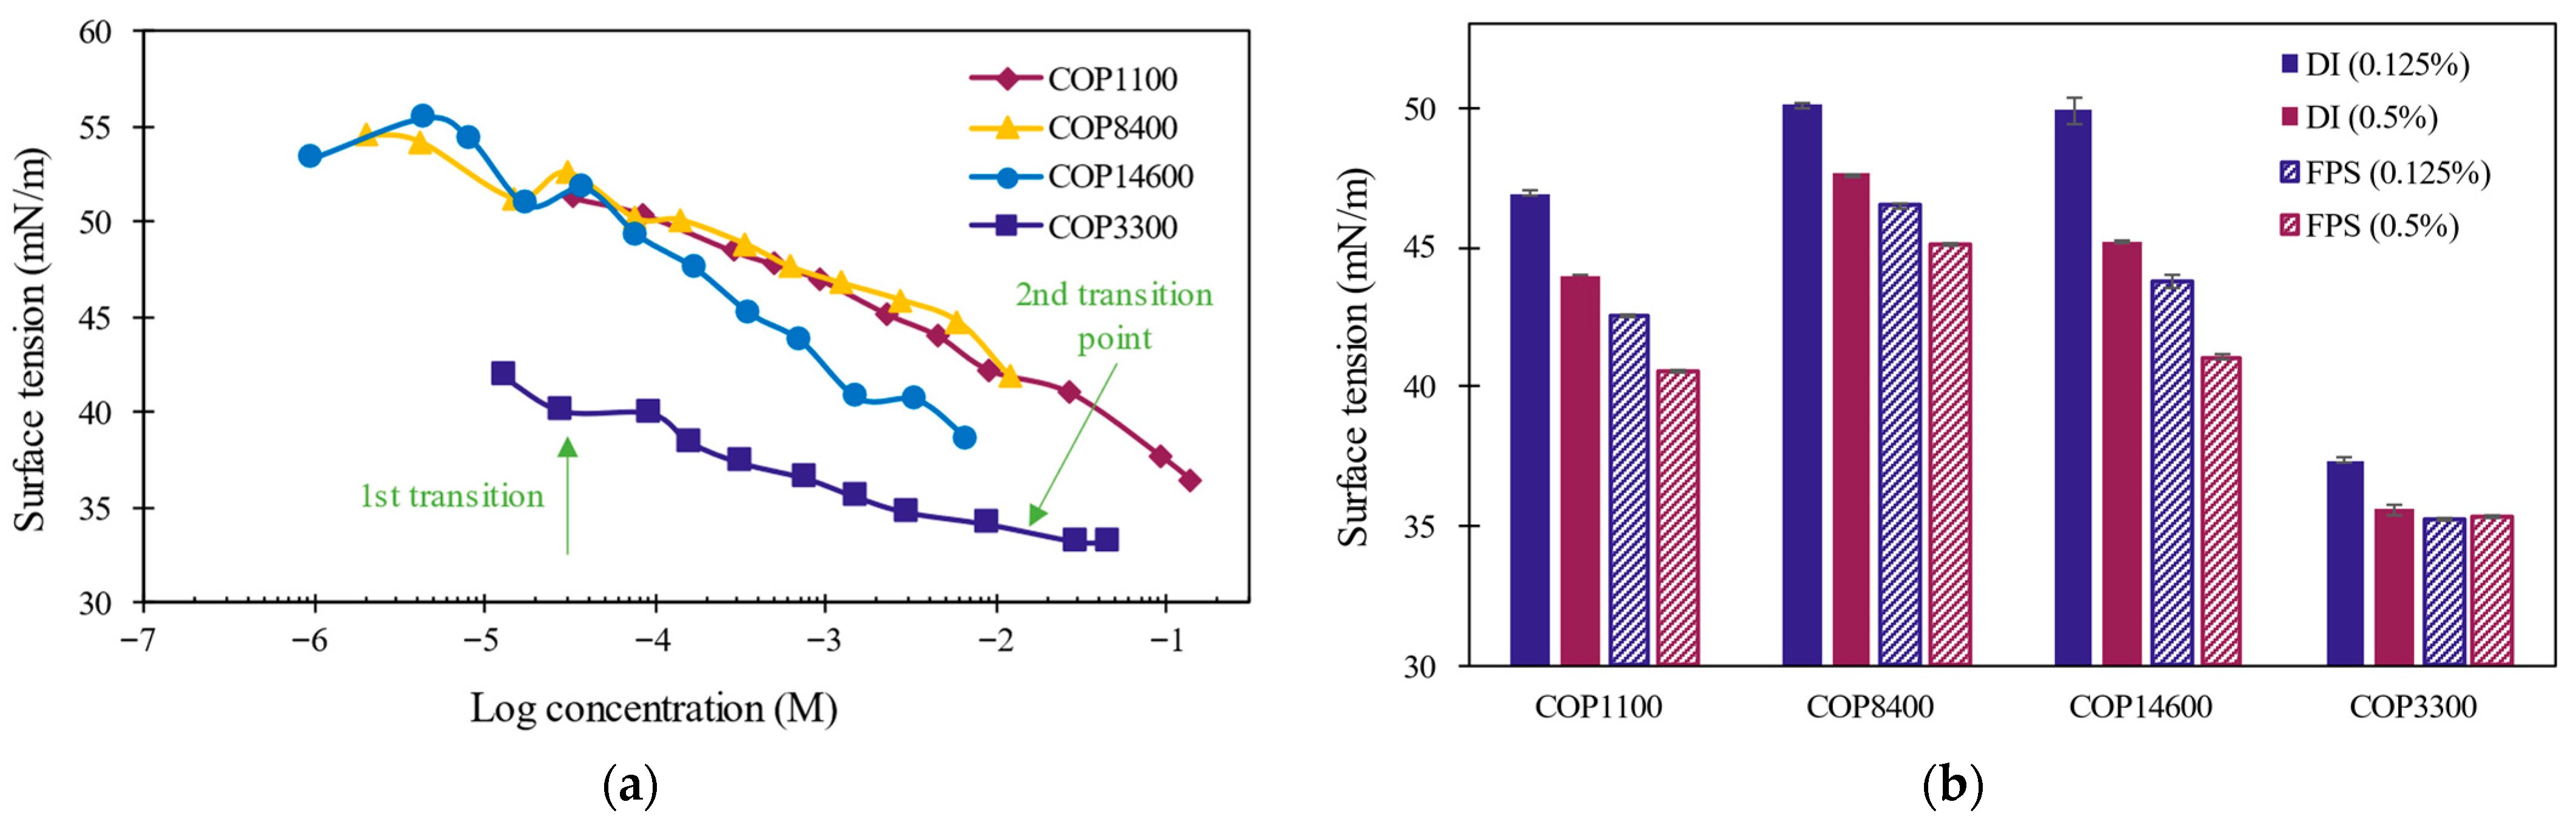
3.1.3. Equilibrium Surface Activity

Figure 5a shows the efficacy of copolymers with varying molecular weights and chemical chain arrangements in reducing the surface tension of DI. It is apparent that the highly hydrophobic COP3300, characterized by the PPG-PEG-PPG structure in Figure 1, exhibits the lowest surface tension among the copolymers. In contrast, the three other PEG-PPG-PEG copolymers demonstrate similar surface tensions, at least in lower concentrations.
The surface tension decreases gradually with an increase in concentration until it reaches a specific concentration known as the critical micelle concentration (CMC). At the CMC, surfactants start to self-associate to form micelles. At concentrations above CMC, the surface tension stabilizes, forming a plateau and showing little further changes. However, it is worth noting that for certain surfactants, there might be a slight increase in surface tension above the CMC [31]. The CMC is not always distinctly defined, and in some cases, especially for PEG-PPG triblock copolymers, multiple stages of behavior may be observed [11]. In a study by Alexandridis et al. [32], many PEG-PPG triblock copolymers exhibited two points of transition instead of one at room temperature. After the first transition point, a plateau was observed, followed by another decrease in surface tension, the second transition point, and the final plateau. Similar behavior was observed in some copolymers of the current study, particularly COP3300, as depicted in Figure 5a. For COP3300, the first plateau appears to occur around −4.5 Log(M), and the second one at approximately −2 Log(M). Some argue that the second transition point identifies the CMC value in PEG-PPG triblock copolymers, i.e., the formation of properly defined micelles [11].
As the concentration of the copolymers increases in the bulk solution, their concentration at the air–water interface also increases. Typically, at a bulk concentration of −6 to −3 Log(M), copolymers reach full coverage of the interface [32]. Higher surface coverage of copolymers thickens the air–water interface and further reduces surface tension. It is postulated that PEG-PPG triblock copolymers undergo extreme folding and coiling at the air–water interface, as evidenced by the surface area covered per copolymer molecule. This proposition stems from the observation that a folded conformation occupies less surface area on the bubble surface compared to a stretched conformation. The proposed orientation of folded copolymers is analogous to a U shape, where the handles represent the A blocks, and the curved bottom represents the B block in an A-B-A structure [11]. This compact arrangement of copolymers on the interface minimizes the exposure of hydrophobic regions to water. It allows the hydrophobic PPG blocks to be positioned toward the air, while the hydrophilic PEG blocks are close to the solution [11].
The relationship between HLB and surface tension in copolymers reveals interesting insights. Generally, copolymers with lower PEG/PGG and HLB values tend to be more hydrophobic and exhibit greater efficacy in adsorbing at the interface to reduce surface tension [11,32]. However, extremely low HLB values may compromise solubility, potentially affecting the copolymer’s ability to effectively position itself at the interface and impact surface tension [11]. This is also contingent on the molecular size of the copolymer [11]. Examining Figure 5a, it is apparent that COP3300, with its very low HLB of 1 and small molecular size of 3300 Da, effectively positions itself at the interface, significantly lowering surface tension compared to other copolymers. On the other hand, COP8400 and COP14600, characterized by high HLB and larger molecular size, are less effective, displaying higher surface tension compared to COP3300. Despite its small molecular size of 1100 Da and relatively low HLB of 5, COP1100 is not as effective as other copolymers in reducing surface tension.
Figure 5b illustrates the influence of the pH and ionic environment of FPS on the surface tension of the copolymers. As is evident in the figure, the copolymers exhibit a slight overall decrease in surface tension for both 0.125% and 0.5% concentrations. For ionic surfactants, the surface tension and CMC in cement pore solution is generally lower than in DI. This is because the ions in the solution shield the electrostatic repulsion between ionic surfactants and enable them to pack more tightly at the air–water interface, thereby reducing surface tension more effectively [33,34]. The lower electrostatic repulsion between surfactants also facilitates the formation of micelles in cement pore solution [33,35]. Lunagariya et al. [36] explored the effect of different active ions, including Cl, Br and I, on copolymers and observed small changes of approximately 3–5 mN/m at CMC.
Since the copolymers being examined in this study are nonionic, the extent of reduction in surface tension in response to the ionic environment would typically be less, compared to ionic surfactants. In nonionic surfactants, the charge shielding interaction observed in ionic surfactants does not exist, and therefore, they are not as sensitive to the ionic content of the pore solution. Despite this, it was shown that some nonionic surfactants still exhibit a small reduction in surface tension and CMC in the presence of ions [33]. Some researchers attributed this to the dehydration of PEG blocks, which can make the copolymer molecules more hydrophobic and therefore lower surface tension [35]. Interestingly, it appears that lower concentrations of copolymers are influenced by the FPS to a slightly greater extent than higher concentrations. Previous studies have also indicated that in higher concentrations, the surface tension of copolymers is slightly less affected [33]. This phenomenon is attributed to the formation of micelles, which are less susceptible to interference from ions [35,36].

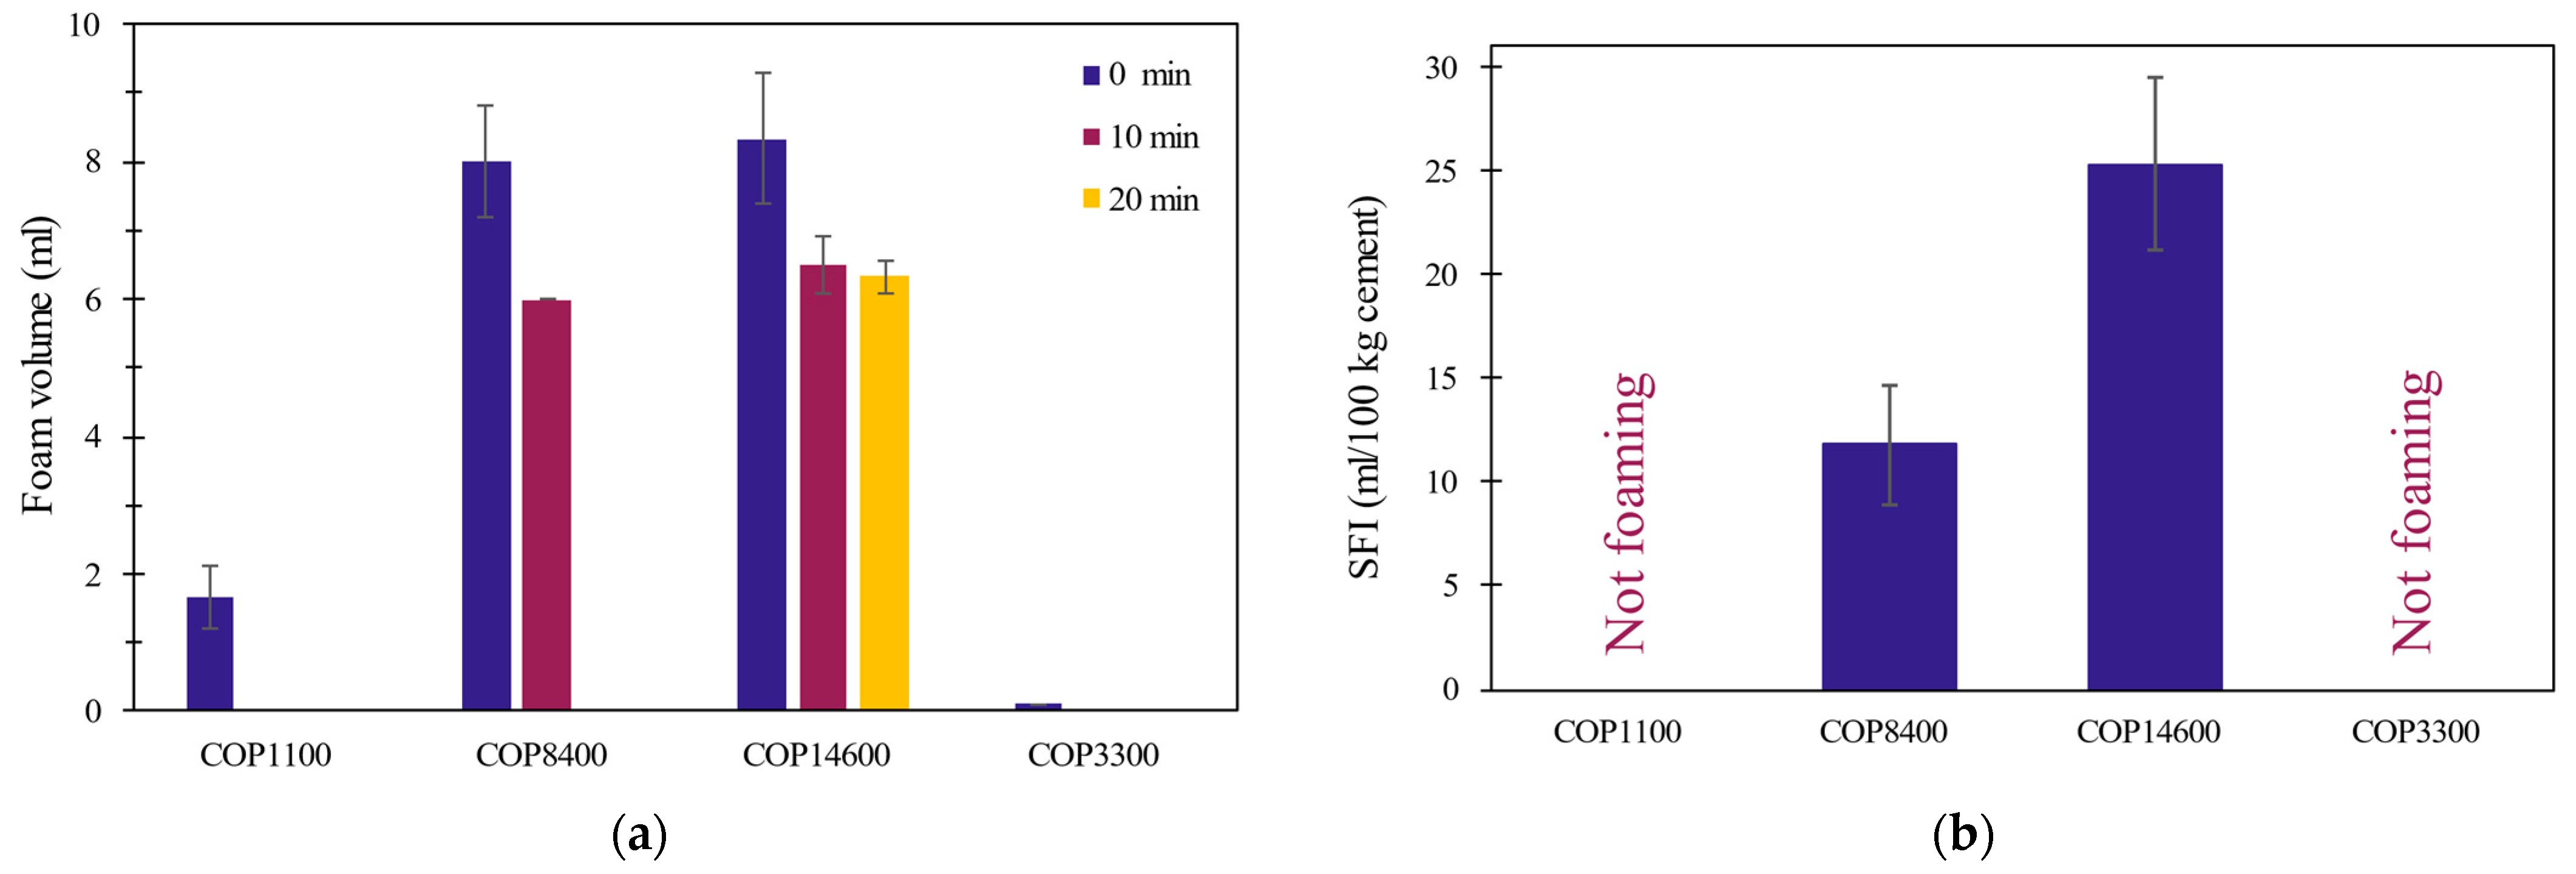
3.2. Foaming Properties in Cement Environment

Figure 6a,b depicts the foaming characteristics of the copolymers studied in cement pore solution. As shown in Figure 6a, hydrophobic copolymers (low HLB) COP1100 and COP3300 exhibited minimal to no initial foam formation (0 min). Even in the case of COP1100, which produced a small amount of foam, its stability was very low, and the bubbles disappeared almost immediately. In contrast, hydrophilic copolymers (high HLB) COP8400 and COP14600 generated a significantly larger volume of foam compared to the hydrophobic ones. Although the initial foam volumes at 0 and 10 min were the same for COP8400 and COP14600, COP8400 lacked long-term bubble stability, with nearly all the foam disappearing after 20 min. On the other hand, COP14600 maintained a large volume of its foam after 20 min. This stability is crucial in cementitious systems since air bubbles in the paste need to preserve their stability until the paste hardens, at which point the bubbles transform into voids. The foam volume reported here is for a 0.25% w/w copolymer concentration in cement, and it is possible to increase the foam volume further by increasing the concentration, as for instance, COP14600 reaches its maximum foam volume at 1% concentration [37].
PEG-PPG triblock copolymers are typically regarded as low-foaming agents, and since all the copolymers of this study possess good solubility in water, solubility does not seem to be a factor affecting their foaming properties. However, despite the fact that the hydrophobic PPG blocks significantly reduce surface tension across all copolymers in Figure 5 (in both low and high HLB copolymers), it is evident that COP1100 and COP3300 were unable to retain bubble stability. This can be attributed to their lower PEG/PPG content since, in general, the foaming ability of the copolymers improves as the PEG content increases [38]. However, this relationship holds only to a certain point. Beyond a certain threshold, a higher PEG content has a negative impact on foaming, and the highest volume of foam is typically observed in copolymers with a PEG/PPG range of 40–80% [11]. This PEG/PPG range is associated with a wide range of HLB, from 12 to upwards of 24, pointing out that hydrophobicity alone does not solely determine foaming ability [11]. Conversely, copolymers with a PEG/PPG content lower than 20% are considered antifoaming agents in the industry [38]. Therefore, as shown in Table 1, COP8400 and COP14600, with a PEG/PPG content of approximately 80%, exhibit significantly higher foaming than COP1100 and COP3300, with a PEG/PPG content lower than 10%. In a study conducted by Pisal et al. [37], a relationship between PEG block content and the foaming ability of copolymers F-68, F-87, and F-108 in DI was observed. Moreover, among copolymers with similar PEG content, those with a higher hydrophobic PPG content and larger molecular weight generally exhibit better foaming properties [37]. In the case of COP8400 and COP14600, even though their HLB and PEG/PPG values are quite similar, the larger molecular weight of COP14600 appears (14,600 versus 8400 Da) to have greatly improved its foaming stability.
Figure 6b presents the SFI property for different copolymers, where a lower SFI value is preferred as it indicates a higher efficiency of the AEA in generating a large volume of stable foam in the presence of cement. Originally proposed for pozzolanic blends by Dodson [39], the SFI method has become a general means of evaluating the effectiveness of AEAs in cementitious systems. Standard methods for measuring SFI, such as the one developed by Harris et al. [18], are now available. In conventional AEAs, including alpha olefin sulfonate, vinsol resin, and resin/rosin, used in cement-fly ash systems with very low carbon content, SFI typically falls in the range of 50 to 150 mL/100 kg [40].
Both hydrophobic copolymers, COP1100 and COP3300, although different in terms of their polymeric block arrangement, exhibited similar SFI values that did not satisfy the test criteria, even at very high copolymer concentrations. Consequently, the SFI value for these copolymers could not be calculated and was not included in Figure 6b. In contrast, the hydrophilic copolymers showed favorable results, with SFIs of 11.83 and 25.32 for COP8400 and COP14600, respectively. While it is not entirely clear why COP8400 has a lower SFI than COP14600, despite similar foaming behavior in FPS, this difference may partially be attributed to the higher number of PEG and PPG monomers in COP14600 that result in a more stable bubble interface. Comparing the foaming results of copolymers COP8400 and COP14600 in Figure 6a,b, with the air-entrained porosity of CEM-COP8400 and CEM-COP14600 presented in Section 3.4.1, can give some information about the relation between foaming and porosity in hardened cement paste. While SFI might present some indication about the efficiency of copolymers in producing small amounts of stable foam, it is not enough to predict the air-entrained porosity in cement paste.

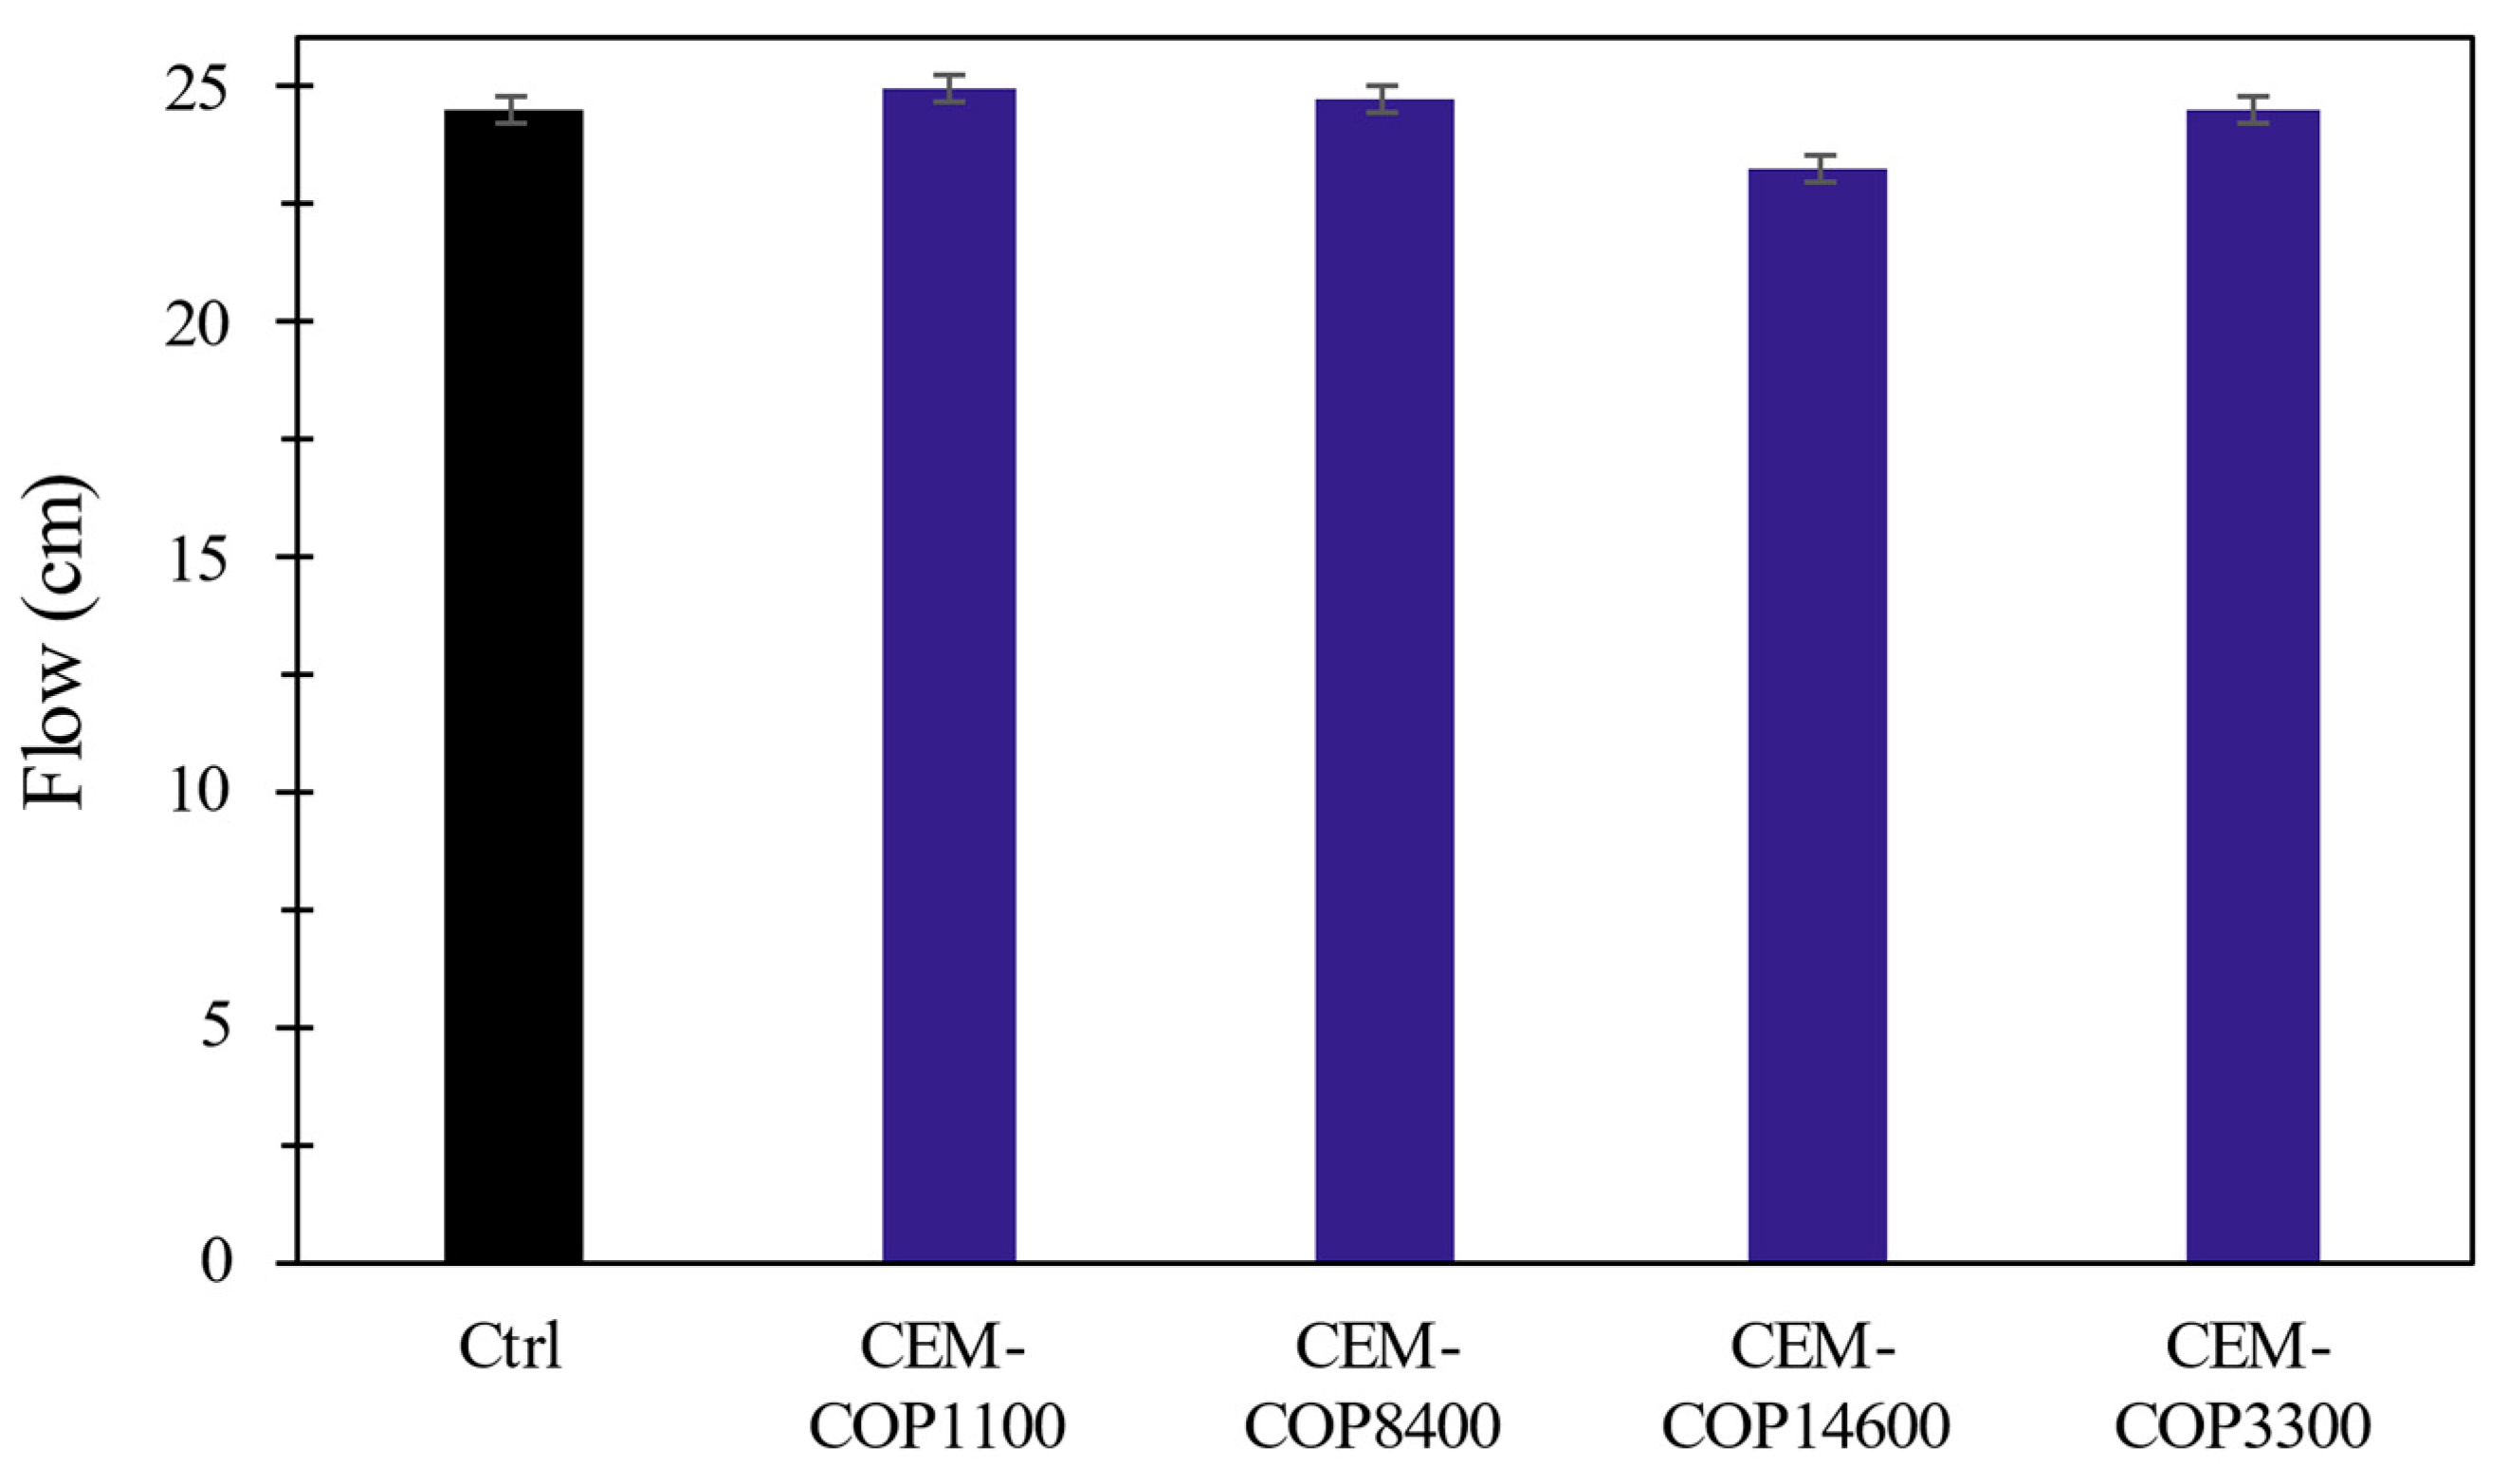
3.3. Effect of PEG-PPG Triblock Copolymers on Cement Fresh Paste Properties

3.3.1. Adsorption on Cement Particles

It is important to look at the adsorption mechanisms of copolymers on cement particles, as adsorption can affect air void microstructure directly through Pickering stabilization, or indirectly through the change in flow [31]. The adsorption of the copolymers in this study on cement particles during the early stages has been quantified through TOC measurements, as presented in Figure 7. The quantity of PEG-PPG copolymers adsorbed on any solid substrate depends on various factors, including the type, concentration, and hydrophobicity/hydrophilicity of the copolymer, as well as the characteristics of the solid interface [11,41]. Adsorption isotherms are also influenced by experimental conditions, including the duration of contact between the chemicals and cement before solution extraction. Therefore, it is important to consider these conditions when comparing the results. However, in general, nonionic surfactants (including the copolymers used in this study) tend to exhibit low adsorption on cement surfaces compared to ionic surfactants or polymers [33,42,43,44]. For instance, lignosulphonate-, naphthalene-, and melamine-based ionic superplasticizers, which primarily act through adsorption on cement and providing electrostatic repulsion, typically display high adsorption levels [45]. Merlin et al. [46] conducted a study examining the adsorption of nonionic TX100 and TX405 on various surfaces within cement paste, including C3S, C–S–H, Ca(OH)2, and ettringite, and observed insignificant adsorption. Since the interactions that govern adsorption can be categorized into ionic and dispersion interactions [41], this low adsorption of nonionic surfactants can be attributed to two possible reasons.
The first reason nonionic copolymers exhibit low adsorption on cement is due to the ionic mechanism of adsorption of surfactants. Ionic surfactants adsorb on positively and negatively charged surfaces of hydrating cement particles, through electrostatic interactions [42]. This adsorption occurs within the Stern or diffuse double layers formed on the particle surface [33,42,47]. Therefore, the absence of charge in copolymers results in no electrostatic interactions with the cement surface. The second reason for low adsorption is the hydrophilic nature of cement particles. In the absence of ionic charge, nonionic surfactants rely on hydrophobic attractive forces to adsorb on hydrophobic surfaces. These hydrophobic attractive forces are driven by hydrophobic blocks (PPGs in copolymers) that position themselves near the solid surface to minimize the hydrophobic repulsion with water, while the hydrophilic blocks (PEGs in copolymers) extend outward into the aqueous solution [11]. However, because the surface of cement is quite hydrophilic, the magnitude of these hydrophobic attractive forces is very low. Consequently, nonionic copolymers experience limited overall adsorption on cement. A study on the adsorption of hydrophobic nonionic surfactants on surfaces with varying degrees of hydrophobicity showed that the lowest adsorption happens on the most hydrophilic solid surface [41]. This further supports the notion that the hydrophilic nature of cement particles is a key factor in the low adsorption of nonionic copolymers on cement surfaces.
Despite the weak hydrophobic attractive forces and low overall adsorption, the effect of copolymer hydrophobicity on adsorption is evident. The specific adsorption of copolymers on cement in Figure 7 exhibits a relationship with their overall hydrophobicity, reported as HLB index in Table 1. The highest adsorption is observed for COP1100 and COP3300, which have a low HLB of 1–5. In contrast, the copolymers COP8400 and COP14600 with higher HLB values, possess lower hydrophobicity and consequently lower adsorption among the copolymers. Other factors including the molecular weight of copolymers can also influence the adsorption, as has been seen for other polymers [44,48].
The influence of different hydrophobic groups and their rigidity on the adsorption of polymers, including polycarboxylate, has been studied previously, revealing that hydrophobic groups generally enhance adsorption on cement particles [49,50]. Likewise, greater surfactant hydrophilicity resulting from a higher number of ethylene oxide groups in the structure typically leads to lower adsorption [41]. Some degree of micellization, especially near the solid cement interface is also expected. In the absence of an accessible hydrophobic solid interface for copolymer molecules to escape to, hydrophobic blocks of the copolymer can micellize near the hydrophilic surface [51].

3.3.2. Effect on the Dispersion of Cement Paste

The flow of cement paste is influential on the stability of air bubbles in the fresh paste. If the flow is too low, not enough air can be entrained during mixing, whereas a paste with very high flow does not have enough inhibition against the buoyancy forces of air bubbles that want to escape the paste [31]. Therefore, to understand the air-entrained microstructure of cement affected by copolymers, it is useful to study their effect on the flow of the paste. The flow test results of fresh cement paste, both the Ctrl and with 0.25% concentration of copolymer, are presented in Figure 8. Copolymers showed a minimal effect on the flow compared to the Ctrl sample, and even CEM-COP14600, which displayed the largest difference, deviates by no more than 5% from the 24.5 cm flow of the Ctrl paste. This observation is not surprising because, in addition to their low adsorption, nonionic copolymers lack the requisite electrostatic charge that is an integral component of the repulsion mechanism of superplasticizers. Even when comparing structurally similar neutral hydrophobic and ionic polymers, it is typically the ionic polymers that show higher adsorption and enhanced flowability [49]. Moreover, the type and conformation of hydrophobic side chains can significantly impact the dispersing capabilities of polymers. In a study by Shu et al. [49], variations in polycarboxylate superplasticizers with different hydrophobic groups but similar chain rigidity demonstrated differences as high as 25% in flowability.
In superplasticizers, a certain amount of polymer adsorption on the cement substrate is required for the plasticizing effect to take place [52]. However, beyond this initial adsorption, the relationship between adsorption amount and flowability is not always linear. Factors including electrostatic and steric repulsive forces, as well as the thickness of the adsorption layer, can also play a critical role [50,52]. In this study, copolymers exhibit minimal adsorption on cement particles and as a result, their influence on the flow is very small.

3.4. Effect of PEG-PPG Triblock Copolymers on Hardened Cement Paste Properties

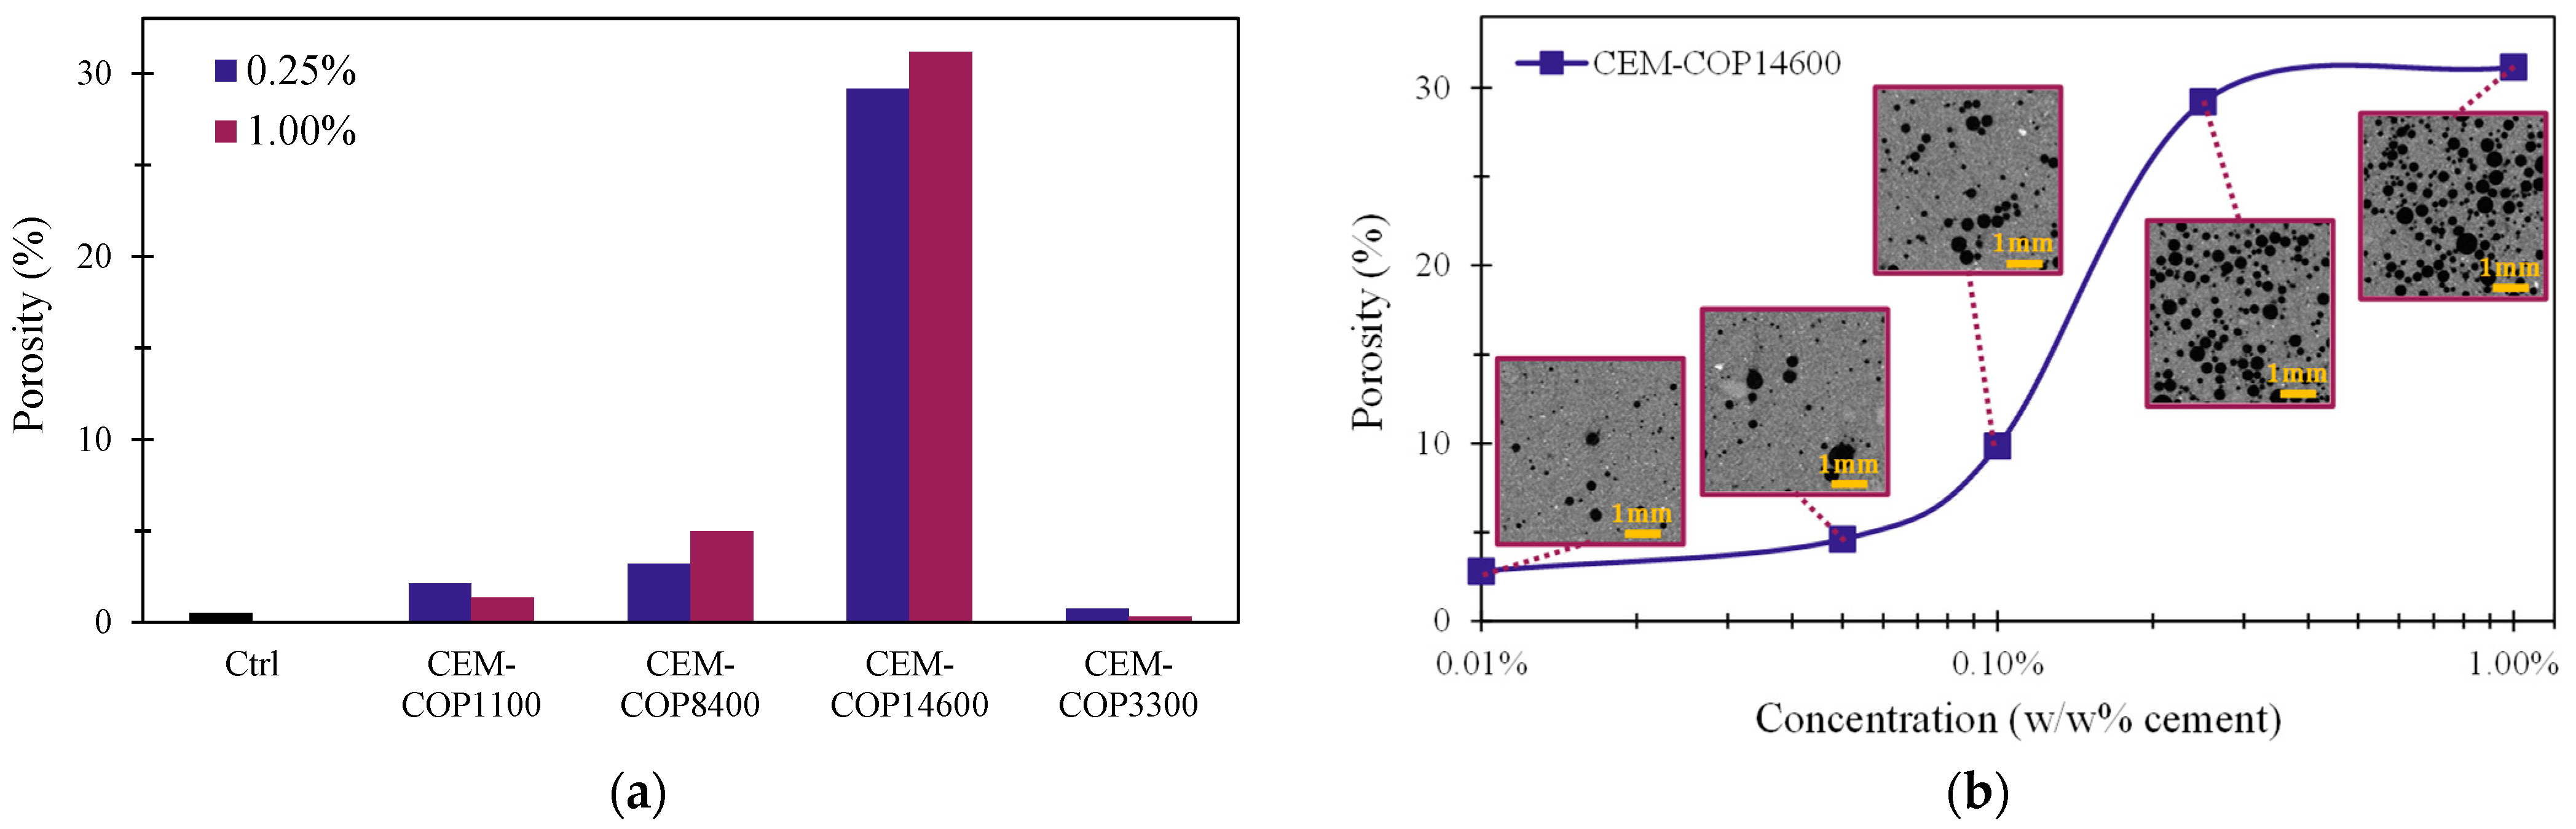
3.4.1. Void Structure

To investigate the impact of the copolymer addition on the microstructure of cement paste, micro-CT tests were performed to characterize the macro-scale air-entrained voids. Various classifications exist in the literature for categorizing voids and pores based on their size. For instance, some classify voids smaller than 5 nm as gel pores, those in the range of 5 nm to 8 μm as capillary pores, and those larger than 8 μm as air voids [53]. In this study, a common classification scheme was adopted: under 10 nm for gel and interparticle C-S-H, 10 nm to 1 μm for capillary pores, 10 μm to 1 mm for air-entrained voids, and larger than 1 mm for entrapped voids. This classification is similar to the categories outlined by Mehta and Monteiro [54].
Micro-CT scans were performed to investigate the impact of copolymer type and concentration on the air-entrained void structure of cement paste in the range of 10–1000 μm. The results, including porosity, separation, and volume-averaged diameter, are summarized in Table 3. It is important to note that separation, although conceptually similar to the spacing factor, is determined through a different calculation method. The spacing factor is a parameter commonly used in the analysis of air void systems in concrete and cementitious materials [55]. While the spacing factor relies on a theoretical formula, separation quantifies the average distance between the outer surfaces of the voids and is directly derived from the three-dimensional reconstructed structure of the pastes obtained from the micro-CT scans [56]. The distribution of the voids in the Ctrl and cement paste with the copolymers is depicted in cross-sectional images in Figure 9. As Table 3 shows, the more porous samples usually have smaller void sizes and lower separation which is crucial for hydraulic pressure mitigation in freeze-thaw [8].
Figure 10a,b displays the effect of copolymer type and concentration on the porosity of cement paste. As shown in Figure 10a, the concentrations of 0.25% and 1% have minimal effects on porosity, with no significant alteration observed in most samples, except for CEM-COP14600. Even at a relatively high concentration of 1%, there is no noticeable air entrainment in CEM-COP1100 and CEM-COP3300. However, CEM-COP14600 displays a very high amount of entrained air. Figure 10b illustrates the porosity–concentration relationship for CEM-COP14600, revealing that concentrations below 0.1% are sufficient for practical applications in concrete, providing an air volume of 5–7%, while the average void size remains relatively similar to higher concentrations (refer to Table 3).

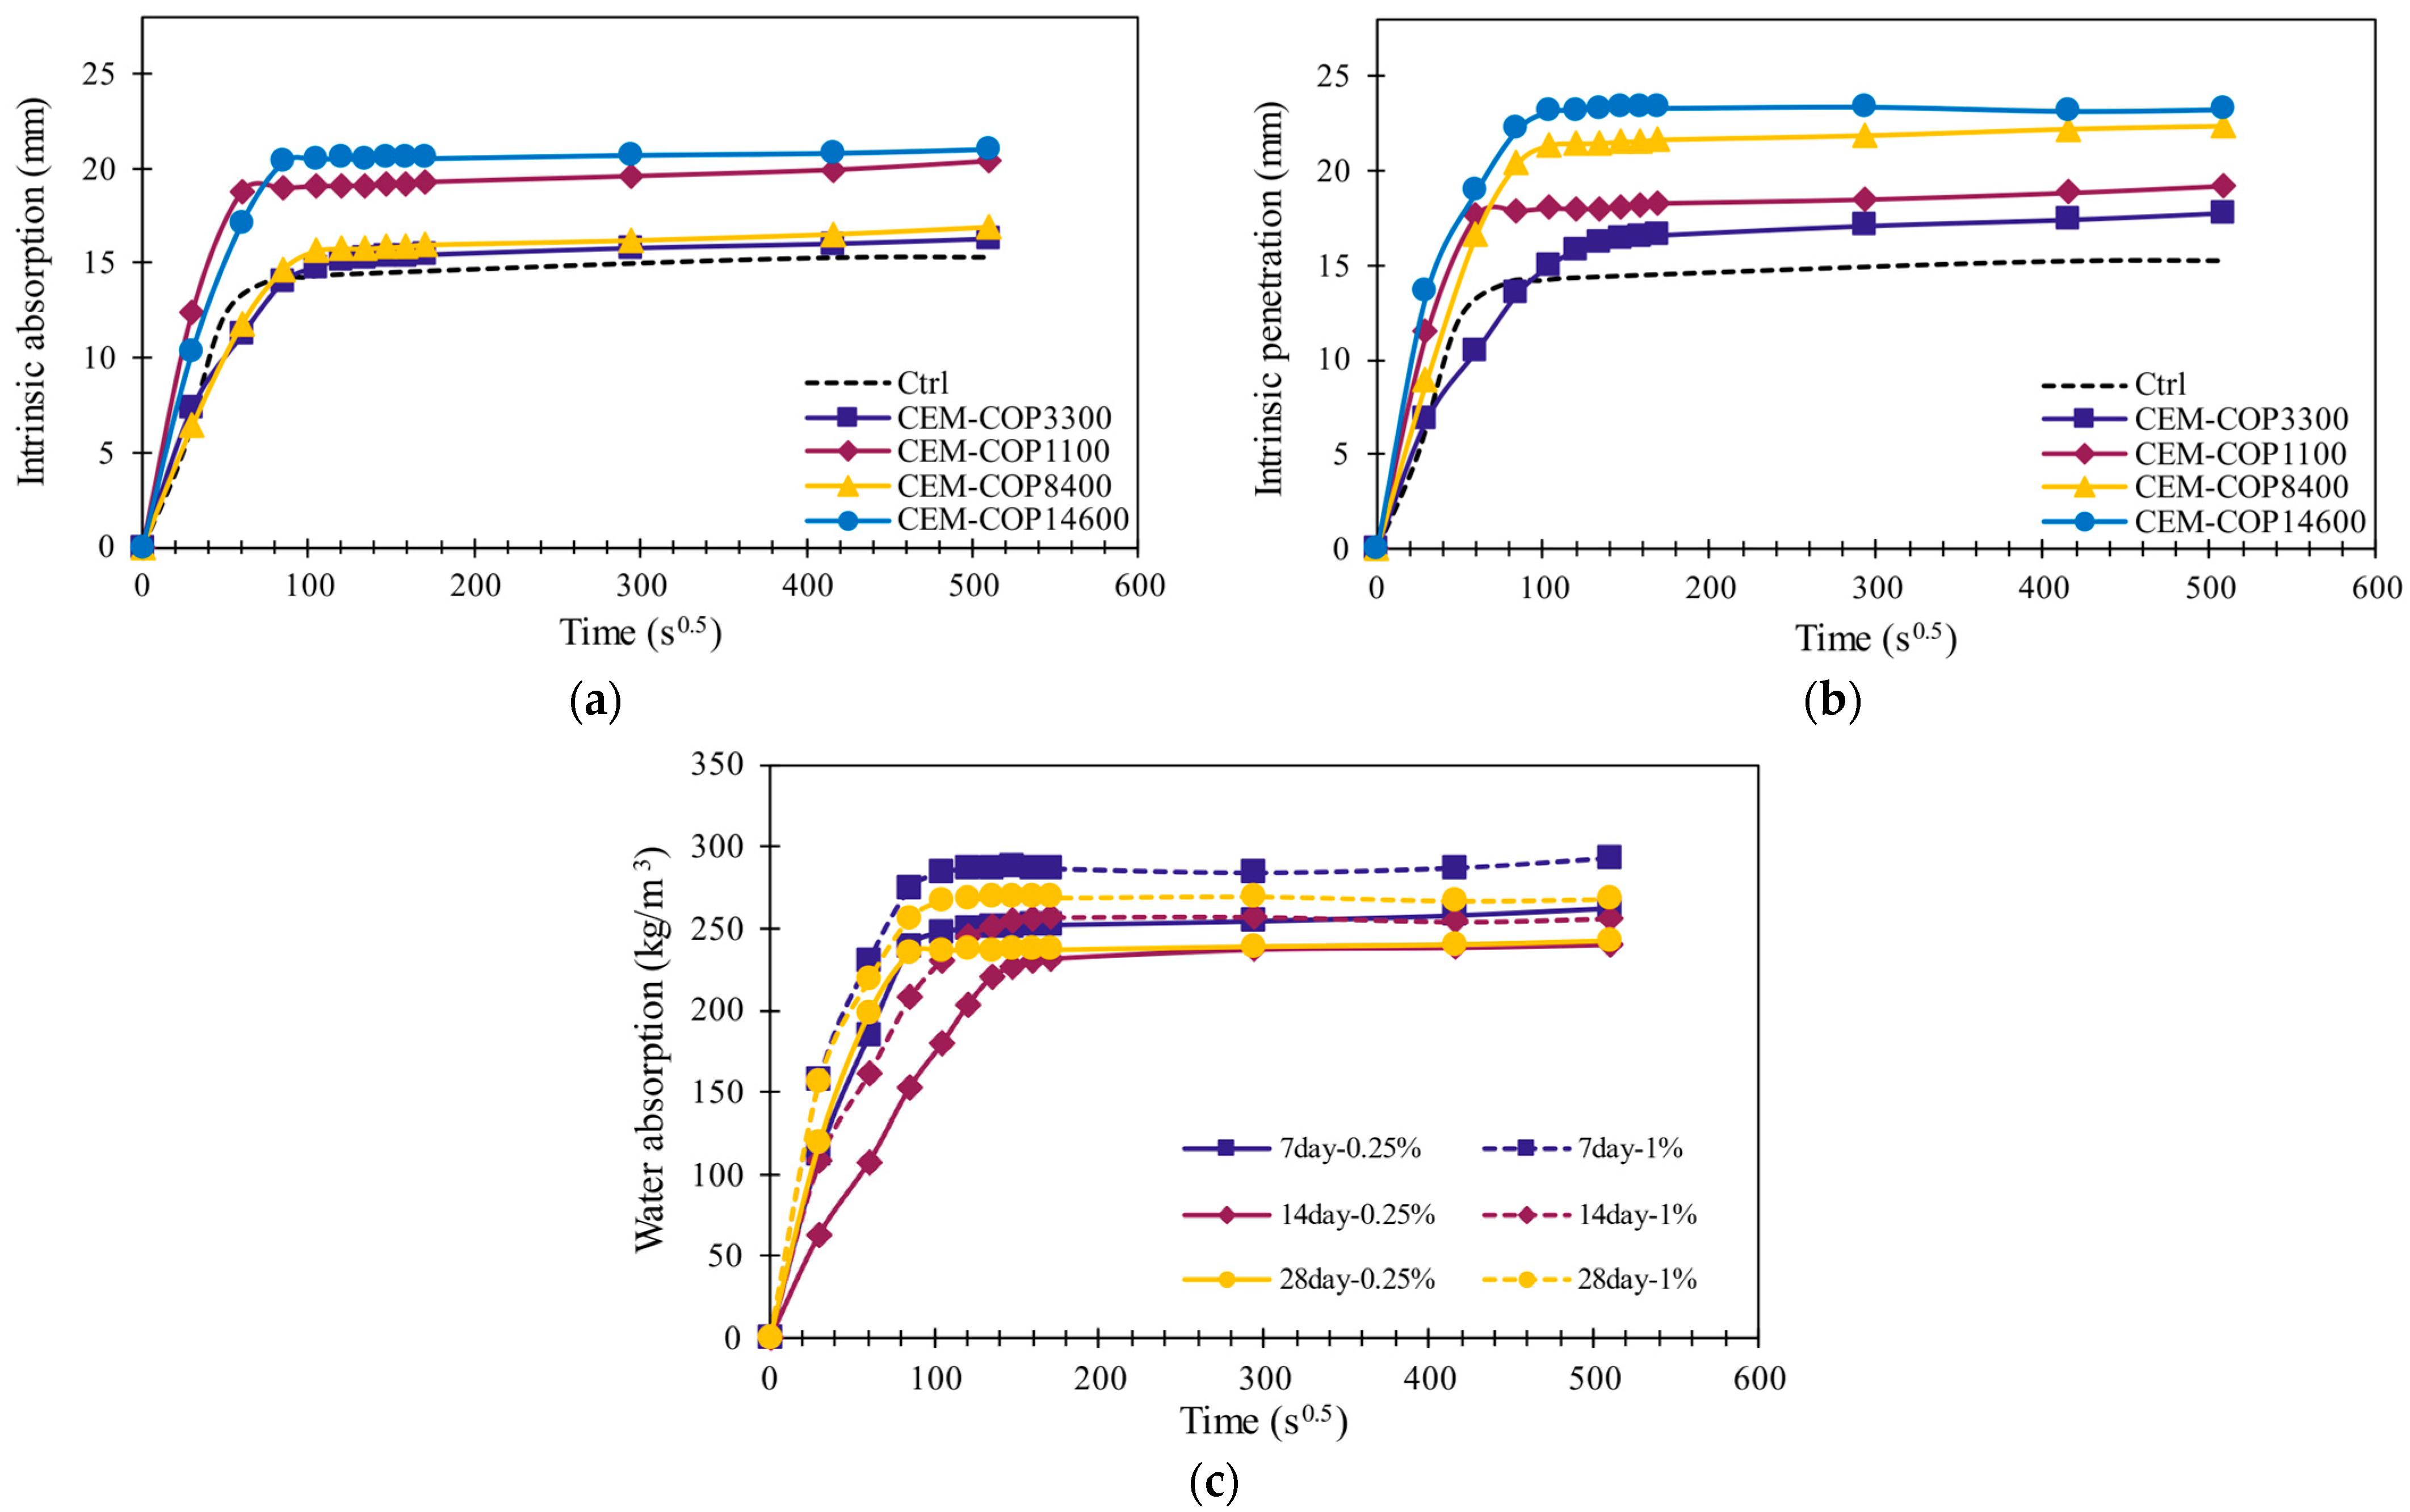
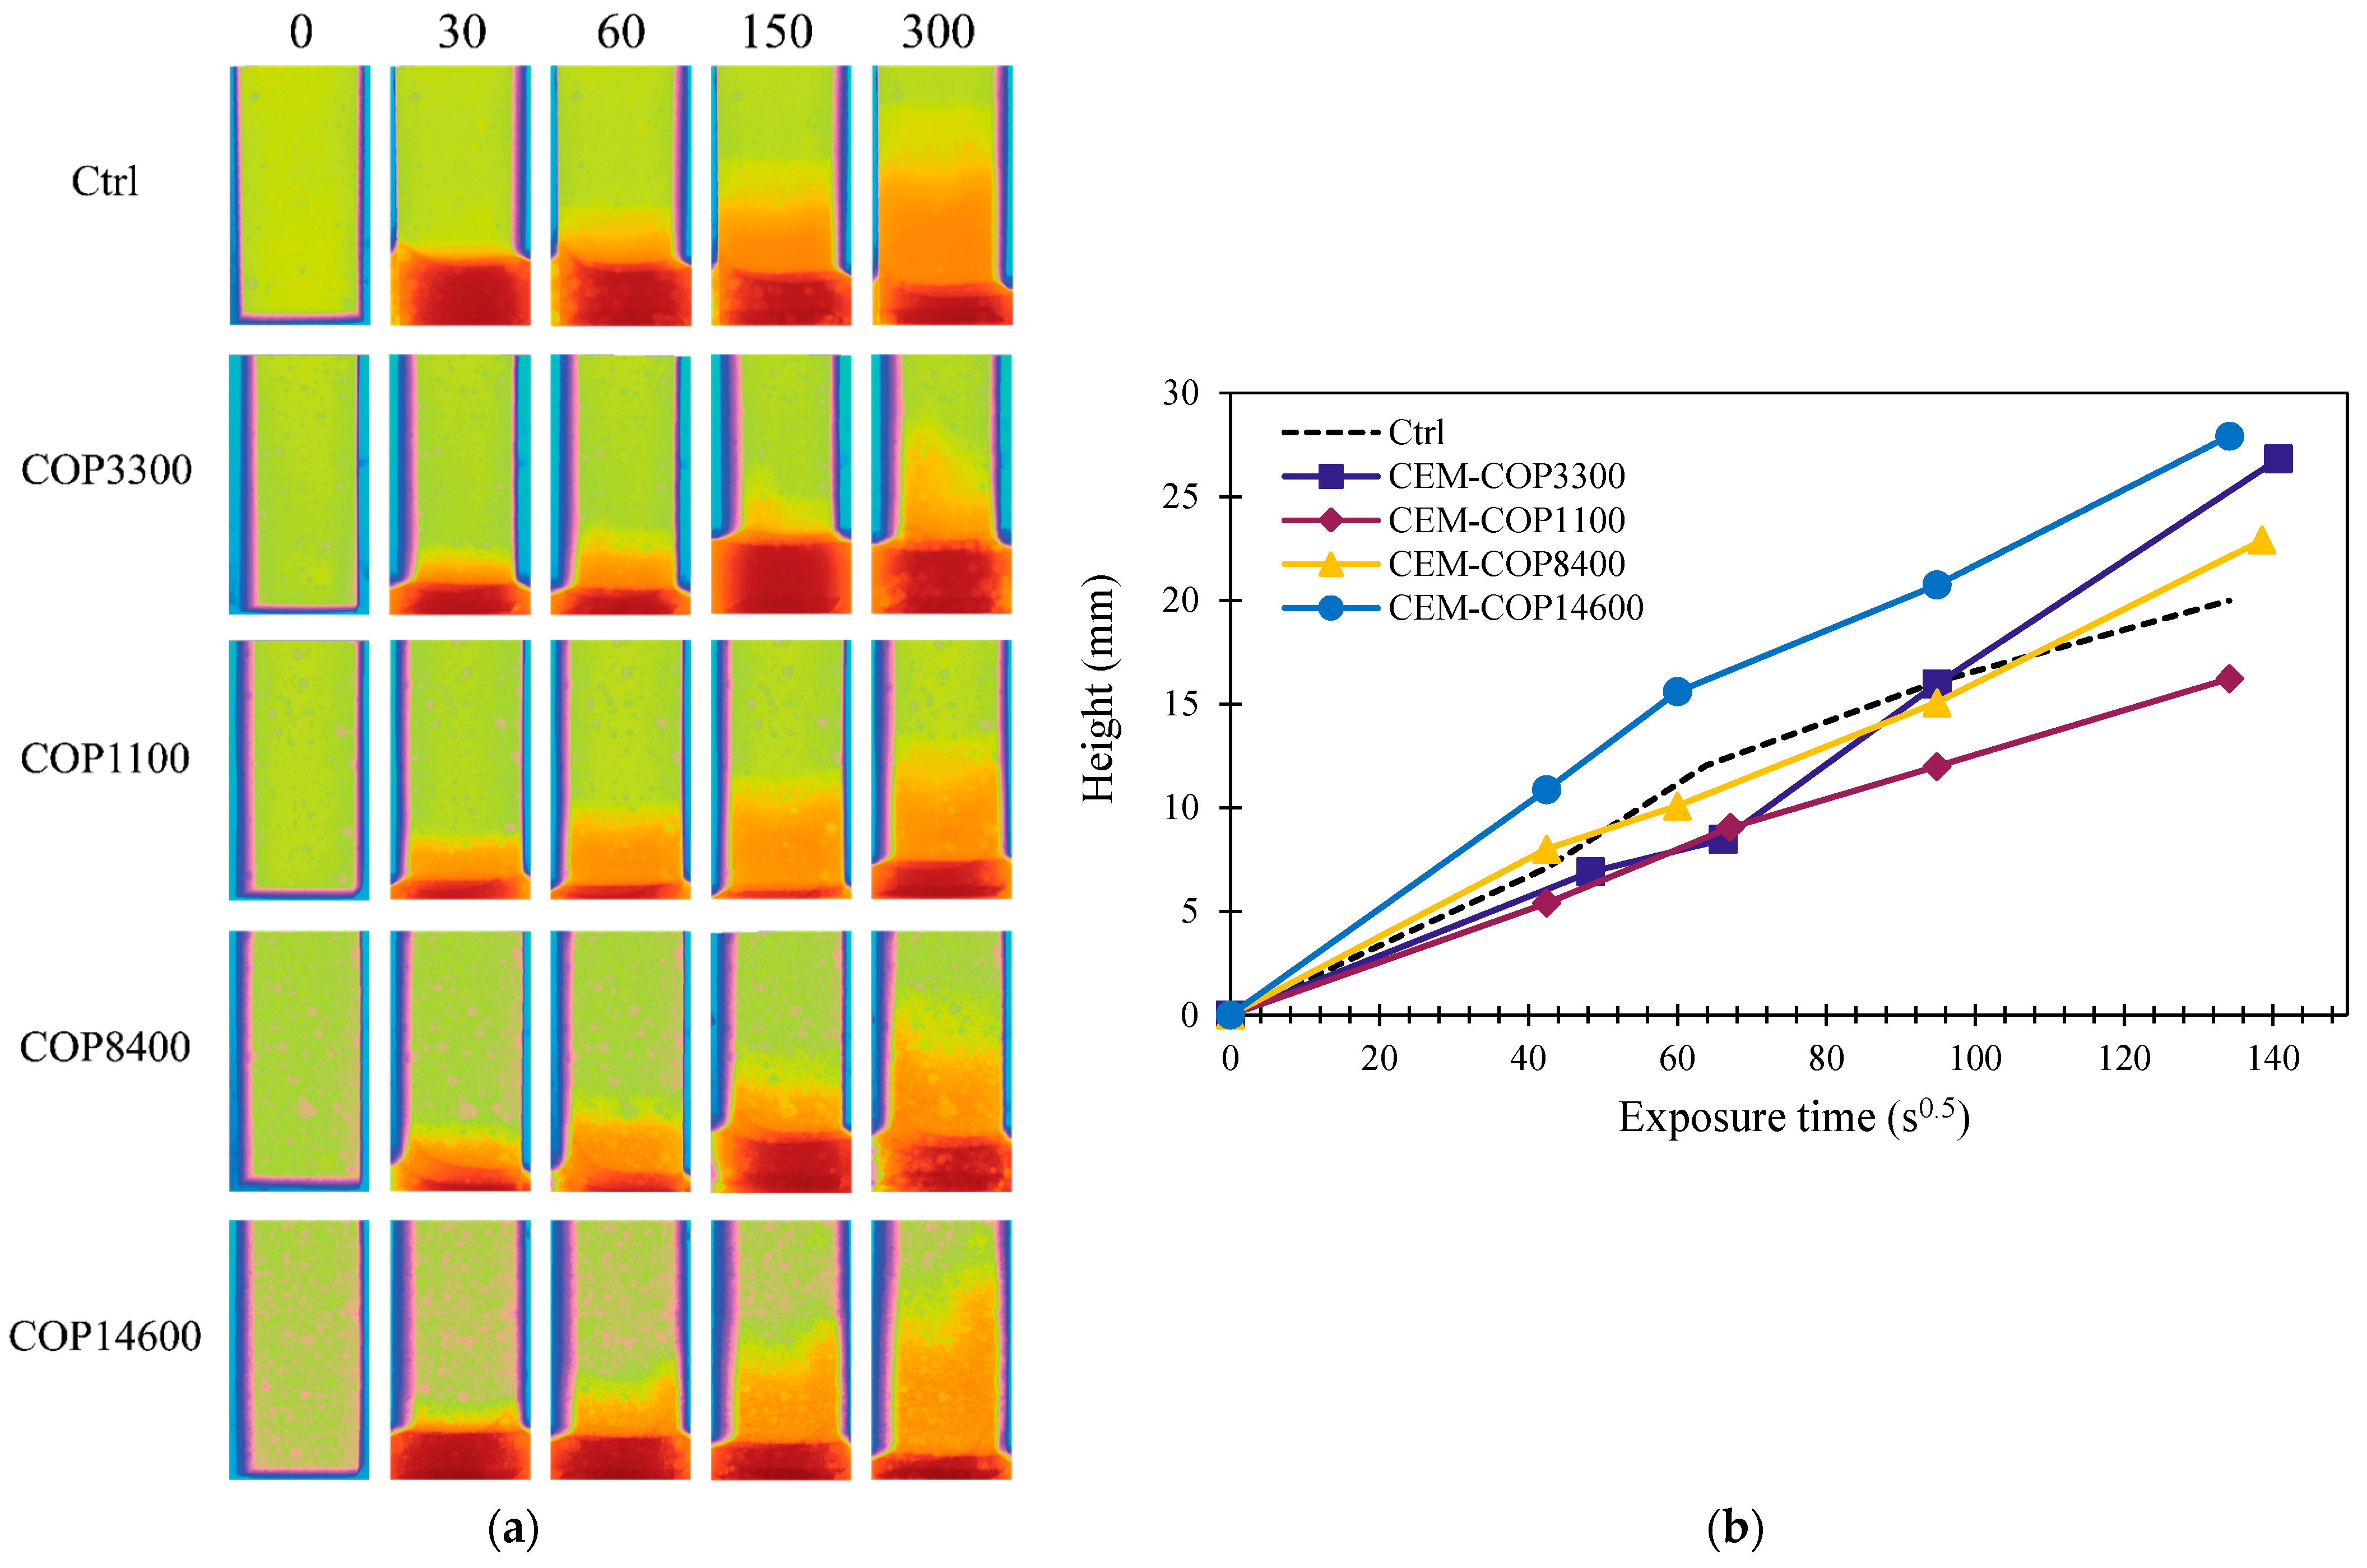
3.4.2. Water Sorption

Gravimetry

Figure 11a,b illustrates the water sorption behavior of the 28-day samples with varying copolymer types and concentrations. It is seen in Figure 11a,b that all samples exhibited increased water sorption compared to the Ctrl. As seen in Figure 11c, samples with longer curing age showed an inverse relationship with sorption, with 14-day and 28-day samples displaying slightly lower sorption compared to the 7-day samples. The reduction in water sorption with curing age is attributed to increased densification and reduced capillary porosity of the microstructure with age [57].
The mechanisms of water sorption differ significantly between the two types of voids. Capillary suction primarily affects capillary pores, while air dissolution and diffusion affect air voids [58]. Air-entrained voids have a sorption rate that is orders of magnitude lower than that of capillary pores [58]. The prevailing consensus is that macro air voids have limited effects on the short-term water sorption of concrete since it is primarily governed by the capillary pore structure. However, over the long term, water sorption tends to increase with higher macro air content [59,60]. The significant impact of air-entrained voids lies in their ability to reduce the degree of saturation and extend the time it takes for concrete to reach the critical degree of saturation, at which freeze-thaw cycles can significantly damage concrete structure [59]. Nevertheless, depending on the conditions of concrete, a slight increase in sorption with higher porosity is sometimes observed [61,62].
The water sorption behavior of cement samples containing copolymers aligns with the mechanism previously discussed. As shown in Figure 11a,b, cement pastes with copolymers exhibit higher water sorption compared to the Ctrl paste after a short initial period, both at 0.25% and 1% concentrations. The difference in water sorption in 1% concentration seems to be slightly larger than that in the case of the 0.25% concentration. CEM-COP14600 displays the highest sorption in both concentrations.
To obtain an estimate of the capillary porosity in the samples, approximate values of the volume fraction of capillary pores to the total volume of samples were calculated. This calculation is based on the dry density of the paste, assuming a density of 2.2 g/cm3 for the cement matrix and subtracting the large air void porosity calculated from micro-CT (refer to Table 3). These values are presented in Table 4 for both concentrations. In general, most samples exhibit higher porosity compared to Ctrl, except for CEM-COP14600. Due to the very high amount of large air voids that occupy large volumes of the sample, CEM-COP14600 has a lower fraction of capillary pores relative to the total volume. Since air voids are not expected to contribute to water sorption in the early stages, the effective sorption area of the samples in Equation (4) is smaller in CEM-COP14600 leading to a higher height of water in this sample. There is an insignificant change in the estimated capillary porosity observed between different concentrations of 0.25% and 1% of the same copolymers.
It is also interesting to examine the ability of different copolymers to modify the hydrophobicity of cement paste. Cement paste has a very hydrophilic matrix due to its many capillary pores and the affinity of its hydration products to bind with water [63]. Figure 12 shows the change in contact angle of samples with 0.25% concentration of copolymers, where copolymers are reducing the contact angle of cement paste by 9–17%. From this reduction in contact angle, it can be concluded that copolymers are lowering the hydrophobicity of cement paste and making it even more hydrophilic. It has been shown that by increasing the PEG content in poly(dimethylsiloxane), the hydrophilicity of the bonded molecule increases, and they absorb more water [64]. Therefore, it can be postulated that the hydrophilic PEG blocks of the copolymer in the matrix increase the hydrophilicity of the paste.
Although this change is small, it can be a contributing factor in the higher water sorption of copolymers compared to the Ctrl in Figure 11. It is well understood that by increasing the hydrophobicity of cement paste, water sorption generally declines [65,66]. Here, the decrease in the hydrophobicity of copolymers can contribute to the higher sorption in cement samples. Interestingly, the HLB value of the copolymers themselves appears to have a weak correlation with the water sorption in Figure 11a,b. Cement samples containing copolymers with higher HLBs—COP14600 and COP8400—have generally higher sorption than copolymers with lower HLBs, COP1100 and COP3300. Similarly, in Figure 11c, 1% concentration showed higher water sorption compared to 0.25% concentration, which can be attributed in part to the higher hydrophilicity of 1% samples that contain more PEG groups.

Micro-CT

Figure 13 presents the outcome of water sorption experiments conducted with micro-CT on cement samples with a height of two inches. In Figure 13a, profiles of cement samples containing various copolymers are shown at different exposure times, including 0 min (initial), 30 min, 60 min, 150 min, and 300 min. The dark red regions represent the level of CsCO3 solution in the cylinder tube, while the bright orange regions indicate the sorption of CsCO3 solution into the sample. The highest intensity is observed at the bottom where the cement sample is in contact with the solution and has absorbed the largest amount of solution. This intensity gradually decreases along the height of the sample, indicating a lower amount of absorbed solution at the top. Instead of qualitatively determining the highest point of water sorption in the sample, a procedure based on the greyscale average values was implemented, as described in detail in the methodology section. The result of this analysis is presented in Figure 13b. The highest sorption was observed for CEM-COP14600 and other samples, including Ctrl, that have lower sorption in comparison, which is consistent with the gravimetric water sorption results in Figure 11a.

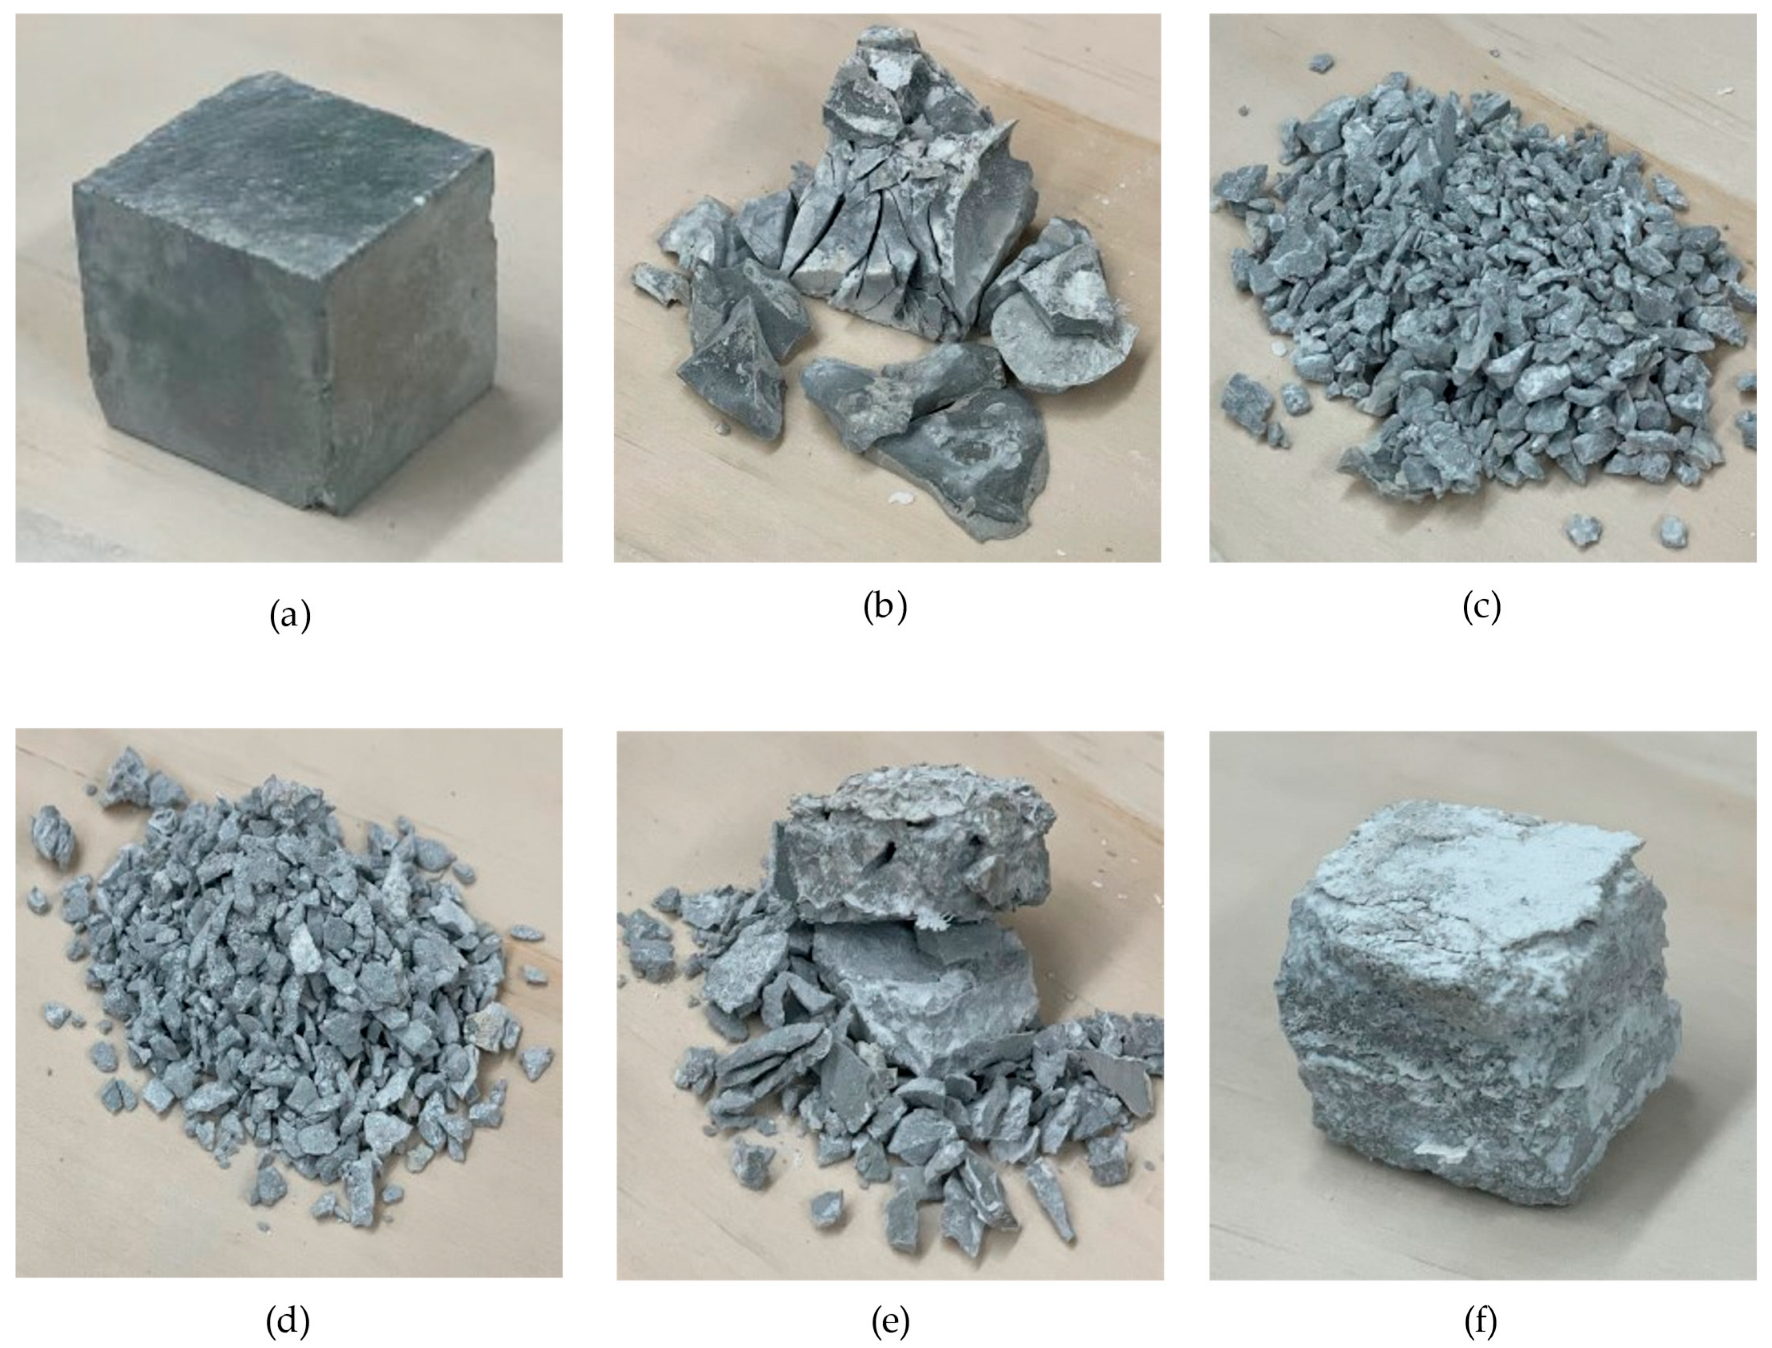
3.4.3. Freeze-Thaw Damage

To evaluate the impact of these copolymers on the freeze-thaw resistance of cement paste, an accelerated freeze-thaw experiment was conducted. Figure 14 shows the effect of 50 freeze-thaw cycles on 1-inch cubes of Ctrl and pastes with different copolymers. Figure 14a,b compares the Ctrl sample before and after the freeze-thaw treatment. As shown in Figure 14b, the Ctrl sample exhibited extensive cracking and spalling after 50 cycles, indicating significant damage. This damage is also severe in CEM-COP3300 and CEM-COP1100, where the freeze-thaw action caused the sample to break into small pieces. CEM-COP8400 displayed a slightly lower degree of damage than Ctrl. On the other hand, CEM-COP14600 remained mostly intact compared to the other samples, with damage limited to only surface delamination.
When comparing the freeze-thaw damage in Figure 14 to the water sorption in Figure 11, it is evident that there is not a direct correlation between water sorption and the damage in freeze-thaw action. On the other hand, there is a direct correlation between freeze-thaw damage and the amount of air-entrained porosity reported in Table 3 and Figure 10a. Ctrl, CEM-COP1100, and CEM-COP3300 were not able to entrain enough small, well-dispersed voids to increase the resistance of cement paste samples for freeze-thaw action. However, CEM-COP8400, with a slightly higher volume of air voids, and CEM-COP14600, with a very high air void porosity, were more resistant to freeze-thaw damage. Another important factor is the separation distance between voids, where CEM-COP8400 and CEM-COP14600 possess much smaller values compared to the rest, and therefore, have improved performance in freeze-thaw. Both CEM-COP1100 and CEM-COP3300 have higher separation and average void diameters compared to even Ctrl, which can explain why they showed significantly higher degrees of freeze-thaw damage.
As discussed earlier, the way entrained air void volume, average distance, and size affect freeze-thaw is through modifying the degree of saturation of samples, and the rate of advance toward the critical degree of saturation, at which point, cementitious materials start to sustain significant damage in freeze-thaw [59,67,68]. Therefore, based on Table 3 and Figure 14, it can be concluded that CEM-COP1100 and CEM-COP3300 reach the critical degree of saturation very fast, even before the Ctrl sample, whereas CEM-COP8400 and CEM-COP14600 have higher saturation limit and take much longer to reach the critical degree of saturation. In the case of CEM-COP14600, it seems that the sample did not reach a critical degree of saturation during the 50 cycles of freeze-thaw. The important point is that due to their small size of 1 inch, these samples saturate in a shorter timescale. For larger concrete samples, this saturation will take significantly more cycles. The freeze-thaw results presented here provide qualitative insights into the freeze-thaw damage of the samples modified with different copolymers. Further studies are needed to examine the quantitative damage characteristics.

4. Conclusions

In this study, the air-entraining effect of four PEG-PPG triblock copolymers with different molecular structures in cement paste was studied. The following conclusions are drawn:
  • The surface activity and foaming measurements showed that although all copolymers are capable of significantly reducing surface tension, only some of the copolymers (namely F-68 LF and F-108) produce stable foam. Interestingly, the copolymer with the lowest surface tension did not exhibit any foaming ability.
  • Copolymers adsorb minimally to the cement particles, and as such, did not affect cement particle dispersion due to a lack of electrostatic repulsion.
  • Certain copolymers including COP14600 can produce considerable amounts of air voids in the samples. The results showed that both foaming and air void volume showed a direct relationship with the HLB of the copolymers rather than their surface tension. Thus, HLB could be used as an indicator of the air-entraining performance of these copolymers in cement paste.
  • The samples modified with the copolymers showed an increase in water sorption compared to the control sample. This is attributed to increased capillary porosity and increased surface hydrophilicity in the modified samples.
  • Almost all samples experienced slightly increased water sorption that was linked to the change in microstructure and a lower hydrophobicity of the matrix. The results for water sorption were compared to micro-CT and freeze-thaw results, and a good correlation was observed between air-entrained properties of the microstructure and freeze-thaw resistance.

Author Contributions

Conceptualization, M.S.T.M. and A.G.; methodology, M.S.T.M.; software, M.S.T.M.; validation, M.S.T.M. and A.G.; formal analysis, M.S.T.M.; investigation, M.S.T.M. and A.G.; resources, A.G.; data curation, M.S.T.M. and A.G.; writing—original draft preparation, M.S.T.M. and A.G.; writing—review and editing, M.S.T.M. and A.G.; visualization, M.S.T.M.; supervision, A.G.; project administration, A.G.; funding acquisition, A.G. All authors have read and agreed to the published version of the manuscript.

Funding

This study was performed at the Advanced Infrastructure Materials Research Laboratory at the University of Miami and was supported by the National Science Foundation under the CAREER award number 1846984 and the MRI award number 1920127. Any opinions, findings, and conclusions or recommendations expressed in this material are those of the authors and do not necessarily reflect the views of the National Science Foundation.

Data Availability Statement

Data are available upon request.

Acknowledgments

The authors would like to thank Knecht and Amin for facilitating access to their laboratories.

Conflicts of Interest

The authors declare no conflicts of interest.

References

  1. Adhikary, S.K.; Ashish, D.K. Turning waste expanded polystyrene into lightweight aggregate: Towards sustainable construction industry. Sci. Total Environ. 2022, 837, 155852. [Google Scholar] [CrossRef] [PubMed]
  2. Adhikary, S.K.; Ashish, D.K.; Rudžionis, Ž. Aerogel based thermal insulating cementitious composites: A review. Energy Build. 2021, 245, 111058. [Google Scholar] [CrossRef]
  3. Powers, T. A Working Hypothesis for Further Studies of Frost Resistance of Concrete, Concrete.Org. 1945. Available online: https://www.concrete.org/publications/internationalconcreteabstractsportal.aspx?m=details&i=8684&m=details&i=8684 (accessed on 7 December 2023).
  4. Powers, T.C.; Willis, T.F. The air requirement of frost resistant concrete. In Proceedings of the Twenty-Ninth Annual Meeting of the Highway Research Board, Washington, DC, USA, 13–16 December 1949; Volume 29. [Google Scholar]
  5. Powers, T.; Helmuth, R. Theory of volume changes in hardened portland-cement paste during freezing. In Proceedings of the Thirty-Second Annual Meeting of the Highway Research Board, Washington, DC, USA, 13–16 January 1953; Volume 32. [Google Scholar]
  6. Guo, J.; Sun, W.; Xu, Y.; Lin, W.; Jing, W. Damage Mechanism and Modeling of Concrete in Freeze–Thaw Cycles: A Review. Buildings 2022, 12, 1317. [Google Scholar] [CrossRef]
  7. Shah, H.A.; Yuan, Q.; Zuo, S. Air entrainment in fresh concrete and its effects on hardened concrete-a review. Constr. Build. Mater. 2020, 274, 121835. [Google Scholar] [CrossRef]
  8. Chatterji, S. Freezing of air-entrained cement-based materials and specific actions of air-entraining agents. Cem. Concr. Compos. 2003, 25, 759–765. [Google Scholar] [CrossRef]
  9. Masoule, M.S.T.; Baffoe, E.; Ghahremaninezhad, A. On the physicochemical properties and foaming characteristics of proteins in cement environment. Constr. Build. Mater. 2023, 366, 130204. [Google Scholar] [CrossRef]
  10. Pitto-Barry, A.; Barry, N.P.E. Pluronic® block-copolymers in medicine: From chemical and biological versatility to rationalisation and clinical advances. Polym. Chem. 2014, 5, 3291–3297. [Google Scholar] [CrossRef]
  11. Alexandridis, P.; Hatton, T.A. Poly(ethylene oxide)–poly(propylene oxide)–poly(ethylene oxide) block copolymer surfactants in aqueous solutions and at interfaces: Thermodynamics, structure, dynamics, and modeling. Colloids Surf. A Physicochem. Eng. Asp. 1995, 96, 1–46. [Google Scholar] [CrossRef]
  12. Kontogiannis, O.; Selianitis, D.; Perinelli, D.R.; Bonacucina, G.; Pippa, N.; Gazouli, M.; Pispas, S. Non-Ionic Surfactant Effects on Innate Pluronic 188 Behavior: Interactions, and Physicochemical and Biocompatibility Studies. Int. J. Mol. Sci. 2022, 23, 13814. [Google Scholar] [CrossRef]
  13. Devi, D.R.; Sandhya, P.; Hari, B.N.V. Poloxamer: A novel functional molecule for drug delivery and gene therapy. J. Pharm. Sci. Res. 2013, 5, 159. [Google Scholar]
  14. Kabanov, A.V.; Lemieux, P.; Vinogradov, S.; Alakhov, V. Pluronic® block copolymers: Novel functional molecules for gene therapy. Adv. Drug Deliv. Rev. 2002, 54, 223–233. [Google Scholar] [CrossRef] [PubMed]
  15. Unosson, J.; Montufar, E.B.; Engqvist, H.; Ginebra, M.; Persson, C. Brushite foams—the effect of Tween® 80 and Pluronic® F-127 on foam porosity and mechanical properties. J. Biomed. Mater. Res. Part B Appl. Biomater. 2015, 104, 67–77. [Google Scholar] [CrossRef] [PubMed]
  16. Tuncer, K.; Gür, B.; Şenol, O.; Aydın, M.R.; Gündoğdu, O. New bone cements with Pluronic®F127 for prophylaxis and treatment of periprosthetic joint infections. J. Mech. Behav. Biomed. Mater. 2021, 119, 104496. [Google Scholar] [CrossRef] [PubMed]
  17. Masoule, M.S.T.; Ghahremaninezhad, A. Effect of Poly(ethylene glycol)–Poly(propylene glycol) Triblock Copolymers on Autogenous Shrinkage and Properties of Cement Pastes. Buildings 2024, 14, 283. [Google Scholar] [CrossRef]
  18. Harris, N.J.; Hover, K.C.; Folliard, K.J.; Ley, M.T. The Use of the Foam Index Test to Predict Air-Entraining Admixture Dosage in Concrete Containing Fly Ash: Part II—Development of a Standard Test Method: Apparatus and Procedure. J. ASTM Int. 2008, 5, 1–15. [Google Scholar] [CrossRef]
  19. Corr, D.; Lebourgeois, J.; Monteiro, P.; Bastacky, S.; Gartner, E. Air void morphology in fresh cement pastes. Cem. Concr. Res. 2002, 32, 1025–1031. [Google Scholar] [CrossRef]
  20. Farnam, Y.; Washington, T.; Weiss, J. The Influence of Calcium Chloride Salt Solution on the Transport Properties of Cementitious Materials. Adv. Civ. Eng. 2015, 2015, 929864. [Google Scholar] [CrossRef]
  21. ASTM C1585; Standard Test Method for Measurement of Rate of Absorption of Water by Hydraulic-Cement Concretes. Available online: https://www.astm.org/c1585-20.html (accessed on 23 November 2023).
  22. Moradllo, M.K.; Hu, Q.; Ley, M.T. Using X-ray imaging to investigate in-situ ion diffusion in cementitious materials. Constr. Build. Mater. 2017, 136, 88–98. [Google Scholar] [CrossRef]
  23. Moradllo, M.K.; Ley, M.T. Quantitative measurement of the influence of degree of saturation on ion penetration in cement paste by using X-ray imaging. Constr. Build. Mater. 2017, 141, 113–129. [Google Scholar] [CrossRef]
  24. Moradllo, M.K.; Ley, M.T. Comparing ion diffusion in alternative cementitious materials in real time by using non-destructive X-ray imaging. Cem. Concr. Compos. 2017, 82, 67–79. [Google Scholar] [CrossRef]
  25. Zhou, Z.; Chu, B. Light-scattering study on the association behavior of triblock polymers of ethylene oxide and propylene oxide in aqueous solution. J. Colloid Interface Sci. 1988, 126, 171–180. [Google Scholar] [CrossRef]
  26. Nagarajan, R. Solubilization of hydrocarbons and resulting aggregate shape transitions in aqueous solutions of Pluronic® (PEO–PPO–PEO) block copolymers. Colloids Surf. B Biointerfaces 1999, 16, 55–72. [Google Scholar] [CrossRef]
  27. Sharma, R.K.; Shaikh, S.; Ray, D.; Aswal, V.K. Binary mixed micellar systems of PEO-PPO-PEO block copolymers for lamotrigine solubilization: A comparative study with hydrophobic and hydrophilic copolymer. J. Polym. Res. 2018, 25, 73. [Google Scholar] [CrossRef]
  28. Lal, S.; Datta, M. Organoclay Pluronic f68—Montmorillonite, as a Sustained Release Drug Delivery Vehicle for Propranolol Hydrochloride; European Chemical Bulletin: Budapest, Hungary, 2014. [Google Scholar]
  29. Dmitrenko, M.; Penkova, A.; Atta, R.; Zolotarev, A.; Plisko, T.; Mazur, A.; Solovyev, N.; Ermakov, S. The development and study of novel membrane materials based on polyphenylene isophthalamide—Pluronic F127 composite. Mater. Des. 2019, 165, 107596. [Google Scholar] [CrossRef]
  30. Elmowafy, M.; Alruwaili, N.K.; Shalaby, K.; Alharbi, K.S.; Altowayan, W.M.; Ahmad, N.; Zafar, A.; Elkomy, M. Long-Acting Paliperidone Parenteral Formulations Based on Polycaprolactone Nanoparticles; the Influence of Stabilizer and Chitosan on In Vitro Release, Protein Adsorption, and Cytotoxicity. Pharmaceutics 2020, 12, 160. [Google Scholar] [CrossRef] [PubMed]
  31. Tunstall, L.E.; Ley, M.T.; Scherer, G.W. Air entraining admixtures: Mechanisms, evaluations, and interactions. Cem. Concr. Res. 2021, 150, 106557. [Google Scholar] [CrossRef]
  32. Alexandridis, P.; Athanassiou, V.; Fukuda, S.; Hatton, T.A. Surface Activity of Poly(ethylene oxide)-block-Poly(propylene oxide)-block-Poly(ethylene oxide) Copolymers. Langmuir 1994, 10, 2604–2612. [Google Scholar] [CrossRef]
  33. Feneuil, B.; Pitois, O.; Roussel, N. Effect of surfactants on the yield stress of cement paste. Cem. Concr. Res. 2017, 100, 32–39. [Google Scholar] [CrossRef]
  34. Tiwari, S.; Namsani, S.; Singh, J.K. Effect of salt on the adsorption of ionic surfactants at the air-water interface. J. Mol. Liq. 2022, 360, 119498. [Google Scholar] [CrossRef]
  35. Jain, N.; Aswal, V.; Goyal, P.; Bahadur, P. Salt induced micellization and micelle structures of′ PEO/PPO/PEO block copolymers in aqueous solution. Colloids Surf. A Physicochem. Eng. Asp. 2000, 173, 85–94. [Google Scholar] [CrossRef]
  36. Lunagariya, J.; Kumar, N.S.; Asif, M.; Dhar, A.; Vekariya, R.L. Dependency of Anion and Chain Length of Imidazolium Based Ionic Liquid on Micellization of the Block Copolymer F127 in Aqueous Solution: An Experimental Deep Insight. Polymers 2017, 9, 285. [Google Scholar] [CrossRef]
  37. Pisal, S.; Wawde, G.M.; Bandivadekar, M.; Hajare, A.A.; Kadam, S. Vacuum foam drying for preservation of lasota virus: Screening of foaming agent and cycle optimization. Indian J. Biotechnol. 2006, 5, 491–497. [Google Scholar]
  38. BASF. Pluronic PE Types Technical Information. 1996. Available online: http://www.timing-ouhan.com/images/pluronicpetypes.pdf (accessed on 4 July 2024).
  39. Dodson, V.H. Concrete Admixtures; Springer Nature: Dordrecht, The Netherlands, 1990. [Google Scholar]
  40. Federal Highway Administration. Fly Ash AEA Adsorption Capacity Estimation as Measured by Fluorescence or Foam Index. 2017. Available online: https://www.fhwa.dot.gov/publications/research/infrastructure/pavements/17118/index.cfm (accessed on 4 July 2024).
  41. Doulia, D.; Trägårdh, G.; Gekas, V. Interaction behaviour in ultrafiltration of nonionic surfactants Part II. Static adsorption below CMC. J. Membr. Sci. 1997, 123, 133–142. [Google Scholar] [CrossRef]
  42. Zhang, T.; Shang, S.; Yin, F.; Aishah, A.; Salmiah, A.; Ooi, T. Adsorptive behavior of surfactants on surface of Portland cement. Cem. Concr. Res. 2001, 31, 1009–1015. [Google Scholar] [CrossRef]
  43. Lange, A.; Plank, J. Contribution of non-adsorbing polymers to cement dispersion. Cem. Concr. Res. 2016, 79, 131–136. [Google Scholar] [CrossRef]
  44. Fang, Y.; Lin, Z.; Yan, D.; Zhang, X.; Ma, X.; Lai, J.; Liu, Y.; Chen, Z.; Wang, Z. Study on the Effect of Polycarboxylate Ether Molecular Structure on Slurry Dispersion, Adsorption, and Microstructure. Polymers 2023, 15, 2496. [Google Scholar] [CrossRef]
  45. Burgos-Montes, O.; Palacios, M.; Rivilla, P.; Puertas, F. Compatibility between superplasticizer admixtures and cements with mineral additions. Constr. Build. Mater. 2012, 31, 300–309. [Google Scholar] [CrossRef]
  46. Merlin, F.; Guitouni, H.; Mouhoubi, H.; Mariot, S.; Vallée, F.; Van Damme, H. Adsorption and heterocoagulation of nonionic surfactants and latex particles on cement hydrates. J. Colloid Interface Sci. 2005, 281, 1–10. [Google Scholar] [CrossRef]
  47. Zingg, A.; Winnefeld, F.; Holzer, L.; Pakusch, J.; Becker, S.; Gauckler, L. Adsorption of polyelectrolytes and its influence on the rheology, zeta potential, and microstructure of various cement and hydrate phases. J. Colloid Interface Sci. 2008, 323, 301–312. [Google Scholar] [CrossRef]
  48. Qiao, M.; Chen, J.; Gao, N.; Shan, G.; Wu, J.; Zhu, B.; Ran, Q. Effects of Adsorption Group and Molecular Weight of Viscosity-Modifying Admixtures on the Properties of Cement Paste. J. Mater. Civ. Eng. 2022, 34, 04022148. [Google Scholar] [CrossRef]
  49. Shu, X.; Zhao, H.; Wang, X.; Zhang, Q.; Yang, Y.; Ran, Q.; Liu, J. Effect of hydrophobic units of polycarboxylate superplasticizer on the flow behavior of cement paste. J. Dispers. Sci. Technol. 2016, 38, 256–264. [Google Scholar] [CrossRef]
  50. Li, S.; Liu, J.; Yang, Y.; Qi, S.; Ran, Q.; Liu, J. Synthesis, performance and working mechanism of a novel polyaryl ether superplasticizer for cement-based materials. J. Dispers. Sci. Technol. 2019, 41, 1–10. [Google Scholar] [CrossRef]
  51. Shi, L.; Huang, J.; Zeng, G.; Zhu, L.; Gu, Y.; Shi, Y.; Yi, K.; Li, X. Roles of surfactants in pressure-driven membrane separation processes: A review. Environ. Sci. Pollut. Res. 2019, 26, 30731–30754. [Google Scholar] [CrossRef]
  52. Qu, H.; Fu, C.; Yang, W.; Yang, Z.; Zhang, L. Preparation, application and water reducing mechanism of a novel fluorescent superplasticizer with improved flow retaining ability and clay tolerance. J. Dispers. Sci. Technol. 2018, 39, 1829–1839. [Google Scholar] [CrossRef]
  53. Choi, P.; Yeon, J.H.; Yun, K.-K. Air-void structure, strength, and permeability of wet-mix shotcrete before and after shotcreting operation: The influences of silica fume and air-entraining agent. Cem. Concr. Compos. 2016, 70, 69–77. [Google Scholar] [CrossRef]
  54. Kumar Mehta, P.; Monteiro, P.J.M. Concrete: Microstructure, Properties, and Materials; McGraw-Hill Education: New York, NY, USA, 2014; Available online: https://www.accessengineeringlibrary.com/content/book/9780071797870 (accessed on 4 July 2024).
  55. C457/C457M; Standard Test Method for Microscopical Determination of Parameters of the Air-Void System in Hardened Concrete, (n.d.). Available online: https://www.astm.org/c0457_c0457m-16.html (accessed on 4 July 2024).
  56. Micro Photonics. Structural Parameters Measured by SkyscanTM CT-Analyzer Software, n.d. Available online: https://www.microphotonics.com/wp-content/uploads/2016/01/CTAn_parameters.pdf (accessed on 4 July 2024).
  57. Zhuang, S.; Wang, Q.; Zhang, M. Water absorption behaviour of concrete: Novel experimental findings and model characterization. J. Build. Eng. 2022, 53, 104602. [Google Scholar] [CrossRef]
  58. Eriksson, D.; Gasch, T.; Ansell, A. A Hygro-Thermo-Mechanical Multiphase Model for Long-Term Water Absorption into Air-Entrained Concrete. Transp. Porous Media 2018, 127, 113–141. [Google Scholar] [CrossRef]
  59. Moradllo, M.K.; Qiao, C.; Keys, M.; Hall, H.; Ley, M.T.; Reese, S.; Weiss, W.J. Quantifying Fluid Absorption in Air-Entrained Concrete Using Neutron Radiography. ACI Mater. J. 2019, 116, 213–226. [Google Scholar] [CrossRef]
  60. Li, W.; Pour-Ghaz, M.; Castro, J.; Weiss, J. Water Absorption and Critical Degree of Saturation Relating to Freeze-Thaw Damage in Concrete Pavement Joints. J. Mater. Civ. Eng. 2012, 24, 299–307. [Google Scholar] [CrossRef]
  61. Kearsley, E.P.; Wainwright, P.J. The effect of porosity on the strength of foamed concrete. Cem. Concr. Res. 2002, 32, 233–239. [Google Scholar] [CrossRef]
  62. Wong, H.; Pappas, A.; Zimmerman, R.; Buenfeld, N. Effect of entrained air voids on the microstructure and mass transport properties of concrete. Cem. Concr. Res. 2011, 41, 1067–1077. [Google Scholar] [CrossRef]
  63. Shen, C.; Zhu, Y.; Shi, W.; He, K.; Xiao, X.; Xu, X.; Shi, J.; Xu, G. Mechanically stable superhydrophobic surface on cement-based materials. Chem. Phys. 2020, 538, 110912. [Google Scholar] [CrossRef]
  64. Lin, G.; Zhang, X.; Kumar, S.R.; Mark, J.E. Improved Hydrophilicity from Poly(ethylene glycol) in Amphiphilic Conetworks with Poly(dimethylsiloxane). Silicon 2009, 1, 173–181. [Google Scholar] [CrossRef]
  65. Yao, H.; Xie, Z.; Huang, C.; Yuan, Q.; Yu, Z. Recent progress of hydrophobic cement-based materials: Preparation, characterization and properties. Constr. Build. Mater. 2021, 299, 124255. [Google Scholar] [CrossRef]
  66. Liu, B.; Shi, J.; Sun, M.; He, Z.; Xu, H.; Tan, J. Mechanical and permeability properties of polymer-modified concrete using hydrophobic agent. J. Build. Eng. 2020, 31, 101337. [Google Scholar] [CrossRef]
  67. Qiao, C.; Moradllo, M.K.; Hall, H.; Ley, M.T.; Weiss, W.J. Electrical Resistivity and Formation Factor of Air-Entrained Concrete. ACI Mater. J. 2019, 116, 85–93. [Google Scholar] [CrossRef]
  68. Fagerlund, G. The international cooperative test of the critical degree of saturation method of assessing the freeze/thaw resistance of concrete. Matériaux Constr. 1977, 10, 231–253. [Google Scholar] [CrossRef]
Figure 1. Molecular structures of PEG-PPG triblock copolymers for PEG-PPG-PEG chains (top) and PPG-PEG-PPG (bottom).
Buildings 14 02100 g001
Figure 2. Experimental setup and interpretation procedure for water sorption test with micro-CT. (a) 0.6 × 2-inch cement sample is sealed in aluminum foil tape on the sides and glued to the cap of a 50 ml centrifuge tube. The exposed bottom surface is then submerged a few millimeters in 10% CsCO3 dopant solution and scanned at different times. (b) The average greyscale histogram of dopant solution is extracted at every cross-section. The distance between the first peak and the end of signal signifies the height of sorption of water. (c) Measuring the height of penetration of water at different times can illustrate the behavior of water sorption with micro-CT.
Buildings 14 02100 g002
Figure 3. Averaged volume-based distribution of hydrodynamic size of copolymers with 0.2% w/w concentration in DI measured by DLS. Summary table shows size at major peaks and the PDI.
Buildings 14 02100 g003
Figure 4. FTIR spectra of copolymers and the major bands at 20% w/w concentration in aqueous solution.
Buildings 14 02100 g004
Figure 5. Plots of surface tension in DI and FPS at 22 °C, (a) surface tension as a function of log of molar concentration in DI, and (b) changes in surface tension in FPS compared to DI in 0.125% and 0.5% w/w concentration of solution.
Buildings 14 02100 g005
Figure 6. Foaming properties of different copolymers in cement environment. (a) Foam volume in FPS with respect to time at a concentration of 0.25% w/w, and (b) SFI in cement. COP1100 and COP3300 never satisfied test criteria even at very high concentrations.
Buildings 14 02100 g006
Figure 7. Specific adsorption isotherms of the studied PEG-PPG copolymers on cement particles, determined through TOC measurements.
Buildings 14 02100 g007
Figure 8. Flow of samples with copolymer concentration of 0.25% w/w cement at a W/C of 0.4.
Buildings 14 02100 g008
Figure 9. Micro-CT cross-sections of samples at mid-length with 0.25% of copolymer as air-entraining agents. (a) Ctrl. (b) CEM-COP1100. (c) CEM-COP8400. (d) CEM-COP14600. (e) CEM-COP3300.
Buildings 14 02100 g009
Figure 10. Air-entrained porosity of cement samples, (a) porosity of cement with 0.25% and 1% of copolymer, and (b) porosity vs. log concentration in CEM-COP14600. Inset cross-sections are a quadrant of original samples.
Buildings 14 02100 g010
Figure 11. Gravimetric water penetration and absorption at 28 days between different copolymer samples (a) with 0.25% concentration, (b) with 1% concentration, and (c) CEM-COP14600 at different ages and concentrations.
Buildings 14 02100 g011
Figure 12. Contact angle of Ctrl and samples with copolymer concentration of 0.25% w/w cement at a W/C of 0.5.
Buildings 14 02100 g012
Figure 13. Results of the water sorption experiments. (a) X-ray shadow projections of cement samples with different copolymers and different water exposure times in minutes, and (b) height of CsCO3 solution in different samples. Samples have a height of two inches.
Buildings 14 02100 g013
Figure 14. Effect of 50 cycles of freeze-thaw (−18 °C to 12 °C) on Ctrl paste and pastes with 0.25% copolymer. Samples are 1-inch cubes at 28 days of curing. (a) Ctrl—N = 0. (b) Ctrl—N = 50. (c) CEM-COP3300—N = 50. (d) CEM-COP1100—N = 50. (e) CEM-COP8400—N = 50. (f) CEM-COP14600—N = 50.
Buildings 14 02100 g014
Table 1. PEG-PPG triblock copolymer properties in DI from MilliporeSigma, BASF, and the literature [11]. Block size, copolymer molecular weight, and PEG/PPG ratios are approximate and may vary. Higher HLB points to a more hydrophilic polymer. Brookfield viscosities were measured at 25 °C and 77 °C for liquids and solids, respectively.
CodePluronic® IdentifierPolymer Structurex|zyMn (Da)PEG (%w) by 1H NMRHLBFormViscosity (cps)
COP1100L-31[PEG]x [PPG]y [PEG]z416110010%5Liquid175
COP8400F-68 LF[PEG]x [PPG]y [PEG]z8027840080%29solid1000
COP14600F-108[PEG]x [PPG]y [PEG]z1414414,60082.5%27solid2800
COP330031R1[PPG]x [PEG]y [PPG]z274330010%1liquid660
Table 2. Oxide composition of Portland cement.
Composition(%)
SiO220.6
Al2O34.8
Fe2O33.5
CaO64
MgO0.9
Na2O0.1
K2O0.3
SO33.4
LOI2.4
Table 3. Microstructure of air-entrained cement samples with different types and concentrations of the copolymers, obtained from the micro-CT analysis. The void diameter is weight-averaged using the volume to minimize the impact of the noise and very fine voids.
SampleMicro-CT Analysis
CopolymerConc.Porosity (%)Separation (mm)Ave. Void Diameter (mm)
Ctrl0.00%0.510.540.11
CEM-COP11000.25%2.150.830.28
1.00%1.381.460.42
CEM-COP84000.25%3.230.470.33
1.00%5.000.540.32
CEM-COP146000.01%2.800.530.29
0.05%4.600.500.29
0.10%9.850.580.34
0.25%29.200.280.32
1.00%31.170.270.30
CEM-COP33000.25%0.771.270.49
1.00%0.331.230.42
Table 4. Approximate volume fraction of capillary pores of cement pastes with 0.25% and 1% concentration of copolymers.
SampleCapillary Porosity (%)
0.25%1%
Ctrl28.1628.16
CEM-COP110034.5437.28
CEM-COP840031.1232.65
CEM-COP1460022.0821.92
CEM-COP330034.6533.00
Disclaimer/Publisher’s Note: The statements, opinions and data contained in all publications are solely those of the individual author(s) and contributor(s) and not of MDPI and/or the editor(s). MDPI and/or the editor(s) disclaim responsibility for any injury to people or property resulting from any ideas, methods, instructions or products referred to in the content.

