Article

A New Methodology to Estimate the Early-Age Compressive Strength of Concrete before Demolding

1
Graduate School of Engineering, Tohoku University, Sendai 980-8579, Japan
2
School of Process Engineering, Hamburg University of Technology, 21073 Hamburg, Germany
3
Faculty of Economics, West Pomeranian University of Technology, 71-210 Szczecin, Poland
4
Department of Civil Engineering, National Institute of Applied Sciences of Toulouse, 31077 Toulouse, France
*
Author to whom correspondence should be addressed.
Buildings 2024, 14(7), 2099; https://doi.org/10.3390/buildings14072099
Submission received: 15 June 2024 / Revised: 1 July 2024 / Accepted: 5 July 2024 / Published: 9 July 2024

Abstract

:
Non-destructive testing has many advantages, such as the ability to obtain a large number of data without destroying existing structures. However, the reliability of the estimation accuracy and the limited range of applicable targets remain an issue. This study proposes a novel pin penetration test method to determine the early-age compressive strength of concrete before demolding. The timing of demolding and initial curing is determined according to the strength development of concrete. Therefore, it is important to determine the compressive strength at an early age before demolding at the actual construction site. The applicability of this strength estimation methodology at actual construction is investigated. Small test holes (12 mm in diameter) are prepared on the mold surface in real construction sites and mock-up specimens in advance. The pin is penetrated into these test holes to obtain the relationship between the compressive strength and the penetration depth. As a result, it is confirmed that the pin penetration test method is suitable for measuring the early-age compressive strength at the actual construction site. This allows the benchmark values for compressive strength, necessary to avoid early frost damage, to be directly verified on the concrete structural members at the construction site. For instance, the compressive strengths of greater than 5 MPa and 10 MPa can be confirmed by the penetration depths benchmark values of 8.0 mm and 6.7 mm or less, respectively.

1. Introduction

It is important to determine the early-age compressive strength at the actual construction site when concrete work is executed in cold weather conditions to prevent early-age frost damage. Most of the international norms and guidelines for cold weather concreting are recommending to obtain at least 5 MPa strength before exposing concrete to early-age freezing. However, there are no suitable methods available for the measurement of low-strength concrete at a very early age, in particular before demolding at the construction site. As well known, cement hydration is quite sensitive to temperature, and strength development would be delayed at low temperatures [1]. The mold provides an important protection function against low temperatures for early-age concrete. Therefore, it is desirable to extend the period during which the concrete mold remains in place as much as possible to ensure sufficient initial curing. Japanese Architectural Standard Specification for Reinforced Concrete Works, JASS 5 [2], provided by the Architectural Institute of Japan, specifies that the period where the mold remains in place shall be controlled by strength. JASS 5 requires the removal of the mold after confirming that the compressive strength of the structural concrete attains specific criteria depending on the planned service life. In the case of the ‘short-term’ and ‘standard’ service life level, the compressive strength should be 5 N/mm2 or more for demolding. In the case of the ‘long-term’ and ‘extra-long-term’ service life level, the compressive strength should be 10 N/mm2 or more. In the case of cold weather concreting, the recommendation for the practice of cold weather concreting [3,4] and its commentary also require initial curing until the compressive strength exceeds 5 N/mm2 in order to avoid initial frost damage.
As mentioned above, the timing of demolding and initial curing is determined according to the strength development of concrete. However, because compressive strength is obtained by compressive strength tests using test pieces, it undergoes different curing conditions from the structural concrete placed in the mold. To obtain the compressive strength of the actual structural concrete, it is desirable to take cores from the hardened structure and test them, which is destructive. However, it is challenging to take cores from unmatured concrete members before demolding. In addition, conducting a compression test is not easy to do at the construction site, and it is unavoidably costly in terms of time and economics, such as transportation to the testing location and the testing procedure itself.
There are various non-destructive testing (NDT) methods available for the assessment of the in situ concrete strength. Non-destructive and micro-destructive testing methods for estimating the compressive strength of concrete have been studied extensively, and many methods have been put into practical use and standardized. The most commonly used NDT methods are a rebound hammer test [5,6,7,8] and ultrasonic pulse velocity [9,10,11,12,13,14,15]. A combination of those methods [16,17,18] is also widely used to evaluate the existing concrete structures. However, most of them have been applied to the concrete surface to estimate the internal mechanical properties (compressive strength). Any of those methods are only applicable for the existing or hardened concrete structures but not applicable to the unmatured concrete structures before demolding. The target concrete of these NDTs is post-cured concrete or structures that have deteriorated over time, and there are not enough tests available for young concrete, especially before demolding.
Non-destructive testing has many advantages, such as the ability to obtain a large number of data without destroying existing structures on a large scale [19]. However, the reliability of the estimation accuracy remains an issue. For example, the rebound hammer test is an extremely simple test method and has been standardized in Japan as JIS A 1155 [20], which is modified from ISO 1920-7 [21]. However, the method of estimating strength from the degree of rebound is not included in these standards due to a unified calculation method for estimating strength from the degree of rebound has not been obtained [22,23,24,25].
There are several studies that investigated the NDT methods to use for alternative assessment of in situ concrete strength. Gunes et al. [26] have studied the drilling-based test methodology for non-destructive estimation of in situ concrete strength and carried out to develop a relationship between the drilling resistance parameter and compressive strength. However, they concluded that the most accurate estimations for strength are obtained when the drilling resistance measurements are combined with rebound hammer or ultrasonic pulse velocity measurements as additional NDT data. Al-Sabah et al. [27] investigated the post-installed screw pull-out test for the assessment of the compressive strength of in situ concrete, and they found that the correlation between the compressive strength of mortar and the peak load was significant. In addition, one of our previous studies [28] investigated the screening method to evaluate the low-strength concrete using the combination of two low-energy non-destructive testing devices, a type L rebound hammer and a scratching test. As a result, a concrete classification chart is proposed based on the boundary values of two NDT methods, and it provides a concrete strength range via a classification chart and a conservative estimate of the compressive strength. Nguyen et al. [29] studied the simple non-destructive method for evaluating the cover concrete quality, and they concluded that the water intentional spray test method could sensitively detect the poor-quality concrete caused by a high water–cement ratio and short curing time. However, all NDT methods mentioned here were performed on the surface of concrete; it is difficult to apply it directly to concrete before demolding when the surface has not yet been exposed.
The mold plays a role in protecting the concrete from external stimuli and ensuring its quality, and it is undesirable to remove even a part of the mold for the purpose of confirming the strength of young-aged concrete. A proposal to estimate the strength of the concrete with mold has been considered. In the BOSS (Broken Off Specimens by Splitting) specimen method [30] shown in Figure 1, which has been standardized in Japan as JIS A 1163 [31], concrete is poured into the mold with the mold for the BOSS specimen installed in advance to obtain a specimen that has hardened in the same environment as the structural concrete. By performing a compressive test on this BOSS specimen, strength estimation can be performed with high accuracy. However, there are some problems with the simplicity of the test, such as the fact that the compressive test cannot be performed at the construction site, the need for repair after demolding, and the limited number of specimens.
The strength of concrete generally depends on the strength of the hardened cement. Therefore, a non-destructive testing method called the penetration resistance method has been proposed [32,33,34,35], in which pins or needles are inserted into the mortar portion of concrete, and the strength is estimated from the penetration depth. Maliha et al. also used the same pin penetration device used in this study; they obtained a correlation between the penetration depth and compressive strength but confirmed that it was affected by coarse aggregate [34]. Conversely, if the influence of coarse aggregate can be eliminated, strength estimation can be performed with higher accuracy. For example, the accuracy of strength estimation for mortar without coarse aggregate is high, and there are also standardized methods for strength estimation, such as shotcrete [35].
In addition, a method called ‘smart sensor mold’, in which a mold is equipped with a sensor that can measure the surface temperature history of concrete, etc., has been proposed to confirm the development of standard strength at demolding [36,37]. However, this method cannot be applied to conventional mold easily because it requires the use of a mold with special devices.
Based on the above backgrounds, this study proposes to use the pin penetration test method to determine the early-age compressive strength before demolding. There are two main advantages of this method that is reason to use in this study. First, the proposed pin penetration test is applicable to use before demolding. Second, this method is suitable to use for low-strength concrete. However, the previous studies [37] have only shown the effectiveness of this method on laboratory-sized specimens and have not examined it on full-size concrete specimens, which may include different conditions, e.g., compaction conditions and uncontrolled temperature. In this study, the applicability of this strength estimation method at actual construction is investigated. Small test holes (12 mm in diameter) are prepared on the mold surface in real construction sites and mock-up specimens in advance. The pin is penetrated into these test holes to obtain the relationship between the compressive strength and the penetration depth.

2. Testing Method and Materials

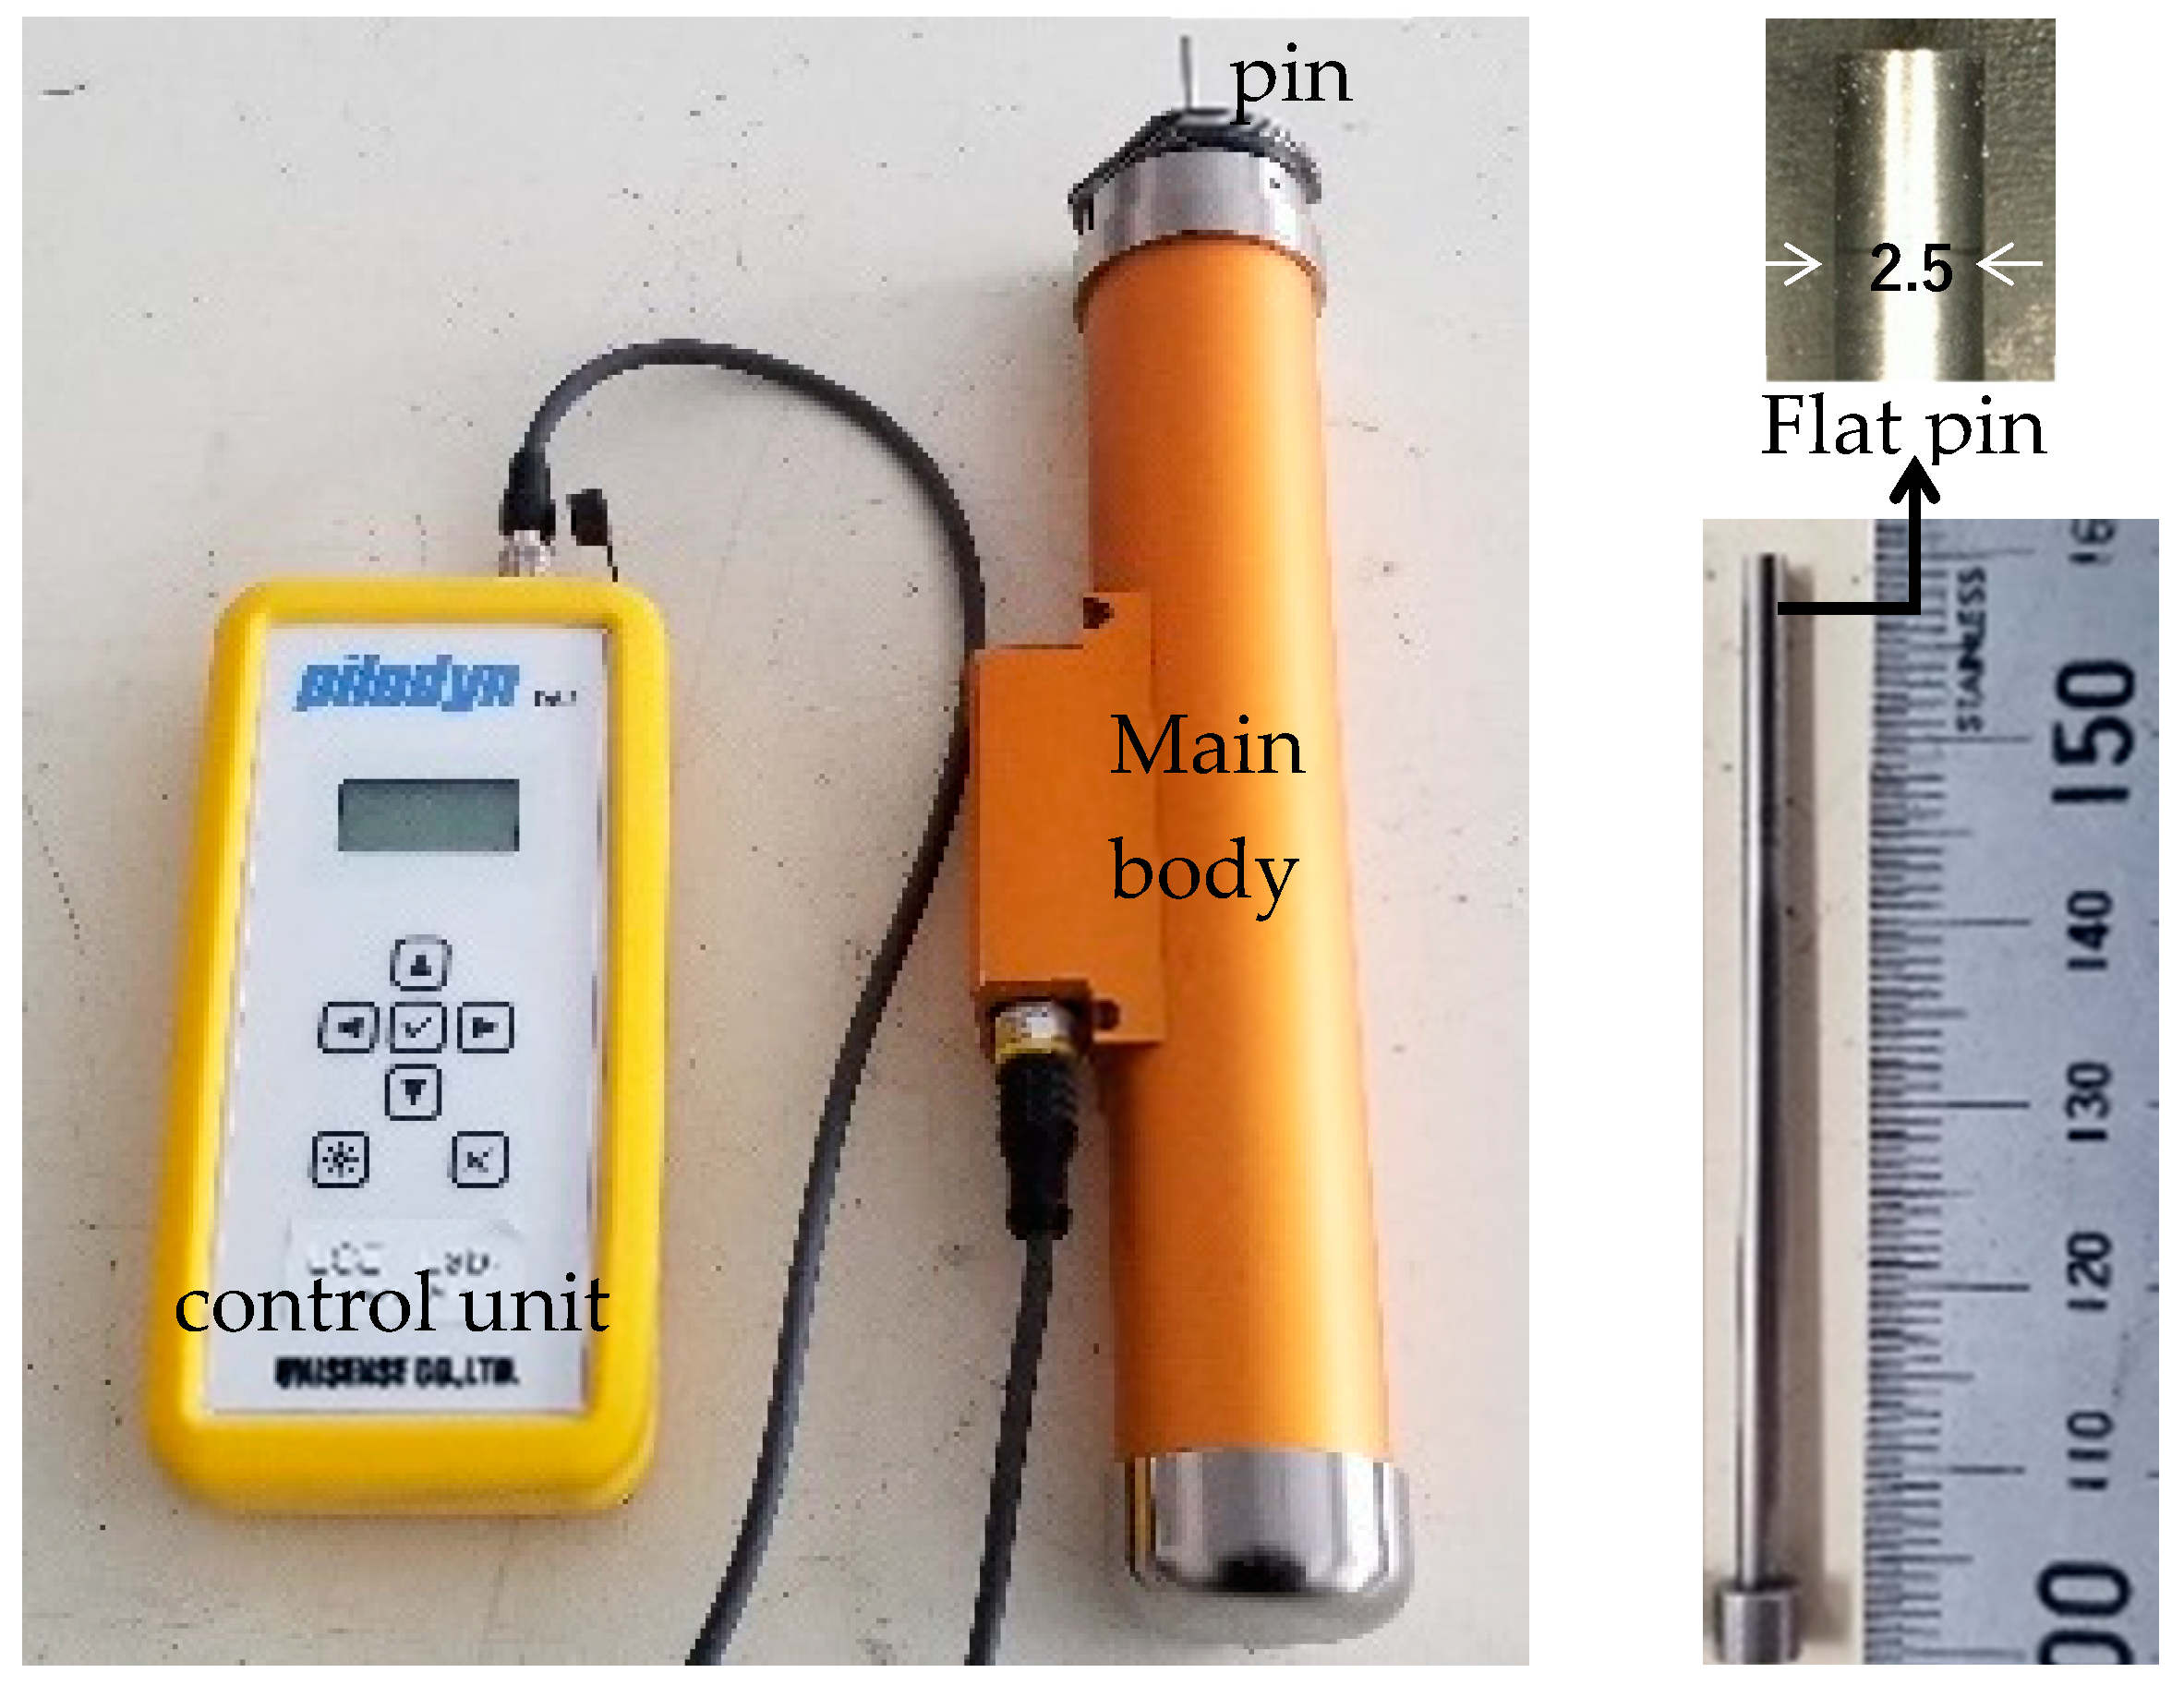
2.1. Pin Penetration Testing Device

The pin penetration testing device used in this study is shown in Figure 2, and its specifications are in Table 1. In this device, a metal pin of 2.5 mm in diameter and 60 mm in length is ejected with constant energy (6 Nm) from an internally compressed spring, pushing the pin at the tip up to a predetermined height, and the penetration depth is then measured. The measured penetration depth is digitally displayed on a control unit connected to the main unit of the tester. The measuring principle is similar to that of conventional pin penetration testers [32,33] used for concrete. This device was originally developed to estimate the degree of decay or deterioration of wood based on the penetration depth. In previous studies [34,35], this device was employed to determine the compressive strength of concrete on the cubic mold on a laboratory scale. No result has been verified on full-size mock-up specimens and/or actual construction sites. This study investigated the applicability of this method in actual construction sites to determine the early compressive strength. Two types of pipes with different materials were used to compare the effect of material type on penetration depth, as shown in Figure 2.

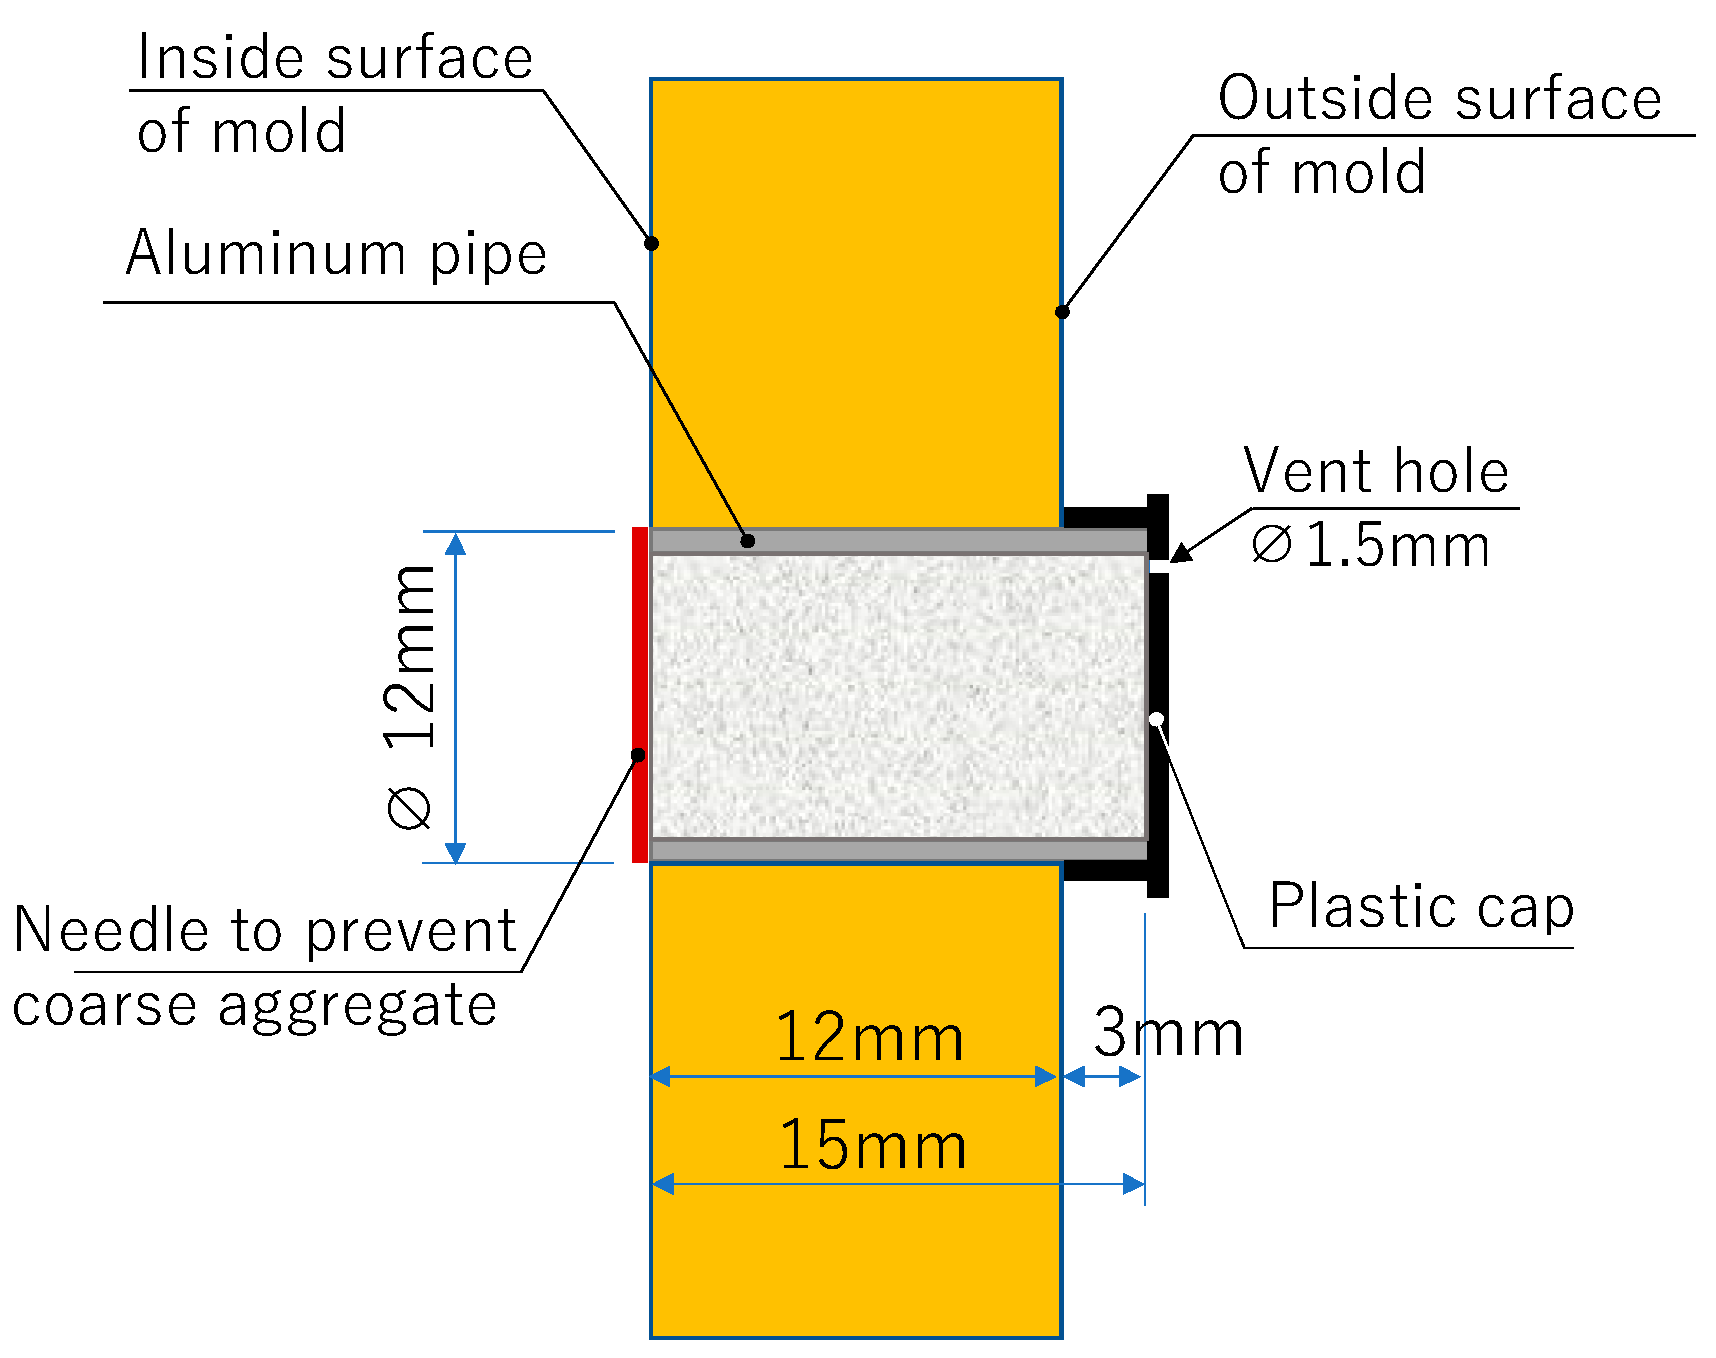
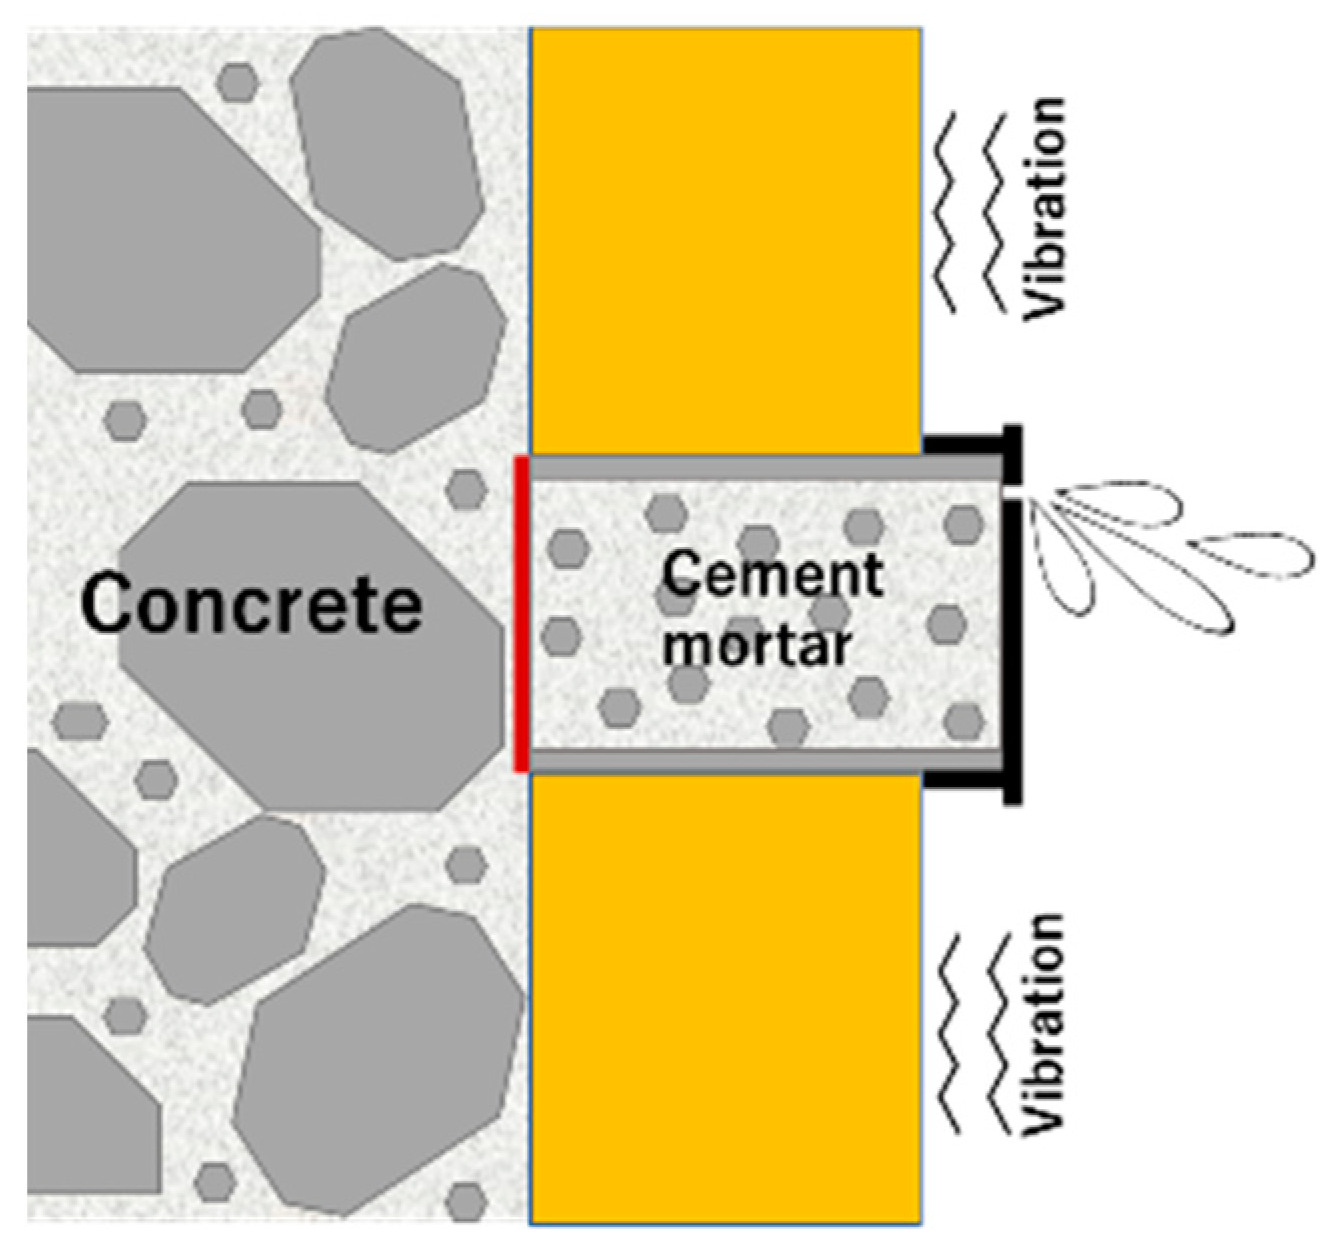
2.2. Technique of Measuring Strength before Demolding

Figure 3 shows the pin penetration test of the mock-up specimen. As shown in this photo, the specimens were not demolded. The pin penetration testing device is compact and lightweight, does not require an external power source other than the built-in dry cell batteries, and can be brought to the construction site easily. The pin penetration tests were performed on mortar filled in the holes, as shown in Figure 4. The measurement results were obtained from each hole.
Figure 4, Figure 5 and Figure 6 show the experimental procedure for preparing the test holes on the mold. The pre-assembled test piece consists of an aluminum (Al) or acrylic (Ac) pipe, a plastic cover, and a needle, as shown in Figure 4. The holes in the mold have the same diameter as those used for ordinary separators of the mold, and the test can be conducted simply by placing an aluminum pipe with a coarse aggregate penetration prevention needle and a plastic cap with holes on the side facing the outside of the mold. At first, test holes with a diameter of 12 mm were drilled in the mold before inserting the test piece, as shown in Figure 4. The space between holes was not less than 40 mm. After that, the pre-assembled test pieces were inserted into drilled holes, as shown in Figure 5. The concrete was poured into the mold after finishing the preparation of the mold. The internal and surface vibrators were used to compact the concrete until cement paste leaked from the plastic cap, as shown in Figure 6.

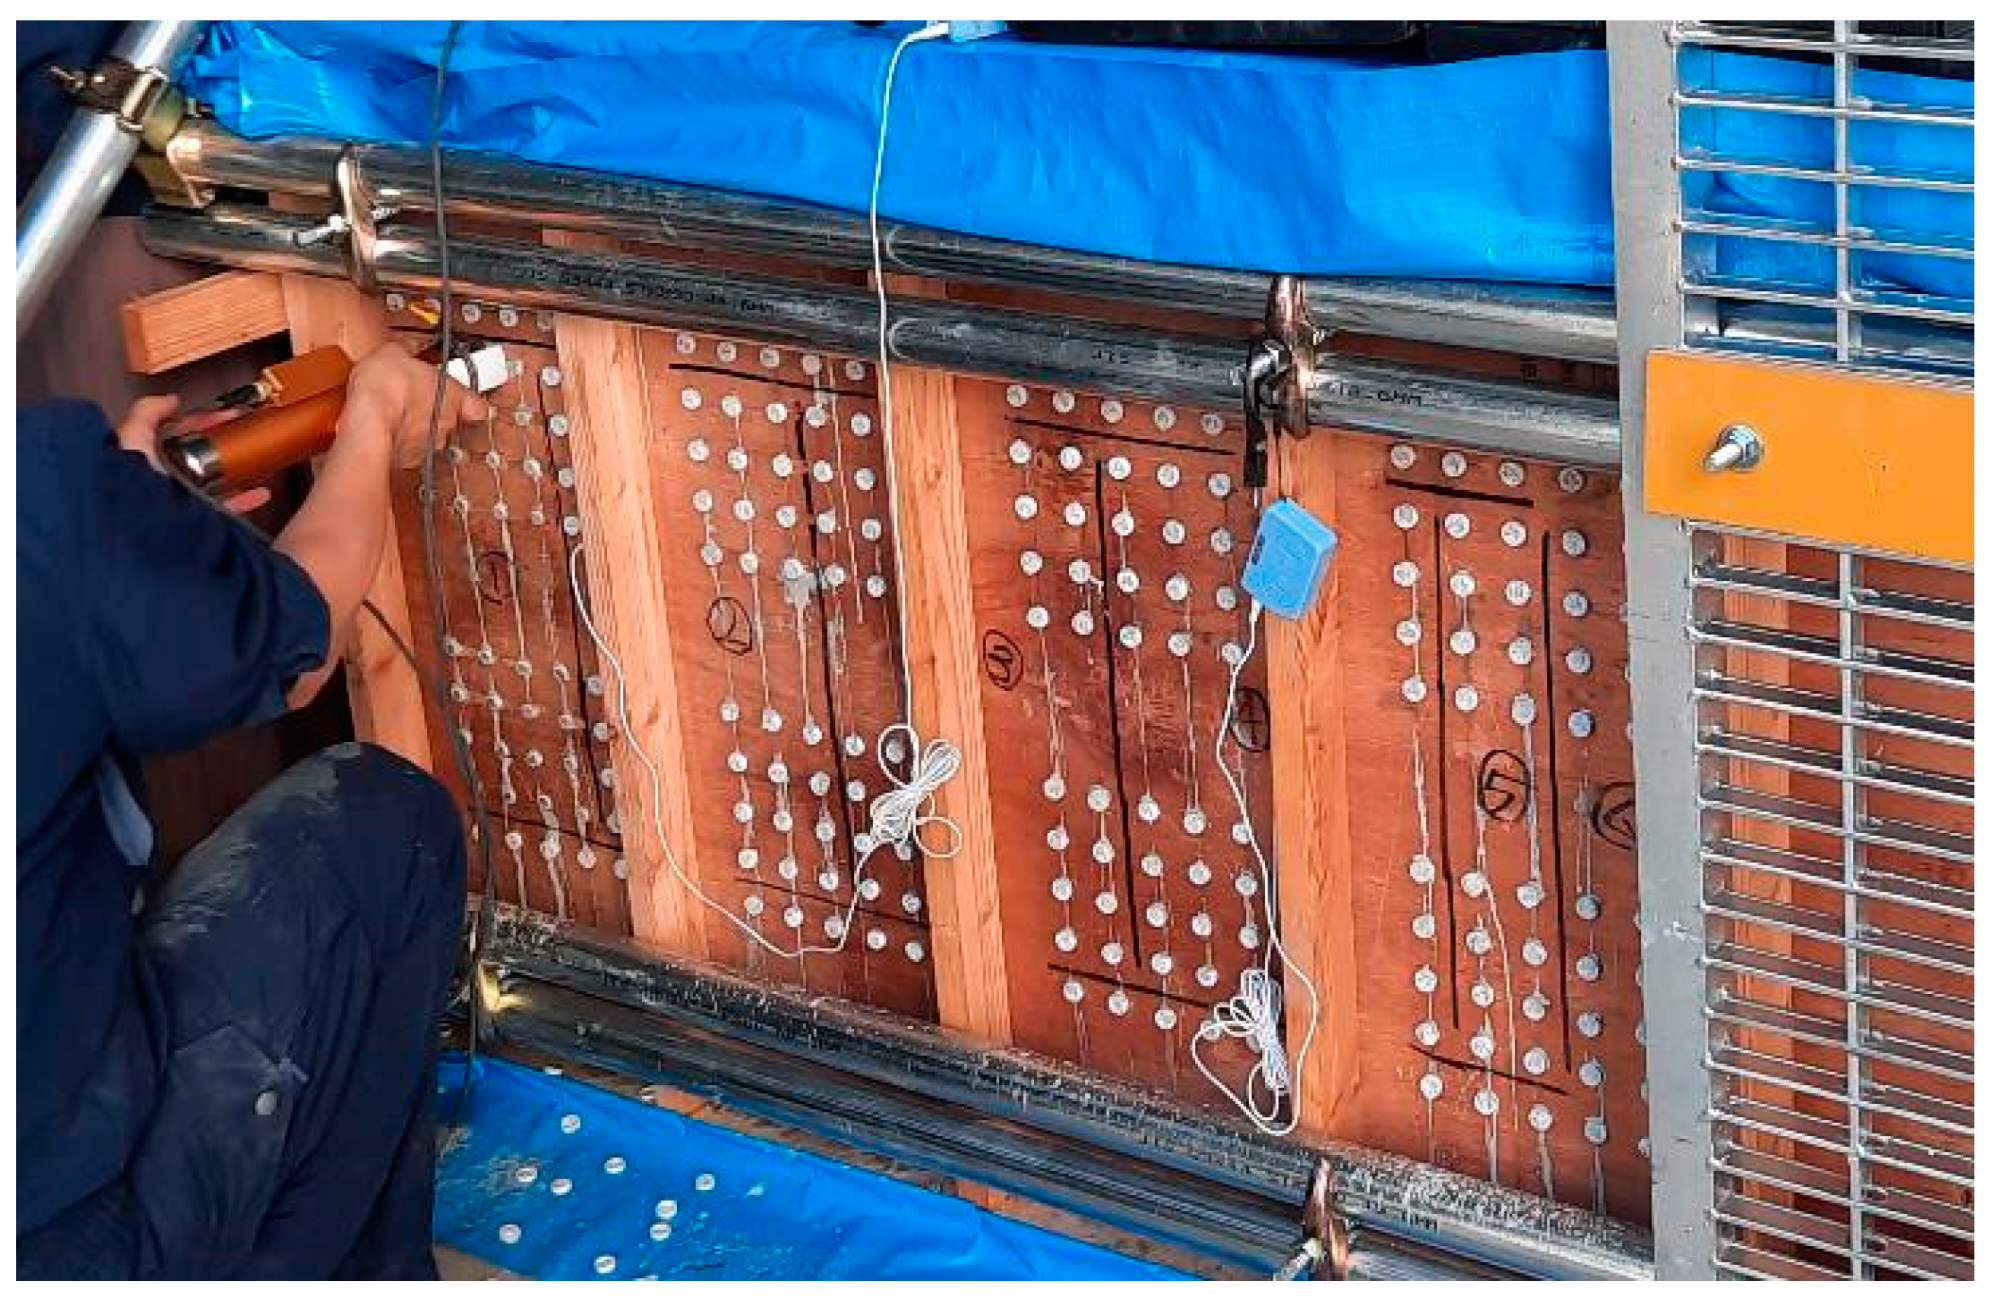
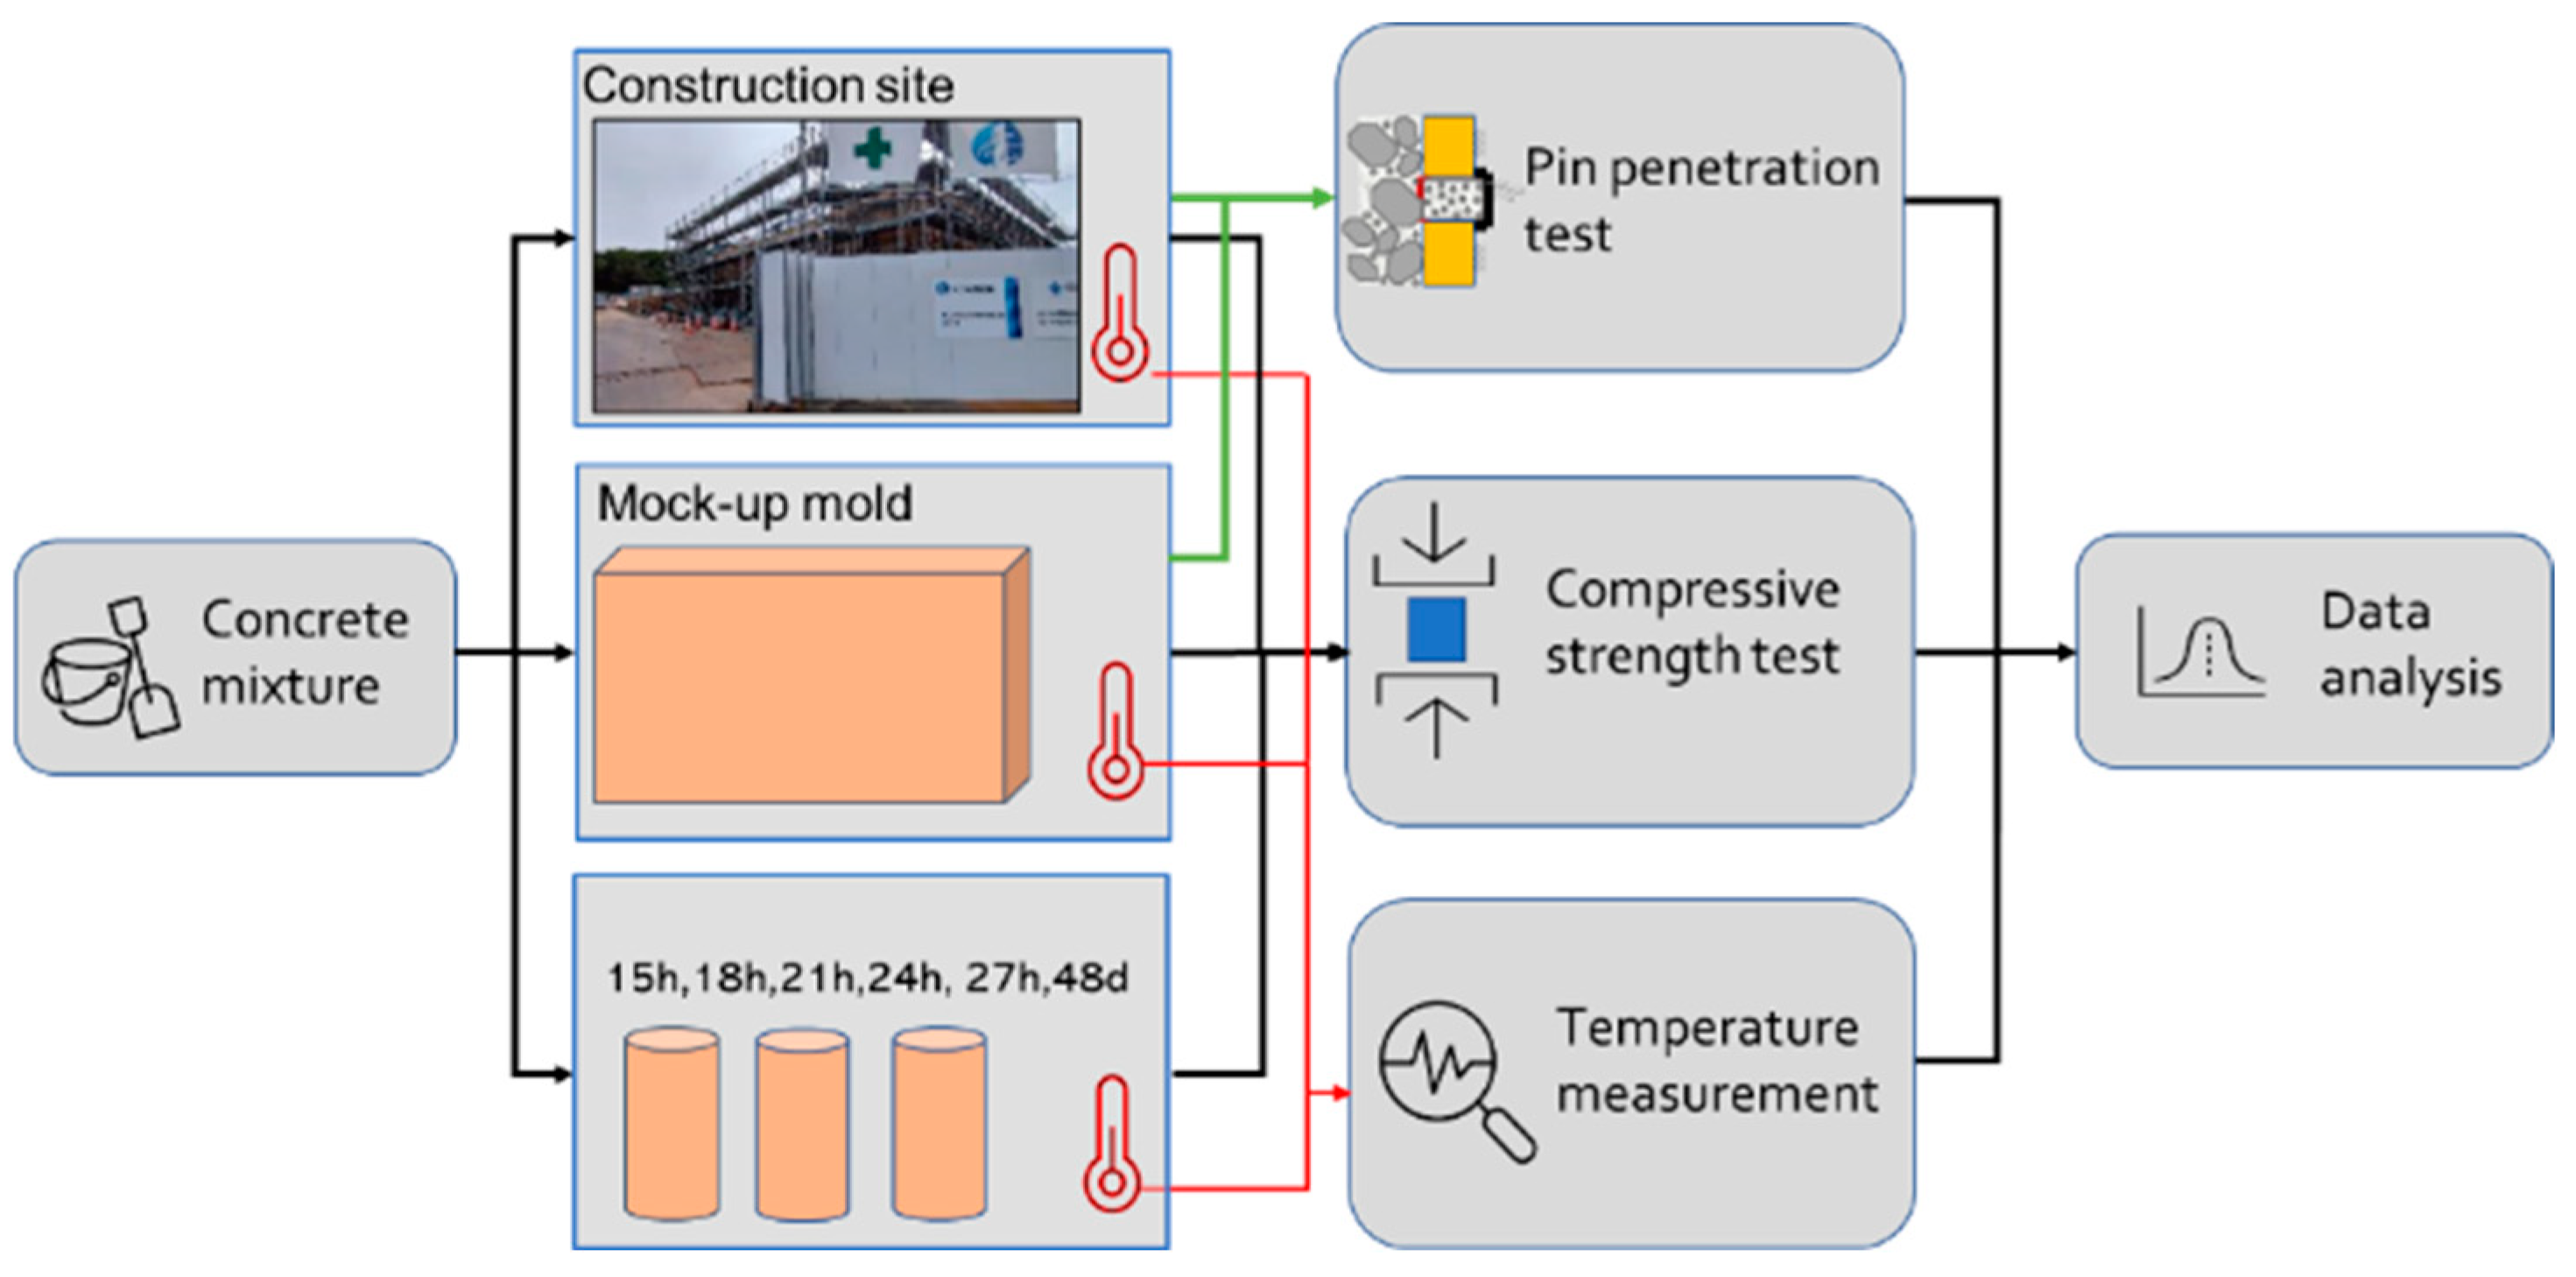
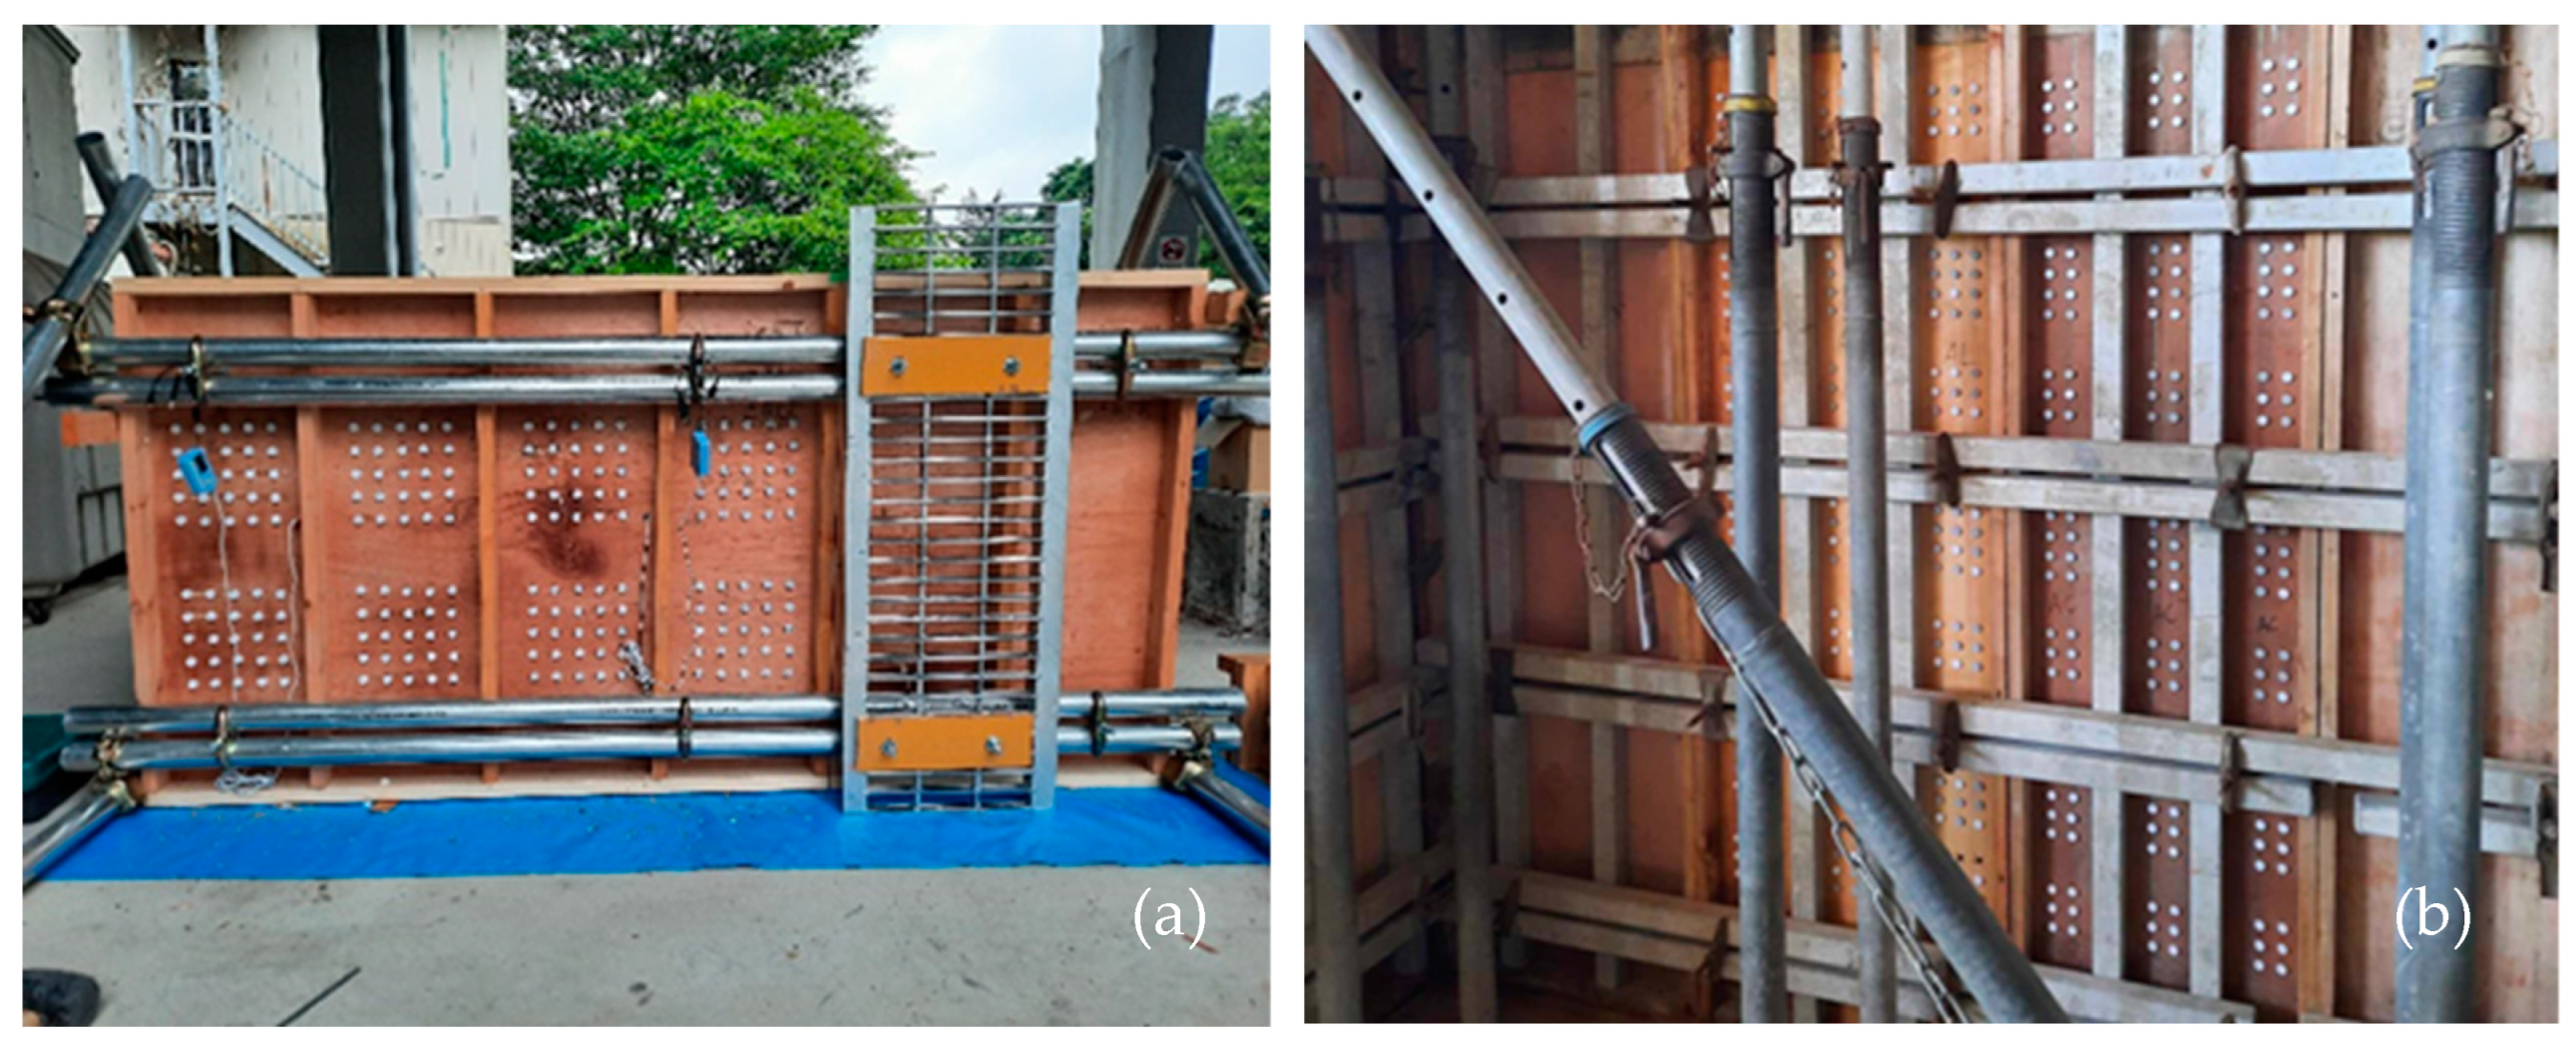
2.3. Pin Penetration Test at Construction Site and Mock-Up Mold

Figure 7 shows the outline of experimental work for the pin penetration test. The pin penetration test was performed at both the laboratory and the actual construction site to investigate the applicability of this method. Also, mock-up specimens were prepared to conduct pin penetration tests to simulate the actual construction site. Cylindrical specimens with a size of 100 × 200 mm were prepared to determine the compressive strength of concrete. Concrete temperatures and ambient temperatures were measured for each type of specimen and on the construction site using the digital thermometer. The temperature measurement interval was 5 min.
In the scope of this study, penetration tests were conducted with 30 holes with both Al and Ac pipes. For each series, pin penetration tests were conducted according to the schedule shown in Table 2. At the same accumulated temperature, the compressive strength tests were also conducted to obtain the corresponding compressive strength.
Figure 8 shows the schematic diagram of the mock-up mold. The size of the mock-up mold was 1800 × 900 × 200 mm each in length, height and thickness. In the case of the mock-up mold, the pin penetration test was performed once 15 h after casting and then repeated every 3 h. Therefore, testing times were 15, 18, 21, 24, 27, and 48 h. The core drilled specimens were taken from mock-up mold at a time interval of 21, 24, 27, and 48 h. The core drilling was conducted with the mold in place, as opposed to the usual situation. Temperatures were measured from the surface of the mock-up mold using the digital thermometer.
On the construction site, it was impossible to perform the test at the construction site before 8 a.m. in the morning and after 5 p.m. in the evening due to the limitation of working time at the construction site. Therefore, pin penetration tests were performed at 18, 21, 24, and 48 h at the construction site. The temperature was also measured from the concrete surface. Figure 9 shows the prepared test holes at the construction site and mock-up mold before conducting the pin penetration test.

2.4. Concrete Used in the Experiment

The concrete for the specimens was supplied by a ready-mixed concrete plant near Sendai City, Japan. Table 3 shows its specifications, and Table 4 shows its mix proportions. As shown in these tables, tests were conducted on the different concretes with different nominal strength, slump, and curing conditions also were different. Two different fine aggregates were used for adjustment of particle size distribution. After casting, the cylindrical specimens were sealed and cured at the construction site until testing.

2.5. Compressive Strength Test

Compressive strength tests were conducted in accordance with JIS A 1108. For each series of tests, three cylindrical specimens were used for compressive strength tests to confirm the strength. The testing time was determined by temperature measurement, which was reached when the cured specimens obtained the same accumulated temperature as the site concrete. The accumulated temperatures were calculated using Equation (1) [3].
M = ( 10 + T ) t
where
M: accumulated temperature (ºD·D);
T: temperature at ∆t;
t: time.
Both ends of the cylindrical specimens were polished. For the young specimens that were not strong enough to withstand polishing, unbonded capping devices with soft rubber were used. A 1000 kN universal testing machine was used for loading.

3. Results and Discussion

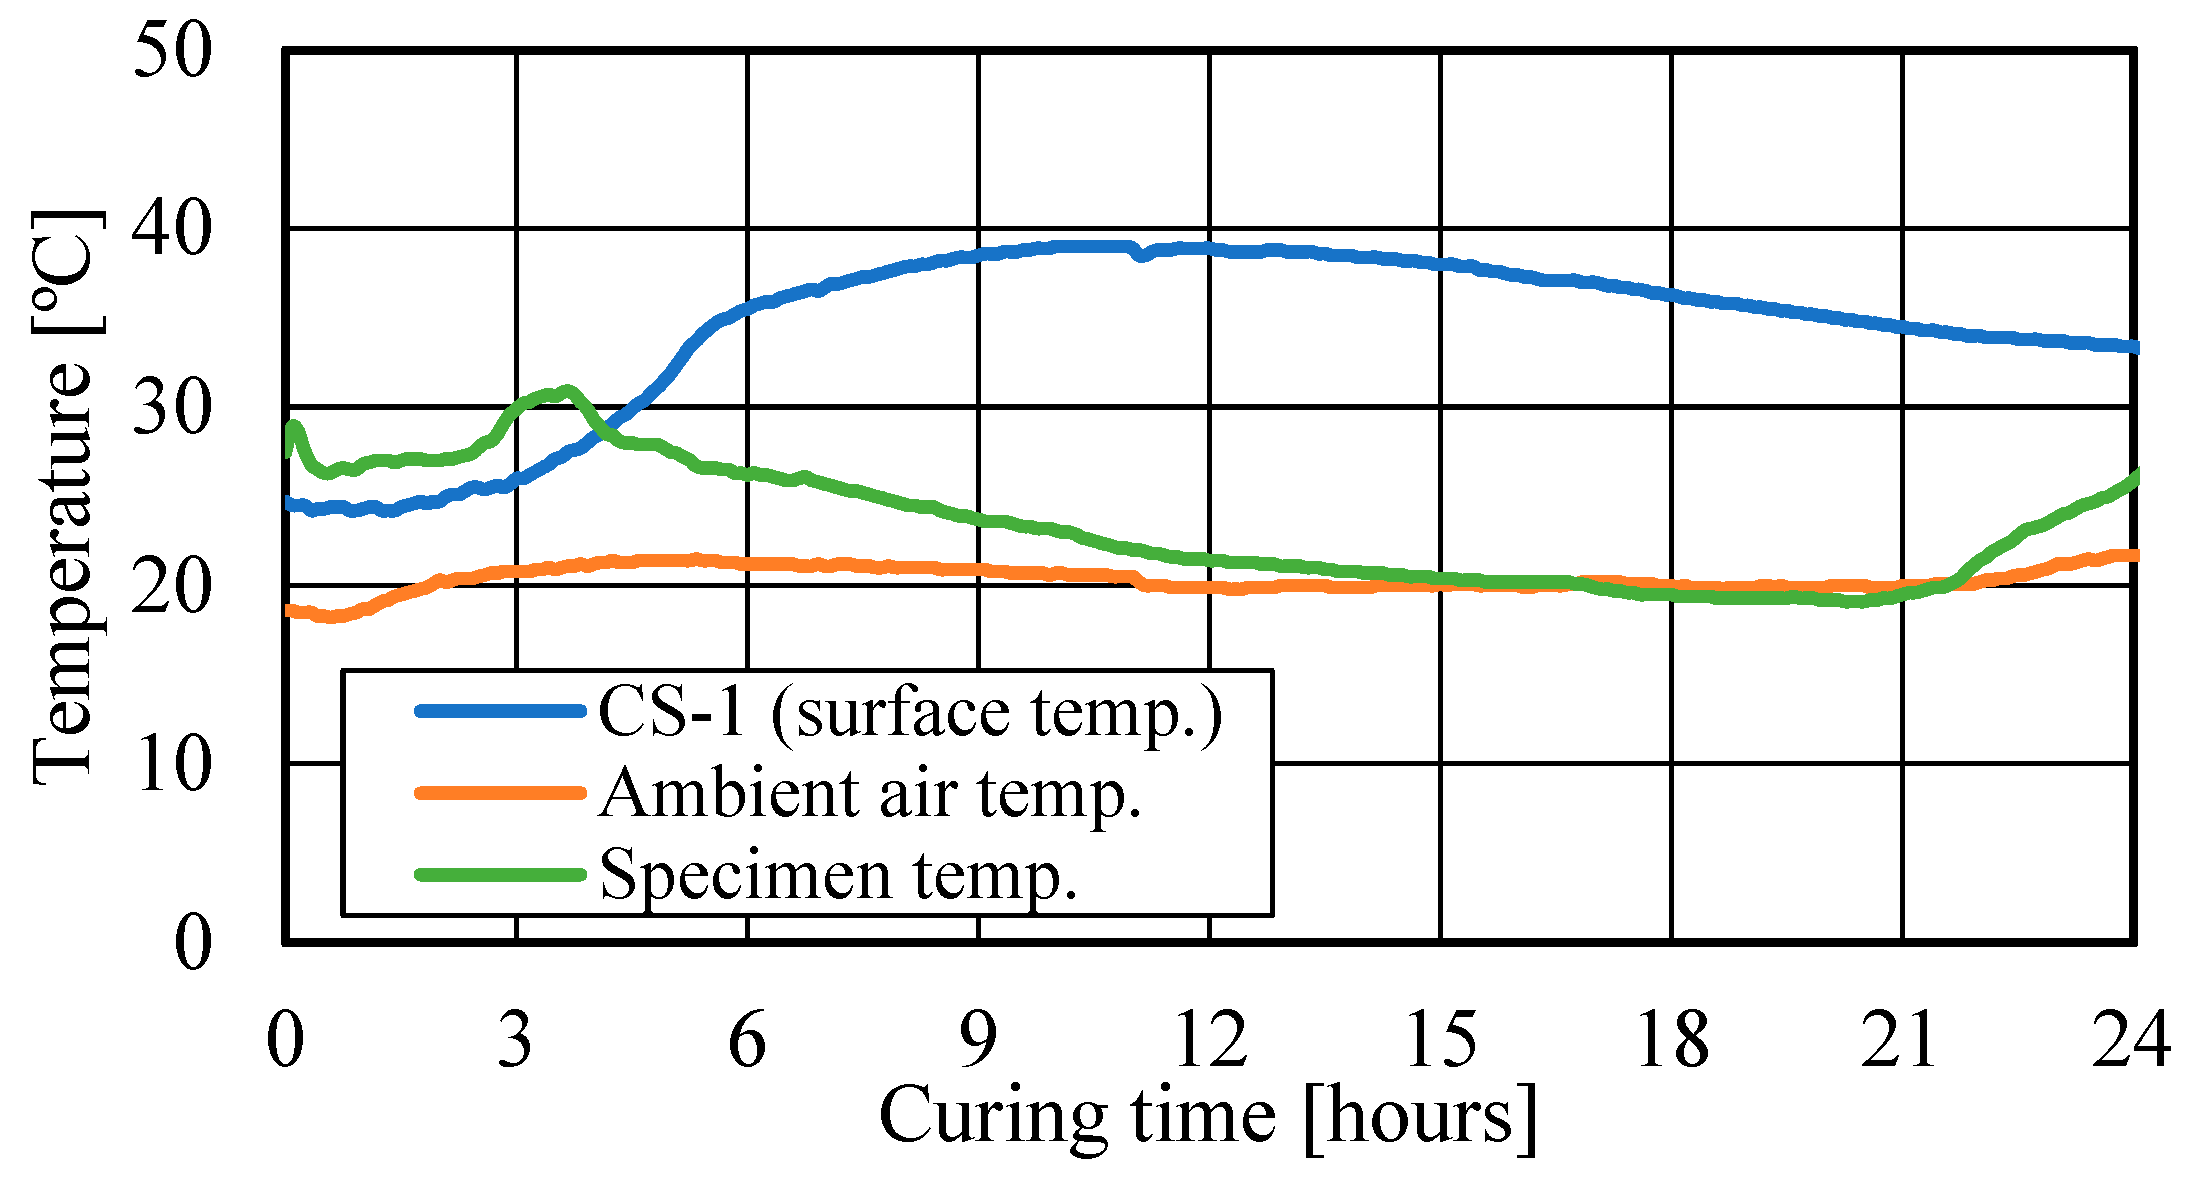
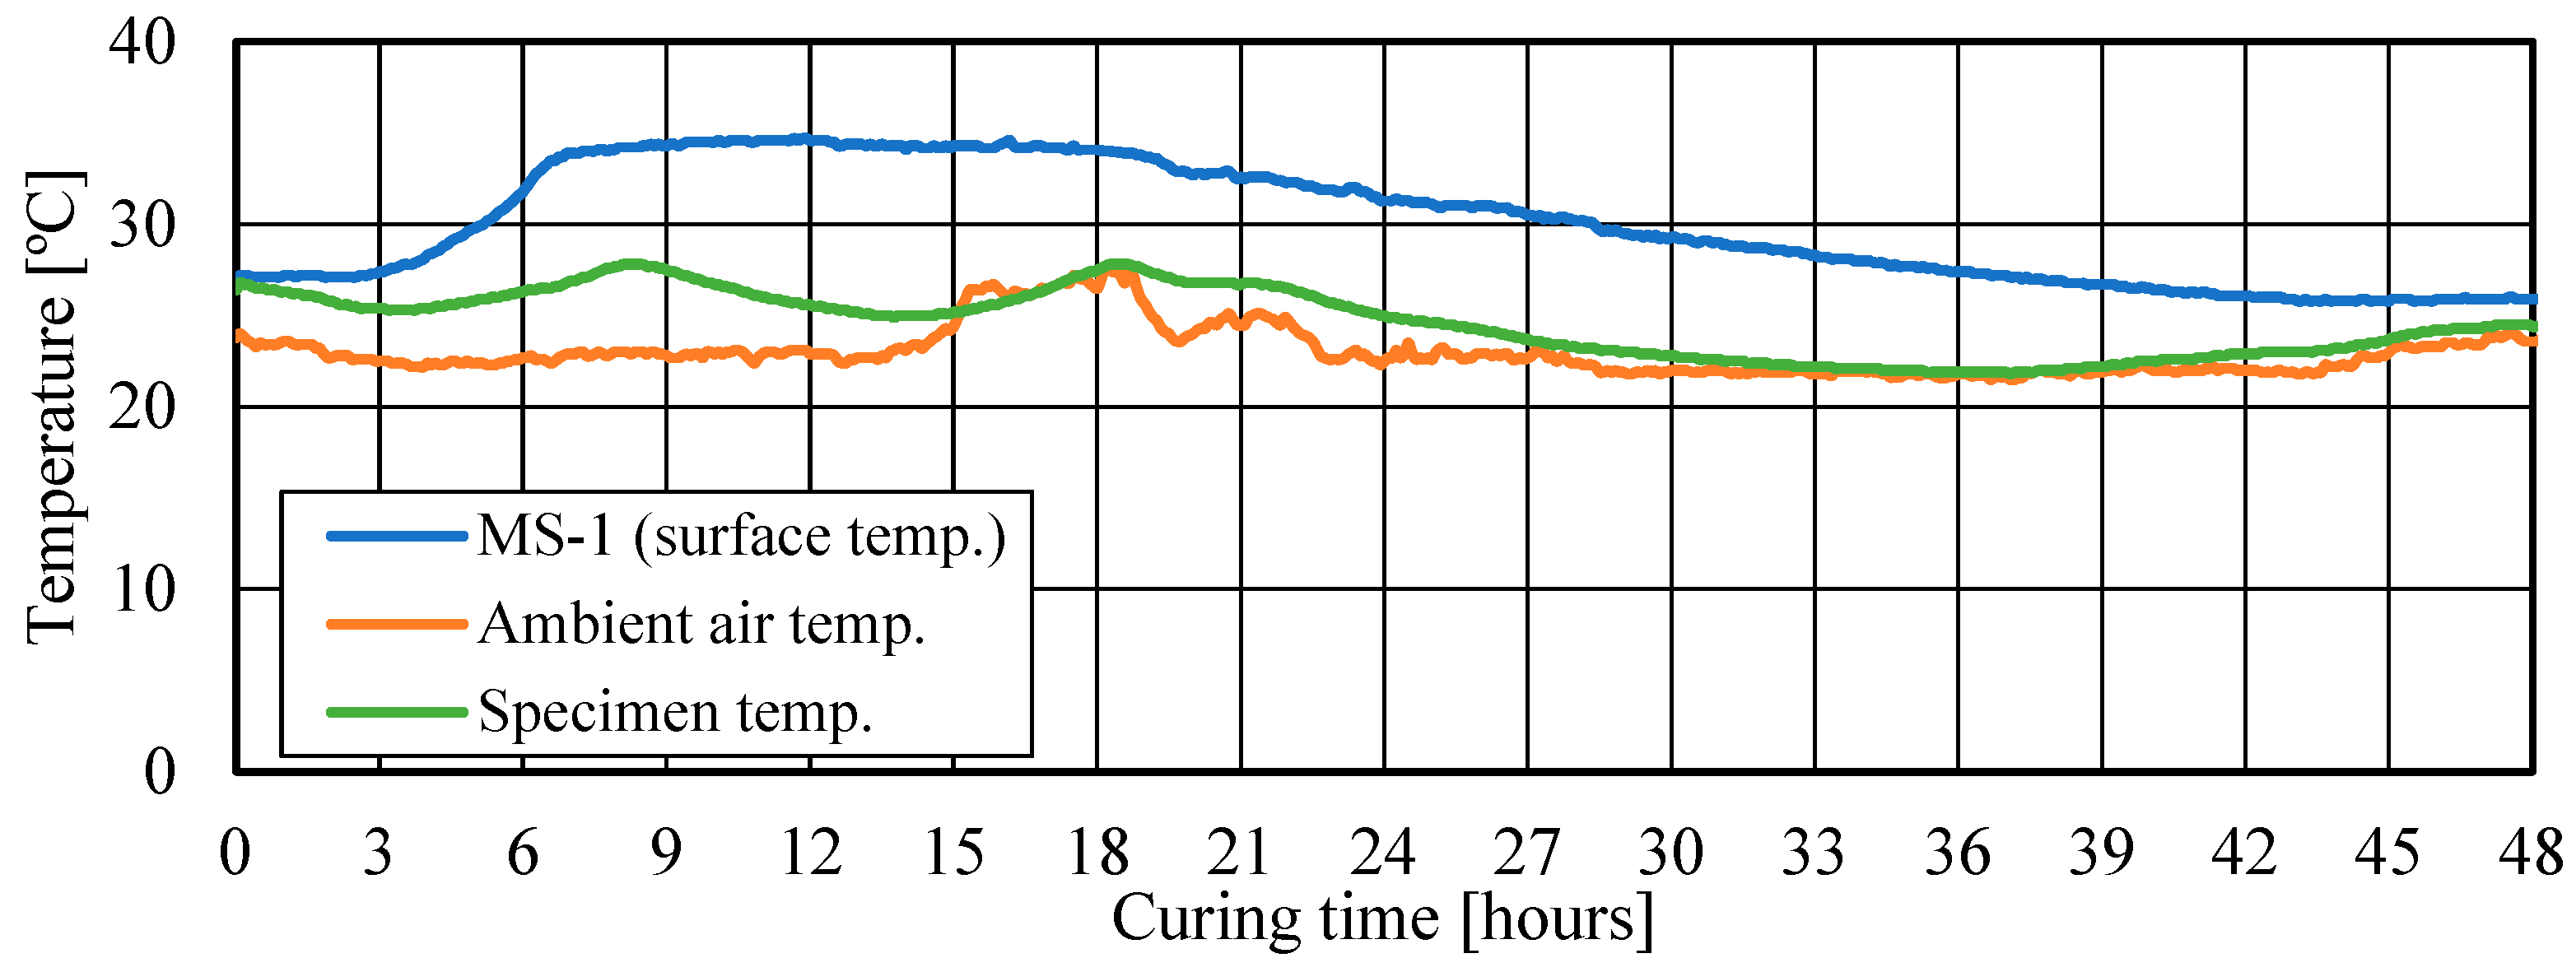
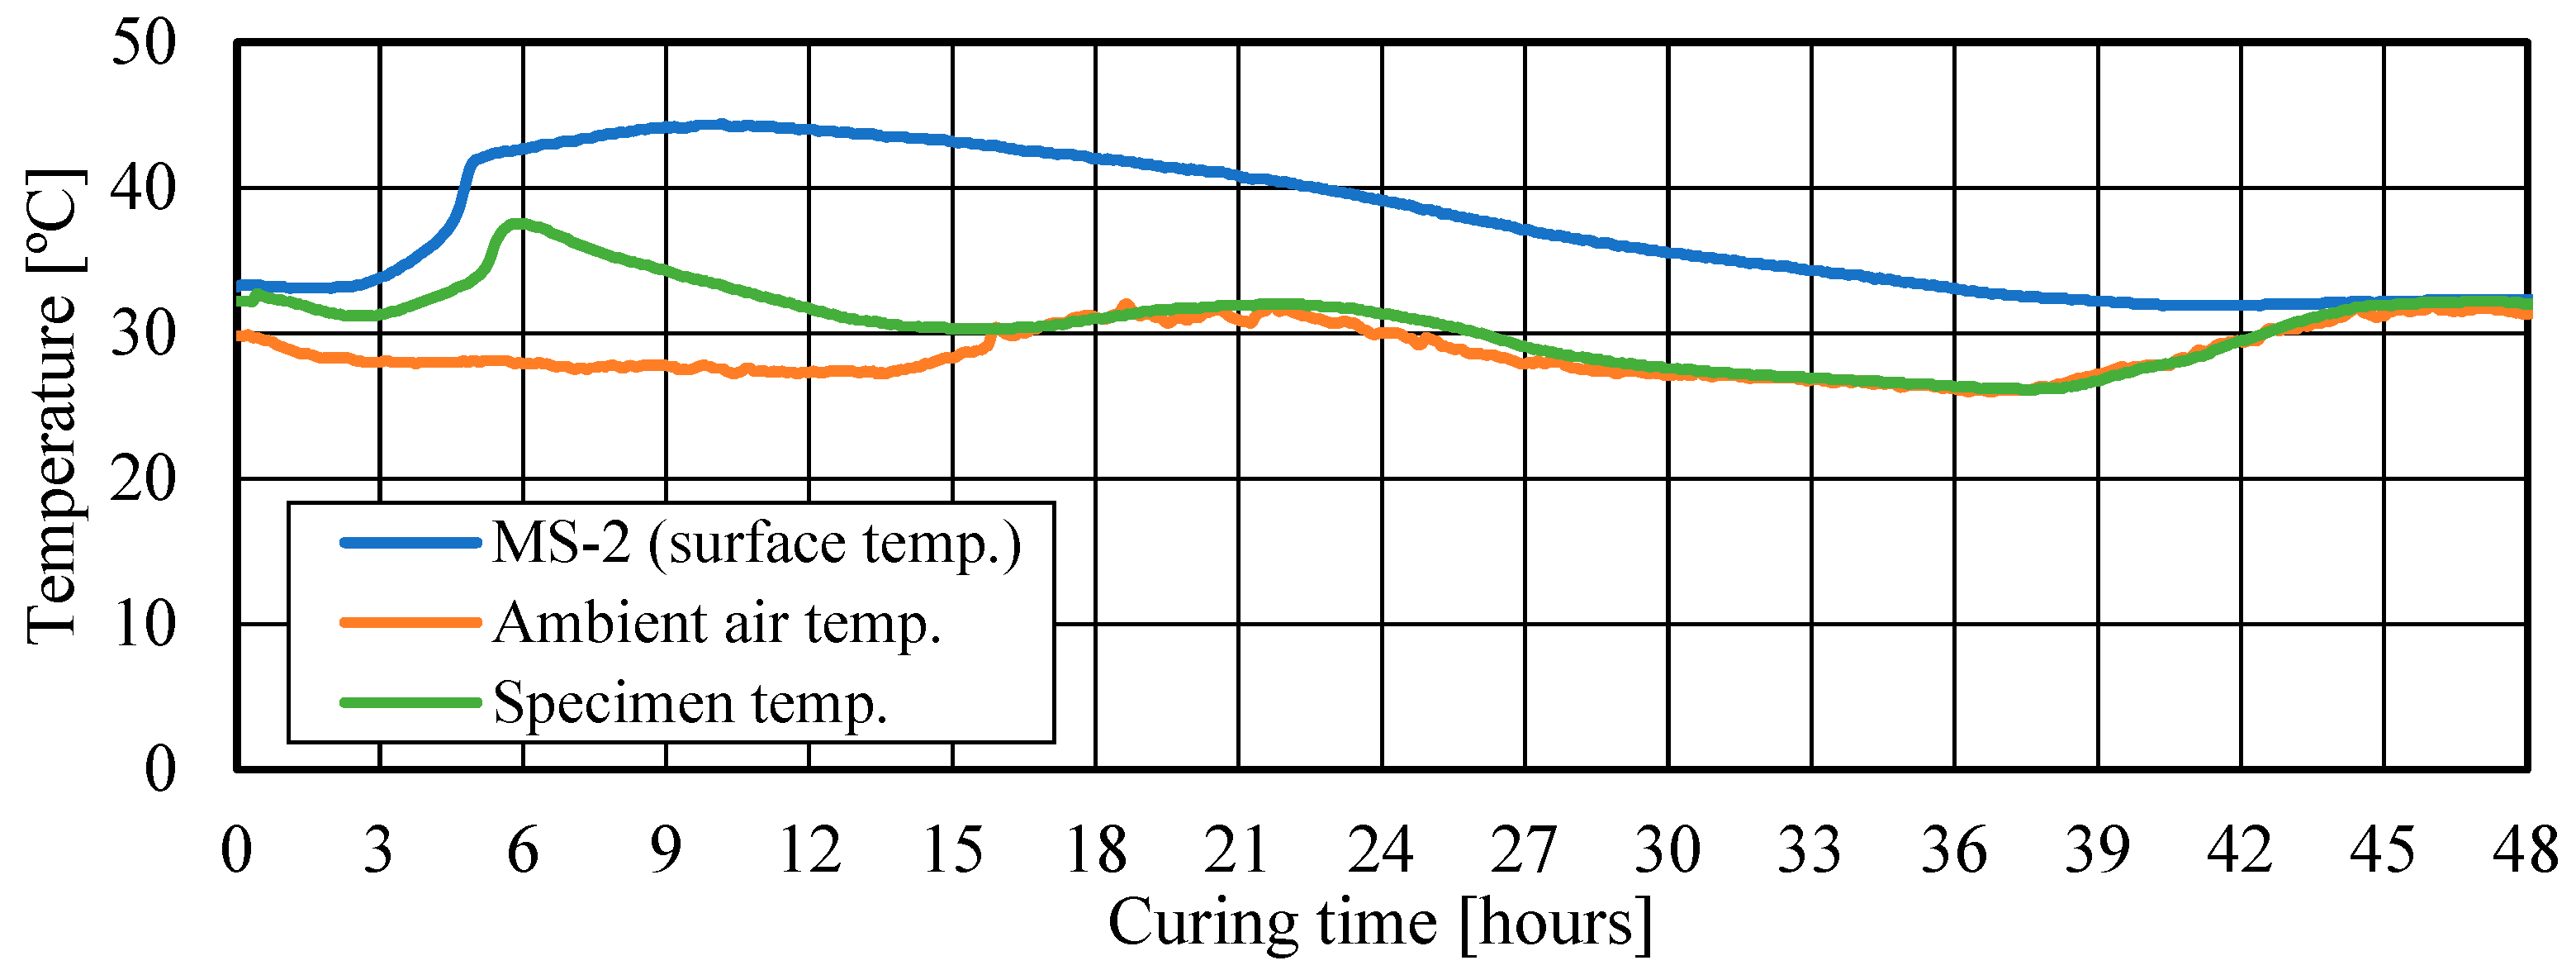
3.1. Temperature Difference between Site Concrete and Specimens

Figure 10, Figure 11, Figure 12 and Figure 13 show the temperature histories of the construction site and mock-up specimens. The temperature measured from the site or mock-up specimen concrete gives the highest temperature profiles, and their temperatures slightly decreased to ambient air temperature. The cylindrical specimens were cured at the same ambient air temperature as mock-up molds and construction sites. However, the highest temperature profile occurred within the first 8 h and then decreased to ambient air temperature. In general, cylindrical specimens’ temperatures depend on the ambient air temperature. Therefore, it is confirmed that even if the ambient air temperature is the same, the actual construction site concrete temperature is higher than the temperature of site-cured specimens.

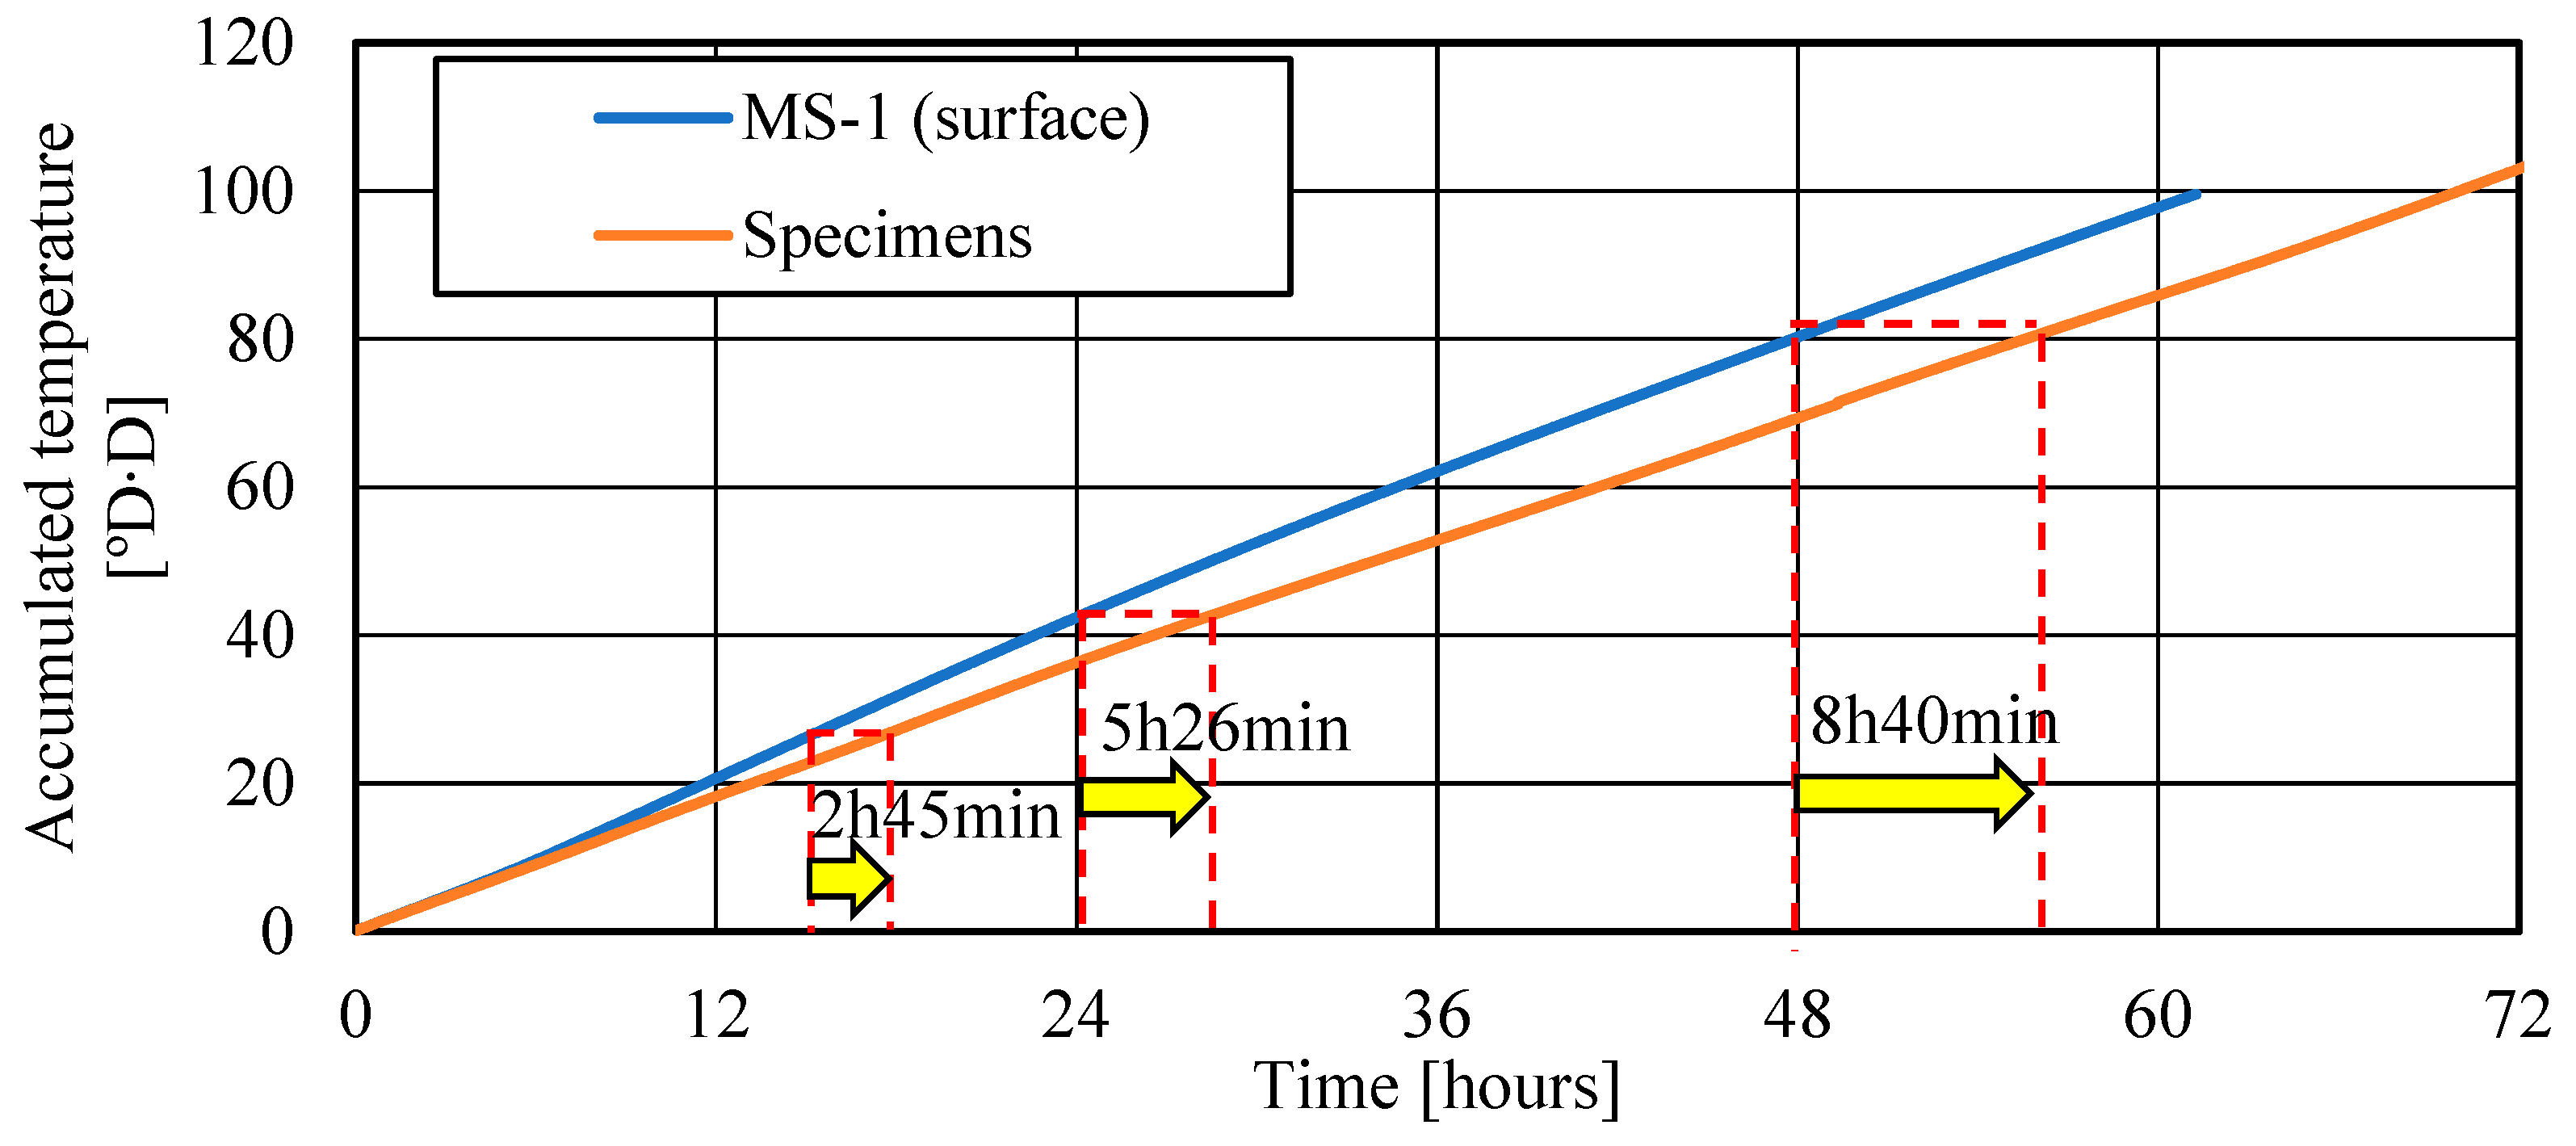
3.2. Accumulated Temperature and Strength Delaying Time

As defined by [38], the concrete of the same mix at the same maturity has approximately the same strength, whatever combination of temperature and time that leads to maturity. Therefore, the strength delaying time was determined based on the time to reach the same accumulated temperature for all series. For instance, Figure 14 shows the accumulated temperature and curing time for MS-1. As shown in this figure, the accumulated temperature of the mock-up specimens (MS-1) is 27.5 °D∙D, 43.5 °D∙D, and 81.2 °D∙D after 15 h, 24 h, and 48 h, respectively. However, cylindrical specimens obtained the same accumulated temperature after 17 h 45 min, 29 h 26 min, and 56 h 40 min. Therefore, the strength delaying time is 2 h 45 min, 5 h 26 min, and 8 h 40 min for the cylindrical specimens. It confirms that the on-site cured specimens are not suitable to evaluate the actual compressive strength of concrete at the construction site, and the direct measurement method is important to determine the pre-curing time, especially in cold weather conditions.

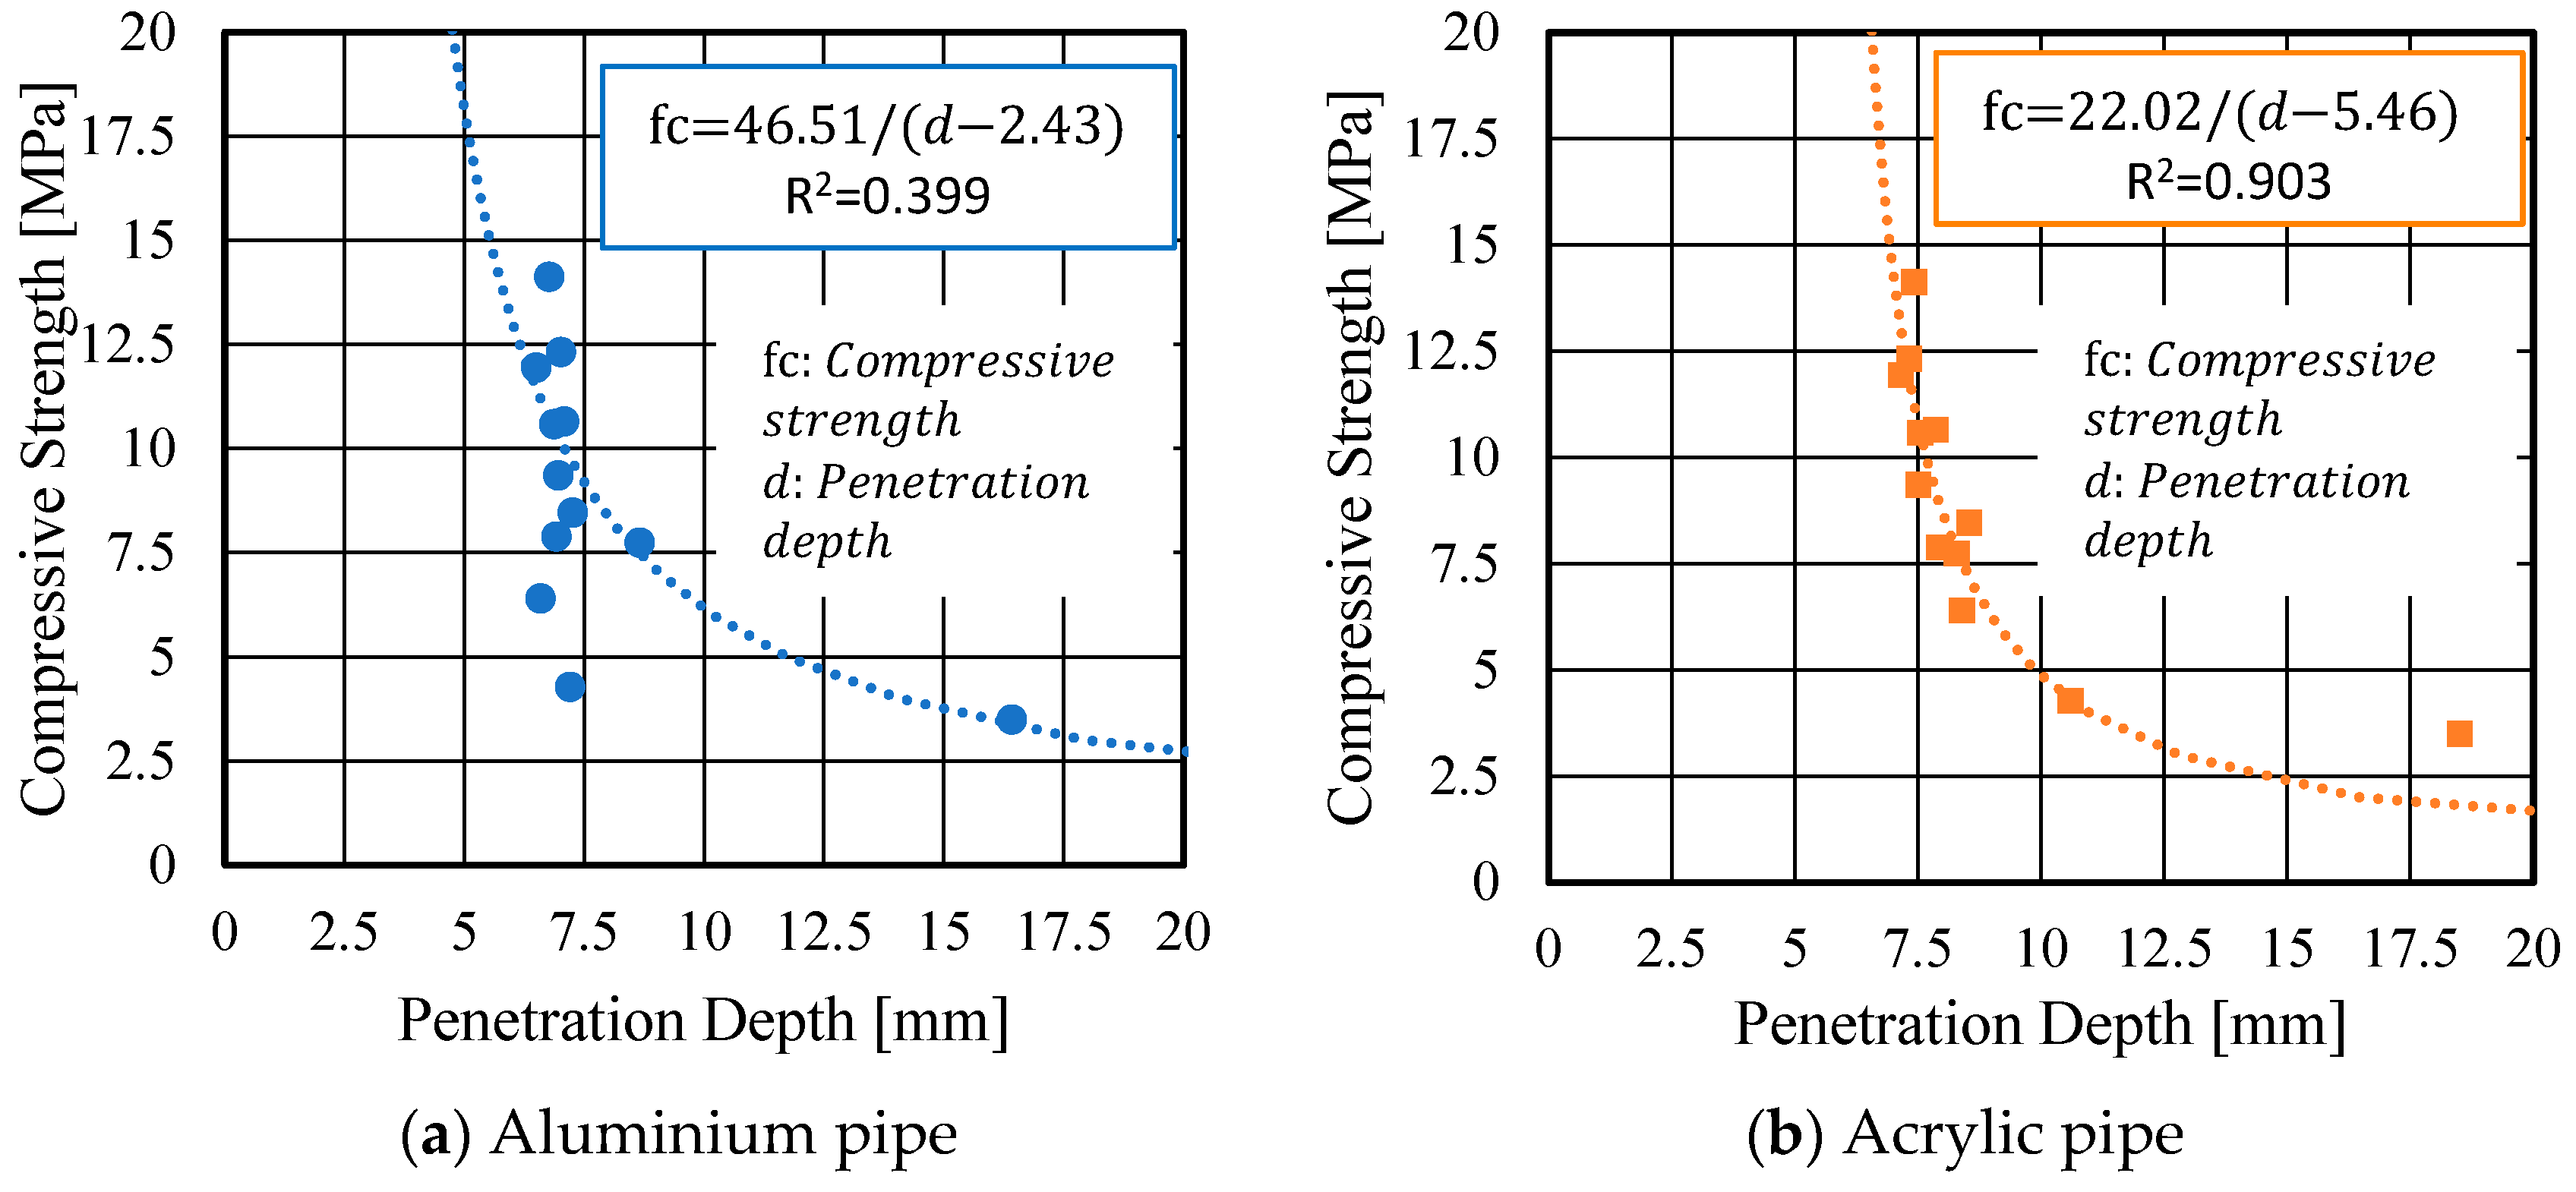
3.3. Relationship between Compressive Strength and Penetration Depth

The relationship between the penetration depth d and compressive strength is shown in Figure 15. In the case of Al pipe (Figure 15a), the same depth of penetration is measured even when the strength is increased. Al pipes are stronger than Ac pipes, which are difficult to expand when the pin penetrates into the cement mortar filled in Al pipes. This is the reason why Al pipe gives the same penetration depth even when the strength is different. Therefore, it is not suitable to use strong materials for pipe because concrete-filled steel pipe structures have high bearing capacity and strong deformation ability [39,40]. In the case of Ac pipe (Figure 15b), the depth of penetration tends to decrease exponentially as the compressive strength increases. When the compressive strength is less than 5 MPa, the depth of penetration shows significant variation. However, the obtained result was different from the previous curve, which was determined in laboratory experiments [35]. The compressive strength range that can be estimated by the proposed method in this study is set from 3 MPa to 15 MPa. A regression curve is set up to obtain the strength estimation equation using the measurement points within this strength range. Here, based on the graph shown in Figure 16, we use the inverse proportionality equation shown in Equation (2) below.
f c = s d t
where,
fc: compressive strength [MPa];
d: corrected penetration depth [mm];
s,t: experimental constant.
The correlation between the compressive strength fc and the penetration depth d is determined from the least squares method as in the following Equations (3) and (4). The coefficients of determination of R2 are R2Al = 0.399 and R2Ac = 0.903. It can be confirmed that acrylic pipe shows a higher correlation. Therefore, the result from the acrylic pipe is used to determine early-age compressive strength before demolding.
f c = 46.51 d A l 2.43
f c = 22.02 d A c 5.46
where
dAl: corrected penetration depth of aluminum pipe [mm];
dAc: corrected penetration depth of acrylic [mm].
Finally, a reference value of the penetration depth is determined with sufficient certainty that the strength required before demolding or preventing early-age freezing has been obtained from the depth of penetration d i obtained in one penetration test and the corresponding compressive strength f c i . The corresponding experimental constant s i in Equation (2) is calculated by the following Equation (5).
s i = d i d × f c i
Here, d is the pin penetration depth for the acrylic pipe. s i is assumed to follow a normal distribution, the mean value s of s i is calculated by Equation (6), and the standard error S E s i is calculated by Equation (7) for the acrylic pipes.
s ¯ = i = 1 n s i n
S E s i = 1 n 1 i = 1 n ( s i s ¯ ) 2 n
The 99% confidence interval when considering the distribution of the experimental constant s i is expressed by the following Equations (8) and (9). s m a x and s m i n are calculated for the acrylic pipe.
s m a x = s ¯ + 3 S E s i
s m i n = s ¯ 3 S E s i
Substituting s m a x and s m i n into Equation (2) yields the estimated intensity intervals. These equations are expressed in Equations (10) and (11).
f c m a x = 31.24 d s 5.46
f c m i n = 12.81 d s 5.46
Here,
fcmax: estimated upper strength of acrylic pipe [MPa];
fcmin: estimated lower strength of acrylic pipe [MPa].
These estimated intervals are indicated by the dashed lines in Figure 16, confirming that it is possible to estimate the early-age compressive strength from the depth of penetration obtained. The standard error of S E is 3.07 . Considering the respective estimated strength intervals, the penetration depths that ensure the development of the early-age strength required before demolding are shown in Table 5. Figure 16 shows these values for the relationship between penetration depth and compressive strength. If the penetration depth is less than these values, it confirms that the minimum required strength before demolding is achieved.
However, fewer values were obtained at lower strength levels due to higher strength development during testing. Therefore, it is necessary to conduct more experiments to obtain more data at a low strength level in the future, although we were able to propose reference values.

3.4. Surface Condition of Concrete after Demolding

The condition of the surface of the structure after demolding is shown in Figure 17. As shown in these figures, the test hole marks after demolding are small, with acceptable unevenness. It is considered possible to repair these test marks easily without damaging the structural frame. Additionally, when installing finishing materials or insulation, these marks can be covered without any special treatment.

4. Conclusions

In this study, the pin penetration test method was investigated to determine the early-age compressive strength at the actual construction site before demolding. The mock-up specimens were prepared to determine the relationship between penetration depth and compressive strength. The findings of this study are described below.
  • It is confirmed that the pin penetration test method is suitable to measure the early-age compressive strength before demolding at actual construction site.
  • The relationship between pin penetration depth and compressive strength of concrete was determined at actual construction site using the mock-up specimens. The obtained results were different from the existing curves obtained in laboratory experiments.
  • The strength development of specimens was significantly delayed compared to mock-up specimens even when specimens were cured at same ambient air temperatures. Therefore, it confirms that the pin penetration test method is important to determine early-age compressive strength before demolding at actual construction site.
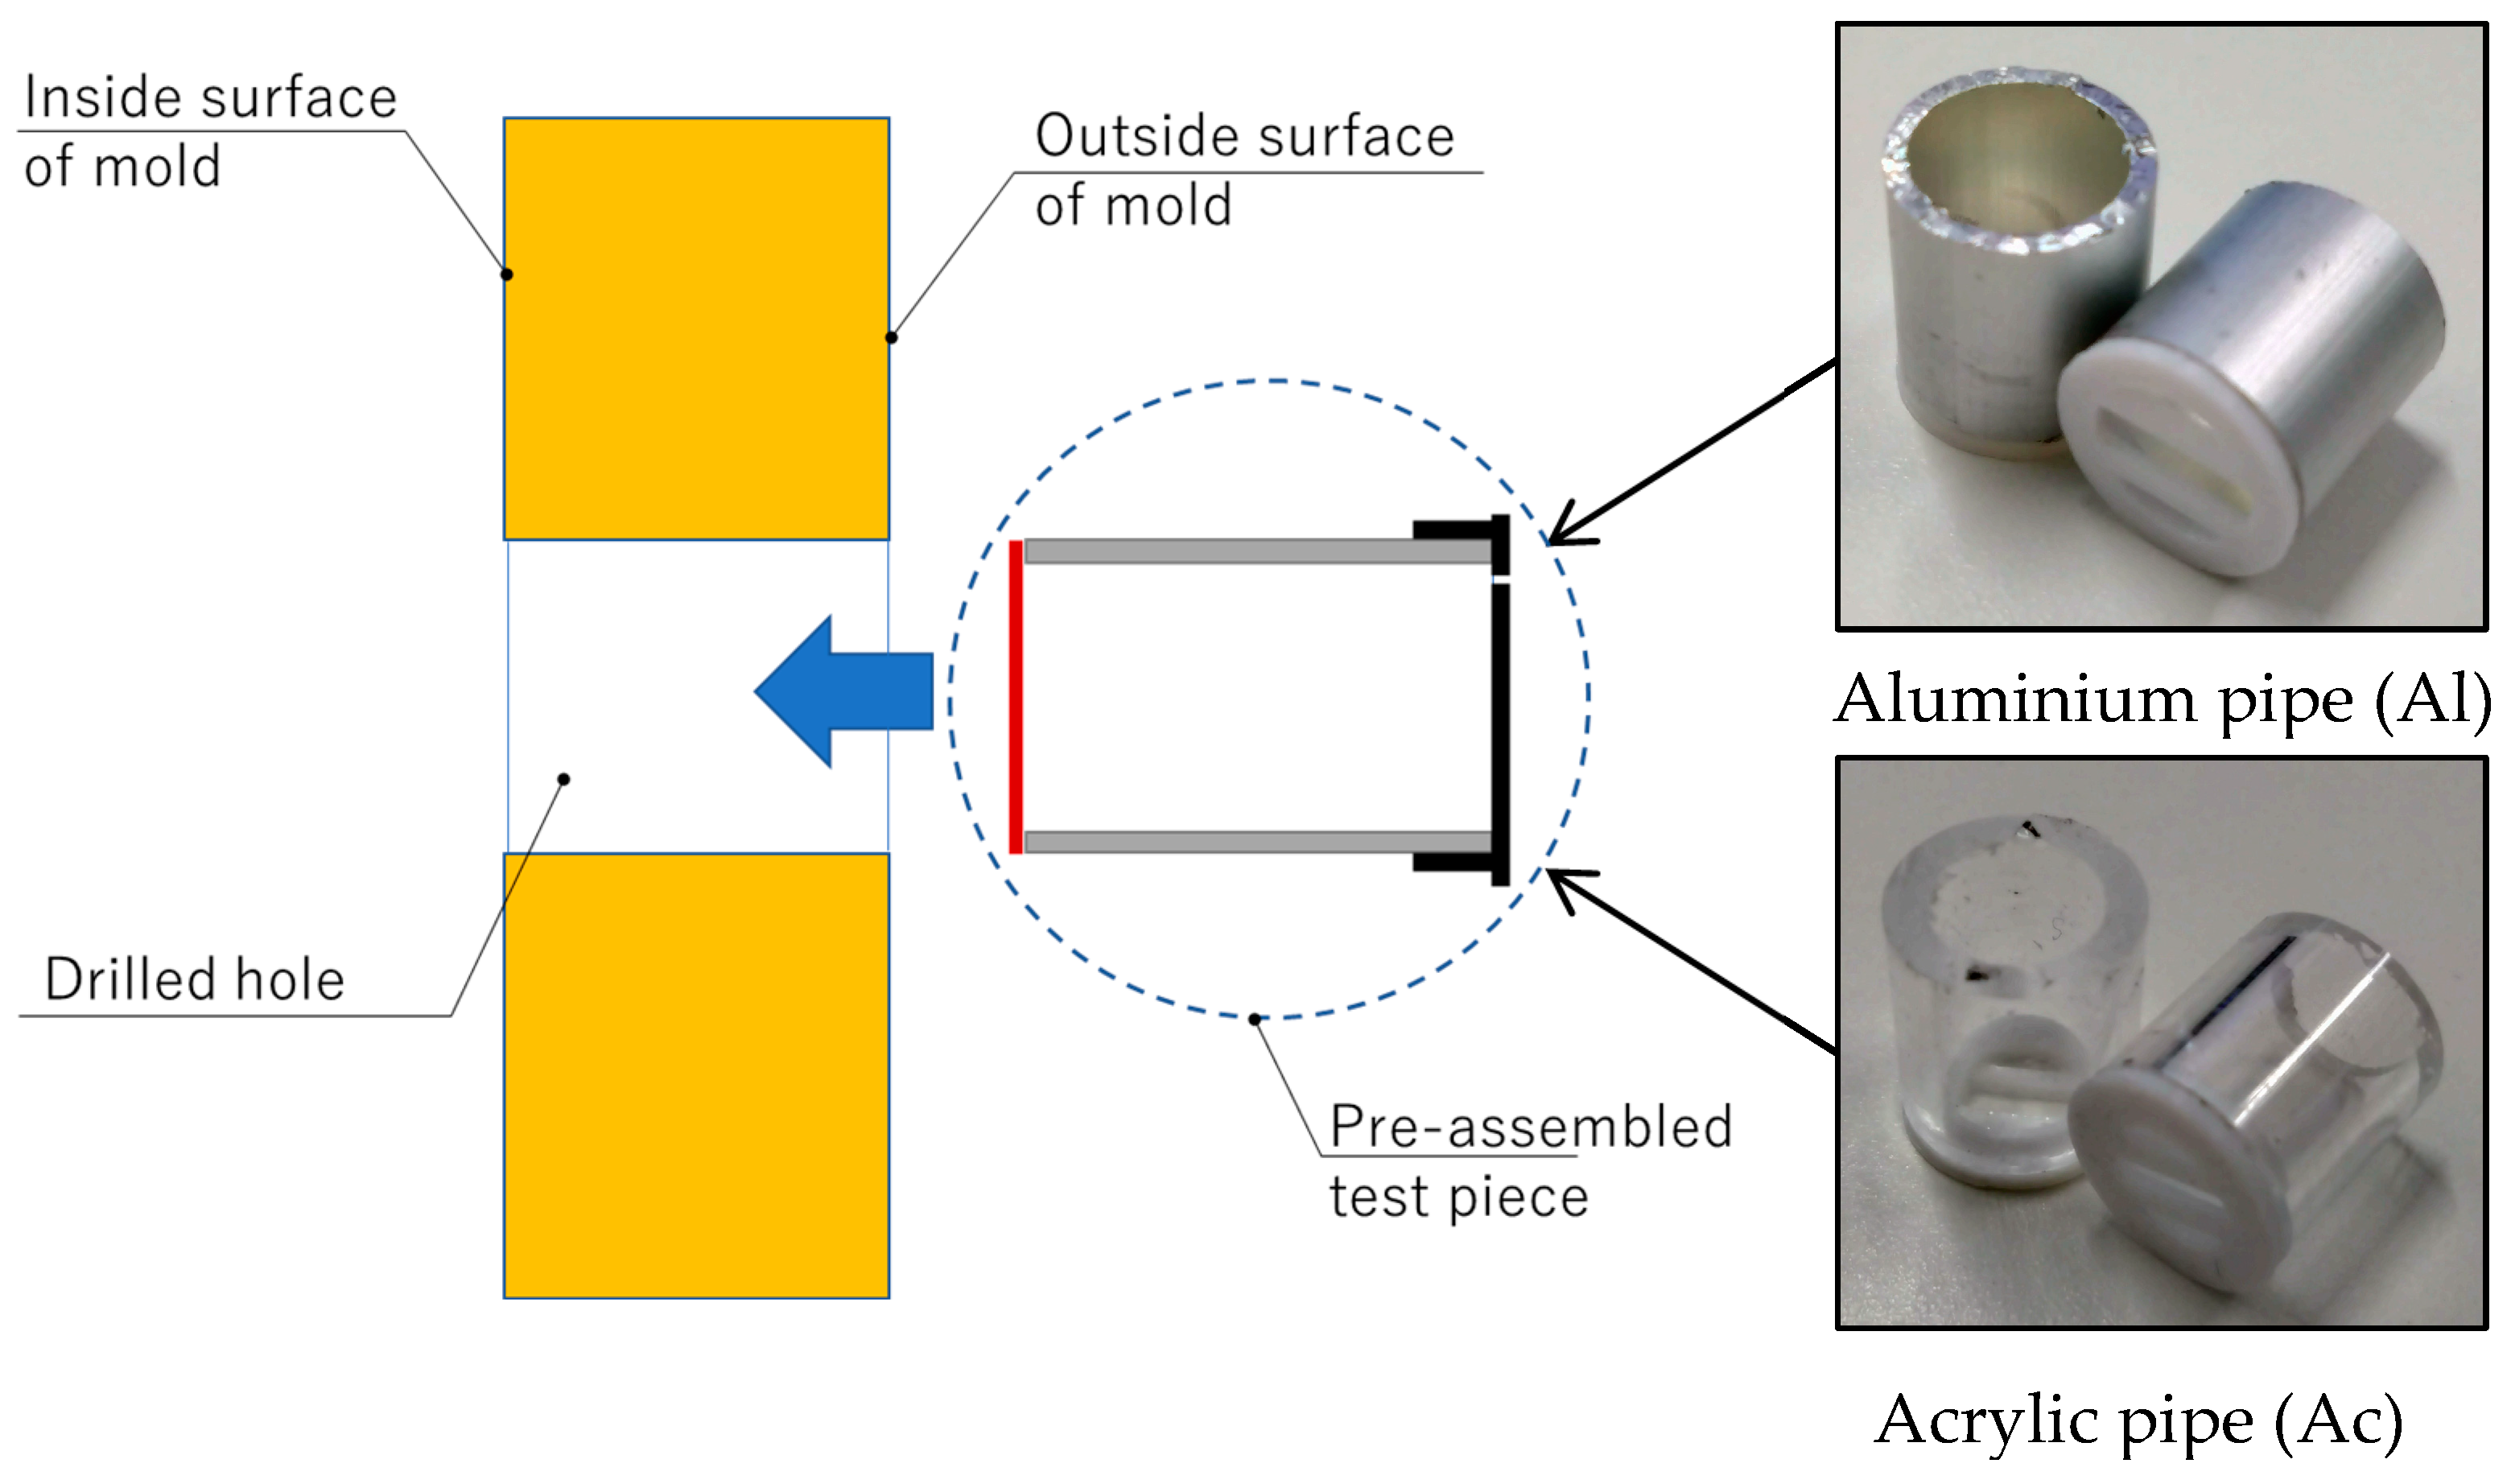
  • The relationship between pin penetration depth and compressive strength gives higher correlation when using the acrylic pipes. However, the compressive strength range that can be estimated by the proposed method in this study was from 3 MPa to 15 MPa.
  • It is confirmed that when the compressive strengths are greater than 5 MPa and 10 MPa, the penetration depths are smaller than 8.0 mm and 6.7 mm, respectively.

Author Contributions

Conceptualization, B.N. and T.N.; methodology, B.N. and T.N.; validation, Y.D. and T.N.; formal analysis, B.N. and F.T.; investigation, B.N., F.T., K.K., T.L., A.J. and F.D.; data curation, B.N. and F.T.; writing—original draft preparation, B.N.; writing—review and editing, T.N., Y.D., F.T., K.K., T.L., A.J. and F.D.; visualization, B.N.; supervision, T.N.; project administration, T.N. All authors have read and agreed to the published version of the manuscript.

Funding

This research received no external funding.

Data Availability Statement

The original contributions presented in the study are included in the article, further inquiries can be directed to the corresponding author.

Acknowledgments

We would like to express our gratitude to Sumitomo Mitsui Construction Co., Ltd., for their great support and for allowing us to conduct experiments at their construction site. We also appreciate the support provided by Taihaku Corporation and the Sendai Concrete Testing Center in the preparation and execution of the mock-up specimens.

Conflicts of Interest

The authors declare no conflicts of interest.

References

  1. Narantogtokh, B.; Nishiwaki, T.; Pushpalal, D.; Taniguchi, M. Influence of pre-curing period at sub-zero temperature (−20 °C) on the compressive strength of concrete. Cem. Sci. Concr. Technol. 2022, 76, 379–385. [Google Scholar] [CrossRef]
  2. Japanese Architectural Standard Specification JASS 5 Reinforced Concrete Work; Architectural Institute of Japan: Tokyo, Japan, 2018. (In Japanese)
  3. Recommendation for Practice of Cold Weather Concreting; Architectural Institute of Japan: Tokyo, Japan, 2010. (In Japanese)
  4. RILEM. RILEM Recommendations for Concreting in Cold Weather; VTT Technical Research Centre of Finland: Espoo, Finland, 1988. [Google Scholar]
  5. Revilla-Cuesta, V.; Ortega-Lopez, V.; Faleschini, F.; Espinosa, A.B.; Serrano-Lopez, R. Hammer rebound index as an overall-mechanical-quality indicator of self-compacting concrete containing recycled concrete aggregate. Constr. Build. Mater. 2022, 347, 128549. [Google Scholar] [CrossRef]
  6. Szilágyi, K.; Borosnyói, A.; Zsigovics, I. Extensive statistical analysis of the variability of concrete rebound hardness based on a large database of 60 years experience. Constr. Build. Mater. 2014, 53, 333–347. [Google Scholar] [CrossRef]
  7. Kumavat, N.R.; Chandak, N.R.; Patil, I.T. Factors influencing the performance of rebound hammer used for non-destructive testing of concrete members: A review. Case Stud. Constr. Mater. 2021, 14, e00491. [Google Scholar] [CrossRef]
  8. Odimegwu, T.C.; Amrul Kaish, A.B.M.; Zakaria, I.; Abood, M.M.; Jamil, M.; Ngozi, K.O. Nondestructive determination of strength of concrete incorporating industrial wastes as partial replacement for fine aggregate. Sensors 2021, 21, 8256. [Google Scholar] [CrossRef] [PubMed]
  9. Mata, R.; Ruiz, R.O.; Nunez, E. Correlation between compressive strength of concrete and ultrasonic pulse velocity: A case of study and a new correlation method. Constr. Build. Mater. 2023, 369, 130569. [Google Scholar] [CrossRef]
  10. Bogas, J.A.; Gomes, M.G.; Gomes, A. Compressive strength evaluation of structural lightweight concrete by non-destructive ultrasonic pulse velocity method. Ultrasonics 2013, 53, 962–972. [Google Scholar] [CrossRef] [PubMed]
  11. Andrade, M.; Lopes, A.; Júnior, M.; Cristina, G. Ultrasonic testing on evaluation of concrete residual compressive strength: A review. Constr. Build. Mater. 2023, 373, 130887. [Google Scholar] [CrossRef]
  12. Moreira, R.; Gondim, L.; Haach, V.G. Monitoring of ultrasonic velocity in concrete specimens during compressive loading-unloading cycles. Constr. Build. Mater. 2021, 302, 124218. [Google Scholar] [CrossRef]
  13. Liang, M.T.; Wu, J. Theoretical elucidation on the empirical formulae for the ultrasonic testing method for concrete structures. Cem. Concr. Res. 2002, 32, 1763–1769. [Google Scholar] [CrossRef]
  14. Lencis, U.; Udris, A.; Korjakins, A. Frost influence on the ultrasonic pulse velocity in concrete at early phases of hydration process. Case Stud. Constr. Mater. 2021, 15, e00614. [Google Scholar] [CrossRef]
  15. Solis-Carcaňo, R.; Moreno, E.I. Evaluation of concrete made with crushed limestone aggregate based on ultrasonic pulse velocity. Constr. Build. Mater. 2008, 22, 1225–1231. [Google Scholar] [CrossRef]
  16. Ali-benyahia, K.; Kenai, S.; Ghrici, M.; Sbartaï, Z. Analysis of the accuracy of in-situ concrete characteristic compressive strength assessment in real structures using destructive and non-destructive testing methods. Constr. Build. Mater. 2023, 366, 130161. [Google Scholar] [CrossRef]
  17. Hobbs, B.; Kebir, M.T. Non-destructive testing techniques for the forensic engineering investigation of reinforced concrete buildings. Forensic. Sci. Intern. 2007, 167, 167–172. [Google Scholar] [CrossRef] [PubMed]
  18. Poorarbabi, A.; Ghasemi, M.; Moghaddam, M.A. Concrete compressive strength prediction using non-destructive tests through response surface methodology. Ain Shams Eng. J. 2020, 11, 939–949. [Google Scholar] [CrossRef]
  19. Helal, J.; Sofi, M.; Mendis, P. Non-destructive testing of concrete: A review of methods. Elect. J. Struc. Eng. 2015, 14, 97–105. [Google Scholar] [CrossRef]
  20. JIS A 1155; Method for Measuring the Degree of Rebound of Concrete. Japanese Standards Association: Tokyo, Japan, 2012. (In Japanese)
  21. ISO 1970-7; Testing of Concrete—Part 7: Non-Destructive Tests on Hardened Concrete. International Organization for Standardization: Geneva, Switzerland, 2004.
  22. Technical Committee on Concrete Strength Estimation; The Society of Materials Science Japan. Guideline for Compressive Strength Estimation of Concrete by Schmidt Hammer (Draft). Mater. Test. 1958, 7, 426–430. (In Japanese) [Google Scholar]
  23. El-Mir, A.; El-Zahab, S.; Sbartaï, Z.M.; Homsi, F.; Saliba, J.; El-Hassan, H. Machine learning prediction of concrete compressive strength using rebound hammer test. J. Build. Eng. 2023, 64, 105538. [Google Scholar] [CrossRef]
  24. Breysse, D.; Martínez-Fernández, J.L. Assessing concrete strength with rebound hammer: Review of key issues and ideas for more reliable conclusions. Mater. Struc. 2014, 47, 1589–1604. [Google Scholar] [CrossRef]
  25. Breysse, D. Nondestructive Evaluation of Concrete Strength: An Historical Review and a New Perspective by Combining NDT Methods. Const. Build. Mater. 2012, 33, 139–163. [Google Scholar] [CrossRef]
  26. Gunes, B.; Karatosun, S.; Gunes, O. Drilling resistance testing combined with SonReb methods for nondestructive estimation of concrete strength. Constr. Build. Mater. 2023, 362, 129700. [Google Scholar] [CrossRef]
  27. Al-sabah, S.; Sourav, S.N.A.; Mcnally, C. The post-installed screw pull-out test: Development of a method for assessing in-situ concrete compressive strength. J. Build. Eng. 2021, 33, 101658. [Google Scholar] [CrossRef]
  28. Maliha, M.; Nishiwaki, T.; Amin, A.F.M.S. A Screening Method for Very-Low-Strength Concrete. ACI Mater. J. 2022, 119. [Google Scholar] [CrossRef]
  29. Nguyen, M.H.; Nakarai, K.; Kubori, Y.; Nishio, S. Validation of simple nondestructive method for evaluation of cover concrete quality. Constr. Build. Mater. 2019, 201, 430–438. [Google Scholar] [CrossRef]
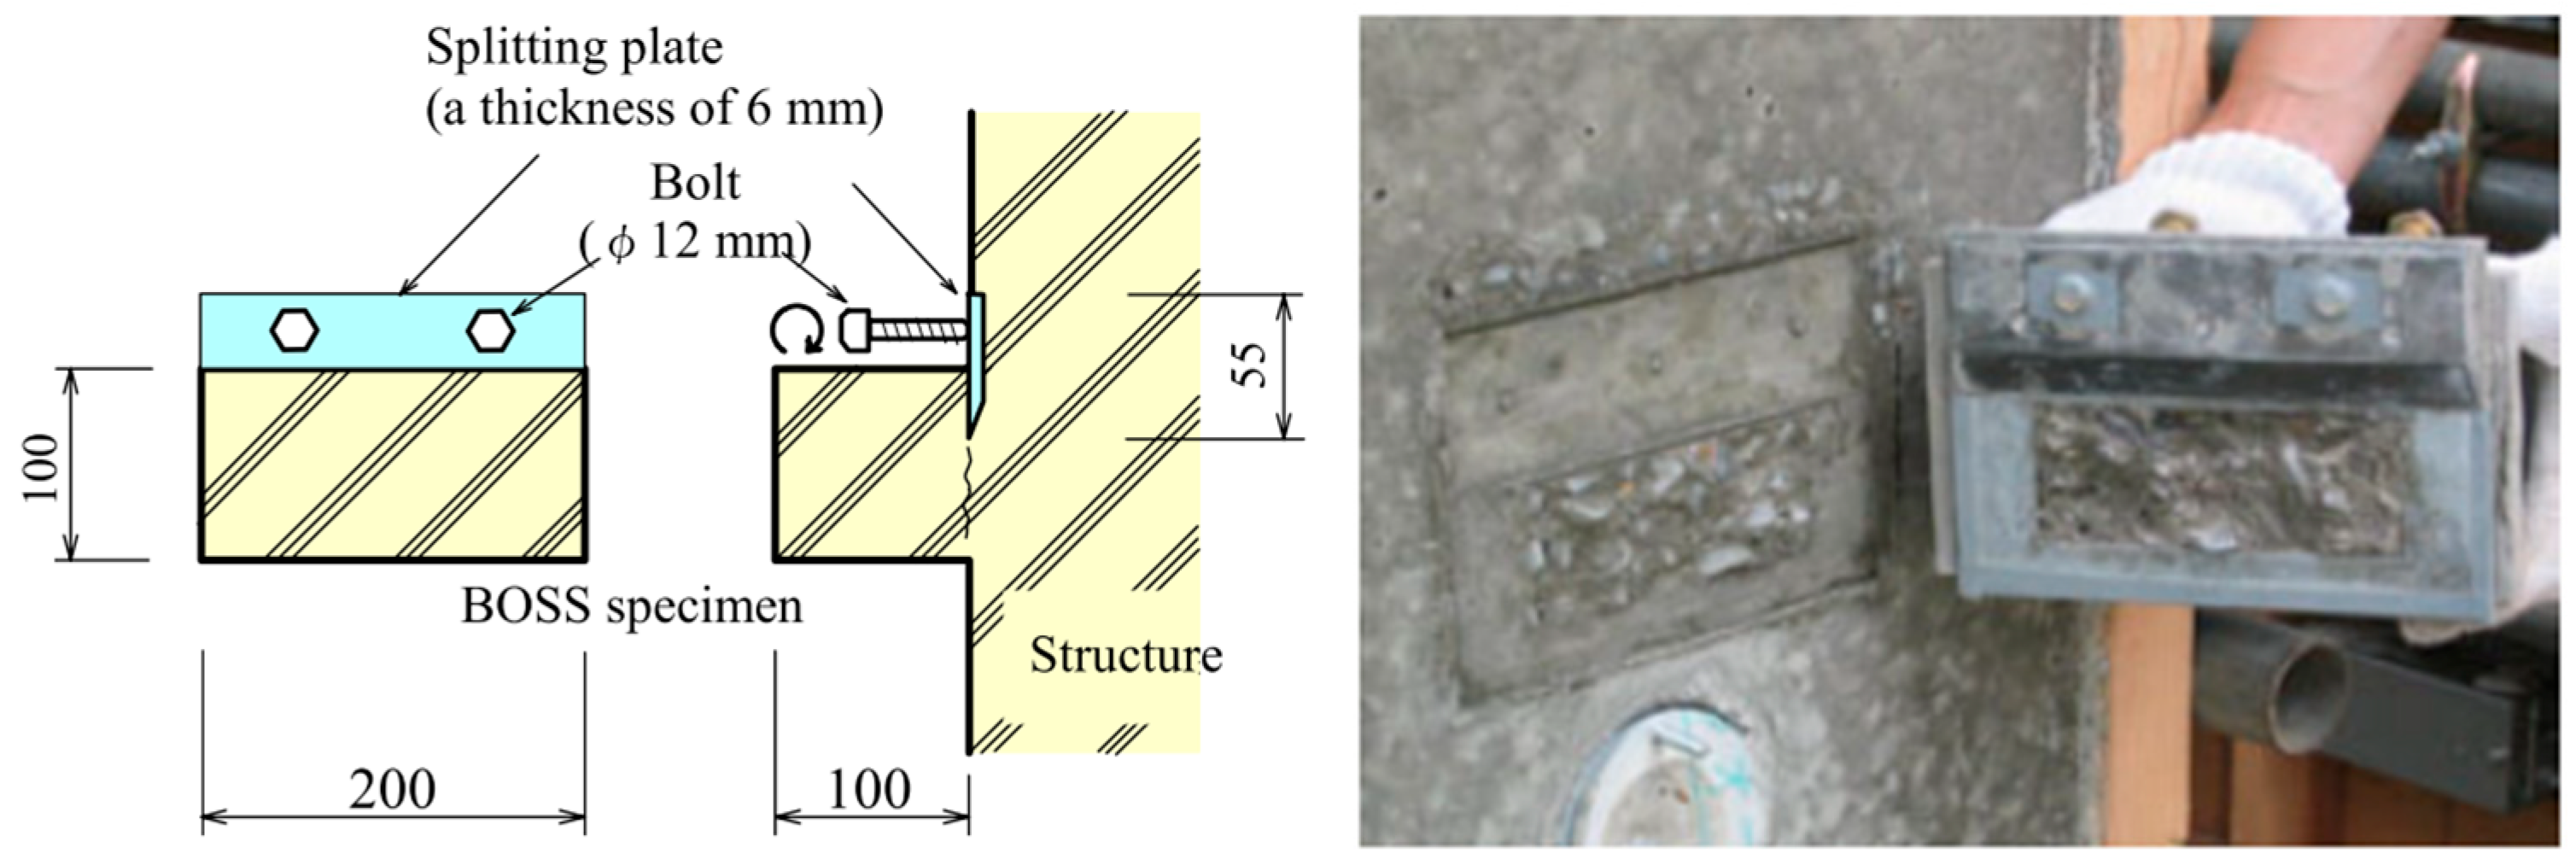
  30. Shinozaki, T.; Fujii, K.; Kemi, T.; Shirayama, K. Estimation of Concrete Strength in Structures by the BOSS Method. J. Advanc. Concr. Technol. 2004, 2, 175–185. [Google Scholar] [CrossRef]
  31. JIS A 1163; Method of Making and Testing for Compressive Strength BOSS Specimens. Japanese Standards Association: Tokyo, Japan, 2020. (In Japanese)
  32. Levent, S.H.; Suleyman, G.; Kamil, K.; Osman, S. A Nondestructive Testing Technique: Nail Penetration Test. ACI Struct. J. 2012, 109, 245–252. [Google Scholar] [CrossRef]
  33. Herrera-Mesena, C.; Salvadorb, R.P.; Cavalaroc, S.H.P.; Aguadoa, A. Effect of gypsum content in sprayed cementitious matrices: Early age hydration and mechanical properties. Cem. Concr. Comp. 2019, 95, 81–91. [Google Scholar] [CrossRef]
  34. Maliha, M.; Nishiwaki, T.; Fujiwara, T.; Minemura, T. In-Place Test Method with Penetration Resistance for Low-Strength Concrete. Proc. Jpn. Concr. Inst. 2020, 42, 1732–1737. [Google Scholar]
  35. Nishiwaki, T.; Takasugi, F.; Narantogtokh, B.; Hara, S.; Maliha, M. A method to estimate the early age compressive strength of concrete before demolding using a pin penetration device. J. Struct. Constr. Eng. 2022, 88, 18–26. (In Japanese) [Google Scholar] [CrossRef]
  36. Noguchi, T. Quality Control System in Curing Concrete Using Small Integrated Circuit for Monitoring Temperature and Attitude on Formworks. JACIC Res. Dev. Rep 2010, 2010. (In Japanese). Available online: https://www.jacic.or.jp/josei/pdf/2010-16.pdf (accessed on 4 July 2024).
  37. ASTM C1074-11; Standard Practice for Estimating Concrete Strength by the Maturity Method. ASTM International: West Conshohocken, PA, USA, 2011.
  38. Popovics, S. Strength and Related Properties of Concrete: A Quantitative Approach; John Wiley & Sons: Hoboken, NJ, USA, 1998; p. 12. [Google Scholar]
  39. Zhou, S.; Sun, Q.; Wu, X. Impact of D/t Ratio on Circular Concrete-Filled High-Strength Steel Tubular Stub Columns under Axial Compression. Thin-Walled Struct. 2018, 132, 461–474. [Google Scholar] [CrossRef]
  40. Chen, H.; Wu, L.; Jiang, H.; Liu, Y. Seismic Performance of Prefabricated Middle Frame Composed of Special-Shaped Columns with Built-in Lattice Concrete-Filled Circular Steel Pipes. Structures 2021, 34, 1443–1457. [Google Scholar] [CrossRef]
Figure 1. Non-destructive testing method. BOSS specimen [30].
Buildings 14 02099 g001
Figure 2. Pin penetration tester.
Buildings 14 02099 g002
Figure 3. Pin penetration test of the mock-up mold before demolding.
Buildings 14 02099 g003
Figure 4. Test hole before inserting the pipe.
Buildings 14 02099 g004
Figure 5. Test piece after inserting the pipe.
Buildings 14 02099 g005
Figure 6. Test hole after concrete casting.
Buildings 14 02099 g006
Figure 7. Outline of experimental work.
Buildings 14 02099 g007
Figure 8. Design of mock-up mold.
Buildings 14 02099 g008
Figure 9. Test holes at mold (a) mock-up mold (b) construction site.
Buildings 14 02099 g009
Figure 10. Temperature history of construction site (CS-1).
Buildings 14 02099 g010
Figure 11. Temperature history of construction site (CS-2).
Buildings 14 02099 g011
Figure 12. Temperature history of mock-up specimens (MS-1).
Buildings 14 02099 g012
Figure 13. Temperature history of mock-up specimens (MS-2).
Buildings 14 02099 g013
Figure 14. Accumulated temperature and curing time (MS-1).
Buildings 14 02099 g014
Figure 15. Relationship between modified penetration depth and compressive strength.
Buildings 14 02099 g015
Figure 16. Pin penetration depth to ensure minimum required strength (Ac pipe).
Buildings 14 02099 g016
Figure 17. Surface of concrete after demolding (a) mock-up specimen (b) construction site.
Buildings 14 02099 g017
Table 1. Pin penetration device specifications.
Device SpecificationValue Range
Measuring range0~35 mm
Measurement accuracy0.1 mm
Dimensions of device50 × 70 × 335 mm
Weight~2 kg
Energy6 J (Nm)
Table 2. Testing schedule.
DeterminationCuring Time
15 h18 h21 h24 h27 h48 h
Mock-up moldAl pipe
Ac pipe
Construction siteAl pipe
Ac pipe
Table 3. Used concrete specifications.
SeriesTesting ConditionNominal Strength
[MPa]
Slump
[cm]
CS-1Construction site
(at ambient air temperature)
3621
CS-23621
MS-1Mock-up specimens
(at ambient air temperature)
2418
MS-23018
Table 4. Mix proportions (kg/m3).
SeriesW/C
[%]
CementWaterFine Aggregate *Coarse AggregateAdmixture
CS-141.0427175598, 1589696.41
CS-241.0427175598, 1589696.41
MS-154.0324175659, 1659903.24
MS-246.5376175626, 1579903.76
* The fine aggregate contains a combination of two different sources.
Table 5. Penetration depth to ensure minimum required compressive strength before demolding.
Compressive Strength
[MPa]
Penetration Depth [mm]
(Acrylic Pipe)
5.0 8.02 (8.0)
10.06.74 (6.7)
Disclaimer/Publisher’s Note: The statements, opinions and data contained in all publications are solely those of the individual author(s) and contributor(s) and not of MDPI and/or the editor(s). MDPI and/or the editor(s) disclaim responsibility for any injury to people or property resulting from any ideas, methods, instructions or products referred to in the content.

