
Relationship between Visual Attention Patterns and Subjective Evaluations in Housing Sales Information: A Study Using Eye-Tracking Technology

Abstract
:1. Introduction
2. Methodology
2.1. Subjects
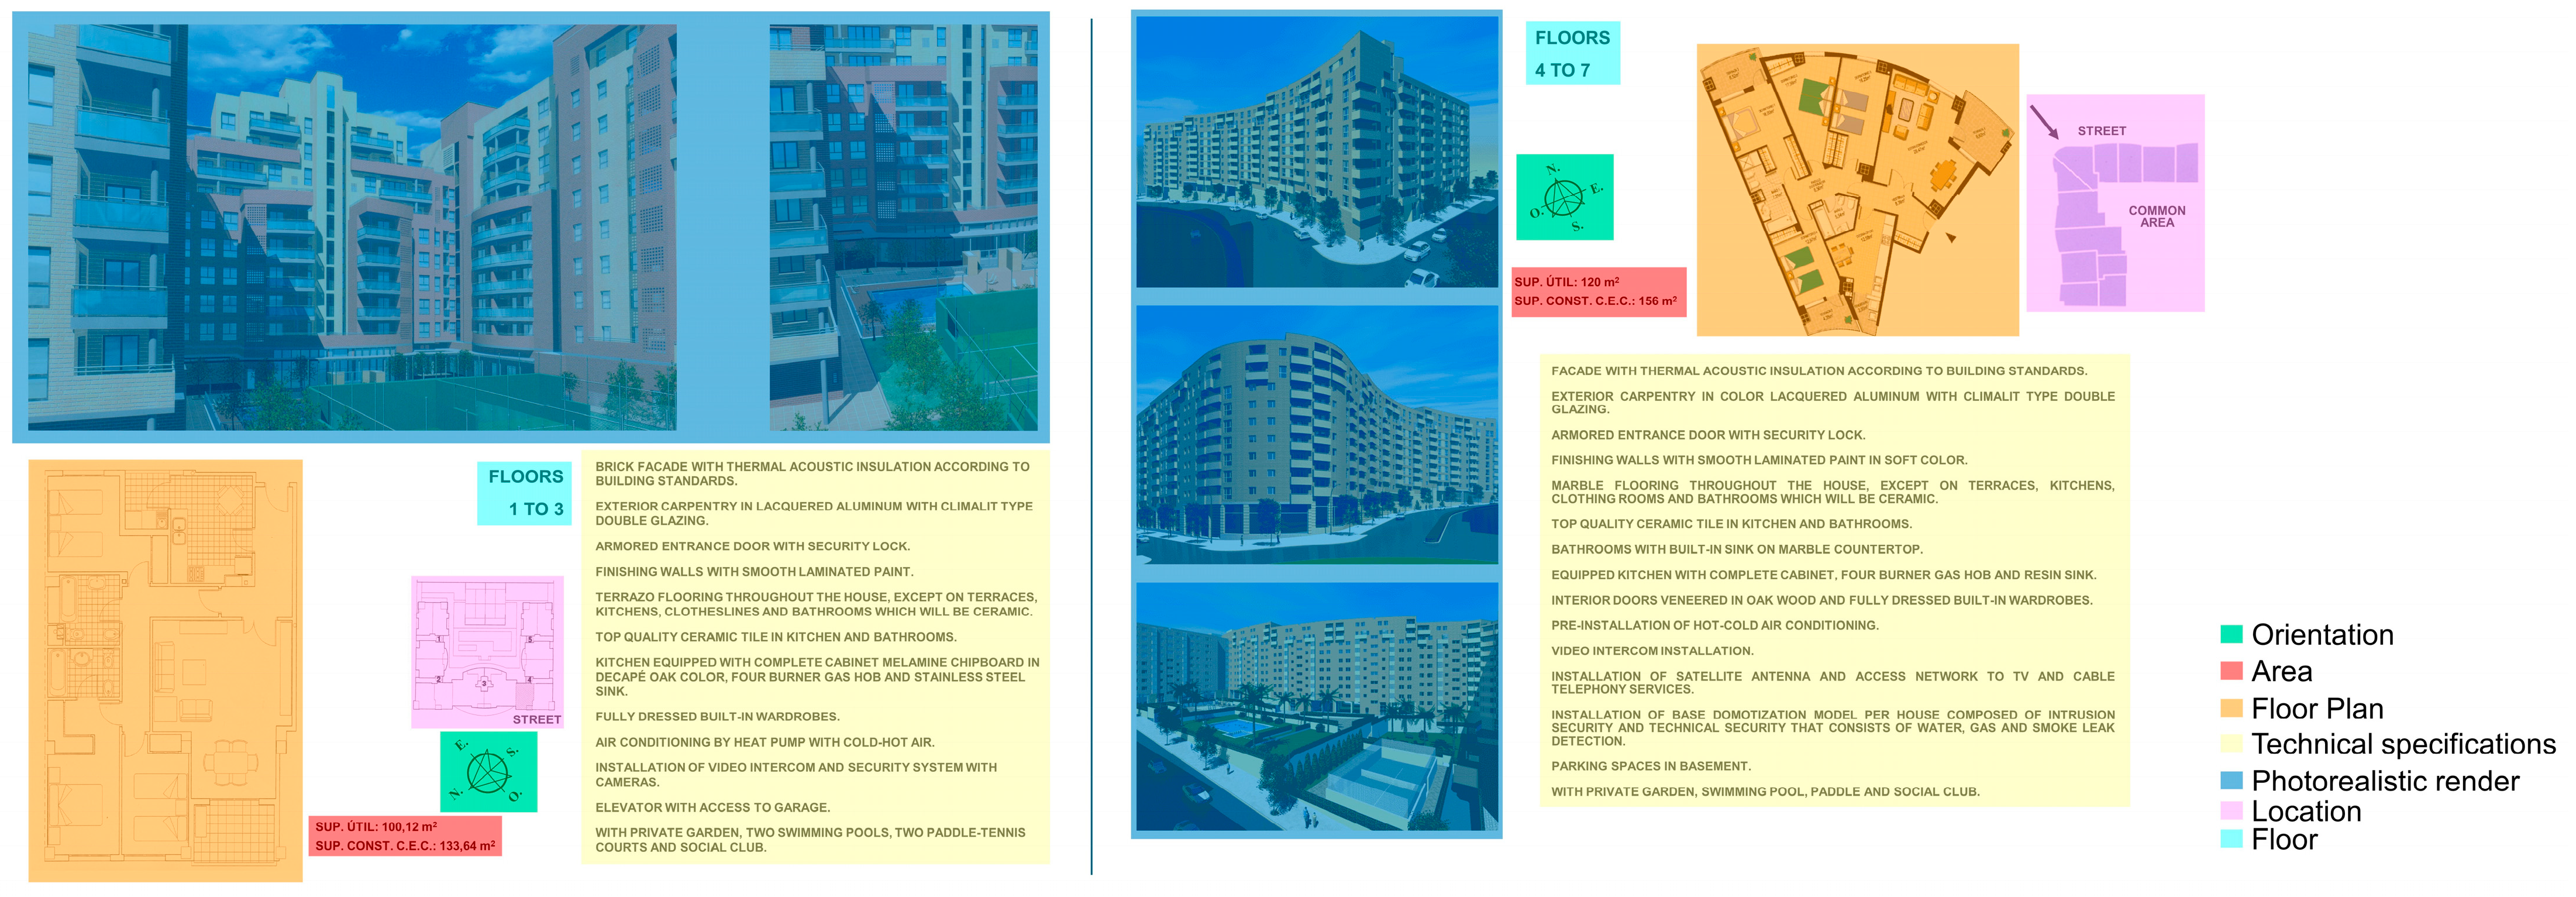
2.2. Stimuli
2.3. Measures
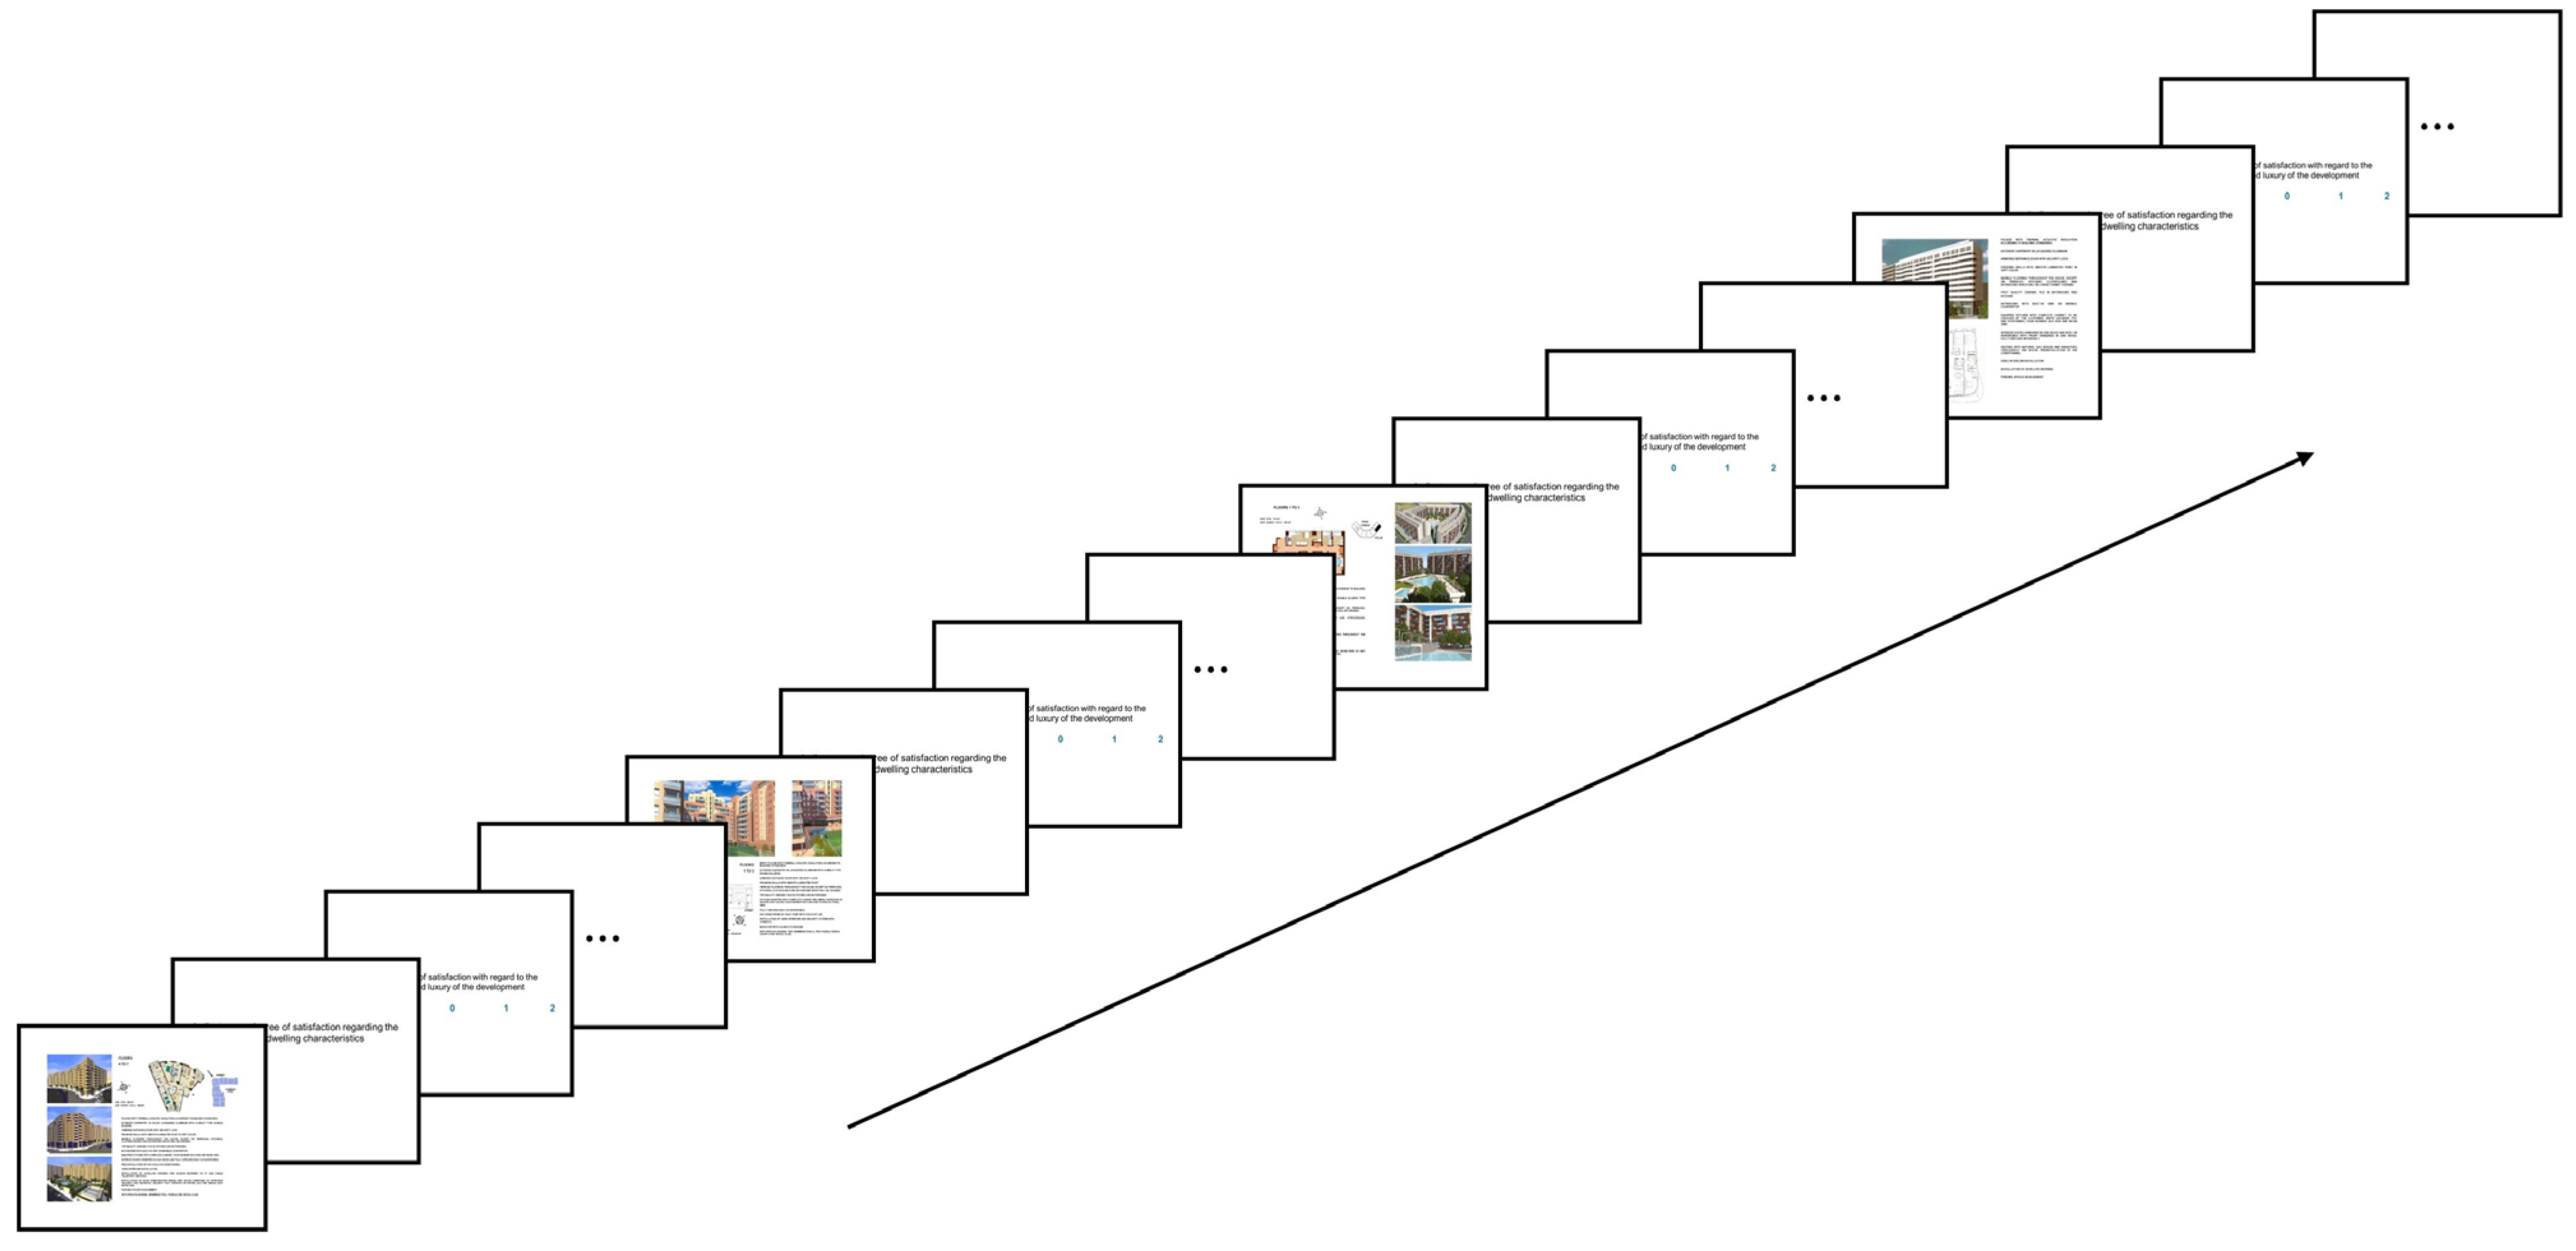
2.4. Development of Study
2.5. Data Processing
3. Results
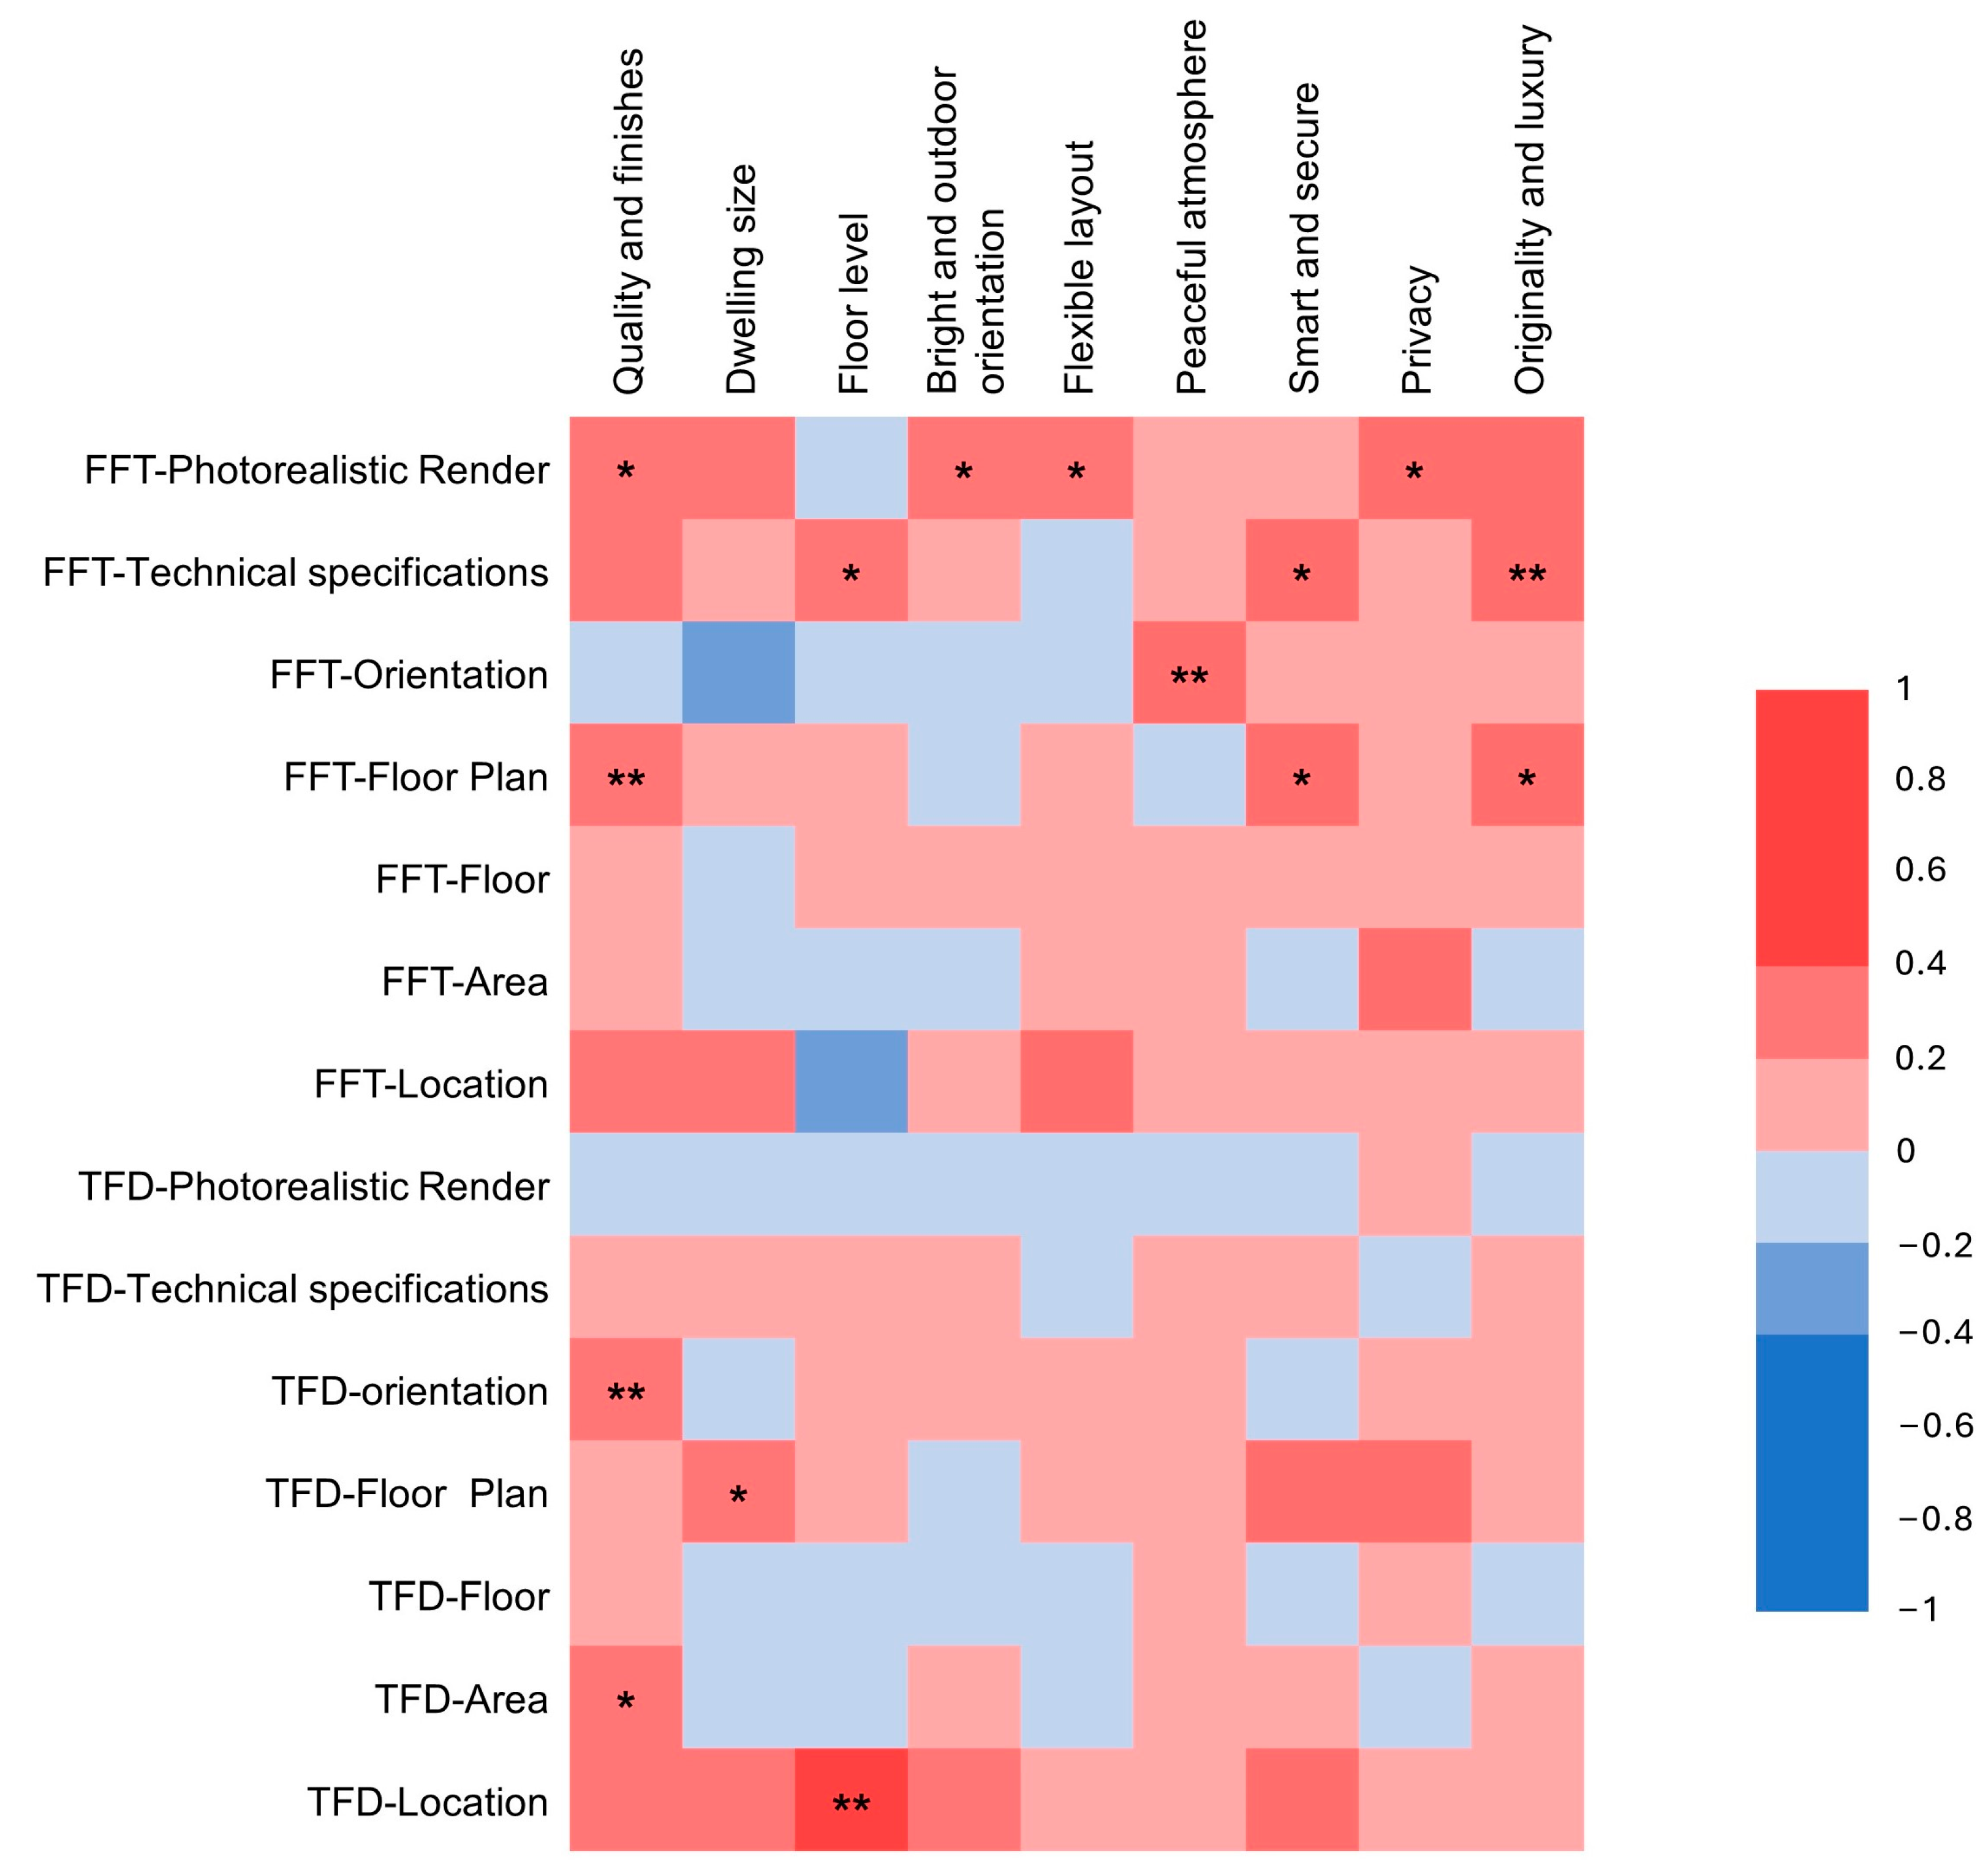
3.1. Hypothesis I: There Is a Relationship between Subjects’ Viewing Pattern and Their Evaluation of the Observed Houses
3.2. Hypothesis II: There Are Significant Differences in the Viewing Pattern Based on Participants’ Gender
3.3. Hypothesis III: There Are Significant Differences in the Viewing Pattern Based on the Level of Expertise in the Sector
4. Discussion
5. Conclusions
Author Contributions
Funding
Data Availability Statement
Conflicts of Interest
References
- Seiler, M.; Madhavan, P.; Liechty, M. Toward an understanding of real estate homebuyer internet search behavior: An application of ocular tracking technology. J. Real Estate Res. 2012, 34, 211–242. [Google Scholar] [CrossRef]
- Baker, R.; Yu, U.J.; Gam, H.J.; Banning, J. Identifying tween fashion consumers’ profile concerning fashion innovativeness, opinion leadership, internet use for apparel shopping, interest in online co-design involvement, and brand commitment. Fash. Text. 2019, 6, 8. [Google Scholar] [CrossRef]
- Noris, A.; Nobile, T.H.; Kalbaska, N.; Cantoni, L. Digital fashion: A systematic literature review. A perspective on marketing and communication. J. Glob. Fash. Mark. 2021, 12, 32–46. [Google Scholar] [CrossRef]
- Xiang, Z.; Wang, D.; O’Leary, J.T.; Fesenmaier, D.R. Adapting to the internet: Trends in travelers’ use of the web for trip planning. J. Travel Res. 2015, 54, 511–527. [Google Scholar] [CrossRef]
- Chung, N.; Koo, C. The use of social media in travel information search. Telemat. Inform. 2015, 32, 215–229. [Google Scholar] [CrossRef]
- Jeong, Y.; Lee, Y. A study on the customer satisfaction and customer loyalty of furniture purchaser in on-line shop. Asian J. Qual. 2010, 11, 146–156. [Google Scholar] [CrossRef]
- Montañana, A.; Nolé, M.L.; Llinares, C. Strategic Design Approaches for Eliciting the Perception of ‘Prestige’ in Housing Consumers. Buildings 2024, 14, 853. [Google Scholar] [CrossRef]
- Montañana, A.; Llinares, C.; Page, Á.F. Modelling design requirements of a floor plan. Open House Int. 2015, 40, 88–93. [Google Scholar] [CrossRef]
- Kupke, V. Factors important in the decision to buy a first home. Pac. Rim Prop. Res. J. 2008, 14, 458–476. [Google Scholar] [CrossRef]
- Hofman, E.; Halman, J.I.; Ion, R.A. Variation in housing design: Identifying customer preferences. Hous. Stud. 2006, 21, 929–943. [Google Scholar] [CrossRef]
- Larson, R.B. Controlling social desirability bias. Int. J. Mark. Res. 2019, 61, 534–547. [Google Scholar] [CrossRef]
- Tatman, A.W.; Kreamer, S. Psychometric properties of the Social Desirability Scale-17 with individuals on probation and parole in the United States. IJCJS 2014, 9, 122. [Google Scholar]
- Zaltman, G. How Customers Think: Essential Insights into the Mind of the Market; Harvard Business Press: Brighton, MA, USA, 2003. [Google Scholar]
- Bagozzi, R.P.; Verbeke, W.J.; Dietvorst, R.C.; Belschak, F.D.; van den Berg, W.E.; Rietdijk, W.J. Theory of mind and empathic explanations of Machiavellianism: A neuroscience perspective. J. Manag. 2013, 39, 1760–1798. [Google Scholar] [CrossRef]
- Oatley, K.; Jenkins, J.M. Human emotions: Function and dysfunction. Annu. Rev. Psychol. 1992, 43, 55–85. [Google Scholar] [CrossRef] [PubMed]
- Lazarus, R.S. Progress on a cognitive-motivational-relational theory of emotion. Am. Psychol. 1991, 46, 819–834. [Google Scholar] [CrossRef] [PubMed]
- Janowski, A.; Renigier-Biłozor, M.; Walacik, M.; Chmielewska, A. EMOTIF—A system for modeling 3D environment evaluation based on 7D emotional vectors. Inf. Sci. 2024, 662, 120256. [Google Scholar] [CrossRef]
- Stewart, D.W.; Furse, D.H. Applying psychophysiological measures to marketing and advertising research problems. JCIRA 1982, 5, 1–38. [Google Scholar]
- Vartanian, O.; Navarrete, G.; Chatterjee, A.; Fich, L.B.; Gonzalez-Mora, J.L.; Leder, H.; Skov, M. Architectural design and the brain: Effects of ceiling height and perceived enclosure on beauty judgments and approach-avoidance decisions. J. Environ. Psychol. 2015, 41, 10–18. [Google Scholar] [CrossRef]
- Iñarra, S.; Vidal, F.J.; Llinares, C.; Guixeres, J. Visual attention in the evaluation of architectural spaces. EGA 2015, 20, 228–237. [Google Scholar]
- Higuera-Trujillo, J.L.; Llinares, C.; Macagno, E. The cognitive-emotional design and study of architectural space: A scoping review of neuroarchitecture and its precursor approaches. Sensors 2021, 21, 2193. [Google Scholar] [CrossRef]
- Schachter, S.; Singer, J. Cognitive, social, and physiological determinants of emotional state. Psychol. Rev. 1962, 69, 379. [Google Scholar] [CrossRef] [PubMed]
- Ma, X.; Monfared, R.; Grant, R.; Goh, Y.M. Determining Cognitive Workload Using Physiological Measurements: Pupillometry and Heart-Rate Variability. Sensors 2024, 24, 2010. [Google Scholar] [CrossRef] [PubMed]
- Brown, C.L.; Van Doren, N.; Ford, B.Q.; Mauss, I.B.; Sze, J.W.; Levenson, R.W. Coherence between subjective experience and physiology in emotion: Individual differences and implications for well-being. Emotion 2020, 20, 818. [Google Scholar] [CrossRef] [PubMed]
- Tsai, C.M.; Guan, S.S. Identifying regions of interest in reading an image. Displays 2015, 39, 33–41. [Google Scholar] [CrossRef]
- Carlson, N.R.; Platón, M.J.R.; Carson, N.R.; Urbano, B.C. Fundamentos de Fisiología de la Conducta; Pearson Educación: London, UK, 2010. [Google Scholar]
- Coubard, O.A. Saccade and vergence eye movements: A review of motor and premotor commands. Eur. J. Neurosci. 2013, 38, 3384–3397. [Google Scholar] [CrossRef] [PubMed]
- Carter, B.T.; Luke, S.G. Best practices in eye tracking research. Int. J. Psychophysiol. 2020, 155, 49–62. [Google Scholar] [CrossRef] [PubMed]
- Hoffman, J.E. Visual attention and eye movements. In Attention; Psychology Press: London, UK, 2016; pp. 119–153. [Google Scholar]
- Pieters, R.; Wedel, M. Attention capture and transfer in advertising: Brand, pictorial, and text-size effects. J. Mark. 2004, 68, 36–50. [Google Scholar] [CrossRef]
- Wedel, M.; Pieters, R. Eye tracking for visual marketing. Found. Trends Mark. 2008, 1, 231–320. [Google Scholar] [CrossRef]
- Duchowski, A.; Duchowski, A. Eye tracking techniques. In Eye Tracking Methodology: Theory and Practice; Springer: Berlin/Heidelberg, Germany, 2007; pp. 51–59. [Google Scholar]
- Hwang, Y.M.; Lee, K.C. Using an eye-tracking approach to explore gender differences in visual attention and shopping attitudes in an online shopping environment. Int. J. Hum.-Comput. Interact. 2018, 34, 15–24. [Google Scholar] [CrossRef]
- Sargezeh, B.A.; Tavakoli, N.; Daliri, M.R. Gender-based eye movement differences in passive indoor picture viewing: An eye-tracking study. Physiol. Behav. 2019, 206, 43–50. [Google Scholar] [CrossRef] [PubMed]
- Shen, W.; Shen, Q.; Sun, Q. Building Information Modeling-based user activity simulation and evaluation method for improving designer–user communications. Autom. Constr. 2012, 21, 148–160. [Google Scholar] [CrossRef]
- Ishikawa, T.; Nakata, S.; Asami, Y. Perception and conceptualization of house floor plans: An experimental analysis. Environ. Behav. 2011, 43, 233–251. [Google Scholar] [CrossRef]
- Boumová, I.; Zdráhalová, J. The apartment with the best floor plan layout: Architects versus non-architects. Crit. Hous. Anal. 2016, 3, 30–41. [Google Scholar] [CrossRef]
- Vogt, S.; Magnussen, S. Expertise in pictorial perception: Eye-movement patterns and visual memory in artists and laymen. Perception 2007, 36, 91–100. [Google Scholar] [CrossRef] [PubMed]
- Tallon, M.; Greenlee, M.W.; Wagner, E.; Rakoczy, K.; Frick, U. How do art skills influence visual search? Eye movements analyzed with hidden markov models. Front. Psychol. 2021, 12, 594248. [Google Scholar] [CrossRef] [PubMed]
- Dogusoy-Taylan, B.; Cagiltay, K. Cognitive analysis of experts’ and novices’ concept mapping processes: An eye tracking study. Comput. Human. Behav. 2014, 36, 82–93. [Google Scholar] [CrossRef]
- Gegenfurtner, A.; Lehtinen, E.; Säljö, R. Expertise differences in the comprehension of visualizations: A meta-analysis of eye-tracking research in professional domains. Educ. Psychol. Rev. 2011, 23, 523–552. [Google Scholar] [CrossRef]
- Stofer, K.; Che, X. Comparing experts and novices on scaffolded data visualizations using eye-tracking. JEMR 2014, 7, 1–15. [Google Scholar] [CrossRef]
- National Association of Realtors (NAR). Highlights From the Profile of Home Buyers and Sellers. 2023. Available online: https://store.realtor/2023-nar-profile-of-home-buyers-and-sellers-download/ (accessed on 9 January 2024).
- Judd, T.; Durand, F.; Torralba, A. Fixations on low-resolution images. J. Vis. 2011, 11, 14. [Google Scholar] [CrossRef] [PubMed]
- Torralba, A.; Oliva, A.; Castelhano, M.S.; Henderson, J.M. Contextual guidance of eye movements and attention in real-world scenes: The role of global features in object search. Psychol. Rev. 2006, 113, 766. [Google Scholar] [CrossRef]
- Llinares, C.; Page, A. Application of product differential semantics to quantify purchaser perceptions in housing assessment. Build. Environ. 2007, 42, 2488–2497. [Google Scholar] [CrossRef]
- Terninko, J. Step-by-Step QFD: Customer-Driven Product Design; Routledge: London, UK, 2018. [Google Scholar]
- Holmqvist, K.; Nyström, M.; Andersson, R.; Dewhurst, R.; Jarodzka, H.; Van de Weijer, J. Eye Tracking: A Comprehensive Guide to Methods and Measures; OUP Oxford: Oxford, UK, 2011. [Google Scholar]
- Hessels, R.S.; Benjamins, J.S.; Cornelissen, T.H.; Hooge, I.T. A validation of automatically-generated areas-of-interest in videos of a face for eye-tracking research. Front. Psychol. 2018, 9, 1367. [Google Scholar] [CrossRef] [PubMed]
- Sugano, Y.; Matsushita, Y.; Sato, Y. Graph-based joint clustering of fixations and visual entities. ACM Trans. Appl. Percept. (TAP) 2013, 10, 1–16. [Google Scholar] [CrossRef]
- Fisher, R.A. On the “probable error” of a coefficient of correlation deduced from a small sample. Metron 1921, 1, 3–32. [Google Scholar]
- Zou, G. Toward using confidence intervals to compare correlations. Psychol. Methods 2007, 12, 399–413. [Google Scholar] [CrossRef] [PubMed]
- Cleophas, T.J.; Zwinderman, A.H.; Cleophas, T.J.; Zwinderman, A.H. Monte Carlo Tests and Bootstraps for Analysis of Complex Data (10, 20, 139, and 55 Patients). In SPSS for Starters, Part 2; Springer: Dordrecht, The Netherlands, 2012; pp. 87–90. [Google Scholar]
- Ben-Shachar, M.S.; Lüdecke, D.; Makowski, D. Effectsize: Estimation of effect size indices and standardized parameters. J. Open Source Softw. 2020, 5, 2815. [Google Scholar] [CrossRef]
- Tomczak, M.; Tomczak, E. The need to report effect size estimates revisited. An overview of some recommended measures of effect size. Trends Sport Sci. 2014, 1, 19–25. [Google Scholar]
- Clement, J.; Kristensen, T.; Grønhaug, K. Understanding consumers’ in-store visual perception: The influence of package design features on visual attention. J. Retail. Consum. Serv. 2013, 20, 234–239. [Google Scholar] [CrossRef]
- Leahy, W.; Sweller, J. Cognitive load theory, modality of presentation and the transient information effect. Appl. Cogn. Psychol. 2011, 25, 943–951. [Google Scholar] [CrossRef]
- Spriggs, M.J.; Kirk, I.J.; Skelton, R.W. Hex Maze: A new virtual maze able to track acquisition and usage of three navigation strategies. Behav. Brain Res. 2018, 339, 195–206. [Google Scholar] [CrossRef] [PubMed]
- Andersen, N.E.; Dahmani, L.; Konishi, K.; Bohbot, V.D. Eye tracking, strategies, and sex differences in virtual navigation. Neurobiol. Learn. Mem. 2012, 97, 81–89. [Google Scholar] [CrossRef] [PubMed]
- Franěk, M.; Šefara, D.; Petružálek, J.; Cabal, J.; Myška, K. Differences in eye movements while viewing images with various levels of restorativeness. J. Environ. Psychol. 2018, 57, 10–16. [Google Scholar] [CrossRef]
- Zhang, Y.; Yang, J. Exploring gender differences in the instructor presence effect in video lectures: An eye-tracking study. Brain Sci. 2022, 12, 946. [Google Scholar] [CrossRef] [PubMed]
- Rodriguez, S.; Regueiro, B.; Piñeiro, I.; Estévez, I.; Valle, A. Gender differences in mathematics motivation: Differential effects on performance in primary education. Front. Psychol. 2020, 10, 505859. [Google Scholar] [CrossRef] [PubMed]
- Cook, M.P. Visual representations in science education: The influence of prior knowledge and cognitive load theory on instructional design principles. Sci. Educ. 2006, 90, 1073–1091. [Google Scholar] [CrossRef]
- Beukema, S.; Jennings, B.J.; Olson, J.A.; Kingdom, F.A. The pupillary response to the unknown: Novelty versus familiarity. i-Perception 2019, 10, 2041669519874817. [Google Scholar] [CrossRef] [PubMed]
- Richmond, J.L.; Zhao, J.L.; Burns, M.A. What goes where? Eye tracking reveals spatial relational memory during infancy. J. Exp. Child Psychol. 2015, 130, 79–91. [Google Scholar] [CrossRef] [PubMed]
- Yoo, C.Y. Unconscious processing of web advertising: Effects on implicit memory, attitude toward the brand, and consideration set. J. Interact. Mark. 2009, 22, 2–18. [Google Scholar] [CrossRef]
- Godfroid, A.; Hui, B. Five common pitfalls in eye-tracking research. Second Lang. Res. 2020, 36, 277–305. [Google Scholar] [CrossRef]

| Gender | Profession | Age | Interest on the Purchase of a Home | Vision |
|---|---|---|---|---|
| Male 11 (52.38%) | Expert 11 (52.38%) | <30 7 (33.33%) | None - | Incorrect - |
| Female 10 (47.62%) | Non-expert 10 (47.62%) | 30–40 4 (19.05%) | Medium 8 (38.1%) | Correct without support 5 (23.81%) |
| 40–50 6 (28.57%) | High 13 (61.9%) | Correct with support 16 (76.19%) | ||
| >50 4 (19.05%) |
| Hypotheses | Study Variables | Statistical Test | ||
|---|---|---|---|---|
| Physiological | Assessment | Intrasubject | ||
| I | FFT AOI (x7) TFD AOI (x7) | design atributtes assessments (x9) | - | Spearman Correlation Test |
| II | FFT AOI (x7) TFD AOI (x7) | design atributtes assessments (x9) | Gender (Male/Female) | Mann Whitney U comparison test |
| III | FFT AOI (x7) TFD AOI (x7) | design atributtes assessments (x9) | Profession (expert/non-expert) | Mann Whitney U comparison test |
| Mean Rank | Sum of Rank | U | p | ||
|---|---|---|---|---|---|
| FFT-Photorealistic Render | Male | 29.5 | 1180 | 360 | 0.059 |
| Female | 38.6 | 965 | |||
| FFT-Technical specifications | Male | 43.38 | 1822 | 677 | 0.244 |
| Female | 37.32 | 1418 | |||
| FFT-Orientation | Male | 36.59 | 1427 | 647 | 0.329 |
| Female | 41.47 | 1576 | |||
| FFT-Floor Plan | Male | 35.86 | 1398.5 | 618.5 | 0.623 |
| Female | 38.31 | 1302.5 | |||
| FFT-Floor | Male | 33.59 | 1310 | 530 | 0.141 |
| Female | 40.91 | 1391 | |||
| FFT-Area | Male | 21.6 | 453.5 | 92.5 | 0.037 * |
| Female | 14.17 | 212.5 | |||
| FFT-Location | Male | 18.62 | 391 | 155 | 0.936 |
| Female | 18.33 | 275 | |||
| TFD-Photorealistic Render | Male | 39.38 | 1614.5 | 752.5 | 0.960 |
| Female | 39.64 | 1466.5 | |||
| TFD-Technical specifications | Male | 24.29 | 631.5 | 213.5 | .441 |
| Female | 21.24 | 403.5 | |||
| TFD-orientation | Male | 33.28 | 1264.5 | 523.5 | 0.057 |
| Female | 42.85 | 1585.5 | |||
| TFD-Floor Plan | Male | 22.96 | 597 | 246 | 0.982 |
| Female | 23.05 | 438 | |||
| TFD-Floor | Male | 20.1 | 522.5 | 140.5 | 0.626 |
| Female | 18.21 | 218.5 | |||
| TFD-Area | Male | 32.68 | 1274.5 | 480.5 | 0.923 |
| Female | 32.22 | 805.5 | |||
| TFD-Location | Male | 18.4 | 460 | 135 | 0.626 |
| Female | 20.25 | 243 |
| Mean Rank | Sum of Rank | U | p | ||
|---|---|---|---|---|---|
| FFT-Photorealistic Render | Non-expert | 32.78 | 1213 | 510 | 0.916 |
| Expert | 33.29 | 932 | |||
| FFT-Technical specifications | Non-expert | 41.73 | 2003 | 709 | 0.562 |
| Expert | 38.66 | 1237 | |||
| FFT-Orientation | Non-expert | 37.89 | 1705 | 572.5 | 0.598 |
| Expert | 40.56 | 1298 | |||
| FFT-Floor Plan | Non-expert | 38.05 | 1750.5 | 572.5 | 0.579 |
| Expert | 35.2 | 950.5 | |||
| FFT-Floor | Non-expert | 38.72 | 1781 | 542 | 0.367 |
| Expert | 34.07 | 920 | |||
| FFT-Area | Non-expert | 20.19 | 424 | 122 | 0.254 |
| Expert | 16.13 | 242 | |||
| FFT-Location | Non-expert | 19.1 | 401 | 145 | 0.688 |
| Expert | 17.67 | 265 | |||
| TFD-Photorealistic Render | Non-expert | 34.76 | 1599 | 518 | 0.027 * |
| Expert | 46.31 | 1482 | |||
| TFD-Technical specifications | Non-expert | 22.29 | 579.5 | 228.5 | 0.671 |
| Expert | 23.97 | 455.5 | |||
| TFD-orientation | Non-expert | 36.7 | 1578 | 632 | 0.549 |
| Expert | 39.75 | 1272 | |||
| TFD-Floor Plan | Non-expert | 25.69 | 668 | 177 | 0.108 |
| Expert | 19.32 | 367 | |||
| TFD-Floor | Non-expert | 19.59 | 431 | 174 | 0.953 |
| Expert | 19.38 | 310 | |||
| TFD-Area | Non-expert | 30.5 | 1098 | 432 | 0.330 |
| Expert | 35.07 | 982 | |||
| TFD-Location | Non-expert | 18.29 | 384 | 153 | 0.646 |
| Expert | 19.94 | 319 |
Disclaimer/Publisher’s Note: The statements, opinions and data contained in all publications are solely those of the individual author(s) and contributor(s) and not of MDPI and/or the editor(s). MDPI and/or the editor(s) disclaim responsibility for any injury to people or property resulting from any ideas, methods, instructions or products referred to in the content. |
© 2024 by the authors. Licensee MDPI, Basel, Switzerland. This article is an open access article distributed under the terms and conditions of the Creative Commons Attribution (CC BY) license (https://creativecommons.org/licenses/by/4.0/).
Share and Cite
de-Juan-Ripoll, C.; Nolé, M.L.; Montañana, A.; Llinares, C. Relationship between Visual Attention Patterns and Subjective Evaluations in Housing Sales Information: A Study Using Eye-Tracking Technology. Buildings 2024, 14, 2106. https://doi.org/10.3390/buildings14072106
de-Juan-Ripoll C, Nolé ML, Montañana A, Llinares C. Relationship between Visual Attention Patterns and Subjective Evaluations in Housing Sales Information: A Study Using Eye-Tracking Technology. Buildings. 2024; 14(7):2106. https://doi.org/10.3390/buildings14072106
Chicago/Turabian Stylede-Juan-Ripoll, Carla, María Luisa Nolé, Antoni Montañana, and Carmen Llinares. 2024. "Relationship between Visual Attention Patterns and Subjective Evaluations in Housing Sales Information: A Study Using Eye-Tracking Technology" Buildings 14, no. 7: 2106. https://doi.org/10.3390/buildings14072106