Article

Study on Mechanical Properties of Nano-TiC- and Nano-SiO2-Modified Basalt Fiber Concrete

1
Key Laboratory of Cold Region Water Resources Engineering, School of Water Resources and Electric Power, Heilongjiang University, Harbin 150080, China
2
Key Laboratory of Impact and Structural Safety, Academy of Civil Engineering & Architecture, Nanyang Normal University, Nanyang 473061, China
3
Heilongjiang Heidai Water Conservancy Engineering Quality Inspection Co., Ltd., Harbin 150078, China
4
Science and Technology on Advanced Ceramic Fibers and Composites Laboratory, College of Aerospace Science and Engineering, National University of Defense Technology, Changsha 410073, China
*
Author to whom correspondence should be addressed.
Buildings 2024, 14(7), 2120; https://doi.org/10.3390/buildings14072120
Submission received: 26 May 2024 / Revised: 22 June 2024 / Accepted: 3 July 2024 / Published: 10 July 2024
(This article belongs to the Section Building Materials, and Repair & Renovation)

Abstract

:
The load-bearing capacity of a building is influenced by the strength of the concrete. However, when faced with complex environments, ordinary concrete is not always adequate. The strength of concrete can be enhanced by incorporating additives into it. At this point, the study of adding basalt fiber (BF) and nano-SiO2 (NS) to concrete is pretty advanced. Still, research on the incorporation of nano-TiC (NT) into concrete is limited. In order to study the effect of NT, BF, and NS on the strength of concrete, in this paper, these materials were incorporated into concrete and NSF concrete was made by semi-dry mixing. And the concrete was analyzed for slump, compressive strength, splitting tensile strength, flexural strength, and modulus of elasticity. The optimization of the mechanical characteristics of concrete was conducted using response surface methodology (RSM), and the microstructure of concrete was used for analysis by scanning electron microscopy (SEM). To develop a thirst function optimization model based on NSF concrete, parallel experiments were used to verify the accuracy of the optimization results. The research findings show that NS, NT, and BF reduced the slump of concrete. Adding NT, NS, and BF in moderate amounts can enhance the mechanical characteristics of the concrete. The material’s optimal proportions for mixing were 0.85% for NT, 0.11% for BF, and 1.94% for NS. The optimized concrete has a maximum error of 9.03% in compressive strength, 9.30% in split tensile strength, and 9.82% in flexural strength.

1. Introduction

Concrete is an essential material in the building industry; its main function is to maintain structural stability and long-lasting durability [1,2,3]. However, concrete often has limitations and deficiencies when it is in a complex engineering environment [4,5,6]. Plain concrete has good compressive properties and poor splitting and flexural properties. When resisting shear and tensile stresses, the body of concrete is prone to cracking, which leads to structural failure [7]. In order to deal with the situation, steel reinforcement is usually added to concrete to increase the load-bearing capacity, but this inevitably leads to increased construction costs [8]. And when concrete is used for a long period, it is subjected to carbonation caused by the external environment over time, which reduces the performance of the internal reinforcement. Therefore, low-cost, alkali-resistant, and high-elastic-modulus materials are needed for work with concrete to resist external forces. Incorporating fibers into concrete is one of the effective solutions [9,10].
Several researchers and scholars have obtained high-strength concrete by adding fibers, such as polypropylene fiber concrete [11], glass fiber concrete [12], and carbon fiber concrete [13]. An appropriate amount of fibers can disperse the stress in concrete, thus effectively preventing the generation and expansion of cracks and improving its durability [14,15,16].
Among them, basalt fiber (BF) has come to the attention of scholars because of its excellent mechanical properties and low cost [17]. An appropriate amount of BF can improve the load-bearing capacity of concrete and also improve its cracking properties [18]. Yang et al. [19] added different amounts of BF (0%, 0.05%, 0.1%, and 0.15%) to concrete to make recycled aggregate concrete last longer in coastal areas. The research indicates that the appropriate amount of BF could decrease cracks and microvoids in the concrete. Luo et al. [20] incorporated different admixtures of BF into recycled concrete, and the initiative increased the resistance of concrete to freeze–thaw erosion and enhanced the integrity of the recycled concrete. Deng et al. [21] examined the impact of blending methods for BF on the mechanical characteristics of concrete. The findings show that different mixing methods affect the dispersion of fibers in concrete and affect the compressive properties, as well as the flexural toughness of the concrete. Wang et al. [22] indicated that the appropriate amount of BF can improve a concrete beam’s high-temperature resistance.
Since the addition of appropriate amounts of nanomaterials to concrete will improve its performance, researchers add the appropriate amount of nano-SiO2 (NS) to concrete. Numerous studies have shown that NS can be used as an admixture for concrete to improve its performance [23]. Yang et al. [24] improved the compressive strength and modulus of elasticity of concrete by using waste concrete powder, fly ash (FA), and slag as aggregates and NS as a modified material. Fang et al. [25] replaced some of the sand in concrete with rubber particles and NS to study the microstructure and freeze–thaw damage mechanism of concrete. The research pointed out that the appropriate amount of rubber particles and NS can restrain the pore generation of concrete and reduce the degree of freeze–thaw damage of concrete. Han et al. [26] introduced both unmodified and modified NS into concrete to enhance its durability. The study observed that both forms of NS had a substantial impact on increasing the hydrophobicity and durability of the concrete. Zhang et al. [27] included polyvinyl alcohol (PVA) fibers and NS in the concrete. The research observed that the fluidity of the concrete diminishes as the amounts of PVA and NS increase. Additionally, the mechanical characteristics of the concrete are improved when the NS content is below 5%.
The theory of composite mechanics [28] provides a basis for combining fibers with other multiphase materials to form a cement matrix (Figure 1). However, it also leads to three problems: Firstly, the amount of materials added to concrete is often at the same intervals and in stepwise increments, which is not necessarily an accurate dosage. Secondly, although there is an improvement in the performance of concrete with a variety of admixtures, is it a significant effect? Thirdly, whether it is possible to reduce the cost of experimental group control by technical means.
With the introduction of response surface methodology (RSM), scholars resorted to RSM to solve this problem. The method can control the experimental objectives and achieve multi-objective optimization of maximum and minimum values [29]. It can also control the range of parameters to find the ideal experimental conditions. Therefore, RSM is widely used in the fields of medicine, food processing, and materials. For concrete composites, RSM also has a considerable contribution [30,31,32]. Parhi et al. [33] studied the effect of aspect ratio, volume fraction, and fiber length of PET fibers on concrete by RSM. It resulted in the improvement of the fracture toughness of concrete. Sadeghian et al. [34] improved the impact toughness and energy absorption properties of concrete by RSM. Adedokun et al. [35] incorporated steel slag into concrete instead of granite, and through RSM experiments it was noted that the mechanical strength of concrete was higher when the water–cement ratio was 0.47. Bypour et al. [36] obtained better-performing steel plate shear walls by RSM optimization using concrete thickness, compressive strength, the thickness of the steel plate, and yield stress as variables. Qu et al. [37] incorporated aluminum sulfate, sodium nitrate, and triethanolamine into concrete to provide bearing capacity for concrete in desert areas. Multiple optimizations of the above three substances using RSM improved the early strength of concrete.
At present, research on the incorporation of nano-TiC (NT) into concrete is limited, and also further research is needed on the effects of NT and other materials acting together in concrete. NT is widely used in ceramics and circuits because of its large specific surface area, fine particle size, high strength, and high temperature resistance [38]. Numerous studies have shown that the addition of nanomaterials to concrete can enhance its strength [39,40,41], so can the addition of an appropriate amount of NT have the same effect? BF and NS incorporation into concrete have already been researched [42,43,44], so can the additional addition of NT also improve its mechanical properties?
Based on the above studies and discussion, this paper investigates the effects of NT, BF, and NS on the mechanical properties of concrete based on the Box–Behnken theory (RSM-BBD) and uses the production method in Figure 2 to mix the above materials into the concrete (NSF). The relationship between the concrete strength index and material parameters was established to improve the damage state of concrete, and then the optimal response value was obtained by the thirst function. And the microstructure of concrete after pressurized crushing was analyzed by scanning electron microscopy (SEM). It provides some theoretical basis for the study of the effect of nanomaterials and fibers on concrete.

2. Materials and Methods
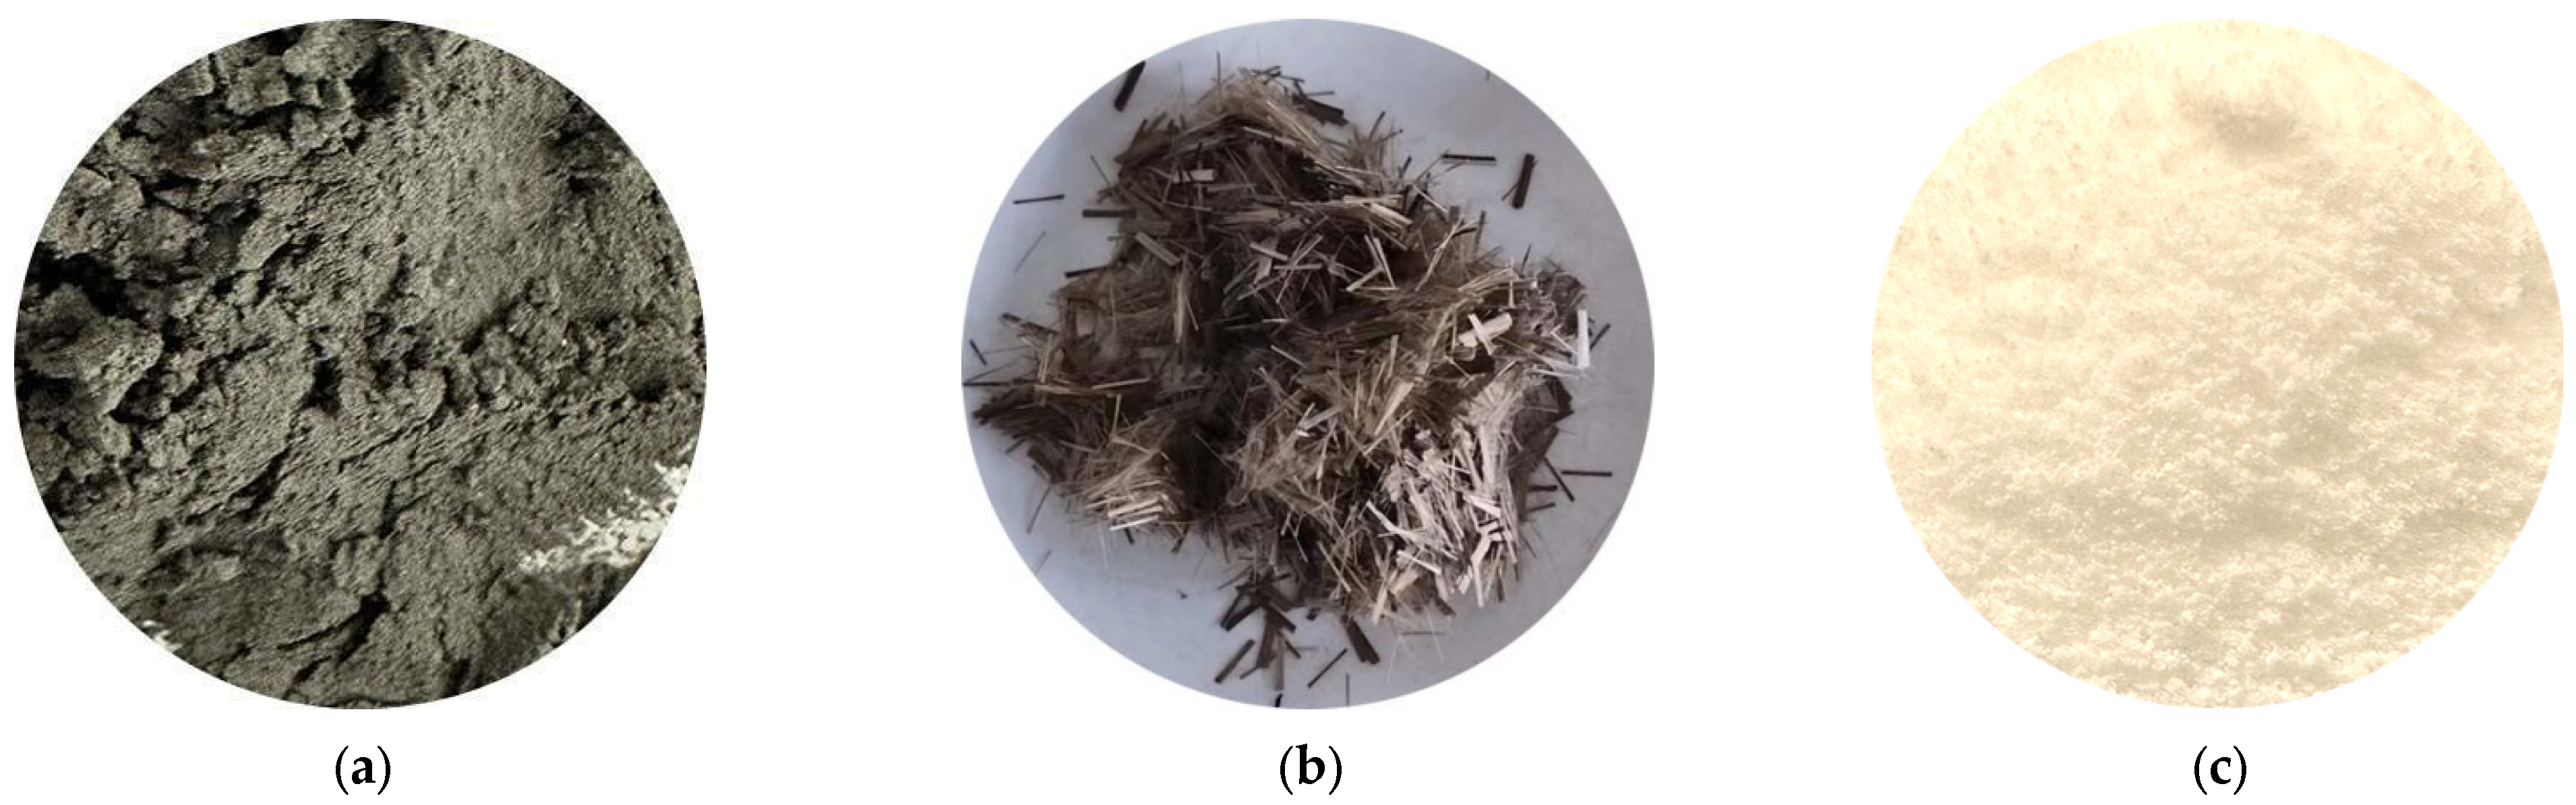
2.1. Materials

The main gel material for this experiment is ordinary silicate cement P.O 42.5 from Swan, and its performance index is shown in Table 1. Polyhydroxyacid-based high-efficiency water-reducing agent in powder form with a water reduction rate ≥ 25% was used as the main water-reducing material in this experiment. Medium sand was used as fine aggregate (Table 2) and the indicators for crushed stone are shown in Table 3. Considering the price, secondary fly ash (FA) was chosen for this experiment. NT from Huizhou City, China, Top Metal Material Co. NS from Shanghai City, China, Shanghai Yingcheng New Material Co. (Figure 3). The dosage of FA, NT, and NS is the mass percentage of cement. The performance indicators for BF are shown in Table 4. Since the medium sand and the stone contained a small amount of impurities, to improve the accuracy of the experiment, the coarse and fine aggregates needed to be sieved to remove impurities.

2.2. Model Optimization Theory and Design Methods

2.2.1. Theoretical Calculation of RSM

The RSM was first proposed by Box and Wilson, and then gradually formed a whole set of theoretical systems through the continuous development and utilization of researchers [45,46]. RSM can be used to decrease the number of experiments, to find the optimal design value of parameters, or to optimize the design scheme. In the theoretical system of RSM, the best response value can be obtained by controlling the experimental parameters to help researchers find the experimental target more quickly. However, the correlation between response values and parameters in RSM remains uncertain. Therefore, the relationship between response values and parameters should be found before experimental optimization. The theoretical calculations are shown in Equation (1):
y 0 = a 0 + i = 1 k a i x i + i = 1 k a i i x i 2 + i = 1 k i = 1 k a i j x i x j , i < j
In the equation, y 0 is the response value; a 0 , a i , and a i i are coefficients; and x is the response variable. The number of variables is denoted by the k in the formula. The response surface formula is defined as (2) when there are two independent variables:
y 0 = a 0 + a 1 x 1 + a 2 x 2 + a 3 x 1 2 + a 4 x 2 2 + a 5 x 1 x 2
When x 3 = x 1 2 , x 4 = x 2 2 ,   x 5 = x 1 x 2 , Equation (3) is derived by taking the variation of Equation (2):
y 0 = a 0 + a 1 x 1 + a 2 x 2 + a 3 x 3 + a 4 x 4 + a 5 x 5
When the sample content is n, calculations are made as shown in Equations (4) and (5):
Y ~ = X ~ A ~ + e ~
Y ~ = y 1 y 2 . . . y n X ~ = 1 1 . . . 1 x 11 x 21 . . . x n 1 x 12 x 22 . . . x n 2 . . . . . . . . . . . . x 1 k x 2 k . . . x n k A ~ = a 0 a 1 . . . a n e ~ = e 1 e 2 . . . e n
where e ~ is the error vector. The parameter vector A ~ comes from b ~ . The calculation of b ~ is shown in Equation (6):
b ~ = X ~ T X 1 X ~ T Y ~
And the variance/covariance of b ~ obeys Equation (7):
c o v ( b i , b j ) = C i j = s 2 X ~ T X 1
where s is the error of Y ~ whose predicted value obeys Equation (8).
s 2 = S S E n k 1
The residual sum of squares S S E is calculated in Equation (9).
S S E = Y ~ T Y ~ b ~ T X ~ T X ~ Y T
To increase the RSM accuracy, multiple computations of R 2 a d j are required. The algorithm obeys Equation (10).
R 2 a d j = 1 S S E / ( n k 1 ) S y y / ( n 1 ) , R 2 a d j 0,1
The calculation of the total piece and S y y is shown in Equation (11).
S y y = Y ~ T Y ~ ( i = 1 n y i ) 2 n
As R 2 a d j gets closer to 1, it means that the RSM is more accurate. The result obeys Equation (12):
t 0 = b j S 2 C j j
where t 0 is the statistic and b j is the coefficient. C j j is the result of the calculation from Equation (7).

2.2.2. Theoretical Calculation of the Thirst Function

The craving function method can transform multiple-response objectives into single-response objectives, which in turn simplifies the experimental process [47]. With this function, researchers can optimize and analyze experimental data more efficiently to find the best experimental conditions. As the RSM response value gets closer to the target, the thirst value d i gets closer to 1. Conversely, d i gets closer to 0. L i and Ti are the neighboring values of the ith response, while Ui is the target value of the ith response. The r is the adjustment function and D is the thirst value. The calculation principle is shown below:
d i ( Y i ) m a x = 0 ,   Y i < L i Y i L i T i L i r i ,   L i Y i T i 1 , Y i > L i
d i ( Y i ) m a x = 0 , Y i < T i ( U i Y i U i T i ) r i , T i Y i U i 1 , Y i > U i
D = i ( d i ( y i ) ) ω i 1 ω i , ω i [ 0,1 ]

2.2.3. Preparation of Concrete

Existing engineering experience and experimental results can ensure that the concrete can obtain better mechanical properties. Thus, in this experiment, the amount of control gel material, sand rate, and water–cement ratio are kept constant. The cement is 410 kg·m−3, the sand rate is 36%, the water–cement ratio is 0.45, and the water-reducing agent dosage is 0.6%. The addition of nanomaterials and FA will take up a large amount of cement, which will affect the concrete strength. Therefore, the FA admixture was appropriately reduced and its admixture was 10%. NT (A), BF (B), and NS (C) were selected as the three free factors for this experiment. Water-reducing agent, NT, NS, and FA are the percentage of cement mass and BF is the volume admixture. Compressive strength (R1), split tensile strength (R2), and flexural strength (R3) are the three response values for this experiment. The RSM-BBD test was used to optimize the objectives of this experiment. The free factors and response values are shown in Table 5 and the test results of the experiment are shown in Table 6.
To improve the homogeneous dispersion of aggregates, semi-dry mixing was used for this concrete mixing method. Firstly, NS, BF, NT, and FA are put into the concrete mixer and mixed for 1 min. Then cement, aggregate, and water reducer are added to the concrete and mixed for 5 min. Laboratory tap water is added and mixed for 2 min and the mixture is subsequently poured into the concrete molds. Subsequently, manual vibration was performed to make NSF concrete. The slump of the concrete was tested during the experiment. After the specimen curing was completed, compressive and split tensile strength tests were conducted on cubic specimens (100 × 100 × 100 mm). The flexural strength test and modulus of elasticity test were carried out on prismatic specimens (100 × 100 × 400 mm), and the concrete modulus of elasticity measurement reference specification “Standard for test methods of long-term performance and durability of ordinary concrete” (GB/T50082-2009) [48] was used for testing. The experiments were loaded in groups of three and the measured values were recorded for 28 days.

3. Results and Discussion

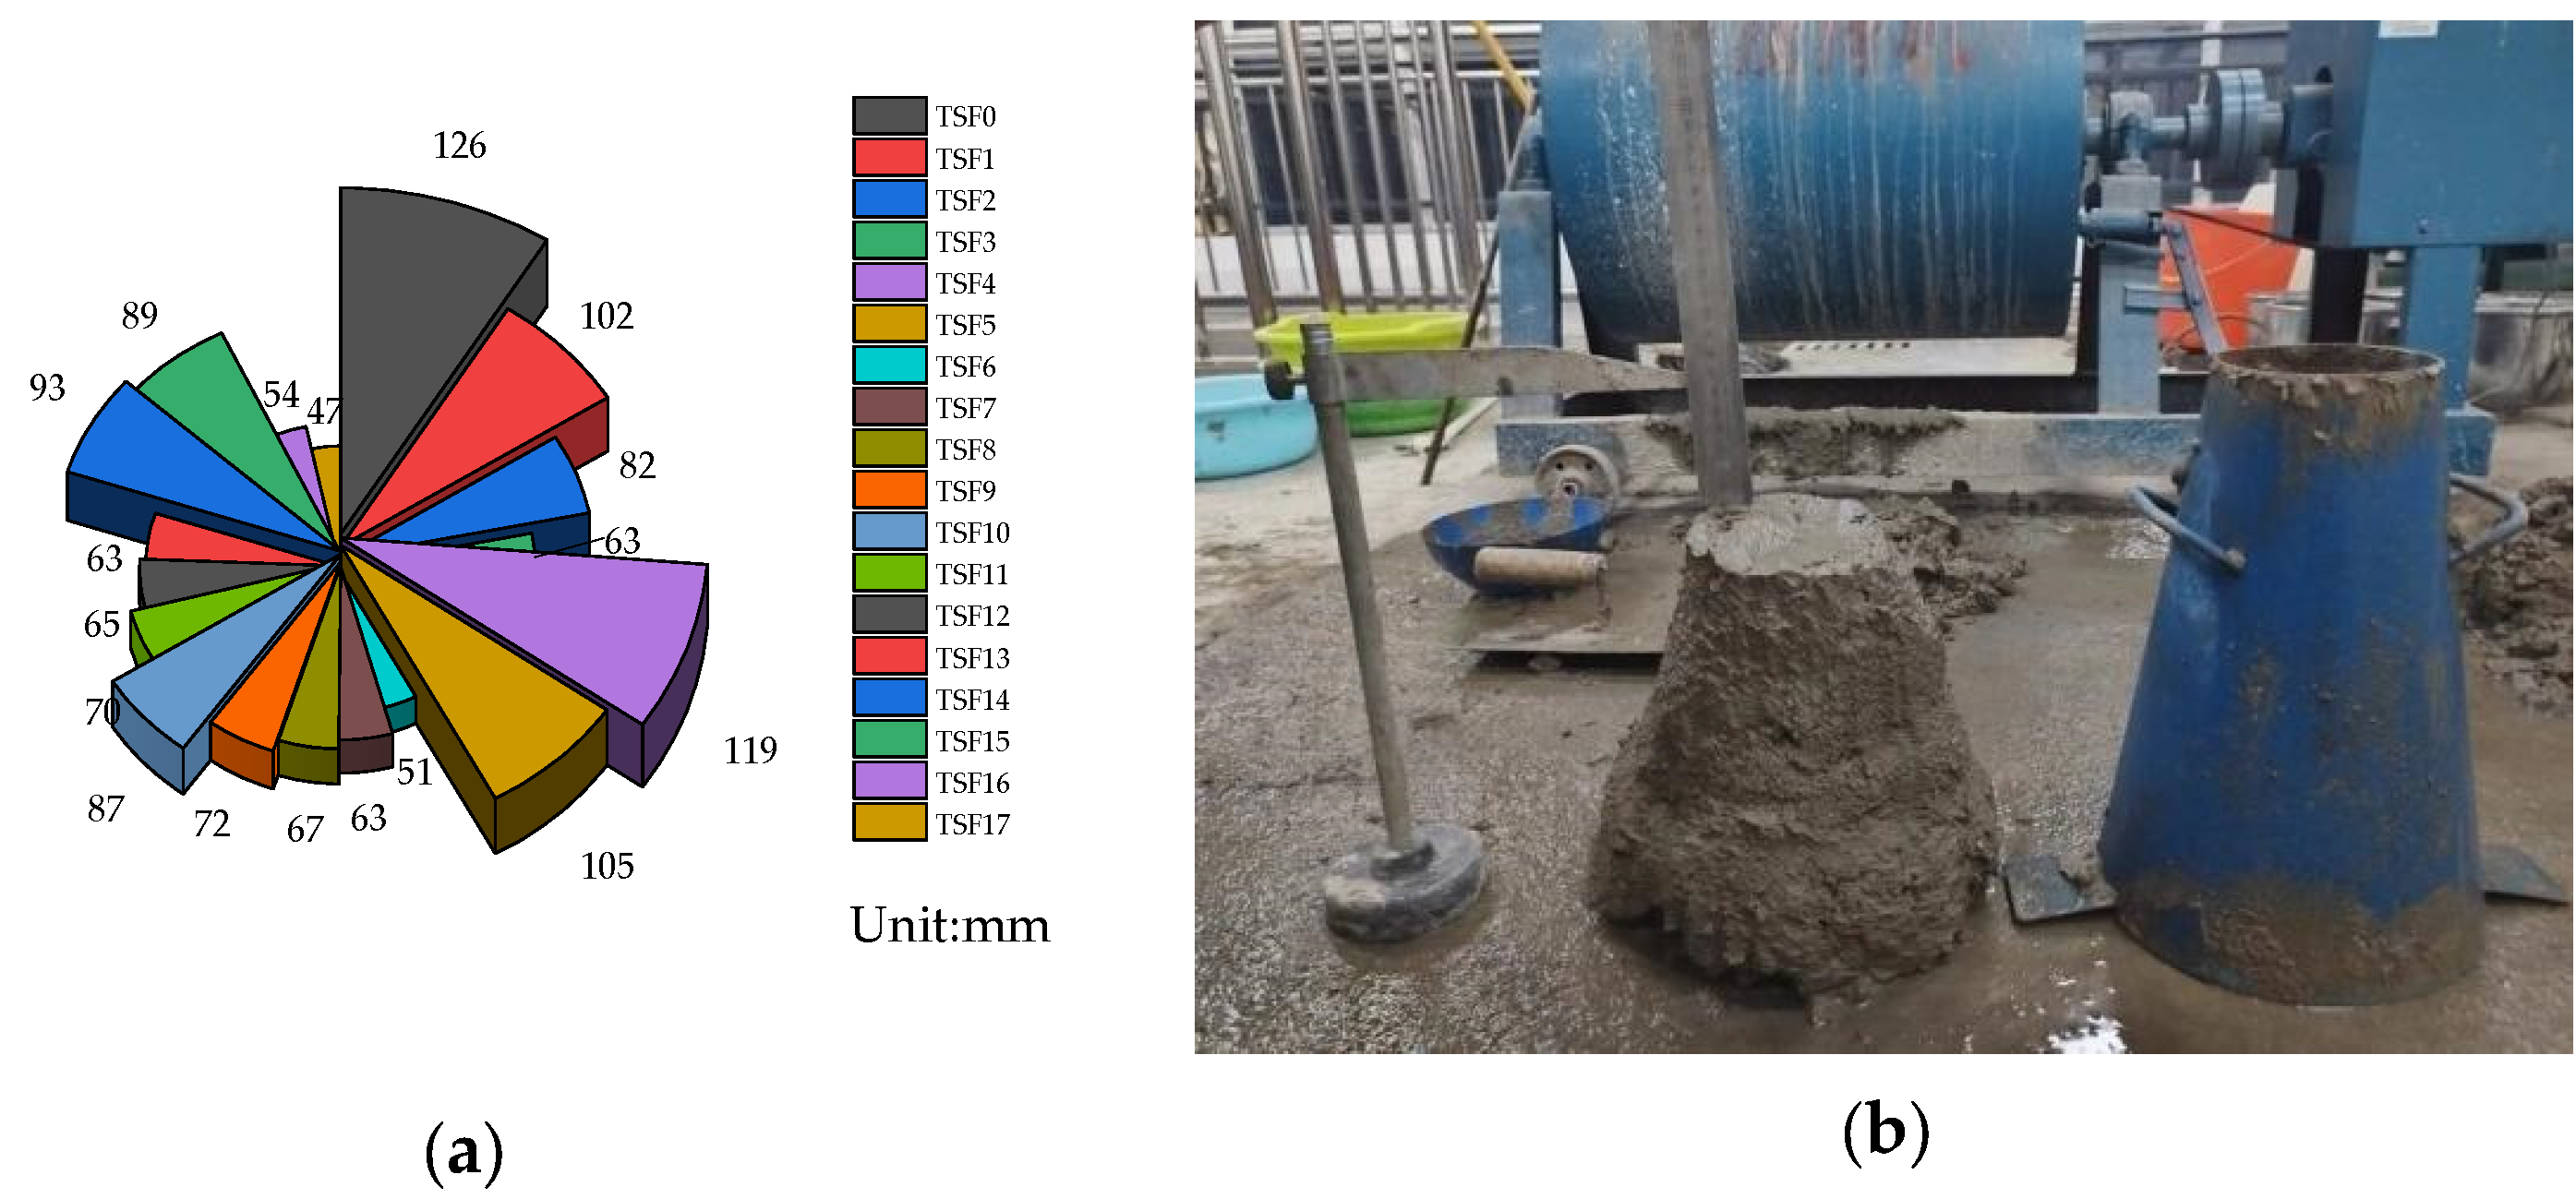
3.1. Analysis of NSF Concrete Slump Results

The degree of slump of concrete affects the working performance of concrete, and a suitable degree of slump makes the concrete easy to pour and vibrate to form. It also ensures the homogeneity of the concrete mixture, avoids segregation, and helps the growth of the concrete’s strength. The experimental results and test pictures of the concrete slump are shown in Figure 4. According to Figure 4, the use of BF in concrete decreases its slump. The magnitude of the concrete’s slump was reduced from 105 mm to 63 mm when the dosage of NT was 0%, the dosage of NS was 2.5%, and the volume dosage of BF rose from 0% to 0.3%. And similar experimental results were seen in NSF0 and NSF1. The reason is mainly because of surface friction and mutual entanglement between the fibers and the cement paste. The increased adhesion makes the concrete less fluid, which leads to a decrease in the degree of slump [49].
Adding NT to concrete reduces its degree of slump. The slump of concrete was reduced from 102 mm to 82 mm when the dosage of BF was 0.15%, NS was 0%, and NT was increased from 0% to 2.5%. And similar test results were also observed in NSF0 and NSF4. The reason is mainly because of the large specific surface area of NT. When NT is dispersed in the concrete, it absorbs some of the water used to provide concrete fluidity, which reduces the concrete fluidity.
Adding NS to concrete reduces its slump. The slump of the concrete decreased from 112 mm to 82 mm when the dosage of NT was 1.25%, the dosage of BF was 0%, and the dosage of NS was increased from 0% to 5%. Similar experimental results were found for NSF0 and NSF5. This phenomenon may be due to the strong surface tension between the NS particles and the cement particles, which requires a large amount of water to weaken the cohesion of the mixture [27].

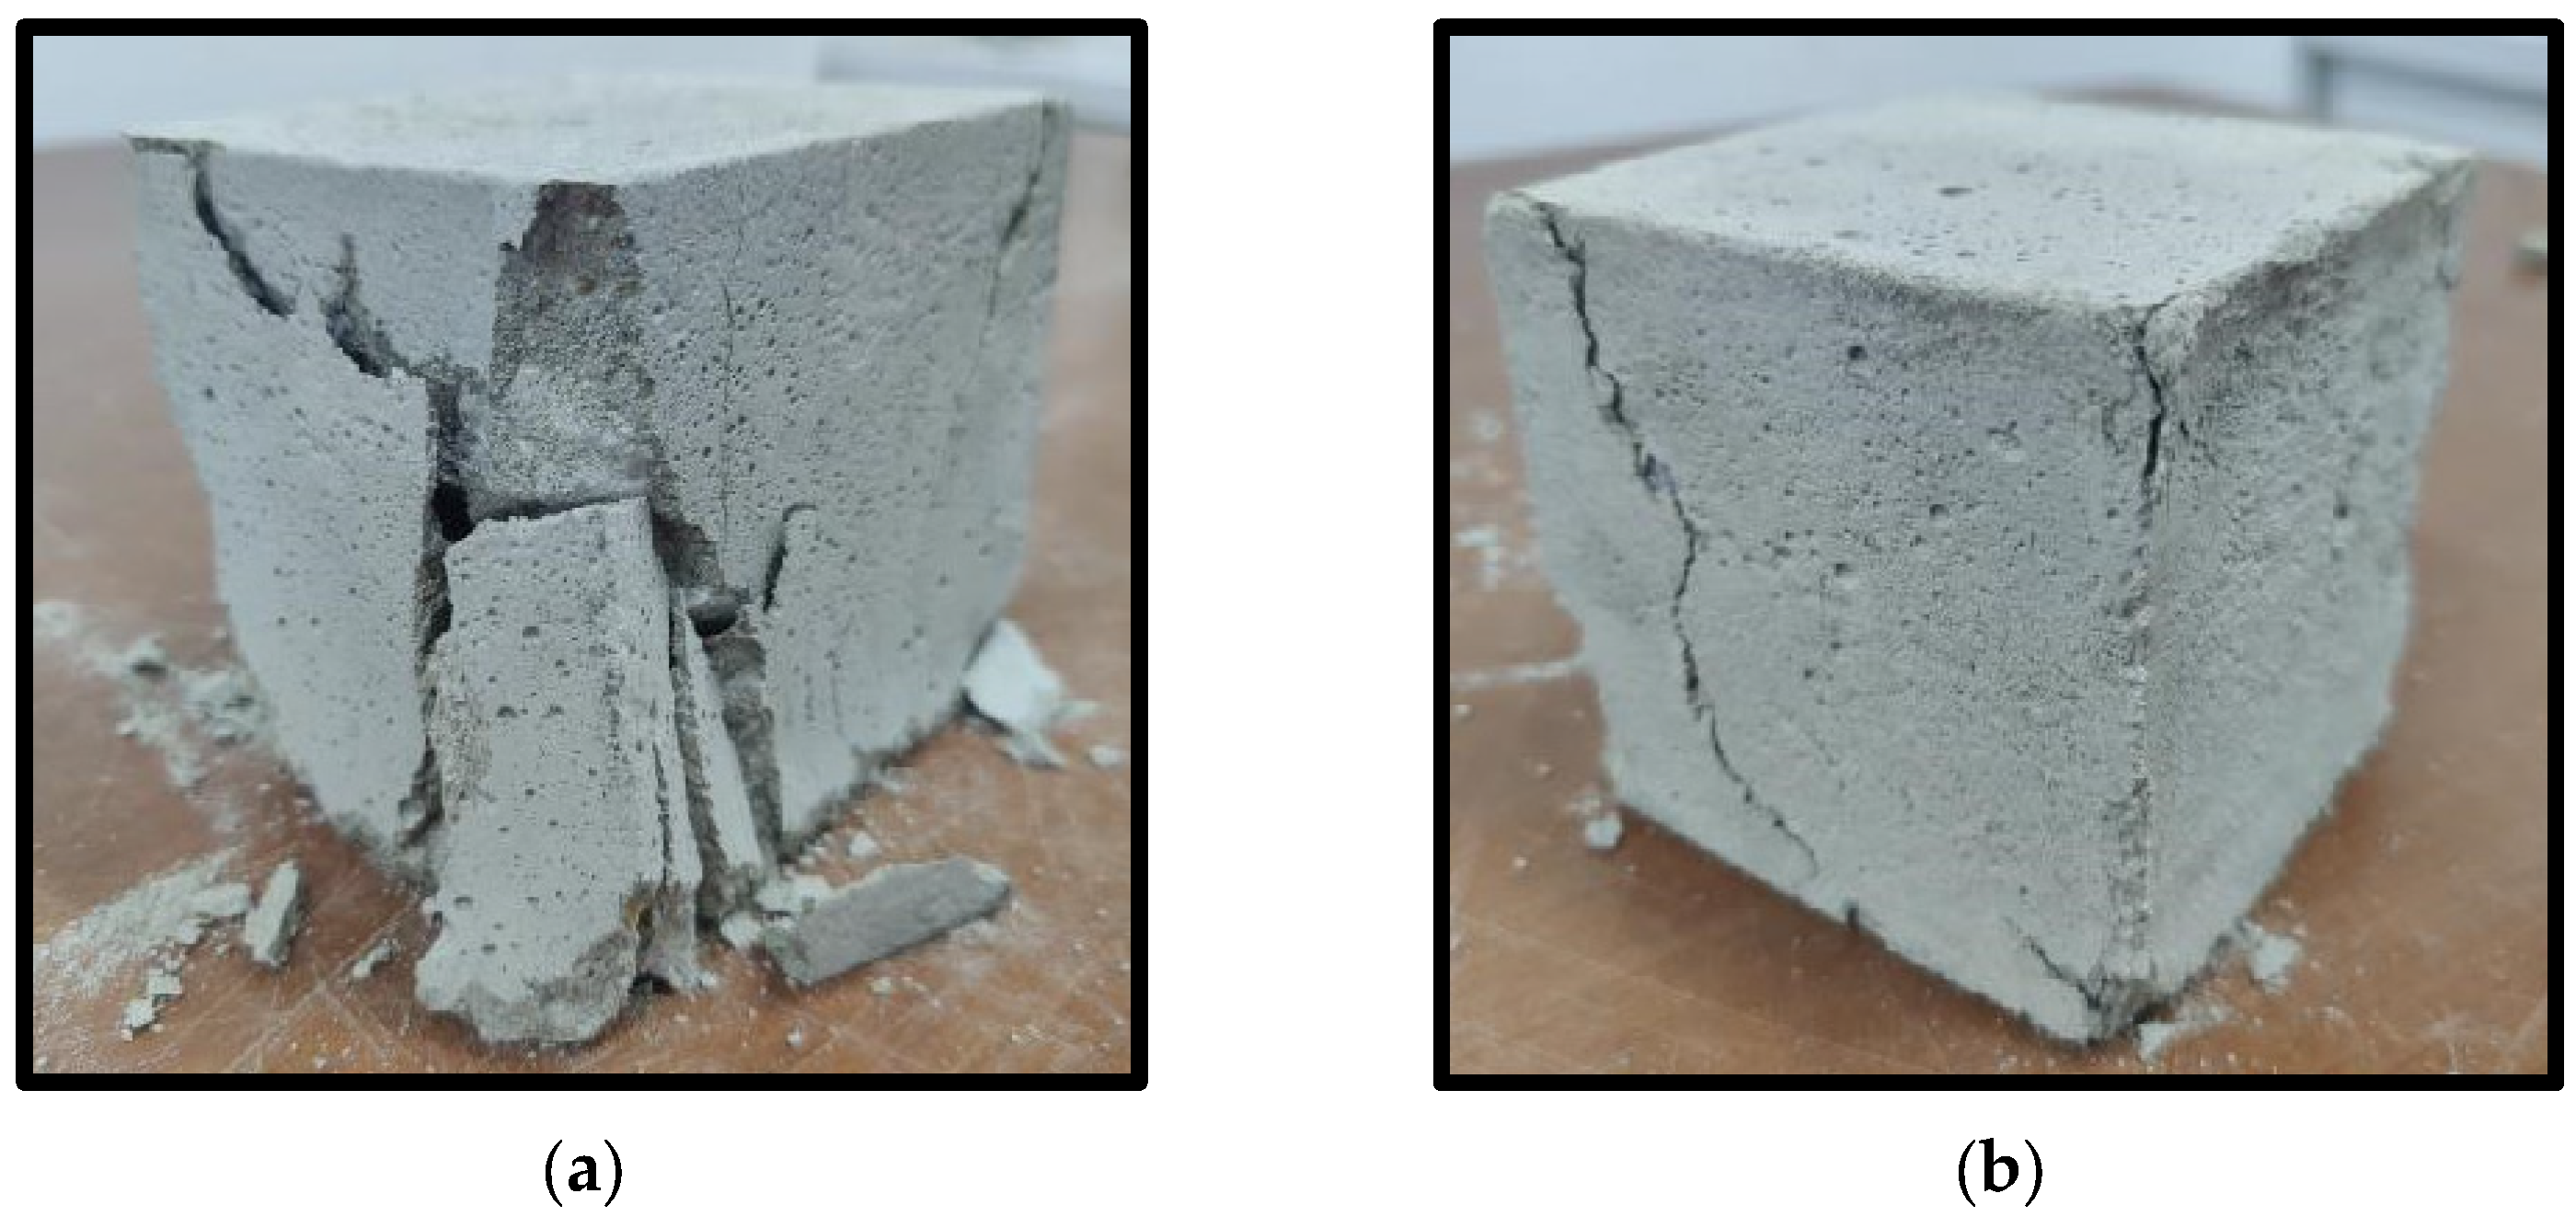
3.2. The Concrete Damage Realization

The location and pattern of the concrete damage form affect the force process and state of the concrete. Traina et al. [49] stated that adding a suitable quantity of fibers to concrete can enhance both its mechanical properties and its resistance to damage. In order to examine the impact of NT, BF, and NS on the compressive damage of concrete, a comparison was made between NSF0 and NSF9 (Figure 5).
The baseline group NSF0 has a proportional stress–strain at the beginning of loading and no change in the concrete as a whole. As the loading continued to increase, cracks began to appear in the concrete specimens and the cracks continued to expand with increasing pressure. When the ultimate compressive strength of the concrete was reached, its bearing capacity began to decrease. Eventually, the concrete completely loses its load-bearing capacity and is unable to maintain its integrity.
At the beginning of loading, no change in the NSF9 was observed. As the external force increased, small cracks were produced on the surface of the concrete. When the destructive stress of the concrete was reached, the cracks expanded rapidly. However, unlike the benchmark group NSF0, fewer cracks on the surface of the concrete were observed and very few or no cement blocks were dislodged. On the other hand, due to the addition of the fibers, the extension time of the cracks also became relatively longer. This damage state also appeared in the study of Chen [50].

3.3. Analysis of Mechanical Properties of Concrete

3.3.1. Concrete Prediction Model

Data fitting is a core part of data analysis, which extracts information from data and applies it to experimental prediction, optimization of experimental results, etc. Mondal et al. [51] obtained the relationship between bacterial cell concentration and water–cement ratio on the strength of concrete by using the application of RSM. Raouache et al. [52] obtained a high-strength reinforced concrete based on the RSM predictive model. The RSM-BBD was utilized to fit the experimental results in Table 6 and the regression equation shown below was obtained:
R 1 = 51.30 3.26   A 5.23   B 3.71   C + 1.63   A B 0.20   A C + 0.28   B C 5.32   A 2 8.60   B 2 7.88   C 2
R 2 = 4.64 0.19   A 0.26   B 0.20   C + 0.10   A B + 0.12   A C + 0.025   B C 0.32   A 2 0.62   B 2 0.55   C 2
R 3 = 8.57 0.33   A 0.45   B 0.39   C + 0.23   A B + 2.5 × 10 3   A C + 0.035   B C 0.69   A 2 1.02   B 2 0.89   C 2

3.3.2. RSM Model Test

From Table 7, Table 8 and Table 9, the p-values of the models are all less than 0.01 and the p-values of the out-of-fit terms are all greater than 0.05. This indicates that the experiment is available for subsequent analysis. Based on the data shown in Table 7, BF has the highest F-value of 118.03, with NS and NT following closely behind. The order of the factors’ impact on the compressive strength of concrete at 28 days is as follows: BF has the greatest influence, followed by NS, and then NT. A similar tendency is also observed in the split tensile strength and flexural strength. The compressive, splitting tensile, and flexural strengths of concrete were mostly influenced by the individual variables of NT, BF, and NS, as indicated by the results of the experimental fitting. The compressive and flexural strengths of concrete are influenced by the interaction between NT and BF according to the multifactorial approach. And the splitting tensile strength of concrete is affected by the interaction between NT and NS.

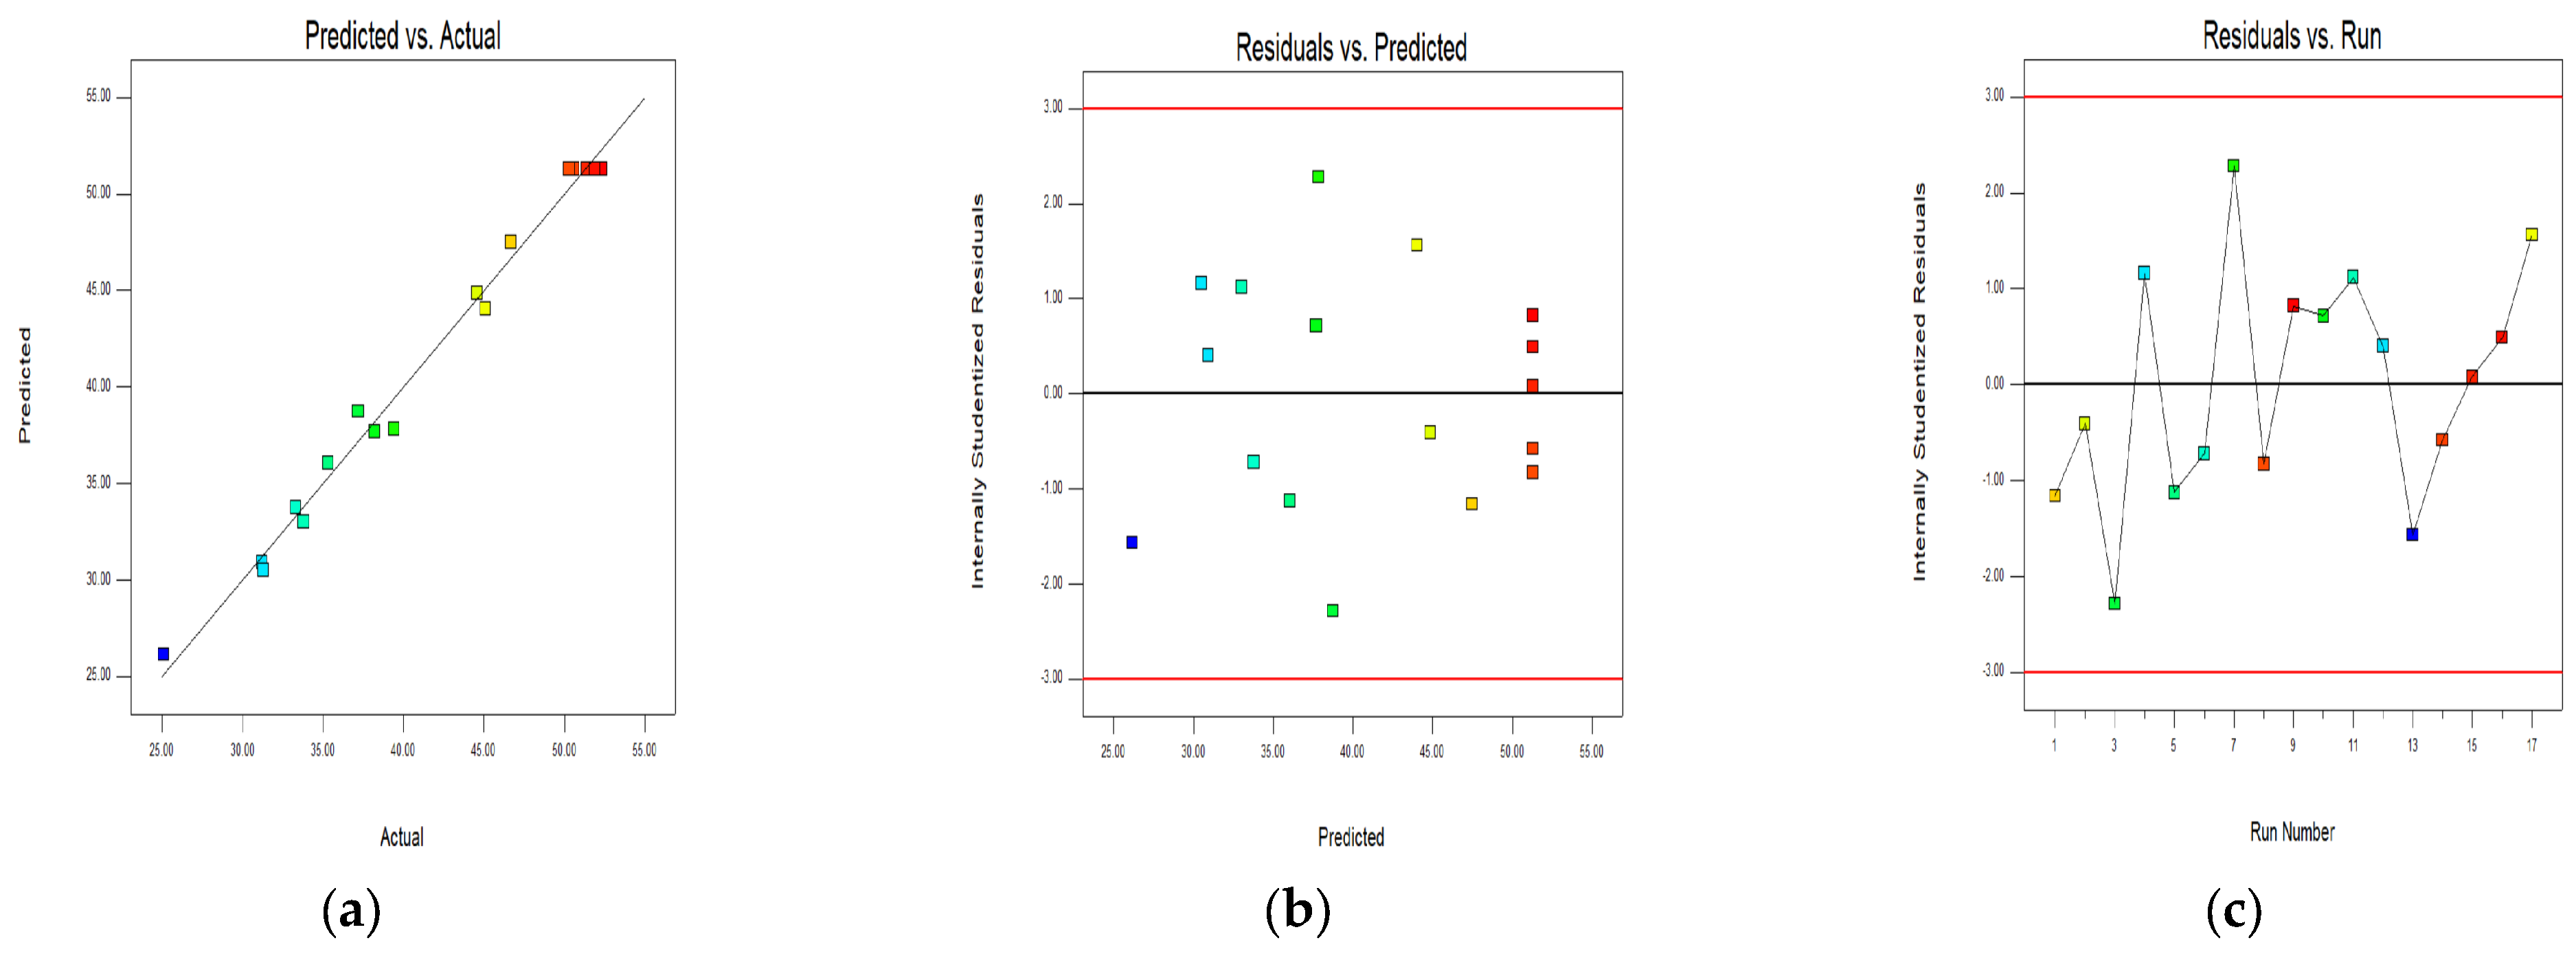
3.3.3. Model Diagnostic Diagrams

Figure 6a–i show the specific errors of the model’s residuals versus predicted values, residuals versus run values, and predicted versus actual values. Adamu et al. [53] stated that run values and graphs help to detect the model’s operation and accuracy, which leads to better optimization of the experiments. The colors in Figure 6 represent the different levels of response values, blue for low response, green for medium response, and red for high response. Figure 6 demonstrates a close relationship between the actual values of concrete strength and the predicted values, with the residuals falling within the permissible margin of error. The result indicates that the model has a high level of confidence and accuracy.

3.3.4. Compressive Strength of NSF Concrete

Figure 7 demonstrates that NT, BF, and NS affect concrete’s 28-day compressive strength. The compressive strength shows a quadratic paraboloid with a downward opening, indicating a maximum value in the test range. Figure 7a–c indicate that compressive strength increases and subsequently falls with NT, BF, and NS dosage, with a critical value. From Figure 7a, increasing NS from 0% to 1.25% and BF from 0% to 0.15% enhanced concrete compressive strength by 11.99%. When NS was added from 0% to 2.5% and BF from 0% to 0.3%, concrete compressive strength was reduced by 32.98%. Figure 6b,c show a similar soaring tendency.
These results indicate that a reasonable quantity of NS, BF, and NT can enhance the compressive strength of concrete. This may be due to the “aggregate effect” of NT and NS, which improves the compactness of the concrete and reduces internal defects [54]. The high elasticity and uniformly dispersed BF share the internal stresses of the concrete and further increase the compressive strength of the concrete [55]. Nevertheless, an overabundance of NS, BF, and NT diminished the adhesive characteristics of the cement matrix, hence hindering the enhancement of the concrete’s compressive strength. The response surface studies indicate that the compressive strength is maximized when the dosage of NT is 0.53%, the dosage of BF is 0.10%, and the dosage of NS is 2.49%.

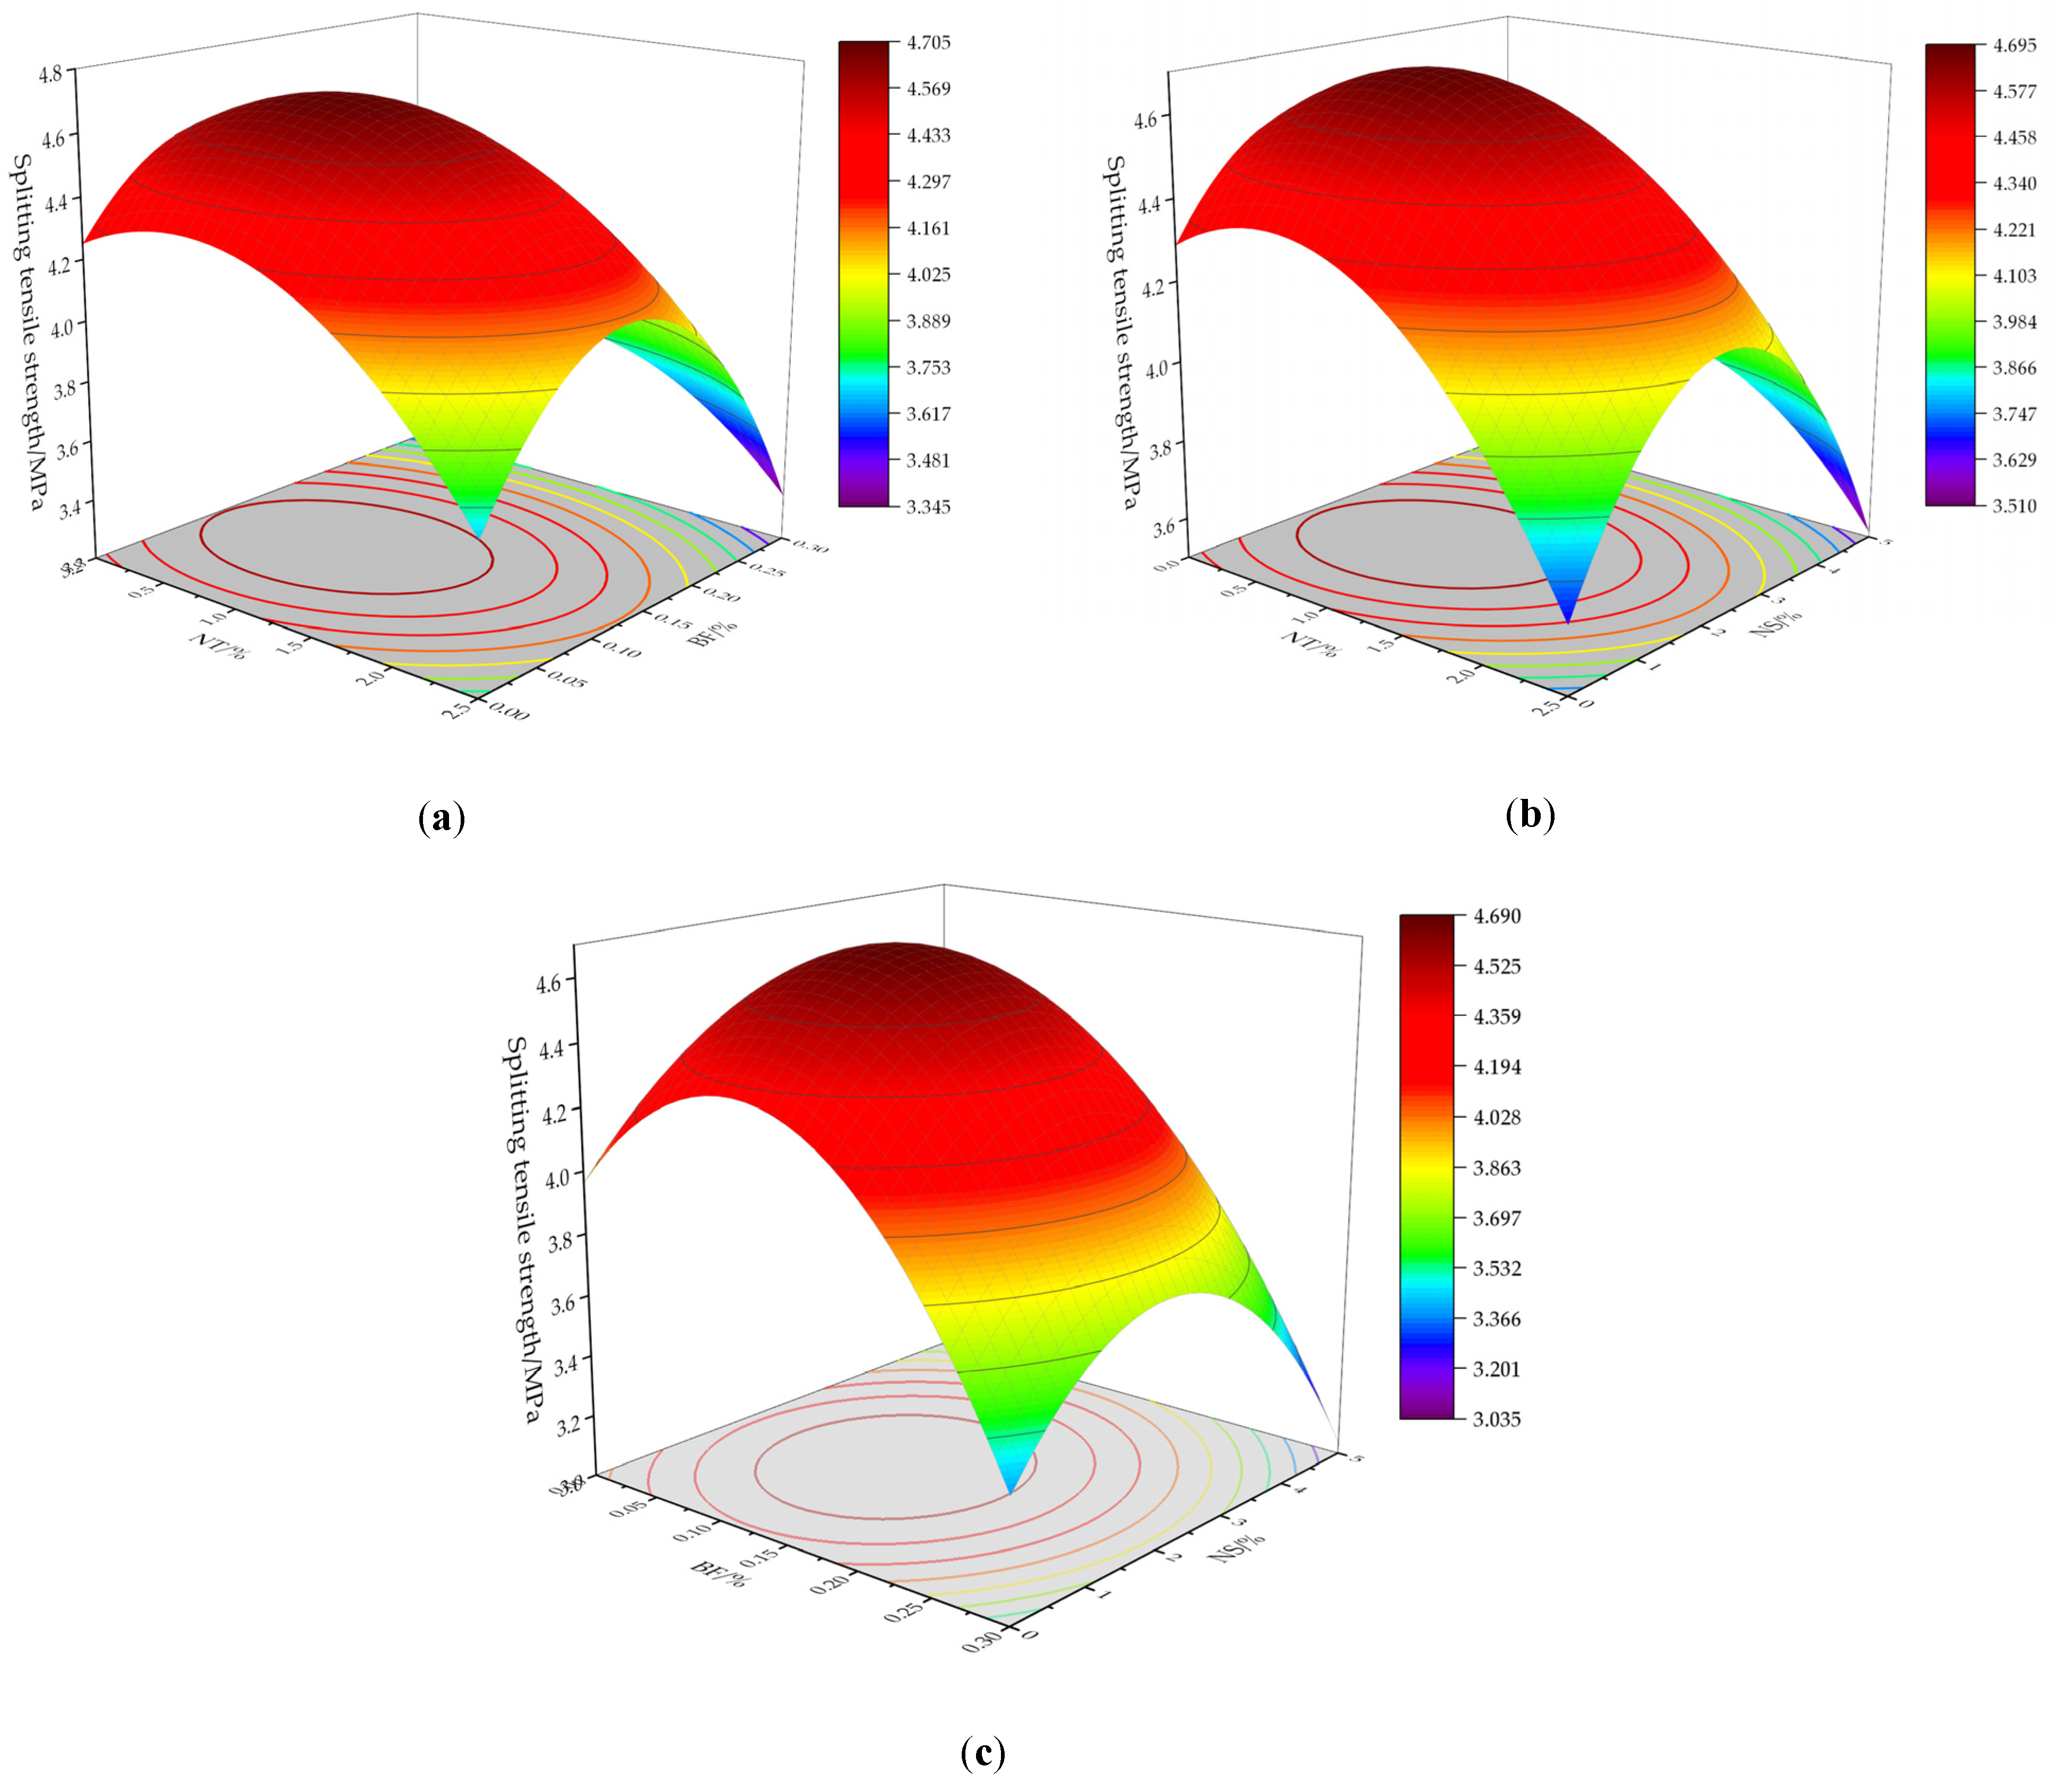
3.3.5. Splitting Tensile Strength of NSF Concrete

Figure 8 illustrates the impact of NT, BF, and NS on the splitting tensile strength of the concrete after 28 days. The splitting tensile strength exhibits a quadratic paraboloid shape with a downward opening, indicating the presence of a maximum value within the range of the experiment. Figure 8a–c all show that the splitting tensile strength increases and then decreases with the increase in the dosage of NT, BF, and NS, and a threshold value exists for their dosage. It is shown in Figure 8a,b that when BF doping is certain, excessive NS and NT will sharply reduce the splitting tensile strength (steeper surface). According to the results of the response surface experiments, the maximum value of splitting tensile strength is reached when the doping of NT is 0.78%, BF is 0.11%, and NS is 1.92%.
According to these findings, concrete splitting tensile strength may be enhanced by using modest quantities of NS, BF, and NT. This may be because when the concrete is cracked by force and the fracture surface extends to the fibers, the fibers transfer some of the stresses to the concrete and reduce the stress concentration of the concrete [55]. The volcanic ash effect in NS promotes the hydration of the concrete, and the increase in the C-S-H gel improves the splitting tensile strength [56]. The moderate amount of NT incorporated into concrete further compensated for the internal defects of the concrete.

3.3.6. Flexural Strength of NSF Concrete

Figure 9 shows the effect of NT, BF, and NS on the flexural strength of the concrete at 28 days. The flexural strength is parabolic with a downward opening, indicating a maximum value in the range of the supply test. Figure 9a–c all show that the flexural strength increases and then decreases with increasing amounts of NT, BF, and NS and there is a critical value for their amounts. From Figure 9a, when the dosage of NT is increased from 0% to 1.25% and that of BF is increased from 0% to 0.15%, the flexural strength increases by 12.4%. The flexural strength decreased by 18.80% when the dosage of NT was increased from 0% to 2.5% and the dosage of BF was increased from 0% to 0.3%. The same trend is also shown in Figure 9b,c. According to the results of the response surface experiments, the maximum value of split tensile strength was reached when the dosage of NT was 0.90%, BF was 0.11% and NS was 1.94%.
According to the aforementioned study, including a suitable quantity of NT, BF, and NS in concrete contributes to an enhancement in flexural strength. The main reason for this may be the uniformly dispersed fibers in the cement matrix, which form a mesh structure that effectively prevents cracks from developing. Especially when the stresses are transferred to the fibers, the fibers also share some of the stresses, which improves the flexural strength even more [57]. Furthermore, the right amount of NS and NT reduces the harmful pores in the concrete, making fewer concrete defects [58]. However, this situation is not always beneficial, while excessive amounts of fibers and nanomaterials form agglomerates in the concrete, preventing cement hydration and reducing the flexural strength of the concrete.

3.4. Modulus of Elasticity Analysis of NSF Concrete

The modulus of elasticity is an important parameter for evaluating the stiffness and deformation properties of concrete. During the structural design process, accurate knowledge of the modulus of elasticity of concrete is required to ensure that the designed structure can maintain the expected stiffness and deformation properties when subjected to loads. The correct value of the modulus of elasticity can help researchers perform stress analysis and deformation calculations more accurately, thus ensuring the safety and stability of the structure. Alfonso et al. [59] stated that the modulus of elasticity is related to the mechanical strength of concrete and that the type of aggregate and the water–cement ratio can affect the modulus of elasticity of concrete. The modulus of elasticity of the concrete in this experiment is shown in Figure 10. The research indicated the modulus of elasticity of the concrete can be increased by adding an appropriate amount of NS, NT, and BF to the concrete. And the elastic modulus of concrete was increased by a maximum of 28.62% and decreased by a maximum of 24.31% compared to the benchmark group NSF0.
The reason may be that the larger surface area and reactivity of NS and NT can fill the micropores in concrete, enhance the matrix compactness, and improve the overall strength and stiffness [60]. Furthermore, BF has a high modulus of elasticity and tensile strength, which can not only share part of the stress but also transfer part of the stress. However, excessive addition of these materials can also lead to the internal stress not being transferred well, resulting in the decrease in elastic modulus.

3.5. Optimization of Modified Concrete Design and Analysis of Results

According to the concrete experimental results in Table 6, the mixing amounts of NS, BF, and NT were controlled within the experimental range. And the RSM optimization was carried out with compressive, flexural, and splitting tensile strengths as the response objectives (Table 10). The optimum doping levels of NT, BF, and NS were obtained under the conditions in Table 10. When the above materials were doped at 0.85%, 0.11%, and 1.94%, respectively, the experiment achieved maximum satisfaction. However, there is always a difference between the experimental optimization results and the actual situation. In order to judge the desirability of the optimization results, three sets of parallel experiments were carried out with the same optimum admixture. The errors in concrete strength were less than 10%, which indicates that the optimization results of RSM are exact and can be used for engineering applications (Table 11). Table 12 shows the difference between the measured value and predicted values of the concrete, which showed a significant increase in strength. The compressive strength of the concrete was enhanced by 28.88%, split tensile strength by 23.68%, and flexural strength by 20.44%.

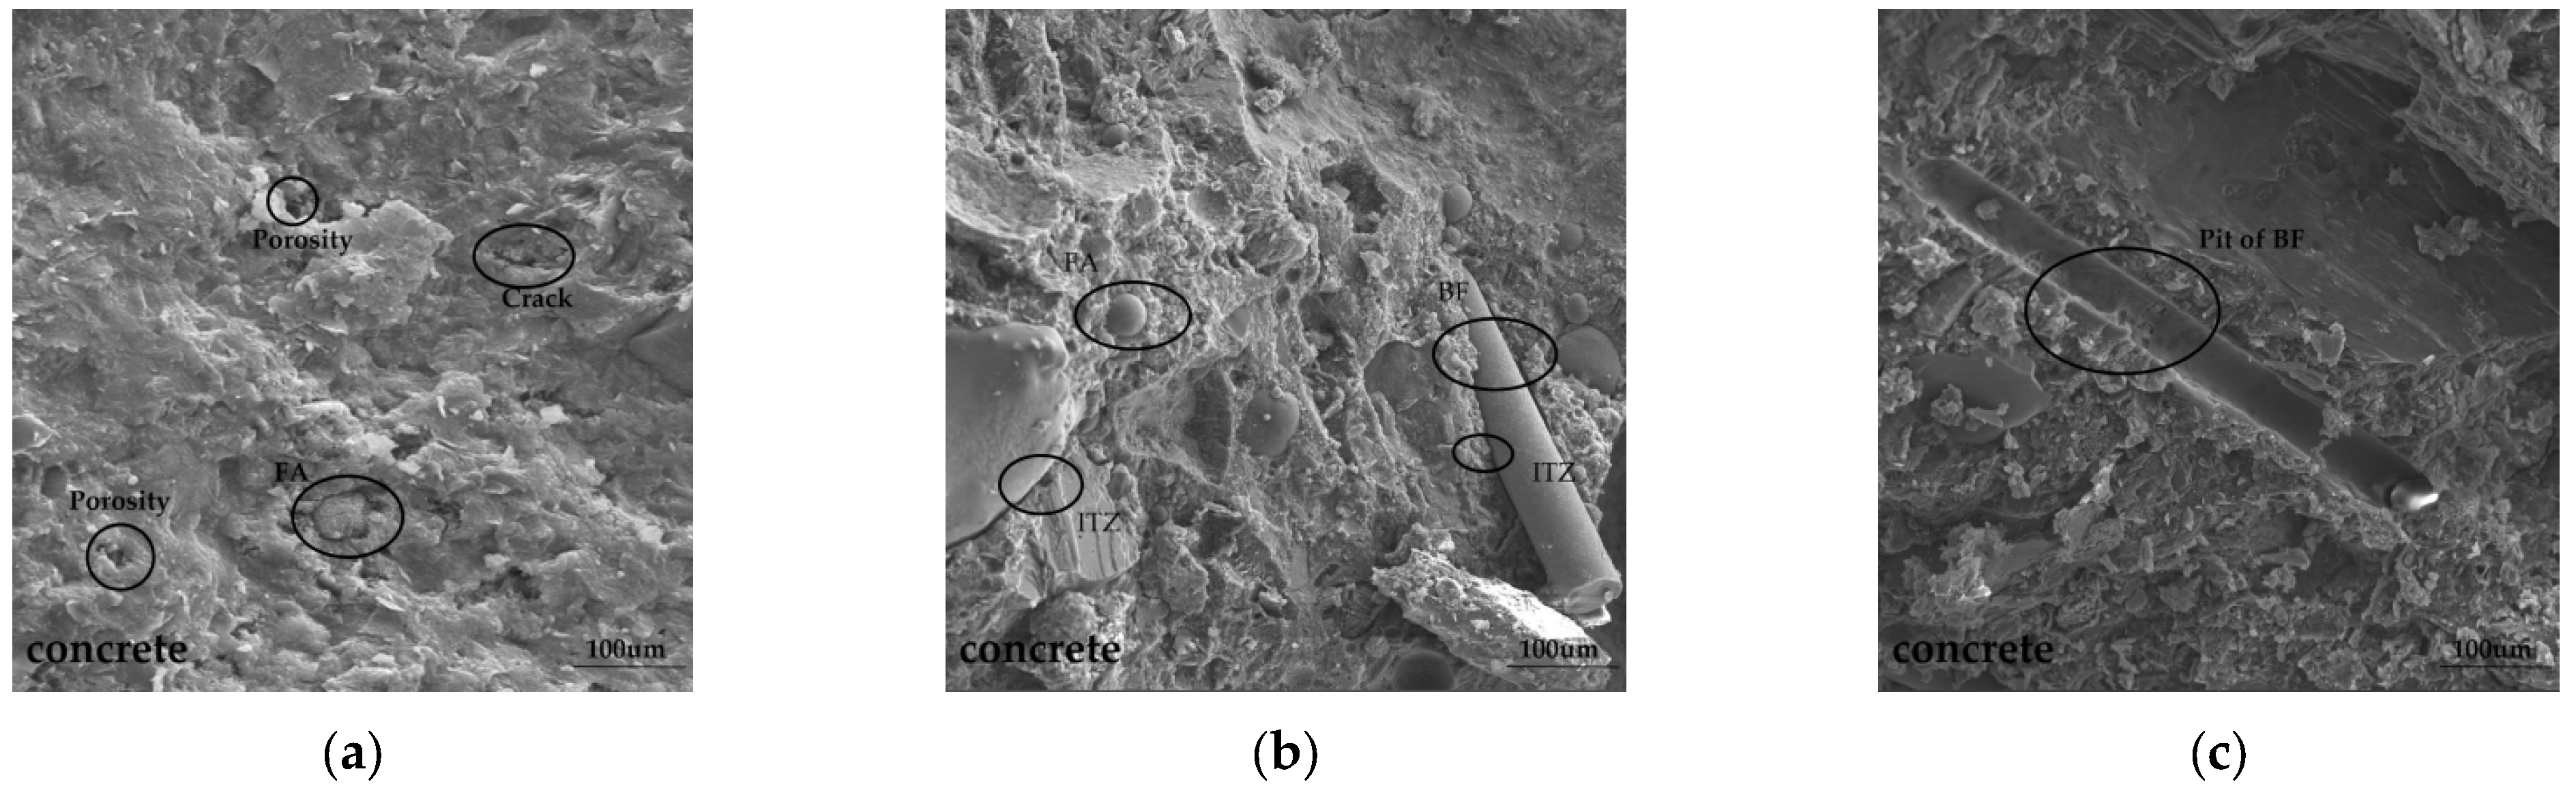
3.6. Analysis of Concrete Microstructure

The proposal of an interfacial transition zone (ITZ) for concrete makes the scholars’ understanding of concrete change from a two-phase host material to a three-phase host material [61]. Zhou et al. [62] pointed out that when fibers are added to concrete, the fibers act as a reinforcing phase (skeleton support) to fill in the concrete. In the stress concentration area, fibers can transfer as well as disperse the stress, thus reducing the generation of microcracks. Especially when the fibers are in the interfacial transition zone (ITZ), the fibers connect the ITZ with the cement paste, increasing the ability of the ITZ to resist stress concentration (Figure 11).
Figure 12 shows the SEM image of the concrete, which has a small number of pores and cracks. The main reason for this is that the water in the concrete gradually evaporates during the hydration process, resulting in the volume contraction of the concrete, which inevitably produces a certain number of pores. And cracks are caused by stress concentration in weak areas within the concrete [63].
The presence of spherical-like particles in Figure 12a is mainly due to the FA which is not involved in hydration. After a lot of research, adding FA to concrete will increase the late strength of concrete. The main reason is that FA participates in the secondary hydration of concrete over time, leading to a higher late strength of concrete [64]. In conclusion, Figure 11a shows that the concrete is dense.
Figure 12b,c show the SEM images of the optimized concrete, which shows a relative reduction in the number of pores and an overall denser appearance compared to NSF0. Figure 12b shows an ITZ between the aggregate, fibers, and cement paste, where the concrete is prone to cracking after stressing [62]. Figure 12c shows that the fibers show a pull-out phenomenon rather than fiber breakage due to sharing some of the stresses after the concrete matrix is stressed. The phenomenon is similar to the results studied by Zhang et al. [65], where the fibers in the concrete are pulled out because of the stresses endured. In conclusion, appropriate amounts of NT, BF, and NS can be incorporated into concrete to reduce the concrete’s porosity and improve the compactness of the concrete.

4. Conclusions

This experiment examined the link impacts of NT, BF, and NS on the strength of concrete by testing its mechanical strength using RSM-BBD. Parallel experiments confirmed the RSM optimization findings’ correctness, while scanning electron microscopy (SEM) examined the concrete microstructure. According to the study’s findings:
(1)
NS, BF, and NT reduced the concrete’s slump. The main reason for the situation is that the larger specific surface area of the nanomaterials and the surface tension of the fibers trapped some of the water, and more water was needed to improve the viscosity of the cement.
(2)
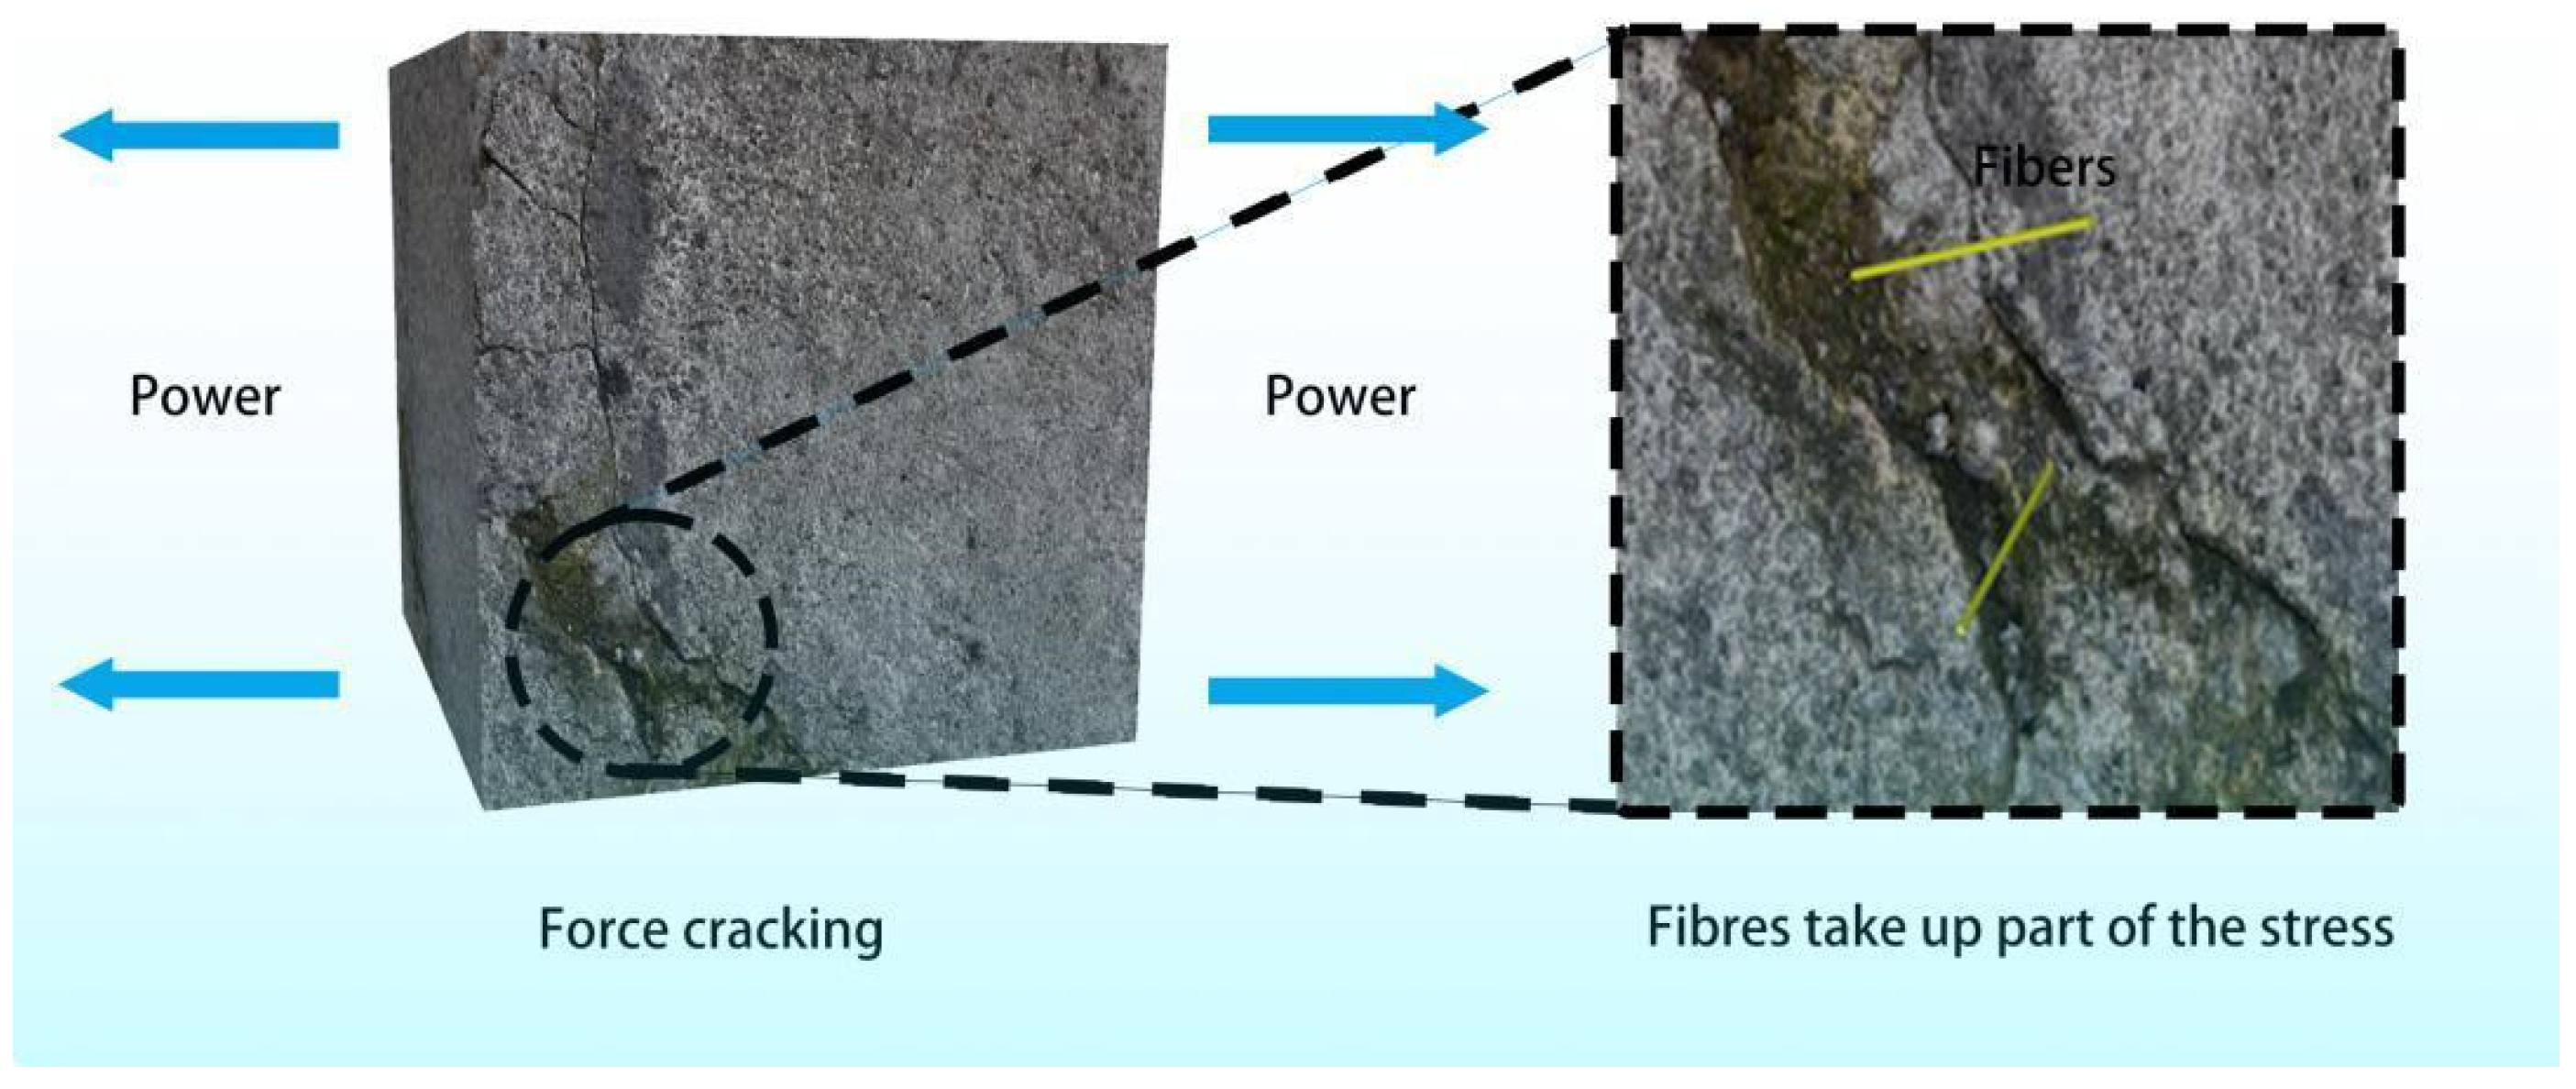
Incorporation of a moderate amount of NT, BF, and NS into concrete improves the damaged state of concrete, and also its microstructure becomes dense. The main reason for the situation is that the fibers dispersed some of the stresses in the concrete and resisted the dislodgement of the cement blocks. Additionally, the material effect of NT and NS reduced the pores in the concrete so that the cement specimens could have better integrity.
(3)
The admixture of NT, BF, and NS affects the mechanical properties of concrete. The compressive, splitting tensile, and flexural strengths of concrete were greatly affected by NT, BF, and NS. The interaction of NT and BF significantly affected the concrete’s compressive and flexural strengths. NT and NS significantly affected the concrete splitting tensile strength.
(4)
The optimum admixture of NT, BF, and NS was obtained by developing a thirst function optimization model for the mechanical strength of the concrete. Their optimum admixtures were 0.85%, 0.11% and 1.94%, respectively. The difference between the predicted and actual values was also compared using parallel tests and the error results were less than 10%, which shows that optimization model has high accuracy.
In summary, based on the RSM-BBD experiments, higher-performance concrete was obtained with improved mechanical properties and microstructure. In the time to come, the freeze–thaw damage characteristics of NSF concrete can be investigated in combination with numerical simulation for better engineering applications.

Author Contributions

Conceptualization, X.Y. and F.J.; methodology, X.Y., F.J. and X.W.; software, X.Y.; validation, X.Y. and Z.W.; formal analysis, X.W., Z.W. and Y.W.; investigation, X.Y.; resources, X.W., Y.D. and Y.W.; data curation, X.Y. and Z.W.; writing—original draft preparation, X.Y., Z.W. and Y.W.; writing—review and editing, X.W. and Z.W.; visualization, X.Y. and Z.W.; supervision, Y.D. and Z.W.; project administration, X.W. and Z.W.; funding acquisition, X.W. and Z.W. All authors have read and agreed to the published version of the manuscript.

Funding

This work was supported by the Heilongjiang Provincial Key R&D Program Guidance Category Scientific Research Projects (GZ20220138), Scientific Research Program of the Department of Ecology and Environment of Heilongjiang Province (HST2022GF004), Henan Provincial Science and Technology Research Project (Grant No. 232102320198), and Science and Technology Tackling Project of Henan Province (No. 232102320198).

Data Availability Statement

The available figures presented in this research are obtainable upon contact with the corresponding authors. Being open to the scientific public, these digital data will be part of our continuing investigation.

Conflicts of Interest

Author Yingxin Du was employed by the company Heilongjiang Heidai Water Conservancy Engineering Quality Inspection Co., Ltd. The remaining authors declare that the research was conducted in the absence of any commercial or financial relationships that could be construed as a potential conflict of interest.

References

  1. Lu, S.; Yang, J.; Wang, J. Experimental and theoretical analysis of steel tubed geopolymer concrete columns under axial compression. Constr. Build. Mater. 2024, 411, 134277. [Google Scholar] [CrossRef]
  2. Garcia, S.L.; Ferreira, J.; Dias, D.; Trindade, J. Theoretical and Experimental Study on Minimum Shear Reinforced Ratio in Concrete Beams. ACI Struct. J. 2024, 121, 47–59. [Google Scholar]
  3. Mariani, E.; Ingrassia, L.P.; Spadoni, S.; Canestrari, F. Laboratory Investigation on the Use of Geocomposites as Waterproofing Systems for Concrete Bridge Decks. J. Mater. Civ. Eng. 2024, 36, 04023544. [Google Scholar] [CrossRef]
  4. Concha, N.C. A robust carbonation depth model in recycled aggregate concrete (RAC) using neural network. Expert Syst. Appl. 2024, 237, 121650. [Google Scholar] [CrossRef]
  5. Li, T.; Nogueira, R.; Pereira, M.F.C.; de Brito, J.; Liu, J. Effect of the incorporation ratio of recycled concrete aggregate on the properties of self-compacting mortar. Cem. Concr. Compos. 2024, 147, 105429. [Google Scholar] [CrossRef]
  6. Huang, Z.; Chen, W.; Hao, H.; Siew, A.U.; Huang, T.; Ahmed, M.; Pham, T.M. Lateral impact performances of geopolymer concrete columns reinforced with steel-BFRP composite bars. Constr. Build. Mater. 2024, 411, 134411. [Google Scholar] [CrossRef]
  7. Lindholm, C.; Paananen, J.; Stevanovic, M.; Weiste, E.; Valkeapää, T. Requests for concrete actions in interaction: How support workers manage client participation in mental health rehabilitation. Pragmatics 2024, 34, 190–214. [Google Scholar] [CrossRef]
  8. Soylev, T.A.; François, R. Quality of steel–concrete interface and corrosion of reinforcing steel. Cem. Concr. Res. 2003, 33, 1407–1415. [Google Scholar] [CrossRef]
  9. Liu, X.; Wang, S.; Han, F.; Qin, J.; Lu, L.; Xue, Q.; Ji, Y. Mechanical relationship between compressive strength and sulfate erosion depth of basalt fiber reinforced concrete. Constr. Build. Mater. 2024, 411, 134412. [Google Scholar] [CrossRef]
  10. Rahman, M.N.; Serin, S.; Ozer, H. Effectiveness of a Pullout Test Method Developed to Characterize Fundamental Fiber-Matrix Interfacial Mechanisms in Viscoelastic Asphalt Concrete. J. Mater. Civ. Eng. 2024, 36, 04024185. [Google Scholar] [CrossRef]
  11. Alex, A.G.; Jose, P.A.; Antony, M.R.; Dhanalakshmi, K. The Effect of Partial Replacement of Cement with Diatomaceous Earth (DE) and Polypropylene Fibers (PPF) on Fresh, Hardened, and Durability Properties of Concrete. Int. J. Concr. Struct. Mater. 2024, 18, 24. [Google Scholar] [CrossRef]
  12. Zou, Q.Q.; Fu, B.; Chen, J.F.; Teng, J.G. Stress-strain behaviour of carbon fibre reinforced polymer-confined concrete containing macro fibres recycled from waste glass fibre reinforced polymer. Adv. Struct. Eng. 2024, 27, 1189–1208. [Google Scholar] [CrossRef]
  13. Gong, S.; Su, M.; Zhang, J.; Peng, H. Flexural behavior of reinforced concrete beams strengthened with gradually prestressed near surface mounted carbon fiber-reinforced polymer strips under static and fatigue loading. Adv. Struct. Eng. 2024, 27, 1234–1250. [Google Scholar] [CrossRef]
  14. Yang, X.; Huang, J.; Peng, L.; He, Y. Research on the mechanism of elevated permeability resistance in recycled glass fiber reinforced concrete. Case Stud. Constr. Mater. 2024, 20, e03173. [Google Scholar] [CrossRef]
  15. Kunchariyakun, K.; Sinyoung, S.; MacKenzie, K.J.D.; Boonyung, W.; Suwannaphong, C.; Pantong, K.; Dungsang, P. Experimental study of lightweight concrete prepared from super absorbent polymers (SAPs) and glass fibers (GF). J. Asian Archit. Build. Eng. 2024, 23, 994–1006. [Google Scholar] [CrossRef]
  16. Pournoori, P.; Davarpanah, T.Q.A.; Rajaee, A.; Ghodratnama, M.; Abrishami, S.; Masoodi, A.R. Experimental exploration of fracture behavior (pure mode III) in eco-friendly steel fiber-reinforced self-compacting concrete with waste tempered glass as coarse aggregates. Sci. Rep. 2024, 14, 9043. [Google Scholar] [CrossRef]
  17. Xu, X.; Jiang, Z.; Wan, M.; Liu, P.; Zeng, H. Experimental study on performance of reinforced concrete short columns repaired and strengthened with Basalt fiber ultra-high-performance concrete (BF-UHPC). In Structures; Elsevier: Amsterdam, The Netherlands, 2024; Volume 62, p. 106170. [Google Scholar]
  18. Zhou, C.; Dai, F.; Liu, Y.; Wei, M.; Gai, W. Experimental assessment on the dynamic mechanical characteristics and cracking mechanism of hybrid basalt-sisal fiber reinforced concrete. J. Build. Eng. 2024, 88, 109151. [Google Scholar] [CrossRef]
  19. Yang, W.; Huang, Y.; Tang, Z.; Xiong, X.; Li, C.; Zhong, X.; Liu, L.; Zhou, H.; Zhang, X. Impermeability performance and corrosion resistance mechanism of basalt fiber recycled concrete under the coastal tidal environment. Constr. Build. Mater. 2024, 411, 134510. [Google Scholar] [CrossRef]
  20. Luo, H.Y.; Jiang, J.S.; Zhao, K. Damage characteristics of basalt fiber recycled concrete under freeze-thaw cycle based on energy dissipation. Compos. Sci. Eng. 2023, 5, 86–93. [Google Scholar]
  21. Deng, Z.; Ding, J. Experimental Study on the Dispersibility and Flexural Toughness of Basalt Fibers in BFRC. China Concr. Cem. Prod. 2020, 1, 47–50. [Google Scholar]
  22. Wang, L.; Zhao, Y.; Song, B.; Xing, Y.; He, X. Fracture behavior of basalt fiber-reinforced concrete subjected to high temperatures. Struct. Concr. 2023, 24, 3147–3161. [Google Scholar] [CrossRef]
  23. Fahmy, M.A.; Abu El-Hassan, M.M.; Kamh, G.M.; Bashandy, A.A. Investigation of Using Nano-silica, Silica Fume and Fly Ash in High Strength Concrete. Eng. Res. J. 2020, 43, 211–221. [Google Scholar] [CrossRef]
  24. Yang, L.; Zhu, Z.; Zhang, D.; Sun, H.; Huo, W.; Zhang, J.; Wan, Y.; Zhang, C. Influence mechanism of Nano-SiO2 on geopolymer recycled concrete: Change mechanism of the microstructure and the anti-carbonation mechanism. Cem. Concr. Compos. 2024, 146, 105364. [Google Scholar] [CrossRef]
  25. Fang, J.; Zhao, L.; Shi, J. Frost resistance and pore structure of concrete incorporated with rubber aggregates and nano-SiO2. Materials 2021, 14, 1170. [Google Scholar] [CrossRef]
  26. Han, J.; Wang, J.; Li, G.; Zhang, L.; Lu, Y.; Qin, Y. Effect of Modified Nano-SiO2 Film-forming Composite Coating on Hydrophobicity and Carbonation Resistance of Concrete. Sci. Technol. Eng. 2019, 19, 268–273. [Google Scholar]
  27. Zhang, P.; Fu, S.; Zhang, K.; Zhang, T. Mechanical properties of polyvinyl alcohol fiber-reinforced concrete composite containing fly ash and nano-SiO2. Sci. Adv. Mater. 2018, 10, 769–778. [Google Scholar]
  28. Gulati, K.C. A Thermomechanical Theory of Composite Materials; University of Texas at Austin: Austin, TX, USA, 1972. [Google Scholar]
  29. Onyelowe, K.C.; Ebid, A.M.; Ghadikolaee, M.R. GRG-optimized response surface powered prediction of concrete mix design chart for the optimization of concrete compressive strength based on industrial waste precursor effect. Asian J. Civ. Eng. 2024, 25, 997–1006. [Google Scholar] [CrossRef]
  30. Ren, F.; Du, J.; Yang, X.; Huang, X. Optimization on a novel irregular snowflake fin for thermal energy storage using response surface method. Int. J. Heat Mass Transf. 2023, 200, 123521. [Google Scholar] [CrossRef]
  31. Chen, H.; Deng, T.; Du, T.; Chen, B.; Skibniewski, M.J.; Zhang, L. An RF and LSSVM–NSGA-II method for the multi-objective optimization of high-performance concrete durability. Cem. Concr. Compos. 2022, 129, 104446. [Google Scholar] [CrossRef]
  32. Chang, G.; Hua, X.; Liu, X.; Chen, L.; Wang, E.; Sun, B. Fluidity influencing factor analysis and ratio optimization of new filling slurry based on the response surface method. J. Renew. Mater. 2022, 10, 1439. [Google Scholar] [CrossRef]
  33. Parhi, S.K.; Patro, S.K. Application of R-curve, ANCOVA, and RSM techniques on fracture toughness enhancement in PET fiber-reinforced concrete. Constr. Build. Mater. 2024, 411, 134644. [Google Scholar] [CrossRef]
  34. Sadeghian, A.; Moradi Shaghaghi, T.; Mohammadi, Y.; Taghipoor, H. Performance Assessment of Hybrid Fibre-Reinforced Concrete (FRC) under Low-Speed Impact: Experimental Analysis and Optimized Mixture. Shock. Vib. 2023, 2023, 7110987. [Google Scholar] [CrossRef]
  35. Adedokun, S.I.; Anifowose, M.A. Optimal Replacement of Granite Modified with Ife Iron and Steel Slag on Strength Properties of Concrete. Int. J. Eng. Res. Afr. 2022, 58, 183–190. [Google Scholar] [CrossRef]
  36. Bypour, M.; Yekrangnia, M.; Kioumarsi, M. Predicting the shear capacity of composite steel plate shear wall with the application of RSM. Eng. Struct. 2024, 301, 117263. [Google Scholar] [CrossRef]
  37. Qu, G.; Zheng, M.; Zhang, W.; Jing, H.; Ou, Z. Preparation and acceleration mechanism of a ternary hardening accelerator for high-performance concrete with full aeolian sand. Constr. Build. Mater. 2023, 369, 130629. [Google Scholar] [CrossRef]
  38. Alabay, P.; Elaldi, F. Low Velocity Impact Behaviour of Composite Laminates Containing TiC and ZrC Nanoparticles in Resin System. Nano Hybrids Compos. 2023, 38, 25–35. [Google Scholar] [CrossRef]
  39. Urkhanova, L.A.; Lkhasaranov, S.A.; Buyantuev, S.L. Modification of cement and concrete with carbon nanomaterials, obtained by plasma method. Int. J. Civ. Eng. Technol. 2018, 9, 652–656. [Google Scholar]
  40. Wu, Z.; Shi, C.; Khayat, K.H.; Wan, S. Effects of different nanomaterials on hardening and performance of ultra-high strength concrete (UHSC). Cem. Concr. Compos. 2016, 70, 24–34. [Google Scholar] [CrossRef]
  41. Onuaguluchi, O.; Banthia, N. Sulfate resistance of cement composites containing Nano-Fibrillated Cellulose (NFC). Cem. Concr. Compos. 2023, 135, 104831. [Google Scholar] [CrossRef]
  42. Gan, Y.; Chen, J.; Zeng, H.; Zeng, D. Whole-process analytical model on progressive collapse response of reinforced concrete structures under middle column loss. Eng. Struct. 2024, 302, 117375. [Google Scholar] [CrossRef]
  43. Rathod, N.; Gonbare, M.; Pujari, M. Basalt fiber reinforced concrete. Int. J. Sci. Res. 2013, 4, 359–361. [Google Scholar]
  44. Zhang, X.; Hou, J.; Sun, H.; Zhang, C.; Huang, J.; Wang, J.; Hou, P. Rheological property and stability of nano-silica modified self-compacting concrete with manufactured sand. Constr. Build. Mater. 2023, 401, 132935. [Google Scholar] [CrossRef]
  45. Box, G.E.P.; Draper, N.R. Empirical Model-Building and Response Surfaces; John Wiley & Sons: Hoboken, NJ, USA, 1987. [Google Scholar]
  46. Myers, R.H.; Montgomery, D.C.; Anderson-Cook, C.M. Response Surface Methodology: Process and Product Optimization Using Designed Experiments; John Wiley & Sons: Hoboken, NJ, USA, 2016. [Google Scholar]
  47. Debele, A.D.; Demeke, S.; Bekele, T.; Malimo, M. Recycling and reusing potential of disposable low-density polyethylene plastic waste for flexible paver tile construction for outdoor application. Heliyon 2024, 10, e29381. [Google Scholar] [CrossRef]
  48. GB/T 50082-2009; Standard for Test Methods of Long-Term Performance and Durability of Ordinary Concrete. China Building Industry Press: Beijing, China, 2009.
  49. Traina, L.A.; Mansour, S.A. Biaxial strength and deformational behavior of plain and steel fiber concrete. ACI Mater. J. 1991, 88, 00615123. [Google Scholar]
  50. Chen, F.; Xu, B.; Jiao, H.; Chen, X.; Shi, Y.; Wang, J.; Li, Z. Triaxial mechanical properties and microstructure visualization of BFRC. Constr. Build. Mater. 2021, 278, 122275. [Google Scholar] [CrossRef]
  51. Mondal, S.; Ghosh, A.D. Response Surface Methodology-Based Optimization of Bacterial Cell Concentration for Microbial Concrete. Iran. J. Sci. Technol. Trans. Civ. Eng. 2022, 46, 1087–1102. [Google Scholar] [CrossRef]
  52. Raouache, E.; Logzit, N.; Driss, Z.; Khalfallah, F. Optimization by RSM of reinforced concrete beam process parameters. Am. J. Mech. Eng. 2018, 6, 66–74. [Google Scholar]
  53. Adamu, M.; Ibrahim, Y.E.; Abdel Daiem, M.M.; Alanazi, H.; Elalaoui, O.; Ali, N.M. Optimization and modelling the mechanical performance of date palm fiber-reinforced concrete incorporating powdered activation carbon using response surface methodology. Materials 2023, 16, 2977. [Google Scholar] [CrossRef]
  54. Buettner, N.; Iyacu, G.; Akono, A.T. Colloidal nanosilica promotes high-density calcium-silicate-hydrates in fine recycled concrete aggregate mortar. Cem. Concr. Res. 2024, 180, 107498. [Google Scholar] [CrossRef]
  55. Wang, K.; Wang, W.; Guo, Y.; Liu, Y.; Duan, P.; Shi, W.; Liu, Y. Grey modeling study on mechanical properties and pore structure of concrete with different basalt fiber contents based on NMR. J. Build. Eng. 2024, 89, 109287. [Google Scholar] [CrossRef]
  56. Zhang, J.; Wang, Y.; Li, X.; Zhang, Y.; Wu, L. Enhancing Concrete Mechanical Properties through Basalt Fibers and Calcium Sulfate Whiskers: Optimizing Compressive Strength, Elasticity, and Pore Structure. Materials 2024, 17, 1706. [Google Scholar] [CrossRef]
  57. Chin, S.C.; Shaaban, I.G.; Rizzuto, J.P.; Khan, S.U.; Mohamed, D.; Roslan, N.I.M.; Aziz, A.A. Predictive models for mechanical properties of hybrid fibres reinforced concrete containing bamboo and basalt fibres. Structures 2024, 61, 106093. [Google Scholar] [CrossRef]
  58. Khan, M.H.; Qiuhong, Z.; Sikandar, M.A.; Khan, B.; Zhu, H.; Khan, M.S. Evaluation of mechanical strength, gamma-ray shielding characteristics, and ITZ microstructural properties of heavyweight concrete using nano-silica (SiO2) and barite aggregates. Constr. Build. Mater. 2024, 419, 135483. [Google Scholar] [CrossRef]
  59. Alfonso, D.; Dugarte, M.; Carrillo, J.; Arteta, C.A. Effect of aggregate type on the elastic modulus and compressive behavior of concrete: A case study in Colombia. Constr. Build. Mater. 2024, 411, 134131. [Google Scholar] [CrossRef]
  60. Alam, M.F.; Shubham, K.; Kumar, S.; Srivastava, A.K.L. Enhancing high-strength self-compacting concrete properties through Nano-silica: Analysis and prediction of mechanical strengths. J. Build. Pathol. Rehabil. 2024, 9, 43. [Google Scholar] [CrossRef]
  61. Xiao, T.; Liang, X.; Du, S. Development of high-volume fly ash concrete with improved interfacial transition zone. J. Build. Eng. 2024, 87, 109050. [Google Scholar] [CrossRef]
  62. Zhou, M.; He, X.; Wang, H.; Wu, C.; He, J.; Wei, B. Mechanical properties and microstructure of ITZs in steel and polypropylene hybrid fiber-reinforced concrete. Constr. Build. Mater. 2024, 415, 135119. [Google Scholar] [CrossRef]
  63. Rajkohila, A.; Chandar, S.P. Assessing the effect of natural fiber on mechanical properties and microstructural characteristics of high strength concrete. Ain Shams Eng. J. 2024, 15, 102666. [Google Scholar] [CrossRef]
  64. Zhang, D.; Zhu, T.; Ai, Q.; Mao, M.; Li, J.; Yang, Q. Performance of coal gangue concrete with fly ash and ground-granulated blast slag: Rheology, mechanical properties and microstructure. Constr. Build. Mater. 2024, 427, 136250. [Google Scholar] [CrossRef]
  65. Zhang, X.; Zhou, G.; Xu, P.; Fu, L.; Deng, D.; Kuang, X.; Fan, Y. Mechanical properties under compression and microscopy analysis of basalt fiber reinforced recycled aggregate concrete. Materials 2023, 16, 2520. [Google Scholar] [CrossRef]
Figure 1. Stresses on concrete material.
Buildings 14 02120 g001
Figure 2. Flowchart of concrete production.
Buildings 14 02120 g002
Figure 3. Concrete admixtures: (a) NT, (b) BF, (c) NS.
Buildings 14 02120 g003
Figure 4. Concrete slump: (a) concrete slump test results, (b) Experimental diagram of concrete collapse.
Buildings 14 02120 g004
Figure 5. Concrete compressive damage state: (a) NSF0, (b) NSF9.
Buildings 14 02120 g005
Figure 6. Model diagrams: (ac) Diagnostic diagram of compressive strength. (df) Diagnostic diagram of splitting strength. (gi) Diagnostic diagram of flexural strength.
Buildings 14 02120 g006aBuildings 14 02120 g006b
Figure 7. Surface diagram of concrete compressive response: (a) NT and BF, (b) NT and NS, (c) BF and NS.
Buildings 14 02120 g007
Figure 8. Response surface diagram of concrete splitting tensile strength: (a) NT and BF, (b) NT and NS, (c) BF and NS.
Buildings 14 02120 g008
Figure 9. Concrete flexural strength response surface plot: (a) NT and BF, (b) NT and NS, (c) BF and NS.
Buildings 14 02120 g009
Figure 10. Modulus of elasticity of concrete.
Buildings 14 02120 g010
Figure 11. Fiber concrete interface overzone enhancement model.
Buildings 14 02120 g011
Figure 12. Microcharacterization of concrete: (a) NSF0, (b,c) optimized concrete.
Buildings 14 02120 g012
Table 1. Cement performance indicators.
Type of CementStabilityTimes/minCompressive Strength/MPaFlexural Strength/MPa
CondensationCongeal3d28d3d28d
P.O 42.5eligible28033524.246.35.06.7
Table 2. Physical properties of sand.
Sand TypeFineness ModulusApparent Density/kg·m−3Grain Size/mmPacking Density/kg·m−3Moisture Content/%Mud Content%
Mesopotamia2.42594≤316063.21.5
Table 3. Coarse aggregate performance indicators.
Coarse AggregateCrushing Indicators/%Apparent Density/kg·m−3Grain Size/mmBulk Density
/kg·m−3
Mud Content/%
crushed stone5.4277110~3113600.7
Table 4. Physical and mechanical properties of basalt fiber.
Lengths/mmMonofilament Diameter/μmDensities/g·cm−3Modulus of Elasticity/GPaTensile Strength/MPaElongation at Break/%
12132.63~2.6591~1103000~48002.4~3.0
Table 5. Free factors and response values.
BrochureUnitTypologyLevel
−101
A: NT%factor01.252.5
B: BF%factor00.150.3
C: NS%factor02.55
R1: Compressive strengthMParesponse value
R2: Splitting tensile strengthMParesponse value
R3: Flexural strengthMParesponse value
Table 6. Experimental results of RSM.
Experimental GroupABCDegree of SlumpR1R2R3Modulus of Elasticity
%%%mmMPaMPaMPaGPa
NSF000012641.23.87.2432.5
NSF100.15010244.64.37.7435.6
NSF22.50.1508237.23.66.9430.7
NSF31.250.306333.83.46.6328.3
NSF41.250011245.147.5636.8
NSF5002.510546.74.27.8237.2
NSF62.50.32.55131.33.46.3527.1
NSF700.32.56333.33.56.4328.4
NSF81.250.152.56750.34.88.7939.2
NSF91.250.152.57252.34.68.4640.9
NSF102.502.58738.23.76.8331.6
NSF111.250.152.57050.64.78.6741.8
NSF121.250.152.56551.44.58.4241.4
NSF131.250.152.56351.94.68.5340.7
NSF141.25058235.33.56.6229.2
NSF1500.1558939.43.77.0331.3
NSF162.50.1555431.23.56.2427.4
NSF171.250.354725.13.05.8324.6
Table 7. ANOVA of the compressive strength regression model.
SourceSum of SquareDegree of FreedomMean SquareF Valuep Value
Model1193.999132.6771.70<0.0001significant
A85.15185.1546.020.0003
BF218.401218.40118.03<0.0001
C110.261110.2659.590.0001
AB10.56110.565.710.0482
AC0.1610.160.0860.7772
BC0.3010.300.160.6980
A2119.391119.3964.52<0.0001
B2311.411311.41168.30<0.0001
C2261.121261.12141.12<0.0001
Residual12.9571.85
Lack of Fit10.0933.364.710.0844not significant
Cor Total1206.9416
Note: Adj R-Squared = 0.9755, Pred R-Squared = 0.8625, C.V. = 3.31%, Adequate Precision = 24.095.
Table 8. Analysis of variance of cleavage tensile strength regression model.
SourceSum of SquareDegree of FreedomMean SquareF Valuep Value
Model4.9190.5554.97<0.0001significant
A0.2810.2828.330.0011
B0.5510.5555.520.0001
C0.3210.3232.230.0008
AB0.04010.0404.030.0847
AC0.06310.0636.290.0405
BC2.50 × 10−312.50 × 10−30.250.6312
A20.4310.4343.430.0003
B21.6211.62163.02<0.0001
C21.2511.25125.96<0.0001
Residual0.07079.929 × 10−3
Lack of Fit0.01735.833 × 10−30.450.7318not significant
Cor Total4.9816
Note: Adj R-Squared = 0.9681, Pred R-Squared = 0.9275, C.V. = 2.53%, Adequate Precision = 20.969.
Table 9. Analysis of variance of the regression model for flexural strength.
SourceSum of SquareDegree of FreedomMean SquareF Valuep Value
Model14.8491.6579.73<0.0001Significant
A0.8810.8842.770.0003
B1.6111.6177.91<0.0001
C1.2411.2459.980.0001
AB0.2110.2110.010.0158
AC2.500 × 10−512.500 × 10−51.209 × 10−30.9732
BC4.900 × 10−314.900 × 10−30.240.6413
A22.0312.0398.21<0.0001
B24.4014.40212.68<0.0001
C23.3513.35162.02<0.0001
Residual0.1470.021
Lack of Fit0.05030.0170.710.5954not Significant
Cor Total14.9816
Note: Adj R-Squared = 0.9779, Pred R-Squared = 0.9365, C.V. = 1.96%, Adequate Precision = 24.676.
Table 10. Experimental curves and optimization criteria.
FormGoalLower LimitUpper Limit
Ain range02.5
Bin range00.3
Cin range05
R1maximize25.1 MPa52.3 MPa
R2maximize3.0 MPa4.8 MPa
R3maximize5.83 MPa8.79 MPa
Table 11. Variance between projected and actual values.
Experimental GroupPredicted Value/MPa Actual Value/% Inaccuracy/%
R1R2R3R1R2R3R1R2R3
153.14.78.7250.24.37.945.789.39.82
253.44.88.699.032.081.83
348.74.58.560.564.260.35
Table 12. Difference between baseline and projected values.
TypologyR1/MPaR2/MPaR3/MPaEnhancement Ratio/%
R1R2R3
TBF041.23.87.24---
Projected value53.14.78.7228.8823.6820.44
Disclaimer/Publisher’s Note: The statements, opinions and data contained in all publications are solely those of the individual author(s) and contributor(s) and not of MDPI and/or the editor(s). MDPI and/or the editor(s) disclaim responsibility for any injury to people or property resulting from any ideas, methods, instructions or products referred to in the content.

