Abstract
“Not In My Back Yard” (NIMBY) conflicts have emerged as a significant challenge in the siting and construction of power grid projects. Traditional risk management methods are often inadequate for addressing the complex interactions between the multiple factors involved in such projects. To explain the relationship between different influencing factors, this paper constructs the hierarchy between the influencing factors using the Interpretive Structural Model (ISM) and carries out a causal analysis of NIMBY conflicts in power grid construction projects using the Bayesian network model. The results of the ISM hierarchical map show that high risk perception and construction practices lacking refinement are the most direct causes of NIMBY incidents. The Bayesian network model indicates that poor construction practices, negative public opinion, high risk perception, inadequate risk assessment and emergency response mechanisms, and negative externalities are the most sensitive factors within the causal system of NIMBY incidents and require priority attention. An increase in risk perception is also found to significantly escalate the severity of NIMBY conflicts. The insights gleaned in this study may provide valuable guidance for managing NIMBY conflicts in power grid construction projects.
1. Introduction
Power grids are a vital public infrastructure because they ensure a safe and stable energy supply, optimizing resource allocation and driving economic growth. Power grid construction projects are foundational to the development of modern Chinese society [1]. These projects are highly complex and multifaceted, characterized by lengthy durations, substantial investments, cross-regional layouts, rigorous technical specifications, stringent safety standards, significant environmental implications, and a strong correlation with societal interests [2].
China’s power grid construction has experienced rapid growth in recent years. By the end of 2022, the total length of transmission lines of 220 kV and above within the national power grid reached 880,000 km, marking a 3.4% increase compared to 2021. The investment in these projects also grew to 500.6 billion yuan, reflecting a 1.8% increase compared to the previous year. Despite this growth, the planning, construction, and operation of such projects often encounter opposition and resistance from local communities due to their associated negative externalities (e.g., economic losses and health or environmental risks). This resistance often leads to “Not In My Back Yard” (NIMBY) phenomena [3], which can impede project implementation as well as jeopardize societal harmony, stability, and public safety. The increasing prevalence of NIMBY conflicts presents a significant challenge for power grid enterprises as they strive to balance development with community interests.
Research concerning NIMBY risks has mainly centered on residents’ acceptance of facilities like power grid projects from a multidisciplinary perspective involving social psychology and human behavior. These studies have tended to focus on various dimensions including institutional and environmental factors, as well as individual public factors [4]. Some scholars have also examined the economic impacts of NIMBYism on market value and resource allocation [5]. NIMBYism is recognized not just as a technical and environmental concern but also as a complex socio-economic challenge [6].
In power grid construction projects, public opposition typically centers on safety and environmental concerns like radiation, pollution, and explosions, often compounded by irrational fears. Such opposition is exacerbated by factors like perceived governmental indifference, information asymmetry, and irregularities emerging in the construction process, leading to NIMBY conflicts through protests, roadblocks, petitions, and extensive public complaints [7]. Power grid projects increasingly incorporate digital technologies, new energy solutions, and eco-friendliness considerations, further increasing the complexity of managing NIMBY risks [8].
NIMBY conflicts associated with these projects are influenced by numerous factors, including public participation, the public opinion climate, perceived risks, and perceived benefits [3]. However, current studies often fall short when comprehensively accounting for the intricate relationships and interactions among the multiple risk factors affecting power grid construction projects [9]. In efforts to address these gaps, this paper poses two research questions: How do influencing factors interact to trigger NIMBY conflicts? What is the likelihood of these factors emerging and to what extent are they influential? To answer these, an Interpretive Structural Modeling–Bayesian Network (ISM–BN) model is employed to systematically identify relevant risk factors, explore sensitive factors, and reveal key causal pathways in NIMBY conflicts associated with power grid projects while assessing the influence intensity of each risk factor. The findings of this work may enrich the interdisciplinary body of NIMBY-related research and provide actionable insights for government agencies and enterprises. Such insights are crucial for developing targeted preventive and management strategies, facilitating the smooth implementation of power grid projects, and ensuring sustainable development.
2. Materials and Methods
2.1. Factors
Focusing on NIMBYism toward power grid construction projects, this study gathered data on 25 typical instances of public resistance-related conflicts associated with these projects using a combination of literature review and web searches. A comprehensive database of events was established. Then, key factors triggering NIMBY conflicts were identified through expert interviews. The identified influencing factors are presented in Table 1. For convenience, we denote the occurrence of the target factor, i.e., NIMBY, as Y in the software. Due to space constraints, the detailed 25 case scenarios are provided in Appendix A for review.

Table 1.
Impact factors related to NIMBY events for power grid construction projects.
2.2. ISM Hierarchical Analysis
The Interpretative Structural Modeling (ISM) method is an engineering technique utilized to describe and analyze the structure of complex systems. Essentially, ISM serves to construct a structural model that reveals the hierarchical relationships and interactions among various factors. The ISM method was used in this study to analyze the relationships between the influencing factors in NIMBY conflicts related to power grid projects. There are three steps in this study.
Step 1: Construct the adjacency matrix A.
Step 2: Construct the reachability matrix K. The results from the first step were integrated into the unit matrix, i.e., K = A + I, to obtain a reachability matrix.
Step 3: Decomposing the factor hierarchy. Based on the reachability matrix K, the reachable set and prior set were organized using Equations (2)–(4).
The reachable set (R) represents the nodes that are directly or indirectly interconnected with each node, and the prior set (Q) represents the influences or preconditions preceding that node. An intersection table was used to compare the reachable set to the prior set, revealing intersections (C) between them.
2.3. Bayesian Network Modeling
The Bayesian Network (BN) is an effective probabilistic graphical model that represents conditional dependencies between variables, facilitating inference in the presence of uncertainties. The BN method involves systematically assessing and predicting interactions and effects between variables using both empirical data and expert insights. The steps involved are outlined below.
Step 1: Using the ISM hierarchical map, the BN was constructed in GeNIe 4.1 software. Conditional probabilities were input for each factor while ensuring data authenticity and scientific rigor.
Step 2: The strength of connections between factors was calculated using the CPT for each node, representing the extent to which the probability distribution for a child node is influenced by the state of its parent node. The Hellinger distance was employed to quantify this relationship, as a measure of the distance between two probability distributions (P and Q). The Hellinger distance is defined as , where pi and qi denote the probability of distributions P and Q on the ith sample, respectively.
Step 3: When incidents of NIMBYism occur, governments must identify efficient paths to resolve them. Overly long causal pathways can be problematic as intervening in key factors might initiate unpredictable chain reactions. This study adopts a methodology analogous to calculating the distance between two points in a complex network to assess the efficiency of various causal paths.
Step 4: Sensitivity analysis is a useful tool for evaluating how changes in decisions or optimization strategies impact target variables or model results. This process can reveal the risks and effects associated with different options to aid in well-informed decision-making.
Step 5: Diagnostic reasoning was utilized to assess the impact of the occurrence of NIMBY conflicts on the probability of other nodes associated with the power grid project. This approach aided in identifying the most likely causes of outcomes and the underlying reasons for these phenomena.
3. Results
3.1. ISM Hierarchy Analysis Results
To facilitate this analysis, three experts in the field were invited to score the influencing interrelations among the 16 identified factors (Table 1) as either 1 (related) or 0 (no relationship). The scores were then averaged, with an average above 0.5 set to 1, indicating a strong relationship, and below 0.5 set to 0, indicating a weak or absent relationship. Based on experts’ scores, this matrix was drawn to summarize the influence of factor Si on Sj. A value of 1 indicates a strong influence relationship between Si and Sj, and a value of 0 indicates no relationship or a weak relationship between them (Table 2). The results from the adjacency matrix were integrated into the unit matrix to obtain a reachability matrix (Table 3).
Table 2.
Adjacency matrix.
Table 3.
Reachability matrix.
Using Equations (2)–(4) mentioned above, compute the intersection C of the reachable set and the prior set. These co-occurring nodes directly or indirectly influence and are influenced by each other. The results are outlined in Table 4.
Table 4.
Reachable set, prior set, and intersections.
Within the ISM methodology, the “outcome-first-UP” type of analysis is an approach that begins with a specific known outcome or effect and traces its origins upwards. This model emphasizes identifying and understanding both the direct and indirect influences that contribute to an outcome, thus establishing a hierarchy among factors. This effectively reveals how various factors interact to produce final results, offering a clear chain of causal logic.
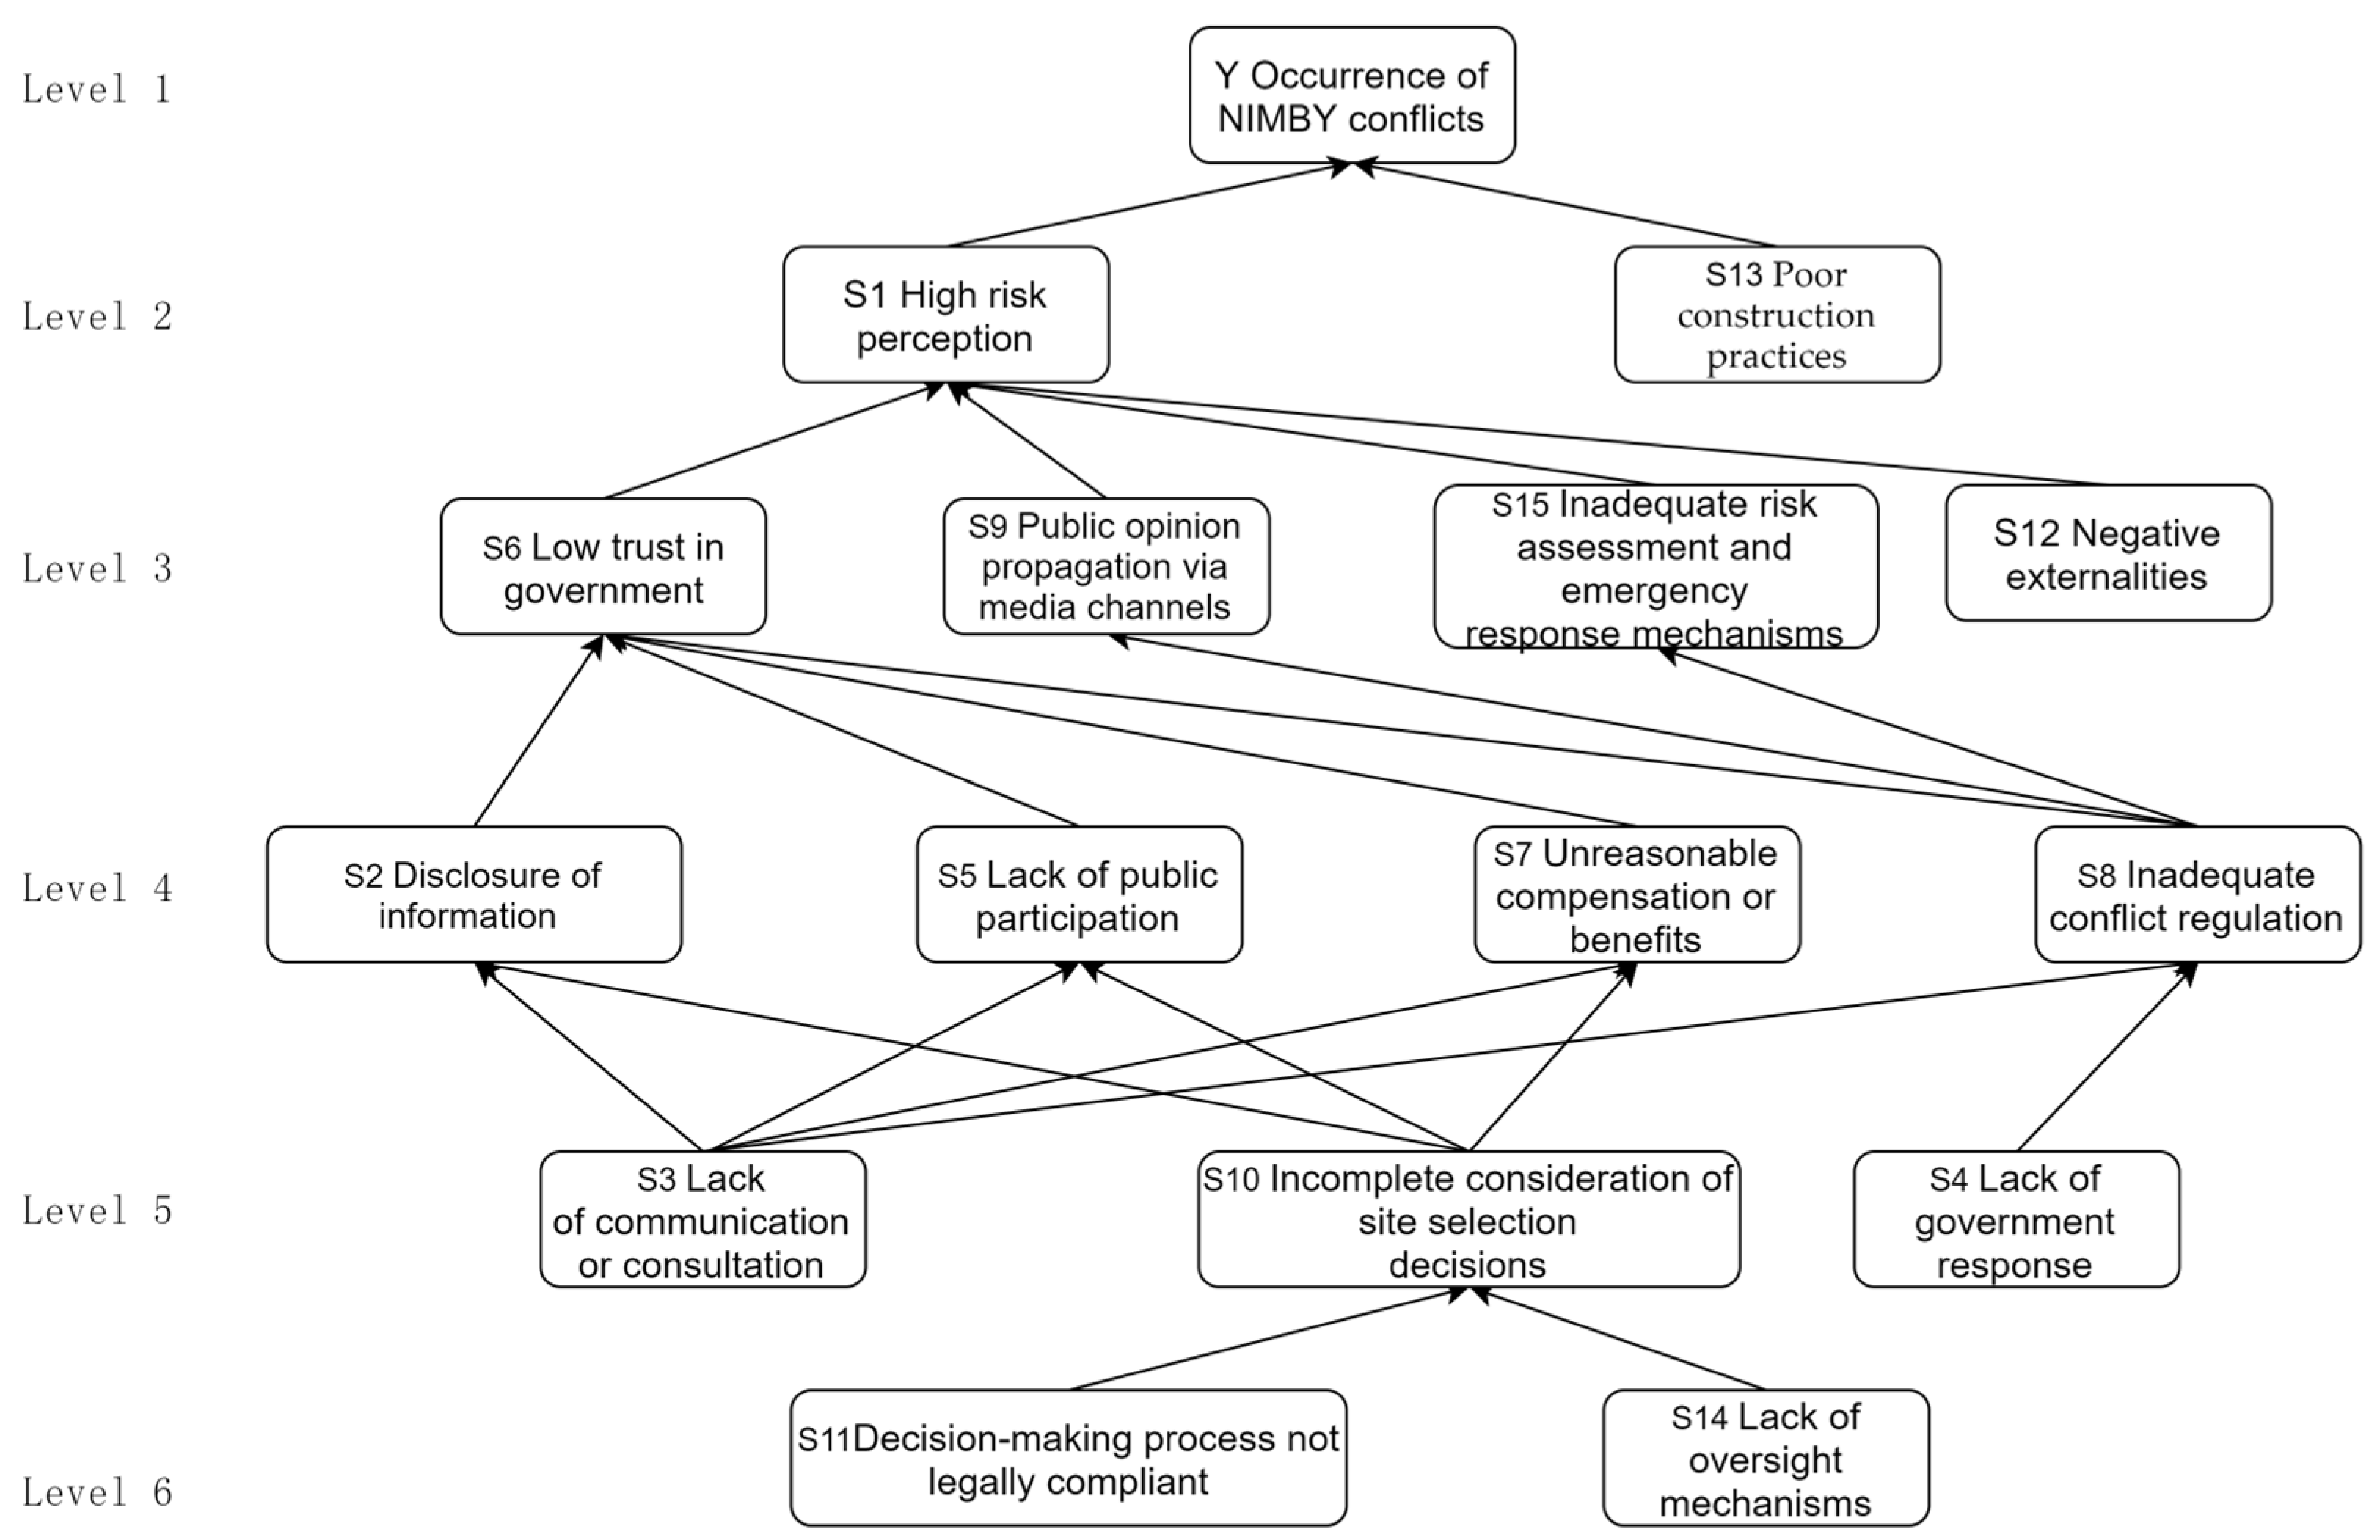
Through pattern analysis, this approach yielded the hierarchical structure illustrated in Figure 1. In this structure, the top level represents the ultimate outcome of the system, specifically the NIMBY conflict in the context of this study. Lower levels delineate the causes contributing to the occurrence of this top-level event, with each descending level representing increasingly important underlying causes.
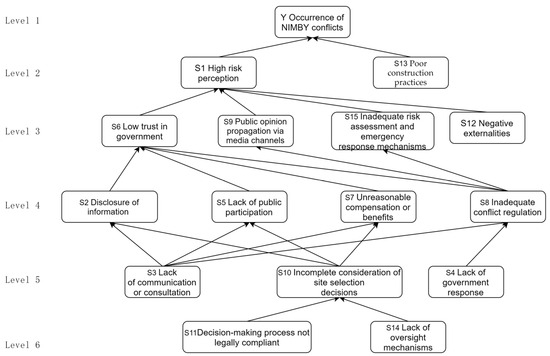
Figure 1.
ISM hierarchy of factors associated with NIMBY conflicts at power grid projects.
As shown in Figure 1, the factors “high risk perception” and “poor construction practices” were identified as the most direct causes of the “Y NIMBY incident”. These represent the most immediate manifestations of the problem and are crucial targets for mitigating risks associated with neighborhood opposition to the power grid project. The elements “decision-making process not legally compliant” and “lack of oversight mechanisms” are positioned as the deepest causes within the system. These factors, hidden beneath the surface issues, are structural and systemic; they demand thorough analysis and more comprehensive understanding as addressing them can fundamentally improve the situation.
Intermediate factors such as “low public trust in government”, “inadequate disclosure of information”, and “lack of communication or consultation” serve as bridges in the hierarchical model, linking surface phenomena with more deep-rooted causes. By addressing these intermediate factors, the full context of the problem can be better understood to move toward more effective solutions. Moreover, effectively managing these intermediate factors can prevent NIMBY conflicts by interrupting the chain of causation.
3.2. Bayesian Network Modeling Analysis
A BN model was established in this study using GeNIe 4.1 software based on the information shown in Figure 1. This model processed data from specific cases and expert knowledge to perform causal chain and sensitivity factor analysis of the identified factors. Statistics from 15 comprehensive case studies were used to determine the presence of the 15 identified factors, recording “1” for presence and “0” for absence. The 15 cases selected were the first 15 of the 25 cases in the appendix that were able to be evaluated. The target factor, i.e., NIMBY conflicts, was categorized into three severity levels (“low”, “middle”, and “high”). The “high” level indicates serious legal violations with frequent or numerous participants. The “middle” level reflects acts such as complaints and petitions by local residents during the site selection, construction, and operation phases of the power grid project, whereby residents employ reasonable and legal means to assert their rights. The “low” level signifies dissatisfaction or discomfort among local residents, but not significant resistance, to the project’s siting, construction, and operation. The results of this categorization are presented in Table 5.
Table 5.
Parameter learning-related data.
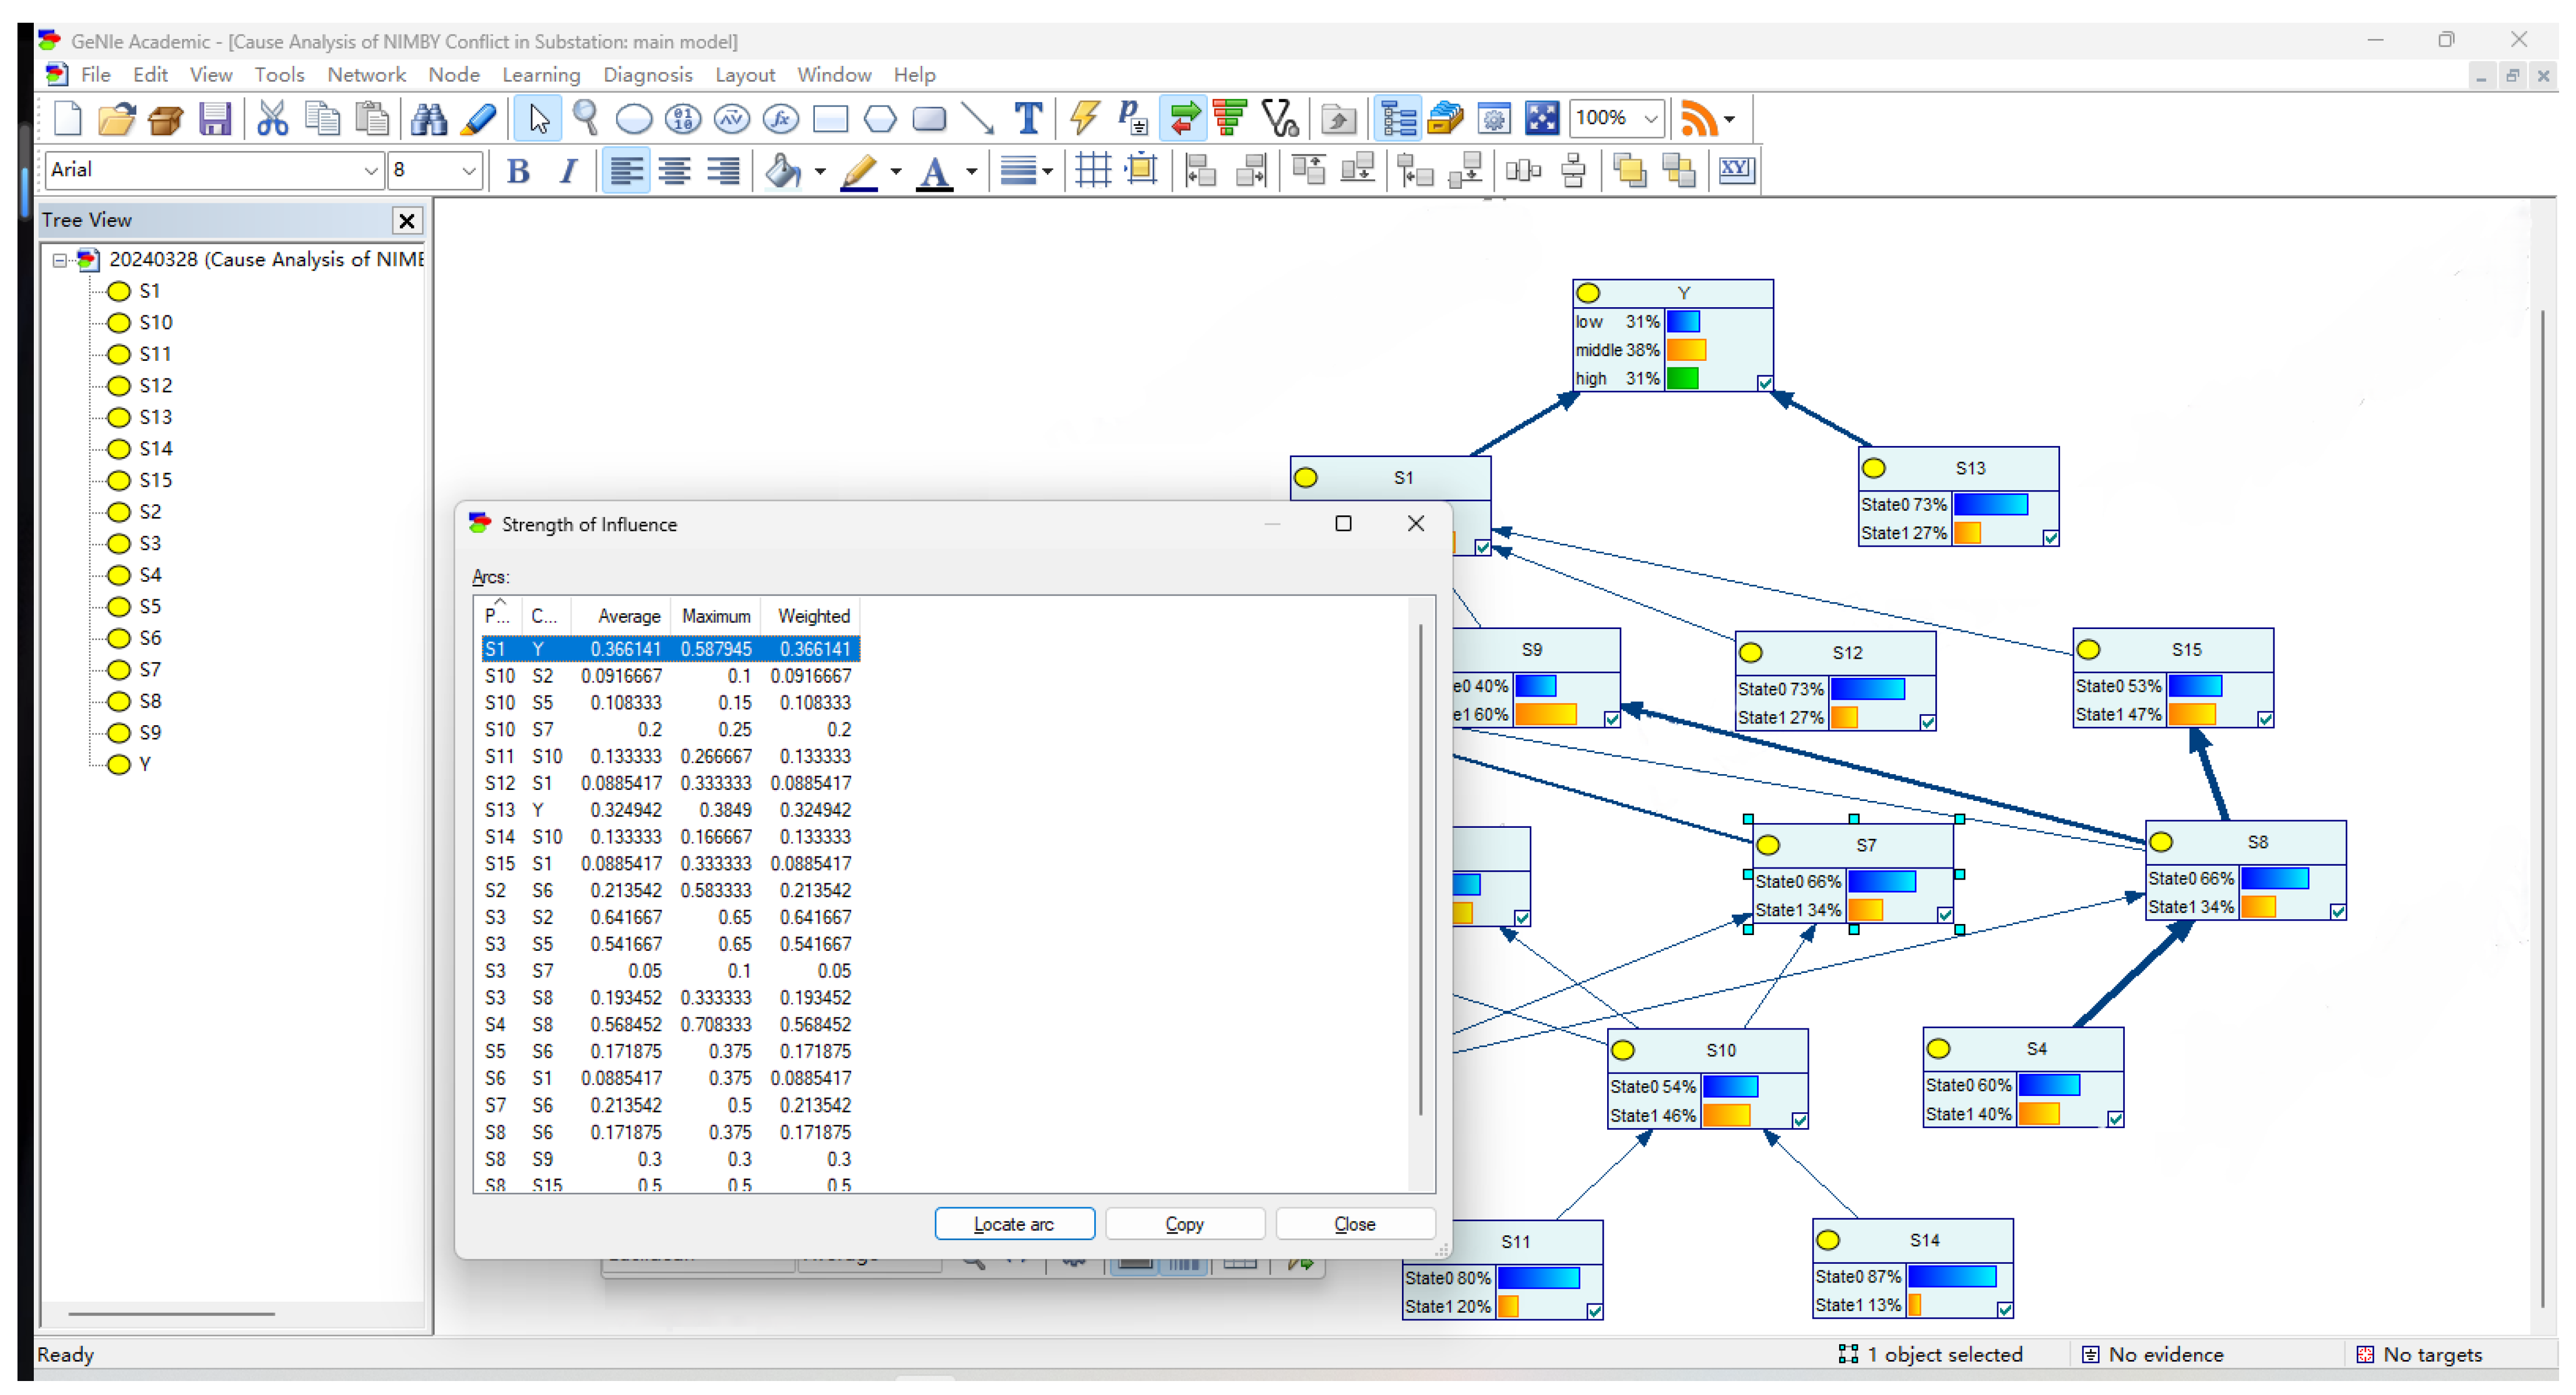
On this basis, this study conducted an impact intensity analysis. The connection strengths between nodes in the network were also visualized using line thicknesses to represent “average”, “maximum”, and “weighted”. The averages were computed as the mean distance across all samples, while the maximum values were determined by selecting the greatest distance between the distributions. The weighted values were determined by adjusting the distance according to the marginal probability of the parent node. For the purposes of this analysis, only the average values were retained to represent the strength of the connections; the results are displayed in Figure 2.
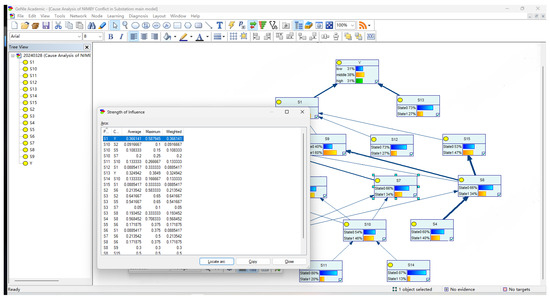
Figure 2.
Strength of the influence of nodes between ISM hierarchical graphs.
All directed edges in the graph were ranked based on their influence intensity values. The results are listed in Table 6. Notably, the connections “S3—lack of communication and consultation→S2—inadequate disclosure of information”, “S4—lack of government response→S8—inadequate conflict regulation”, and “S3—lack of communication or consultation→S5—lack of public participation” all have particularly high impact intensities. Policymakers are advised to focus on these critical links as disrupting these connections could effectively block the conditions that lead to NIMBY conflicts.
Table 6.
Influence intensities between nodes.
To find efficient solution paths, the efficiency is calculated using the distance of each set of causal paths, assuming that each underlying factor of Y consumes a total of 1 unit of resources. For example, consider the causal path S3→S2→S6→S1→Y, which has four steps. Assuming that navigating from each bottom factor to Y consumes a total of 1 unit of resources, the efficiency of this path is ¼. To provide a comprehensive assessment, stability–efficiency composite metrics were obtained as a product of path strength and path efficiency. This allows for a quantifiable evaluation of each causal chain’s effectiveness. The calculations for all causal chain indicators are presented in Table 7.
Table 7.
Combined path stability–efficiency indicator results.
Evidently, the causal path “S13→Y” is shortest. For the same amount of resources allocated, this path efficiently distributes the most resources to each of its connections. Thus, decision-makers aiming to address a NIMBY conflict should immediately consider prioritizing this pathway (Figure 3).
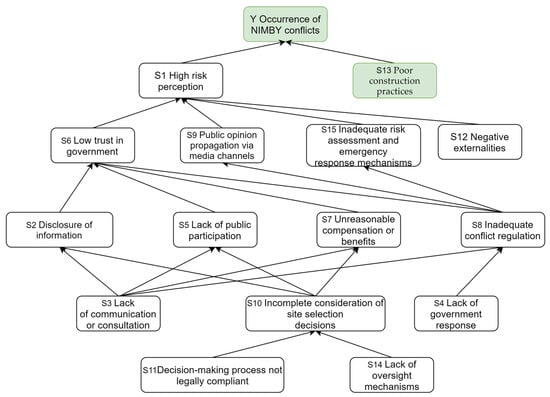
Figure 3.
ISM hierarchy graph of the shortest and most efficient paths.
However, it is important to note that choosing this path for governance does not guarantee an ideal outcome. This is because the “poor construction practices” factor primarily involves the construction unit itself. Compared to the government and local residents, the construction enterprise’s interests are more straightforward and less impacted by the negative externalities of the project.
The causal path “S4→S8→S15→S1→Y” was identified as having the highest impact strength and the second-highest stability–efficiency value, making it both more stable and more efficient than other paths. This pathway strikes a balance in avoiding the inefficiencies associated with longer paths and the instability typical of shorter paths, as illustrated in Figure 4. In efforts to prevent NIMBY conflicts, decision-makers should target the influencing factors within this causal pathway and address critical nodes effectively. Potential interventions could include appointing a government response commissioner, enhancing risk assessment and emergency response mechanisms, and reducing public perceptions of risk.
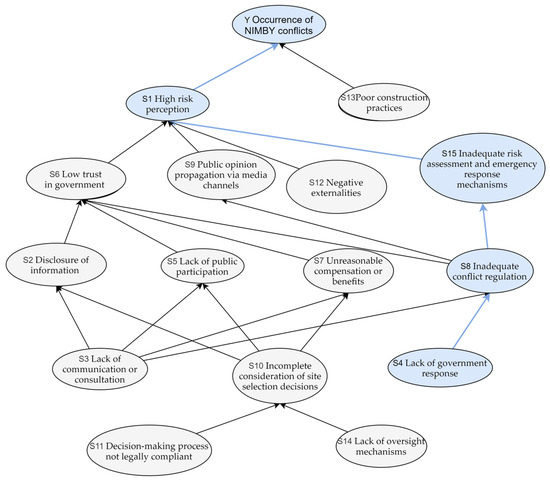
Figure 4.
ISM hierarchy graphs of stable and efficient paths.
As outlined in Table 8, setting NIMBY conflicts as a target variable and updating the other factor probabilities for sensitivity analysis revealed how the outcome of the target node depends on the probabilities of one or more nodes.
Table 8.
Factor sensitivity calculation results.
Several factors appear to significantly influence the occurrence of NIMBY conflicts, including “S13—poor construction practices”, “S9—dissemination of public opinion through media”, “S1—high risk perception”, “S15—inadequate risk assessment and emergency response mechanisms”, and “S12—negative externalities” (Figure 5). Figure 5 represents the sensitivity of each factor when NIMBY events are used as the target factor, with darker colors indicating higher sensitivity.
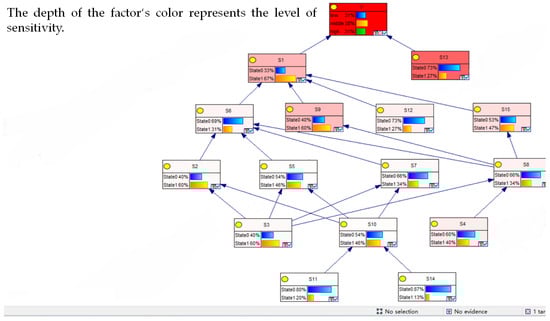
Figure 5.
Bayesian network model sensitivity analysis results.
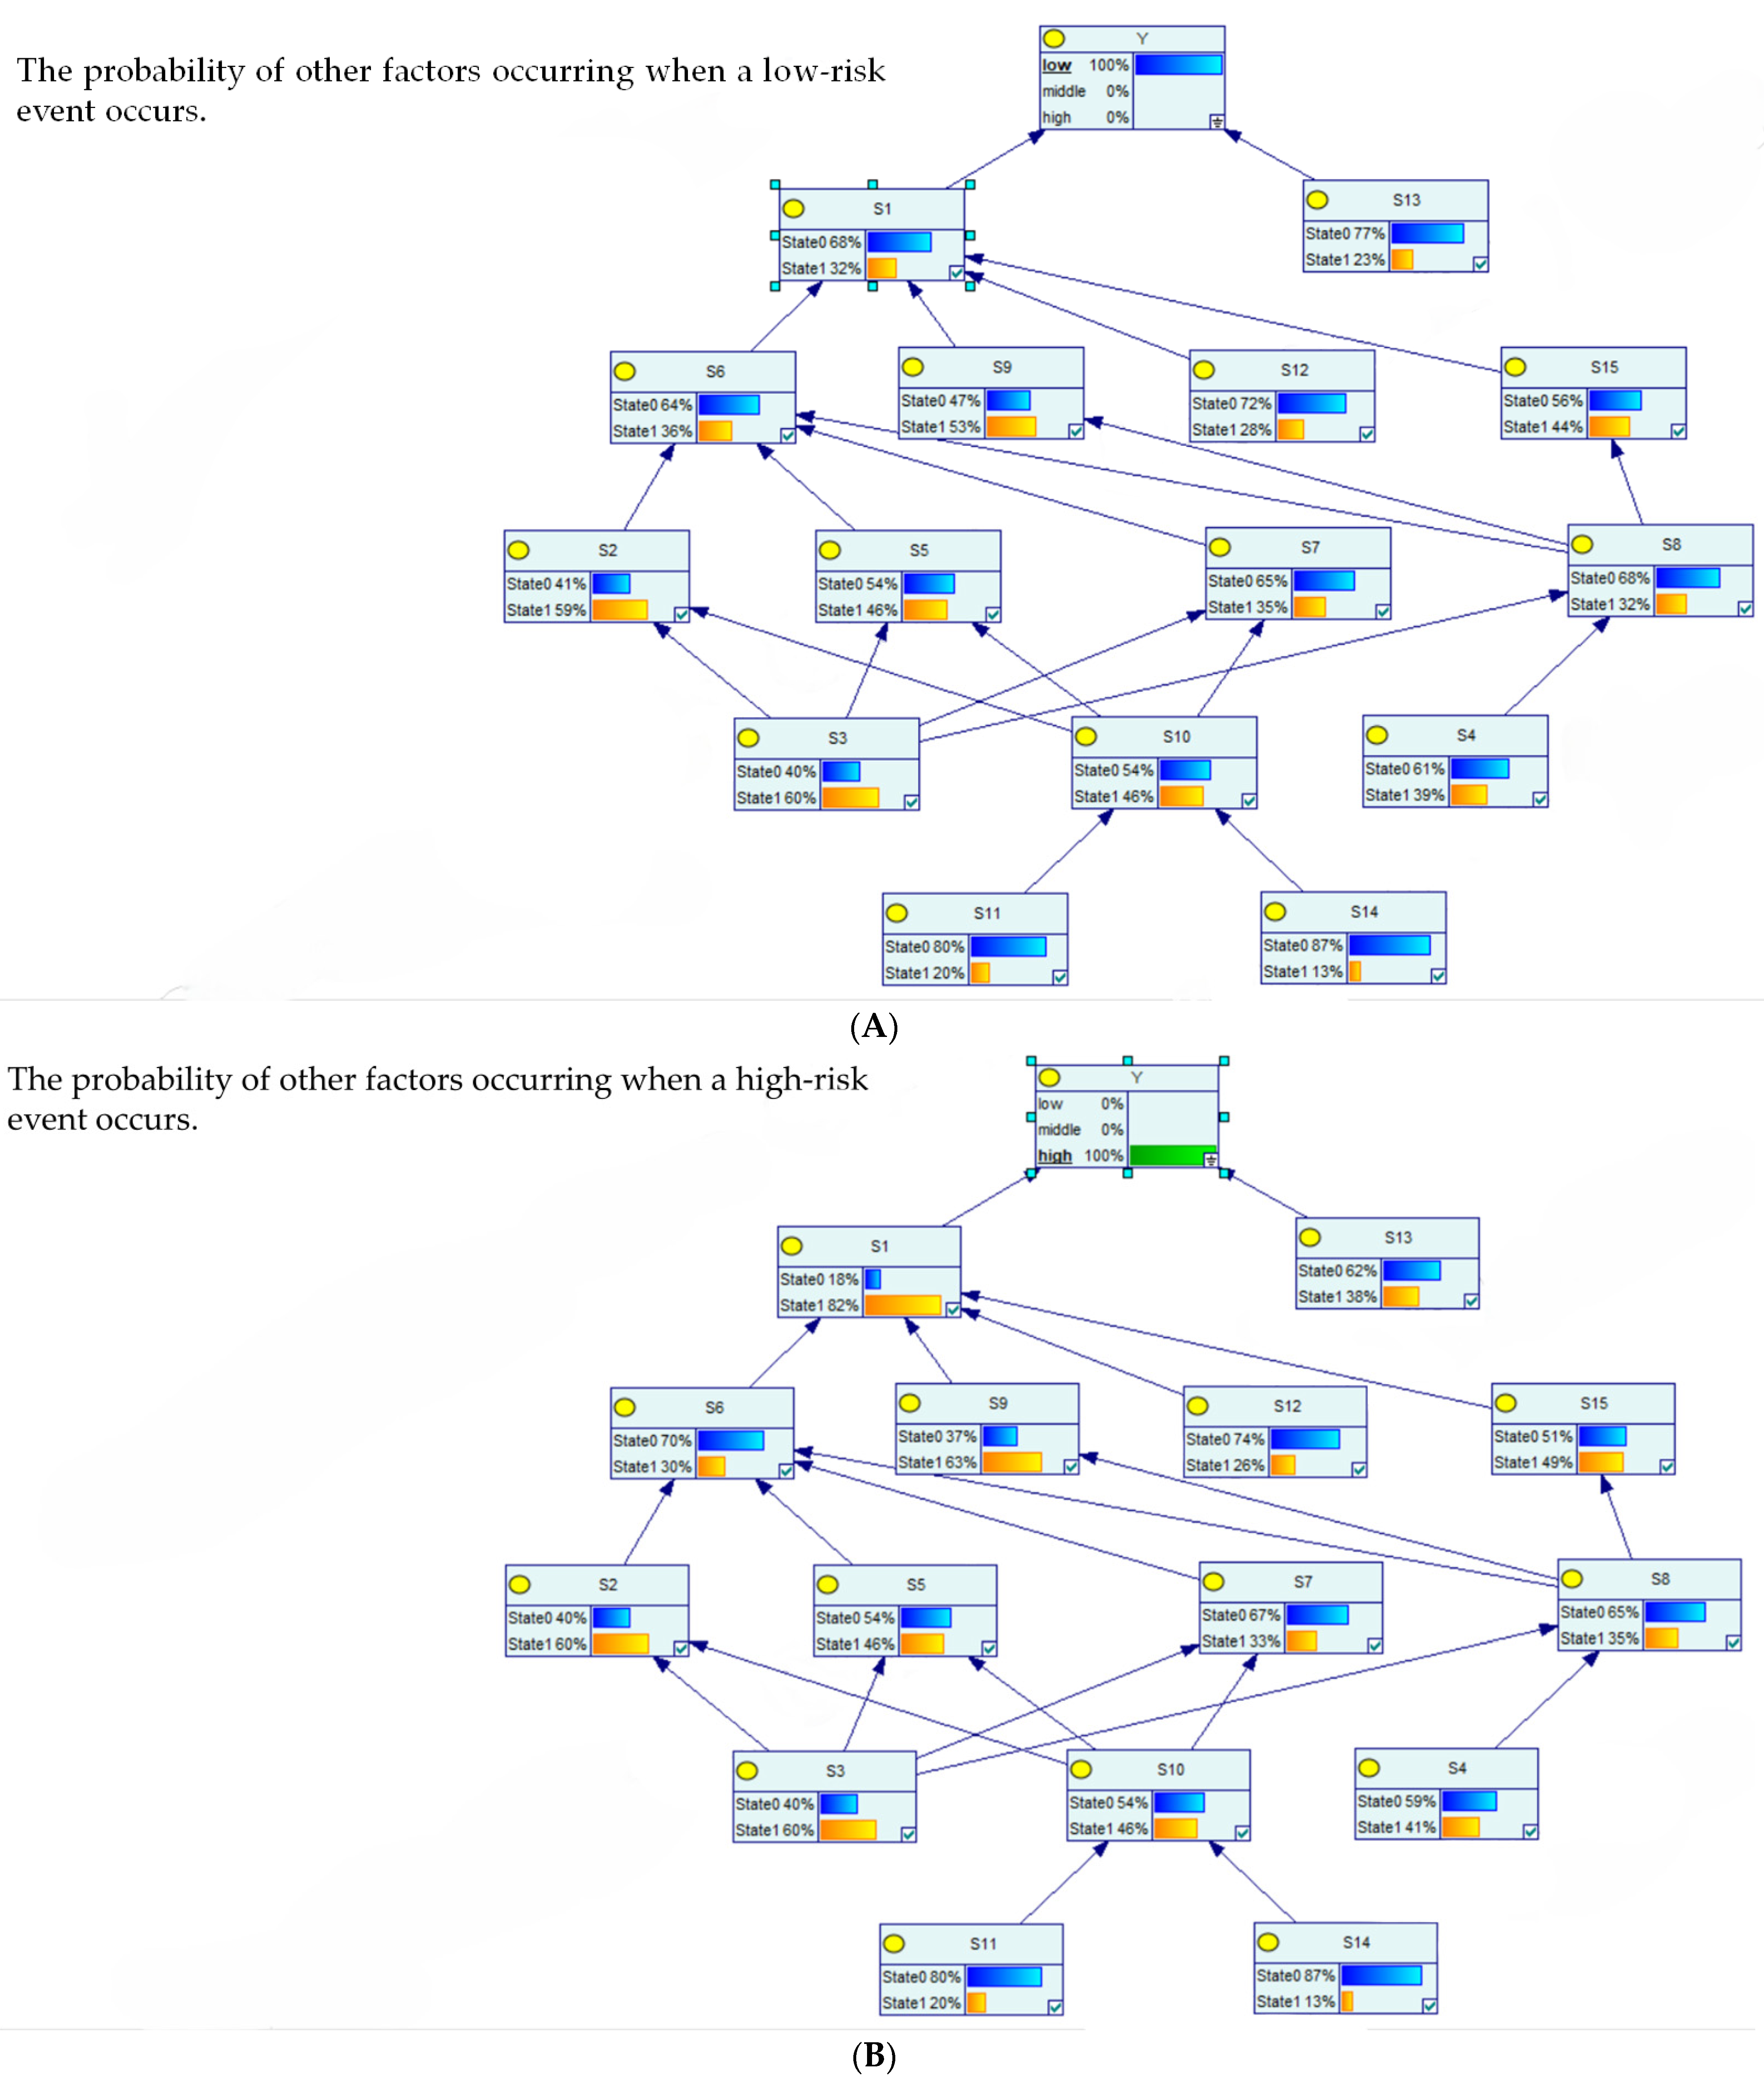
In GeNIe 4.1 software, the “occurrence of NIMBY conflicts” was set to high (100%) and low (100%) before updating the probability values of other factors, facilitating a comparative analysis of the effects of severe and minor NIMBY conflicts. The results are shown in Figure 6, highlighting the differences in probability distributions and how various scenarios affect the project. Scenario A represents the probability of other factor events occurring when the target event Y has a 100% probability of being a low-risk event. Scenario B represents the probability of other factor events occurring when the target event Y has a 100% probability of being a high-risk event.
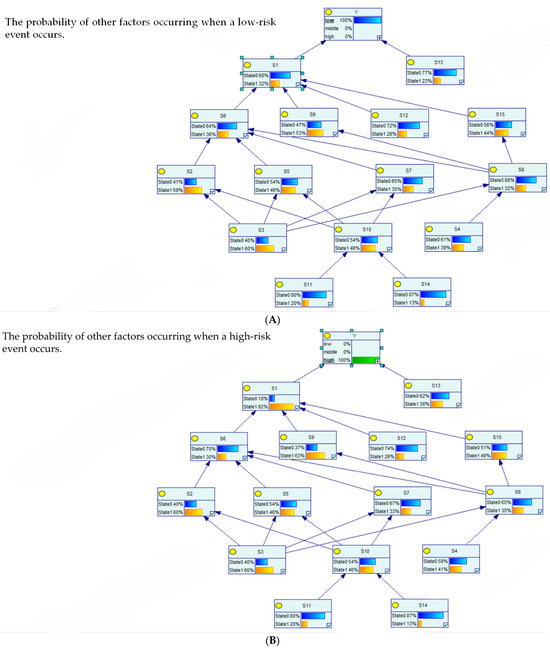
Figure 6.
Reverse reasoning results obtained from Bayesian network modeling. (A) Probability of other factors occurring when the high-risk event rate is at 100%. (B) Probability of other factors occurring when the low-risk event rate is at 100%.
The values for scenarios (A) and (B) in Figure 6 were further analyzed, as summarized in Table 9. The probability of occurrence for several factors increased when shifting from the low-risk to the high-risk scenario, including “S1—high risk perception”, “S9—dissemination of public opinion through media”, and “S15—inadequate risk assessment and emergency response mechanisms”. The factors “S4—lack of government response”, “S8—inadequate conflict regulation”, “S2—inadequate disclosure of information”, and “S3—lack of communication or consultation” also show a notable increase in probability. Among these, “S1—high risk perception” exhibits the most significant change. Accordingly, reducing public risk perception is crucial for preventing NIMBY conflicts as it has a profound impact on the dynamics of these scenarios.
Table 9.
Reverse reasoning results.
4. Discussion
As mentioned above, the pathway “poor construction practices→NIMBY conflicts” is the shortest causal path for the onset of NIMBY-related incidents. This suggests that improper or ineffective construction practices adopted by power grid construction enterprises are significant triggers of NIMBYism. These practices, when directly exposed to local residents without any mitigating factors, frequently lead to public outcry [10]. Furthermore, the pathway “lack of government response→inappropriate conflict regulation→inadequate risk assessment and emergency response mechanisms→high risk perception→NIMBY conflicts” represents a more stable trajectory for the development of NIMBYism and warrants particular attention. The initial factor in this path, “inadequate government response”, can escalate public dissatisfaction and erode the government’s credibility, making it challenging to achieve positive interactions with the local community [11]. This issue often exacerbates risks along the pathway through improper conflict regulation and insufficient risk assessment and emergency response mechanisms, ultimately culminating in NIMBY conflicts.
Sensitivity analysis further revealed that alongside the factors of “poor construction practices” and “high risk perception”, the factors “inadequate risk assessment and emergency response mechanisms”, “dissemination of public opinion”, and “negative externalities” are also highly sensitive. Changes in these factors significantly impact the dynamics of NIMBY conflicts. This is increasingly relevant in today’s information age, which amplifies public awareness of risks associated with power grid projects and enhances community responsiveness to these risks, leading to NIMBYism [12]. Diagnostic reasoning further confirmed pronounced changes in risk perception, suggesting that deeper perceptions of risk associated with construction projects that trigger NIMBY conflicts can intensify avoidance behaviors among local residents [13].
The ISM method, as a statical analysis tool, can be used to determine the hierarchical relationships and mutual influence mechanisms between factors within a system—in this study, a BN model of the occurrence of NIMBY conflicts associated with power grid construction projects—helping scholars to recognize the direct or indirect effects of factors on other factors. Diagnostic reasoning based on the integration of ISM and BN revealed that “S1—high risk perception” is a key factor that contributes to the increased risk of NIMBYism in response to power grid construction projects, aligning with previous research findings [13,14]. Other researchers, like Li et al. [15], employed similar methods, such as establishing a fuzzy Bayesian network model based on fault trees to diagnose complex equipment faults. However, the present study differs by leveraging case study methodologies for data collection and parameter learning, helping to reduce errors that may have otherwise arisen from relying solely on expert scoring to determine conditional probabilities.
Based on the findings of this analysis, this paper proposes several recommendations for government agencies and enterprises tasked with managing NIMBY issues in power grid construction projects. First, the government should work toward establishing a more positive relationship with the public, acting as a leader and coordinator [16,17], establishing risk assessment and emergency response mechanisms in collaboration with enterprises and communities, and actively responding to public concerns with timely and interpretive feedback to eliminate misunderstandings and mitigate risk perceptions [18]. Enterprises, on the other hand, should strive to avoid social issues triggered by poor construction practices. They must maintain public trust by implementing safe, civilized, and green construction systems and ensuring compliance with environmental protection and safety standards in tandem with government agencies [19]. This approach respects residents’ lives and livelihoods and promotes information transparency.
Despite facing certain limitations in data collection and the inherent subjectivity of case studies, the model established using the ISM–BN method demonstrated unique advantages in thoroughly examining complex causal relationships. It effectively uncovered intricate and multifactorial dynamics underlying NIMBYism in response to power grid construction projects. However, future research could benefit from integrating advanced data collection techniques such as web scraping and text analysis for factor identification. Employing dynamic simulation methods could also further enhance the ability to predict and manage the occurrence and development of NIMBY conflicts. Such approaches could offer valuable insights for managing NIMBY-related risks in power grid construction projects, contributing significantly to the field.
5. Conclusions
- (1)
- In this study, through the analysis of collected case information on power grid-related NIMBY conflicts, 15 key risk factors triggering such events were identified based on expert insights and empirical data. An ISM approach was applied to construct a causal hierarchy diagram delineating the complex interactions and influence pathways among these factors. This provided a structured framework to gain an in-depth understanding of the mechanisms underlying NIMBYism-related events in power grid projects and to clarify the hierarchical relationships between key factors.
- (2)
- A BN model was drawn in GeNIe 4.1 software based on the hierarchical framework from ISM. Parameter learning was conducted using case data and expert scoring information. Analyses based on this model, including causal chain analysis, sensitivity factor analysis, and diagnostic reasoning analysis, were performed for the outcome factor of “NIMBY conflicts”. This revealed 17 pathways and accompanying stability–efficiency indices highlighting key factors influencing the likelihood and severity of NIMBY conflict occurrence. The insights gained in this process may be valuable for relevant authorities to formulate targeted NIMBYism prevention and control measures.
- (3)
- Drawing from the comprehensive analyses of the BN model, key influencing factors and their associated pathways were identified as a basis for recommending specific NIMBYism prevention measures to both government and enterprise stakeholders. These recommendations include enhancing information transparency, improving construction practices, and strengthening the communication and negotiation mechanisms between the government and the public. These measures may reduce the likelihood of NIMBY conflicts and increase social acceptance of power grid projects.
Author Contributions
Conceptualization, Y.L.; methodology, Z.X.; software, T.J.; formal analysis, B.Z.; investigation, Q.Z.; resources, Y.L.; data curation, T.J.; writing—original draft preparation, T.J.; writing—review and editing, Y.L.; and funding acquisition, Y.L. All authors have read and agreed to the published version of the manuscript.
Funding
This work was supported by the National Natural Science Foundation of China (NSFC) (Grant Nos. 72072165).
Data Availability Statement
Data are available upon reasonable request.
Acknowledgments
We want to thank the survey work implemented by the graduate students from Zhejiang Sci-Tech University.
Conflicts of Interest
Authors Zhenchao Xu, Busheng Zhou, Qingyun Zhang were employed by the company State Grid Zhejiang Electric Power Co., Ltd. The remaining authors declare that the research was conducted in the absence of any commercial or financial relationships that could be construed as a potential conflict of interest.
Appendix A
- (1)
- Huizhou City Huiyang District Power Grid, 2019: The project was initially scheduled to commence construction in June 2019 and enter production in June 2020. However, shortly after the project began, it faced obstructions from local residents near the station site, who cited concerns over electromagnetic radiation’s environmental impact. From June 2019 to August 2021, the project experienced continuous interruptions. Various protest actions, including petitions, complaints, and road closures, significantly delayed the substation’s construction progress. Consequently, it was designated as a key supervisory task for overdue rectification by the Guangdong Power Grid Corporation. After two years of coordination among local government departments and the power supply bureau, construction resumed in August 2021, and the project became operational by August 2022.
- (2)
- Hanyang 110 kVA Fangcaolu Substation, 2012: The planning and Environmental Impact Assessment (EIA) procedures for the site have been finalized. However, nearby residents have lodged numerous complaints due to concerns regarding the potential impact of the substation on their quality of life and property values. As a result, the project has not commenced construction.
- (3)
- Shanghai Hongyang 50 kV Substation, 2007. The public announcement of the project’s environmental information for the substation in 2007 triggered letters and complaints from neighboring residents for more than four years. It was not until 2012 that the substation resumed operations after years of deadlock.
- (4)
- 110 kV Jinbao Substation in Maonan District, 2018: At the outset of the construction of the 110 kV X Bao substation in Maonan District, dozens of residents from surrounding buildings protested. As the situation developed and escalated, villagers from nearby villages, who had initially adopted a wait-and-see approach, joined the protest efforts, organizing small-scale letter campaigns and visits on their own initiative. This incident also sparked widespread public debate online regarding the construction of the 110 kV X Lake Substation, which began in the same year, leading to a standstill of the project due to public opinion pressure.
- (5)
- Shenzhen 110 kV Shayuanpu Substation, 2009: As early as early 2008, the project was advertised and prepared for the commencement of construction. By the summer of 2009, opposition to the project spread on microblogs, forums, and other news media platforms, prompting owners from nearby neighborhoods to protest through petitions, road blockades, gatherings at the construction site, and the disruption of construction activities. Key concerns raised by local residents centered around project compliance and potential health impacts. Following the protests, local government authorities, in collaboration with public security and municipal office personnel, conducted on-site stabilization efforts and convened a working meeting that led to a decision to halt construction. Subsequently, a special working group was established by the new district management committee to address the issue.
- (6)
- 220 kV Yongfu Substation, Xianlie Zhong Road, Guangzhou, 2003: In 2004, the project site was selected after extensive deliberation and coordination. The local community harbored inherent misconceptions, such as concerns about electromagnetic radiation and cancer risks associated with substations, leading to resistance. To dispel these fears and misunderstandings among residents, the local power supply bureau established multiple working groups and conducted initiatives such as producing brochures and organizing on-site seminars. However, traditional science and technology publicity efforts yielded limited results. By 2006, the Environmental Impact Assessment (EIA) for the site had reached a deadlock. The public’s perception gradually shifted following site visits and other ‘seeing is believing’ initiatives. In 2011, after years of stagnation, the project successfully completed its post-approval publicity and entered the construction phase.
- (7)
- Shantou, Guangdong 110 kV Jinan Station New Outlet #10, #11, and #12, 2014: The site was originally planned to be established in 2013, with construction scheduled to commence in 2014. During the implementation process, initial protests arose among villagers dissatisfied with the compensation for land acquisition. Subsequently, surrounding villagers engaged in on-site construction obstruction. Following the circulation of various false statements online, the Village Board convened a coordination meeting to address the issue and proposed alternative viable construction options. In 2018, villagers entered the construction site and disrupted the construction process. Government departments later verified and investigated the incident. The project was completed and began operations in August 2019; yet, dissatisfaction persisted among many villagers.
- (8)
- Zhejiang 110 kV Sanhuan Substation, 2018: On 20 August 2018, the project began land surveying activities, prompting neighboring residents to question its legality. Residents felt that authorities had not disclosed project information in advance and took measures to block and halt the survey operations. Post-grid staff, along with the local village council, conducted an on-site hearing to explain the situation, but residents remained opposed. On 25 August, project staff faced public protests while conducting red-line mapping of the site. Despite government confirmation that the project’s preliminary formalities and procedures were complete and compliant, implementation has been delayed due to a lack of consensus with the public.
- (9)
- Shanghai Hongyang 500 kV Transmission and Substation Project, 2013: The project has faced delays due to opposition from residents in the surrounding neighborhood.
- (10)
- Zhejiang 220 kV Baisha Transmission Project, 2013: Since the project commenced, there has been significant opposition from neighboring residents. Despite multiple coordination efforts by the township government, the project has faced continued resistance. On 20 November 2012, township authorities mobilized personnel to initiate protective measures for the project. By 8:30 a.m. that day, construction workers encountered fierce conflicts with local residents, resulting in injuries to several individuals, including residents, government officials, construction workers, and security personnel. This incident had a considerable negative social impact.
- (11)
- Dongguan 110 kV Centre Substation, 2009: On 13 June 2009, during the early stages of project planning, neighboring residents raised concerns about the project’s legality. By 20 June, a group of property owners collectively requested the project’s withdrawal. Subsequently, owners organized forums to mobilize support for their cause and called for the project to be relocated. In early July, representatives of several owners visited the Letters and Visits Department and published a letter to the mayor, leveraging public opinion through the Internet. Despite coordination meetings involving planning, environmental protection, power supply departments, and local owners at the project site, no resolution was reached. Public opposition peaked on 29 August with a neighborhood cultural event to protest the project. In November, a local court held a public hearing on a lawsuit filed by 20 property owners against the Planning Department, resulting in their loss but gaining attention from government departments. As of now, the project has yet to commence.
- (12)
- Chongqing 220 kV Xiejiawan Substation, 2019: In July 2019, neighboring residents staged a large-scale protest demanding the removal of the project, citing concerns that electromagnetic radiation was affecting their health. In response, the relevant enterprises established a construction command for the power project to address public concerns comprehensively. They conducted accurate scientific assessments on electromagnetic radiation and organized visits for neighboring residents to completed substations to alleviate their fears. These measures effectively mitigated neighborhood conflicts.
- (13)
- Shanghai Yunshu Transmission Station, 2017: Between 2015 and 2016, during the initial stages of project planning, the government maintained silence and did not adequately disclose information to the public. Later, in August 2018, the government initiated preliminary activities such as “three passes and one leveling” but encountered setbacks and errors in the application of professional knowledge, which led to public dissatisfaction. Neighboring residents expressed their protests in various forms in 2018. In response, relevant authorities undertook explanatory efforts.
- (14)
- Suzhou 110 kV Sheyu Substation, 2017: As word of the project’s details spread publicly, residents in neighboring communities launched a vigorous multi-channel protest, including feedback through forums and mailboxes, accumulating over a thousand complaints. On the evening of 17 September 2015, after 8:00 p.m., nearly 300 residents gathered on the road under the guise of a ‘walk’, staging a ‘road rights’ demonstration that briefly spiraled out of control, causing significant traffic disruptions. The local police station promptly mobilized officers to restore order. In response to local residents’ queries and protests, relevant departments provided formulaic responses based on existing legislation, eroding public trust in the local government.
- (15)
- Zhuhai 110 kV Belvedere Garden Substation, 2006: Between March and April 2006, during the initial planning stages of the project, residents near the site primarily engaged in reasoned protests through individualized actions such as writing open letters, petitions, and face-to-face discussions. Subsequently, from May to June 2006, an increasing number of property owners joined the protests. During the May Day holiday in 2006, over 400 property owners staged a demonstration, leading to the project’s suspension to prevent broader repercussions. The sudden resumption of substation construction from December 2008 to 3 January 2009 sparked outrage and violent clashes among the majority of property owners, including site storms and road blockades. On 13 December 2008, tensions escalated as owners occupied the main traffic artery, causing a significant traffic jam. Subsequently, from 31 December 2008 to 3 January 2009, several police officers were injured during protest actions. Since 4 January 2009, mass collective protests have subsided, and the number of participants has dwindled, although sporadic incidents persist. On 19 February 2009, the City’s Building Commission responded to the project’s necessity, curtailing further discussions on the substation’s relocation by property owners.
- (16)
- Fuzhou 1000 kV UHV Substation, 2013: The Fuzhou 1000 kV UHV substation project team planned to establish the project in Xintang Village, Dahu Township, Minhou County. However, local residents vehemently opposed the project due to concerns about radiation and other potential impacts. As a result, the implementation of the project site was significantly delayed.
- (17)
- Zhengzhou 110 kV Substation, 2016: In 2016, plans were made to construct a 110 kV substation on the southeast side of a neighborhood in Zhengzhou. However, due to the deliberate withholding of planning information regarding the substation and concerns about electromagnetic radiation from its proximity, the neighborhood owners lodged complaints and petitions.
- (18)
- Fuzhou 110 kV Hongwan Substation, 2018: In 2018, residents living near the 110 kV Hongwan substation in the Fuzhou area raised multiple complaints, primarily due to concerns about radiation. Consequently, the project was relocated after consultations with the community.
- (19)
- Chongqing 220 kV Xiejiawan Substation, 2012: The station is surrounded by residential areas and primary schools. Some residents in the neighborhood have requested the demolition or relocation of the station, citing concerns over electromagnetic radiation.
- (20)
- Guangdong 110 kV Binhai Station New Out 16 Line and 110 kV Xiangzhou Station Houhuan Line Network Framework Improvement Project, 2018: The project faced repeated obstructions from neighboring households during the construction period. After coordination between the community and the tenants, the project was relocated to another site. It has since been completed and commissioned.
- (21)
- Guangdong 220 kVH Station 10 kV Gao Yuan Line New Stacked Cui Haoting Commercial and Residential Building #2 Project, 2018: The construction of the project faced hindrances due to opposition from the local population.
- (22)
- Guangdong Haicheng town new Yingchun platform area industry expansion distribution, 2019: During construction, the project encountered opposition from the local community, resulting in multiple unsuccessful coordination attempts and necessitating changes to the route path.
- (23)
- Guangdong 110 kV Jianshanling Station 10 kV Shangpu Line, 10 kV Xinqiao Line Feeder Group Based on Grid Automation Modification Project, 2018: The project faced obstructions during construction, with several villagers citing various reasons such as occupation of fields and concerns about electromagnetic radiation to hinder its progress.
- (24)
- Guangdong 110 kV Annex City Station 10 kV Yingchun Line Based on Grid Automation Modification Project, 2018: The construction of the project was initially hindered as neighboring villagers opposed it, citing concerns that electromagnetic radiation from the electrical equipment could affect their health.
- (25)
- Zhejiang 110 kV Dingzhai Substation Transmission and Distribution Project, 2019: The township where the project is situated is known for kiwi fruit production. Neighboring residents expressed dissatisfaction with the compensation for land acquisition benefits. Despite adjustments to the project schedule agreed upon by the village committee, there were instances during the tower construction where villagers blocked progress, demanding further compensation, leading to delays in construction.
References
- Nie, J.; Yang, H.; Zhang, X.; Xu, N.; Song, Y.; Wang, D. Research on Risk Assessment of Life Cycle of Power Transmission and Distribution Engineering. IOP Conf. Ser. Earth Environ. Sci. 2019, 237, 062041. [Google Scholar] [CrossRef]
- Li, W.; Ji, Y.; Shang, Y. Assessment of Grid Construction Project Risk of Process of Process Based on Fuzzy-Event Tree. In Proceedings of the 2009 International Symposium on Information Engineering and Electronic Commerce, Ternopil, Ukraine, 16–17 May 2009; pp. 393–397. [Google Scholar] [CrossRef]
- Mueller, C.E.; Keil, S.I.; Bauer, C. Effects of spatial proximity to proposed high-voltage transmission lines: Evidence from a natural experiment in Lower Saxony. Energy Policy 2017, 111, 137–147. [Google Scholar] [CrossRef]
- Souza, M.A.; Gonçalves, J.T.; Valle, W.A. In My Backyard? Discussing the NIMBY Effect, Social Acceptability, and Residents’ Involvement in Community-Based Solid Waste Management. Sustainability 2023, 15, 7106. [Google Scholar] [CrossRef]
- Perlaviciute, G.; Görsch, R.; Timmerman, M.; Steg, L.; Vrieling, L. Values in the backyard: The relationship between people’s values and their evaluations of a real, nearby energy project. Environ. Res. Commun. 2021, 3, 105004. [Google Scholar] [CrossRef]
- Song, J.; Sun, Y.; Jin, L. PESTEL analysis of the development of the waste-to-energy incineration industry in China. Renew. Sustain. Energy Rev. 2017, 80, 276–289. [Google Scholar] [CrossRef]
- Fang, L.; Zhiyong, L. The Strategies for I Demand Expression Mechanism in NIMBY Conflict Management. In Proceedings of the 2014 International Conference on Public Administration (10th), Chengdu, China, 24–26 October 2014. [Google Scholar]
- Chen, X.; Chen, X.; Wang, C.; Zhang, N.; Yan, Y.; Guo, W. New Technology of the Power-grid Green Construction under the New Power System. In Proceedings of the 2022 IEEE/IAS Industrial and Commercial Power System Asia (I&CPS Asia), Chongqing, China, 8–11 July 2022. [Google Scholar] [CrossRef]
- Liu, W.; Wang, X.; Ye, P.; Jiang, L.; Feng, R. Safety accident analysis of power transmission and power-grid projects based on association rule mining. Environ. Sci. Pollut. Res. 2023. [Google Scholar] [CrossRef]
- Qiao, Y.; Wang, J. An intuitionistic fuzzy site selection decision framework for waste-to-energy projects from the perspective of ‘Not In My Backyard’ risk. AIMS Math. 2023, 8, 3676–3698. [Google Scholar] [CrossRef]
- Zhang, M.; Wu, W.; Song, Y. Exploring the driving mechanism of environmental mass incidents. J. Clean. Prod. 2022, 370, 133226. [Google Scholar] [CrossRef]
- Liu, H.; Wang, S.; He, H.; Tan, L.; Chan, A.P. Nip risk in the bud: A system dynamic model to govern NIMBY conflict. Environ. Impact Assess. Rev. 2022, 97, 106916. [Google Scholar] [CrossRef]
- Zhang, C.; Zhu, Y.; Xu, L. Information Dissemination and Control of NIMBY Projects under Stigmatization. Complexity 2022, 2022, 4383202. [Google Scholar] [CrossRef]
- Wen, E.; Tang, Z. The Causes and Preventions of Not in My Back Yard Conflict from the Perspective of Risk Perception. In Proceedings of the 2014 International Conference on Public Administration (10th), Chengdu, China, 24–26 October 2014. [Google Scholar]
- Li, Y.F.; Mi, J.; Liu, Y.U.; Yang, Y.J.; Huang, H.Z. Dynamic fault tree analysis based on continuous-time Bayesian networks under fuzzy numbers. Proc. Inst. Mech. Eng. Part O J. Risk Reliab. 2015, 229, 530–541. [Google Scholar] [CrossRef]
- Yu, J.; Zhang, C.; Huang, D.; Shao, Y.; Ren, H. Explore the Conflict and Resolution of Pollution NIMBY Facility Construction in the Context of New Media: An Evolutionary Game Theoretical Approach. Complexity 2021, 2021, 9978968. [Google Scholar]
- Zhang, X.; Chen, X. Study on the Influence of Information Public on Government Credibility. In Proceedings of the International Conference on Public Administration, Hyderabad, India, 25–27 October 2012. [Google Scholar]
- Xu, M.; Liu, Y.; Cui, C.; Xia, B.; Ke, Y.; Skitmore, M. Social acceptance of NIMBY facilities: A comparative study between public acceptance and the social license to operate analytical frameworks. Land Use Policy 2023, 124, 106453. [Google Scholar] [CrossRef]
- Ding, L.P.; Zhao, T.S.; Liu, X.Z. Study on the System of Safe and Civilized Construction. Appl. Mech. Mater. 2011, 71–78, 4852–4857. [Google Scholar] [CrossRef]


Disclaimer/Publisher’s Note: The statements, opinions and data contained in all publications are solely those of the individual author(s) and contributor(s) and not of MDPI and/or the editor(s). MDPI and/or the editor(s) disclaim responsibility for any injury to people or property resulting from any ideas, methods, instructions or products referred to in the content. |
© 2024 by the authors. Licensee MDPI, Basel, Switzerland. This article is an open access article distributed under the terms and conditions of the Creative Commons Attribution (CC BY) license (https://creativecommons.org/licenses/by/4.0/).