Article

Theoretical Analysis of the Plastic Property for Equal Angle Sections Subjected to Axial Force and Biaxial Bending

1
School of Civil Engineering, Nanyang Institute of Technology, Nanyang 473004, China
2
College of Mechanics and Engineering Science, Hohai University, Nanjing 211189, China
3
College of Civil Engineering, Shenyang Urban Construction University, Shenyang 110170, China
*
Author to whom correspondence should be addressed.
Buildings 2024, 14(7), 2153; https://doi.org/10.3390/buildings14072153
Submission received: 14 May 2024 / Revised: 12 June 2024 / Accepted: 20 June 2024 / Published: 12 July 2024

Abstract

:
To fully harness the design development potential of plastic angle sections, this study employs a theoretical analysis approach to examine the plastic behavior of equal angle sections subjected to axial force and biaxial bending. Based on the simplified angle section results, the full plasticity correlation equations were derived. Subsequently, section shape coefficients were computed. Finally, a methodology for calculating the plastic development coefficients of angle sections was explored. The findings indicate that the full plasticity correlation equations lack the necessary safety margins in designs. Notably, the angle sections possess a greater plastic development capacity along the weak axis compared with the strong axis. It is advisable, for both regular-size and large-size angle sections, to consistently adopt the plastic development coefficients in designs as follows: γu = 1.05 for the strong axis and γv = 1.15 for the weak axis, thereby addressing the shortcomings of the specification in design.

1. Introduction

Plastic section development can improve economic efficiency when designing steel members [1,2,3,4]; however, it is important to note that, in theory, further plastic development to the point of forming plastic hinges could result in an unbounded increase in deflection, posing a significant structural security risk. To effectively utilize the plastic properties of steel members, the steel structure design specifications permit plastic design in the case of flexural or beam–column members [5,6,7]. Nevertheless, the extent of plastic development is typically restricted to prevent excessive radicals and the resulting significant deformations. Taking the Chinese steel structure design standard GB50017 [5] as an example, it is specified that the depth of plastic development should not exceed 1/8 of the section’s height. This means that a portion of the section transitions into an elastic–plastic working state, serving as a limit state for plasticity design. This approach not only leverages the section’s plastic performance but also ensures the section’s comprehensive safety. The design standard GB50017 employs the plastic development coefficient γ to assess the plastic properties of a section. Based on the plate width-to-thickness ratio, five grades, denoted as S1 to S5, are established to characterize the plastic development capacity. These grades also provide width-to-thickness ratio limits for the H-section, cox-section, and circular pipe-section, facilitating the determination of γ values. However, it is worth noting that angle sections are not included in this classification. Consequently, utilizing the plastic properties of angle sections poses challenges, and the design may not always be economically efficient.
Angle sections are widely utilized in various engineering projects, including building structures, bridges, transmission towers, transportation machinery, and industrial settings. They serve as essential load-bearing components or connectors because of their easy fabrication and convenient assembly [8,9,10,11]. The mechanical performance of angle section members continues to be a topic of interest, attracting research efforts from multiple groups focused on studying their buckling characteristics. Design methods are constantly evolving, especially concerning high-strength steel angles, to achieve economically efficient design objectives. Shi et al. [12,13,14] conducted a study on Q420 high-strength steel equal angles, examining various aspects, including residual stress distribution models, local buckling, and overall buckling. Cao [15] assessed the performance of Q460 high-strength steel angle members under axial loads using a combination of numerical simulations and experimental studies. Bezas [16] explored the performance of high-strength steel angle members under both centric and eccentric compression loads while evaluating the resistance of these designed members. Zhang et al. [17,18,19] conducted a study on the buckling behavior of S690 and S960 high-strength equal-angle members, employing both testing and numerical simulation.
Using large-size (limb width ≥ 220 mm, limb thickness ≥ 16 mm) and high-strength steel angles has gained popularity in fulfilling engineering needs, including reducing assembly work, construction complexity, and steel consumption [20,21]. Cao et al. [22,23,24] investigated the buckling behavior and design methods of large-size and high-strength steel angle members subjected to axial loads. They analyzed the influence of various cross-section sizes, strength grades, and slenderness ratios, employing a combination of experimental and numerical simulation techniques. Sun [25] examined the impact of support constraints on the stability capacity of large-size and high-strength steel angle members by measuring support rotation stiffness in tested conditions. Additionally, they investigated the behavior of large-size angle steel under eccentric loads to advance the design methodology for large-size angle beam–column members [26]. Numerous researchers have progressively incorporated stainless steel into angle steel applications, mitigating issues related to corrosion. Menezes et al. [27,28,29,30,31,32,33,34] conducted a comprehensive study on the buckling behavior and design methodology of hot-rolled austenitic stainless steel angles. They employed experimental and numerical techniques to examine mechanical performance under fixed-ended and pin-ended conditions. Dobrić et al. [35,36,37] analyzed cold-formed stainless steel angles, enriching our understanding of relevant mechanical properties and design approaches. Sian [38] explored the material properties and local buckling behavior of extruded WAAM 316L stainless steel angles.
Many of these studies often emphasize altering material or increasing cross-sectional dimensions to enhance the mechanical performance of angle members, aligning with practical engineering requirements. Furthermore, design methodologies primarily revolve around axial load members, with limited attention given to utilizing the plastic properties of angle sections in flexural or beam–column members. In the current steel structure design specifications, the equivalent method often transforms eccentrically compressed angle members into axially compressed members to simplify the design process. However, ensuring that members are not influenced by bending moment under complex external load conditions is challenging, especially for the superstructure, where the wind load will cause the angle member to experience both axial load and bending moment. In addition, a single-angle member bearing capacity cannot match engineering requirements, and it eventually evolves into double-combined sections. It is unavoidable for double-combined section angle members to withstand the bending moment, but this effect is typically disregarded in design, and such a design strategy may pose potential safety hazards. Consequently, effectively harnessing the plastic properties of angle sections in flexural or beam–column applications becomes challenging. Trahair et al. [39,40] examined steel angle section beams’ biaxial bending and torsion behavior. Aydin et al. [4,41] investigated the mechanical performance of angle beam–column members. Vayas [3] examined the mechanical performance of angle beam–column members and discovered that angle sections categorized as Class 1 and Class 2 have a specific plastic deformation capability. Liu [42,43] et al. used the finite element method to study the angle behavior after conducting axial and eccentric compression test tests on 28 equal single-angle specimens with the section L51 × 6.4. Hussain proposed a set of finite element calculations regarding steel angle members under biaxial bending [1]. The mechanical performance of angle beam–column members was studied by Chan [44,45,46] et al., who recommended utilizing the DSM design approach. These studies observed that angle sections exhibit plastic development ability in flexural or beam–column applications, and they believed that the existing specifications are conservative and only provide some empirical formulas without making due provisions regarding the extent of plastic development of angle steel sections, which confused many designers.
Therefore, this study employs a theoretical analysis approach to examine the plastic properties of equal-angle sections subjected to combined axial force and biaxial bending. The fully plastic development property of the angle steel section was investigated. The formula for calculating the plastic development coefficient of angle sections is derived following the methodology outlined in the GB50017 specification. Plastic development coefficients for regular-size (limb width < 220 mm, limb thickness < 16 mm) and large-size angle sections were computed, and design-recommended values were furnished. Thus, appropriate regulations are made for the extent of plastic development of angle steel sections in plastic design, thereby solving the problem of inconsistent design results and even excessive conservatism caused by replacing eccentric compression angle members with axial compression members.

2. Full Plastic Analysis of the Angle Section

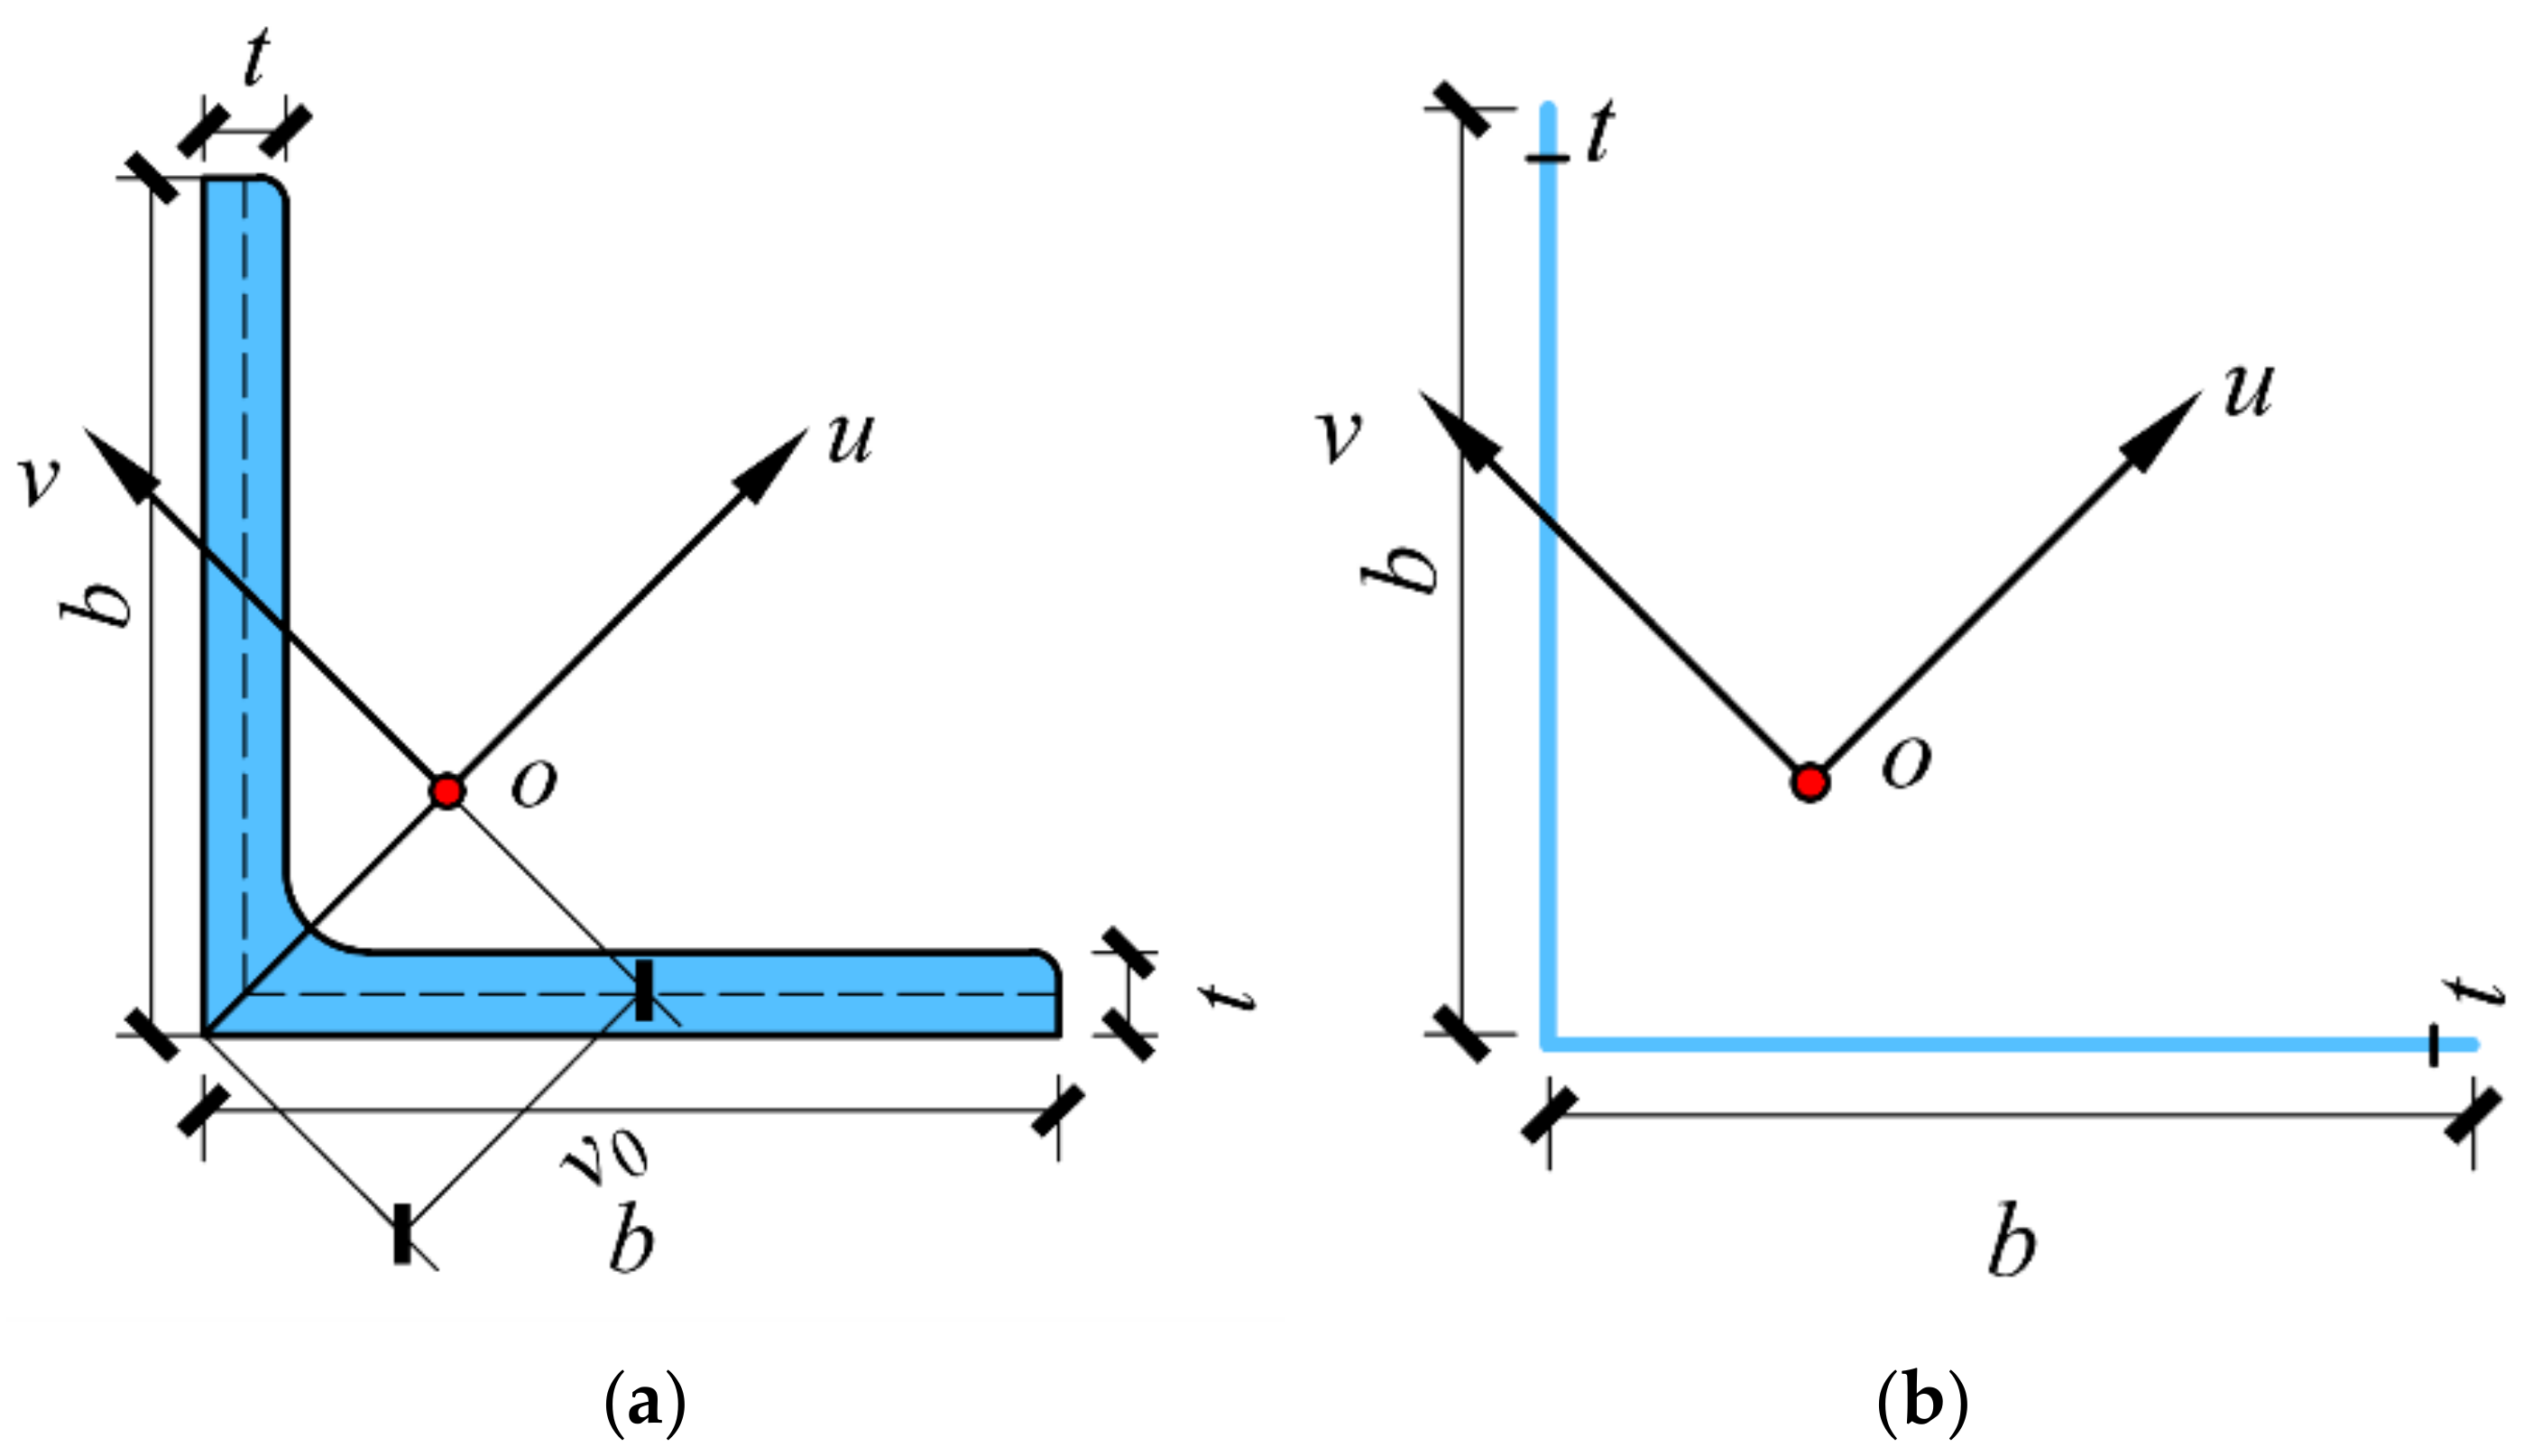
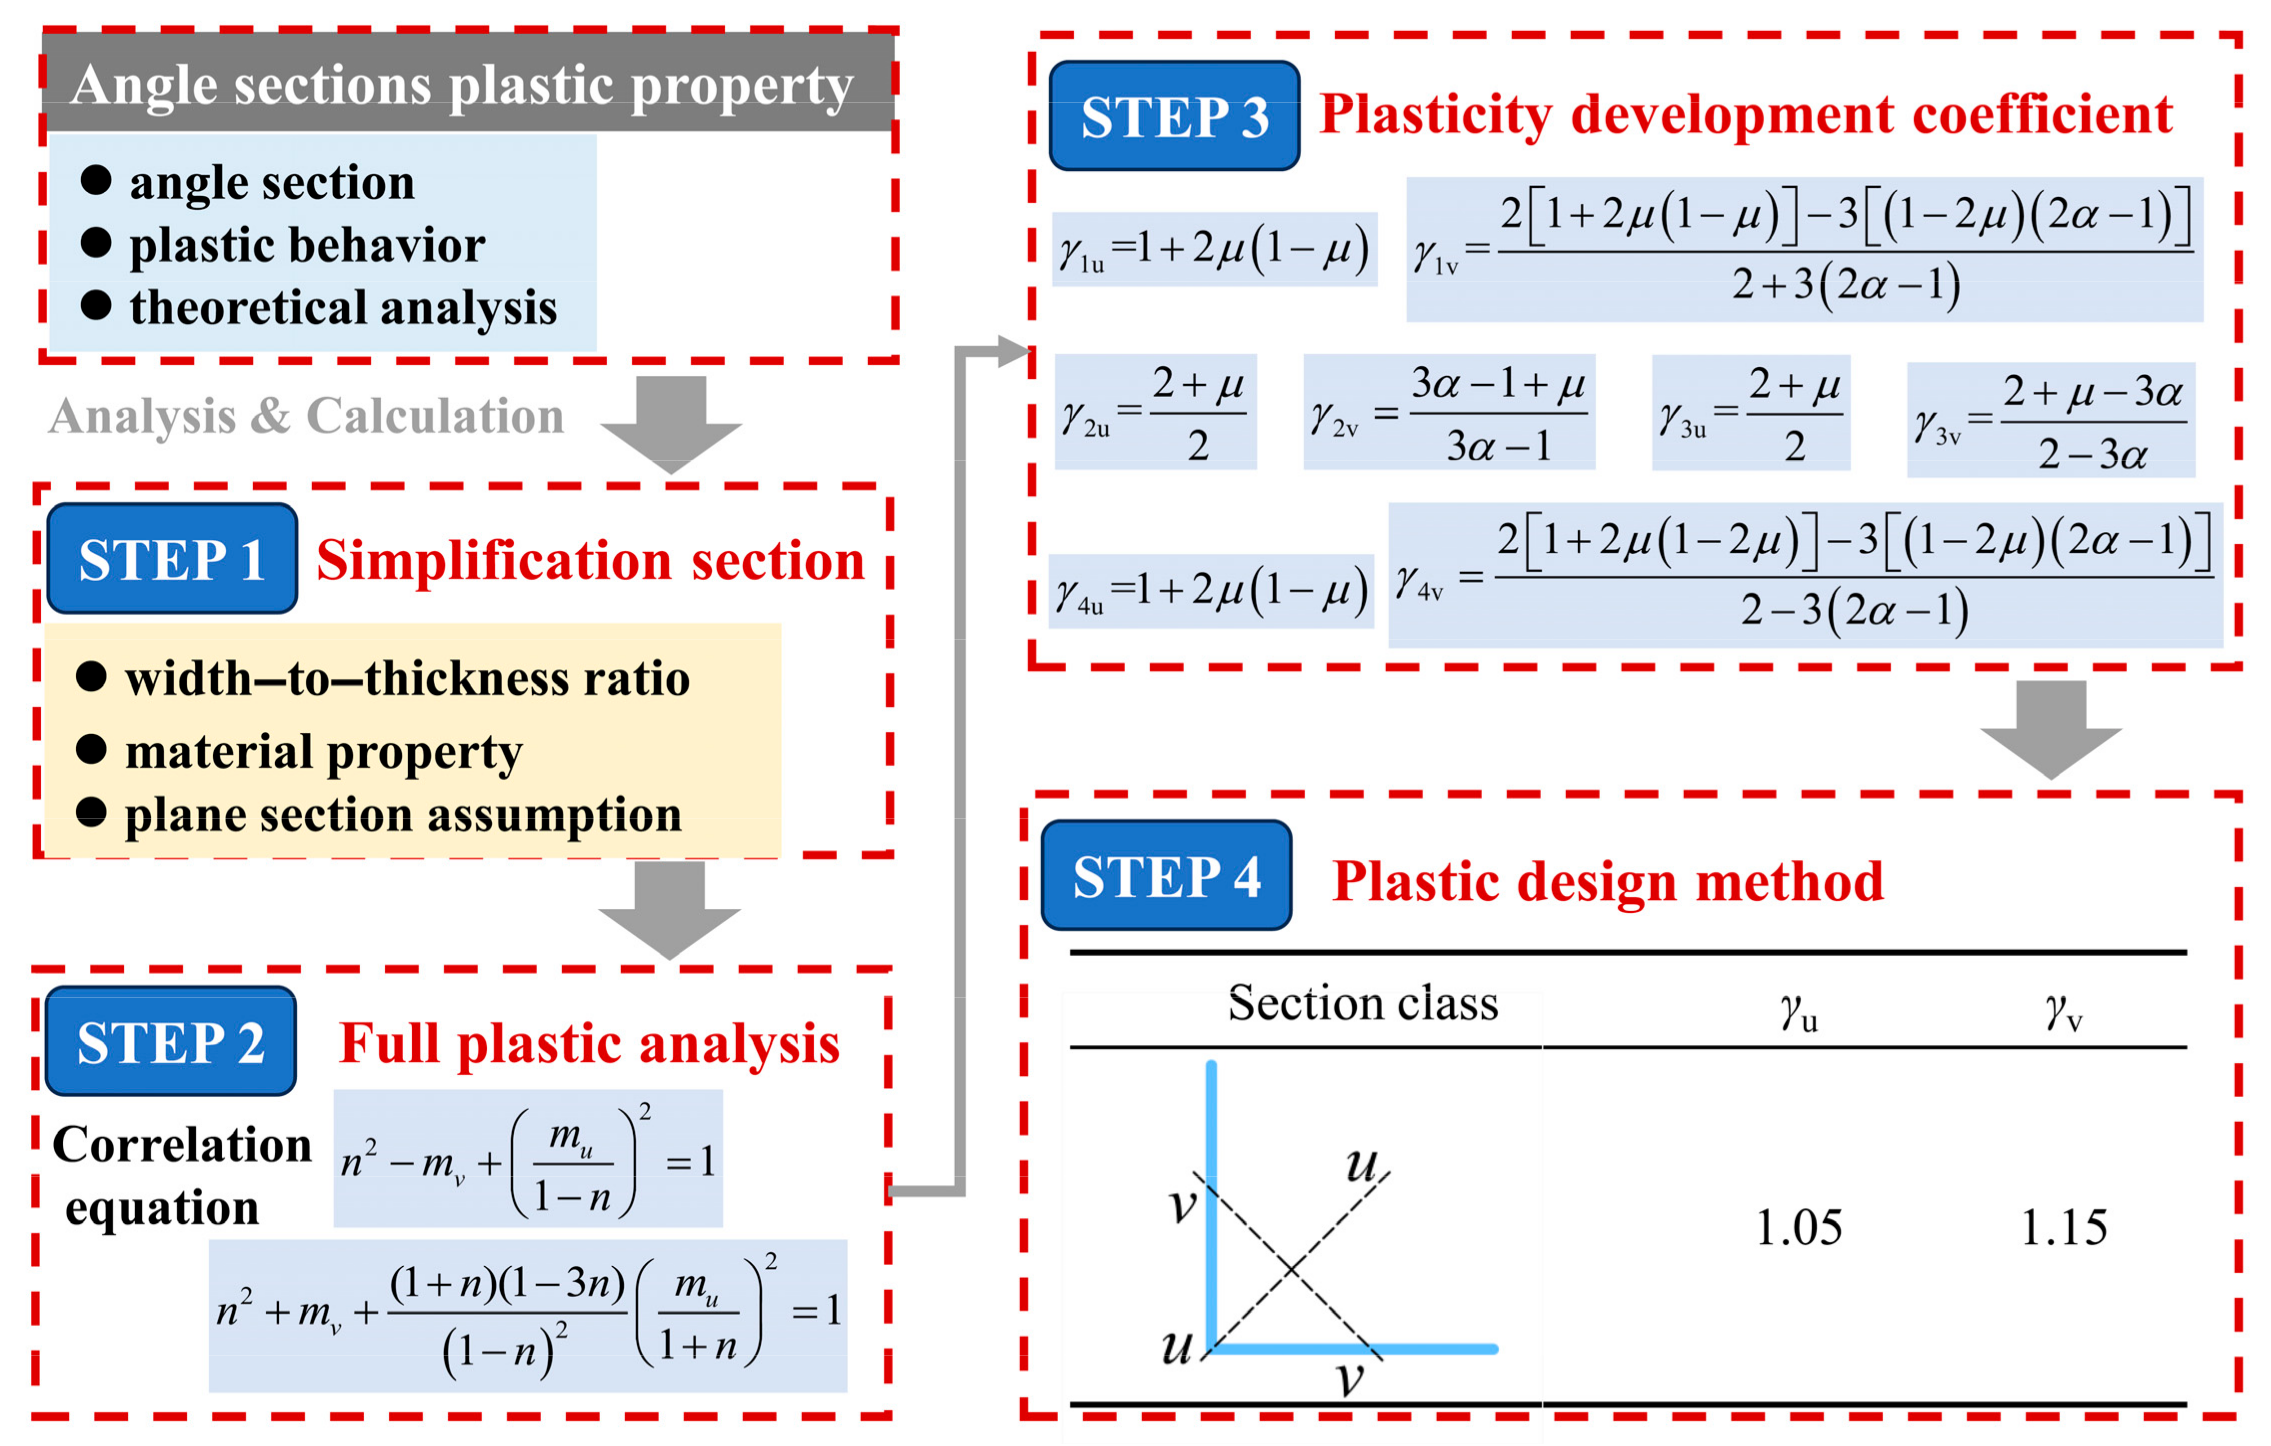
2.1. Cross-Section Simplification

The angle section limb thickness t is small relative to the limb width b. For specification GB/T706-2016 [47], the range of width-to-thickness ratios for the regular-size angle section (b < 220 mm) is 5.0 to 18.8, whereas for large-size angle steel (b ≥ 220 mm) is 7.1 to 13.9. To analyze the angle section mechanically better, the angle section is simplified in that the material concentrates on the center line, the two limbs equate to two intersecting straight lines, and the actual rounded corners are substituted with sharp corners [48]. The simplified angle section result is shown in Figure 1. The angle section is assumed to remain planar when subjected to tension, compression, or bending, and the axis remains perpendicular to its deformed state. The material properties of the steel are considered to exhibit ideal elastic–plastic behavior, with the material following Hooke’s law in the elastic phase and the entire section being capable of entering the plastic phase. Tension is considered positive, while compression is deemed negative. In the simplified angle section, the limb width is adjusted as b′ = bt/2. Consequently, this simplification process leads to a deviation in the section area due to the difference in the limb width value. When the limb width is taken as b for the regular-size angle section, the area calculation, according to Equation (1), results in an average deviation of 3.23% below the nominal value specified in the GB/T706-2016. When b′ is utilized, it falls short of the nominal value by 6.91%. In the case of the large-size angle section, when the limb width is taken as b, the section area calculation, as per Equation (1), exceeds the nominal value specified in the GB/T706-2016 by an average of 4.47%. Nevertheless, when b′ is employed, it falls short of the nominal value by 8.35%. Moreover, the moment of inertia between the simplified section’s strong axis (u-axis) and weak axis (v-axis) is higher than the nominal values in the standard by 0.92% and 0.13%, respectively. In the subsequent theoretical analysis of angle sections, the calculation formulas involved are applicable to both b and b′. This indicates that the errors introduced by using the simplified section for analysis are acceptable. Therefore, in the subsequent analysis, the limb width of the angle steel is considered as b.

2.2. Full Plastic Analysis

The simplified angle section is investigated to discuss its mechanical behaviors under axial force N and combined bending moments (Mu and Mv). The overall analysis process of this paper is shown in Figure 2.
Based on the position of the neutral axis (NA axis), the stress distribution in the angle section is categorized into four cases: the neutral axis intersects both limbs with the limb back in compression (Figure 3a), the neutral axis intersects the lower limb (Figure 3b), the neutral axis intersects both limbs with the limb back in tension (Figure 3c), and the neutral axis intersects the upper limb (Figure 3d). Different stress scenarios are analyzed for each case, and the section is considered to have reached its ultimate bearing capacity when the full cross-section is yielded. The geometric parameters for the angle section’s full plasticity are expressed as follows.
A = 2 b t
N p = A f y
M up = W up f y
M vp = W vp f y
N is the axial force applied to the angle section. Mu is the bending moments applied to the angle section along the strong axis (u-axis). Mv is the bending moments applied to the angle section along the weak axis (v-axis). A is the section area, fy is the yield strength, Np is the axial plastic bearing capacity, Wup and Wvp are the plastic section moduli of the strong and weak axes, respectively, and Mup and Mvp are the plastic bending moments of the strong and weak axes, respectively.
The stress distribution of the angle section in Figure 3a is analyzed. β1b and β2b are the distances from the intersection point of the neutral axis and the two limbs to the limb back, respectively. To satisfy the equilibrium of the force on the angle section, β1 and β2 have to satisfy the relationship in Equation (5).
N N p = 1     β 1   +   β 2
The bending moment for the strong axis (u-axis):
M u = b t f y 1   +   β 1 b 2 2 1     β 1     β 1 b 2 2 β 1   +   β 2 b 2 2 β 2     1   +   β 2 b 2 2 1     β 2
Collating the above equation obtains:
M u = β 2   +   β 1 β 2     β 1 2 b 2 t f y
The plastic bending moment for the strong axis:
M up = 2 b 2 2 b t f y = 1 2 b 2 t f y
The bending moment for the weak axis (v-axis):
M v = b t f y     β 1 b 2 2 1     β 1     1     β 1 b 2 2 β 1     1     β 2 b 2 2 β 2     β 2 b 2 2 1     β 2
Collating the above equation obtains:
M v = β 1 2   +   β 2 2     β 1   +   β 2 2 b 2 t f y
The plastic bending moment for the weak axis:
M vp = 4 1 2 b 2 2 1 2 b t f y = 1 2 2 b 2 t f y
From Equations (5)–(11), the full plasticity correlation equation for the angle section under the combined action of axial force and biaxial bending moment can be obtained, as shown in Equation (12).
N N p 2     M v M vp   +   M u / M up 1 - N / N p 2 = 1
The stress distribution of the angle steel section in Figure 3b is analyzed. β2b is the distance from the intersection point of the neutral axis with the lower limb to the limb back, and the parameter β2 is related to the axial force exerted on the section, shown in Equation (13).
β 2 =     N N p
The bending moment for the strong axis:
M u = b t f y     b 2 2   +   β 2 b 2 2 β 2     1   +   β 2 b 2 2 1     β 2
Collating the above equation obtains:
M u = β 2 2     1 2 b 2 t f y
The plastic bending moment for the strong axis:
M up = 2 b 2 2 b t f y = 1 2 b 2 t f y
From Equations (13)–(16), the full plasticity correlation equation of the axial force and bending moment about the strong axis can be obtained, as shown in Equation (17).
N N p 2     M u M up = 1
The bending moment for the weak axis:
M v = b t f y     1     β 2 b 2 2 β 2     β 2 b 2 2 1     β 2
Collating the above equation obtains:
M v =     β 2 1     β 2 2 b 2 t f y
The plastic bending moment for the weak axis:
M vp = 4 1 2 b 2 2 1 2 b t f y = 1 2 2 b 2 t f y
From Equations (13), (19), and (20), the full plasticity correlation equation of axial forces and bending moments about the weak axis can be obtained as shown in Equation (21).
2 N N p   +   N 2 N p 2     M v M vp = 0
The same approach can be employed to analyze the stress distribution in the cases depicted in Figure 3c,d, deriving the full plasticity correlation equation for the angle section as shown in Equations (22)–(24).
N N p 2   +   M v M vp   +   M u / M up 1   +   N / N p 2 = 1
N N p 2   +   M u M up = 1
2 N N p   +   N 2 N p 2     M v M vp = 0
where Equation (22) represents the correlation equation for the stress distribution state in Figure 3c, Equations (23) and (24), conversely, pertain to the correlation equations for the strong and weak axis of the stress distribution state in Figure 3d, respectively.

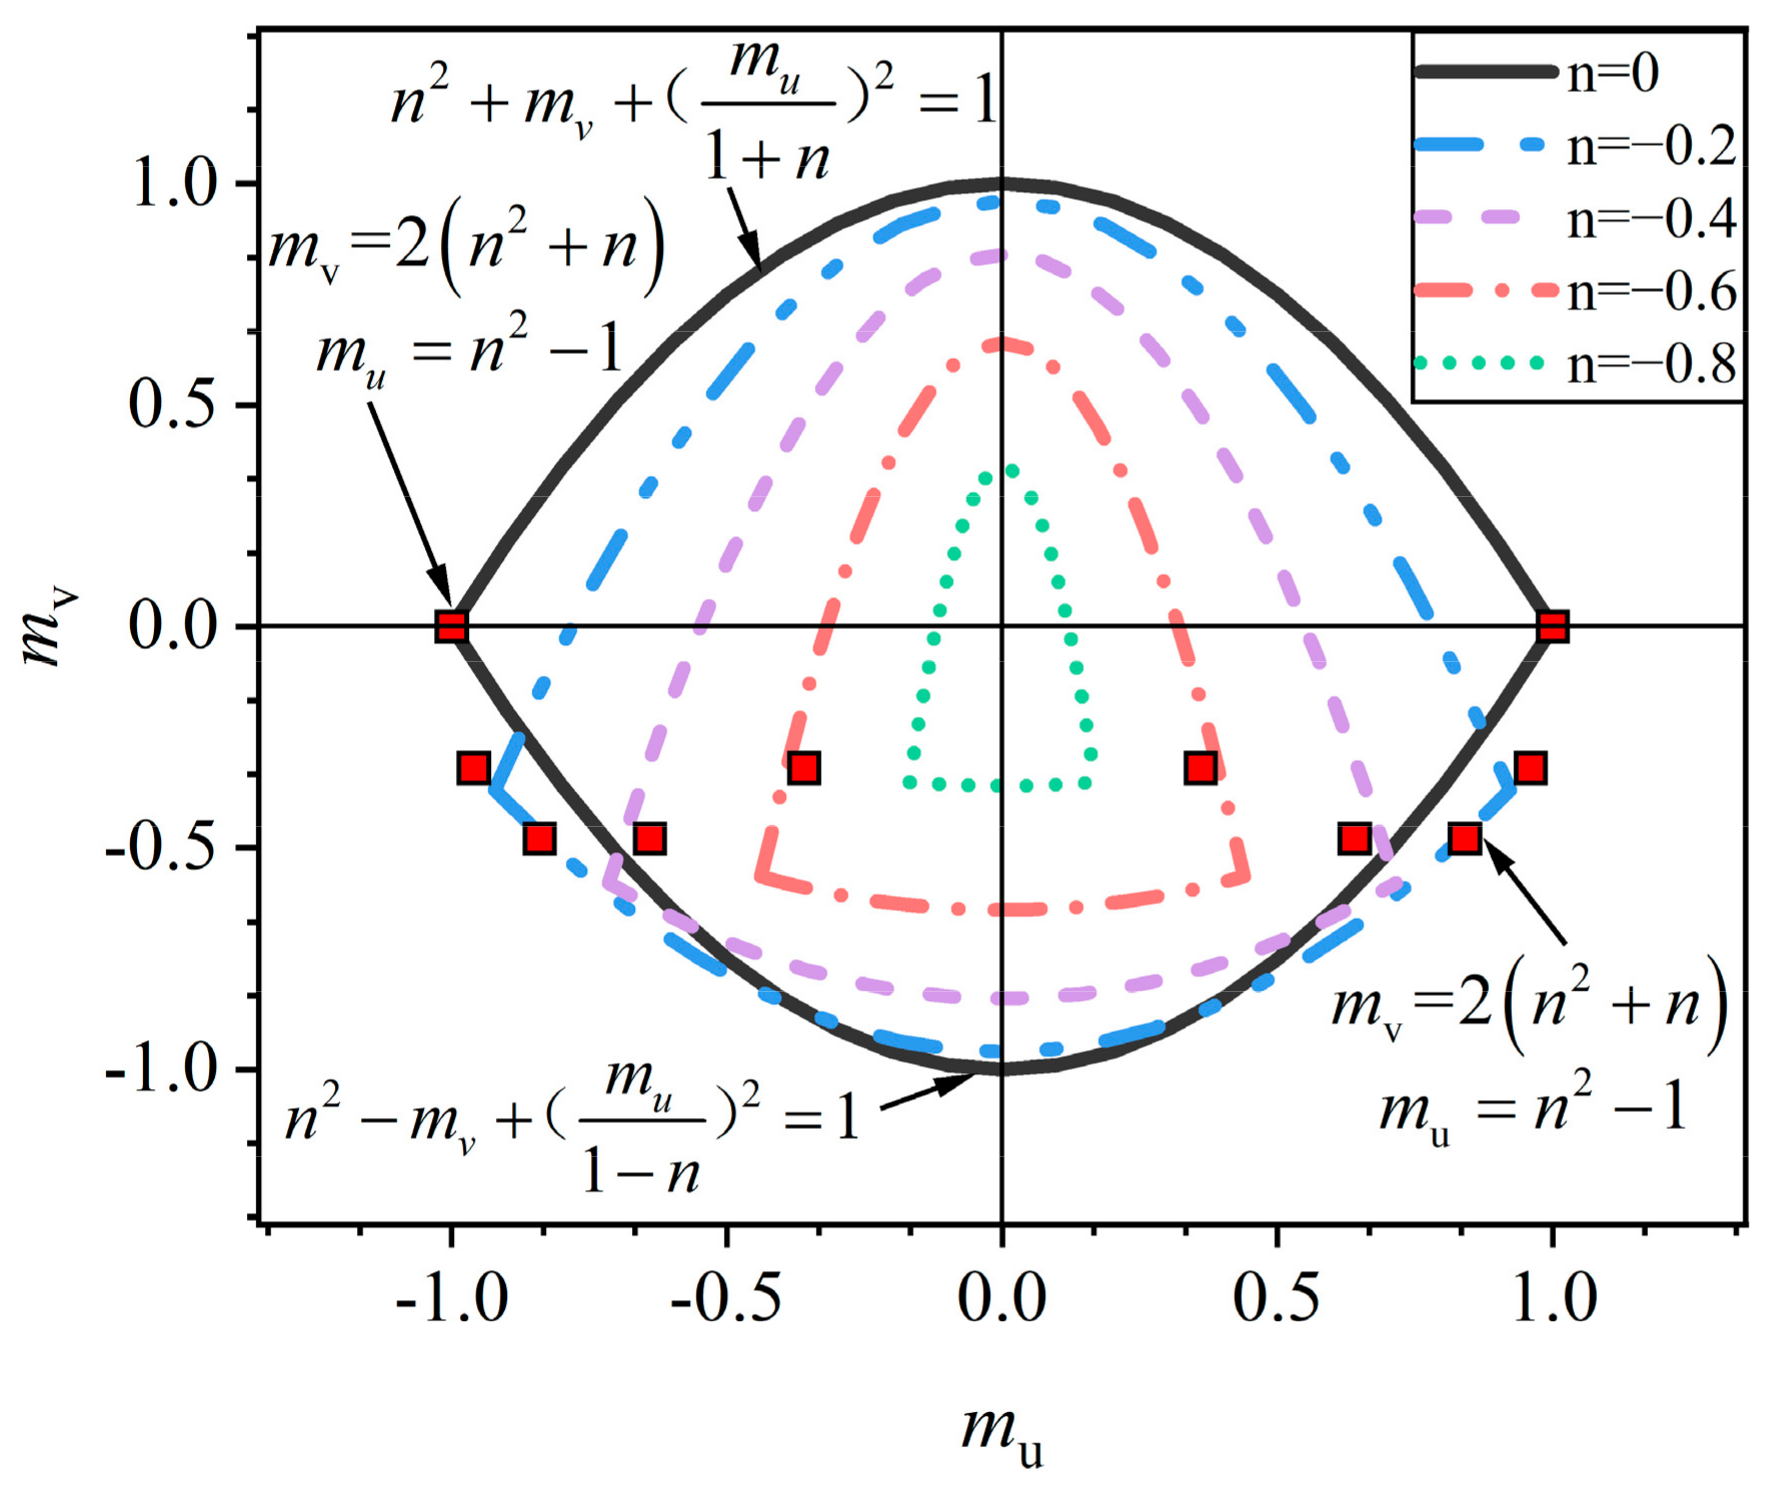
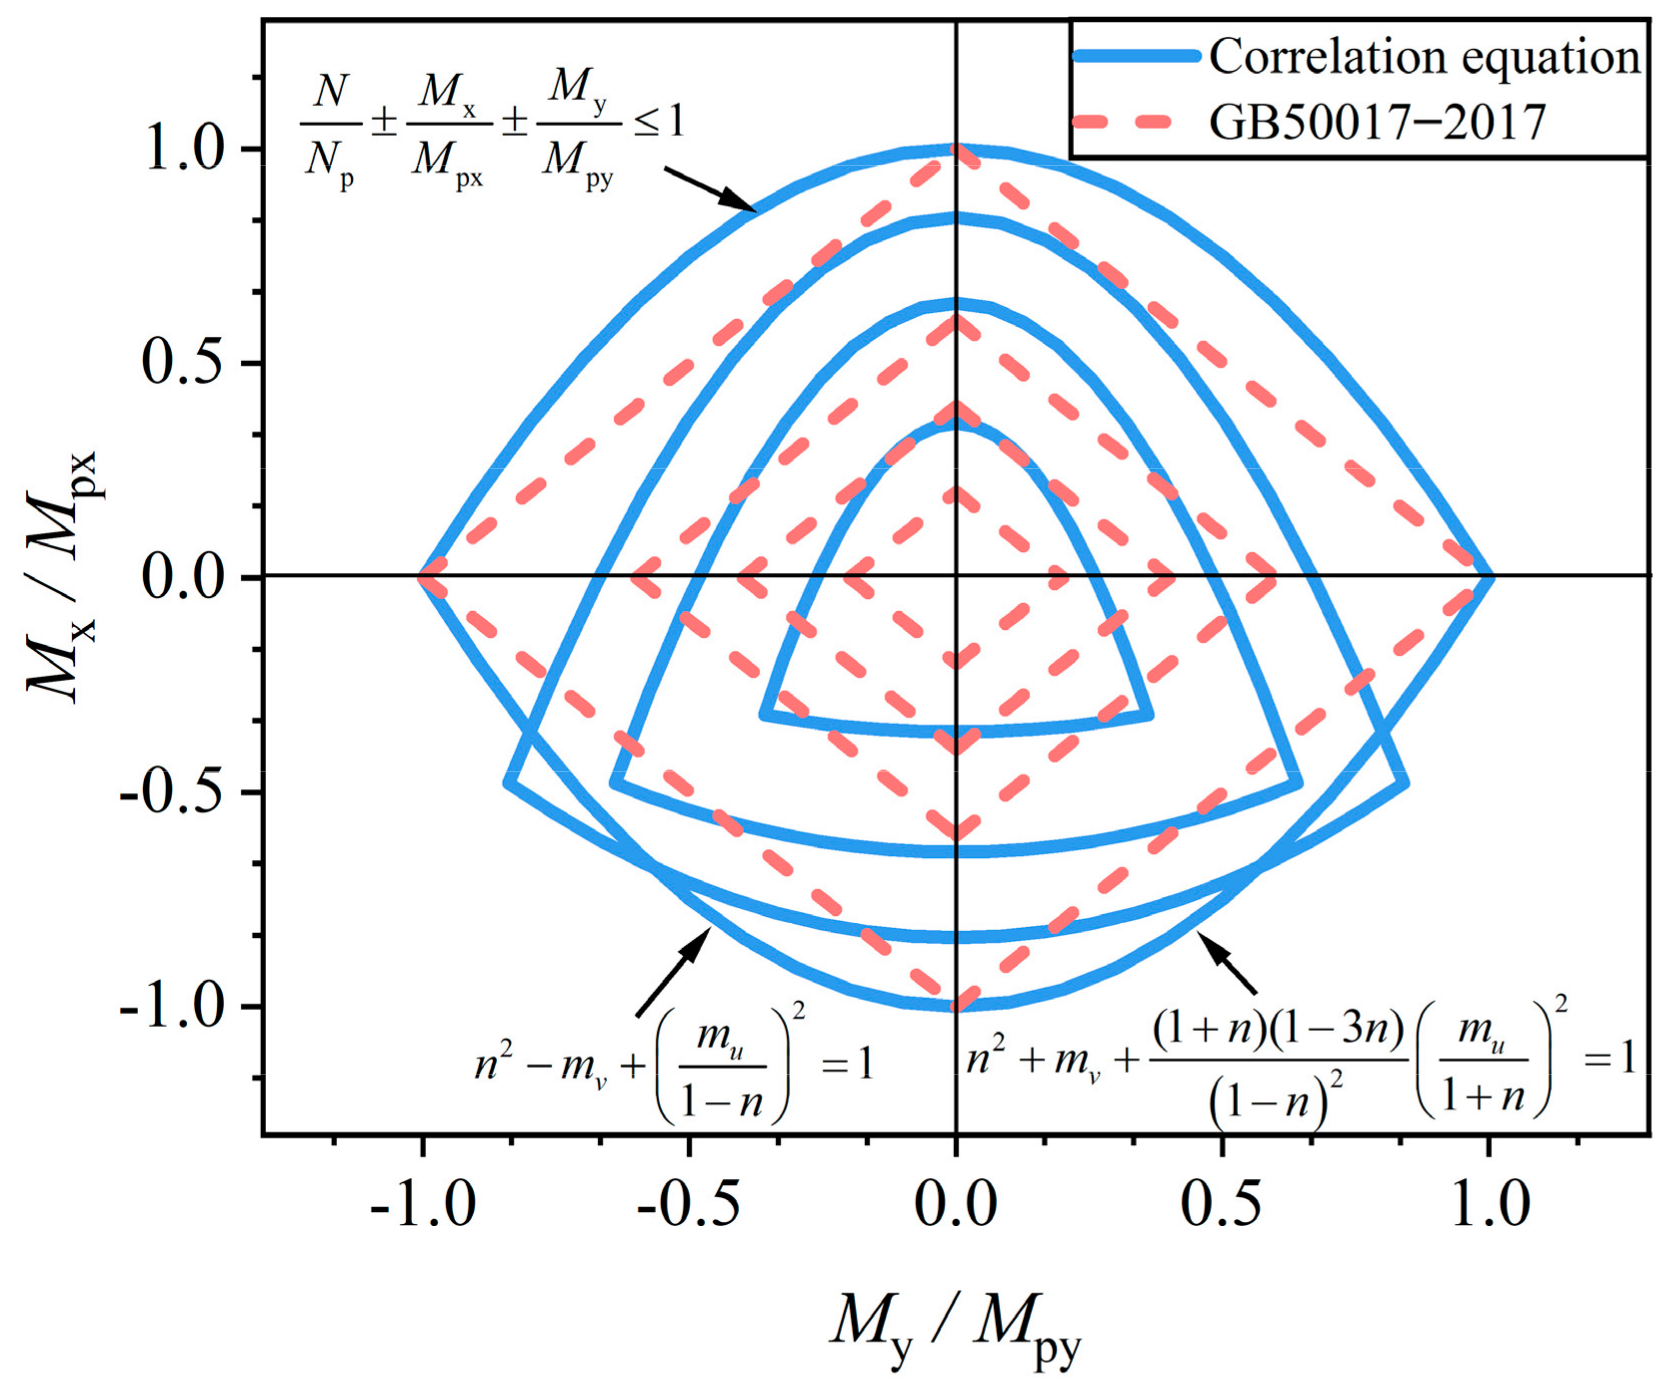
2.3. Full Plastic Correlation Equations

To conduct a more in-depth analysis of the full plastic correlation equations for the angle section’s axial force and biaxial bending moment, we introduce the following dimensionless parameters: n = N/Np, mu = Mu/Mup, and mv = Mv/Mvp. Consequently, we can simplify the fully plastic correlation equations presented in Equations (12), (17), (21)–(24) as follows.
The correlation equation for the stress distribution state depicted in Figure 3a was simplified as Equation (25).
n 2     m v   +   m u 1 - n 2 = 1
Similarly, the correlation equation for the stress distribution state in Figure 3b was simplified as Equations (26) and (27).
m u = n 2     1
m v = 2 n 2   +   n
Similarly, the correlation equation on the stress distribution state in Figure 3c was simplified as Equation (28).
n 2   +   m v   +   m u 1   +   n 2 = 1
Furthermore, we simplify the correlation equation for the stress distribution state in Figure 3d, resulting in Equation (29) and (30).
m u = 1     n 2
m v = 2 n 2   +   n
The relationship curves for the fully plastic correlation equations range from (25) to (30) at various values of n, as illustrated in Figure 4. The full plasticity relationship curves exhibit a distinct convex shape. When a fixed value of n is considered, Equations (25) and (28) correspond to the lower and upper segments of the curve—meanwhile, Equations (26), (27), (29), and (30) denote the red angular points indicated in the graph. Notably, these angular points do not completely coincide with the curve itself, thus requiring modifications to the full plasticity relationship curves. In Figure 3b,d, where the neutral axis intersects a single limb of the angle section, although the neutral axis can rotate over a wide range, the lengths of the tensile and compressive zones need to remain constant to satisfy the equilibrium conditions. Therefore, during the rotation process, Figure 3b,d correspond to only one point on the full plasticity relationship cures, specifically the angular points marked in Figure 4. Moreover, in both of these scenarios, the neutral axis and the angle limb are nearly perpendicular, making the stress distribution of the simplified angle section very similar to that of the actual section. Particularly when v 0 b 2 2 it can be considered that the simplified angle section centroid is the same as that of the actual section. Hence, these angular points can be used to modify the curve.
Introducing correction coefficients ρ1 and ρ2, we can rewrite Equations (25) and (28) as follows.
n 2     m v   +   ρ 1 m u 1     n 2 = 1
n 2   +   m v   +   ρ 2 m u 1   +   n 2 = 1
By substituting Equations (26) and (27) into Equation (31) and substituting Equations (29) and (30) into Equation (32), we obtain:
ρ 1 = 1
ρ 2 = ( 1   +   n ) ( 1     3 n ) 1     n 2
The calculation results of ρ1 and ρ2 are substituted in Equations (29) and (30) to obtain Equations (35) and (36) and depict the full plasticity relationships of angle sections under different n values as shown in Figure 5.
n 2     m v   +   m u 1 - n 2 = 1
n 2   +   m v   +   ( 1   +   n ) ( 1     3 n ) 1     n 2 m u 1   +   n 2 = 1
From Figure 5, it can be observed that the relationship curves remain convex, with Equation (35) representing the lower portion of the curve and Equation (36) representing the upper portion. Moreover, both curves encompass the angular points, indicating that Equations (35) and (36) can serve as the full plasticity correlation equation for the angle section under the combined action of axial force and biaxial bending moment. In standard GB50017, to facilitate the design and consider unfavorable factors, the strength design formula for members subjected to axial force and biaxial bending moment, whether in tension or compression, is presented in a linear form, as shown in Equation (37).
N N p ± M x M px ± M y M py 1
where, N p = A n f y , M px = γ x W nx f y , M py = γ y W ny f y . An is the net cross-section area, Wnx and Wny are the x-axis and y-axis net cross-section moduli, and γx and γy are the x-axis and y-axis cross-section plasticity development coefficients.
Comparing the relationship curves of the derived full plasticity correlation equations for the angle section with the relationship curves of the strength design formula in the standard GB50017, as shown in Figure 6. It can be observed that the full plasticity equation results in a convex curve, whereas the standard design formula follows a linear relationship. Furthermore, the standard design formula is relatively conservative compared with the full plasticity equation. This conservative formula arises from the fact that the standard employs a linear simplified formula, utilizing the section plastic development coefficient γ to restrict the section plastic development depth. This approach ensures that members can utilize the plastic properties of the section while maintaining an adequate margin of safety, fully leveraging the material’s performance. Therefore, for structural design safety considerations, it is also possible to refer to the linear relationships in the standard and discuss the values of the section plastic development coefficient γ, which reflects the plastic performance of angle sections.

3. Plasticity Development Coefficient

3.1. Section Shape Coefficient

The plastic section modulus Wp divided by the elastic section modulus We is denoted by the form factor γF, which represents the full plastic capacity of the section. The section shape coefficients of the angle section strong axis γFu and the weak axis γFv for both regular size (limb width of 100 mm and 150 mm) and large-size (limb width of 220 mm and 250 mm), with different width-to-thickness ratios are calculated, as per the GBT706-2016 standard. The results are depicted in Figure 7.
It can be observed that for a regular-size section angle with a limb width of 100 mm, the strong axis section shape coefficient γFu ranges from 1.65 to 1.93, while the weak axis γFv ranges from 1.67 to 2.21. For a limb width of 150 mm, the strong axis γFu ranges from 1.63 to 1.78, and the weak axis γFv ranges from 1.67 to 1.96. Large-size angle section with a limb width of 220 mm, the strong axis γFu ranging from 1.64 to 1.71, and the weak axis γFv ranging from 1.73 to 1.91. Similarly, in a large-size angle section with a limb width of 250 mm, the strong axis γFu ranges from 1.64 to 1.75, and the weak axis γFv ranges from 1.73 to 1.98. This reveals that for regular-size and large-size angles, the section shape coefficient of the weak axis is greater than that of the strong axis, which is consistent with the behavior of I-section biaxial symmetrically sections. In general, the limb width exerts a relatively modest impact on the section shape coefficient of angle sections, especially notable for large-size angle sections, where the trends in section shape coefficient exhibit remarkable consistency across various limb widths. The section shape coefficients are inversely associated with their width-to-thickness ratio; an escalation in this ratio results in a gradual reduction in the section shape coefficients. This implies that angle sections possessing higher width-to-thickness ratios display diminished plasticity. Additionally, the section shape coefficients for large-size angle sections are smaller than those of regular-size sections, signifying that regular-size angle sections exhibit pronounced plasticity.

3.2. Plastic Development Coefficient

The section’s plastic development coefficient γ is closely linked to its section shape, plastic development depth μh, and stress state. In this section, we investigate the method for calculating the plastic development coefficient of angle sections, drawing inspiration from the derivation approach for the plastic development coefficient of H-section in GB50017. During the analysis, the stress state is categorized into four scenarios: stress state 1, where both the limb tip and limb back simultaneously experience plastic compressive stress and plastic tensile stress; stress state 2, where the limb tip undergoes plastic compressive stress; stress state 3, where the limb back undergoes plastic tensile stress; stress state 4, where both the limb tip and limb back simultaneously experience plastic tensile stress and plastic compressive stress. The stress distribution states were visualized in Figure 8, where σ1 represents the tensile stress at the limb back in stress state 2, σ2 represents the tensile stress at the limb tip in stress state 3, α represents the limb width ratio, defined as the ratio of the distance from the intersection point (between the weak axis and a single limb) to the limb back to the limb width. fy signifies the yield stress, and σ0 denotes the equivalent stress.
The different stress states are analyzed to determine the calculation method for the plastic development coefficient. For the strong axis of stress state 1, based on the stress equilibrium conditions, we can obtain:
N = 0
M 1 u = μ b b     μ b 2     μ b μ b 2 1 2 b t f y 2   +   1     2 μ b 2 b     μ b     1     2 μ b 3 1 2     1     2 μ b 2 μ b   +   1     2 μ b 3 1 2 b t f y 2
Collating the above equation obtains:
M 1 u = 1   +   2 μ 1     μ 3 2 b 2 t f
When μ = 0, obtains:
M 1 ue = 1 3 2 b 2 t f
Therefore,
γ 1 u = M 1 u M 1 ue = 1   +   2 μ 1     μ
For the weak axis, according to the stress equilibrium conditions, it can be obtained that:
N = 0
M 1 v = μ b 1     α b - μ b 2 1 2   +   μ b α b - μ b 2 1 2 b t f y 2   +   1     2 μ b 2 1     α b     μ b     1     2 μ b 3     α b - b 2 1 2   +   1     2 μ b 2 α b     μ b     1     2 μ b 3 1 2 b t f y 2
Collating the above equation obtains:
M 1 v = 2 1   +   2 μ 1     μ     3 1     2 μ 2 α     1 6 2 b 2 t f y
When μ = 0, obtains:
M 1 ve = 2     3 2 α     1 6 2 b 2 t f y
Therefore,
γ 1 v = M 1 v M 1 ve = 2 1   +   2 μ 1     μ     3 1     2 μ 2 α     1 2   +   3 2 α     1
For the strong axis of stress state 2, we can obtain that:
N = 2 b t σ 0 = 2 b t f y     1     μ b 2 t f y   +   σ 1 2
M 2 u = 1     μ b 2 t b     1     μ b 3 1 2 f y   +   σ 1 2
Then:
f y   +   σ 1 = 2 1     μ f y     σ 0
M 2 u = 1     μ 2 2   +   μ 3 2 2 1     μ b 2 t f y   +   σ 1 2 = 2 2   +   μ 3 2 b 2 t f y     σ 0
When μ = 0, obtains:
M 2 ue = 4 3 2 b 2 t f y     σ 0
Therefore:
γ 2 u = M 2 u M 2 ue = 2   +   μ 2
For the weak axis:
N = 2 b t σ 0 = 2 b t f y     1     μ b 2 t f y   +   σ 1 2
M 2 v = 1     μ b 2 t α b     1     μ b 3 1 2 f y   +   σ 1 2
Then:
f y   +   σ 1 = 2 1     μ f y     σ 0
M 2 v = 1     μ 2 3 α     1   +   μ 3 2 2 1     μ b 2 t f y   +   σ 1 2 = 2 3 α     1   +   μ 3 2 b 2 t f y     σ 0
When μ = 0, obtains:
M 2 ve = 2 3 α     1 3 2 b 2 t f y     σ 0
Therefore,
γ 2 v = M 2 v M 2 ve = 3 α     1   +   μ 3 α     1
For the strong axis of stress state 3, we can obtain that:
N = 2 b t σ 0 = 1     μ b 2 t f y   +   σ 2 2     2 b t f y
M 3 u = 1     μ b 2 t b     1     μ b 3 1 2 f y   +   σ 2 2
Then:
f y   +   σ 2 = 2 1     μ f y     σ 0
M 3 u = 1     μ 2 2   +   μ 3 2 2 1     μ b 2 t f y     σ 0 2 = 2 2   +   μ 3 2 b 2 t f y     σ 0
When μ = 0, one obtains:
M 3 ue = 4 3 2 b 2 t f y     σ 0
Therefore,
γ 3 u = M 3 u M 3 ue = 2   +   μ 2
For the weak axis:
N = 2 b t σ 0 = 1     μ b 2 t f y   +   σ 2 2     2 b t f y
M 3 v = 1     μ b 2 t 1     α b     1     μ b 3 1 2 f y   +   σ 2 2
Then:
f y   +   σ 2 = 2 1     μ f y     σ 0
M 3 v = 1     μ 2 2   +   μ     3 α 3 2 2 1     μ b 2 t f y   +   σ 2 2 = 2 2   +   μ     3 α 3 2 b 2 t f y     σ 0
When μ = 0, one obtains:
M 3 ve = 2 2     3 α 3 2 b 2 t f y     σ 0
Therefore,
γ 3 v = M 3 v M 3 ve = 2   +   μ     3 α 2     3 α
For the strong axis of stress state 4, we can obtain that:
N = 0
M 4 u = μ b b - μ b 2     μ b μ b 2 1 2 b t f y 2   +   1     2 μ b 2 b     μ b     1     2 μ b 3 1 2     1     2 μ b 2 μ b   +   1     2 μ b 3 1 2 b t f y 2
Collating the above equation obtains:
M 4 u = 1   +   2 μ 1     μ 3 2 b 2 t f
When μ = 0, one obtains:
M 4 ue = 1 3 2 b 2 t f
Therefore,
γ 4 u = M 4 u M 4 ue = 1   +   2 μ 1     μ
For the weak axis:
N = 0
M 4 v = μ b 1     α b     μ b 2 1 2   +   μ b α b     μ b 2 1 2 b t f y 2   +   1     2 μ b 2 1     α b     μ b     1     2 μ b 3 1 2   +   1     2 μ b 2 α b     μ b     1     2 μ b 3     α b - μ b 2 1 2 b t f y 2
Collating the above equation obtains:
M 4 v = 2 1   +   2 μ 1     2 μ     3 1     2 μ 2 α     1 6 2 b 2 t f y
When μ = 0, one obtains:
M 4 ve = 2     3 2 α     1 6 2 b 2 t f y
Therefore,
γ 4 v = M 4 v M 4 ve = 2 1   +   2 μ 1     2 μ     3 1     2 μ 2 α     1 2     3 2 α     1
Based on the preceding analysis, it can be inferred that the plastic development coefficients γu and γv of angle sections in various stress states for the strong and weak axis are dependent on μ and α. Consequently, Table 1 and Table 2 present the values of γu and γv for angle sections with varying μ values (0.125, 0.15, 0.20, 0.25) and different α values. The α values in Table 1 are obtained from regular-size angle sections L150 × 8, L150 × 12, and L150 × 16, with respective α values of 0.532, 0.553, and 0.575. The α values in Table 2 are derived from large-size angle sections L250 × 18, L250 × 26, and L250 × 35, yielding α values of 0.547, 0.572, and 0.598, respectively.
The results demonstrate that as the section’s plastic development depth increases, both γu and γv values also rise. Furthermore, the weak axis value γv surpasses the strong axis γu, signifying superior plastic development capability along the weak axis, thereby affirming the earlier findings presented in this paper. The strong axis γu values for large-size angle sections are the same as those for regular-size angle sections. However, when considering various plastic development depths, the weak axis γv values for large-size angle sections exhibit average deviations of 3.94% (μ = 0.125), −1.72% (μ = 0.15), 7.32% (μ = 0.20), and 3.94% (μ = 0.25) in comparison to regular-size angle sections. This suggests no substantial disparity in the plastic development coefficients between regular-size and large-size angle sections by the analysis method presented in this paper. For ease of design and safety margin considerations, the plastic development coefficients for the strong and weak axis of the angle section are adopted as γu = 1.05 and γv = 1.15, respectively. This choice aligns with the Chinese steel structure design codes stipulating that the plastic development depth should not exceed 1/8 of the section height. Notably, these selected values are smaller than the minimum calculated values in Table 1 and Table 2.
Substituting the plastic development coefficients of the angle section into the strength design formula for biaxial bending specimens in the GB50017 and comparing it with the H-section and box-section, as shown in Figure 9. It can be observed that the strength design formula for the angle section follows a similar form to that of the H-section and box-section, and the plastic development capability of the angle section falls between that of the H-section and box-section.

4. Angle Section Classification Discussion

In this study, we found that the plastic development capacity of the angle section is intimately connected with the component plates’ width-to-thickness ratio and its plastic development depth, which is consistent with the conclusions of the references [3,4,39,40,41]. Moreover, Trahair believes that in comparison with flat bar sections, the plastic moment for angle sections is 1.5 times the first yield moment. However, in the standard GB50017, the plastic development depth of steel components is limited, not exceeding 1/8 of the section height, to ensure the plastic design’s safety margin. Therefore, based on the calculation method of the plastic development coefficient in this paper, the value of the plastic development coefficient for angle sections is discussed. The GB50017 and Eurocode 3 establish distinct grades for various section types when designing flexural and beam–column members, delineating them according to their width-to-thickness ratio to represent the member’s plastic development capacity. Nonetheless, it is noteworthy that these codes do not explicitly address angle sections. Trahair [49], based on the corresponding design standards, discussed the section grades classification for the angle section using local buckling coefficients. They considered the single-leg plates of the angle section as the extensions of the hot-rolled I-section flange. The Eurocode 3 also adopted a similar approach and classified the angle section into four categories based on the slenderness ratio λT of the constituent plates, which include plastic (λT < λp), compact (λp < λTλc), semi-compact (λc < λTλy), and slender (λy < λT).
Furthermore, the slenderness ratio λT for the strong and weak axes differ because of variations in local buckling coefficients. In the context of angle section classification, the plastic and compact types can be subject to plastic design, while the semi-compact type can attain the first-order yield moment. However, the slender type, constrained by local stability limitations, necessitates elastic design, and the section’s area must be determined based on the effective area. Following the classification method outlined in this reference, angle sections with Q420 strength grades, encompassing both regular-size (with limb widths of 100 mm and 150 mm) and large-size (with limb widths of 220 mm and 250 mm), are categorized and presented in Table 3 and Table 4. Table 3 and Table 4 reveal that, for regular-size angle sections, when assessed along the strong axis, all sections, with the exception of L100 × 7, L100 × 6, L150 × 10, and L100 × 8, are eligible for plastic design. When considering the weak axis, in addition to adhering to the criteria for the strong axis, sections L100 × 8 and L150 × 12 are also ineligible for plastic design. Concerning large-size angle sections, when assessed along the strong axis, all sections, with the exception of L220 × 16 and L250 × 18, meet the criteria for plastic design. In contrast, when evaluated along the weak axis, similar to the strong axis criteria, sections L220 × 18 and L250 × 20 are also ineligible for plastic design. This observation highlights that, when appraised along the strong axis, a larger number of angle sections qualify for plastic design in comparison to the weak axis. Furthermore, no angle sections are assigned to this category within the classification of slender sections, indicating that this classification method may be somewhat stringent.
For the sake of design convenience, this paper treats the single-leg plates of angle sections as extensions of hot-rolled I-section flanges and adopts the section classification method outlined in GB50017. Both regular-size and large-size angle sections are classified into five grades, as presented in Table 5 and Table 6. According to the standard, plastic design is appropriate when the width-to-thickness ratio grade of the section plates falls within S1, S2, or S3. Conversely, elastic design should be employed when the width-to-thickness ratio grade is S4 or S5. These guidelines are equally applicable to angle sections, aligning with the stipulations in the standard.
In the process of classification, the method used did not distinguish angle sections based on their different principal axis but directly categorized them based on the width-to-thickness ratio. A comparison between Table 3 and Table 4, and Table 5 and Table 6 reveals that, with the exception of the inclusion of regular-size angle section L100 × 9 and large-size angle section L250 × 22, which require elastic design, all other section classifications correspond to plastic design. In contrast, the classification method in reference [49] divides angle sections into four grades, whether regular-size or large-size, with no sections allocated to the slender section grades. However, following the classification method outlined in the GB50017 standard, angle sections are classified into five grades, encompassing both regular-size and large-size angle sections in all five grades. This suggests that the section grade classification for the angle section in this paper is relatively cautious compared with the reference [49]. This implies that, for the angle section, adopting the GB50017 standard’s classification method is a more prudent approach, offering increased safety margins for design and ensuring a safer and more reliable design. Therefore, when performing plastic design for angle sections, for section width-to-thickness ratio grades S1, S2, and S3, the section plastic development coefficients γu and γv should be taken as 1.05 and 1.15, respectively, i.e., the plastic development depth of the angle section is taken as 1/8 of the section height. When the section width-to-thickness ratio grade is S4 or S5, a value of 1.0 should be used.

5. Conclusions

This paper explored the plastic behavior of angle sections under the combined action of axial force and biaxial bending, derived the correlation equations for axial force and moment, analyzed the affecting factors of the angle sections’ plastic development capacity, introduced a method for computing the plastic development coefficients of angle sections, and summarized the key findings as follows:
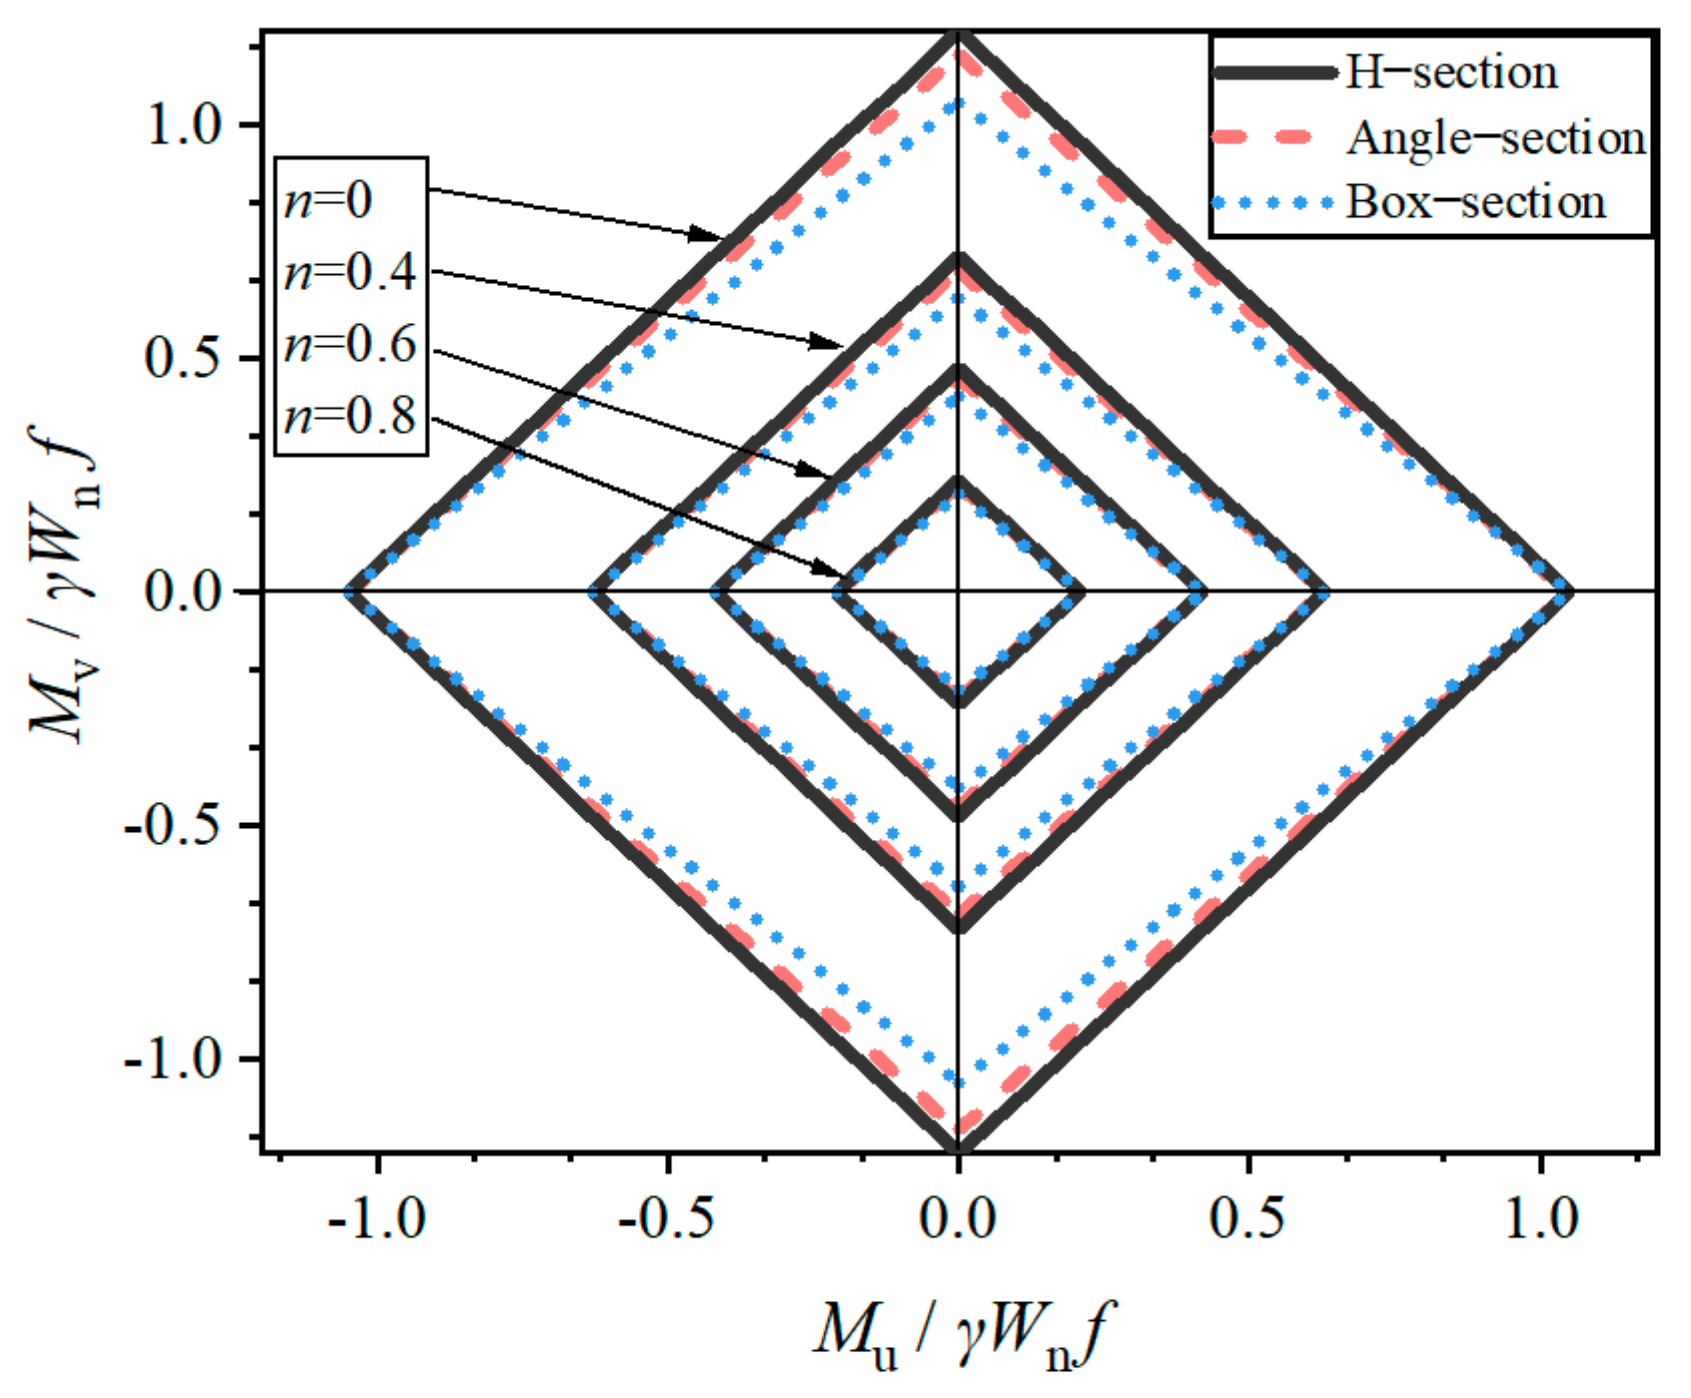
  • The axial force and moment full plasticity equation results are nonlinear, whereas the specification design formula follows a linear relationship. Furthermore, the specification design formula is relatively conservative compared with the full plasticity equation. This conservative arises from the fact that the standard employs a linear simplified formula, utilizing the section plastic development coefficient to restrict the section plastic development depth.
  • The section shape coefficients are inversely associated with their width-to-thickness ratio; an escalation in this ratio results in a gradual reduction in the section shape coefficients. This implies that angle sections possessing higher width-to-thickness ratios display diminished plasticity. Additionally, the section shape coefficients for large-size angle sections are smaller than those of regular-size sections, signifying that regular-size angle sections exhibit pronounced plasticity.
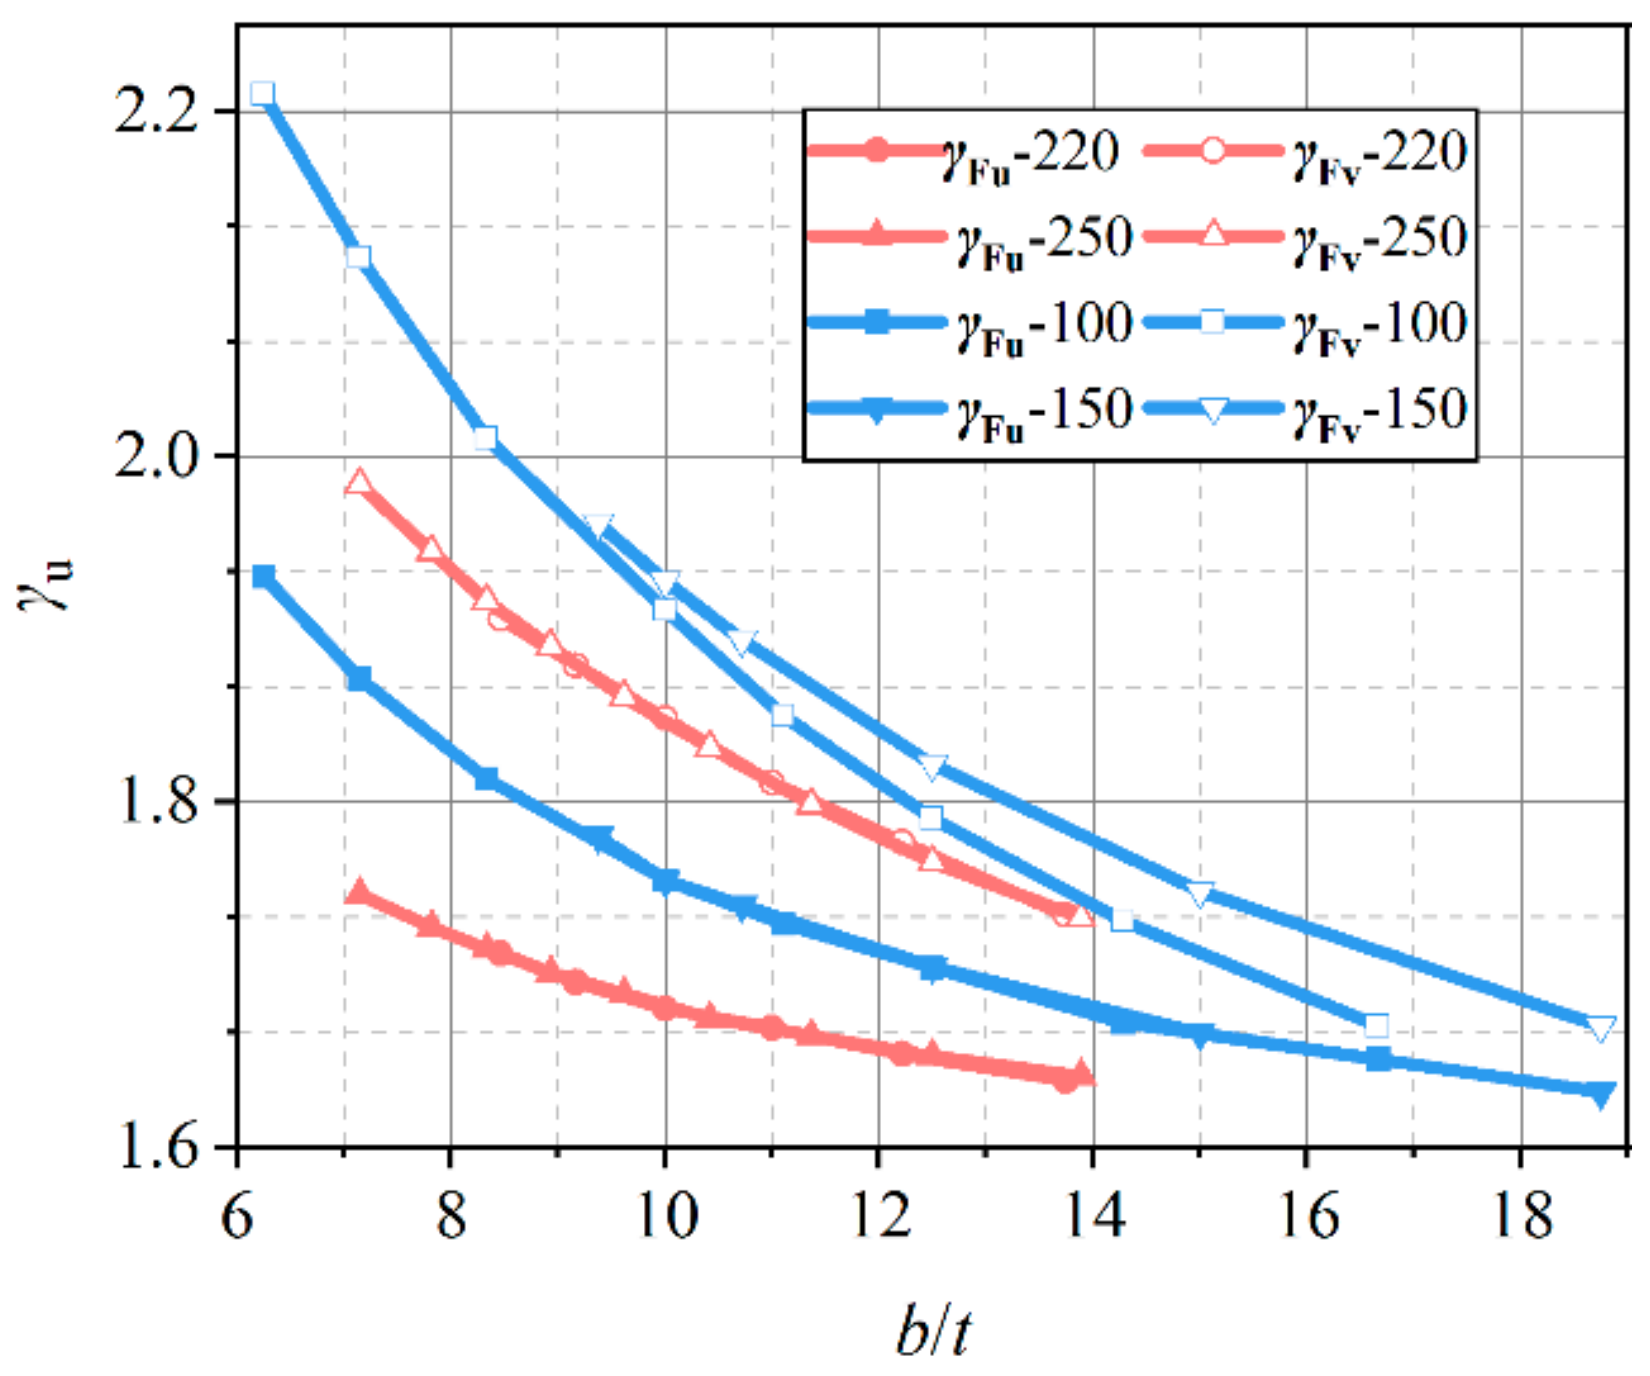
  • The angle sections’ plastic development coefficients are related to plastic development depth. Higher values of development depths are associated with larger values of γu and γv. The plastic development capability of angle sections is also between that of H-sections and box-sections, and they exhibit better plastic development capacity along the weak axis than the strong axis.
  • For regular-size and large-size angle sections, the plastic development coefficients for plastic design can be set to the same values. This choice aligns with the steel structure design code GB50017, stipulating that the plastic development depth should be taken as 1/8 of the section height, with strong and weak axes taken as γu = 1.05 and γv = 1.15, respectively.

Author Contributions

Conceptualization, Q.C.; Formal analysis, Y.S.; Methodology, Y.S.; Writing—original draft, D.S. and S.S.; Validation, Y.L. and Y.Y.; Writing—review and editing, Y.S. and D.S. All authors have read and agreed to the published version of the manuscript.

Funding

This research was funded by the Nanyang Institute of Technology Ph.D. Research Initiation Fund Project (Grant No. NGBJ-2023-34), the Henan Province Science and Technology Plan Project (Grant No. 242102320216), and the Henan Province Key Research Project Plan for Higher Education Institution (Grant No. 24A560016).

Data Availability Statement

The data presented in this study are available on request from the corresponding author. The data are not publicly available as research is continuing.

Conflicts of Interest

The authors declare that they have no known competing financial interests or personal relationships that could have appeared to influence the work reported in this paper.

References

  1. Hussain, A.; Liu, Y.P.; Chan, S.L. Finite Element Modeling and Design of Single Angle Member Under Bi-axial Bending. Structures 2018, 16, 373–389. [Google Scholar] [CrossRef]
  2. Charalampakis, A.; Koumousis, V. Ultimate strength analysis of composite sections under biaxial bending and axial load. Adv. Eng. Softw. 2008, 39, 923–936. [Google Scholar] [CrossRef]
  3. Vayas, I.; Charalampakis, A.; Koumousis, V. Inelastic resistance of angle sections subjected to biaxial bending and normal forces. Steel Constr. Des. Res. 2009, 2, 138–146. [Google Scholar] [CrossRef]
  4. Charalampakis, A.E. Full plastic capacity of equal angle sections under biaxial bending and normal force. Eng. Struct. 2011, 33, 2085–2090. [Google Scholar] [CrossRef]
  5. BS EN 1993-1-1; Eurocode3: Design of Steel Structures: Part 1-1: General Rules and Rules for Buildings. British Standards Institution (BSI): London, Britain, 2005.
  6. ANSI/AISC 360-16; Specification for Structural steel Buildings, ANSI/AISC 360-10. American Institute of Steel Construction (AISC): Chicago, IL, USA, 2016.
  7. GB50017-2017; Standard for Design of Steel Structures. China Architecture & Building Press: Beijing, China, 2017.
  8. Jiang, W.-Q.; Liu, Y.-P.; Chan, S.-L.; Wang, Z.-Q. Direct analysis of an ultrahigh-voltage lattice transmission tower considering joint effects. J. Struct. Eng. 2017, 143, 4017009. [Google Scholar] [CrossRef]
  9. Cho, S.; Chan, S.L. Second-order analysis and design of angle trusses, Part II: Plastic analysis and design. Eng. Struct. 2008, 30, 626–631. [Google Scholar] [CrossRef]
  10. Li, B.; Cao, P.; Zhang, D.; Guo, Y. Experimental research on behavior of Q420 dual-angle steel with cruciform section under dynamic compression. J. Vibroeng. 2017, 19, 2031–2042. [Google Scholar] [CrossRef]
  11. Qu, S.; Zhang, B.; Guo, Y.; Sun, Q.; Wang, Y. Ultimate strength of pinned-end dual-angle cross combined section columns under axial compression. Thin Wall Struct. 2020, 157, 107062. [Google Scholar] [CrossRef]
  12. Ban, H.Y.; Shi, G.; Shi, Y.J.; Wang, Y.Q. Residual Stress Tests of High-Strength Steel Equal Angles. J. Struct. Eng. 2012, 138, 1446–1454. [Google Scholar] [CrossRef]
  13. Shi, G.; Zhou, W.J.; Bai, Y.; Liu, Z. Local buckling of steel equal angle members with normal and high strengths. Int. J. Steel Struct. 2014, 14, 447–455. [Google Scholar] [CrossRef]
  14. Ban, H.Y.; Shi, G.; Shi, Y.J.; Wang, Y.Q. Column Buckling Tests of 420 Mpa High Strength Steel Single Equal Angles. Int. J. Struct. Stab. Dyn. 2013, 13, 1250069. [Google Scholar] [CrossRef]
  15. Cao, X.L.; Xu, Y.; Hao, J.P. Experimental analysis on ultimate bearing capacity of Q460 high-strength angle members under axial compression. J. Civ. Environ. Eng. 2018, 40, 146–152. [Google Scholar]
  16. Bezas, M.-Z.; Demonceau, J.-F.; Vayas, I.; Jaspart, J.-P. Experimental and numerical investigations on large angle high strength steel columns. Thin Wall Struct. 2021, 159, 107287. [Google Scholar] [CrossRef]
  17. Wang, F.; Liang, Y.; Zhao, O.; Young, B. Pin-ended press-braked S960 ultra-high strength steel angle section columns: Testing, numerical modelling and design. Eng. Struct. 2021, 228, 111418. [Google Scholar] [CrossRef]
  18. Zhang, L.; Liang, Y.; Zhao, O. Flexural-torsional buckling behaviour and resistances of fixed-ended press-braked S690 high strength steel angle section columns. Eng. Struct. 2020, 223, 111180. [Google Scholar] [CrossRef]
  19. Zhang, L.; Wang, F.; Liang, Y.; Zhao, O. Press-braked S690 high strength steel equal-leg angle and plain channel section stub columns: Testing, numerical simulation and design. Eng. Struct. 2019, 201, 109764. [Google Scholar] [CrossRef]
  20. Du, R.Z. Applications of Q420 large section angle steel in UHV power transmission line. Power Syst. Clean Energy 2011, 27, 30–34. [Google Scholar]
  21. Zhang, Z.F.; Li, Q.H.; Xing, H.J.; Tang, C.J.; Yuan, X. Application Study of 300 mm Large Size Angle Steel in +/− 1100 kV Ultra-high Voltage Tower Transmission Tower. Aer. Adv. Eng. Res. 2016, 30, 1304–1311. [Google Scholar]
  22. Cao, K.; Guo, Y.J.; Zeng, D.W. Buckling behavior of large-section and 420 MPa high-strength angle steel columns. J. Constr. Steel Res. 2015, 111, 11–20. [Google Scholar] [CrossRef]
  23. Chen, H.; Zeng, D.; Cao, K.; Guo, Y. Buckling behavior and design of large-section angle steel columns under axial compression. J. Build Eng. 2023, 78, 107578. [Google Scholar] [CrossRef]
  24. Chen, H.; Chen, H.; Cao, K.; Guo, Y. Study on Axial Compression Stability of Q345 Large-Section Angle Steel Columns. Buildings 2023, 13, 1030. [Google Scholar] [CrossRef]
  25. Sun, Y.; Guo, Y.J.; Chen, H.Y.; Cao, K. Stability of Large-Size and High-Strength Steel Angle Sections Affected by Support Constraint. Int. J. Steel Struct. 2021, 21, 85–99. [Google Scholar] [CrossRef]
  26. Sun, Y.; Song, D.; Sun, S.; Guo, Y. Behavior of large-size and high-strength steel angle subjected to eccentric load. Structures 2023, 57, 105161. [Google Scholar] [CrossRef]
  27. de Menezes, A.A.; Vellasco, P.C.d.S.; de Lima, L.R.; da Silva, A.T. Experimental and numerical investigation of austenitic stainless steel hot-rolled angles under compression. J. Constr. Steel Res. 2019, 152, 42–56. [Google Scholar] [CrossRef]
  28. Liang, Y.; Jeyapragasam, V.V.K.; Zhang, L.; Zhao, O. Flexural-torsional buckling behaviour of fixed-ended hot-rolled austenitic stainless steel equal-leg angle section columns. J. Constr. Steel Res. 2019, 154, 43–54. [Google Scholar] [CrossRef]
  29. Sun, Y.; Liu, Z.; Liang, Y.; Zhao, O. Experimental and numerical investigations of hot-rolled austenitic stainless steel equal-leg angle sections. Thin Wall Struct. 2019, 144, 106225. [Google Scholar] [CrossRef]
  30. Sarquis, F.R.; de Lima, L.R.; Vellasco, P.C.G.d.S.; Rodrigues, M. Experimental and numerical investigation of hot-rolled stainless steel equal leg angles under compression. Thin Wall Struct. 2020, 151, 106742. [Google Scholar] [CrossRef]
  31. Zhang, L.; Liang, Y.; Zhao, O. Experimental and numerical investigations of pin-ended hot-rolled stainless steel angle section columns failing by flexural buckling. Thin Wall Struct. 2020, 156, 106977. [Google Scholar] [CrossRef]
  32. Dobrić, J.; Filipović, A.; Baddoo, N.; Buđevac, D.; Rossi, B. Design criteria for pin-ended hot-rolled and laser-welded stainless steel equal-leg angle columns. Thin Wall Struct. 2021, 167, 108175. [Google Scholar] [CrossRef]
  33. Filipović, A.; Dobrić, J.; Baddoo, N.; Može, P. Experimental response of hot-rolled stainless steel angle columns. Thin Wall Struct. 2021, 163, 107659. [Google Scholar] [CrossRef]
  34. Behzadi-Sofiani, B.; Gardner, L.; Wadee, M.A. Testing, numerical analysis and design of stainless steel equal-leg angle section beams. Structures 2022, 37, 977–1001. [Google Scholar] [CrossRef]
  35. Dobrić, J.; Filipović, A.; Baddoo, N.; Marković, Z.; Buđevac, D. Design procedures for cold-formed stainless steel equal-leg angle columns. Thin Wall Struct. 2021, 159, 107210. [Google Scholar] [CrossRef]
  36. Dobrić, J.; Filipović, A.; Marković, Z.; Baddoo, N. Structural response to axial testing of cold-formed stainless steel angle columns. Thin Wall Struct. 2020, 156, 106986. [Google Scholar] [CrossRef]
  37. Zhang, L.; Tan, K.H.; Zhao, O. Experimental and numerical studies of fixed-ended cold-formed stainless steel equal-leg angle section columns. Eng. Struct. 2019, 184, 134–144. [Google Scholar] [CrossRef]
  38. Evans, S.I.; Xu, F.; Wang, J. Material properties and local stability of WAAM stainless steel equal angle sections. Eng. Struct. 2023, 287, 116160. [Google Scholar] [CrossRef]
  39. Trahair, N. Biaxial bending of steel angle section beams. J. Struct. Eng. 2004, 130, 554–561. [Google Scholar] [CrossRef]
  40. Trahair, N. Biaxial bending and torsion of steel equal angle section beams. J. Struct. Eng. 2007, 133, 78–84. [Google Scholar] [CrossRef]
  41. Aydın, R.; Doğan, M. Elastic, full plastic and lateral torsional buckling analysis of steel single-angle section beams subjected to biaxial bending. J. Constr. Steel Res. 2007, 63, 13–23. [Google Scholar] [CrossRef]
  42. Liu, Y.; Hui, L.B. Finite element study of steel single angle beam-columns. Eng. Struct. 2010, 32, 2087–2095. [Google Scholar] [CrossRef]
  43. Aydin, R.; Dogan, M.; Gunaydin, A.; Gokdemir, H.; Kirac, N. Experimental and code based study of beam-column behaviour of equal leg single-angles. J. Constr. Steel Res. 2011, 67, 780–789. [Google Scholar] [CrossRef]
  44. Chan, S.L.; Liu, Y.P.; Liu, S.W. A New Codified Design Theory of Second-order Direct Analysis for Steel and Composite Structures—From Research to Practice. Structures 2017, 9, 105–111. [Google Scholar] [CrossRef]
  45. Dinis, P.B.; Camotim, D.; Landesmann, A.; Martins, A.D. Improving the Direct Strength Method prediction of column flexural-torsional failure loads. Thin Wall Struct. 2020, 148, 106461. [Google Scholar] [CrossRef]
  46. Dinis, P.B.; Camotim, D. A novel DSM-based approach for the rational design of fixed-ended and pin-ended short-to-intermediate thin-walled angle columns. Thin Wall Struct. 2015, 87, 158–182. [Google Scholar] [CrossRef]
  47. GB/T706-2016; Hot Rolled Section Steel. China Standard Press: Beijing, China, 2016.
  48. Deng, C.; Zhang, C.; Zhou, J.; Chen, Y. Plate assembly elasto-plastic interactive buckling analyses of H Section steel members under compression and bending. J. Tongji Univ. (Nat. Sci.) 2016, 44, 1307–1315. [Google Scholar] [CrossRef]
  49. Trahair, N. Moment capacities of steel angle sections. J. Struct. Eng. 2002, 128, 1387–1393. [Google Scholar] [CrossRef]
Figure 1. Simplification of angle section: (a) actual section; (b) simplified section.
Buildings 14 02153 g001
Figure 2. The process of the proposed method.
Buildings 14 02153 g002
Figure 3. Stress distribution with the different neutral axis positions: (a) intersects the two limbs, which limb back in compression; (b) intersects the lower limb; (c) intersects the two limbs, which limb back in tension; (d) intersects the upper limb.
Buildings 14 02153 g003
Figure 4. Fully plastic correlation equation curve with different n values.
Buildings 14 02153 g004
Figure 5. Fully plastic correlation equation modified curve with different n values.
Buildings 14 02153 g005
Figure 6. Comparison of full plasticity correlation equation and standard design formulas.
Buildings 14 02153 g006
Figure 7. Comparison of section shape coefficient.
Buildings 14 02153 g007
Figure 8. Different stress states: (a) stress state 1; (b) stress state 2; (c) stress state 3; (d) stress state 4.
Buildings 14 02153 g008aBuildings 14 02153 g008b
Figure 9. Comparison of strength design formulas for different section forms.
Buildings 14 02153 g009
Table 1. Plastic development coefficient for regular-size angle sections.
Stress Stateμ0.1250.150.200.25
α0.5320.5530.5750.5320.5530.5750.5320.5530.5750.5320.5530.575
1γ1u1.2191.2551.3201.375
γ1v1.2691.3081.3541.3141.3611.4151.3961.4571.5281.4681.5421.628
2γ2u1.0631.0751.1001.125
γ2v1.2101.1891.1731.2521.2271.2071.3361.3031.2761.4191.3791.345
3γ3u1.0631.0751.1001.125
γ3v1.3091.3681.4531.3711.4411.5431.4951.5881.7251.6191.7351.906
4γ4u1.2191.2551.3201.375
γ4v1.2691.3081.3541.3141.3611.4151.3961.4571.5281.4681.5421.628
Table 2. Plastic development coefficient for large-size angle sections.
Stress Stateμ0.1250.150.200.25
α0.5470.5720.5980.5470.5720.5980.5470.5720.5980.5470.5720.598
1γ1u1.2191.2551.3201.375
γ1v1.2961.3481.4151.3471.4081.4871.4391.5181.6221.5191.6161.741
2γ2u1.0631.0751.1001.125
γ2v1.1951.1751.1571.2341.2091.1891.3121.2791.2521.3901.3491.314
3γ3u1.0631.0751.1001.125
γ3v1.3491.4401.6101.4191.5281.7321.5581.7041.9771.6981.8802.221
4γ4u1.2191.2551.3201.375
γ4v1.2961.3481.4151.3471.2961.3481.4151.3471.2961.3481.4151.347
Table 3. Section classification of regular-size angle section.
AxisPlastic λpCompact λcSemi-Compact λySlender
Strong121626>26
L100 × 16, L100 × 14
L100 × 12, L100 × 10
L150 × 16, L150 × 15
L100 × 9, L100 × 8
L150 × 14, L150 × 12
L100 × 7, L100 × 6
L150 × 10, L100 × 8
/
Weak101423>23
L100 × 16, L100 × 14
L100 × 12
L100 × 10, L100 × 9
L150 × 16, L150 × 15
L150 × 14
L100 × 8, L100 × 7
L100 × 6, L150 × 12
L150 × 10, L100 × 8
/
Table 4. Section classification of large-size angle.
AxisPlastic λpCompact λcSemi-Compact λySlender
Strong121626>26
L220 × 26, L220 × 24
L220 × 22, L250 × 35
L250 × 32, L250 × 30
L250 × 28, L250 × 26
L220 × 20, L220 × 18
L250 × 24, L250 × 22
L250 × 20
L220 × 16
L250 × 18
/
Weak101423>23
L220 × 26, L250 × 35
L250 × 32, L250 × 30
L220 × 24, L220 × 22
L220 × 20, L250 × 28
L250 × 26, L250 × 24
L250 × 22
L220 × 16
L220 × 18
L250 × 18
L250 × 20
/
Table 5. Slenderness ratio limit for classification of regular-size angle section.
Section ClassS1S2S3S4S5
b/t9εk11εk13εk15εk20
Angle sectionL100 × 16
L100 × 14
L150 × 16
L100 × 12
L100 × 10
L150 × 15
L150 × 14
L100 × 9
L100 × 8
L150 × 12
L100 × 6
L100 × 7
L150 × 10
L150 × 8
Table 6. Slenderness ratio limit for classification of large-size angle section.
Section ClassClass S1Class S2Class S3Class S4Class S5
b/t9εk11εk13εk15εk20
Angle sectionL250 × 35
L250 × 32
L220 × 26
L250 × 30
L250 × 28
L220 × 24
L220 × 22
L220 × 20
L250 × 26
L250 × 24
L220 × 18
L250 × 22
L250 × 20
L220 × 16
L250 × 18
εk is the correction coefficient of the steel grade. ε k = 235 f y .
Disclaimer/Publisher’s Note: The statements, opinions and data contained in all publications are solely those of the individual author(s) and contributor(s) and not of MDPI and/or the editor(s). MDPI and/or the editor(s) disclaim responsibility for any injury to people or property resulting from any ideas, methods, instructions or products referred to in the content.

