Abstract
The development of the straddle-type monorail tour-transit system (MTTS) has received keen attention. Regarding the unspecified regulations on the lateral stiffness limit of steel substructures, which is essential for the design of MTTSs, this work presents a comprehensive assessment of the issue. Firstly, a wind–vehicle–bridge coupling model was established, integrating multibody dynamics and finite element methods. This model was then validated against field test results, considering measured track irregularities and simulated wind loadings as the excitations. Afterwards, a trend analysis and a variance-based sensitivity analysis was performed to investigate the effect of various factors on the dynamic response of the MTTS. Results indicate that the pier height significantly impacts the lateral displacement of the pier top, accounting for 87% of the first-order sensitivity index and 75% of the total sensitivity index. In comparison, the lateral stiffness of track beams contributes over 70% to the maximum responses at the mid-span. Based on this, two responses, the lateral displacement of the pier top and the lateral deflection–span ratio of the track beam, were utilized as evaluation indicators. With the analysis of indicators in terms of lateral acceleration, Sperling index, and lateral wheel force, the limited values for the two indicators were determined as 8.04 mm and L/4200, respectively. These findings can serve as valuable references for future research and designs in this field.
1. Introduction
The straddle-type monorail tour-transit system (MTTS) has developed rapidly in recent years. At present, there are more than 30 MTTS projects under construction or operation across the world [1]. Two main subsystems can be easily defined in an MTTS project, the monorail train and the steel bridge. Compared to conventional monorail systems utilized in urban transportation, the configuration of monorail trains in an MTTS is not much different, but there are significant diversities in the bridge structures employed. That is, the MTTS uses lightweight steel box girders as the supporting track beam and steel columns as the substructures, which is easy for construction, has good ornamental characteristics, and is very suitable for scenic areas. Extensive studies have been conducted on steel bridges of a more complex type, such as steel–concrete composite beams and girders with corrugated webs [2,3,4], regarding overall structural performance and critical responses of the main structural components [5]. Nevertheless, the general configuration of the supporting system in an MTTS is relatively simple. The two main structural components, track beams and columns, of the bridge in an MTTS are basically connected through a flange joints system; a finger band (expansion joint) is used between adjacent track beams to eliminate potential effects due to temperature change. In addition, flat webs are employed in monorails to ensure the stable operation of steering and stabilizing wheels. With these configurations, the weight of the track beam of an MTTS is light, and the overall stiffness is relatively low. Hence, the dynamic response of the track beam of an MTTS may be more significant than that in a conventional monorail system under the same conditions.
For the design of track beams, more attention has been paid to their overall structural performance under practical loads, such as wind and live loads. At present, related designs of track beams does not consider some long-term issues, such as fatigue and material degradation [6]. In particular, the lateral stiffness is an essential factor affecting the smoothness and comfort of train operation and hence, the related limited values must be reasonably determined. However, the design code for the MTTS, i.e., the “Large-scale amusement device safety code (GB 8408-2018) [7]”, does not have specific regulations in this respect. Of course, provisions in relevant codes (e.g., design code for urban rail transit bridges (GB/T 51234-2017) [8] and monorails in urban transit systems (GB 50458-2022) [9]) can be used for reference. Nevertheless, practical use has proven that these codes are not completely applicable because of the structural diversity in various transit systems and the design concepts of different codes. Therefore, it is important to carry out targeted research by considering the coupling effects of practical loads, thereby improving relevant design standards to promote the development of modern tourism systems.
In general, existing studies on the dynamic responses of transportation systems were conducted through numerical simulations, e.g., using the finite element method (FEM) and multi-body dynamics (MBD). For example, Gao et al. developed a co-simulation model using FEM and MBD software to study the effects of vehicle speed and bridge pier height on a rail system [10]. Liu studied the dynamic response of a T-girder continuous rigid frame bridge; by using computational fluid dynamics (CFD) software, the aerodynamic parameters and their effects on the bridge under passing vehicles were simulated [11]. Furthermore, many studies have been able to consider the coupling effect of various loadings. For example, Miao et al. [12] established a refined space vibration model of a wind–vehicle–bridge system with time-varying characteristics to investigate the dynamic features of bridges. Huang et al. [13] utilized a co-simulation method to analyze the mechanical properties of bridges under wind–vehicle–bridge coupling actions. Chen et al. [14] and Wang et al. [15] studied the aerodynamic performance of a vehicle–bridge system under the action of a crosswind. Zou et al. [16] developed a joint model to analyze the dynamic response of a wind–monorail–car–suspended bridge system under wind loadings. In addition, laboratory tests on the coupling system were reported. Luo et al. [17] measured the aerodynamic coefficients of relevant bridge and vehicle models under the action of crosswind through a wind tunnel test. Jiang et al. [18] focused on the most unfavourable load that long-span bridges bore when vehicles and subways were in operation at the same time, and relevant models were established for dynamic response studies. Guo et al. [19] performed wind tunnel tests and numerical simulations to investigate the dynamic characteristics of bridges; the wind–car–bridge coupling model was also developed via the FEM and CFD. It should be noted that these studies are dominantly focused on rail transportations; therefore, results in general monorail systems are still limited, not to mention relevant studies on MTTSs. Nevertheless, the methodologies of general transportation systems can be used as a great reference.
In terms of the lateral stiffness limit, a perspective more inclined towards practical application, research has made great progress on general transit systems. In general, the main body of a vehicle can be simulated or constructed by using MBD. Then, a targeted dynamic evaluation system can be proposed based on the results of the dynamic responses of the vehicle and bridges [20]. Xiang et al. [21] investigated the lateral stiffness limit of a suspension bridge through a combination of a wind tunnel test and a numerical simulation. Zhou et al. [22] investigated the effects of the height of the bridge pier and the lateral stiffness of the bridge beam on the dynamic response of a vehicle–bridge system. Zhu et al. [23] developed multiple suspension bridge models and investigated various methods to improve the structural stiffness of railway bridges. Liu et al. [24] proposed an analytical model to quantitatively analyze the influence and mechanism of several important parameters on the mapped deformation of the rail, including the lateral beam deformation and the lateral stiffness of fasteners. Wang et al. [25] performed numerical simulations of the coupled vibration of 12 track–beam systems with different stiffnesses. In the study, track irregularities and wind-induced lateral loads were considered. Yan et al. [26] investigated the design value of the torsional stiffness reduction factor for the serviceability limit states. Carden et al. [27] proposed a simplified calculation method based on the elastic stress and stiffness of bridge beams, and the results were found comparable with those obtained by the FEM.
To summarize, existing studies on the dynamic response of monorail systems, including MTTSs, and effects of the lateral stiffness of a monorail bridge, i.e., track beams and piers, are limited. Research has reported field tests and numerical simulations of the monorail systems considering track irregularities [28,29,30,31], wind loadings [5], and ground motions [28]. Moreover, the usage of the FEM and MBD on monorails has been verified, providing an effective method for investigating the dynamic effects of an MTTS. To the best of our knowledge, no existing studies have focused on the determination of lateral limited values of MTTSs.
On the basis of a comprehensive analysis of the existing research and considering the unique structural configurations of MTTS, this work employs FEM and MBD software to establish a wind–vehicle–bridge coupling model of an MTTS. The effects of variables such as vehicle load and track beam lateral stiffness on vehicle running stability, acceleration, and the lateral force of guide wheels and stabilizing wheels are investigated. Through a numerical simulation and parametric analysis, the lateral deflection–span ratio limit and the lateral displacement limit of the pier top were determined based on the riding comfort standard, i.e., the mid-span acceleration of the monorail track beam and the lateral force limit of the monorail train wheels. The results of the study can improve the problem of unclear limits of lateral stiffness of MTTSs, which can provide a reference for related research and design.
2. Methodologies
2.1. Wind–Vehicle–Bridge Coupling Mode
2.1.1. Modelling Track Beams
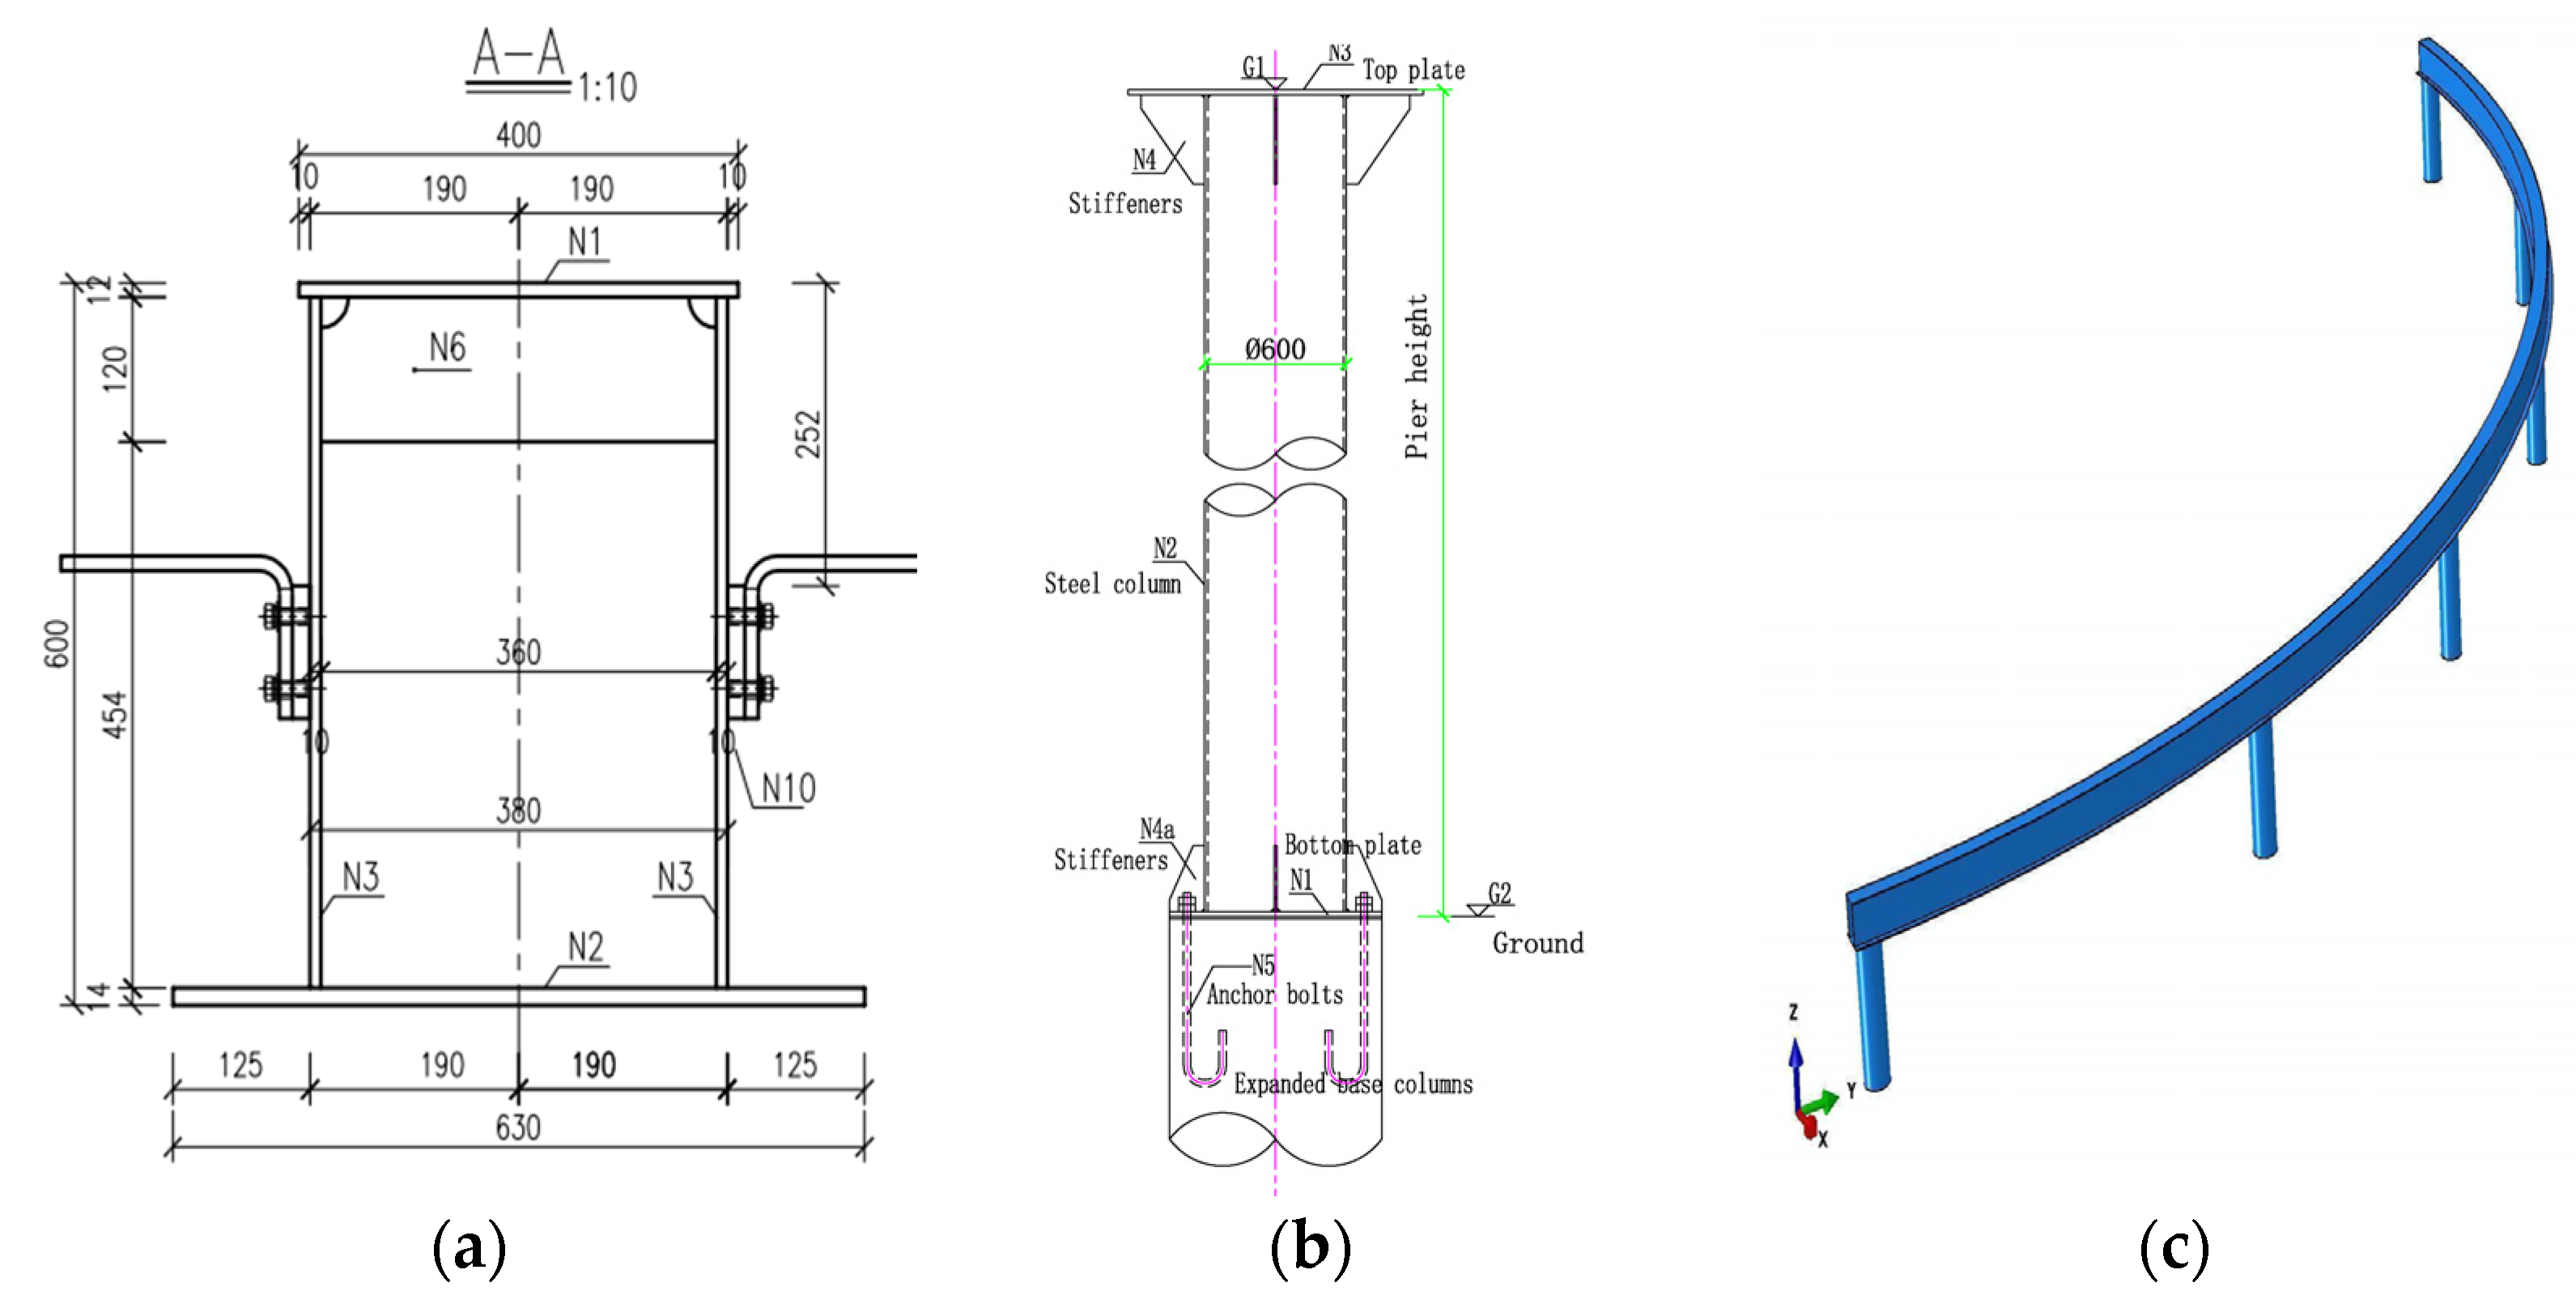
For easy demonstration, a one-connection five-span curve bridge in the Dajueshan project in Jiangxi, China is taken as an example. The curve radius of the track beam is 30 m, the span of a single girder is 10 m, and the bridge pier is a single column with a pier height of 2 m. A solid element C3D8R with 6 degrees of freedom in ABAQUS [32] (FEM software) was chosen to model the monorail substructures (track beams and piers). In a typical span, one side of a track beam body was fixed to the flange on the pier top, and the longitudinal freedom at the other side was released. The connection between the steel column and the ground was simplified and set as a fixed boundary. It should also be noted that the entire analysis was under the elastic stage. The cross-section of track beams, pier column elevation, and FE model of the track beam structure are shown in Figure 1.
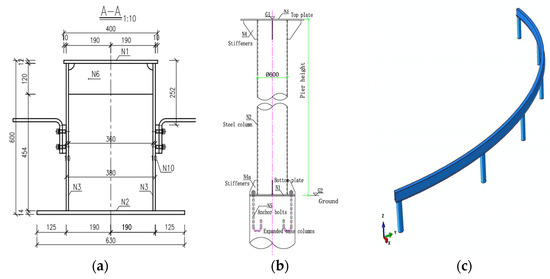
Figure 1.
Representative design diagrams and numerical model of monorail substructures. (a) Cross-section of the track beam; (b) design diagram of the pier; and (c) finite element model.
2.1.2. Modelling Monorail Trains
Owing to the complexity of the vehicle system, necessary simplifications should be performed to efficiently simulate their mechanical characteristics, e.g., using MBD. In this work, the mass, geometric characteristics, and dynamic characteristics of each component of the monorail train were considered. According to the principle of MBD, main bodies, such as the car body and bogies, are modelled as rigid components, which are then connected by springs and dampers. The main components of a bogie are the frame, bolster, spring, and other shock damping equipment; the power drive device; and three types of wheels, the travelling wheels, steering wheels, and stabilizing wheels. To improve the accuracy of the model, springs and other shock damping equipment are simulated via the force element in SIMPACK [33].
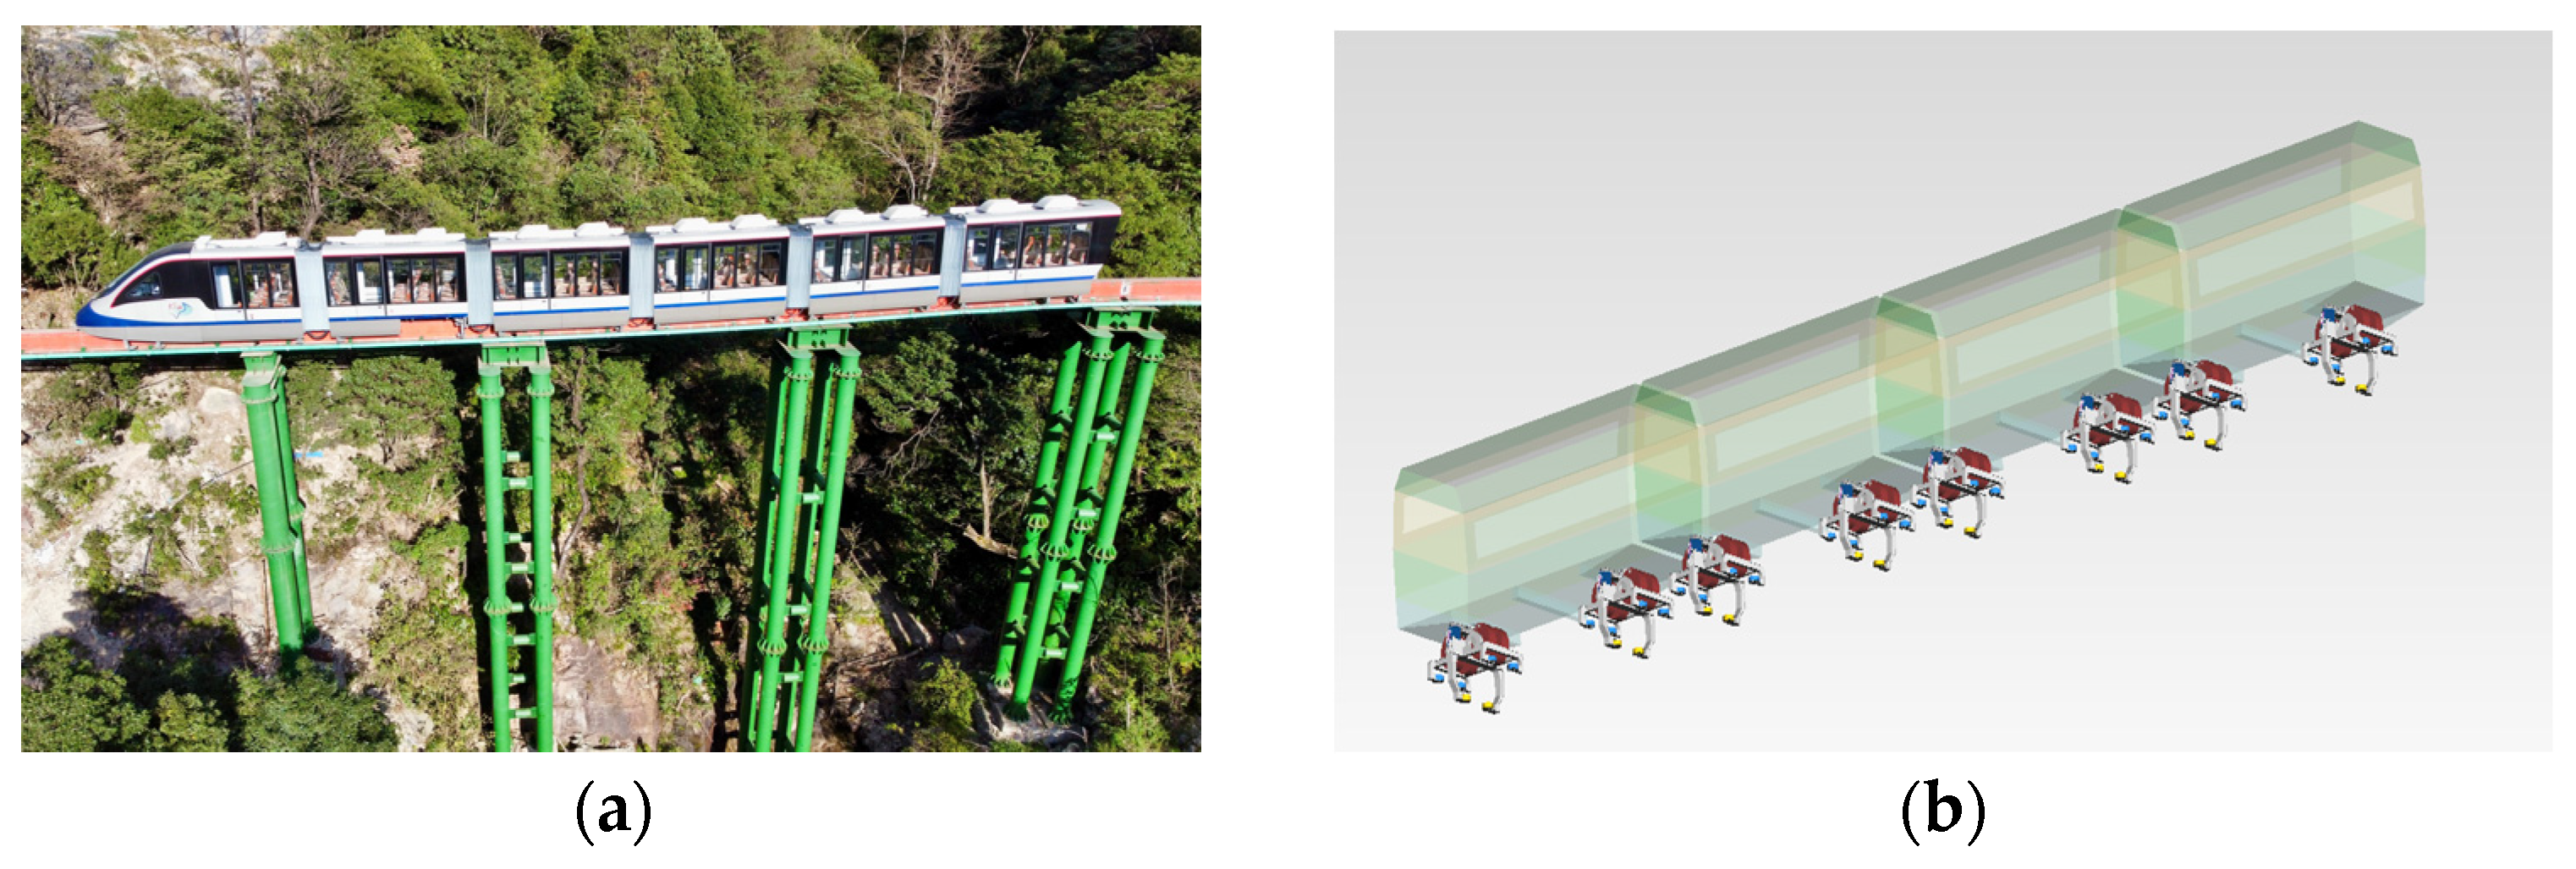
The modelling of the monorail train adopts the substructure technique in SIMPACK. Specifically, a bogie is firstly constructed and transferred as a substructure; then, two identical substructures (bogie) can be used to model one carriage, along with the car body. Similarly, the carriage can be transformed into a substructure and be used to model the entire train. The main modelling parameters were provided by the Zhuzhou CRRC Special Equipment Technology Co., Ltd. The developed MBD models of a 4-carriage monorail system are shown in Figure 2.

Figure 2.
Onsite view of the Dajueshan MTTS project in Jiangxi province, China. (a) A monorail train running on the track beam of steel bridges. (b) MBD model of a typical monorail train; each carriage has two identical bogies surrounding the track beam in practise.
2.1.3. Coupling Model
During the actual operation of an MTTS, the track beam will be disturbed by the pulsation wind component in the crosswind, which will generate a lateral rocking motion, thereby reducing the ride comfort and running stability of monorail trains. The static wind force experienced by an MTTS in a natural wind field can usually be decomposed into three parts, namely aerodynamic drag (FD), aerodynamic lift (FL), and the aerodynamic moment (FM). These three coefficients of the MTTS were determined by numerical simulations via the FLUENT [34] software with CFD grid technology. That is, one boundary side (e.g., left) was set as the velocity inlet and the other side was the pressure outlet; symmetric boundary conditions were utilized for the upper and lower boundaries. The track beam and the vehicle surface were defined as smooth walls [35,36]. Adaptive mesh size was used to enhance calculation efficiency. The SST turbulence model was used; the SIMPLE algorithm was employed to solve the model, and the calculation step is s. Results for subsequent analysis are shown in Table 1. In this work, the effect of fluctuating winds was simulated by using the Kamal spectrum, which can consider the height factor in a given wind field. For simplification, the harmonic synthesis method was used for wind field simulation.

Table 1.
Aerodynamic coefficients of vehicles and bridges.
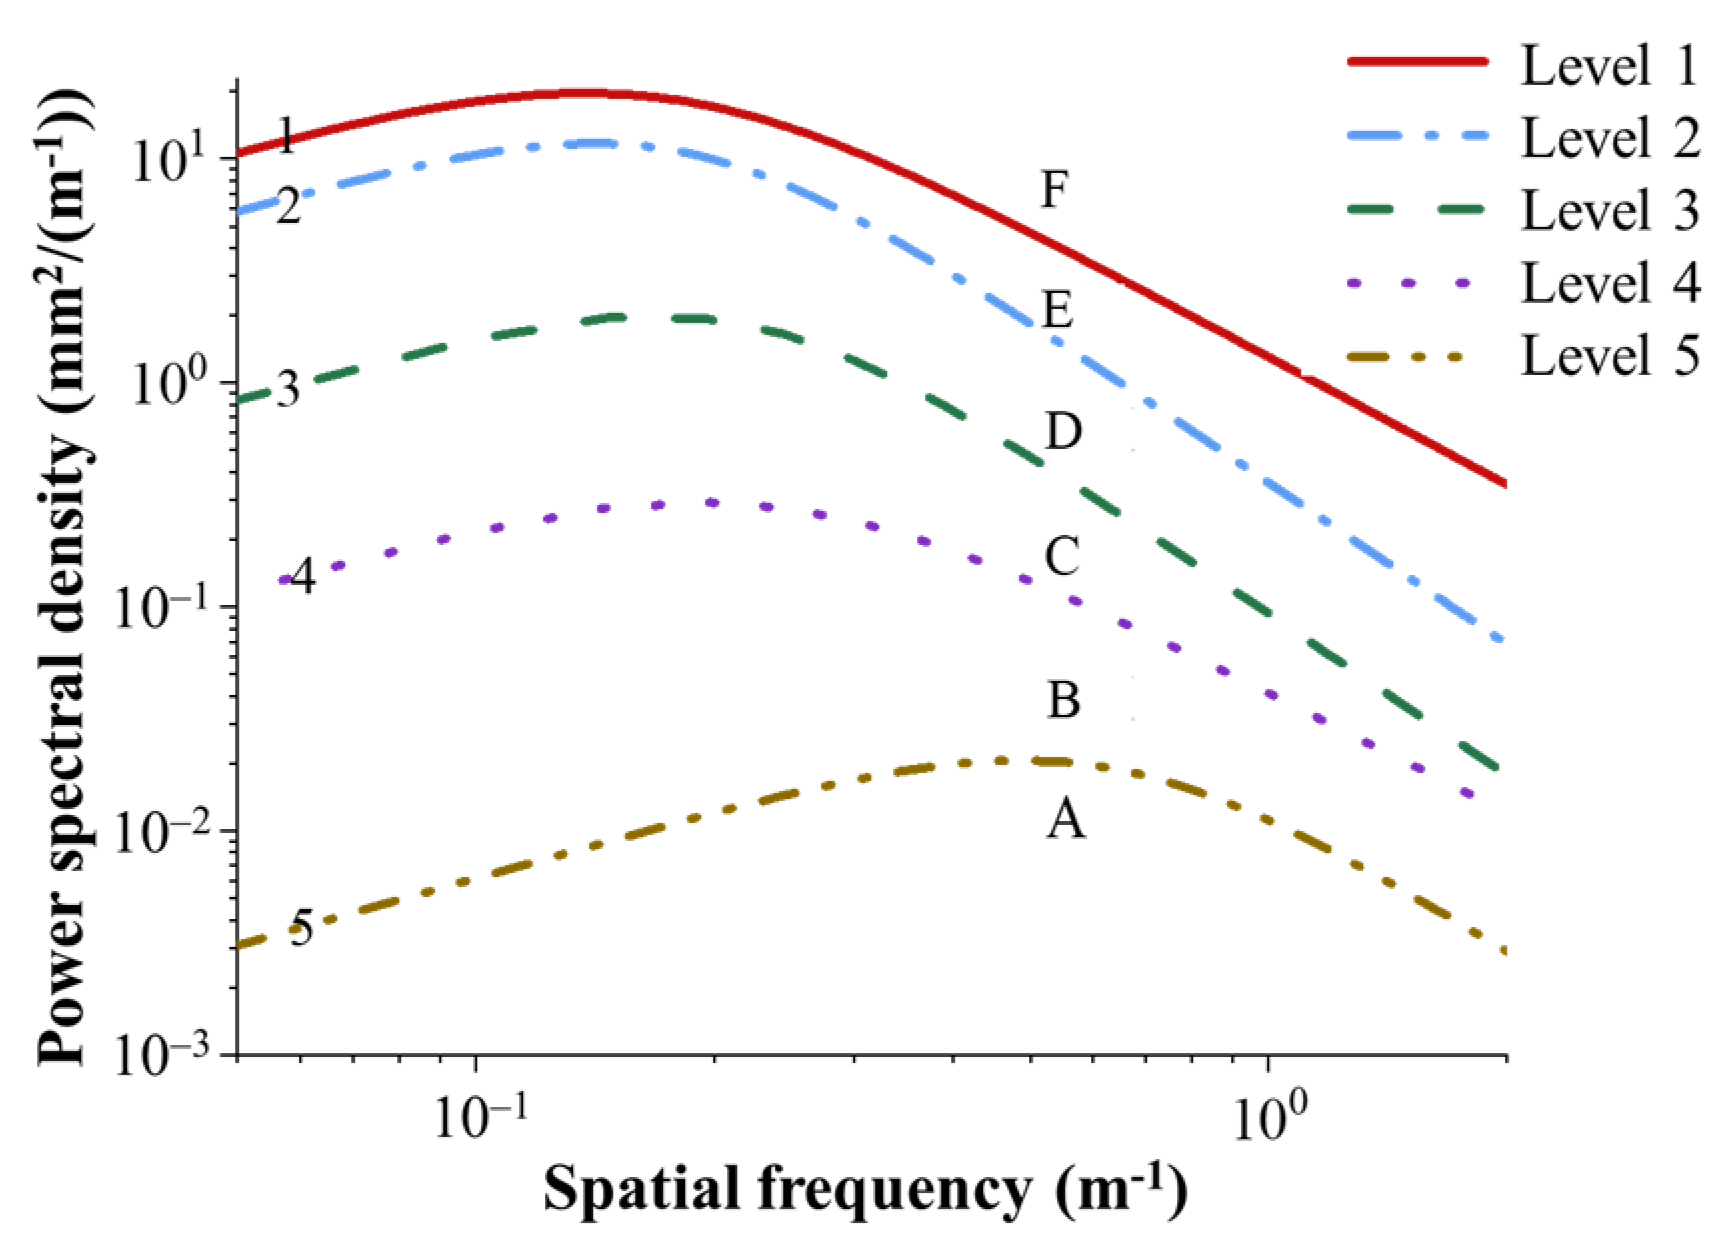
In addition, previous studies have reported the results of track irregularity and related dynamic responses of MTTSs through field measurement and numerical simulations, and the spectrum of longitudinal and horizontal level irregularity was estimated [29,30]. According to the mathematics of the spectrum, observing the power spectral density versus frequency curve, the higher the spectrum line, the worse the track irregularity condition and vice versa. Based on the measured result in several projects, an evaluation system for the spectrum of track irregularity has been proposed. This system contains spectra of six levels to meet various actual conditions of the track lines in practical projects, as shown Figure 3. In this work, level C was chosen because it matches the actual states of track lines in most of the operating projects. In addition, since a combination with wind loadings was used, taking level C is more reasonable and practical.
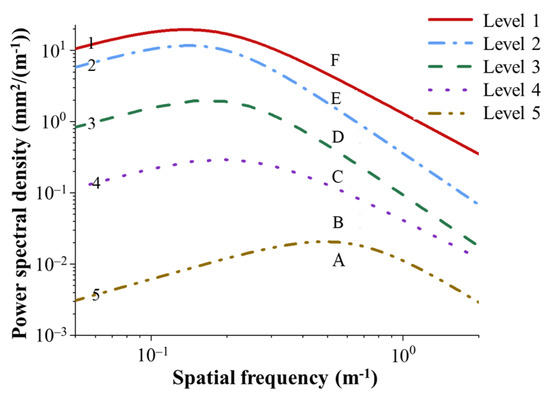
Figure 3.
Spectrum curves of different level track irregularities. Note that original data were collected from field measurements. Fourier transform and curve fitting was used to obtain the spectrum curve; the higher the spectral line, the worse the irregularity condition and hence the red line (level F) indicates the worst status of a track beam condition.
In the track beam model, the wheel–rail forces are transferred, and the interaction between the vehicle and the track is simulated via substructure analysis, fixed master nodes, an interpolation algorithm, elastic deformation, and dynamic interaction. Similar modelling methods have been validated in existing studies [5,28,30,31]. The simulation results of the Kamal spectrum are obtained via the harmonic synthesis method, and the wind load time history is directly applied to the car body and track beam via force elements. After defining the spectral formula, the track irregularity can be retrieved in the form of excitation type in SIMPACK.
2.2. Model Validation
2.2.1. Test Site Information
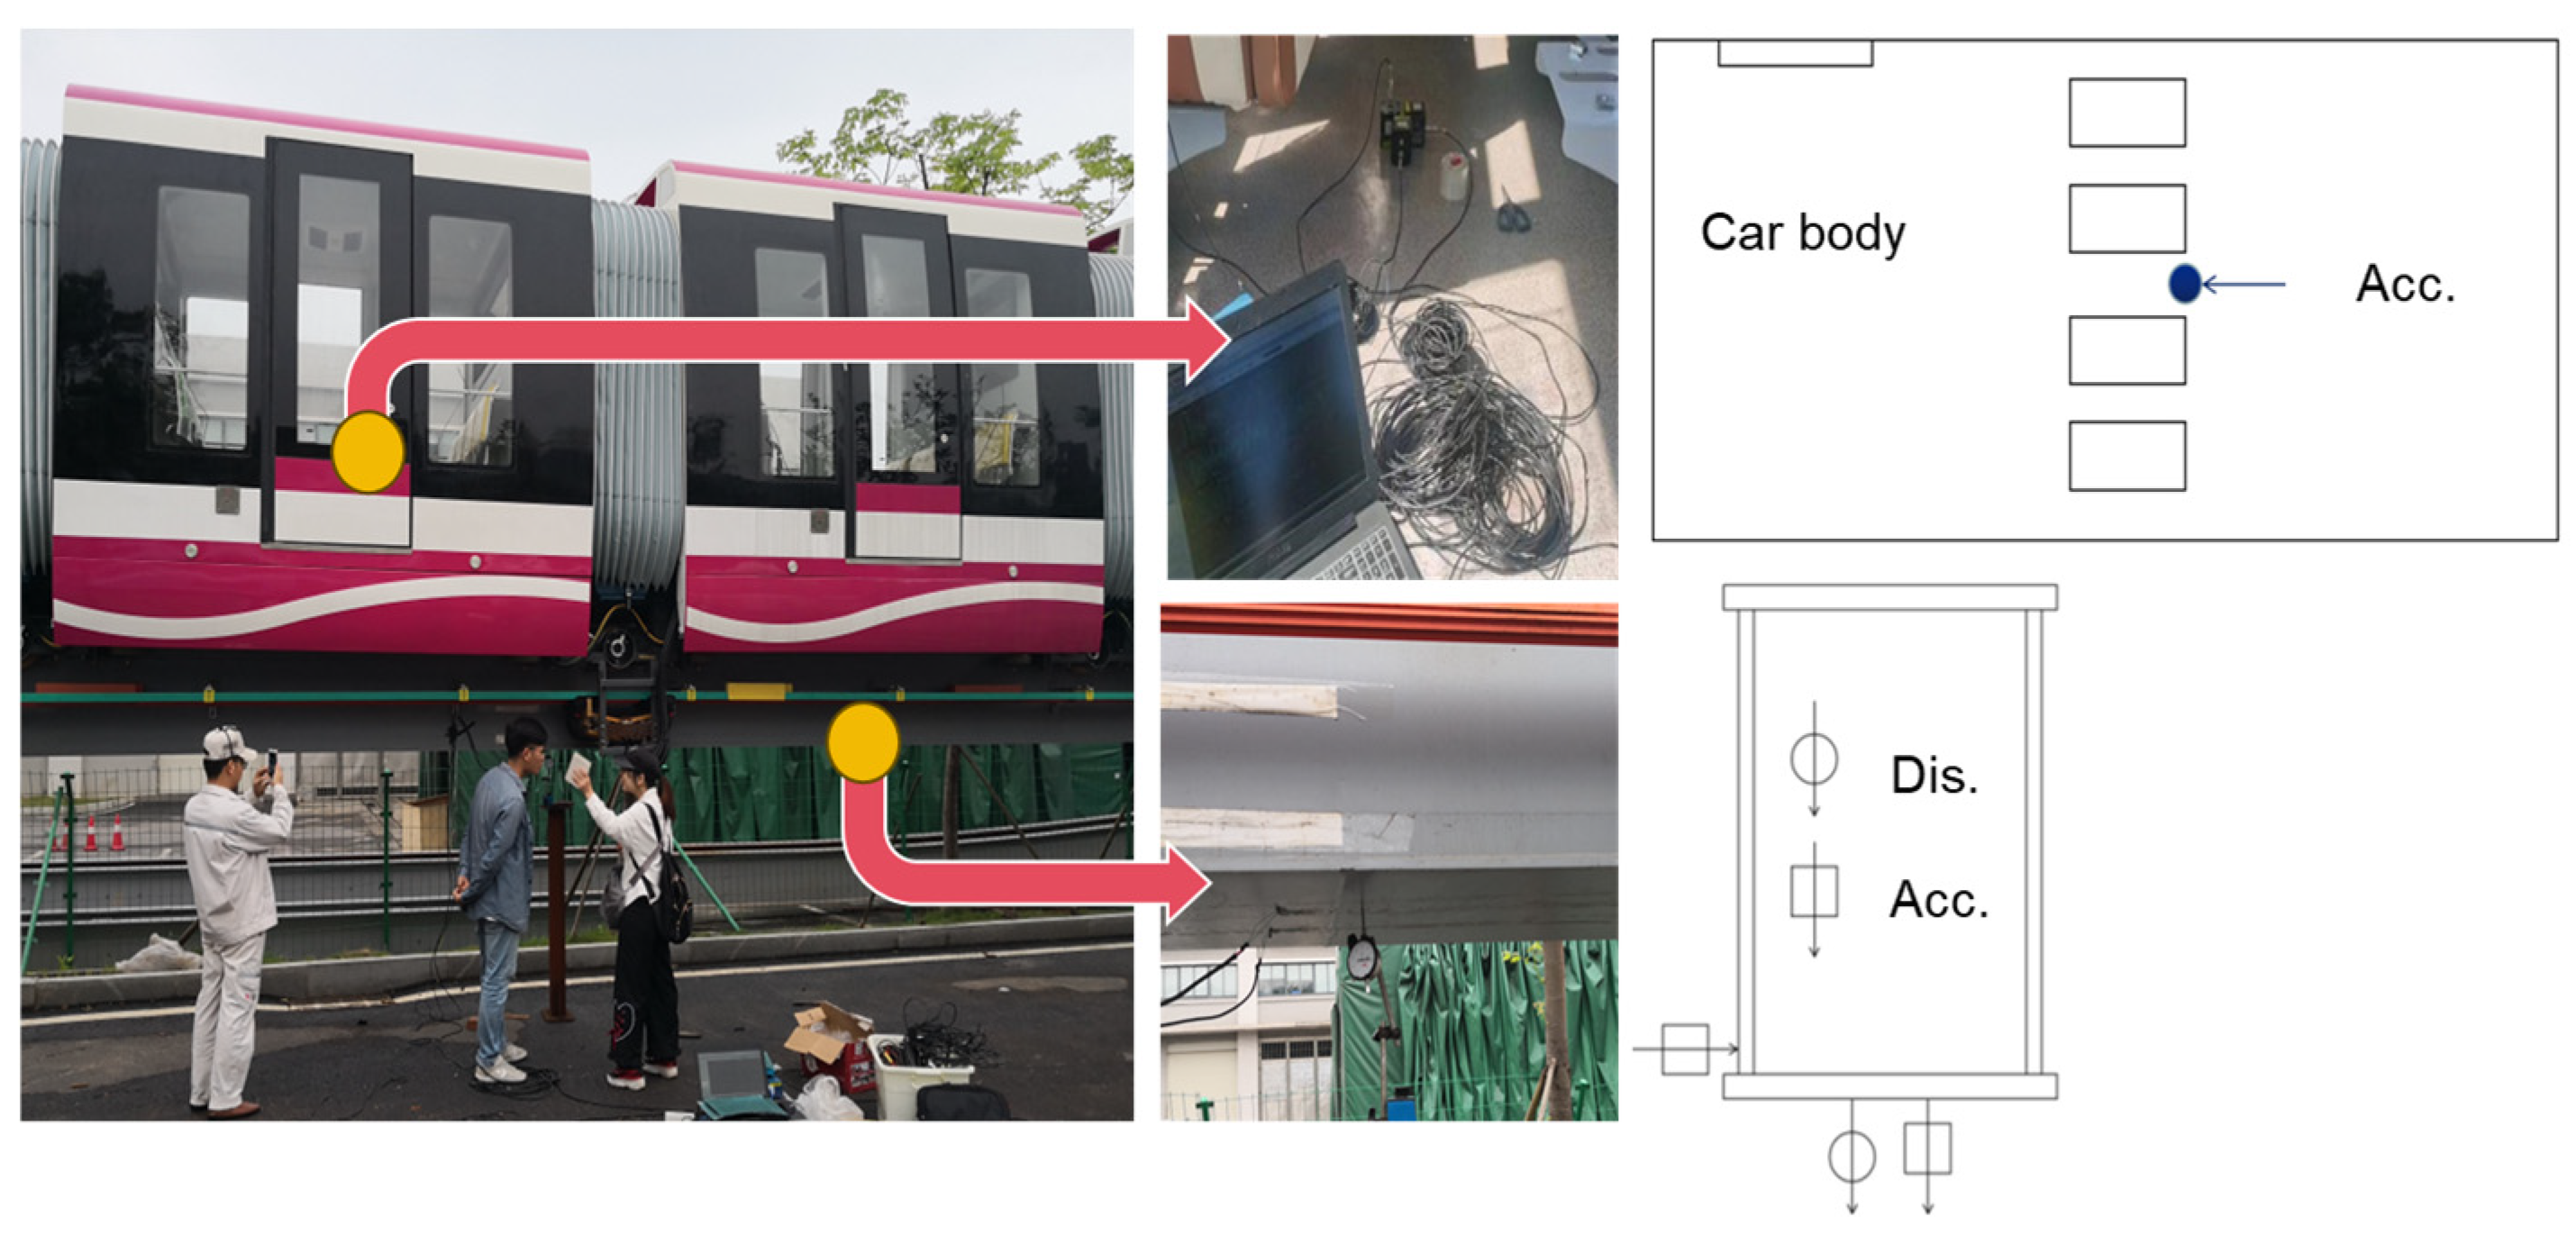
To validate the effectiveness of the developed coupling model, an on-site dynamic response test was conducted in the MTTS test line located in Zhuzhou City, China. The construction standard of the test line is the same as that of the actual MTTS project. In other words, the configuration of the trains and track girders is consistent with the actual project. During the test of track beams, the focus was placed on the vertical displacement and lateral and vertical acceleration of the mid-span cross-section. The location of measuring points was determined according to the most unfavourable locations obtained from finite element analysis, with consideration of the installation space of equipment. The measuring points of vehicle body acceleration are arranged at the seat bottoms of the middle compartment and the rear car. Equipment such as linear variable differential transform and vibration pickups were used to capture the dynamic signals. General configurations of the on-site test are shown in Figure 4.

Figure 4.
Layout diagram of the measuring points. For the car body, vehicle accelerations (Acc.) were tested; for the track beam, vertical displacement (Dis.) and vertical and lateral Acc. were tested.
2.2.2. Validation
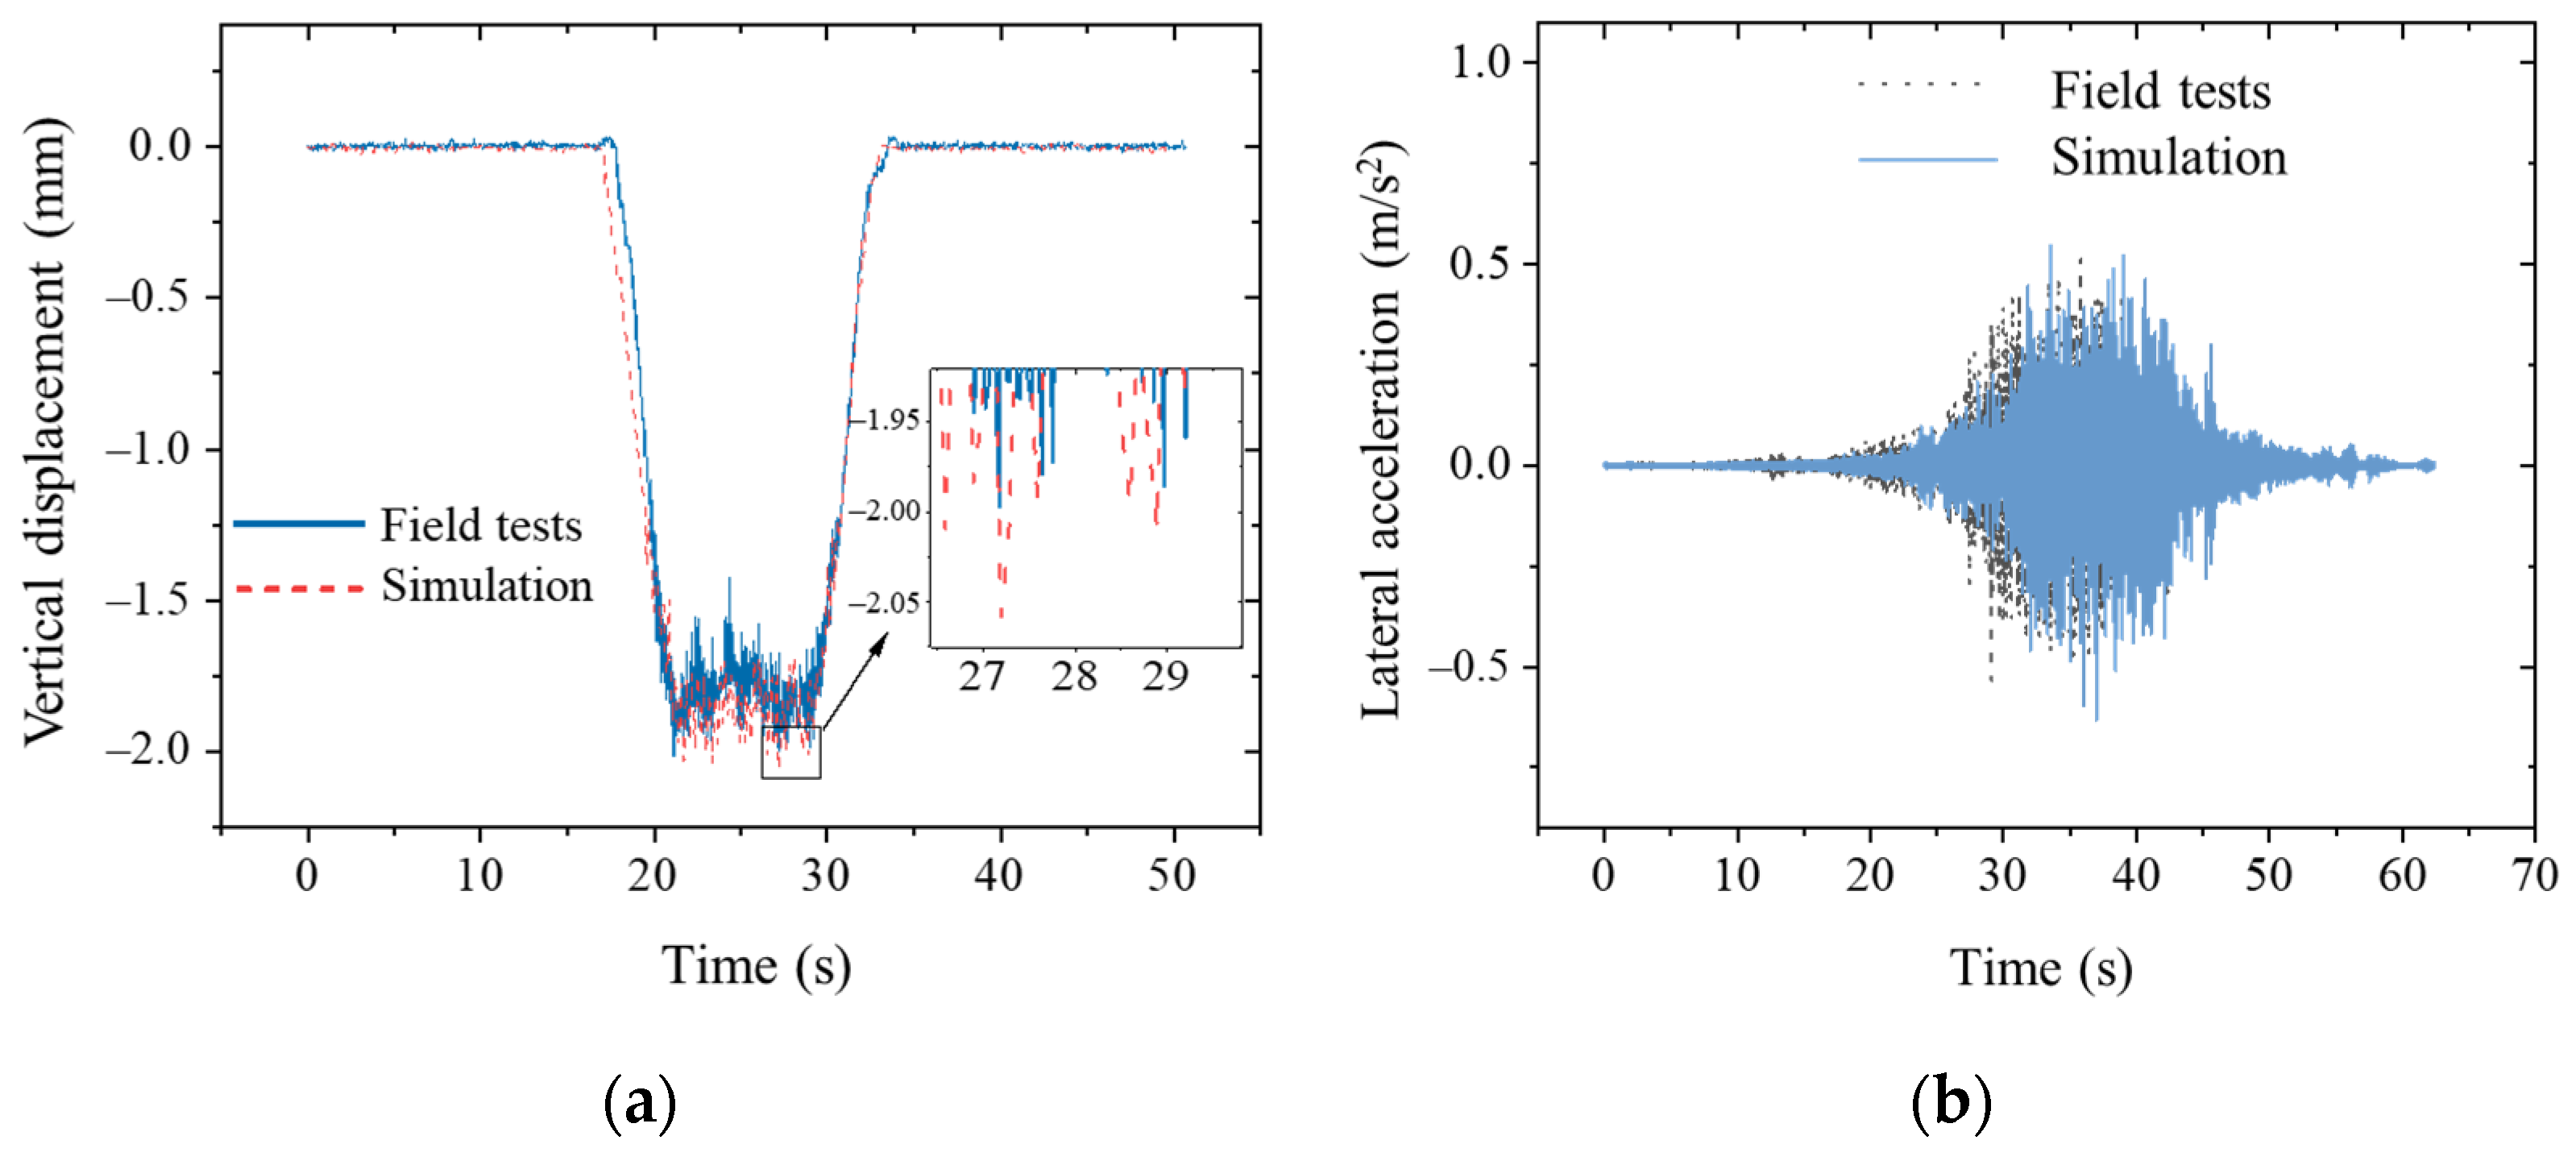
Before further simulation analysis, the vertical displacement, lateral and vertical acceleration, and lateral and vertical acceleration parameters of the car body were predefined in SIMPACK so that the corresponding postprocessing results could be directly viewed during simulation. The analysis results of the co-simulation model are obtained by observing the dynamic response at the corresponding positions, such as the acceleration and deflection of the lateral vibration of the track beam, as shown in Figure 5. The validation was mainly conducted at the mid-span of track beams. This is because the positions are in the typical and representative area where the most unfavourable loadings would occur.
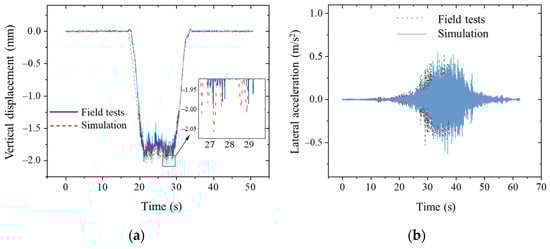
Figure 5.
Comparison of tested and simulation results at the mid-span of a track beam. (a) Vertical displacement and (b) lateral acceleration.
An analysis of Figure 5 reveals that the simulation results and test results are in good agreement. The simulated vertical displacement of the monorail beam mid-span was slightly larger than the actual measured value, which was mainly because the model did not consider the influence of some stiffeners. The analysis results prove that the co-simulation model constructed in this study via ABAQUS and SIMPACK has high accuracy and can be applied to subsequent analysis.
3. Results and Analysis
3.1. Influencing Factors
In the dynamic analysis of vehicle–bridge coupling, with reference to relevant codes, various indexes that represent the dynamic response of the MTTS were selected. The evaluation indexes of the dynamic response of track beams are (i) horizontal and vertical deflection at the beam mid-span; (ii) acceleration at the beam mid-span; and (iii) lateral displacement at the pier top. The evaluation indexes of the dynamic response of monorail trains are (i) the wheel unloading rate; (ii) acceleration of the car body; (iii) riding quality; and (iv) the index of tyre stress. It should be noted that the last index is only applicable in monorail systems utilizing rubber tyres.
Main factors influencing the dynamic response of the MTTS are the speed of the tourist vehicles, vehicle loadings, the pier height, and the lateral stiffness of the monorail bridge. To lay a solid basis for subsequent analyses, the effects of these four influencing factors are firstly analyzed in the following sections.
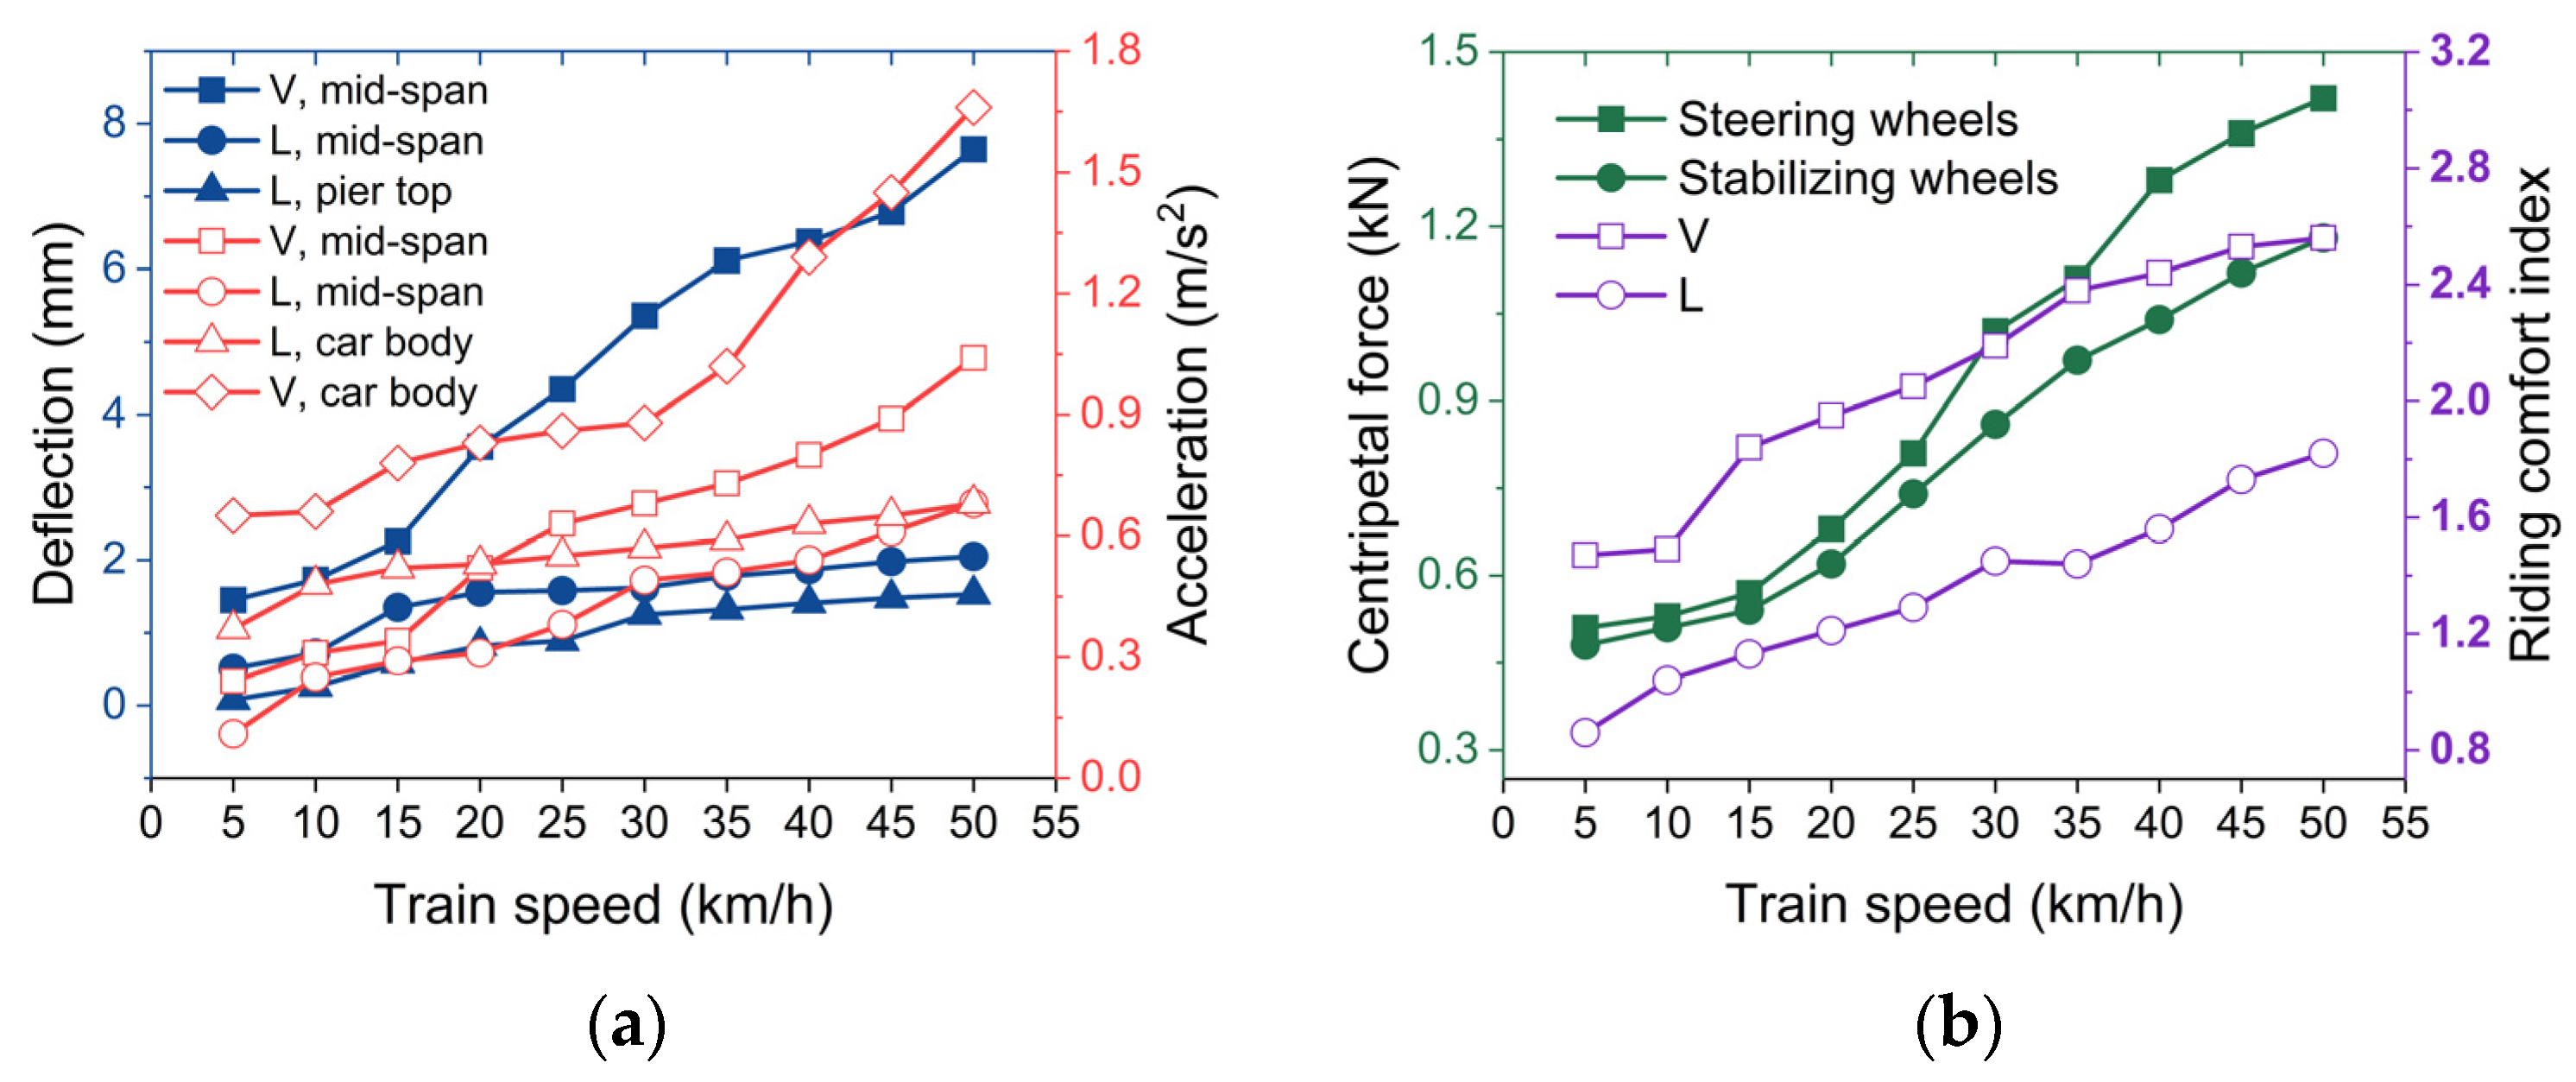
3.1.1. Effects of Travelling Speed
At present, the MTTS generally serves as an amusement facility, and the maximum speed is 40 km/h under current specifications. In this work, the maximum speed used was 50 km/h, about 1.2 times the maximum operating speed, which is recommended by the GB/T 51234-2017 [8]. A total of 10 intervals of vehicle speed were set as follows: 5, 10, …, 50 km/h, so that a comprehensive analysis on the dynamic response can be performed. The model described in Section 2 is then used, with consideration of train loading (maximum capacity), wind loading, and track irregularities. Dynamic responses of the track beam and monorail train are shown in Figure 6.

Figure 6.
Response results corresponding to different vehicle speeds. (a) Displacement and acceleration response and (b) centripetal force and the calculated riding comfort index. Note V and L denote vertical and lateral, respectively.
Figure 6 shows that each kind of dynamic response continuously increases with vehicle speed. Compared with the other responses, vertical deflection at the mid-span and the vertical acceleration of the car body varied significantly with the train speed, indicating that the train speed had the most significant effects on the two. In addition, a significant change in various dynamic responses can be found under a train speed from 20 to 30 km/h. Moreover, in terms of deflection and acceleration, vertical responses are more sensitive to the variation in train speed compared to lateral responses, which is also reflected in the curves of the riding comfort index in Figure 6b. It should be noted that the steering wheels and stabilizing wheels are located at the webs of the track beam during monorail operation. Hence, similar patterns of centripetal force can be observed.
3.1.2. Effects of Vehicle Loading
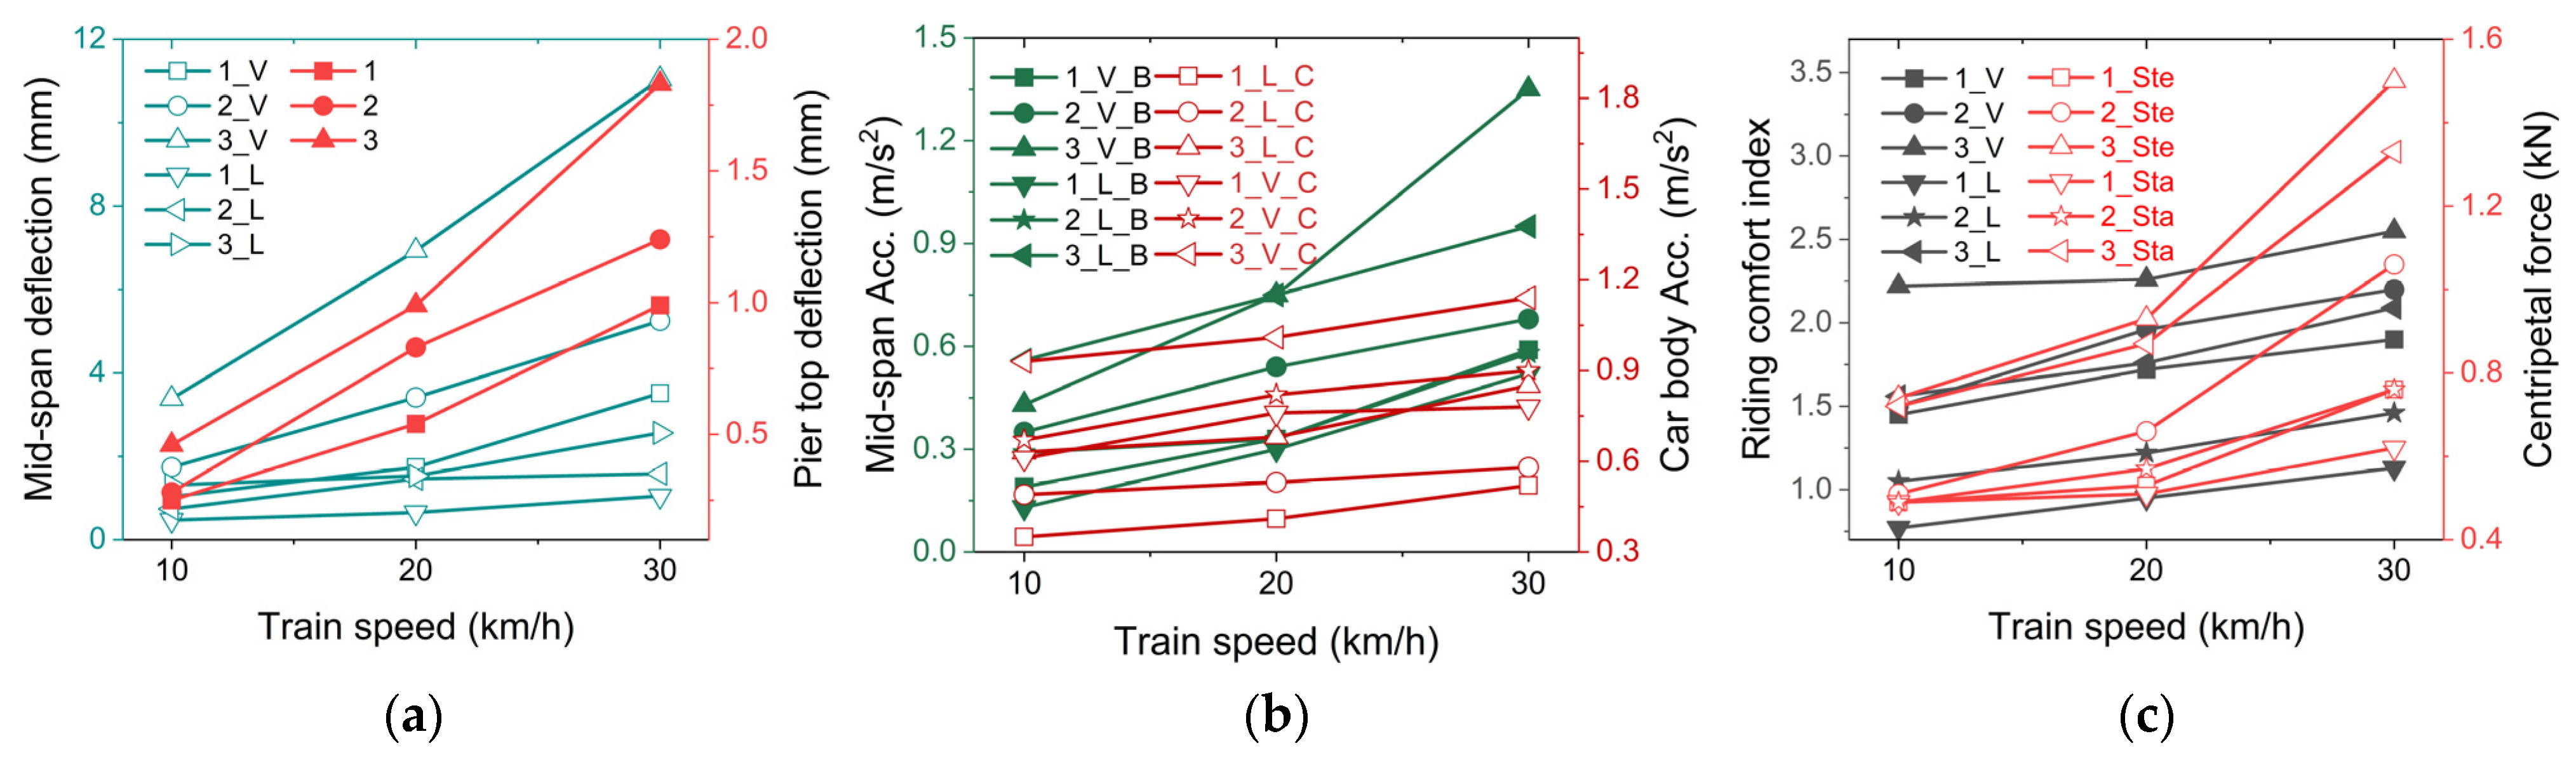
To study the effect of vehicle loading on the dynamic response of the MTTS, three different working conditions were used as follows: 1, no load; 2, full load (3.8 tons); and 3, overloaded (5.3 tons). The train speed commonly used in an MTTS is divided into three gears as follows: slow, 10 km/h; medium, 20 km/h; and fast, 30 km/h. The rest of the conditions are the same as those described in Section 3.1.1. The dynamic responses of the monorail beam and the vehicle are shown in Figure 7.

Figure 7.
Results under various loading conditions and train speed. (a) Deflection of bridge components; (b) accelerations; and (c) centripetal force and the calculated riding comfort index. Note that 1, 2, and 3 denote the loading conditions; B and C denote the bridge and car body, respectively; and Ste and Sta denote steering and stabilizing wheels, respectively.
Figure 7 shows that various types of dynamic responses increase as the vehicle load continuously increases, which is consistent to practical experiences. Specifically, the weight of the vehicle significantly affects the lateral displacement of the pier top, with a greater impact on the vertical deflection at the mid-span than in the lateral direction. Furthermore, this weight has a more pronounced effect on the vertical acceleration response and vertical stability index compared to the lateral direction.
3.1.3. Effect of Pier Height
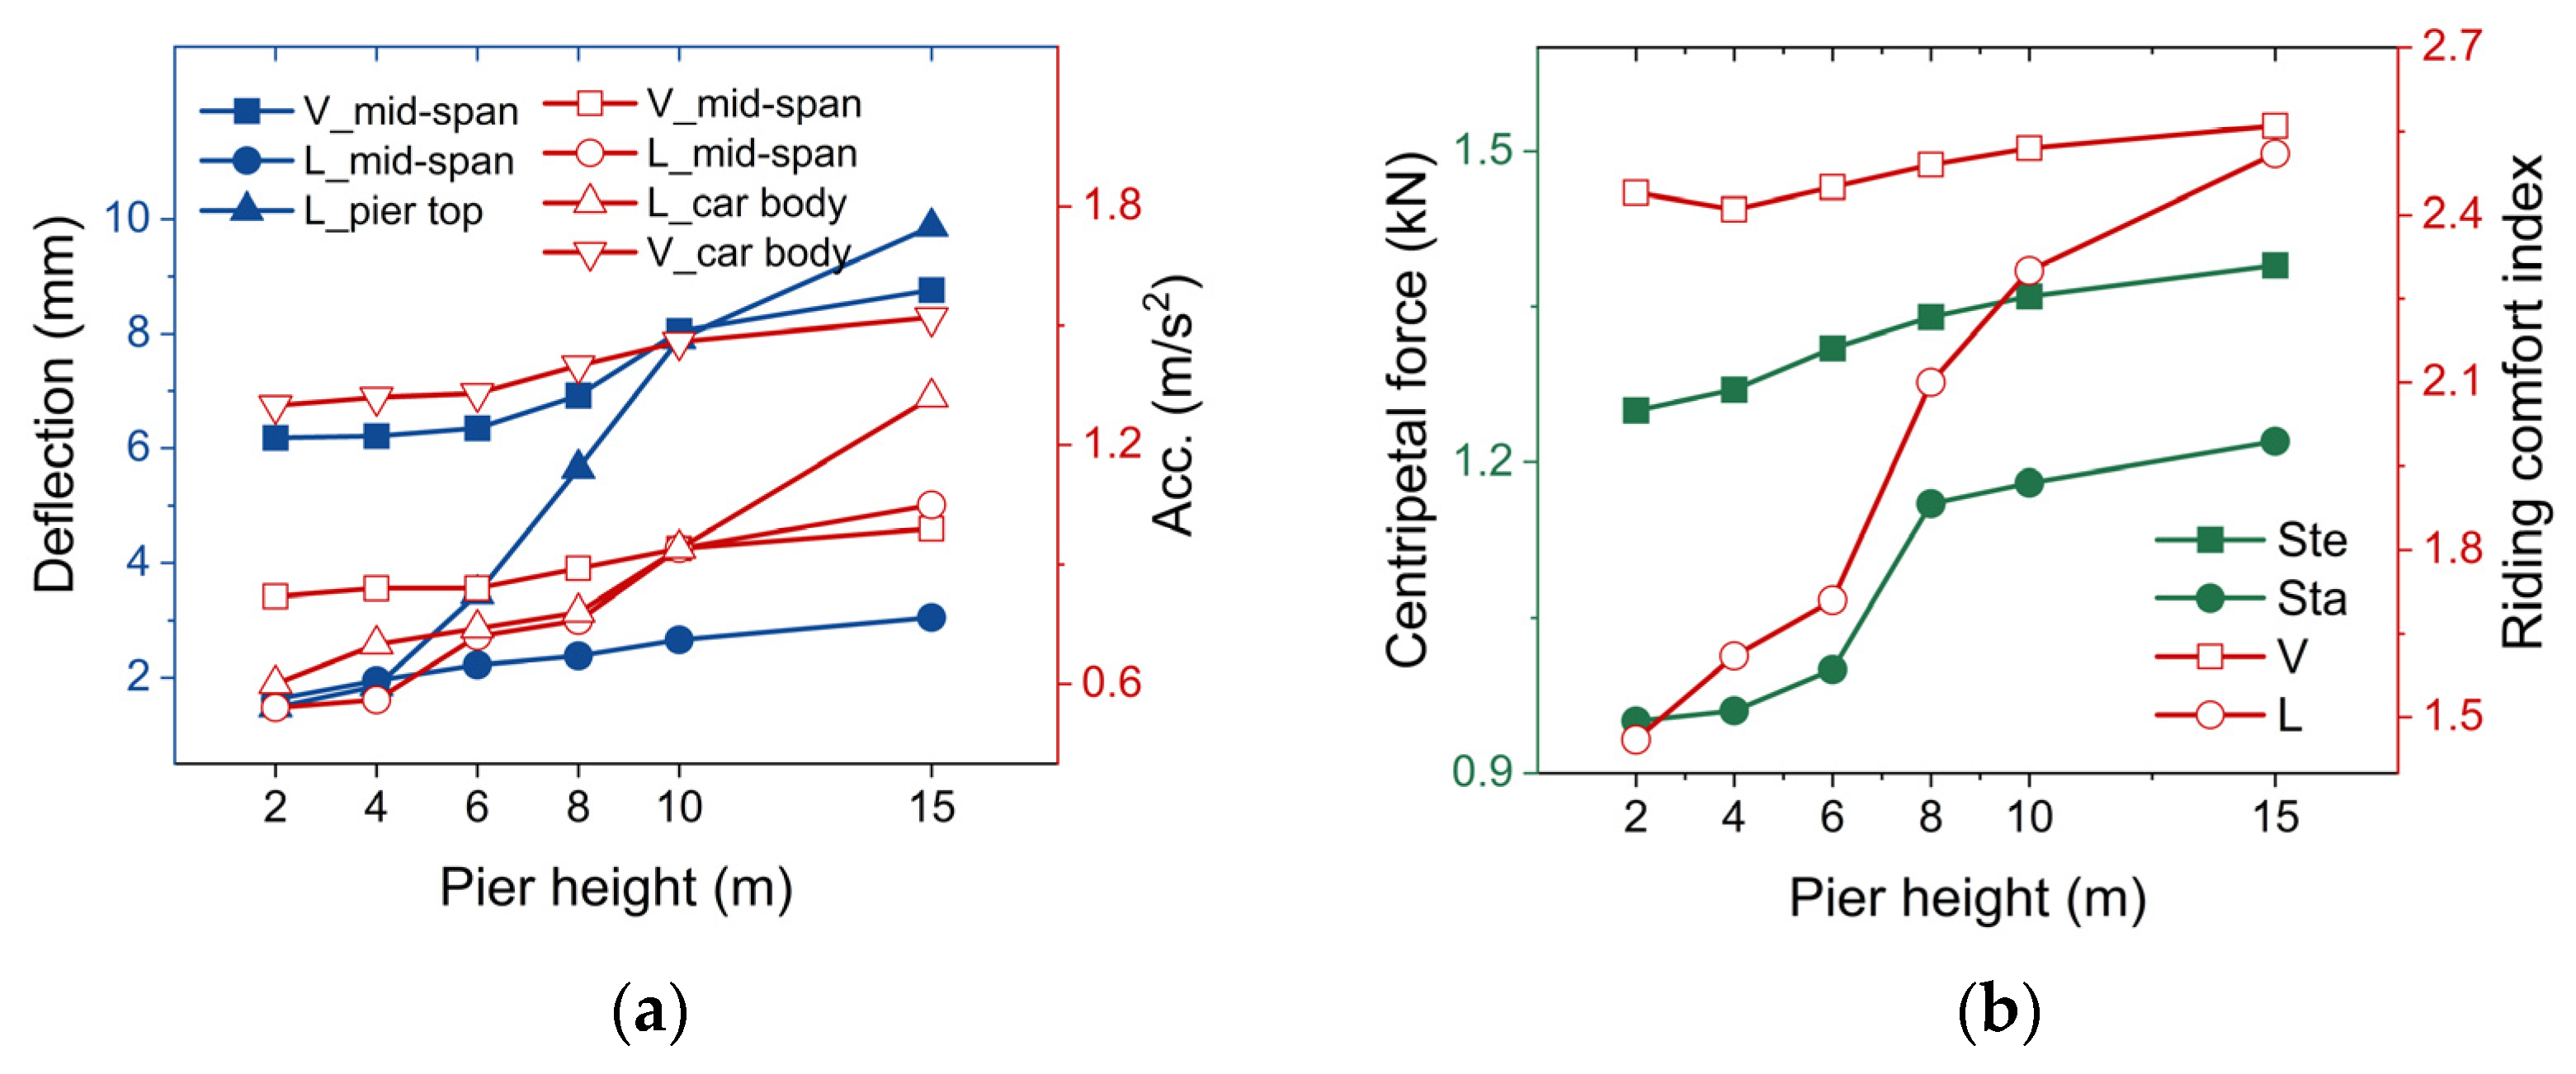
In this section, six pier heights of the monorail bridge, i.e., 2 m, 4 m, 6 m, 8 m, 10 m, and 15 m, were used to analyze the dynamic response of the MTTS. The designed maximum train speed (40 km/h) was used in simulations. The rest of the conditions are the same as those described in Section 3.1.1. The dynamic responses of the monorail beam and vehicles are shown in Figure 8.

Figure 8.
Results under various pier heights. (a) Displacement and acceleration response and (b) centripetal force and the calculated riding comfort index.
As shown in Figure 8, similar patterns can be found in various dynamic responses versus pier height curves, indicating that the induced dynamic responses generally increase with the increasing pier height. The effect of the pier height on the variation in the lateral displacement of the pier top was more significant than that of the other responses. The variation in the lateral riding comfort index is also significant. Nevertheless, the overall lateral comfort index is less than that of the vertical index.
3.1.4. Effects of Beam Stiffness
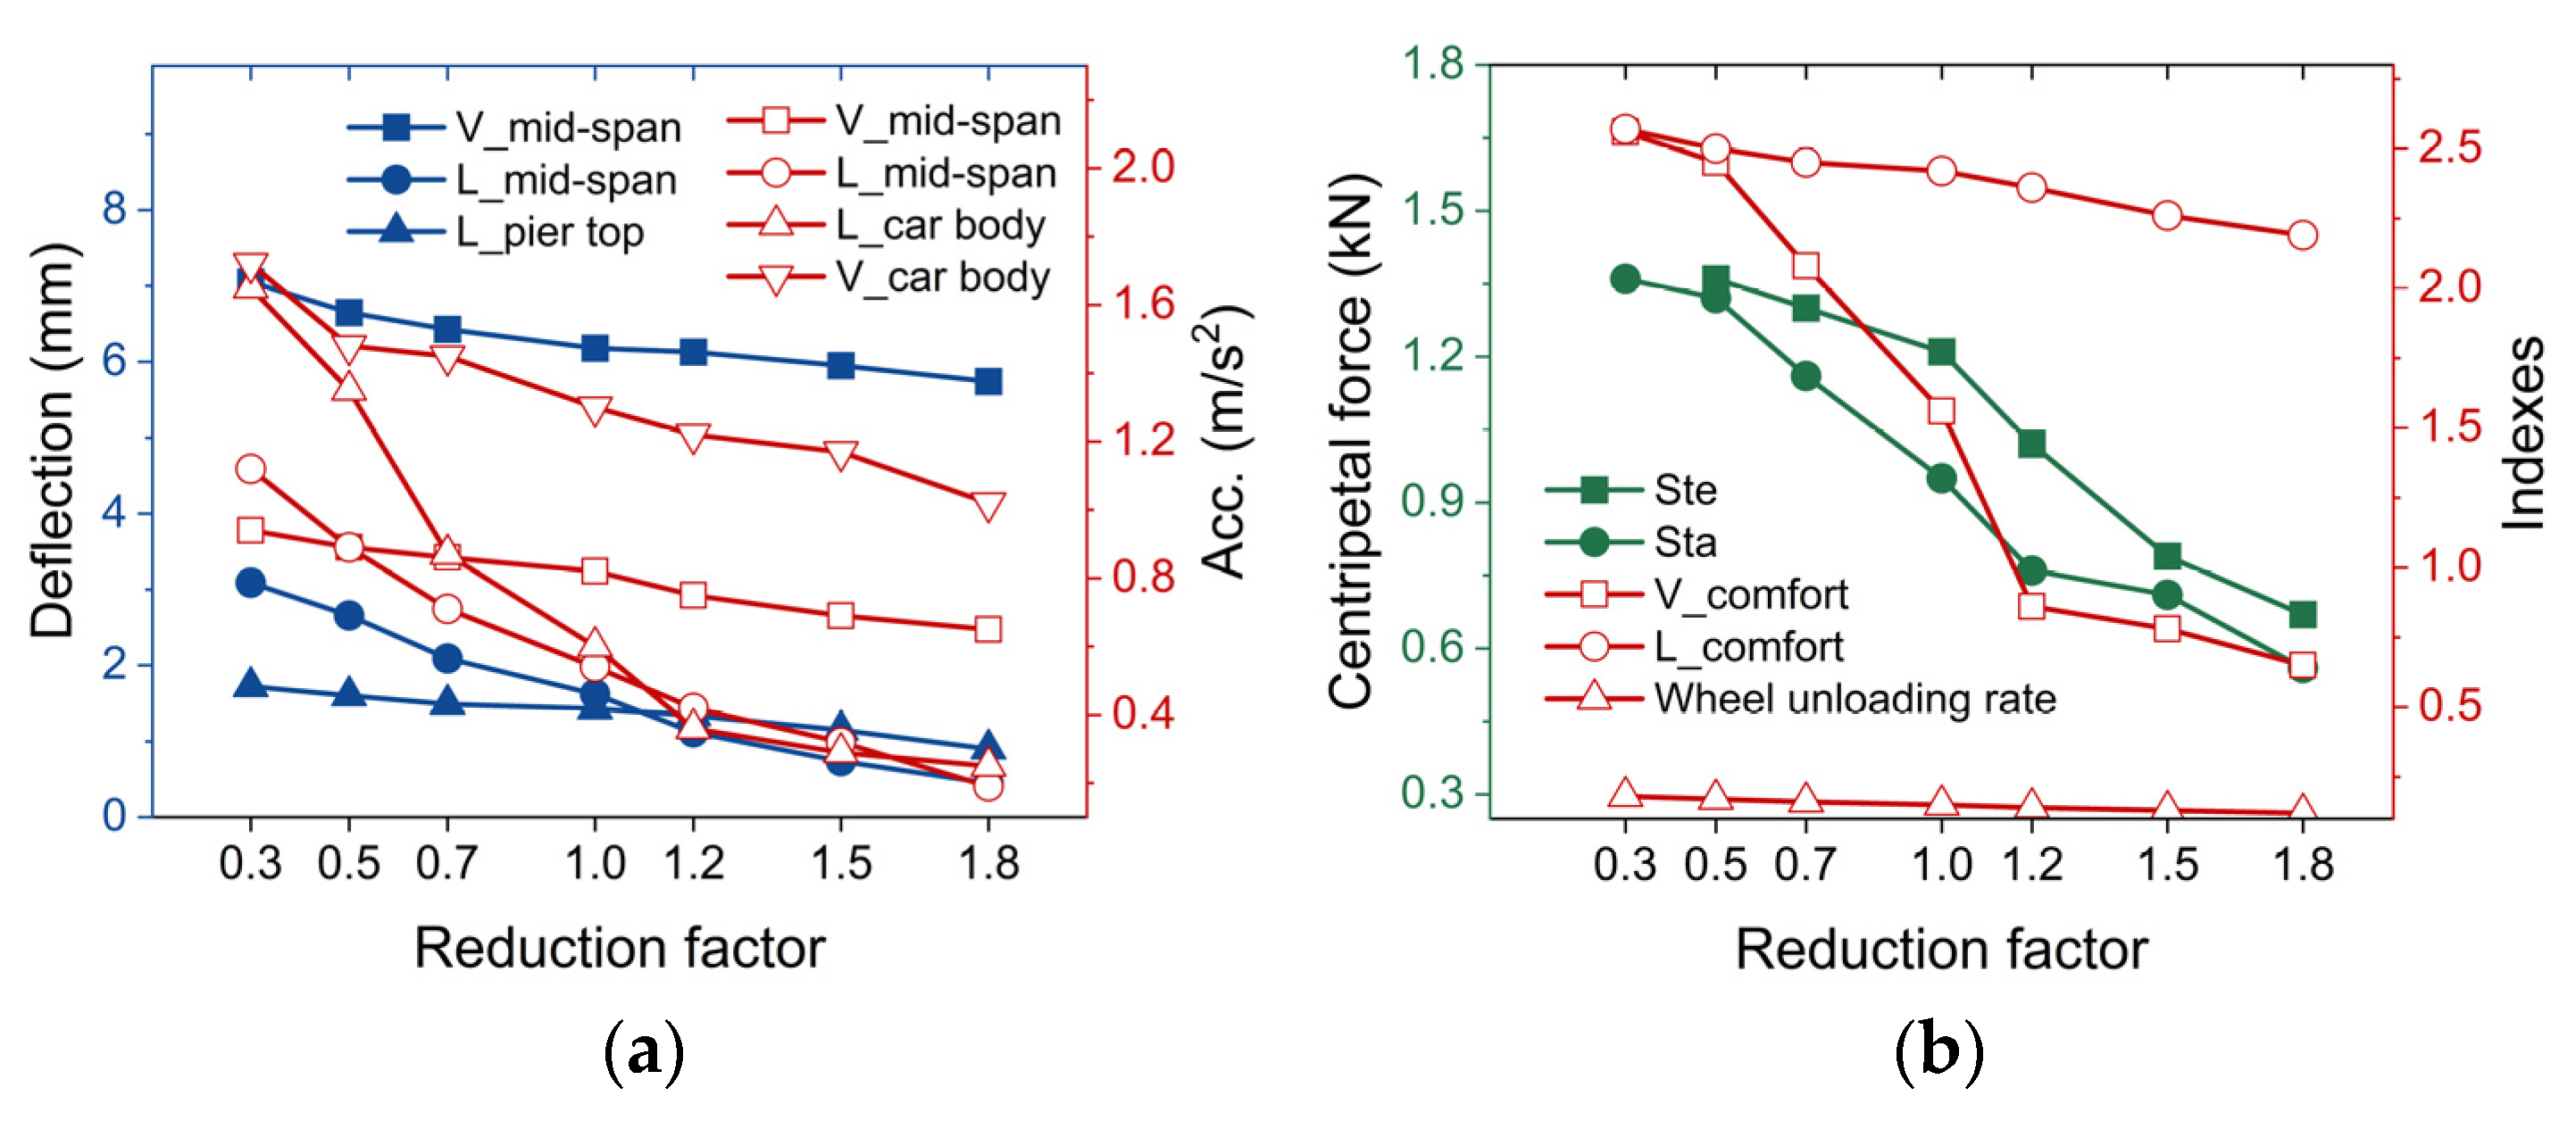
By changing the width and stiffness of the monorail beam, the lateral stiffness of the monorail beam can be altered and hence, the effects of lateral stiffness on the track beam can be further investigated. To this end, this work adopted the method of changing the transverse moment of inertia of track beams. The specific method is as follows: the lateral stiffness of the beam EI was multiplied by a reduction factor Rh, where Rh was set to values of 0.3, 0.5, 0.7, 1.0, 1.2, 1.5, and 1.8 to ensure representativeness and coverage of the lateral stiffness of practical track beams. The remaining conditions are as described in Section 3.1.1. Results are shown in Figure 9.

Figure 9.
Response results corresponding to different reduction factors. (a) Displacement and acceleration responses and (b) centripetal force, riding comfort index, and wheel unloading rate.
As shown in Figure 9, all kinds of dynamic responses decrease with increasing beam lateral stiffness. The variations in the mid-span lateral deflection and the vehicle body lateral acceleration with the girder lateral stiffness were more significant than the other responses were, and the two kinds of wheel vertical forces and stationarity indicators also varied significantly with the girder lateral stiffness.
3.2. Sensitivity Analysis
3.2.1. Variance-Based Methods
In the variance-based sensitivity analysis, the ratio of the parameter influencing factors to the output variance was calculated to assess the sensitivity of the parameter to the output. In this work, the Sobol index analysis method combined with the Saltelli method [37] was used to perform sensitivity analysis. This method uses quasi-random number sequences to construct two random number matrices A and B, then constructs matrix Ci on the basis of A and B and inputs the parameters of matrices A and B and each row of Ci into the model calculation to obtain three matrices. Output vectors are uA, uB, and uC, from which the first-order sensitivity coefficient Si and the overall sensitivity coefficient STi of the i-th parameter can be calculated. The method is expressed as follows:
3.2.2. Sensitivity Analysis of the Lateral Response
In the sensitivity analysis of the horizontal response, the four influencing factors mentioned above were set as sensitivity input parameters. A program was compiled based on the Saltelli method. The sensitivity indicators of each parameter were obtained after integrating the determined parameters, as shown in Figure 10.

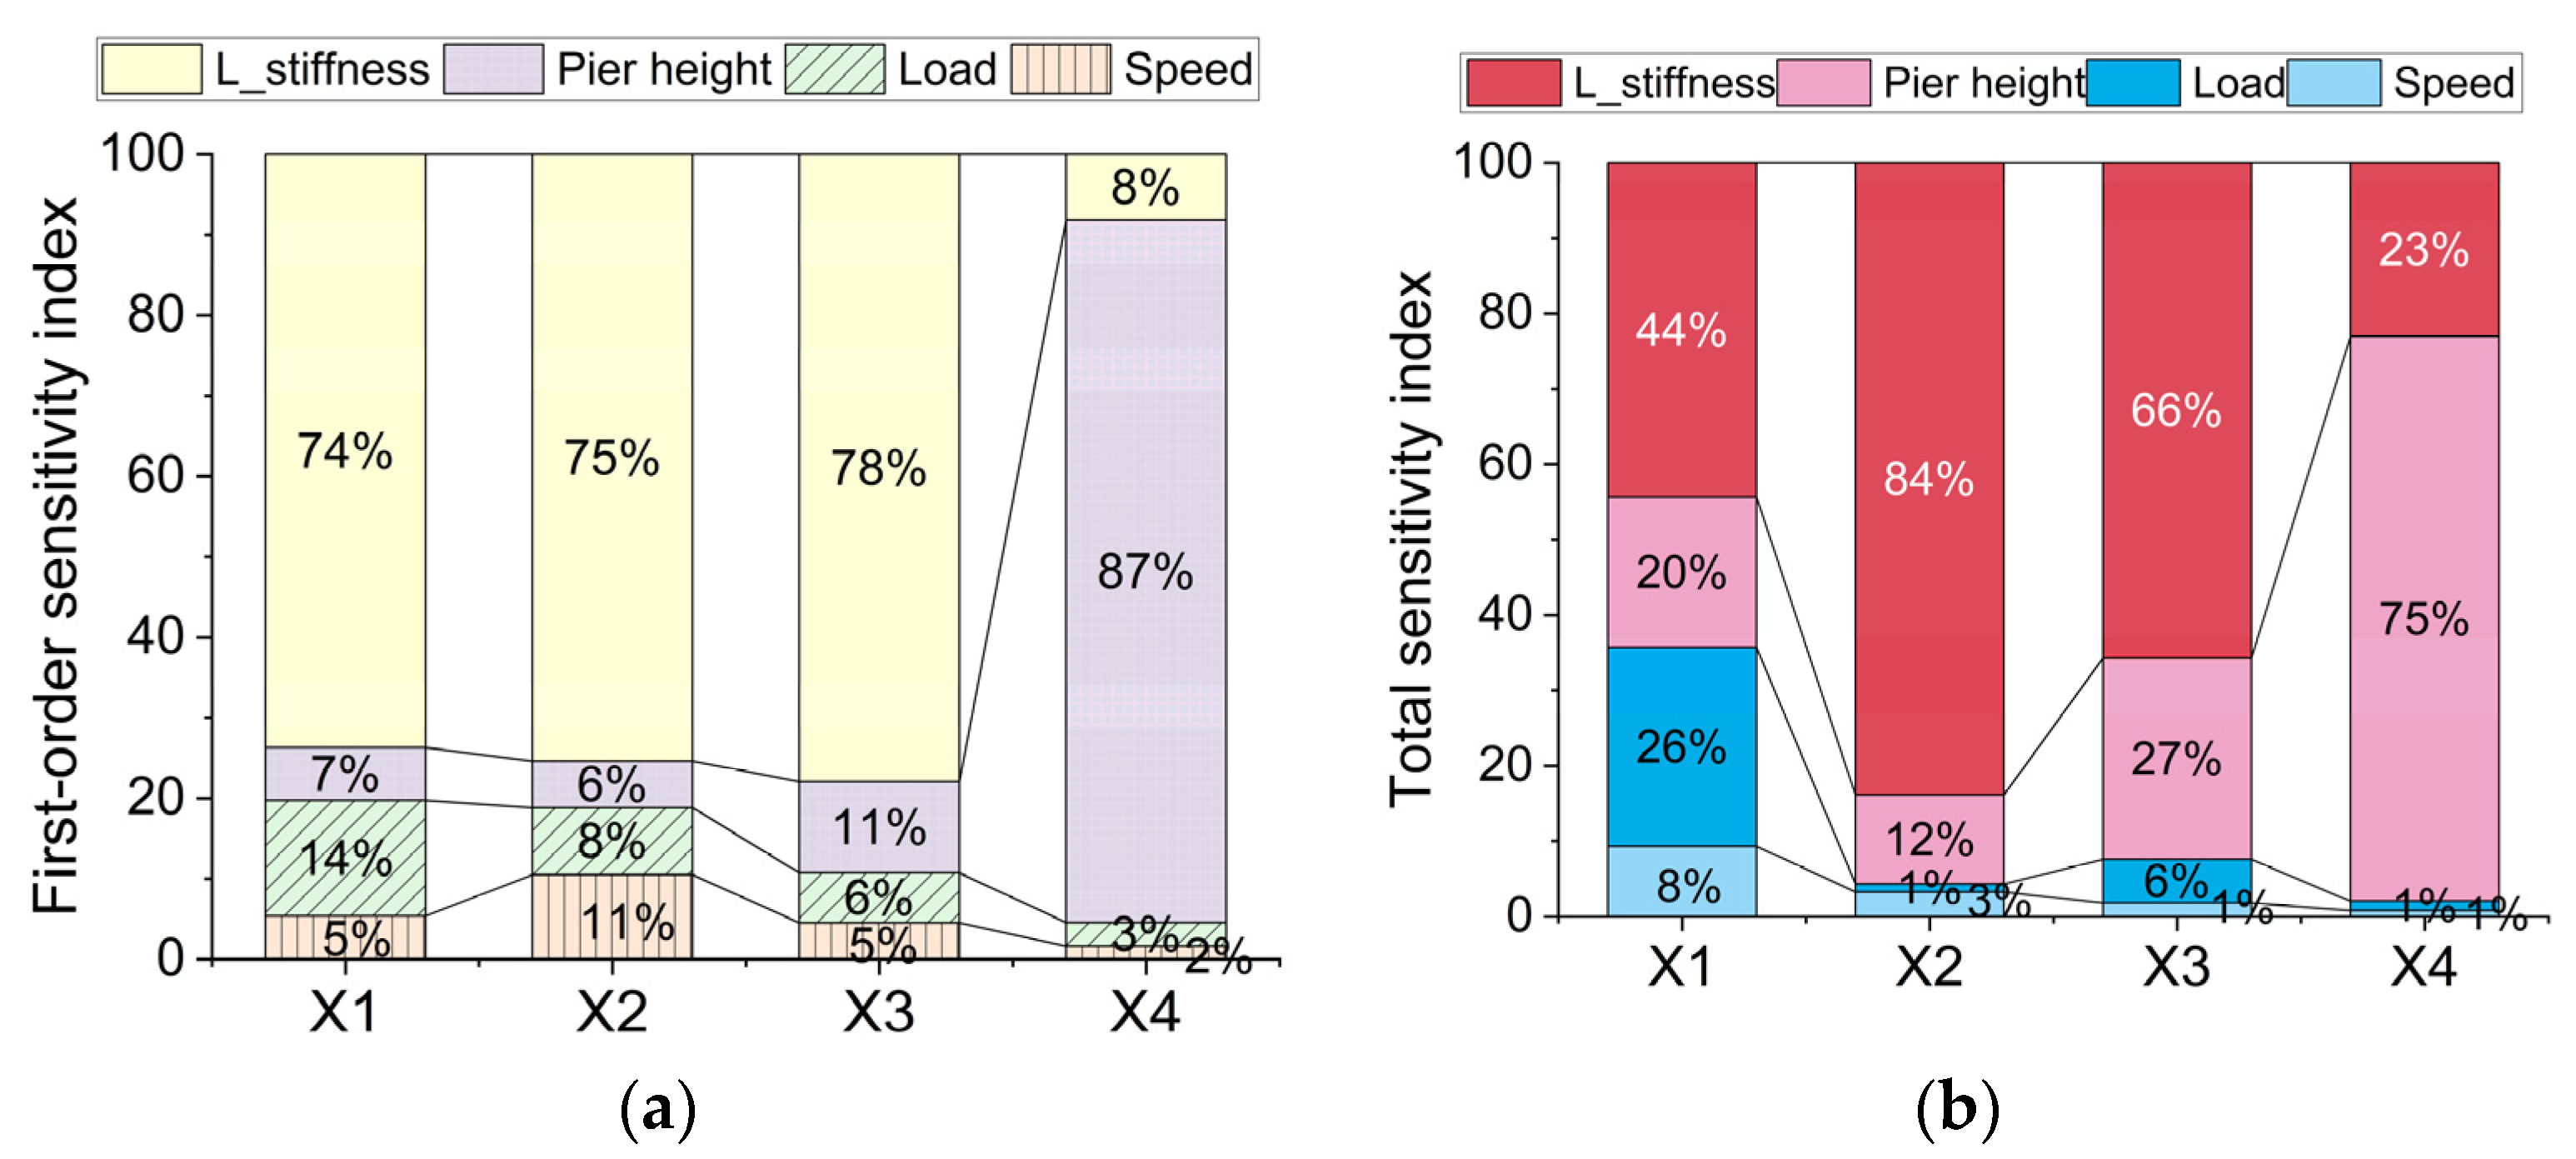
Figure 10.
Results of sensitivity indexes. (a) First-order level and (b) total level. Note that X1 represents the vehicle lateral acceleration, X2 represents the lateral displacement at the mid-span, X3 represents the lateral acceleration at the mid-span, and X4 represents the lateral displacement at the pier top.
As shown in Figure 10, the height of the monorail girder pier and the lateral stiffness of the beam have the greatest impacts on the lateral response of the overall structure. Among them, the pier height significantly contributes to the lateral displacement of the pier top, accounting for 87% of the first-order sensitivity index and 75% of the total sensitivity index. The beam lateral stiffness contributes significantly to the car body lateral acceleration and monorail beam mid-span. The maximum lateral acceleration and the maximum lateral displacement at the mid-span significantly contribute to 74%, 75%, and 78% of the first-order sensitivity indicators and account for 44%, 84%, and 66% of the total sensitivity indicators, respectively.
3.3. Determination of Lateral Stiffness Index
For the evaluation index of bridge lateral stiffness, the width–span ratio, lateral deflection–span ratio, natural frequency, and lateral amplitude are usually chosen. Compared with other indicators, the lateral deflection-to-span ratio can fully reflect the interaction between the vehicle and the bridge system. It is also closely related to the magnitude and distribution pattern of the horizontal force acting on the bridge. Therefore, it can effectively reflect the interaction between the vehicle and the bridge system, considering the magnitude, distribution pattern, and phase distribution of the lateral force. In fact, the deflection–span ratio has also been used in bridges that are sensitive to lateral stiffness, such as long cable-stayed bridges [38,39]. Accordingly, the lateral deflection–span ratio was used in the present study to evaluate the lateral stiffness of bridges. As an important structure in travel and transportation systems, the lateral deflection at the top was chosen as the evaluation scale for the lateral stiffness of the steel pipe columns. This was also determined by the expected most unfavourable serving condition, as presented in studies on the dynamic responses of bridge piers [40].
To determine the limit value of these two parameters, a comprehensive parametric study was conducted to obtain their relationship with the dynamic performance of the MTTS. In this work, three indicators of dynamic performance, including the mid-span lateral acceleration of track beams, the Sperling index (riding comfort [41]) of train operation, and the lateral wheel force of trains, were investigated because of their deterministic nature. With reference to related specifications and the consideration of structural configurations of the MTTS, the evaluation limit of the mid-span lateral acceleration was set to 0.98 m/s2 (0.1 g); the excellent level of the Sperling index, i.e., 2.5, was utilized to ensure the riding comfort of monorail trains. In addition, the evaluation limit value of the lateral wheel force was set to 1.37 kN according to the technical conditions of the polyurethane wheel tyre provided by the manufacturer.
3.3.1. Lateral Acceleration Perspective
Based on the proposed model, the maximum lateral deflection of the track beam (in the mid-span) and the pier (at the top), as well as the indicator of dynamic performance, lateral acceleration, can be calculated. In the subsequent analysis, a 10 m long track beam was used, and wind loads and track irregularity of level C were employed. To obtain the required limit values, the pier height was changed in each individual calculation to obtain dynamic responses of different levels, where the higher the pier, the stronger the response.
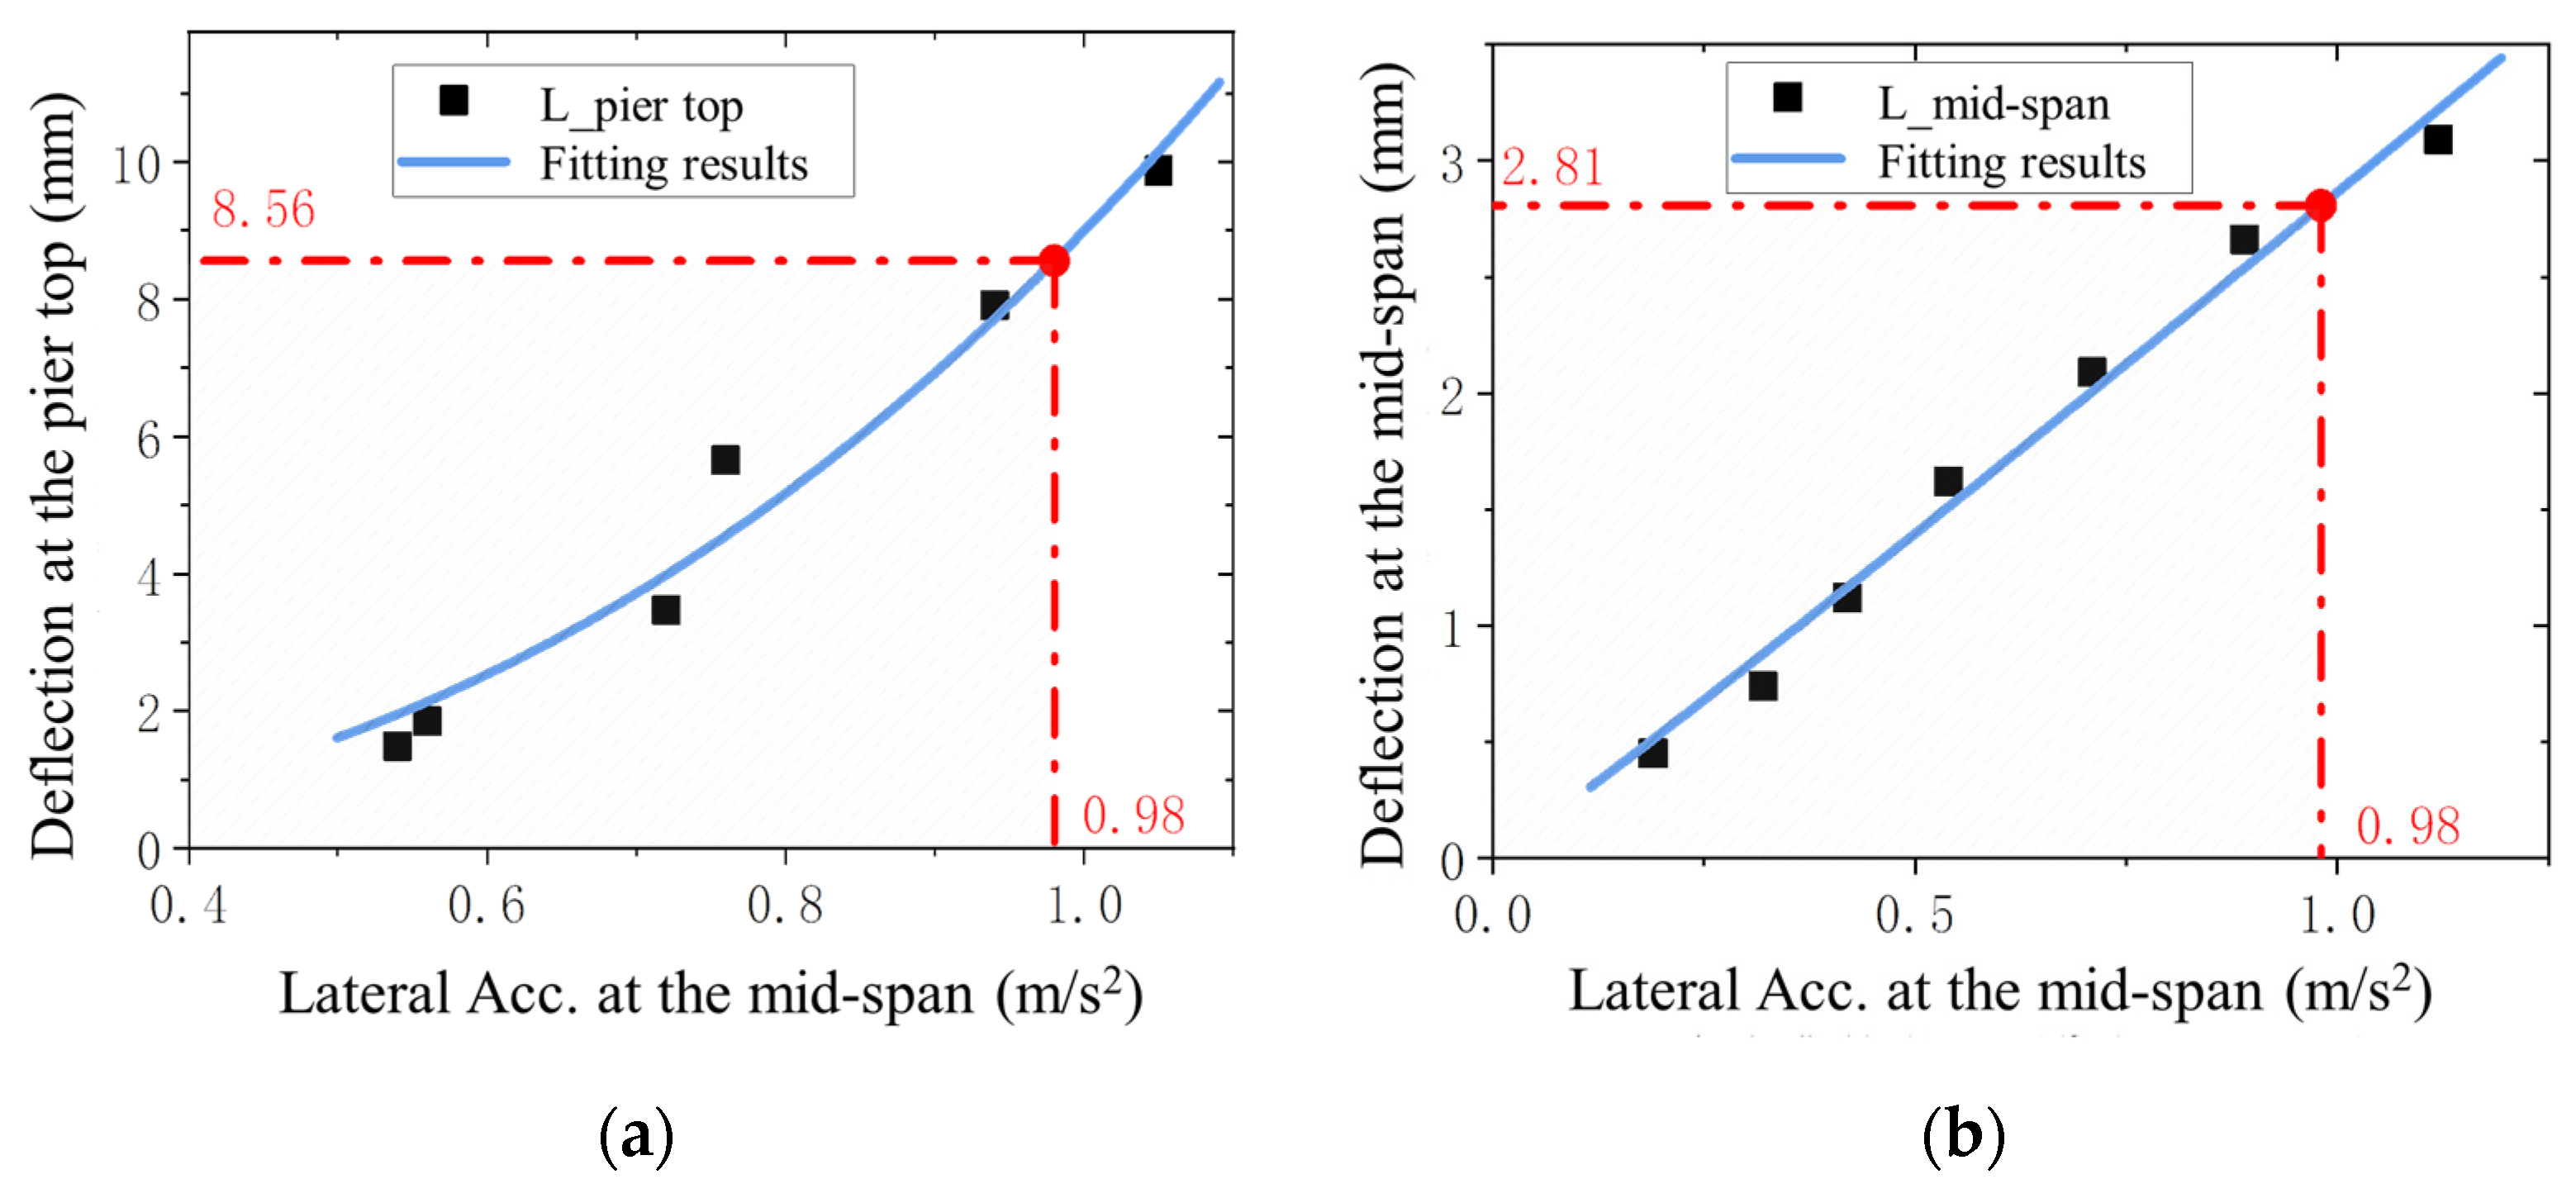
Figure 11a,b illustrate the relationship between the lateral deflection and the lateral acceleration at the pier top and mid-span, respectively. As it shows, the lateral response of different structural components in the MTTS has a similar variation pattern under the change in pier height. Curve fitting was conducted for the data in Figure 11; the determination coefficient R2 was used to quantify the fitting quality. In this case, the coefficients of the pier top and the mid-span are 0.96 and 0.98, respectively, indicating excellent fitting performance. Point interpolation was then performed.

Figure 11.
Fitting results of the maximum lateral deflection versus lateral acceleration of the track beam. (a) Lateral deflection at the pier top and (b) lateral deflection at the mid-span.
Based on the predefined threshold value of 0.98 m/s2, the limit value of lateral deflection at the pier top and mid-span can be determined as 8.56 mm and 2.81 mm, respectively. For 10 m long track beams, the deflection–span ratio is 2.81 mm over 10 m (1/3559); for convenient design, the limit value of the lateral deflection–span ratio is approximately taken as L/3600.
3.3.2. Lateral Riding Comfort Perspective
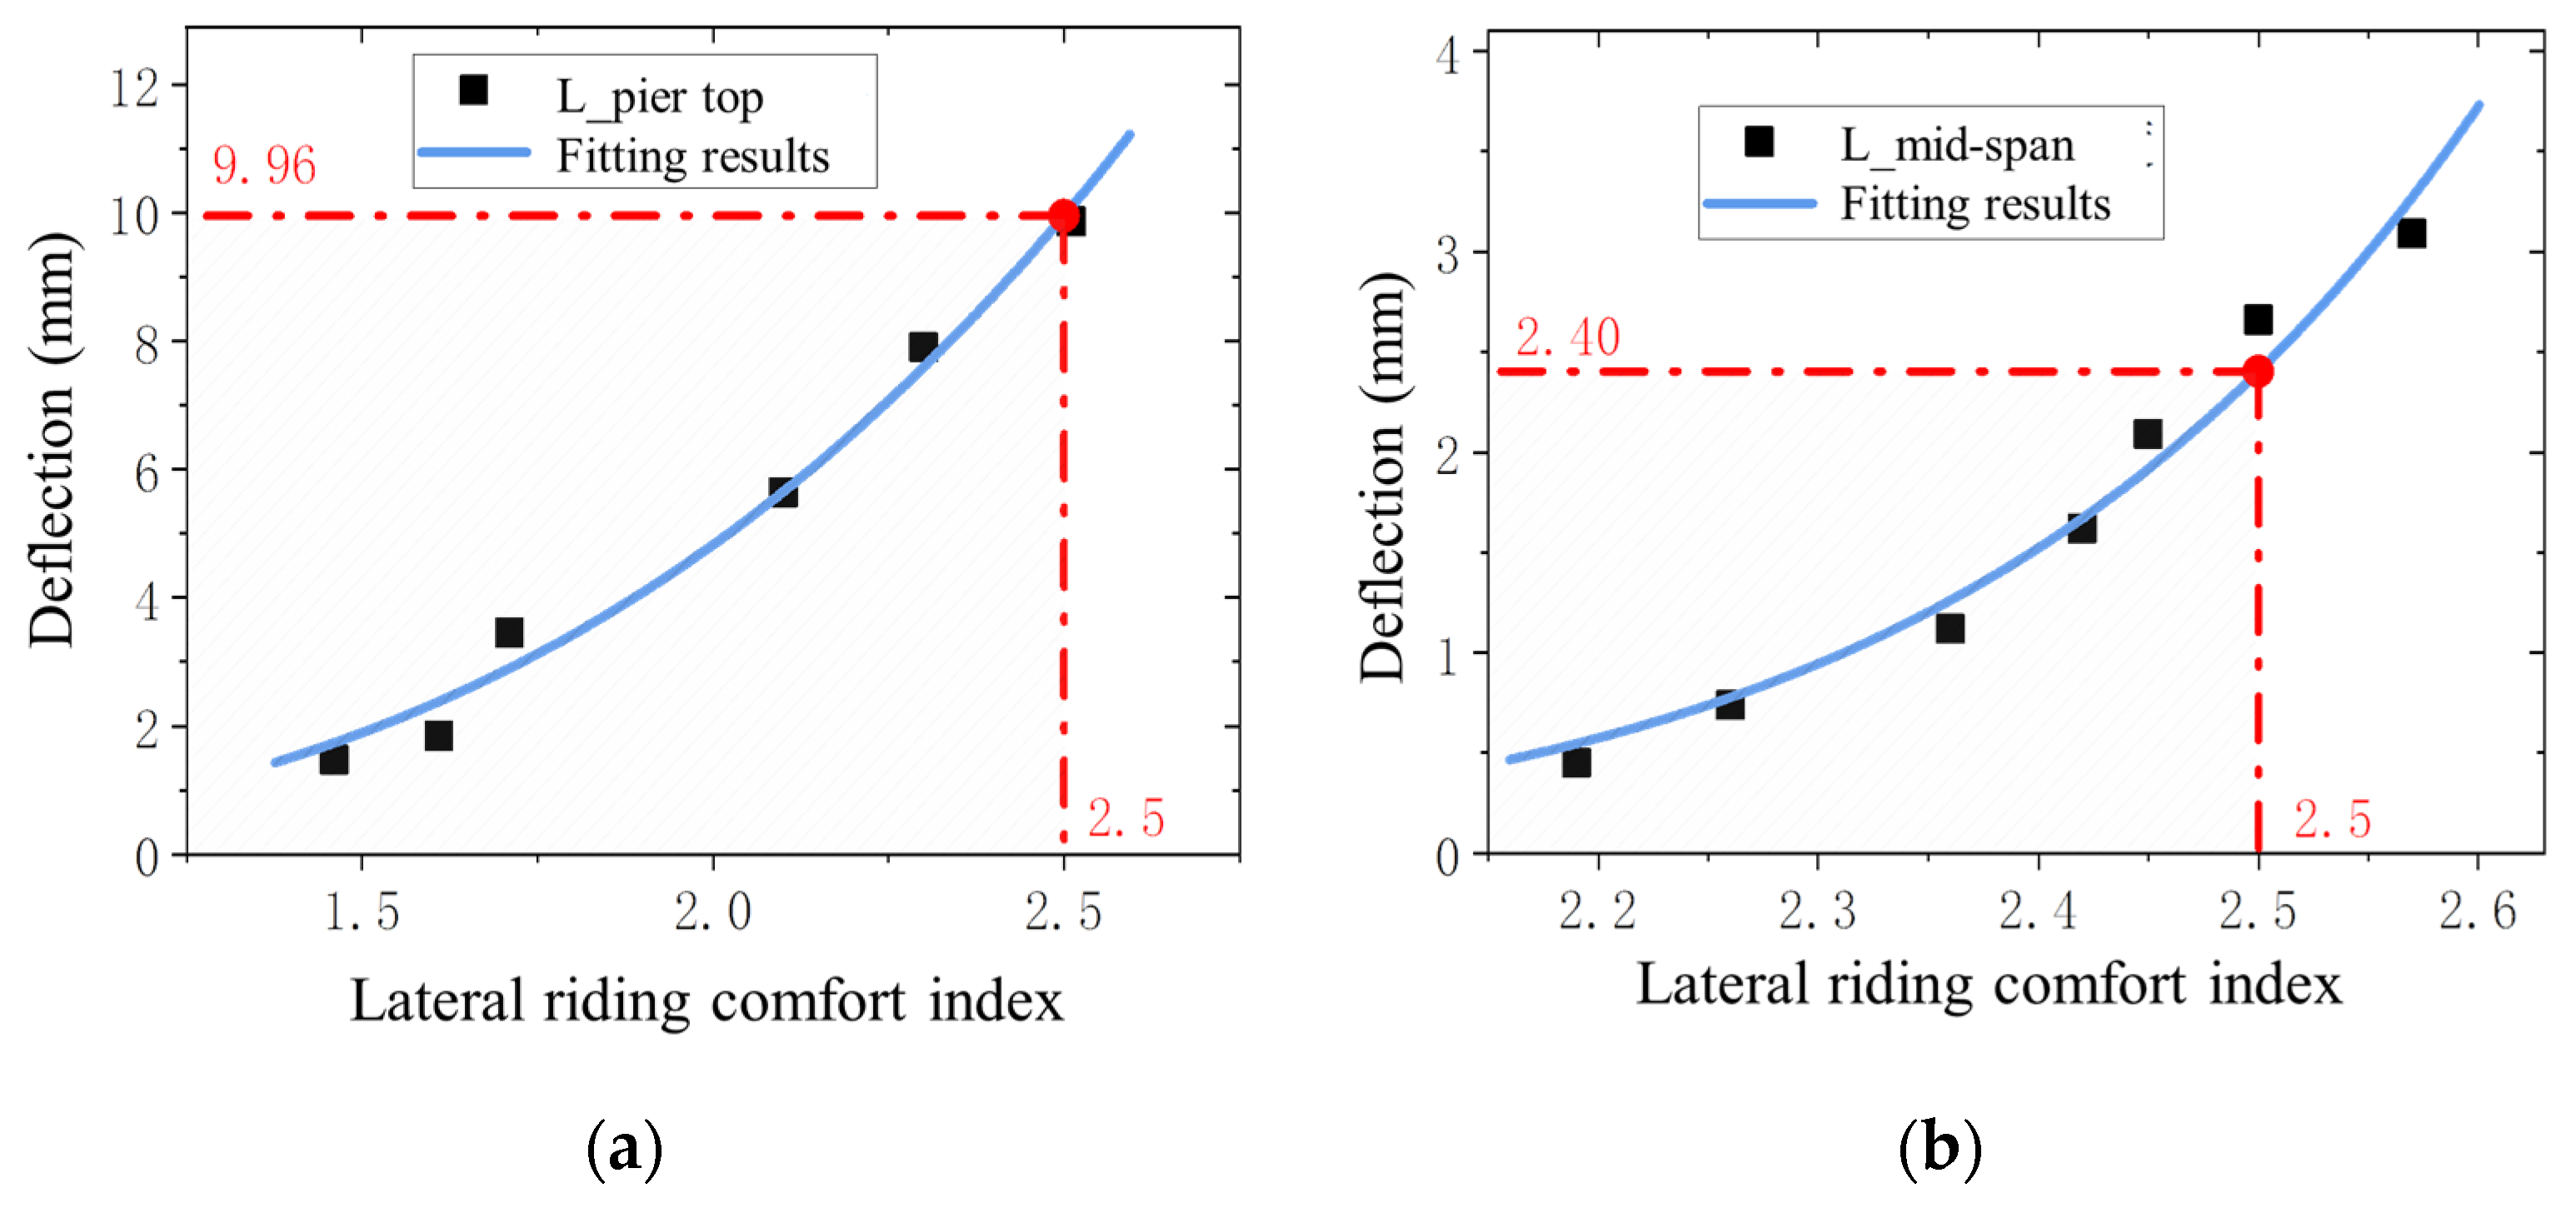
Similarly, this section will investigate the lateral stiffness of MTTS components in terms of the riding comfort of monorail train operation. By following the approach in Section 3.3.1, the relationship between the riding comfort index and the maximum lateral deflection, as well as the fitting result, are plotted in Figure 12. As it shows, the lateral deflection increases a little bit faster than the Sperling index. The determination coefficient of the pier top and the mid-span are 0.96 and 0.97, respectively.

Figure 12.
Fitting results of the maximum lateral deflection versus lateral riding comfort index. (a) Lateral deflection at the pier top and (b) lateral deflection at the mid-span.
Based on the predefined threshold value of 2.5, the limit value of lateral deflection at the pier top and mid-span can be determined as 9.96 mm and 2.40 mm, respectively. In this case, the deflection–span ratio is about 1/4167; for convenient design, the limit value is approximately taken as L/4200.
3.3.3. Lateral (Centripetal) Wheel Force Perspective
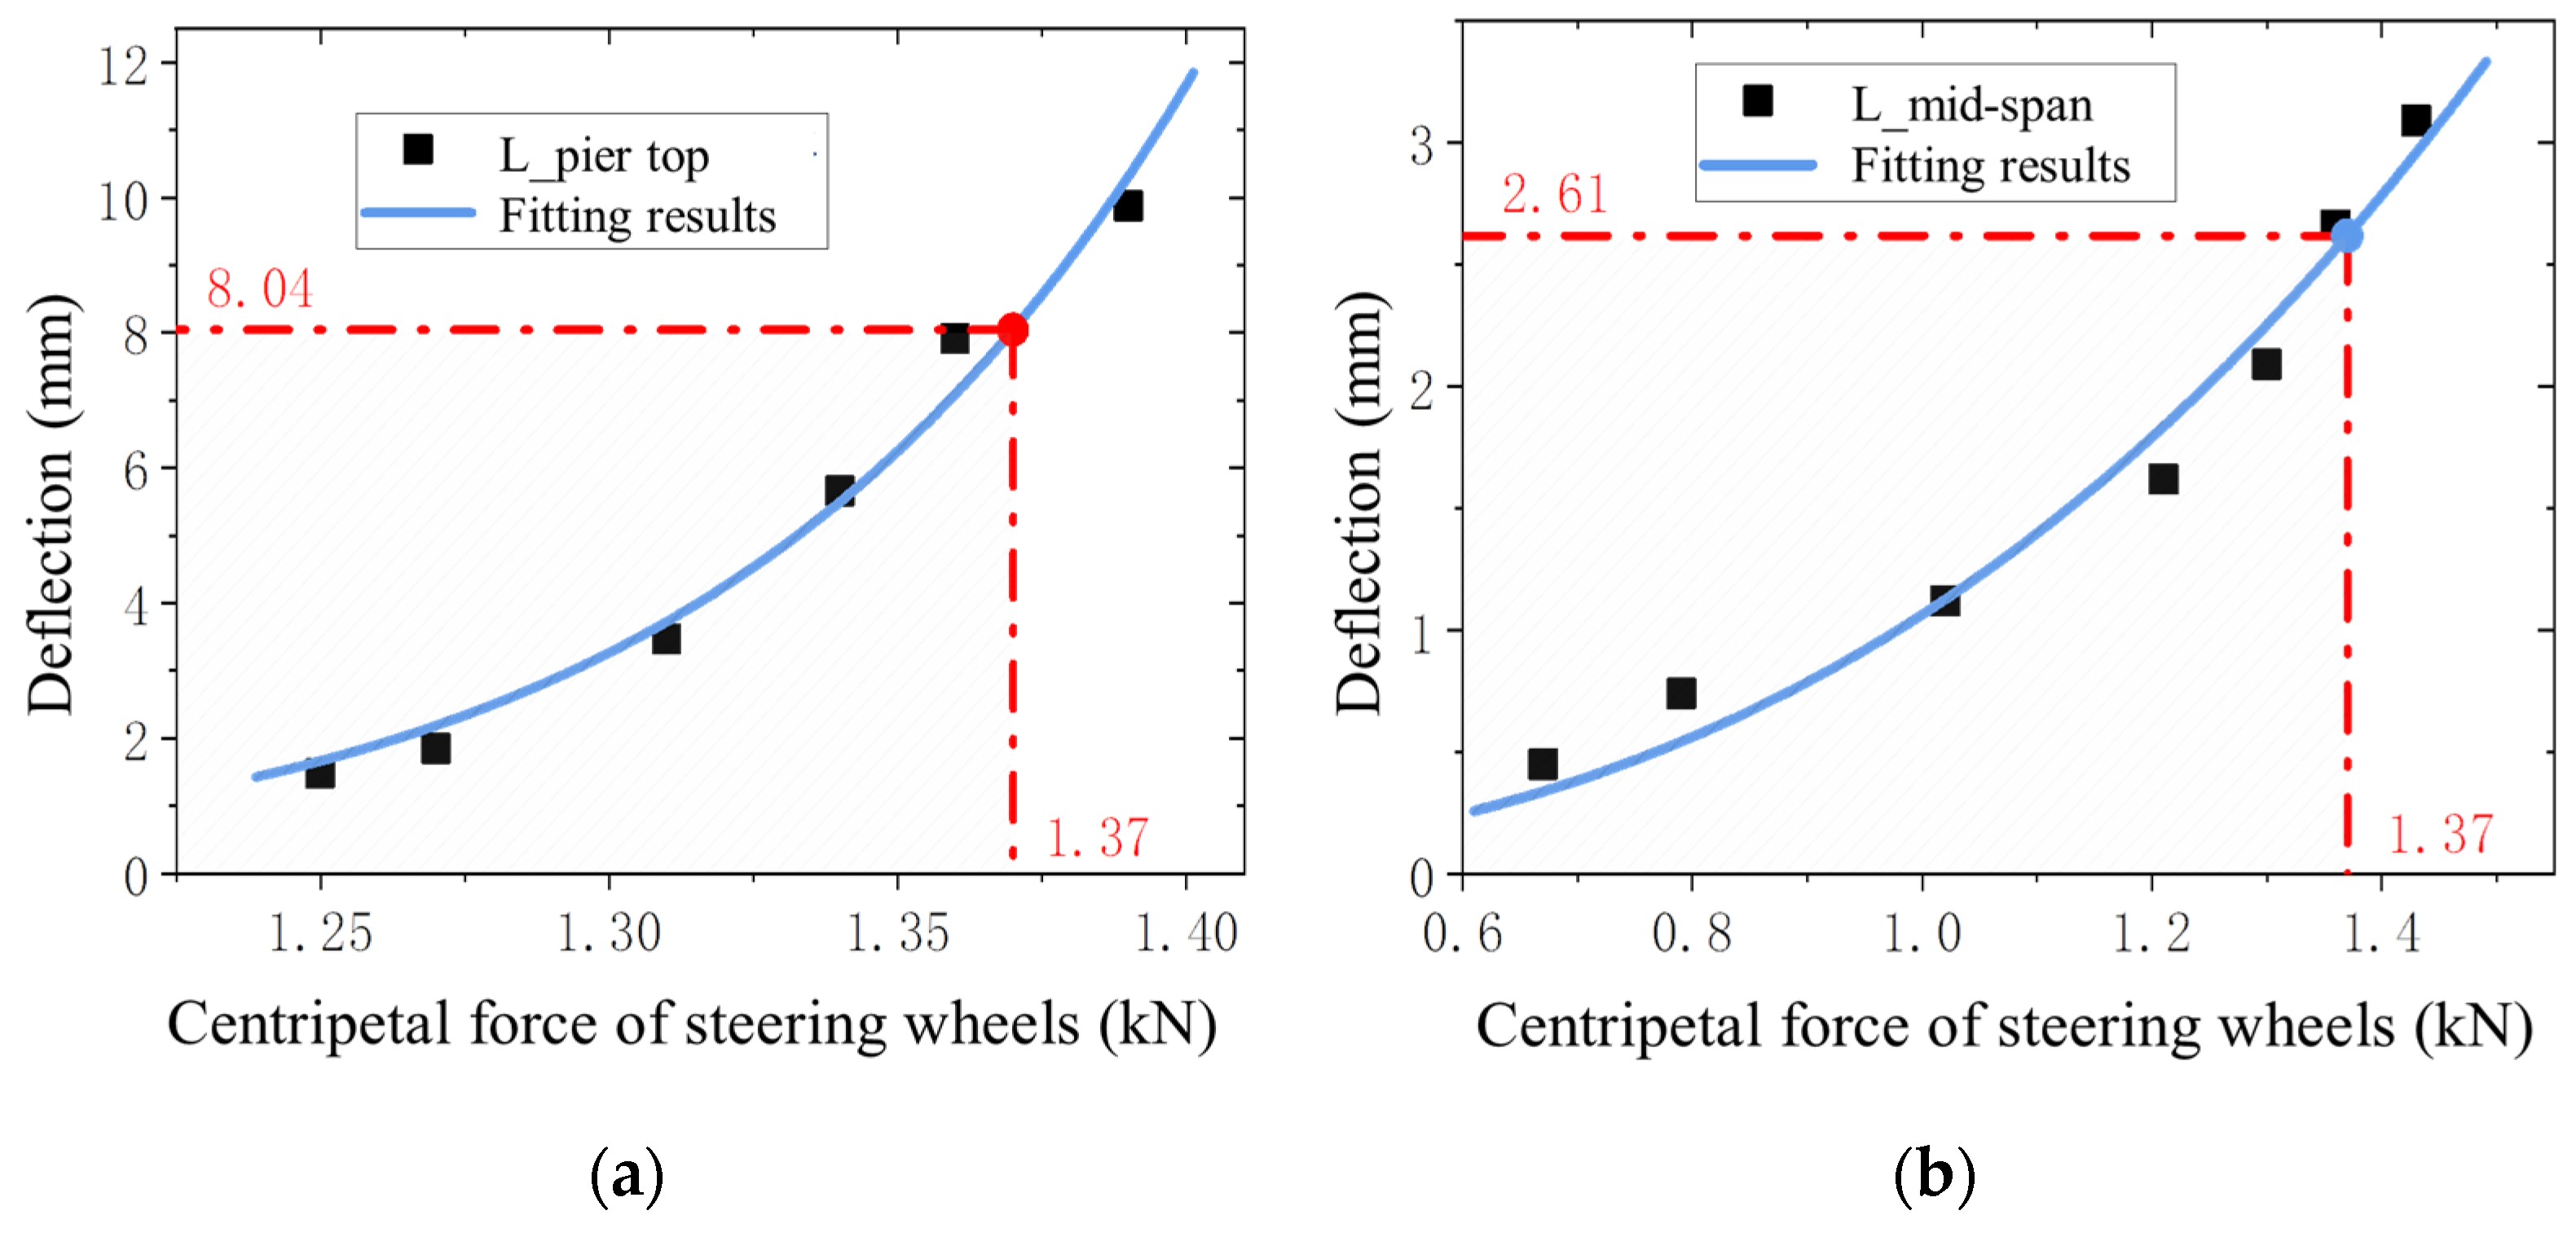
This section will investigate the lateral stiffness limit by considering the lateral force of rubber wheels. The relationship between the centripetal force and the maximum lateral deflection, as well as the fitting result, are plotted in Figure 13. A similar pattern is observed in Figure 13, where the centripetal force rises with the increase in pier height. The determination coefficient of the pier top and the mid-span are 0.98 and 0.96, respectively.

Figure 13.
Fitting results of the maximum lateral deflection versus centripetal force of lateral wheels. (a) Lateral deflection at the pier top and (b) lateral deflection at the mid-span.
Based on the predefined threshold value of 1.37 kN, the limit value of lateral deflection at the pier top and mid-span can be determined as 8.04 mm and 2.64 mm, respectively. In this case, the deflection–span ratio is about 1/3831; for convenient design, the limit value is approximately taken as L/3900.
3.3.4. Limits of the Lateral Displacement and Lateral Deflection–Span Ratio of the Pier Top
In the foregoing text, the interpolation method was used to select the values of the fitting function, and the corresponding data are summarized in Table 2.
Table 2.
Summary of the lateral deflection and deflection–span ratio limits at the pier top.
Based on the data in Table 2, and for the sake of a relatively conservative design, the minimum value of 8.04 mm in the table is taken as the lateral displacement of the pier top, and the minimum value of L/4200 in the table is taken as the lateral deflection–span ratio limit of the MTTS.
4. Discussion
To investigate the difference between the lateral stiffness limit of the MTTS and other specifications, the provisions in similar specifications are compared in Table 3. An analysis of Table 3 shows that among the lateral stiffness limits proposed in this paper, the lateral deflection–span ratio is close to the “Code for the Design of Urban Rail Transit Bridges (GB/T 51234-2017) [8]” and lower than the code of “Design Standards for Straddle-Type Monorail Transit (GB 50458-2022) [9]”. The lateral displacement of the pier top was much lower than those of the other two specifications, which reflects the structural characteristics of the MTTS, which are different from those of rail transportation; therefore, special attention should be given to the design.
Table 3.
Comparison of the lateral stiffness limits with specifications (non-mandatory for MTTS).
Limitations and Future Work
- 1.
- The simulation model established in this paper has room for improvement. For example, a more detailed measurement of the in situ wind field can be carried out to consider the wind-induced effects better. This may help realize the coupled simulation of extreme load effects and dynamic effects of large-span track beams. In addition, more effects of track irregularity can be further included, which can be achieved by employing spectra of various levels and considering the irregularity-induced effect under complex loading conditions, such as ground motion. Of course, a more complicated model generally means a more time-consuming solving process. Moreover, more practical design preferences should be integrated to draw more meaningful conclusions and to promote potential applications.
- 2.
- This work focuses on the lateral response of an MTTS. However, supplying the vertical response of an MTTS may be useful for effectively capturing the dynamic performance of the MTTS. In addition, a more targeted evaluation system and standard limit values can be proposed. The selection of the lateral stiffness index and dynamic performance indicator mainly relies on referring to existing specifications. The possibility of using a more precise indicator for the MTTS should be further studied.
5. Conclusions
The main conclusions of this paper are as follows:
- (i)
- A wind–train–bridge coupling model validated by field measurements was developed to investigate the effects of multiple factors on the dynamic response of an MTTS. During the changes in vehicle speed and vehicle weight, the vertical response increase in the MTTS is greater than the horizontal response increase. Changes in pier height have a significant impact on the lateral response of monorail beams. Moreover, it is concluded that the variation in lateral stiffness can distinctly affect the dynamic responses.
- (ii)
- A variance-based sensitivity analysis was performed on various influencing factors. Results revealed that the pier height and the lateral stiffness significantly affected the lateral response of the overall structure. Among them, the pier height significantly contributed to the lateral displacement of the pier top, accounting for 87% of the first-order sensitivity index and 75% of the total sensitivity index. The lateral acceleration and the maximum lateral displacement at the mid-span significantly contributed to 74%, 75%, and 78% of the first-order sensitivity indexes and accounted for 44%, 84%, and 66% of the total sensitivity indexes, respectively.
- (iii)
- Based on the obtained results, the lateral responses of the MTTS were evaluated in terms of index of beam acceleration, riding comfort of the monorail train, and wheel force on the bogie. Finally, two lateral limited values, i.e., a lateral displacement limit of 8.04 mm for the pier top and a lateral deflection–span ratio limit of L/4200 were determined.
Author Contributions
Methodology, H.Z., P.W., and S.W.; software and formal analysis, P.W. and S.W; data curation, P.W., J.J., and S.W.; writing—original draft preparation, H.Z. and S.W.; writing—review and editing, P.W. and F.G.; supervision and project administration, F.G.; engineering application, Q.L., J.J., C.F., and Q.D. All authors have read and agreed to the published version of the manuscript.
Funding
This research was funded by the National Key Research and Development Program during the 14th Five-Year Plan period of China, grant number 2022YFC3004304.
Data Availability Statement
The data presented in this study may be available upon reasonable request.
Conflicts of Interest
Authors Qin Li, Cheng Feng, and Qun Deng were employed by the 3rd Construction Co., Ltd. of the China Construction 5th Engineering Bureau. Author Junhui Jin was employed by Zhuzhou CRRC Special Equipment Technology Co., Ltd. The remaining authors declare that the research was conducted in the absence of any commercial or financial relationships that could be construed as potential conflicts of interest.
References
- Guo, F.; Chen, K.; Gu, F.; Wang, H.; Wen, T. Reviews on current situation and development of straddle-type monorail tour transit system in China. J. Cent. South Univ. Sci. Technol. 2021, 52, 4540–4551. [Google Scholar]
- Lee, J.; Kim, H.; Lee, K.; Kang, Y.J. Effect of load combinations on distortional behaviors of simple-span steel box girder bridges. Metals 2021, 11, 1238. [Google Scholar] [CrossRef]
- Cheng, J.; Yao, H. Simplified method for predicting the deflections of composite box girders. Eng. Struct. 2016, 128, 256–264. [Google Scholar] [CrossRef]
- Zhou, M.; Liu, Z.; Zhang, J.; An, L.; He, Z. Equivalent computational models and deflection calculation methods of box girders with corrugated steel webs. Eng. Struct. 2016, 127, 615–634. [Google Scholar] [CrossRef]
- Shamsi, M.; Ghanbari, A. Nonlinear dynamic analysis of Qom monorail bridge considering soil-pile-bridge-train interaction. Transp. Geotech. 2020, 22, 100309. [Google Scholar] [CrossRef]
- Nettis, A.; Nettis, A.; Ruggieri, S.; Uva, G. Corrosion-induced fragility of existing prestressed concrete girder bridges under traffic loads. Eng. Struct. 2024, 314, 118302. [Google Scholar] [CrossRef]
- GB 8408-2018; Large-Scale Amusement Device Safety Code. State Administration of Work Supervision: Beijing, China, 2018.
- GB/T 51234-2017; Code for Design of Urban Rail Transit Bridge. Ministry of Housing and Urban-Rural Development of the People’s Republic of China: Beijing, China, 2017.
- GB 50458-2022; Standard for Design of Straddle Monorail Transit. Ministry of Housing and Urban-Rural Development of the People’s Republic of China: Beijing, China, 2022.
- Gao, Q.; Cui, K.; Li, Z.; Li, Y. Numerical investigation of the dynamic performance and riding comfort of a straddle-type monorail subjected to moving trains. Appl. Sci. 2020, 10, 5258. [Google Scholar] [CrossRef]
- Liu, M. Study on Coupling Vibration of Windmill Bridge for T-beam Continuous Rigid Frame Bridge in High Altitude Area. Master’s Thesis, Chongqing Jiaotong University, Chongqing, China, 2019. [Google Scholar]
- Miao, Y. Studies on Coupled Vibration of Rail-cum-Road Cable-stayed Bridge with a Super Span under Wind Loads. Master’s Thesis, Central South University, Changsha, China, 2014. [Google Scholar]
- Huang, G.; Ren, N.; Zheng, H. Structural dynamics of bridges under the coupling effect of windmills and bridges. Eur. J. Comput. Mech. 2023, 31, 601–620. [Google Scholar] [CrossRef]
- Chen, J.; Li, R.; Xu, J.; Li, P. Study on the aerodynamic performances and the operational safety of the vehicle-bridge system under the crosswind. Mech. Based Des. Struct. Mach. 2024, 2, 1–23. [Google Scholar] [CrossRef]
- Wang, S.; Wan, X.; Guo, M.; Giao, H.; Zhang, N.; Ye, Q. Nonlinear dynamic analysis of the wind–train–bridge system of a long-span railway suspension truss bridge. Buildings 2023, 13, 277. [Google Scholar] [CrossRef]
- Zou, Y.; Liu, Z.; Shi, K.; He, X. Analysis of effects of aerodynamic interference on dynamic response of suspended monorail wind–vehicle–bridge system using joint simulation approach. Structures 2022, 45, 179–198. [Google Scholar] [CrossRef]
- Luo, S. The Research on the Aerodynamic Characteristics of Road Vehicles on Bridge Deck and Its Driving Safety. Master’s Thesis, Hunan University of Science and Technology, Xiangtan, China, 2023. [Google Scholar]
- Jiang, Y. Study on Coupled Vibration and Lateral Stiffness of Steel Girder Cable-Stayed Long-Span Road-Rail Bridge. Master’s Thesis, Chongqing Jiaotong University, Chongqing, China, 2023. [Google Scholar]
- Guo, X.; Zou, X. Influence of wind guide railing parameters on wind-vehicle-bridge coupling vibration of steel truss bridge. J. Railw. Sci. Eng. 2024, 21, 1068–1078. [Google Scholar]
- Sugimura, H.; Takeda, M.; Takei, M.; Yamaoka, H.; Ogata, T. Development of HEV engine start-shock prediction technique combining motor generator system control and multi-body dynamics (MBD) models. SAE Int. J. Passeng. Cars-Mech. Syst. 2013, 6, 1363–1370. [Google Scholar] [CrossRef]
- Xiang, H.; Tao, Y.; Chen, X.; Hu, H.; Li, Y. Study on Transverse Deflection-span Ratio Limit of Long-span Railway Suspension Bridge Considering Wind Barrier. J. China Railw. Soc. 2023, 45, 62–69. [Google Scholar]
- Zhou, C.; Xu, X.; Zheng, X.; Chen, X. Study on the Influence of Pier Stiffness on Vehicle-bridge Coupled Vibration of Long-span Continuous Girder Bridge of Railway. High Speed Railw. Technol. 2022, 13, 23–29. [Google Scholar]
- Zhu, Z.; Jiang, Z. Analysis of dynamic characteristics of large-span suspension bridges with extended spans of stiffening girders. J. Railw. Sci. Eng. 2022, 19, 1014–1023. [Google Scholar]
- Liu, L.; Jiang, L.; Liu, X.; Zhou, W.; Nie, L.; Shao, G. Research on analytical model of transverse deformation and rail surface deformation of high-speed railway bridge based on Ritz method. J. Cent. South Univ. Nat. Sci. Ed. 2021, 52, 4349–4360. [Google Scholar]
- Wang, M.; Song, Z.; Teng, N. Research on Transverse Stiffness of High Speed Maglev Guideway Girder Based on Coupled Vibration. Railw. Eng. 2021, 61, 1–5. [Google Scholar]
- Yan, Y.; Zhan, J.; Zhang, N.; Shen, K. Influence of Pier Transverse Displacement and Foundation Stiffness Change on High Speed Running Safety. Railw. Eng. 2020, 60, 8–12. [Google Scholar]
- Carden, L.P.; Buckle, I.G.; Itani, A.M. Transverse displacement capacity and stiffness of steel plate girder bridge superstructures for seismic loads. J. Constr. Steel Res. 2007, 63, 1546–1559. [Google Scholar] [CrossRef]
- Naeimi, M.; Tatari, M.; Esmaeilzadeh, A.; Mehrali, M. Dynamic interaction of the monorail–bridge system using a combined finite element multibody-based model. Proc. Inst. Mech. Eng. Part K J. Multi-Body Dyn. 2015, 229, 132–151. [Google Scholar] [CrossRef]
- Guo, F.; Wang, P. Measurement and analysis of the longitudinal level irregularity of the track beam in monorail tour-transit systems. Sci. Rep. 2022, 12, 19219. [Google Scholar] [CrossRef] [PubMed]
- Wang, P.; Guo, F.; Zhang, H.; Jin, J.; Liao, Q.; Yan, Y. Acquiring the High-Precision Spectrum of Track Irregularity by Integrating Inclination in Chord Methods: Mathematics, Simulation, and a Case Study. Mathematics 2024, 12, 2227–7390. [Google Scholar] [CrossRef]
- Jiang, Y.; Wu, P.; Zeng, J.; Qu, S.; Wang, X.; Wang, S. Simplified and relatively precise back-calculation method for the pavement excitation of the monorail. Int. J. Pavement Eng. 2021, 22, 480–497. [Google Scholar] [CrossRef]
- ABAQUS. ABAQUS User’s Manual, Version 2016; Dassault Systemes: Velizy-Villacoublay, France, 2016; Available online: http://62.108.178.35:2080/v2016/index.html (accessed on 20 September 2024).
- SIMPACK, Version 2021x; Dassault Systemes: Velizy-Villacoublay, France, 2021; Available online: https://blog.3ds.com/brands/simulia/simpack-r2021x-multibody-system-simulation-updates/ (accessed on 20 September 2024).
- ANSYS. ANSYS Fluent 17.0 Documentation; ANSYS Inc.: Lebanon, NH, USA, 2016. [Google Scholar]
- Bao, Y.L.; Xiang, H.Y.; Li, Y.L.; Yu, C.J.; Wang, Y.C. Study of wind–vehicle–bridge system of suspended monorail during the meeting of two trains. Adv. Struct. Eng. 2019, 22, 1988–1997. [Google Scholar] [CrossRef]
- Zou, Y.; Liu, Z.; Shi, K.; Ou, S.; He, X.; Deng, H.; Zhou, S. Experimental study of aerodynamic interference effects for a suspended monorail vehicle–bridge system using a wireless acquisition system. Sensors 2021, 21, 5841. [Google Scholar] [CrossRef]
- Saltelli, A.; Tarantola, S.; Chan, K. A quantitative model-independent method for global sensitivity analysis of model output. Technometrics 1999, 41, 39–56. [Google Scholar] [CrossRef]
- Qin, S.; Han, S.; Li, S. In-situ testing and finite element model updating of a long-span cable-stayed bridge with ballastless track. Structures 2022, 45, 1412–1423. [Google Scholar] [CrossRef]
- Moore, J.C.; Glenncross-Grant, R.; Mahini, S.S.; Patterson, R. Regional timber bridge girder reliability: Structural health monitoring and reliability strategies. Adv. Struct. Eng. 2012, 15, 793–806. [Google Scholar] [CrossRef]
- Tubaldi, E.; Tassotti, L.; Dall’Asta, A.; Dezi, L. Seismic response analysis of slender bridge piers. Earthq. Eng. Struct. Dyn. 2014, 43, 1503–1519. [Google Scholar] [CrossRef]
- GB/T 5599-2019; Specification for Dynamic Performance Assessment and Testing Verification of Rolling Stock. State Administration for Market Regulation; Standardization Administration of PRC: Beijing, China, 2020.
Disclaimer/Publisher’s Note: The statements, opinions and data contained in all publications are solely those of the individual author(s) and contributor(s) and not of MDPI and/or the editor(s). MDPI and/or the editor(s) disclaim responsibility for any injury to people or property resulting from any ideas, methods, instructions or products referred to in the content. |
© 2024 by the authors. Licensee MDPI, Basel, Switzerland. This article is an open access article distributed under the terms and conditions of the Creative Commons Attribution (CC BY) license (https://creativecommons.org/licenses/by/4.0/).