Article

Seismic Isolation Layout Optimized of Mid-Rise Reinforced Concrete Building Frame Structure

by
Shengkun Liu
1,
Zhidong Chen
1,2 and
Yongdou Liu
1,2,*
1
College of Civil Engineering and Hydraulic Engineering, Qinghai University, Xining 810016, China
2
Qinghai Provincial Key Laboratory of Building Energy-Saving Materials and Engineering Safety, Xining 810016, China
*
Author to whom correspondence should be addressed.
Buildings 2024, 14(7), 2172; https://doi.org/10.3390/buildings14072172
Submission received: 3 June 2024 / Revised: 30 June 2024 / Accepted: 8 July 2024 / Published: 15 July 2024
(This article belongs to the Special Issue Damping Control of Building Structures and Bridge Structures)

Abstract

:
Seismic isolation technology plays a crucial role in enhancing earthquake resistance and mitigating disasters for building structures. In this study, the ETABS analysis software V21.0.1 is utilized to establish a numerical model of a six-story steel reinforced concrete frame structure. Both the time-history analysis method and response spectrum method are employed to calculate the seismic response of the model under earthquake actions. The placement of an isolation layer on the foundation and from the first to fifth floor is considered, with separate calculations conducted for each scenario. Subsequently, a comprehensive comparison and analysis of the dynamic response characteristics among different design schemes are performed. The results demonstrate that the most favorable isolation effect is achieved when the isolation layer is implemented on the foundation or first floor. Compared to non-isolated structures, the natural period of the structure can be extended by 2.2 times and 2 times under the base isolation and first-floor top isolation schemes, respectively. The damping coefficients can reach 0.35 and 0.36, respectively, while the inter-story drift angles can be reduced by 66% and 67%, respectively.

1. Introduction

Base isolation technology was initially developed by Japanese scholar [1] Kozo Kawai, who utilized round logs as foundations to diminish the transfer of seismic forces to building structures. In 1906, the idea of constructing base-isolated houses was proposed [2]. In 1909, J.A. Calantarients introduced a technique of installing a layer of talc or mica between the foundation and the building as a means of vibration isolation [1]. Since the 1960s, experts from countries experiencing frequent earthquakes, such as New Zealand, Japan, and the United States, have undertaken comprehensive theoretical and experimental studies on base isolation systems, achieving significant outcomes [3,4,5]. In the early 1970s, scholars in New Zealand developed reliable, economical, and practical base isolation components—lead-core rubber bearings [6,7,8]—significantly advancing the practical application of base isolation technology. By the mid-1970s, approximately 400 buildings with rubber bearing base isolation systems were constructed in the United States and Japan, marking the transition to the broader application phase of this technology.
In recent years, scholars around the world have conducted extensive and in-depth research on base isolation and inter-story isolation technologies, making this field a hot topic in the discipline of civil engineering [9,10,11,12,13]. Lushun Wei and Fulin Zhou developed a novel three-dimensional isolation bearing [14], composed of connectors, vertical isolation bearings, and horizontal isolation bearings. Studies have shown that this bearing significantly attenuates high-frequency vibration signals. Chunwei Zhang developed a low-cost friction isolation system that can be used between the foundation and the superstructure [15]. Abdeddaim, Mahdi enhanced the performance of base-isolated buildings by placing magnesium rheological damper between the structure’s foundation and base [16]. Vasant A. Matsagar modified architectural structures with base isolation devices and conducted seismic response analyses [17]. Yong Yuan et al. studied the seismic performance of rubber isolation bearings, finding that natural rubber bearings provide effective isolation on buildings [18]. Qiang Pei et al. examined the mechanical properties of thick-layered epoxy rubber isolation bearings, demonstrating that these devices have stable deformation capabilities and distinct damping characteristics [19]. Currently, there are many types of isolation bearings available, with lead-core rubber (LRB) bearings being extensively used in seismic isolation for buildings and bridges [20,21,22,23,24].
Inter-story isolation involves placing an isolation layer between structural floors, which typically has a much lower horizontal stiffness compared to base isolation schemes. Fulin Zhou et al. [25] established a two-mass simplified model and a multi-mass dynamic time-history analysis model for inter-story isolation systems, proposed methods for optimizing the design of isolation layer parameters, and systematically studied the seismic mitigation mechanisms of the inter-story isolation system when the position of the isolation layer changes. Shiang-Jung Wang et al. used a three-mass model to simplify the analysis of mid-rise building isolation models [26]. Xiangzhen Li et al. [27] simplified the buildings with an inter-story isolation layer, dividing the structures below and above the isolation layer into two substructures for dynamic response calculation and time-history analysis. Katsuhide Murakami et al. used a two-mass model to analyze the seismic response of inter-story isolated building structures [28]. Keri L. Ryan et al. systematically studied the effectiveness of inter-story isolation systems as a function of their position and explored alternative methods for selecting their properties [29].
Several scholars have optimized isolated and damped structures through software simulations. F. Kazemi et al. [30] employed machine learning (ML) methods to simulate the structural response of various reinforced concrete (RC) frame structures under seismic loads. They used the dynamic incremental analysis method to estimate the seismic ultimate state capacity and performance of both existing and newly constructed RC buildings, optimizing the seismic response design of non-isolated structures. Arash Rayegani et al. [31] improved seismic control optimization by simulating a four-story high-damping rubber bearing isolated building, where magnetorheological (MR) dampers in the hybrid isolation system were used as adaptive energy dissipation devices. They employed an improved and optimized interval Type-2 fuzzy logic controller to reduce the possibility of impact. Additionally, Arash Rayegani and Gholamreza Nouri [32] considered the impact effects under different gap distances and developed a model of an isolated building equipped with MR dampers. They used a multi-objective optimization method to optimize the fuzzy logic control of the dampers at various gap distances. The results showed that the optimized semi-active control system could effectively prevent building impact and improve the structural performance compared to isolated and non-isolated conditions at certain gap distances. Navid Rahgozar et al. [33] utilized OpenSees software to establish a vertically isolated rocking core moment frame (VI-RCMF). They proposed an optimization framework to quantify the optimal design parameters of VI-RCMFs using the simultaneous perturbation stochastic approximation (SPSA) method. The derived optimal design vectors can be used for the preliminary design of low- to mid-rise prototype buildings, providing effective initial design guidelines for practical engineering. Software modeling and optimization design offer valuable guidance for practical engineering by better quantifying some uncertain influencing factors. Extensive research has been conducted on base isolation and inter-story isolation; however, comparative analyses of their effectiveness in seismic isolation for multi-story reinforced concrete frame structures are relatively scarce.
Most studies primarily focus on the mechanism of base isolation or inter-story isolation, without quantitatively comparing the effects of various isolation schemes using specific data results. The research emphasis has been on the improvement and optimization of isolation bearings. This paper conducts a quantitative comparative study of multiple isolation schemes for both base isolation and inter-story isolation. It clearly points out that changes in the position of the isolation bearings can affect the isolation effectiveness and provides the optimal isolation scheme. This paper utilizes the ETABS analysis software to develop a numerical model of a six-story reinforced concrete frame structure. Isolation layers were implemented at the tops of the foundation and floors from one to five separately. The natural periods of each isolation scheme were computed, enabling a quantitative comparison of their seismic isolation effects. The effectiveness of each isolation scheme was further assessed and analyzed by comparing three key indexes: horizontal seismic influence coefficients, inter-story shear forces, and inter-story drift ratios.

2. Methodology of Seismic Isolation

2.1. Principles of Horizontal Seismic Isolation

Seismic isolation technology in buildings involves the installation of isolation devices with relatively low lateral stiffness and high deformation capacity at the base or at a certain height of the structure. This is performed to reduce the energy input from seismic actions to the upper floors, thereby diminishing the seismic response of these floors [34]. A schematic of the seismic isolation principle is shown in Figure 1. The horizontal seismic forces that the building structure withstand are represented by
F = α W
where α is the seismic influence coefficient, dimensionless, and its curve is shown in Figure 2; W is the gravity of the structure; F represents the horizontal seismic action [35]. Typically, most mid-rise building structures have natural periods around Tg, which leads to a significant seismic influence coefficient (see Figure 2) and further results in a large horizontal seismic action. By incorporating a seismic isolation system, the natural period of the isolated structure can be extended to near T (see Figure 2), significantly reducing the seismic influence coefficient α. This reduction substantially decreases the forces exerted on the upper structures.
Seismic isolation systems are characterized by the following fundamental features: high vertical stiffness, low and variable horizontal stiffness, and the ability to provide substantial damping. These systems possess sufficient vertical strength and stiffness to support the weight of the superstructure. Additionally, seismic isolation systems exhibit enough initial horizontal stiffness to keep the superstructure stationary relative to the ground under wind loads and minor seismic events, ensuring the system remains within the elastic range to meet normal operational requirements. During moderate and strong earthquakes, the horizontal stiffness is relatively low, making the structure a flexible system. Since the horizontal stiffness of the isolation devices is significantly lower than the inter-story horizontal stiffness of the superstructure, the displacements of the superstructure during an earthquake are primarily concentrated at the isolation layer, which undergoes significant deformation, dissipating most of the seismic energy. In this way, the horizontal displacements of the superstructure are reduced significantly, thereby maintaining the superstructure predominantly in an elastic state. During an earthquake, the superstructure undergoes slow, long-period horizontal translational movements, allowing the isolated structure to slowly “translate horizontally” as a unit. After the earthquake, the superstructure can recover to its initial state, meeting normal usage requirements. The isolation system itself has substantial damping capacity, capable of dissipating enough energy during an earthquake to significantly reduce the seismic energy absorbed by the superstructure.

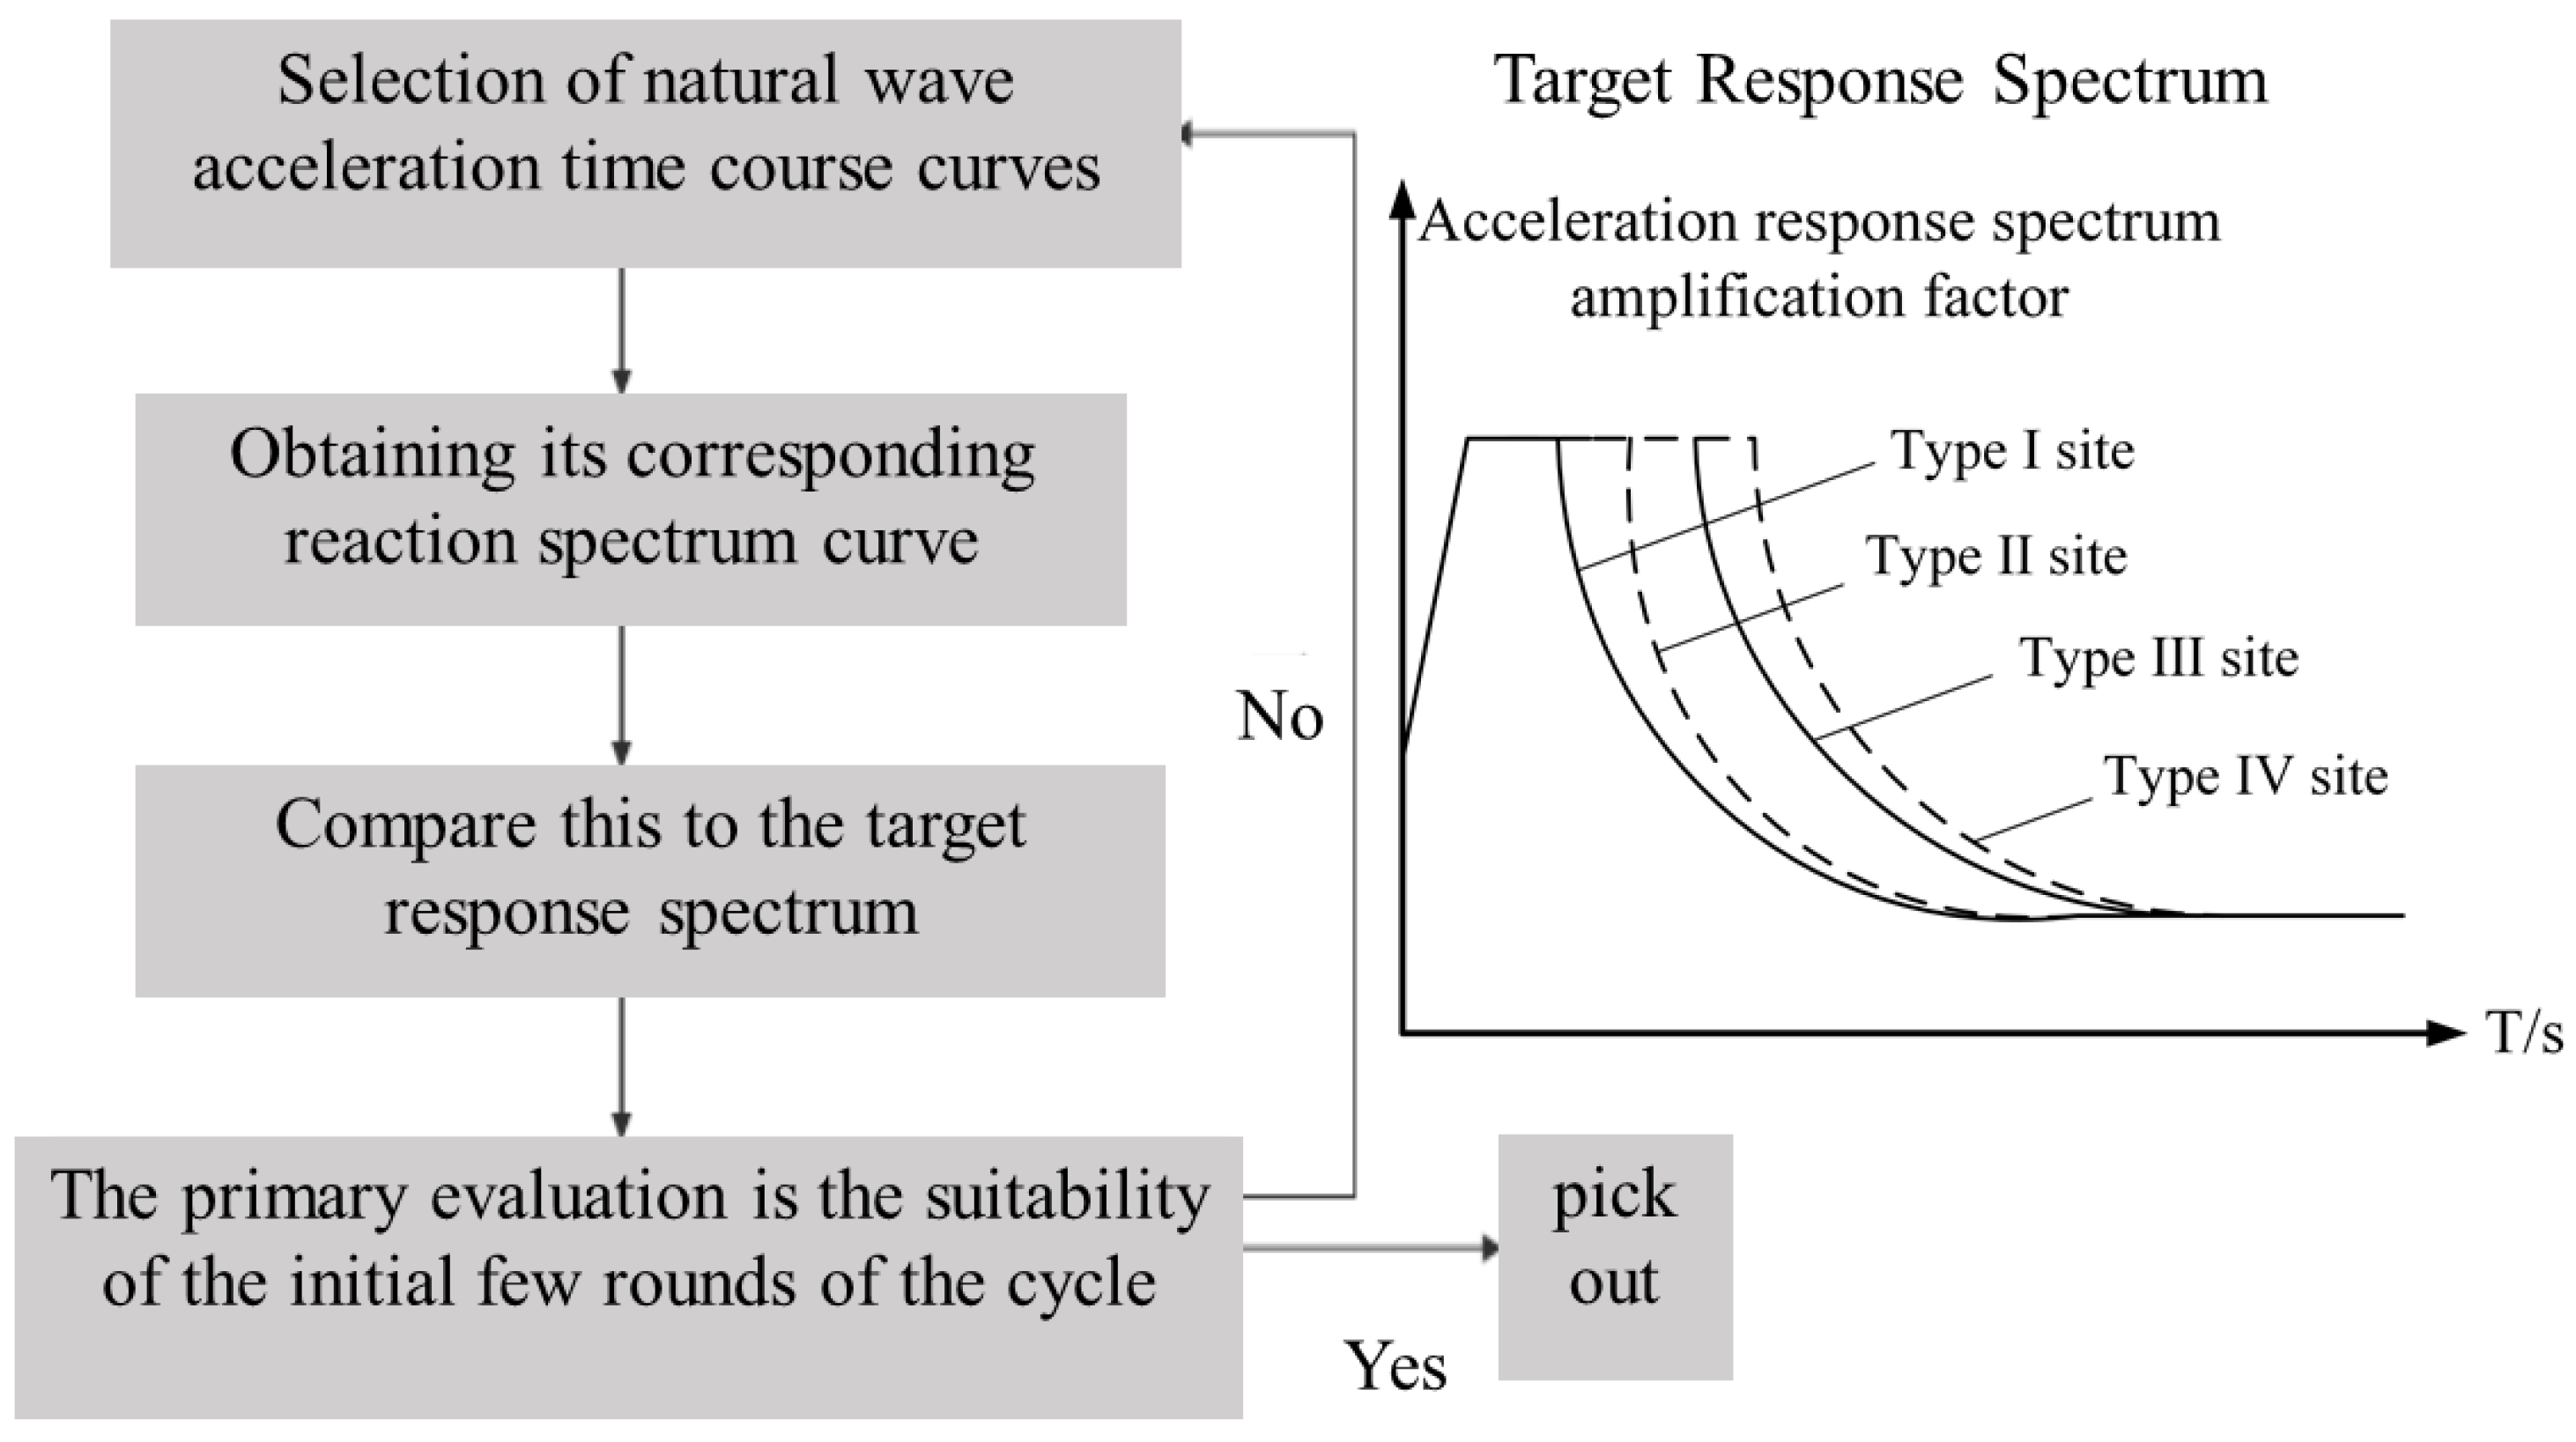
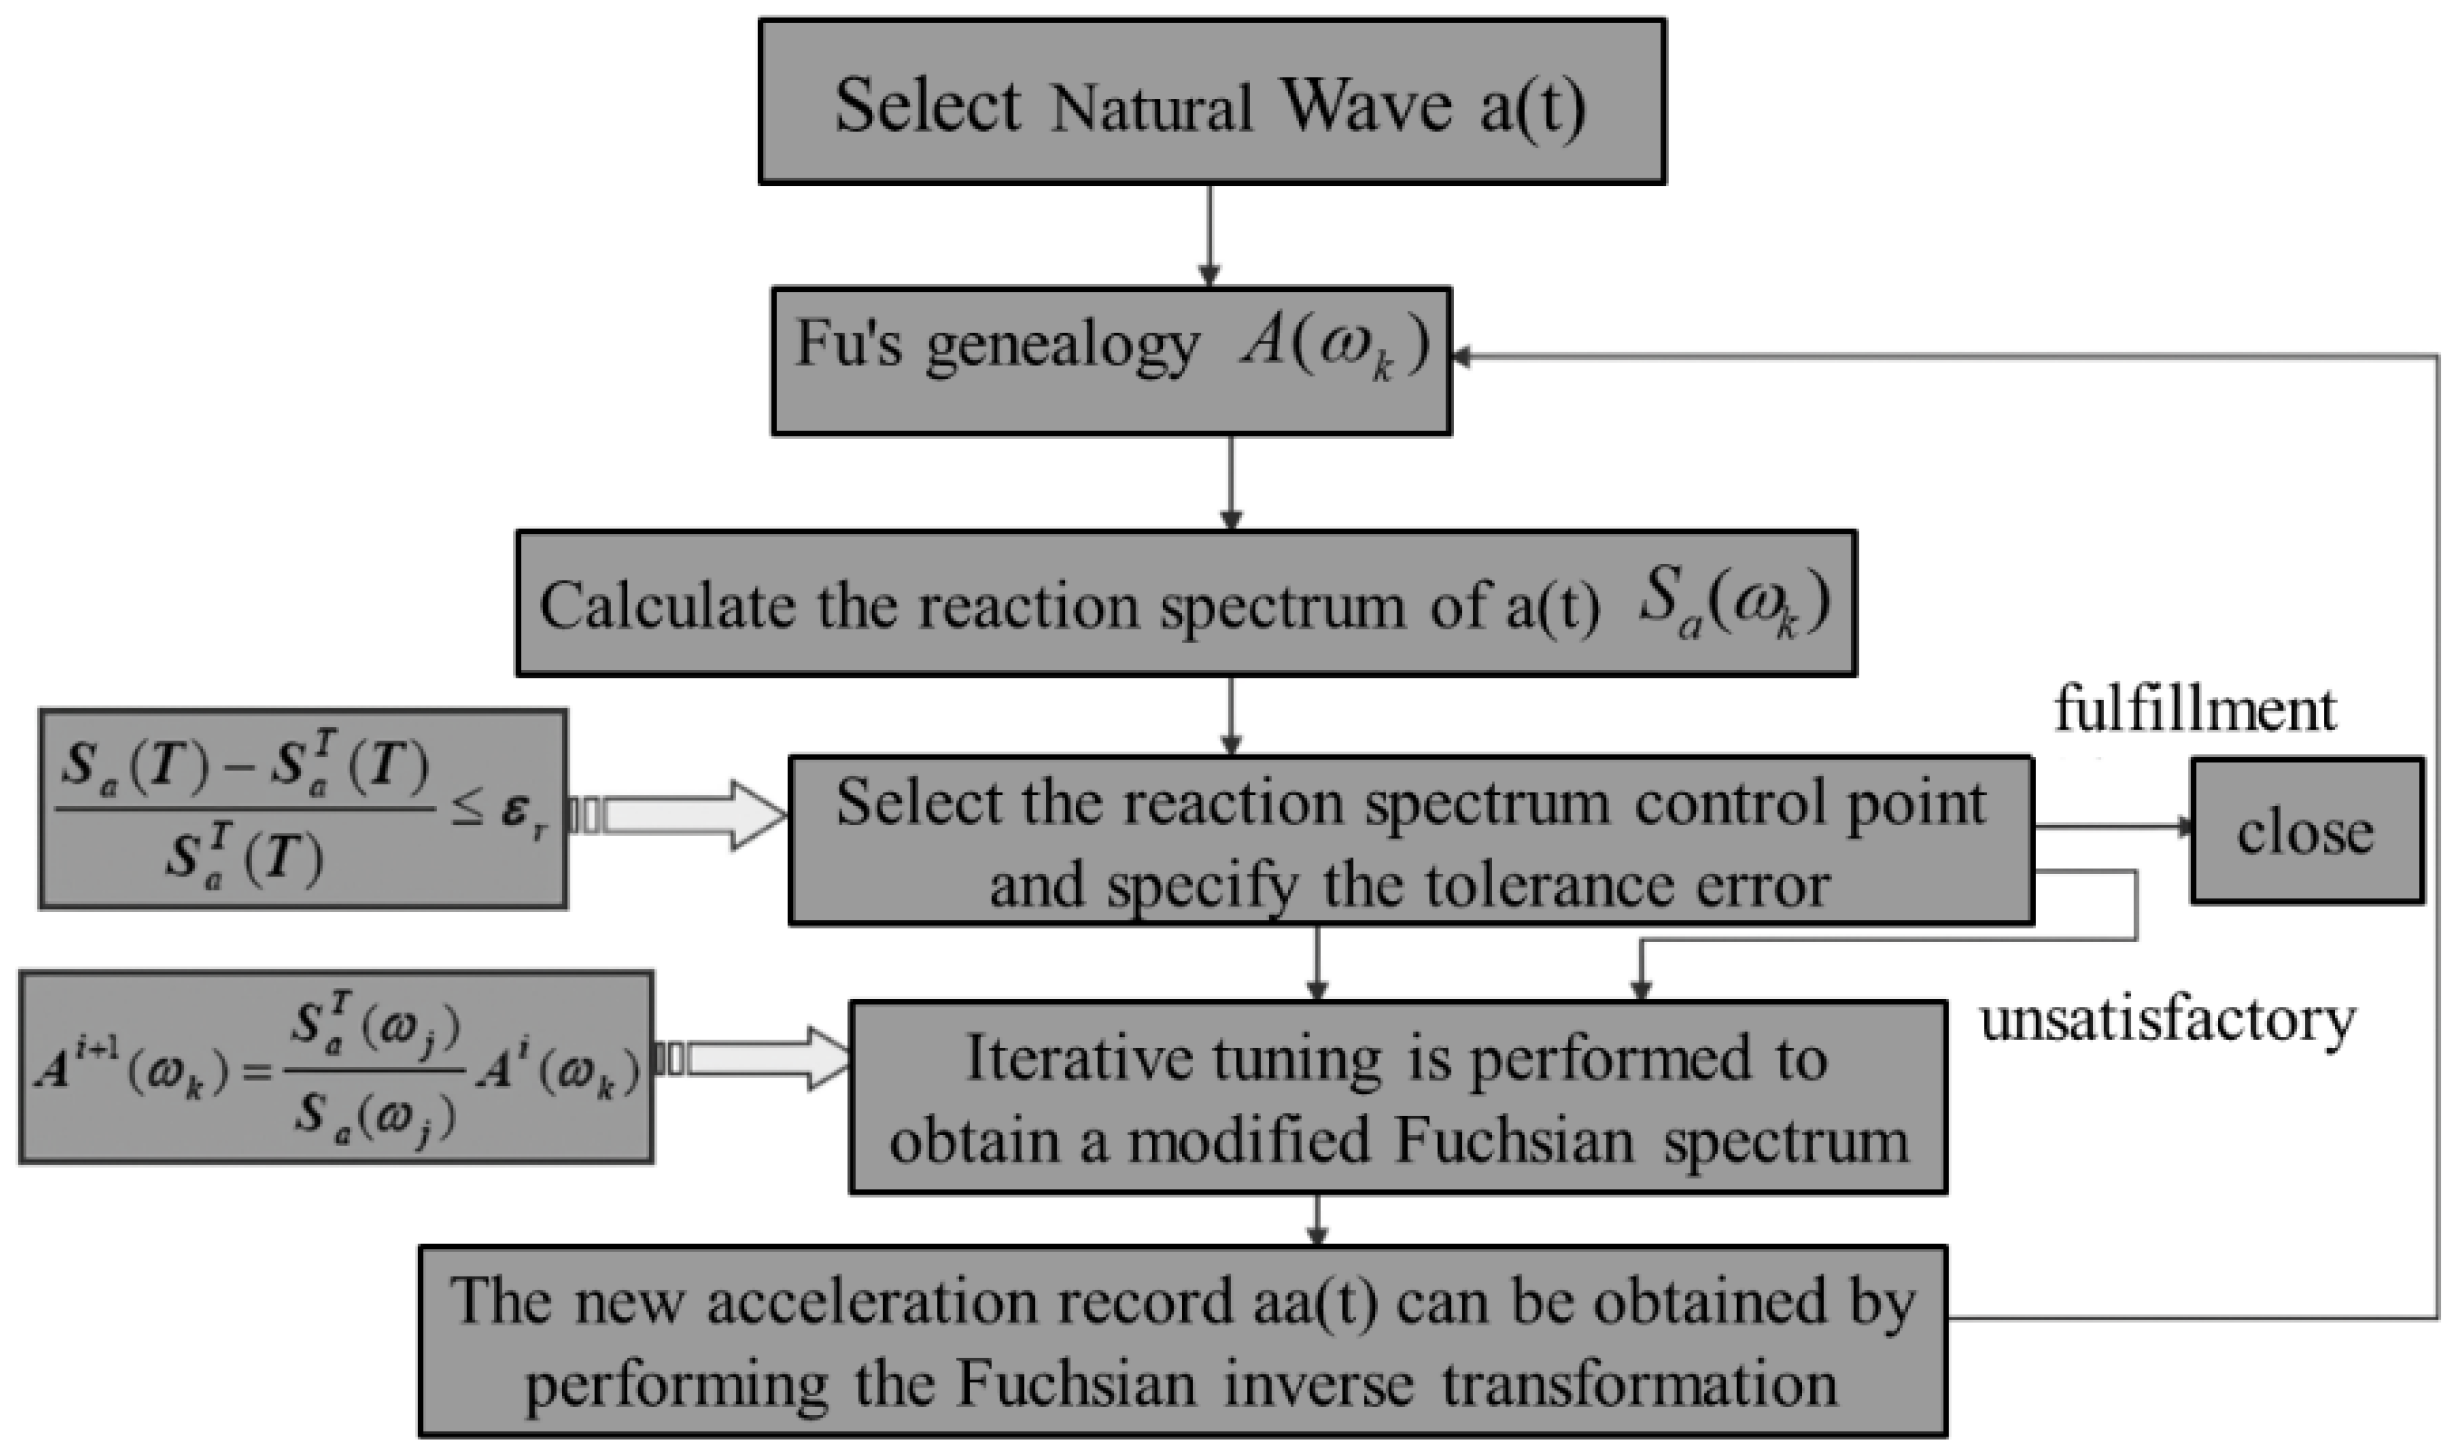
2.2. Selection of Seismic Time History

According to the Code for Seismic Design of Buildings (GB 50011-2010) [35], when using the dynamic time-history response analysis method, it is required to select no fewer than two sets of actual strong-motion records and one set of artificially simulated acceleration time-history curves based on the building site category and seismic design grouping. The engineering background of the building structure in this paper is a six-story student dormitory with a height of 22.5 m located in Haikou City, Hainan Province. For the reference building in this study, three sets of actual strong-motion records and one set of artificially simulated acceleration time-history curves are adopted to obtain relatively reliable and rational results. The selected seismic waves in this study are all far-field earthquakes, with PGA/PGV values around 6.0. The amplitude of the acceleration time-history curve for frequent earthquakes is 1.4 m/s2. To achieve the desired acceleration amplitude, we normalized the four earthquake waves. Then, we scaled them according to the PGA, amplifying the normalized seismic sequences to 1.4 m/s2 to achieve the desired seismic effect, and the scaling of the records is 1.4. The three essential characteristics of seismic waves are amplitude, spectral characteristics, and duration. The amplitude is determined by the peak acceleration and the design seismic intensity, while the spectral characteristics are considered through the site’s predominant period and the distance from the epicenter. The durations are typically selected in the range from 5T to 10T. The term T denotes the first natural period of the analyzed building structure, which is approximately 0.7 s for the building adopted in this study. The Tangshan and El Centro waves are selected as natural waves, with the selecting procedures shown in Figure 3. The time history of accelerations for the selected seismic waves are shown in Figure 4. The duration of all the selected natural waves exceeds 20 s.
The simulation of artificial earthquake waves employs the trigonometric series method, using a set of trigonometric series to construct a stationary Gaussian process with a given power spectral density. This process is then multiplied by an intensity envelope function to produce a non-stationary amplitude seismic acceleration time history. The generation steps for the artificial earthquake waves are illustrated in Figure 5. The artificial earthquake wave produced by this method is depicted in Figure 6. Detailed information of all the seismic records is provided in Table 1. These artificial earthquake waves must meet the following criteria to be applicable for structural dynamic response analysis: under frequent seismic conditions, the base shear calculated from each earthquake wave excitation should not be less than 65% of the results obtained using the modal decomposition response spectrum method, and the average base shear calculated from all the seismic excitations should not be less than 80% of those results. The time-history analysis and response spectrum results are presented in Table 2, which validates the reasonableness of the selected earthquake waves. The default integration method, i.e., Hilber–Hughes–Taylor method, is adopted for the time-history analysis.

3. Response Analysis of Isolation Structures under Seismic Excitation

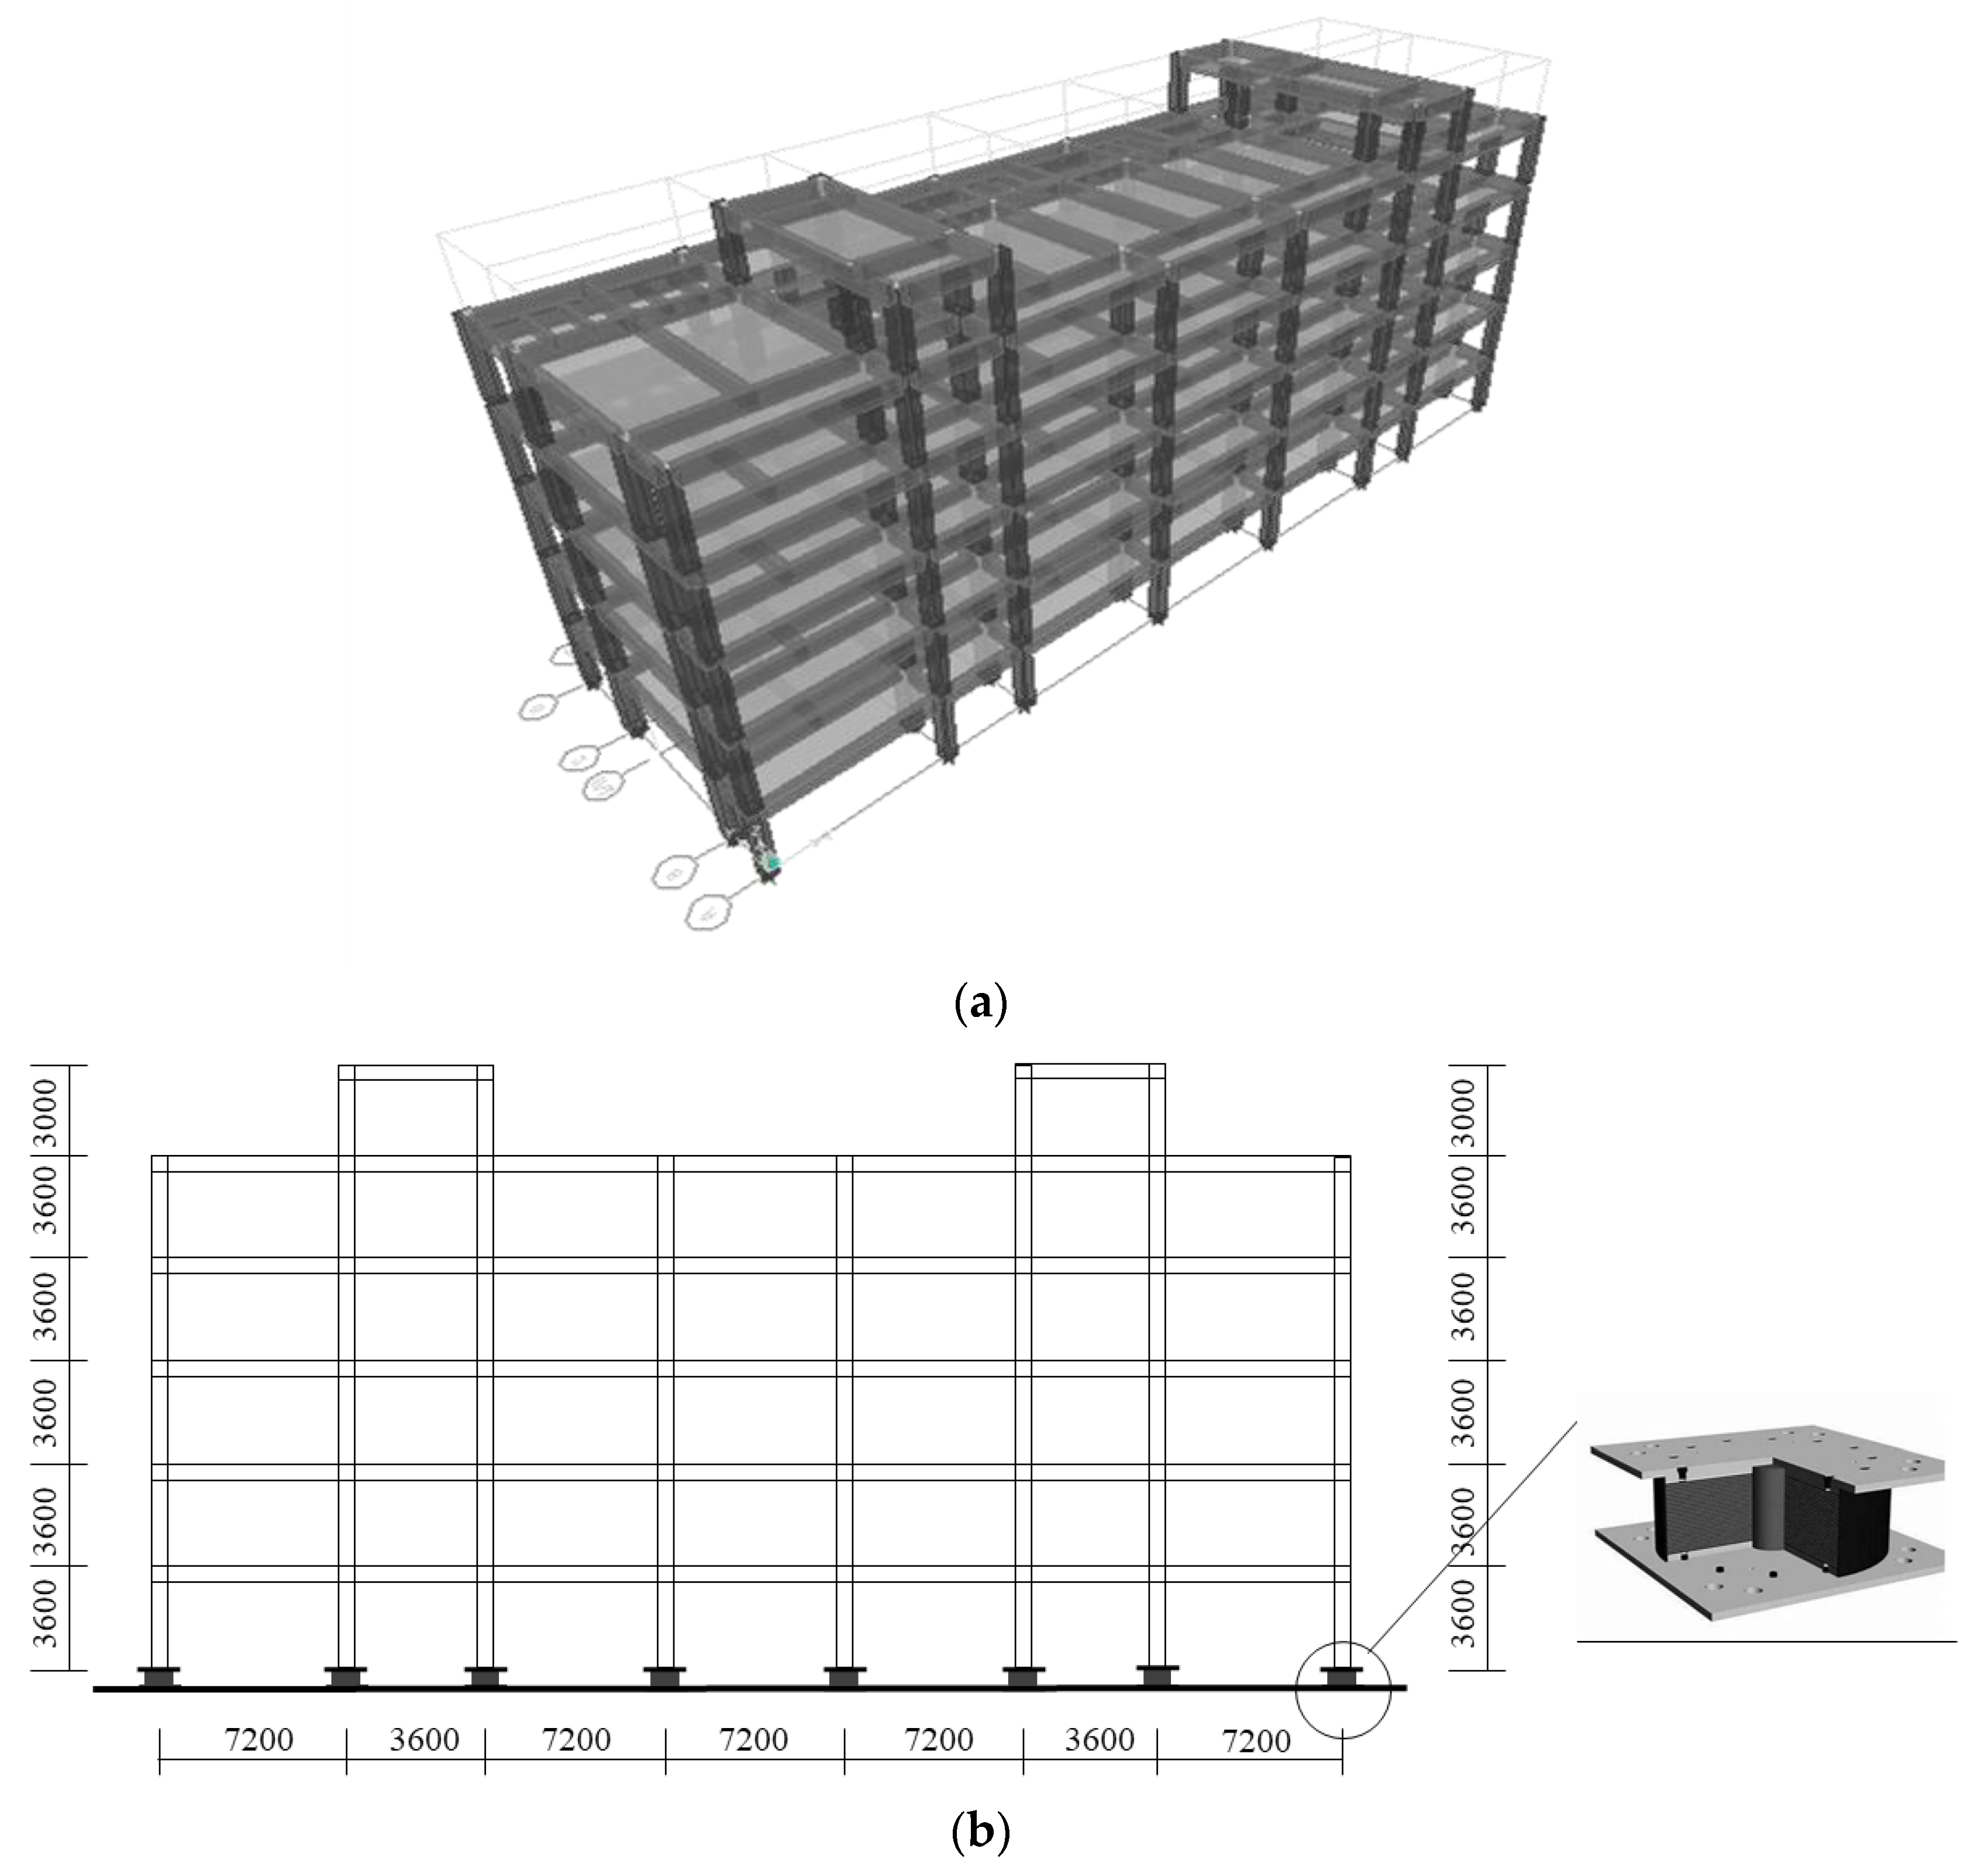
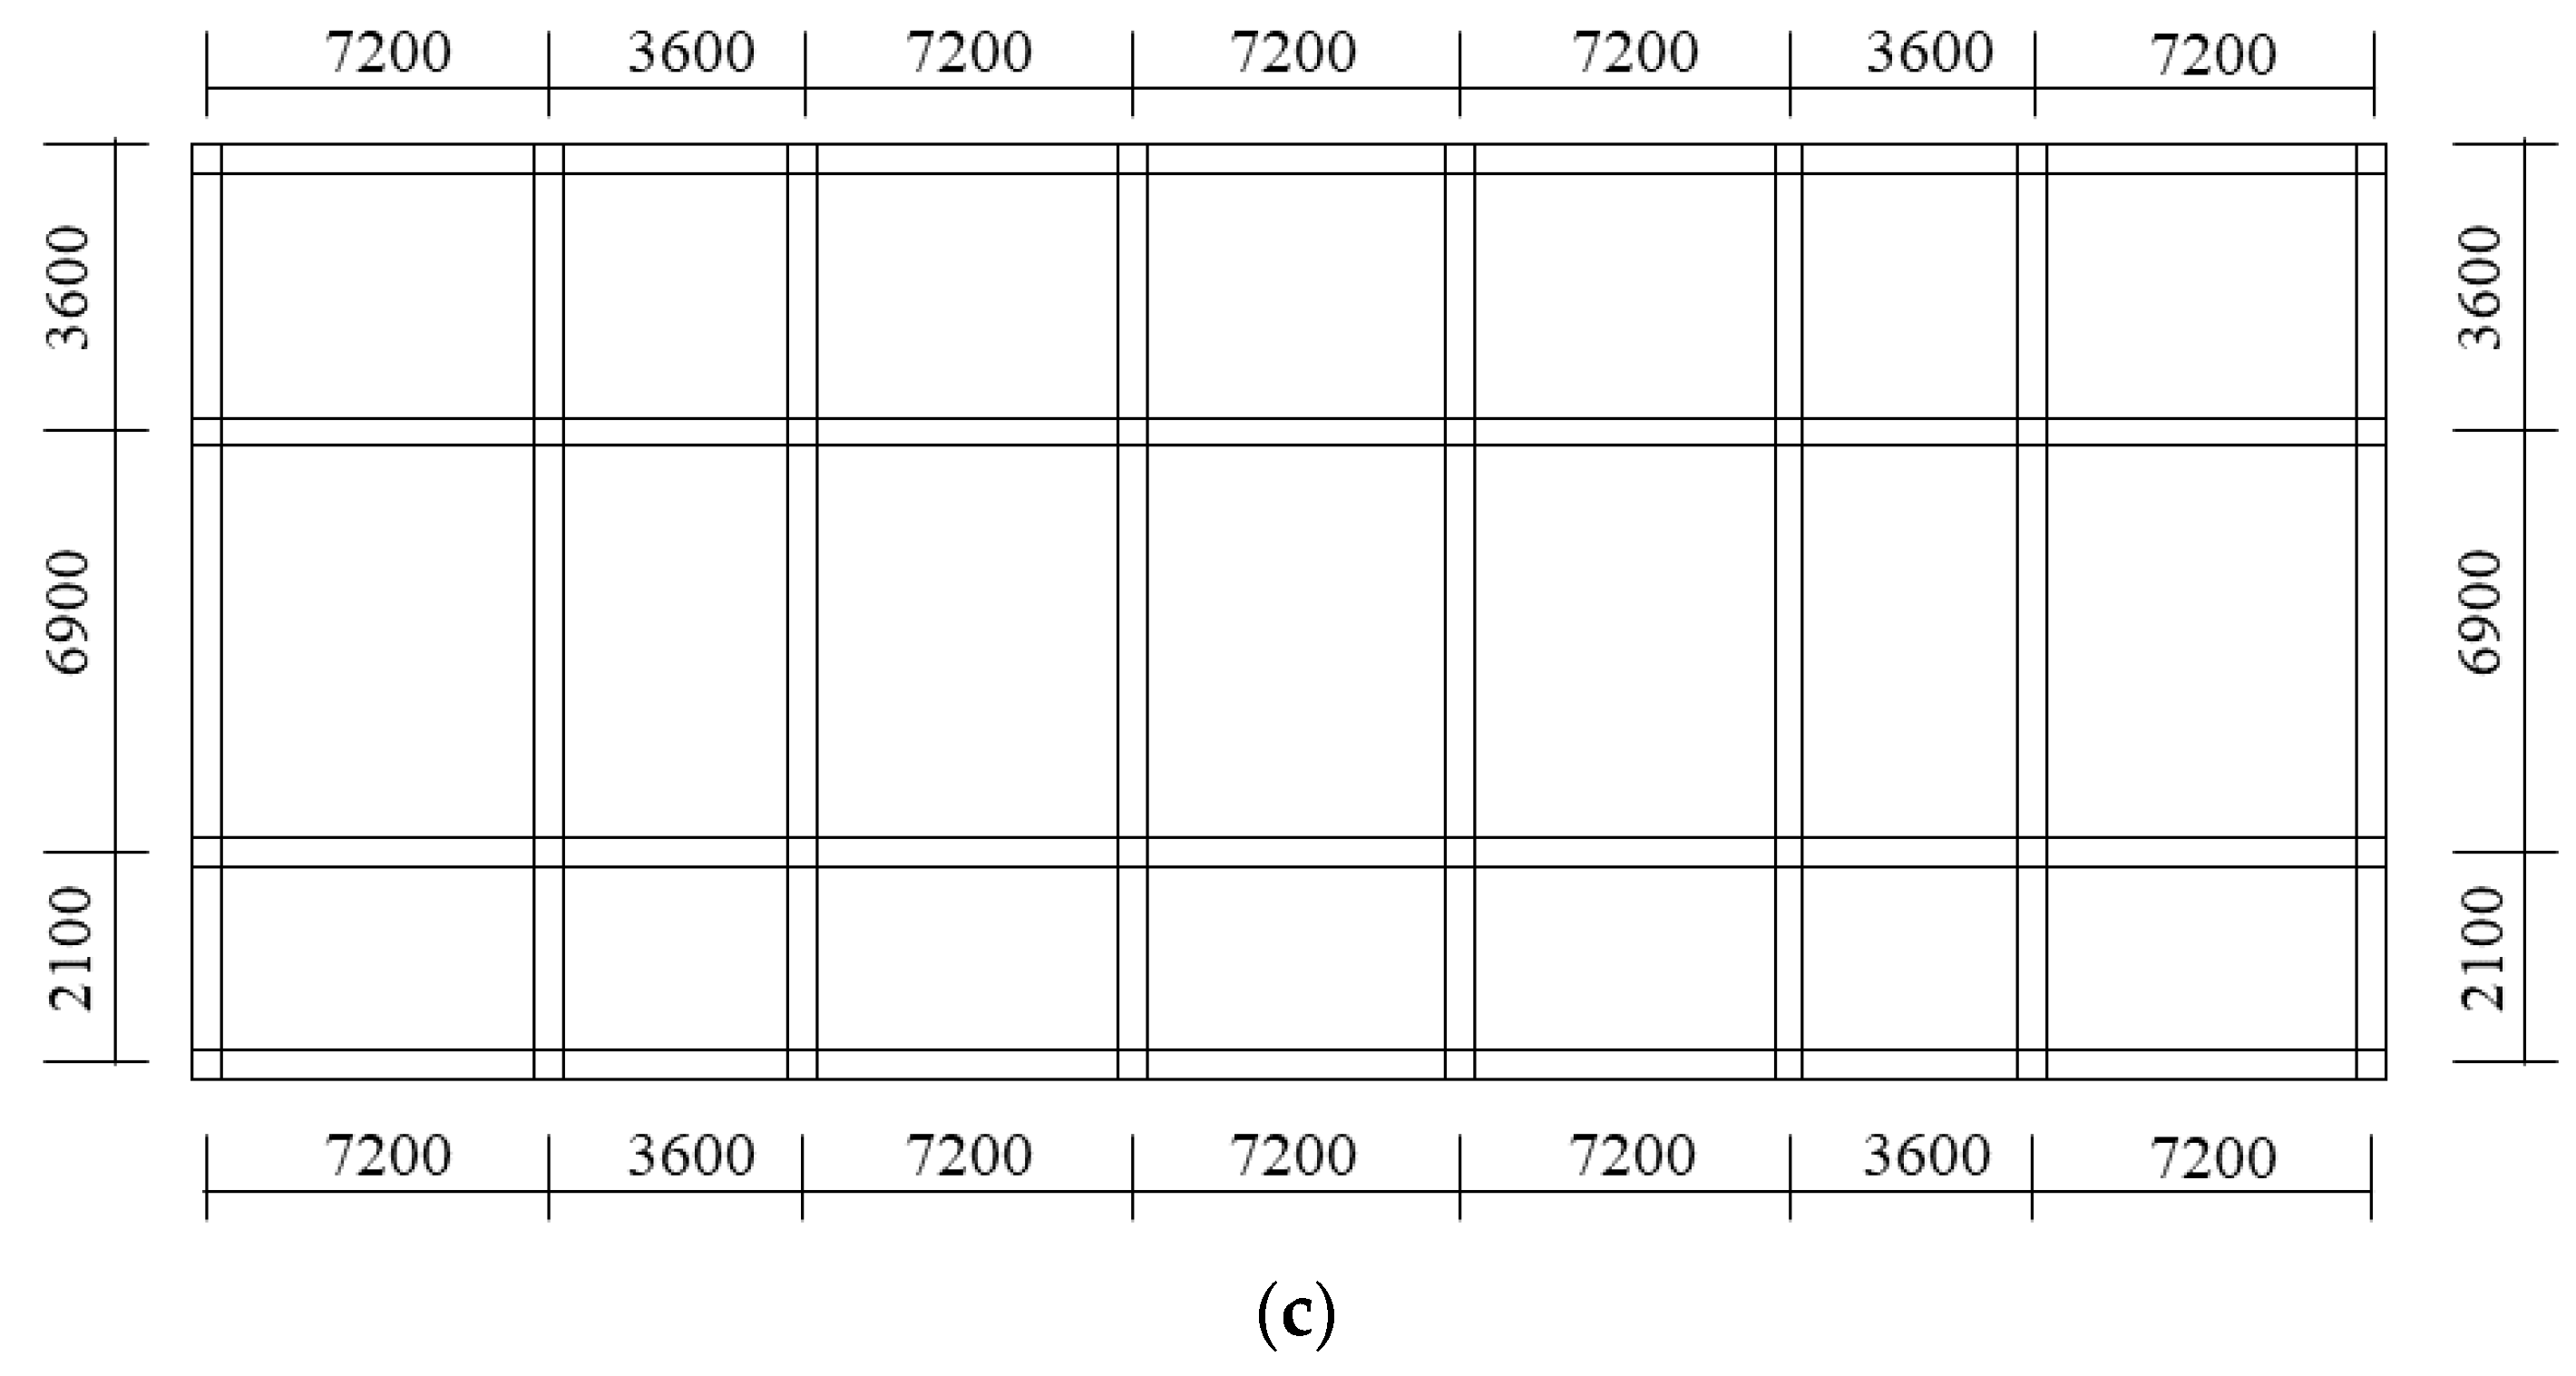
3.1. Structural Modeling

This study focuses on a six-story student dormitory building with a height of 22.5 m located in Haikou City, Hainan Province, analyzing and comparing the horizontal seismic impact coefficients, inter-story shear forces, and inter-story drift ratios under non-isolated conditions and various isolation schemes. The first to fifth floors of the structure have a floor height of 3.6 m. The sixth floor is an architectural protrusion with a floor height of 3 m. The beams, slabs, and columns are all made of C30 concrete. The columns have four different sizes: 600 × 500 mm, 500 × 500 mm, 750 × 550 mm, and 700 × 500 mm. The beams have two different sizes: 750 × 300 mm and 500 × 200 mm. The floor slab thickness is 100 mm, and the roof slab thickness is 120 mm. In this study, C30 concrete is defined as a nonlinear material. The compressive strength strain of the concrete is 0.002219, the ultimate strain is 0.005, and the termination compressive slope is −0.1. The tensile strain of the concrete is neglected. Similarly, the reinforcing steel is also defined as a nonlinear material, with an initial hardening strain of 0.01, an ultimate strain of 0.09, and a termination slope of −0.1. The specific constitutive relationships of the materials are illustrated in Figure 7. The structure is a reinforced concrete frame with a seismic design intensity of IX (0.40 g), situated on a type II site with a characteristic site period (Tg) of 0.40 s. The building is categorized as class B, with a basic wind pressure of 0.75 kN. For a design intensity of IX, the peak ground acceleration for frequently occurring earthquakes is set to be 140 cm/s2, while for rare earthquakes, it is set at 620 cm/s2. The ETABS software is used for numerical modeling, with the spatial beam–column elements adopted to simulate beams and columns, and membrane elements for concrete slabs modeled under the assumption of rigid diaphragms. The building structure contains a total of 482 beam elements and 171 column elements. The elastic modulus of the C30 concrete is 3 × 10⁴ N/mm2, and the Poisson’s ratio is 0.2. The base of the non-isolated model is rigidly connected. The structural damping ratio is 0.05. The time-history analysis type is nonlinear, with a maximum iteration step of 100. For the connection properties, U1 is chosen as a linear connection, while U2 and U3 are chosen as nonlinear connections. Load combinations are obtained according to standard specifications. The foundation isolation frame diagram and the three-dimensional spatial numerical model of the non-isolated condition are shown in Figure 8. The X- and Y-directions refer to the longitudinal and transverse directions of the building structure, respectively.

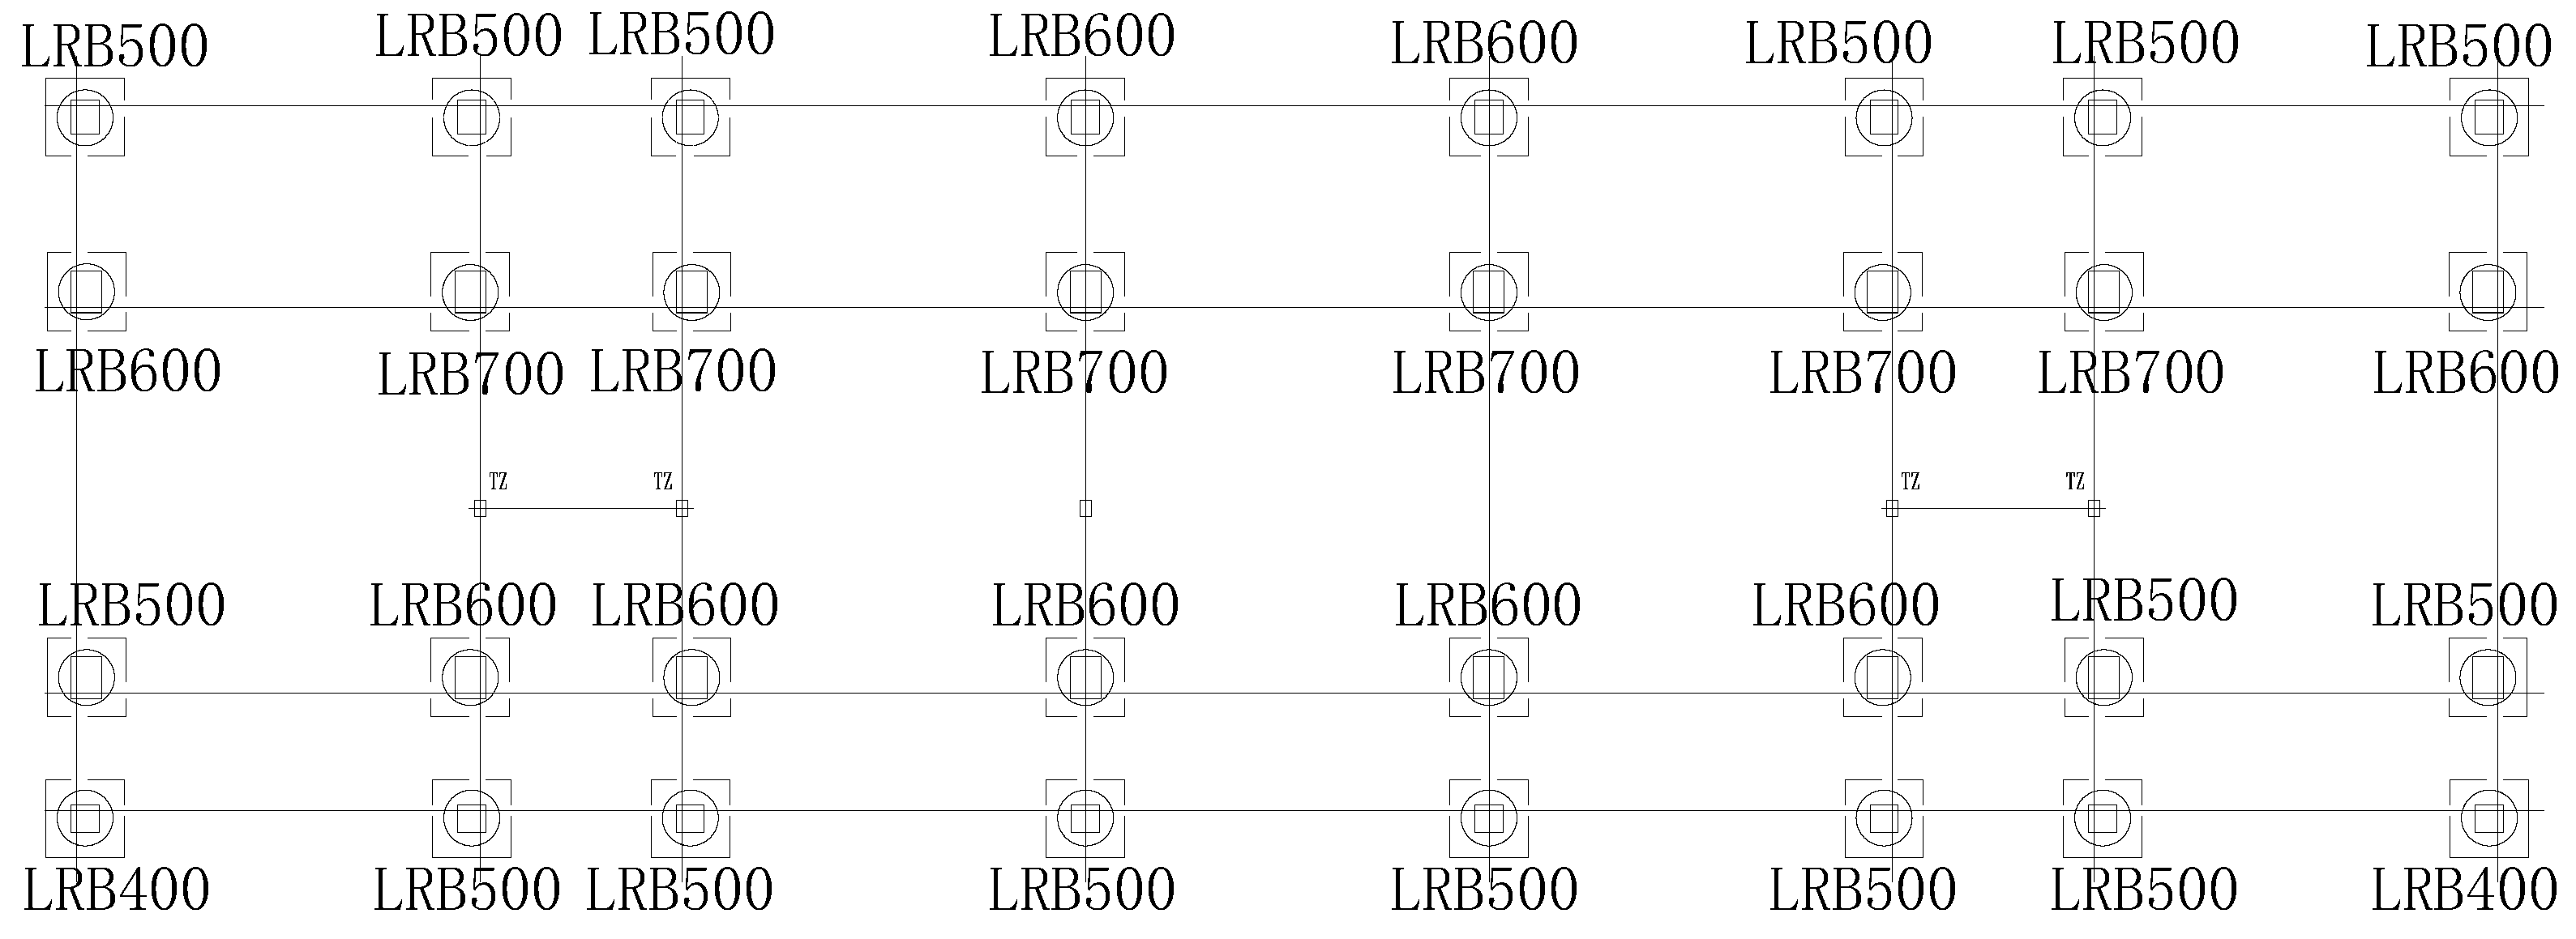
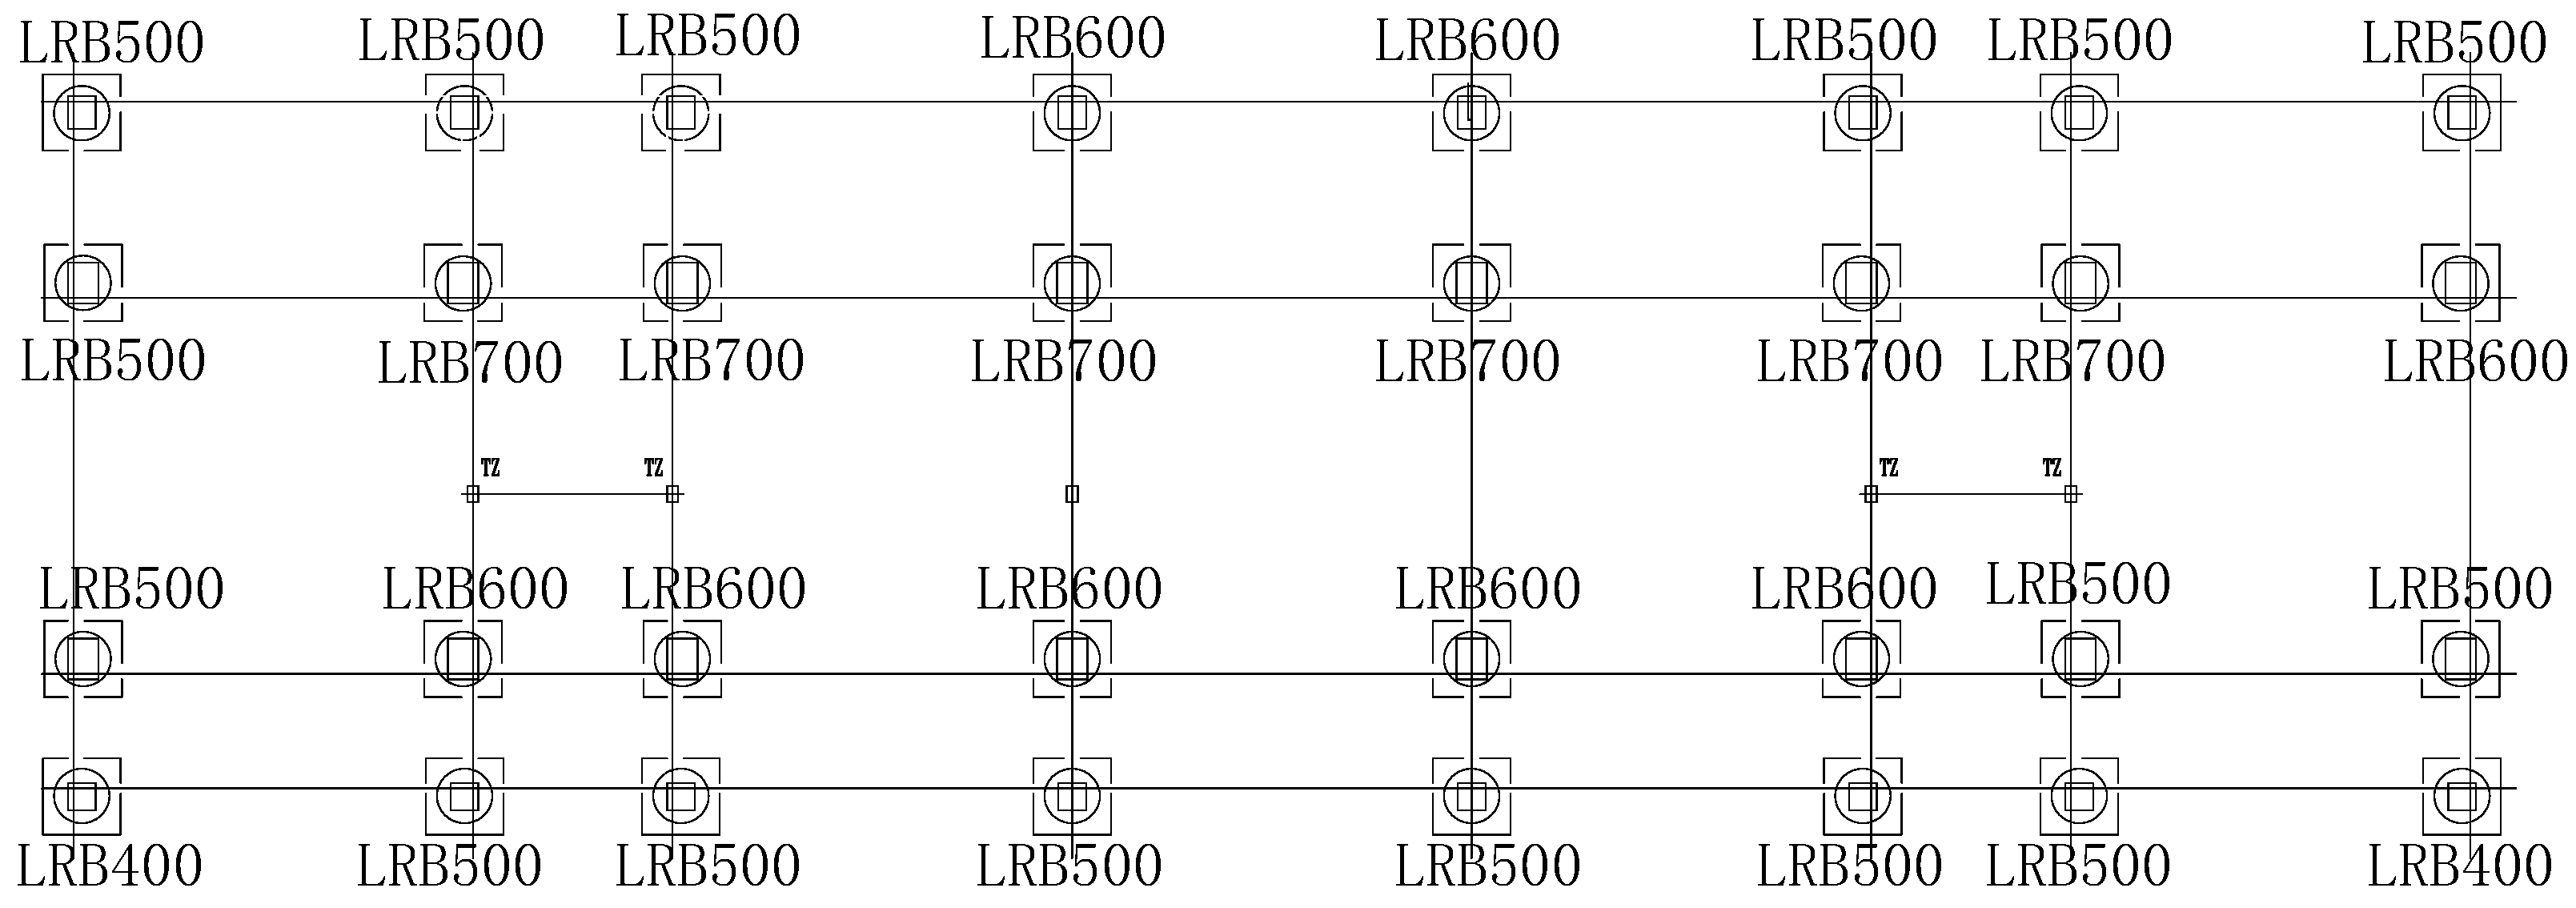
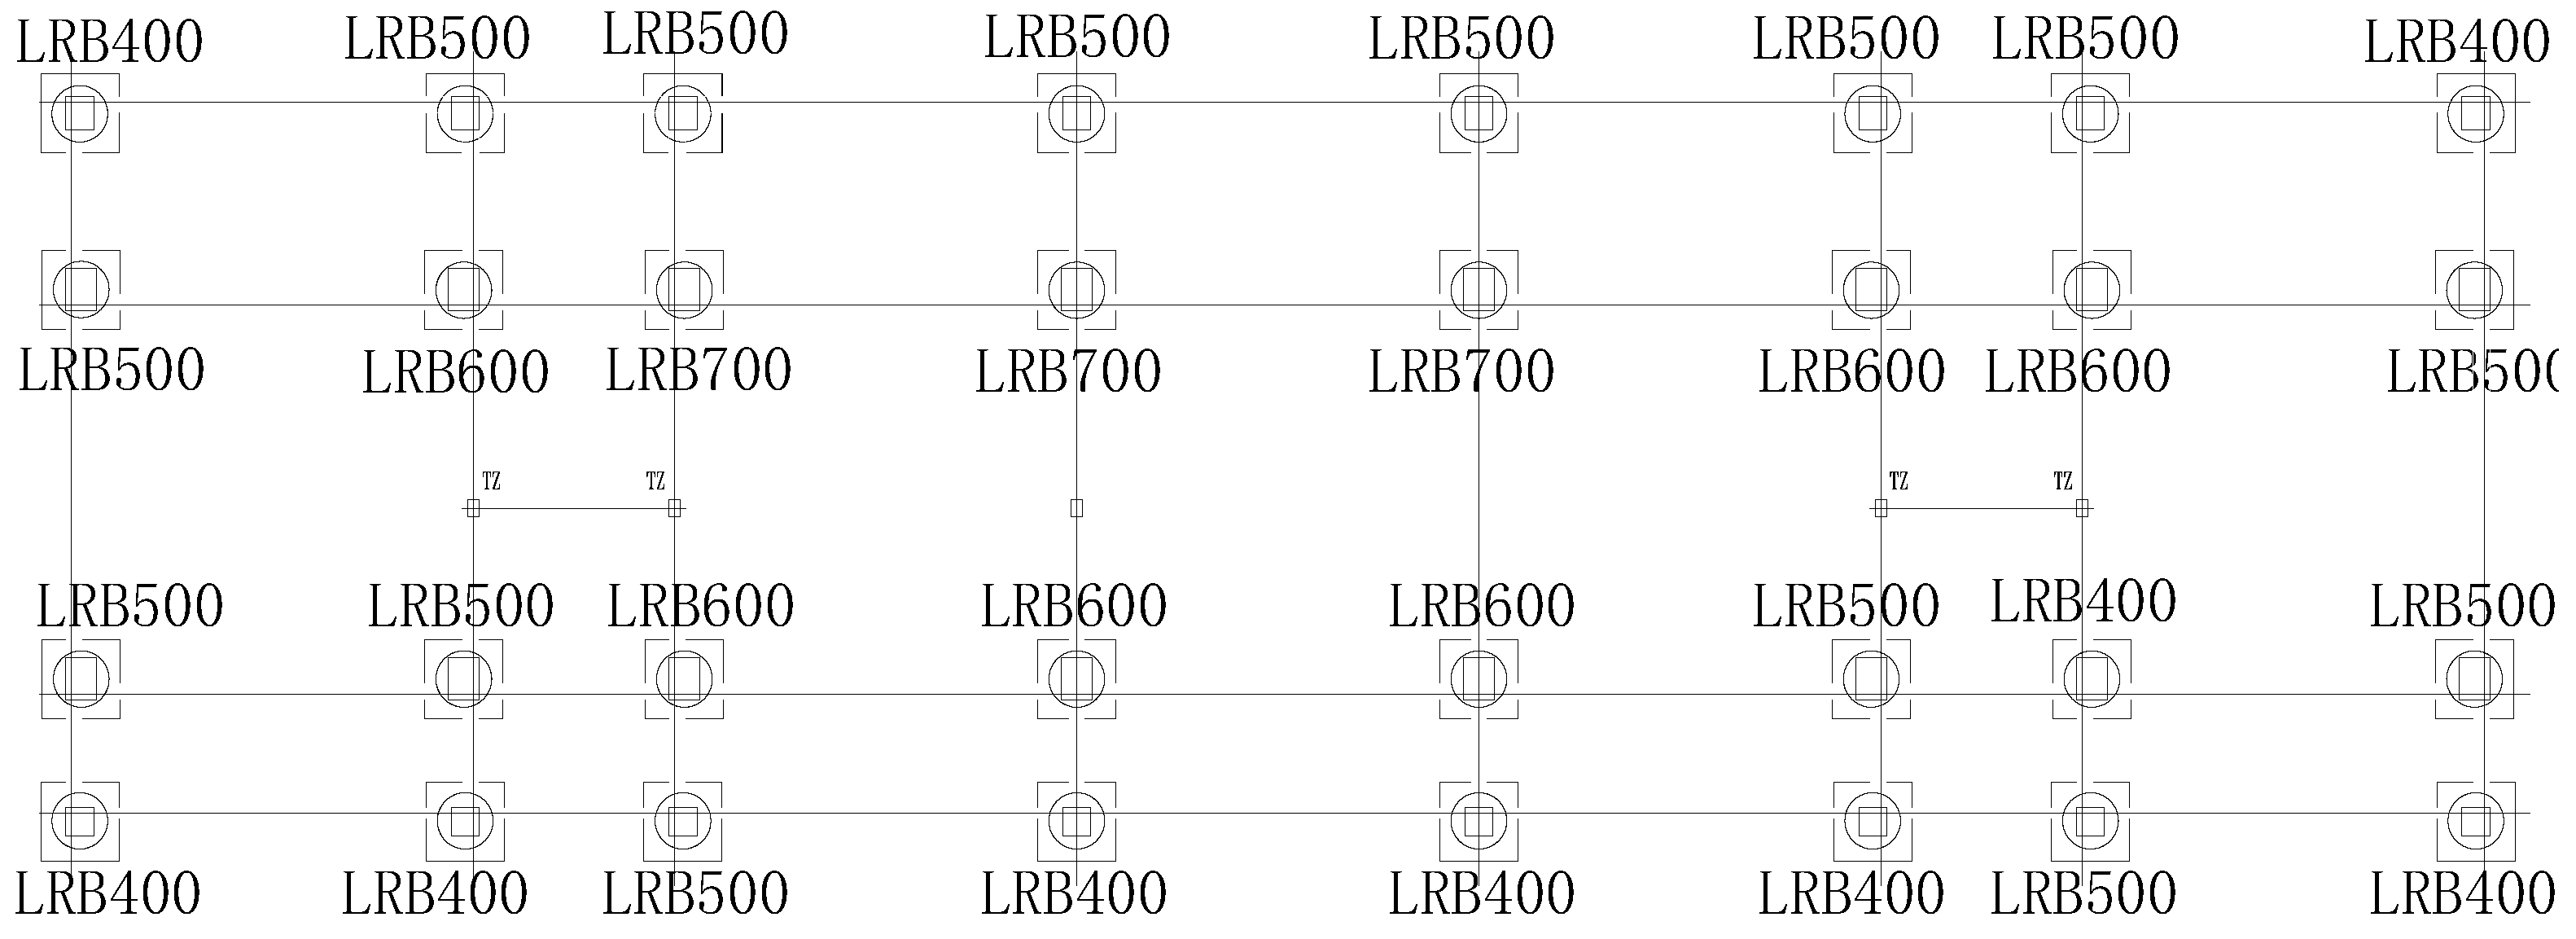
3.2. Seismic Isolation Scheme and Selection of Isolation Bearings

Lead-core rubber bearings (LRBs) are utilized in this study since they confer a variable natural period to the superstructure above the isolation layer. During major seismic events, the natural period of the isolation structure deviates significantly from the site’s predominant period, positioning the structure’s fundamental frequency outside the high-energy frequency band of the earthquake. This effectively reduces the seismic response of the structure. To achieve optimal isolation effects, the isolation layer is placed at the top of the foundation and floors one through five. The layouts of the isolation bearings with respect to all the schemes are shown in Appendix A.
The selection of seismic isolation bearings relies on the maximum axial force combination values of the columns above the isolation layer. These maximum axial force combinations are calculated using ETABS. According to the ”Code for Seismic Design of Buildings” [35], the vertical compressive stress under gravity loads should not exceed 12 MPa for Class B buildings with rubber seismic isolators, that is,
F π D 2 / 4 f
thereby obtain
D 4 F π f
In the equations, the terms D , F , and f represent the diameter of the isolator, the maximum axial force of the isolator actioning on the isolator, and the maximum allowable stress of isolators, which is 12 MPa herein. According to the selection approach described above, the seismic isolators adopted in this study include five types, which are LRB300, LRB400, LRB500, LRB600, and LRB700. Under every seismic isolation scheme, namely base isolation and from first- to fifth-floor isolation schemes, the elevations at the bottom of the isolation layer are 0.00 m, 3.35 m, 6.95 m, 10.55 m, 14.15 m, and 17.75 m, respectively. In all schemes, the height of the isolation layer is consistently 0.25 m.

3.3. Verification of the Rationality of the Isolation Schemes

The isolation schemes determined depending on the vertical load-bearing capacity requirements (see Section 3.2) need to meet the requirements on the inter-story drift angle, horizontal displacement of the isolation layer, and wind resistance. Under rare seismic events, the maximum allowable elastic–plastic inter-story drift angle for the superstructure is 1/50 = 0.02 [35]. By applying bidirectional horizontal seismic input (X:Y = 1:0.85) and using time-history analysis, the inter-story drift angles were obtained under the four seismic waves described in Section 2.2. It should be noted that due to the rigid floor assumption, the entire floor above the isolation layer moves in a horizontal plane as a rigid body; thus, it is sufficient to verify the deformations of the four peripheral isolation bearings. The identification numbers (abbreviated as ID) of these four bearings are 9, 10, 11, and 12. The calculated maximum inter-story drift angles for each scheme are 0.01268, 0.00657, 0.01679, 0.01381, 0.01222, and 0.01013, all of which meet the code requirements. Under rare seismic events, the deformations of the four isolation bearings at the periphery of the isolation layer for each scheme are shown in Table 3. The results in the table indicate that the horizontal displacements of the isolation bearings under rare seismic excitation are all within the allowable limits.
The design of the isolation layer also requires sufficient strength to ensure that it does not fail under the maximum wind load. The basic wind pressure is taken as 0.75 kN/m2, and the wind load can be calculated by
F = 0.75 β z μ s μ z A
where β z is the wind pressure coefficient at height z, taken as 1.0 since the total height of the structure is less than 30 m [36]; μ s is the shape coefficient of the wind load, with values of 0.8 and −0.5 for the windward and leeward sides of the building, respectively, resulting in a combined value of 0.3; μ z is the wind pressure height variation coefficient, which is 1.535 for the building in this study based on ground roughness category A; and A is the windward area above the isolation layer. The design values of the wind load and the bearing capacity calculations for the isolation layer under various isolation schemes are shown in Table 4. The results indicate that all the isolation schemes meet the bearing capacity requirements of the isolation layer under the wind load.

4. Comparison and Analysis of Isolation Effects

4.1. Natural Vibration Characteristics of the Structure

The natural vibration periods for the first five modes of the original structure and the isolated structures are shown in Table 5. It can be seen from the table that, due to the influence of the isolation layer, the natural vibration periods of the structure have increased to varying degrees in all schemes. For example, the first natural vibration period of the original building structure is 0.6416 s. After applying the base isolation and the isolation schemes for the first to fifth stories, the first natural vibration periods increased to 1.6656 s, 1.5054 s, 1.3189 s, 1.1755 s, 1.0307 s, and 0.6843 s, respectively. In terms of the effectiveness of each scheme in increasing the natural vibration periods, the order from strongest to weakest is base isolation, first-story isolation, and second- to fifth-story isolation. It should be noted that the characteristic period T g of the site is 0.4 s. Therefore, based on the principles of seismic isolation (see Section 2.1), it can be preliminarily inferred that the base isolation may achieve the optimal isolation effect.

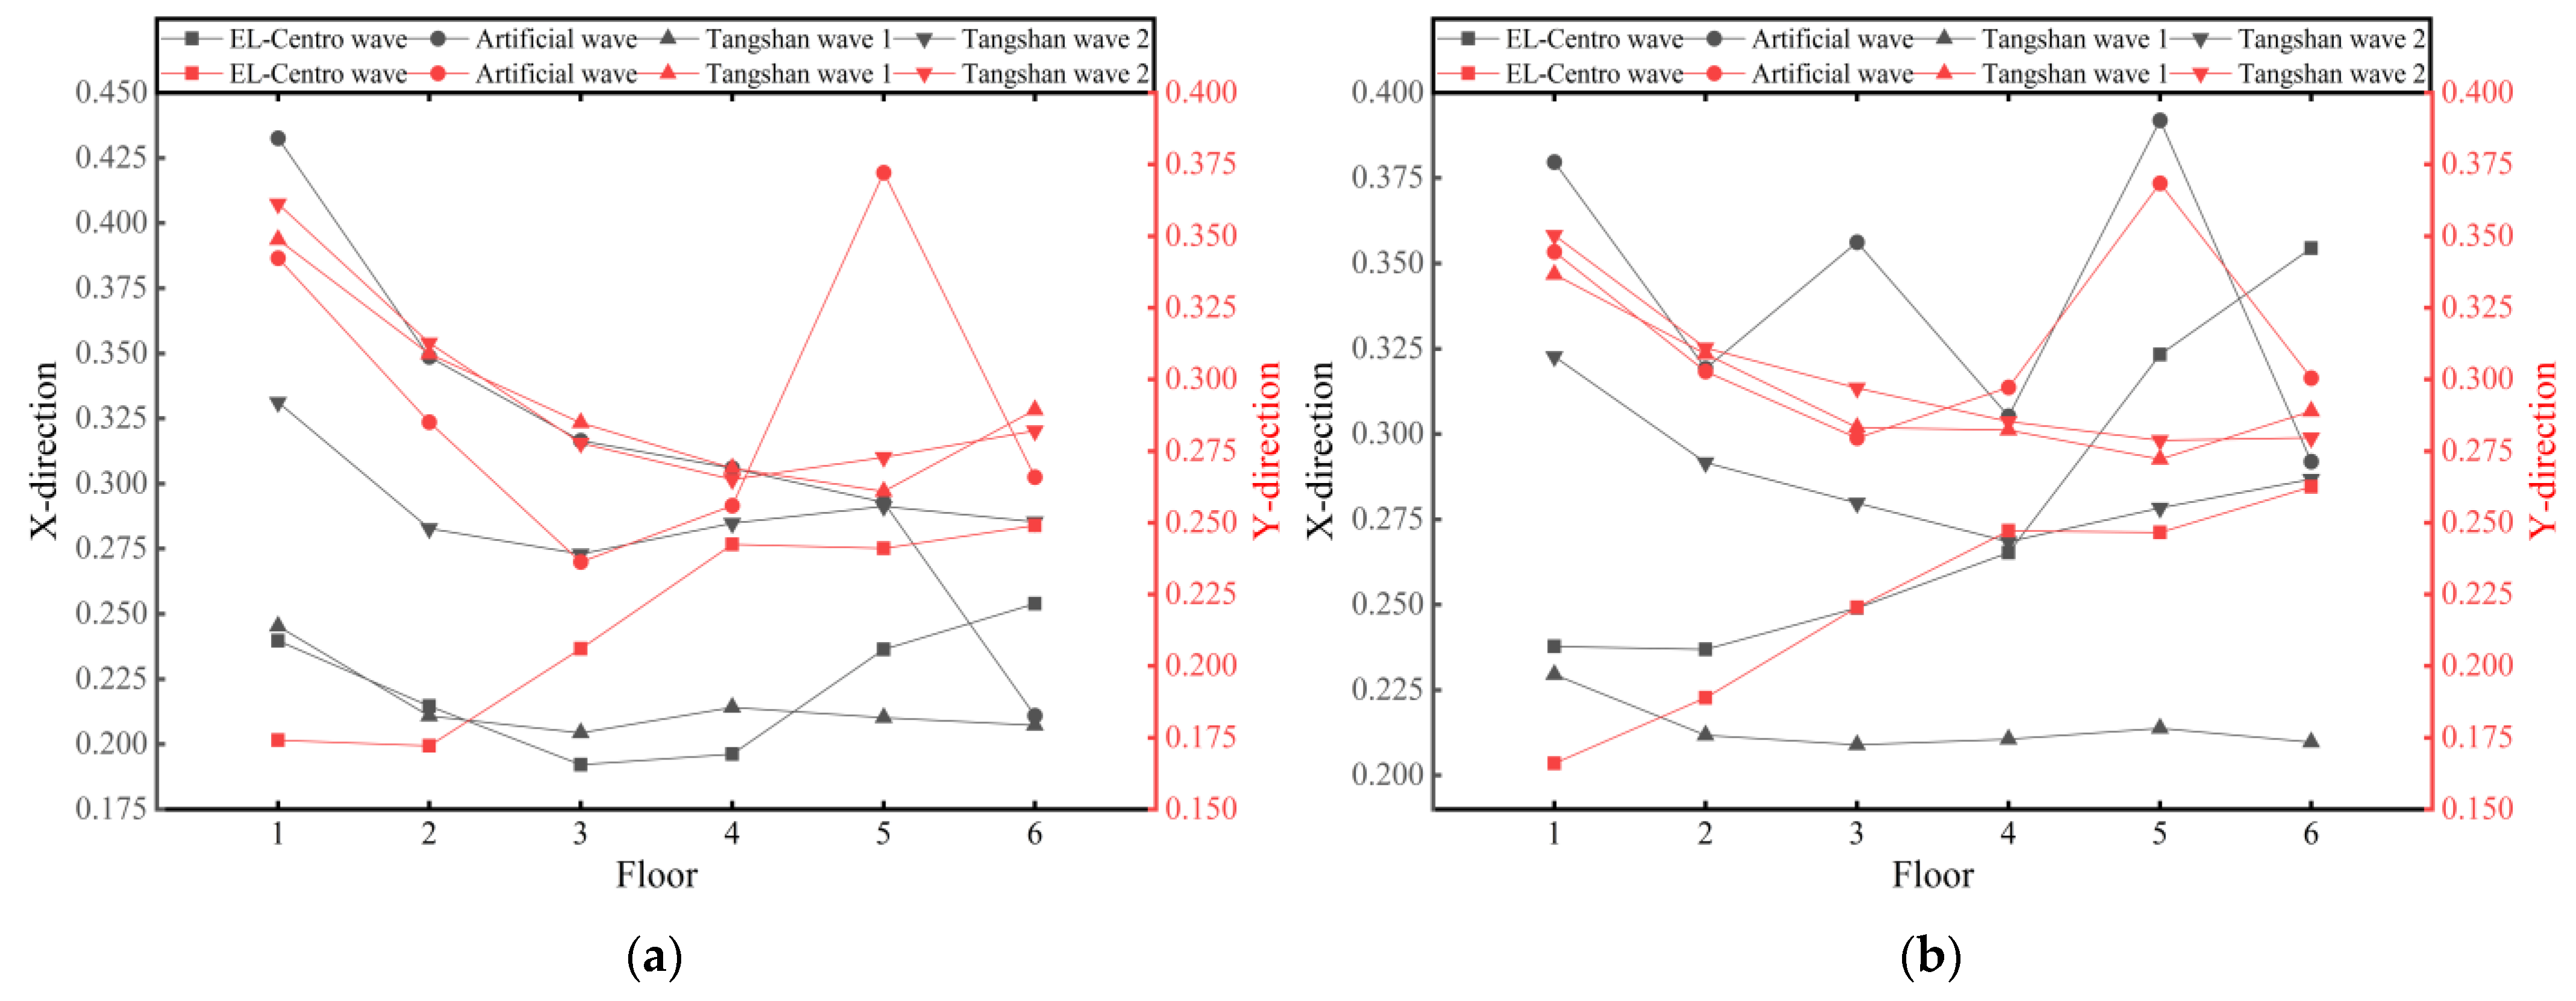
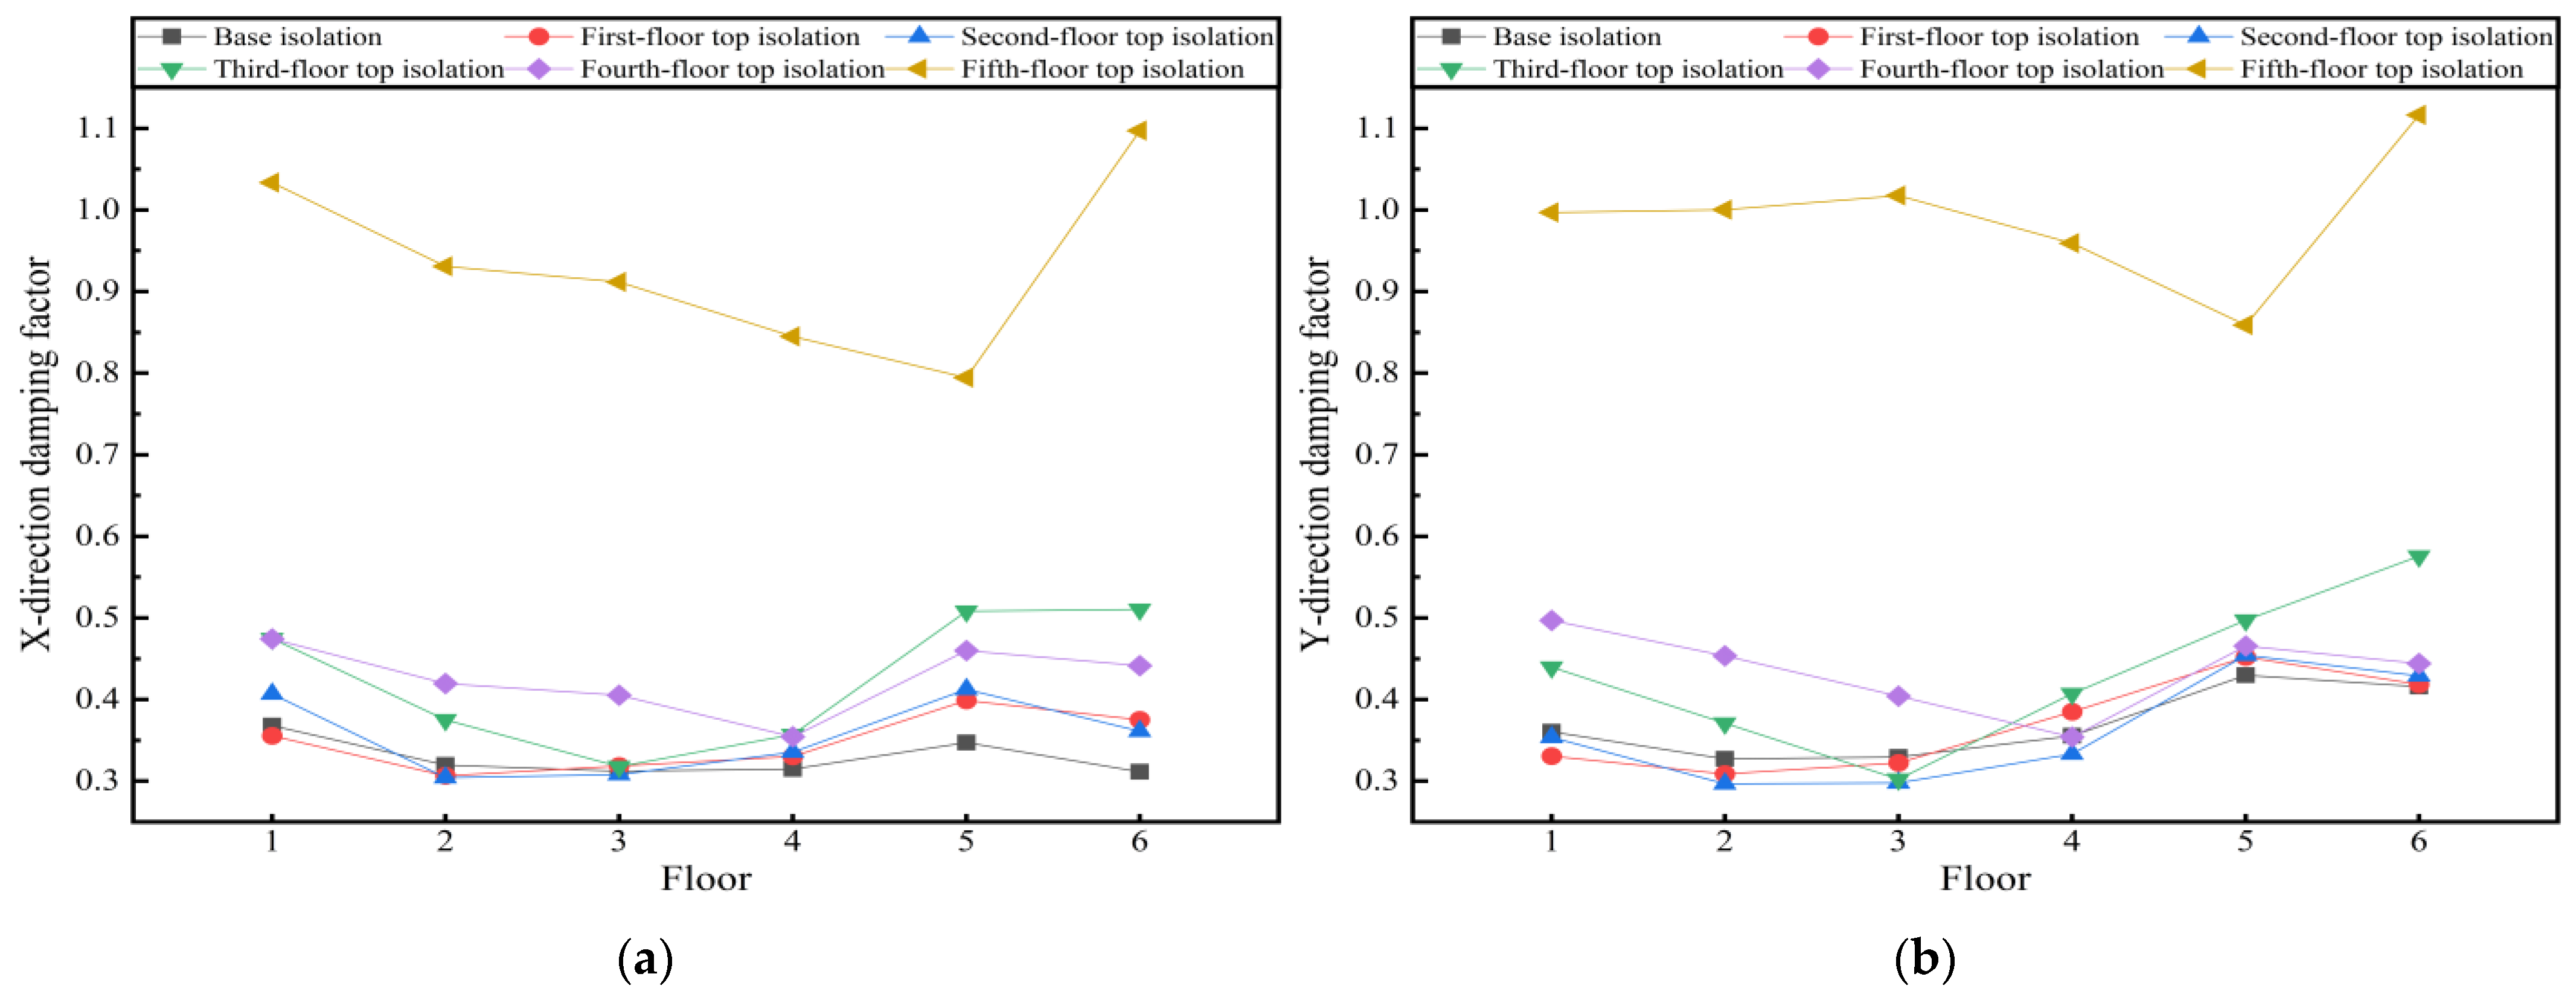
4.2. Horizontal Damping Factors

The inter-story shear forces of the isolated model are analyzed to determine the horizontal damping factor for each isolation scheme. According to the “Code for seismic design of buildings” (GB50011-2010) [35], the horizontal damping factor for multi-story buildings is defined as the maximum ratio of the inter-story shear forces of each floor under isolated and non-isolated conditions, calculated elastically. The ratios of the inter-story shear forces in the X- and Y-directions for each isolation scheme under four seismic waves compared to the non-isolated condition are shown in Figure 9. The results indicate that, excepting the fourth- and fifth-floor isolation schemes, the inter-story shear forces for the other isolation schemes are reduced to varying degrees compared to the non-isolated structure. Based on the results in Figure 9, it can be observed that the inter-story shear ratio varies significantly under different earthquake wave excitations. Therefore, we plotted the average horizontal seismic damping factors for each floor, as shown in Figure 10. The results indicate that for the base and first- to fifth-floor isolation schemes, the maximum X-direction seismic damping factors for the upper structure above the isolation layer are 0.368, 0.399, 0.413, 0.511, 0.474, and 0.794, respectively, while those in the Y-direction are 0.430, 0.452, 0.454, 0.576, 0.497, and 0.859, respectively. These results demonstrate that when the isolation layer is positioned lower, the damping factor is smaller, indicating a more significant seismic reduction effect. Among these, the base, first-floor, and second-floor isolation schemes exhibit excellent isolation performance. However, when the isolation layer is set high, such as in the fifth-floor isolation scheme, although the maximum reduction coefficient of the upper structure above the isolation layer is relatively low at 0.859, the damping factor of the lower structure is significantly high, even exceeding 1. This means that the inter-story shear force is amplified compared to the non-isolated condition.

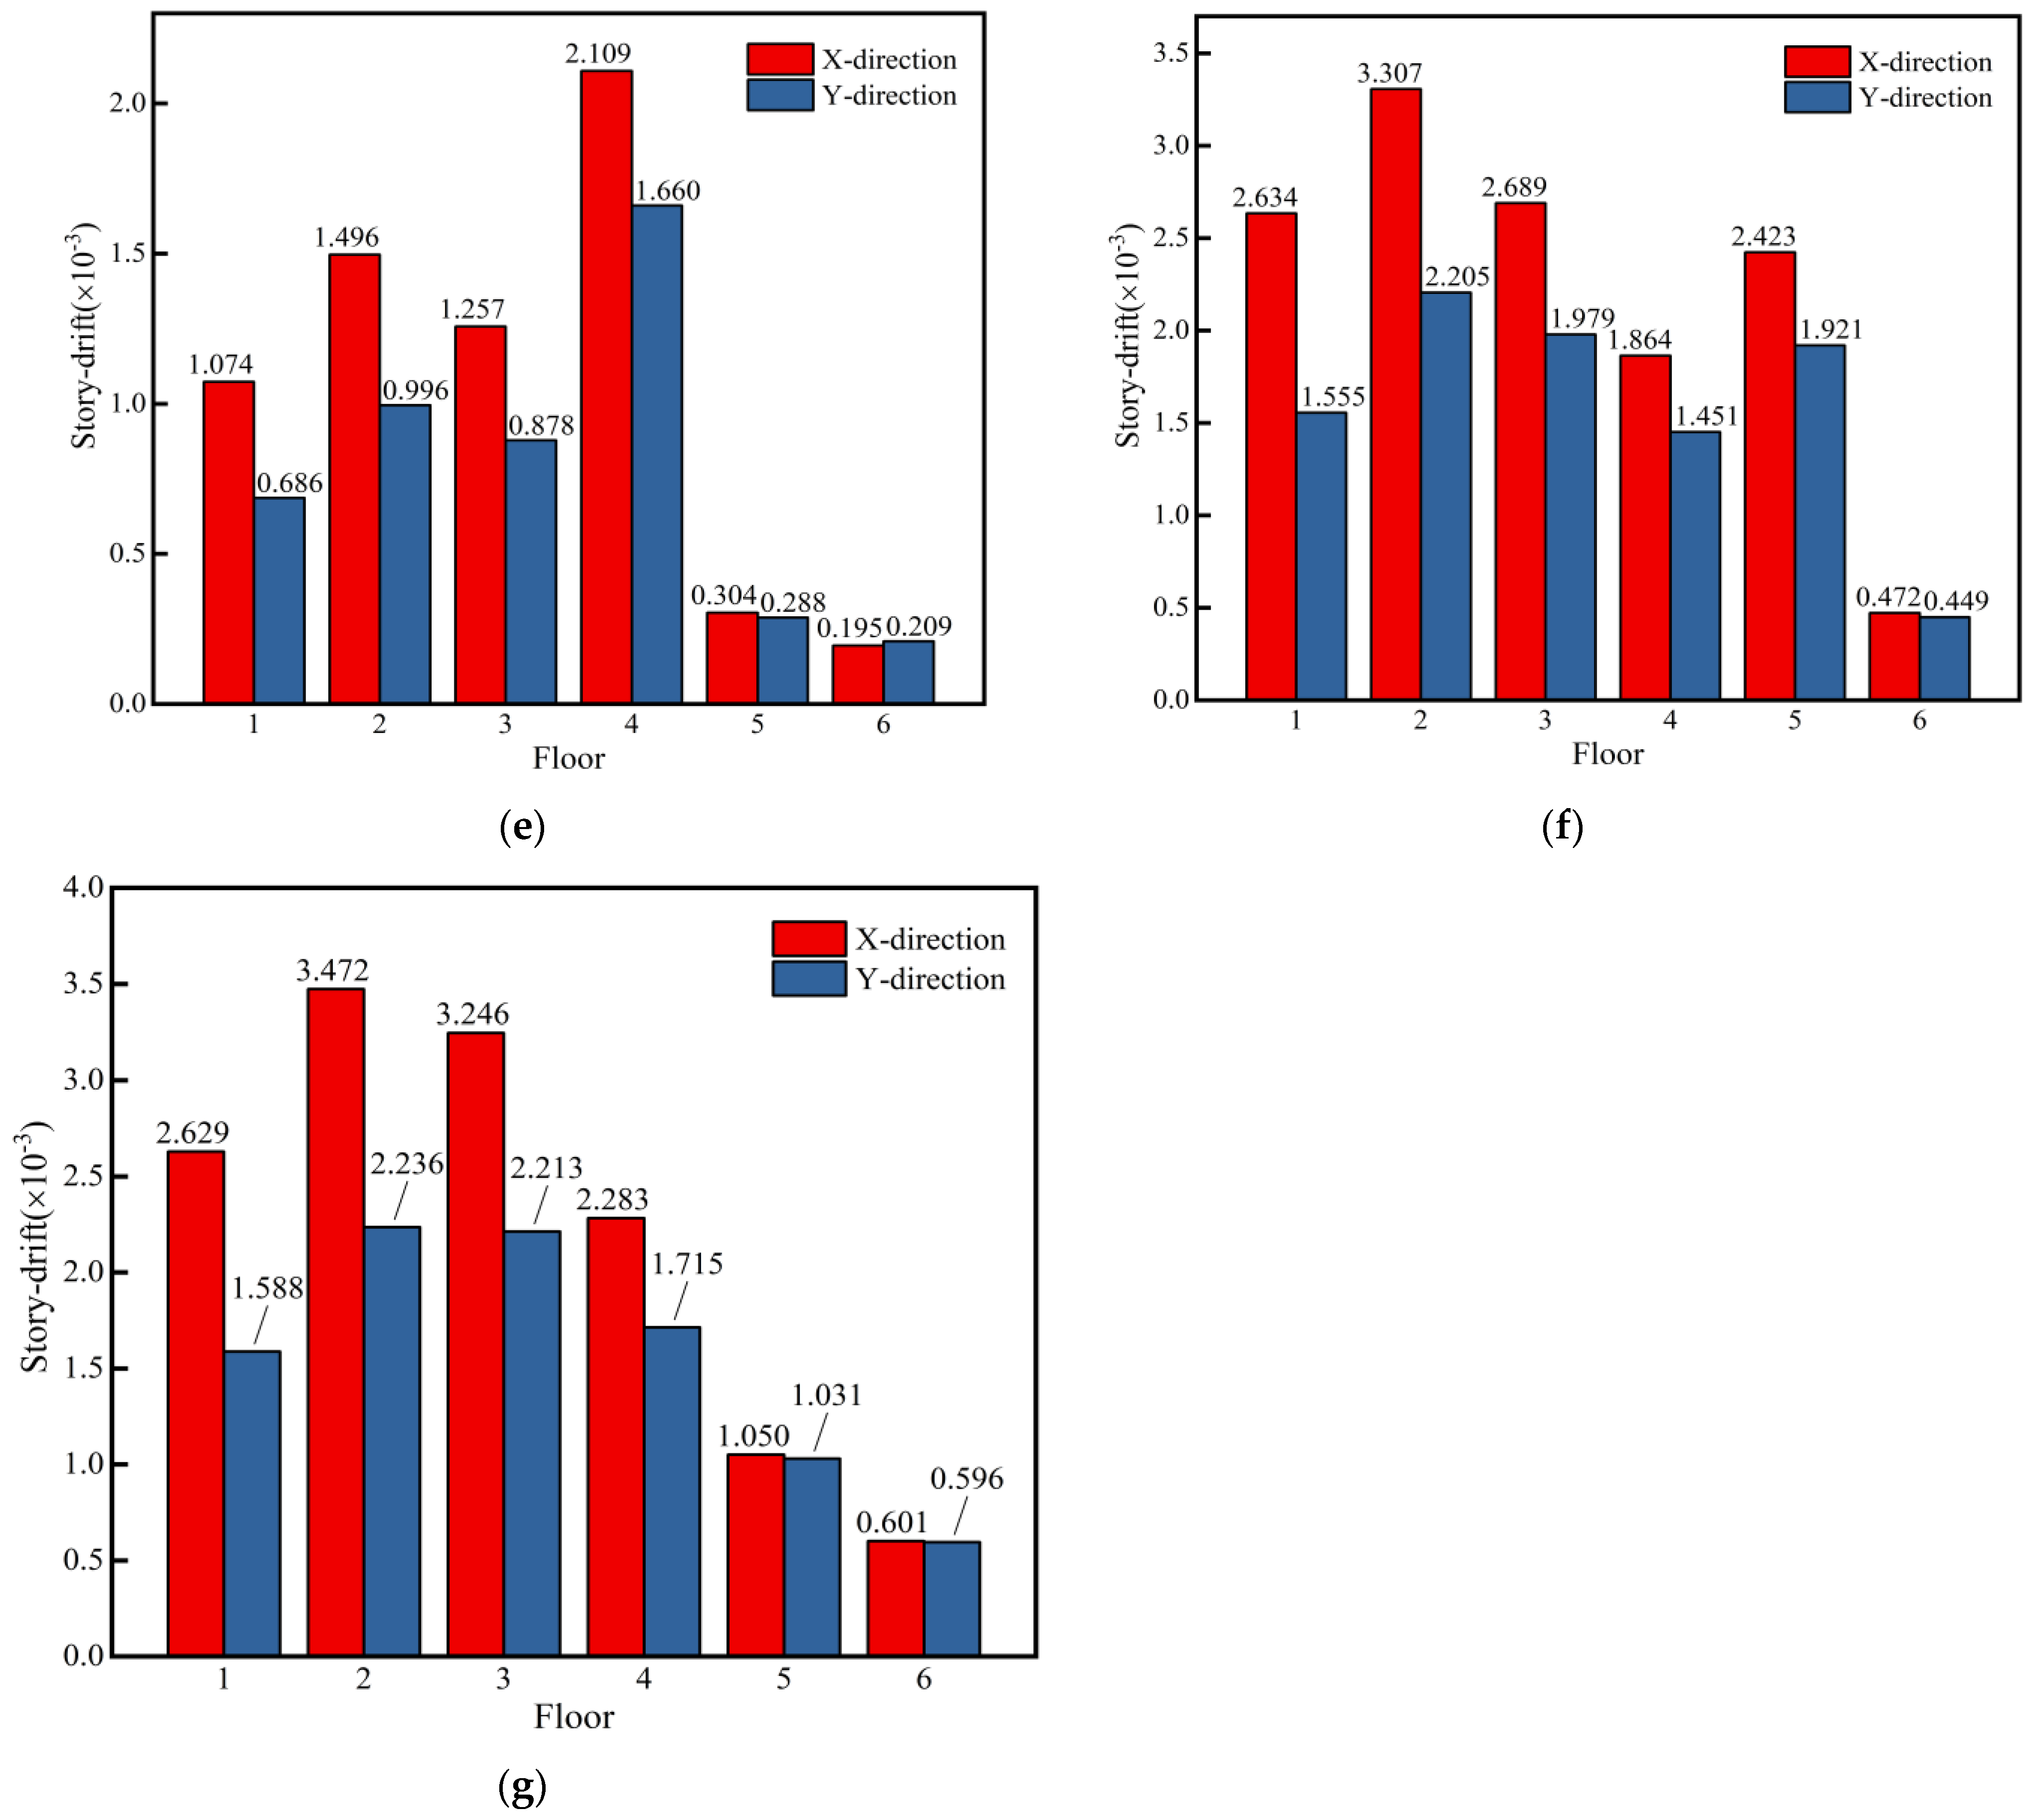
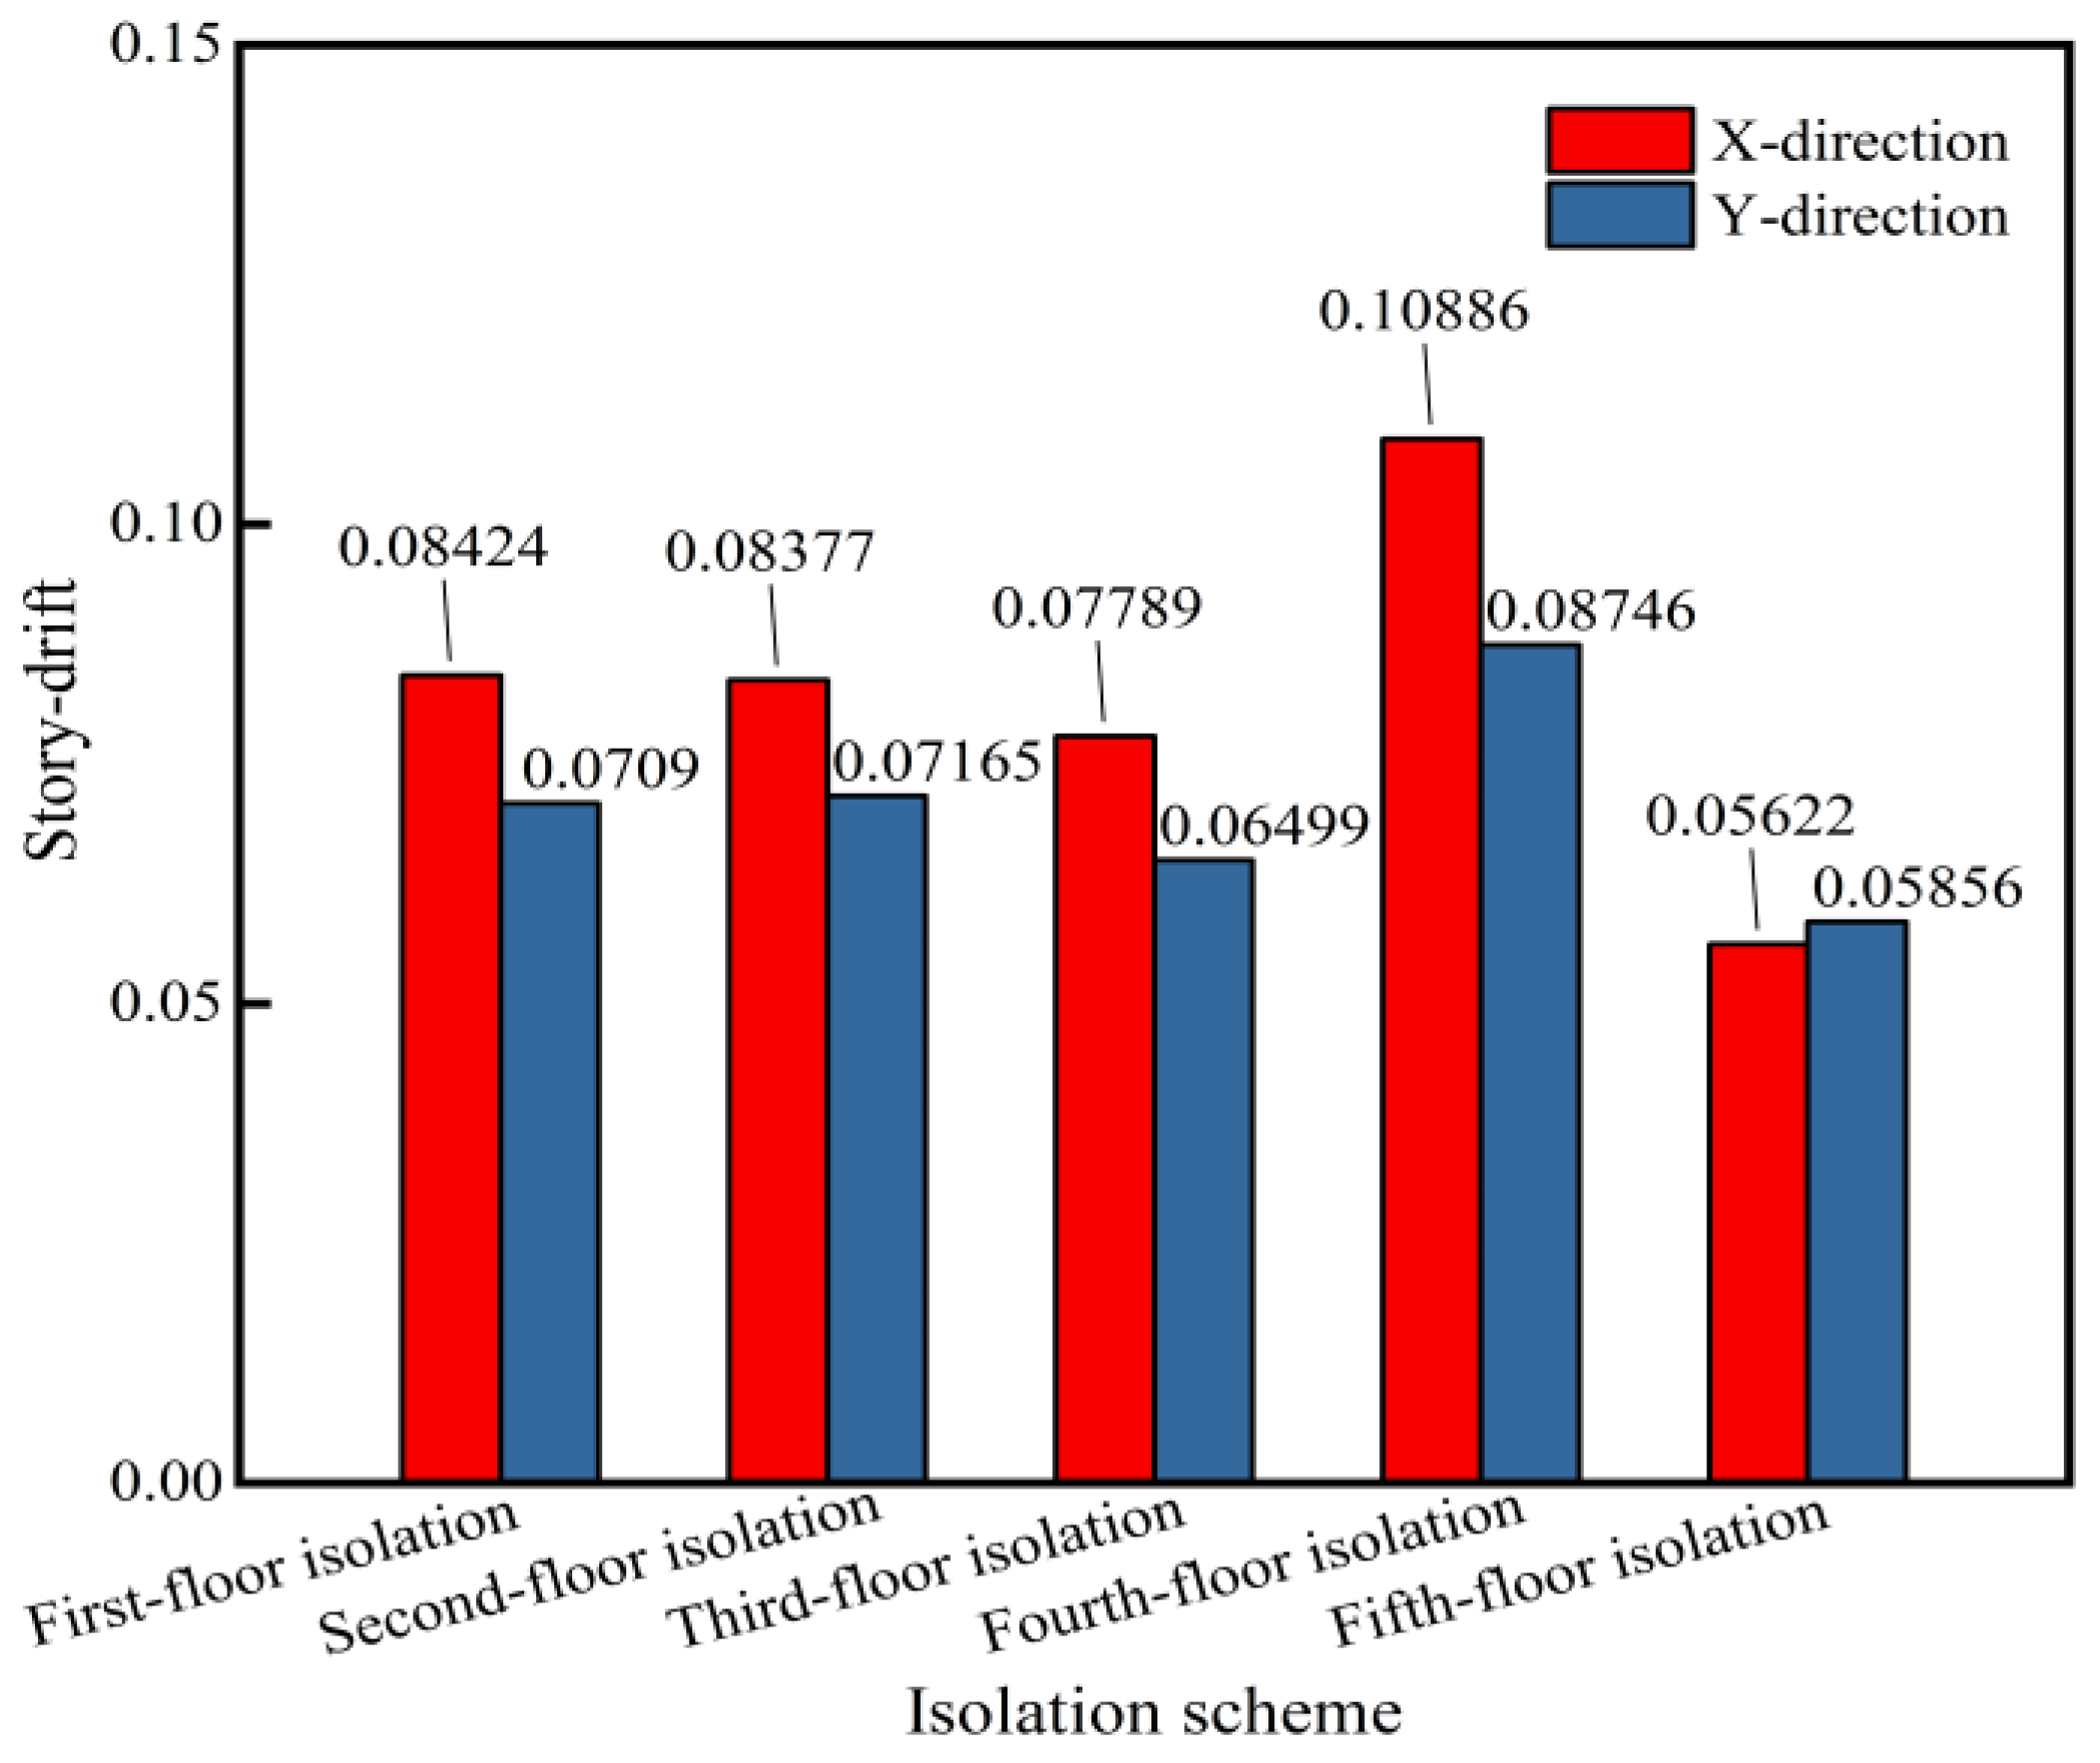
4.3. Inter-Story Drift Angle

The seismic isolation effects of the six isolation schemes are compared by using the inter-story drift angle as an indicator. The average inter-story drift angles of the building structure under multiple earthquake scenarios for each isolation scheme are shown in Figure 11. It is important to note that a bidirectional horizontal seismic input (X:Y = 1:0.85) was applied during the time-history analysis of the structure. Given the significant differences in the dynamic response of the building structure under different seismic waves, as illustrated in Figure 9, the average inter-story drift angles are discussed herein under the excitation of the four seismic waves (see Section 2). Figure 11 shows that the maximum inter-story drift angles for the base and first- to fifth-floor isolation schemes are 0.0037, 0.0021, 0.0026, 0.0024, 0.0021, and 0.0033 radians, respectively. This indicates that the isolation effect is most effective when the isolation layer is set at the top of the first floor. Additionally, the inter-story drift angles of the isolation layers for each isolation scheme are presented in Figure 12. The maximum drift angles for the isolation layers under the base and first- to fifth-floor isolation schemes are 0.08424, 0.08377, 0.07789, 0.10886, and 0.05856, respectively. Comparing the inter-story drift angles of the isolation layers and those of the structures, it can be observed that with the implementation of the isolation design, the horizontal displacement of the building structure mainly occurs in the isolation layers, with the horizontal displacement of other floors being approximately 1% to 3% of that of the isolation layers.
The inter-story drift angles of all floors are compared herein for all the isolation schemes. The isolation scheme with the isolation layer on the first floor exhibits a small drift angle, with generally small inter-story drift angles across all floors; the drift angles for floors 2 to 6 are all less than 0.001 radians (see Figure 11b), indicating the optimal damping effect. Additionally, the base isolation scheme also shows significantly smaller inter-story drift angles compared to the other isolation schemes, achieving a good isolation effect. The fourth-story isolation scheme shows the largest drift angle in the isolation layer, with large inter-story drift angles in the structure below the isolation layer (see Figure 11e). Although the fifth-story isolation scheme has a small drift angle in the isolation layer, the drift angles of the structure below the isolation are significantly large. Furthermore, it can be observed that, under all schemes, the inter-story drift angles below the isolation layer are much larger than those above. For instance, in the third-story isolation scheme (see Figure 11d), the drift angles for floors 1 to 3 are all greater than those for floors 4 to 6. Similarly, in the fourth-story isolation scheme, the drift angles for floors 1 to 4 are greater than those for floors 5 to 6 (see Figure 11e). Therefore, placing the isolation layer at a relatively low position can avoid large displacement differences between the upper and lower structures. The base isolation and first-story isolation schemes, with the isolation layers positioned lower, demonstrate better damping effects than the other schemes for this reason.
A comprehensive analysis of the natural period, horizontal damping factor, and inter-story drift angle for all the isolation schemes reveals that the implementation of an isolation layer significantly extends the natural period of the building structure. This extension causes the natural period to greatly exceed the characteristic period of the site, thereby reducing the seismic forces transmitted to the superstructure above the isolation layer. Moreover, the effect of extending the natural period and reducing the seismic forces transmitted to the building structure is more pronounced when the isolation layer is placed at a low position. Therefore, it is recommended to set the isolation layer at the top of the foundation or the top of the first floor.

5. Conclusions

This paper presents the optimization design of seismic isolation for a six-story concrete frame building. The seismic isolation effects were compared by setting the isolation layer at the foundation and at the top of each floor from the first to the fifth. The comparison was based on three indicators: natural period, horizontal damping factor, and inter-story drift angle. The results lead to the following conclusions:
(1)
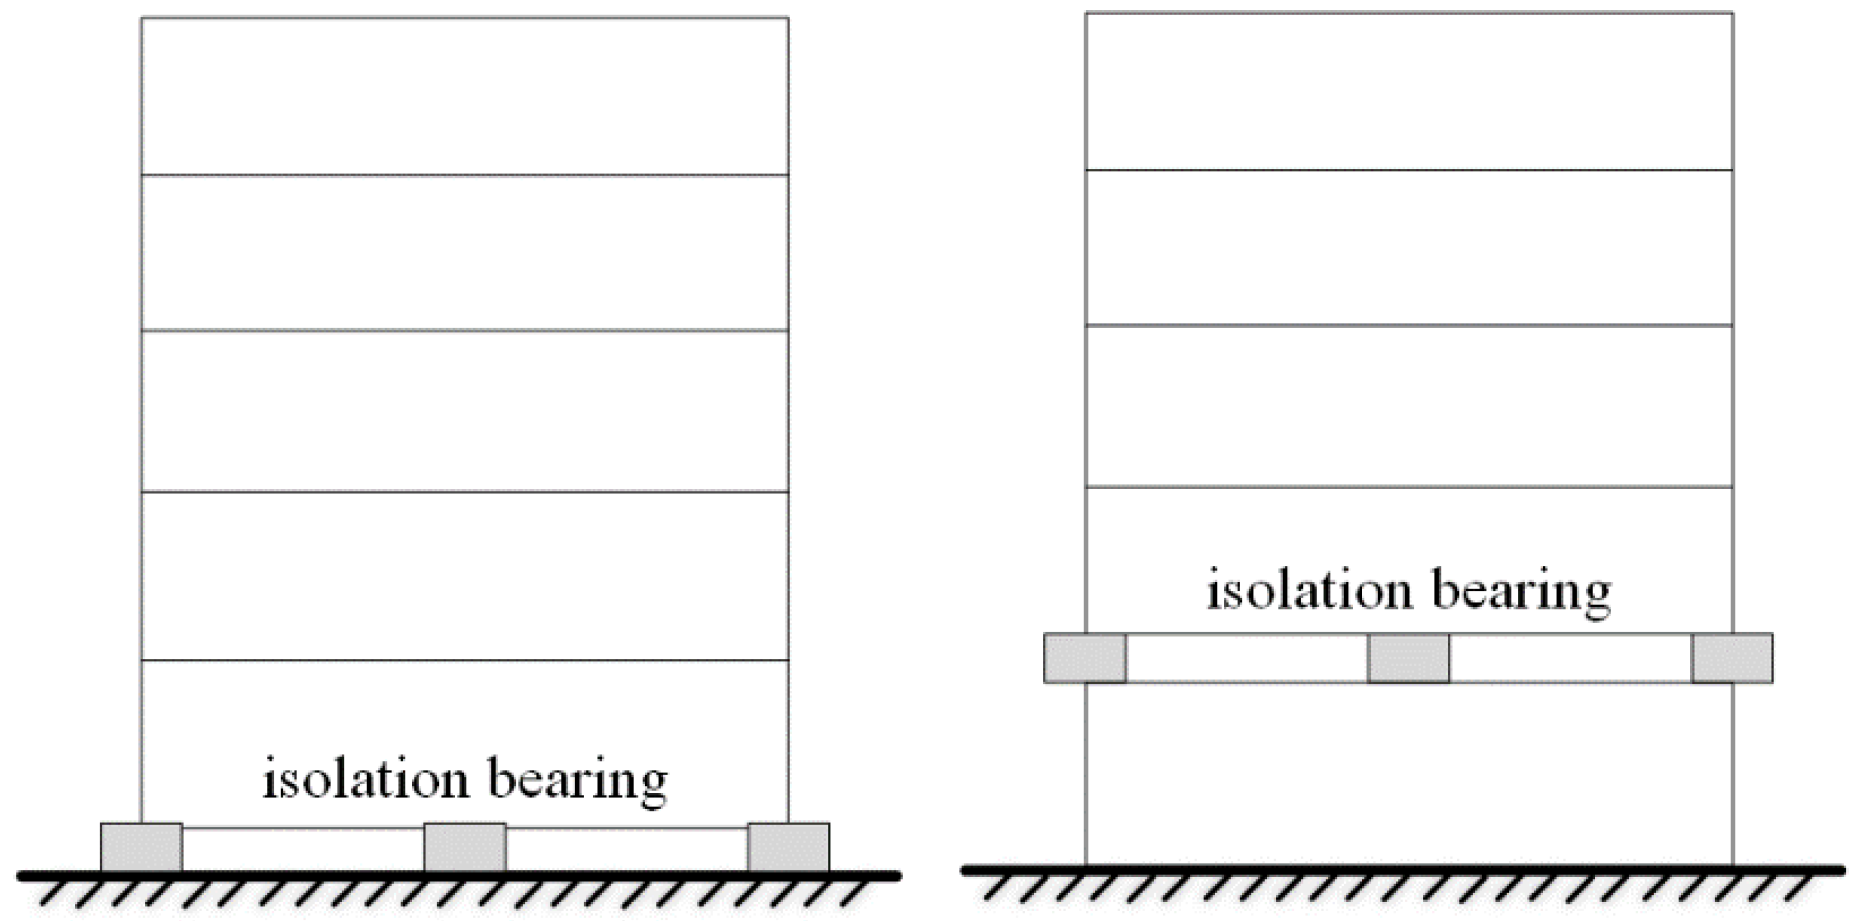
The position of the isolation layer significantly affects the isolation effectiveness. Placing the isolation layer at the foundation or the top of the first floor yields the most significant isolation effect. Compared to non-isolated structures, the natural period of the base-isolated and first-floor top-isolated structures can be extended by 2.2 times and 2 times, respectively. The damping coefficients can reach 0.35 and 0.36, respectively, and the inter-story drift angles can be reduced by 66% and 67%, respectively.
(2)
After setting the isolation layer, the horizontal displacement of the building structure under horizontal seismic excitation is mainly concentrated in the isolation layer, while the horizontal displacement of the structure itself is relatively small.
(3)
When the isolation layer is set at a lower position, using isolation bearings with minimal horizontal stiffness can increase the natural period of the isolation layer and the superstructure, allowing the structure to avoid the predominant period of the site, thereby reducing seismic effects.

Author Contributions

Methodology, Y.L.; Software, S.L.; Validation, Z.C. All authors have read and agreed to the published version of the manuscript.

Funding

This research was funded by Qinghai Provincial Basic Research Program, project number 2023-ZJ-962Q.

Data Availability Statement

The original contributions presented in the study are included in the article, further inquiries can be directed to the corresponding author.

Conflicts of Interest

The authors declare that they have no conflict of interest.

Appendix A

Layouts of the isolation bearings are listed below.
Figure A1. Layout of the lead-core rubber bearings (LRBs) for the base isolation scheme.
Buildings 14 02172 g0a1
Figure A2. Layout of the lead-core rubber bearings (LRBs) for the first isolation scheme.
Buildings 14 02172 g0a2
Figure A3. Layout of the lead-core rubber bearings (LRBs) for the second isolation scheme.
Buildings 14 02172 g0a3
Figure A4. Layout of the lead-core rubber bearings (LRBs) for the third isolation scheme.
Buildings 14 02172 g0a4
Figure A5. Layout of the lead-core rubber bearings (LRBs) for the fourth isolation scheme.
Buildings 14 02172 g0a5
Figure A6. Layout of the lead-core rubber bearings (LRBs) for the fifth isolation scheme.
Buildings 14 02172 g0a6

References

  1. Su, J.-Y.; Zeng, D.-M. Research and application of seismic isolation of buildings in China. Earthq. Eng. Eng. Dyn. 2001, 21, 94–101. [Google Scholar] [CrossRef]
  2. Liu, D.R. Research on Parallel Composite Base Isolation System Based on Reactive Spectrum and Sand Cushion Isolation Theory; Hohai University: Nanjing, China, 2007. [Google Scholar]
  3. Wang, G.H. The Performance-Based Fragility Analysis of Base-Isolated RC Frame Structure; University Of Technology: Lanzhou, China, 2013. [Google Scholar]
  4. Tsai, H.C.; Kelly, J.M. Seismic Response of Heavily Damped Base-Isolation Systems. Earthq. Eng. Struct. Dyn. 1993, 22, 633–645. [Google Scholar] [CrossRef]
  5. Okamura, S.; Kamishima, Y.; Negishi, K.; Sakamoto, Y.; Kitamura, S.; Kotake, S. Seismic Isolation Design for JSFR. J. Nucl. Sci. Technol. 2011, 48, 688–692. [Google Scholar] [CrossRef]
  6. Derham, C.J.; Kelly, J.M.; Thomas, A.G. Nonlinear natural rubber bearings for seismic isolation. Nucl. Eng. Des. 1985, 84, 417–428. [Google Scholar] [CrossRef]
  7. Huang, J.; Wang, P.; Shi, Q.; Rong, C.; Wang, B. Mechanical Properties and Seismic Loss Assessment of Improved Isolation Bearing with Variable Stiffness. Buildings 2023, 13, 1134. [Google Scholar] [CrossRef]
  8. Si, M.; Wu, Y.; Xu, H.; Li, A.; Xu, Y.; Lu, S.; Wang, H. The seismic performance evaluation of unbonded laminated rubber bearings with end rotation. Structures 2023, 51, 926–935. [Google Scholar] [CrossRef]
  9. Wu, Y.; Huang, J.; Lin, S.; Qi, A. Design and application status of seismic isolation constitution of building. China Civ. Eng. J. 2018, 51, 62–73+94. [Google Scholar] [CrossRef]
  10. Ying, X.; Li, Y.; Li, B.; Sun, L. A new method for vertical damping with TMD system. Earthq. Resist. Eng. Retrofit. 2020, 42, 57–63. [Google Scholar] [CrossRef]
  11. Chen, B.; Qiu, Y.; Xiong, J.; Liu, Y.; Xu, Y. Seismic Performance and Optimization of a Novel Partial Seismic Isolation System for Frame Structures. Buildings 2022, 12, 876. [Google Scholar] [CrossRef]
  12. Faiella, D.; Calderoni, B.; Mele, E. Seismic Retrofit of Existing Masonry Buildings through Inter-story Isolation System: A Case Study and General Design Criteria. J. Earthq. Eng. 2022, 26, 2051–2087. [Google Scholar] [CrossRef]
  13. Faiella, D.; Mele, E. Insights into inter-story isolation design through the analysis of two case studies. Eng. Struct. 2020, 215, 110660. [Google Scholar] [CrossRef]
  14. Wei, L.; Zhou, F.; Ren, M.; Liu, W.; Tan, P.; Huang, X.; Chen, J. Application of three-dimensional seismic and vibration isolatior to building and site test. Earthq. Eng. Eng. Dyn. 2007, 27, 121–125. [Google Scholar] [CrossRef]
  15. Zhang, C.W.; Ali, A.; Sun, L. Investigation on low-cost friction-based isolation systems for masonry building structures: Experimental and numerical studies. Eng. Struct. 2021, 243, 112645. [Google Scholar] [CrossRef]
  16. Abdeddaim, M.; Djerouni, S.; Ounis, A.; Athamnia, B.; Farsangi, E.N. Optimal design of Magnetorheological damper for seismic response reduction of Base-Isolated structures considering Soil-Structure interaction. Structures 2022, 38, 733–752. [Google Scholar] [CrossRef]
  17. Matsagar Vasant, A.; Jangid, R.S. Base Isolation for Seismic Retrofitting of Structures. Pract. Period. Struct. Des. Constr. 2008, 13, 175–185. [Google Scholar] [CrossRef]
  18. Yuan, Y.; Wei, W.; Ni, Z. Analytical and experimental studies on an innovative steel damper reinforced polyurethane bearing for seismic isolation applications. Eng. Struct. 2021, 239, 112254. [Google Scholar] [CrossRef]
  19. Pei, Q.; Qi, P.; Xue, Z.; Zhong, J.; Zhang, Y. Design and Experimental Analysis of Seismic Isolation Bearings for Nuclear Power Plant Containment Structures. Buildings 2023, 13, 2366. [Google Scholar] [CrossRef]
  20. Chen, X.; Ikago, K.; Guan, Z.G.; Li, J.Z.; Wang, X.W. Lead-rubber-bearing with negative stiffness springs (LRB-NS) for base-isolation seismic design of resilient bridges: A theoretical feasibility study. Eng. Struct. 2022, 266, 114601. [Google Scholar] [CrossRef]
  21. Dadkhah, H.; Mohebbi, M. A multi-hazard-based design approach for LRB isolation system against explosion and earthquake. Earthq. Struct. 2021, 21, 101–117. [Google Scholar] [CrossRef]
  22. Shiravand, M.R.; Ketabdari, H.; Rasouli, M. Optimum arrangement investigation of LRB and FPS isolators for seismic response control in irregular buildings. Structures 2022, 39, 1031–1044. [Google Scholar] [CrossRef]
  23. Zheng, W.Z.; Tan, P.; Li, J.; Wang, H.; Tan, J.J. Sliding-LRB incorporating superelastic SMA for seismic protection of bridges under near-fault earthquakes: A comparative study. Soil Dyn. Earthq. Eng. 2022, 155, 107161. [Google Scholar] [CrossRef]
  24. Zheng, W.Z.; Wang, H.; Li, J.; Shen, H.J. Parametric Study of Superelastic-Sliding LRB System for Seismic Response Control of Continuous Bridges. J. Bridge Eng. 2020, 25, 04020062. [Google Scholar] [CrossRef]
  25. Zhou, F.; Zhang, Y.; Tan, P. Theoretical study on story isolation system. China Civ. Eng. J. 2009, 42, 1–8. [Google Scholar]
  26. Wang, S.-J.; Chang, K.-C.; Hwang, J.-S.; Lee, B.-H. Simplified analysis of mid-story seismically isolated buildings. Earthq. Eng. Struct. Dyn. 2011, 40, 119–133. [Google Scholar] [CrossRef]
  27. Li, X.-Z.; Ou, H.-L.; Lin, S. Simplified analysis on calculation model of interlayer seismic isolation. Earthq. Eng. Eng. Dyn. 2002, 22, 121–125. [Google Scholar] [CrossRef]
  28. Murakami, K.; Kitamura, H.; Matsushima, Y. The Prediction for Seismic Responses of the Two-Mass Model with the Mid-Story Isolation System. J. Struct. Constr. Eng. (Trans. AIJ) 2001, 66, 51–58. [Google Scholar] [CrossRef] [PubMed]
  29. Ryan, K.L.; Earl, C.L. Analysis and Design of Inter-Story Isolation Systems with Nonlinear Devices. J. Earthq. Eng. 2010, 14, 1044–1062. [Google Scholar] [CrossRef]
  30. Kazemi, F.; Asgarkhani, N.; Jankowski, R. Machine learning-based seismic response and performance assessment of reinforced concrete buildings. Arch. Civ. Mech. Eng. 2023, 23, 94. [Google Scholar] [CrossRef]
  31. Rayegani, A.; Nouri, G. Seismic collapse probability and life cycle cost assessment of isolated structures subjected to pounding with smart hybrid isolation system using a modified fuzzy based controller. Structures 2022, 44, 30–41. [Google Scholar] [CrossRef]
  32. Rayegani, A.; Nouri, G. Application of Smart Dampers for Prevention of Seismic Pounding in Isolated Structures Subjected to Near-fault Earthquakes. J. Earthq. Eng. 2022, 26, 4069–4084. [Google Scholar] [CrossRef]
  33. Rahgozar, N.; Pouraminian, M.; Rahgozar, N. Structural optimization of vertical isolated rocking core-moment frames. J. Vib. Control 2023, 29, 3451–3460. [Google Scholar] [CrossRef]
  34. Yang, Q.; Rao, C.; He, W.; Liu, W. Study on fundamental mechanic properties for composed bearing with high compression stress. World Earthq. Eng. 2017, 33, 158–165. [Google Scholar]
  35. GB 50011-2010; Code for Seismic Design of Buildings. The Ministry of Housing and Urban-Rural Development of the People’s Republic of China: Beijing, China, 2010; 499p.
  36. GB 50009-2012; Load Code for the Design of Building Structures. Ministry of Housing and Urban-Rural Construction of the People’s Republic of China: Beijing, China, 2012; 259p.
Figure 1. Schematic diagram of seismic isolation system.
Buildings 14 02172 g001
Figure 2. Seismic influence coefficient.
Buildings 14 02172 g002
Figure 3. Procedure for selecting seismic waves.
Buildings 14 02172 g003
Figure 4. The time history of accelerations for the selected seismic waves.
Buildings 14 02172 g004
Figure 5. Generation steps for the artificial earthquake waves.
Buildings 14 02172 g005
Figure 6. The time history of acceleration for the artificial earthquake wave.
Buildings 14 02172 g006
Figure 7. Constitutive relationships of the (a) concrete; (b) reinforcing steel.
Buildings 14 02172 g007
Figure 8. Structural model and framework: (a) model of non-seismic isolation structure; (b) building elevation frame; (c) floor plan frame.
Buildings 14 02172 g008aBuildings 14 02172 g008b
Figure 9. Damping factors in the X- and Y-directions for isolation schemes: (a) base isolation; (b) first-floor isolation; (c) second-floor isolation; (d) third-floor isolation; (e) fourth-floor isolation; (f) fifth-floor isolation.
Buildings 14 02172 g009aBuildings 14 02172 g009b
Figure 10. Average damping factors (a) in X-direction; (b) in Y-direction.
Buildings 14 02172 g010
Figure 11. Inter-story drift angles for isolation schemes: (a) base isolation; (b) first-floor isolation; (c) second-floor isolation; (d) third-floor isolation; (e) fourth-floor isolation; (f) fifth-floor isolation; (g) non-isolated structure.
Buildings 14 02172 g011aBuildings 14 02172 g011b
Figure 12. Average inter-story drifts for isolation schemes.
Buildings 14 02172 g012
Table 1. Detailed information of seismic records.
NameInformation of the Seismic RecordsPGA (cm/s2)
Tangshan wave 1Tangshan—Beijing Hotel—East–West Direction65.94
El Centro waveEl Centro341.7
Artificial waveArtificially simulated seismic acceleration records429.19
Tangshan wave 2Tangshan—Beijing Hotel—North–South Direction55.48
Table 2. Base shear obtained by time-history analysis method and response spectrum method.
Seismic WaveEl CentroArtificial WaveTangshan Wave 1Tangshan Wave 2Mean Value
In X-directionTime-history analysis (kN)9012.747045.166948.55165119879.36
Response spectrum (kN)6992.41
Ratio between time-history and response spectrum results128.89%100.75%99.37%236.13%141.29%
In Y-directionTime-history analysis (kN)11151.175767.197017.357856.237947.98
Response spectrum (kN)7448.71
Ratio between time-history and response spectrum results149.71%77.00%94.00%105.00%106.70%
Table 3. Deformations of isolation bearings under rare seismic excitation.
Isolation SchemeID of BearingsX-Direction (mm)Y-Direction (mm)Allowable Displacement (mm)
Base isolation9154.66142.31216
10149.70125.28216
11147.38125.50216
12142.02126.11216
First-floor isolation9130.81125.93216
10131.09106.40216
11135.99102.36216
12135.43120.75216
Second-floor isolation9128.79116.74216
10130.91108.94216
11119.2497.80216
12121.13104.75216
Third-floor isolation9193.0172.1216
10193.1156.6216
11194.0159.0216
12193.2172.7216
Fourth-floor isolation9156134165
10150117216
11152118165
12150129165
Fifth-floor isolation9157.7120.8165
10160.5104.1165
11159.1102.2165
12157.1117.2165
Table 4. The design values of wind load and the bearing capacity.
Isolation SchemeDirectionDesign Value of Wind Load (kN)Horizontal Bearing Capacity (kN)
Base isolationX679.041324.00
Y198.051324.00
First-floor isolationX562.631092.06
Y164.101092.06
Second-floor isolationX446.22849.66
Y130.15849.66
Third-floor isolationX130.15669.84
Y329.82669.84
Fourth-floor isolationX213.41487.44
Y62.24487.44
Fifth-floor isolationX97.01469.20
Y28.29469.20
Table 5. The natural vibration periods for the first five modes.
Modal OrderStructural Period before Isolation (s)Base
Isolation (s)
First-Floor Isolation (s)Second-Floor
Isolation (s)
Third-Floor Isolation (s)Fourth-Floor Isolation (s)Fifth-Floor Isolation (s)
10.64161.66561.50541.31891.17551.03070.6843
20.58321.62061.47151.26431.12770.99550.6502
30.55141.49251.34631.22701.09100.94670.6039
40.21720.31210.29450.23300.28230.40830.4588
50.19130.30030.28300.22240.24220.35950.4298
Disclaimer/Publisher’s Note: The statements, opinions and data contained in all publications are solely those of the individual author(s) and contributor(s) and not of MDPI and/or the editor(s). MDPI and/or the editor(s) disclaim responsibility for any injury to people or property resulting from any ideas, methods, instructions or products referred to in the content.

