Article

Strain Behavior of Short Concrete Columns Reinforced with GFRP Spirals

1
Department of Civil and Environmental Engineering, College of Engineering, University of Jeddah, Jeddah 23890, Saudi Arabia
2
Department of Civil Engineering, Faculty of Engineering—Mataria, Helwan University, Cairo 11718, Egypt
3
Department of Civil and Architectural Engineering, College of Engineering, Applied Science University (ASU), Manama P.O. Box 5055, Bahrain
*
Author to whom correspondence should be addressed.
Buildings 2024, 14(7), 2180; https://doi.org/10.3390/buildings14072180 (registering DOI)
Submission received: 11 June 2024 / Revised: 4 July 2024 / Accepted: 11 July 2024 / Published: 15 July 2024

Abstract

:
This paper presents a comprehensive study focused on evaluating the strain generated within short concrete columns reinforced with glass-fiber-reinforced polymer (GFRP) bars and spirals under concentric compressive axial loads. This research was motivated by the lack of sufficient data in the literature regarding strain in such columns. Five full-scale RC columns were cast and tested, comprising four strengthened with GFRP reinforcement and one reference column reinforced with steel bars and spirals. This study thoroughly examined the influence of various test parameters, such as the reinforcement type, longitudinal reinforcement ratio, and spacing of spiral reinforcement, on the strain in concrete, GFRP bars, and spirals. The experimental results showed that GFRP–RC columns exhibited similar strain behavior to steel–RC columns up to 85% of their peak loads. The study also highlighted that the bearing capacity of the columns increased by up to 25% with optimized reinforcement ratios and spiral spacing, while the failure mode transitioned from a ductile to a more brittle nature as the reinforcement ratio increased. Additionally, it is preferable to limit the compressive strain in GFRP bars to less than 20% of their ultimate tensile strain and the strain in GFRP spirals to less than 12% of their ultimate strain to ensure the safe and reliable use of these materials in RC columns. This research also considers the prediction of the axial load capacities using established design standards permitting the use of FRP bars in compressive members, namely ACI 440.11-22, CSA-S806-12, and JSCE-97, and underscores their limitations in accurately predicting GFRP–RC columns’ failure capacities. This study proposes an equation to enhance the prediction accuracy for GFRP–RC columns, considering the contributions of concrete, spiral confinement, and the axial stiffness of longitudinal GFRP bars. This equation addresses the shortcomings of existing design standards and provides a more accurate assessment of the axial load capacities for GFRP–RC columns. The proposed equation outperformed numerous other equations suggested by various researchers when employed to estimate the strength of 42 columns gathered from the literature.

1. Introduction

1.1. Background

Reinforced concrete (RC) columns have played a significant role in the history of building construction. The idea of RC with steel was first introduced by French gardener Joseph Monier in the late 19th century, and this concept has since become a crucial aspect of modern construction. RC columns offer a combination of the compressive strength of concrete and the tensile strength of steel, making them ideal for use in high-rise buildings, bridges, and other structures that require strong and durable support [1]. The use of RC columns not only increases the strength and stability of the structure, but it also provides a more economical and efficient building solution, as it reduces the amount of material required and simplifies the construction process [2]. The development of RC columns has revolutionized the construction industry and they continue to be an essential component in the design and construction of modern buildings [3,4].
The use of fiber-reinforced polymer (FRP) bars in RC building has gained popularity in recent years due to their high strength-to-weight ratio and corrosion resistance. FRP bars are composed of composite materials and are designed to replace traditional steel reinforcement bars in concrete structures [5]. Unlike steel, FRP bars are resistant to corrosion and degradation over time; however, they are subject to aging processes that can affect their long-term durability and mechanical properties [6]. The lightweight and flexible nature of FRP bars allows for easy handling and installation, leading to significant time and cost savings in construction [7]. FRP–RC columns have been used in many high-performance structures, such as bridges, high-rise buildings, and seismic-resistant structures, providing increased safety and durability [8]. The use of FRP bars in RC construction is a growing trend, and their popularity is expected to increase as more research and development is conducted to optimize their use in various structures [9,10].
Several studies have been conducted to evaluate the impact of certain parameters on the performance of FRP–RC columns. Sharma et al. [11] investigated the effect of the axial reinforcement ratios (0.72, 1.1, and 1.45%) on square columns strengthened with GFRP bars. The results showed that an increase in axial reinforcement led to an increase in ductility for the GFRP–RC columns. Similar findings were reported by Lotfy [12] in another study on the influence of the axial reinforcement ratios on eight square columns. De Luca et al. [13] also observed a similar trend when they examined the behavior of square GFRP–RC columns reinforced with either GFRP or steel bars. Their study found that the contribution of the GFRP bars as axial reinforcement to the overall capacity of the RC columns was approximately 5%.
Tobbi et al. [14] carried out a study aimed at assessing the compressive behavior of square GFRP–RC columns. Their findings indicated that the column capacity could be estimated by assuming the compressive strain of the GFRP bars to be 35% of their tensile strain. In subsequent research by Afifi et al. [15,16], the performance of twenty-three circular FRP–RC columns was evaluated under an axial load. Their study investigated the influence of factors such as the axial reinforcement ratio, spacing, and diameter of spiral reinforcement composed of either glass or carbon FRP bars. The results revealed that the column capacity could be estimated by assuming the compressive strain of the GFRP bars to be 25% of their tensile strain. Mohamed et al. [17] and Xue et al. [18] proposed a common limit of 2000 µε for the contribution of GFRP bars in RC columns. Similarly, Hadi et al. [19] conducted a study on GFRP–RC columns and recommended that this value should not exceed 3000 µε. On the other hand, Hadhood et al. [20], based on tests conducted on GFRP–RC columns subjected to eccentric loading, suggested a limit of 2400 µε. Meanwhile, Youssef and Hadi [21] advised that this value should be restricted to the maximum strain value generated in the concrete. Alsuhaibani et al. [22] tested nine concrete columns reinforced with steel and GFRP bars. The results showed that the GFRP-reinforced columns had an enhanced capacity with closely spaced ties and only a 5–7% reduction in capacity with wider tie spacing compared to columns reinforced with steel. Sajedi et al. [23] tested 16 circular short-scale columns to compare GFRP and steel RC columns. Their study concluded that GFRP–RC columns were more ductile, but GFRP rebars contributed less to the axial-load-carrying capacity than steel rebars.

1.2. Objectives of the Study

This study addresses recommendations from the previous literature regarding strain in longitudinal FRP bars, aiming to determine the optimal strain values while considering the confining effect of FRP spirals. Additionally, it comprehensively evaluates the strain behavior of short circular RC columns under axial loading, focusing on how the GFRP bar axial reinforcement ratio and spiral spacing influence the strain distribution, strength, and stability, in line with current FRP standards. Furthermore, this study compares the behavior of GFRP-reinforced columns with traditionally steel-reinforced ones, highlighting insights that are crucial for structural design and performance assessments. It also acknowledges the challenges of FRP bars in column applications, particularly their brittle nature under tensile stress compared to steel, which may lead to sudden failure and necessitates careful design considerations and monitoring to ensure reliable structural integrity, given their sensitivity to environmental factors [24,25].

2. Experimental Work

In the current endeavor, a comprehensive study was conducted to evaluate the performance of short reinforced concrete (RC) columns under a concentric compressive axial load. Short concrete columns were chosen to comply with building height restrictions, given the lack of specific design criteria for such columns. Typically located in frame structures, these columns are often found in spaces with restricted vertical clearance, such as beneath mezzanines or within parking garages. This placement optimizes space usage while ensuring adequate structural support. Five full-scale RC columns were cast and tested. Four of these columns were strengthened by integrating GFRP bars and spirals into their structures, while the fifth column was used as a reference and was reinforced using steel bars and spirals. All of the columns had the same dimensions, with a diameter of 250 mm and a total length of 1000 mm, as shown in Figure 1.

2.1. Material Properties

GFRP bars and spirals, which were coated with sand for enhanced reinforcement, were employed to strengthen all four GFRP–RC short columns. This reinforcement was applied in both the longitudinal and transverse directions, ensuring comprehensive structural integrity throughout the columns. To achieve fiber content of about 80%, continuous E-glass fibers were saturated with a thermosetting vinyl ester resin and additives. Thermosetting resin composite bars offer superior mechanical strength and stiffness compared to thermoplastic bars, making them more effective in providing structural reinforcement. They also demonstrate better durability against corrosion and environmental factors, ensuring a longer service life in harsh conditions. While thermoplastic bars may offer advantages such as easier fabrication and potentially better fatigue resistance, thermosetting resin composite bars are generally preferred for their overall strength, durability, and suitability for demanding concrete reinforcement applications.
The sand-coated GFRP reinforcement was used to enhance the bond between the bars and surrounding concrete. GFRP longitudinal bars with a size of No. 5 (15.9 mm) were employed in all of the GFRP–RC columns, and, in the perpendicular direction, No. 3 (9.5-mm) GFRP spiral reinforcement was distributed. According to ASTM-D3171 [26], the longitudinal GFRP bars’ tensile characteristics were evaluated, and they are shown in Table 1. By incorporating sand-coated GFRP bars and spirals into the GFRP–RC columns, this study aimed to better understand the mechanical properties of this composite material and its feasibility for use in columns.
The steel–RC column was reinforced using two ASTM grade 60 rebars. Mild M10 steel bars with a diameter of 9.5 mm were used for the transverse spiral reinforcement, while deformed M15 steel bars with a diameter of 16 mm were used for the longitudinal reinforcement. Table 1 also includes the grade 60 steel bars’ tensile properties.
Using ready-mixed, regular-weight concrete with average compressive strength of 38 MPa, all columns were cast on the same day. The average test results of three concrete cylinders, measuring 150 mm in diameter and 300 mm in length, were computed to determine the actual compressive strength, on the day that the testing of each column occurred.

2.2. Columns’ Preparation

To determine the effects of the reinforcement type (GFRP and steel), longitudinal reinforcement ratio, and spacing between the spiral reinforcement, a test plan was developed. Table 2 contains information about the reinforcement and test matrix for the columns. The letters G and S denote columns reinforced with GFRP or steel bars, respectively, and are used to identify each column. The number of longitudinal GFRP or steel bars is represented by the first digit of the unique ID. The second digit represents the interval of the spirals in mm.
Figure 2 depicts the use of GFRP cages to construct various column configurations. Each roll of GFRP or steel spiral reinforcement was a seamless, single-helical spiral. To prevent early failure, the spiral pitch was lowered to 20 mm directly outside of the test section at both edges of the columns (200 mm long). The concrete cover’s distance from the spiral edge remained constant at 25 mm. Rigid sonotubes were used to set up the columns for vertical casting, and wooden formwork kept the sonotubes in place. The steel and GFRP cages were then placed inside the formwork’s sonotubes. For the purpose of simulating conventional column construction techniques, all of the columns were poured vertically. The concrete was supplied by a ready-mixed concrete firm. From a concrete truck, the concrete was poured into the column forms over the course of two lifts. Air bubbles in the concrete were removed and it was compacted using an electronically controlled internal vibrator. Figure 3 depicts the column production process both prior to and after pouring.

2.3. Instruments Used during Testing

The instrumentation used in this study was carefully selected to accurately capture the local strain distribution of the columns. Electrical strain gauges were used to measure the strain on the longitudinal steel or GFRP bars and the spiral reinforcement at the midpoint, providing valuable data on the behavior of the columns under axial stress. Twelve electrical strain gauges were strategically placed at three different locations in the RC columns—specifically at mid-height and at both ends—to monitor the concrete strain. This method provided essential data crucial for the assessment of the overall column behavior. The strain gauges were divided into four groups, with three gauges placed on each face of the columns to accurately capture the strain generated within the concrete on all sides. Each group was oriented either 90 or 180 degrees apart from the others for comprehensive strain measurement. The use of three LVDTs to measure axial deformation allowed for a comprehensive assessment of the columns’ response to the applied load. These LVDTs were positioned along the hoop direction, ensuring that any deformation was accurately captured.
To ensure that the applied load was distributed evenly across the columns’ entire cross-sections, before testing, a thin layer of high-strength cement grout was applied to both ends of the columns. This step was crucial in achieving accurate and reliable results, as it prevented any local failure and ensured that the columns were loaded uniformly. Additionally, steel collars were used to externally confine the end regions and prevent premature failure. The combination of these measures ensured that the columns were subjected to a pure axial compression load during testing and allowed for the accurate measurement of their behavior under axial stress.

2.4. Test Setup

The testing phase was carried out using a state-of-the-art 11,400 kN MTS testing machine, with a displacement control mode of 0.001 mm/s. The internal load cell of the testing apparatus was used to measure the axial load and machine head displacement that were applied to the top of the columns. The recorded load, axial displacement, concrete strain, and reinforcement strain were all crucial to the analysis of the columns’ behavior under axial stress. The automatic data acquisition system that was connected to a computer allowed for the efficient and accurate recording of these measurements. The typical test setup for the concentrically loaded columns is shown in Figure 4.

2.5. Analysis of Outcomes

2.5.1. Behavior and Mode of Failure

Table 3 gives an overview of the experimental findings for the axially loaded short columns. The axial strain in the longitudinal and spiral reinforcements, as well as the maximum load and corresponding concrete strain, was noted. Figure 5 shows the cracking conduct of a typical GFRP–RC column at different loading stages. All columns’ cracking conduct during the failure stage is depicted in Figure 6. Both the GFRP–RC and steel–RC columns at first behaved similarly. As the load increased, vertical microcracks gradually became more numerous and wider, beginning to appear at about 80–90% of the maximum loads. Each GFRP–RC column could withstand a maximum axial load of between 2207 and 2797 kN; higher loads were due to better confinement and higher axial rigidity. The steel–RC column (S-6-80) had a load of 2621 kN, which was 19% greater than the counterpart GFRP–RC column’s load (G-6-80).
The strain in the GFRP bars was measured by employing electrical strain gauges affixed at the mid-points of the bars (Figure 7). The GFRP–RC columns’ average axial longitudinal reinforcement strain at the maximum load ranged from 2498 to 4069 µε, with an average value of 3283 µε. This was less than 20% of the ultimate tensile strain (16,800 µε). The yield strain was reached by the axial bars in the steel–RC column, whose corresponding strain was 2300 µε. In a similar manner, the strain in the spirals was recorded using electrical strain gauges (Figure 8). The measured average spiral strain for the GFRP and steel columns was 1950 and 663 µε, respectively. These values were 12 and 29% of the ultimate and yield strain for the GFRP and steel bars, respectively. Up until the onset of cover spalling, the load–strain relationships’ ascending branches were almost linear in the spiral reinforcement.
With an average value of 2650 µε, which was very close to the calculated unconfined concrete strain of 2600 µε, the GFRP–RC columns reached their maximum load at a strain level ranging from 2236 to 3108 µε. The slight eccentricity in the load was caused by the initial spalling of the concrete, which frequently happened on one side and was not uniform on the other sides. Within a short time, the cracks spread to the other sides and between 5 and 15% of their maximum capacities was lost. This was when the spiral’s confining restraint was initiated, allowing the column to once again support an increased load while the concrete core experienced its highest stress. Because of the light restraint offered by the GFRP spirals, the test results showed that the failure in the GFRP–RC columns with large spiral spacing (80 mm) was dominated by longitudinal bar crumpling. However, the reason for the failure of the tightly confined GFRP–RC columns with narrower spiral spacing of 40 mm was the collapse of the concrete core and, to a lesser extent, the rupture of the spirals.
The well-confined and heavily reinforced GFRP–RC column (G-10-40) partially displayed a second peak load. The illustration in Figure 8 displays two distinct peaks. The initial peak corresponds to the time of spalling, while the second one follows the spalling of the cover and marks the complete activation of the restraint offered by the spiral reinforcement. In the latter peak, the column exhibited exceedingly high strain in the spiral reinforcement, measuring 7307 µε. These observations imply that once the cover spalled, the spirals were triggered and demonstrated their efficacy in confining the concrete core. All columns showed the development of longitudinal steel yielding, spiral steel yielding, the sudden and explosive fracture of the GFRP or steel spirals, the rupture and crumpling of the longitudinal GFRP bars, the buckling of the longitudinal steel bars, and finally the crushing of the concrete core at the end of this stage.
During the test, it was found that the columns reinforced with GFRP bars and those reinforced with steel bars experienced significantly different spiral rupture occurrences. The rupture of the GFRP spirals seemed to be more explosive and abrupt, and it was discovered that it frequently happened at the intersections with the longitudinal bars. In the crushed zones of the tested columns, a clear, singularly inclined failure plane was visible when the test was stopped. The shear sliding of the column’s top and bottom portions produced this plane. Within the same zone, the intersection of the fractured spirals and buckled longitudinal bars formed the diagonal failure plane.
Figure 9 shows the bending and rupture of the longitudinal bars in the failure zone, as well as the rupture of both the GFRP and steel spirals. The diagonal failure plane is indicated in this figure by the dashed line and circle. These findings imply that GFRP bars differ from steel bars in their failure modes, and further investigation is needed to fully comprehend the conduct of GFRP–RC short columns.

2.5.2. Effects of Test Parameters

Figure 10 compares the axial load–strain curves of the short columns. All columns’ axial strain values were calculated after measuring the axial deflections of the columns using LVDTs, and the data were gathered using a data acquisition system. At up to 80 to 90% of their peak loads, all columns initially behaved similarly and showed nearly linear load–strain behavior in the ascending part. Depending on how the test parameters affected the concrete core’s ability to contain the peak load, there were variations in the axial strain and corresponding peak load. According to Table 2, confinement increased the concrete core’s strength, which is shown by the ratio f/cc/f/co, where f/cc stands for the strength of the confined concrete and f/co for the compressive strength of the unconfined concrete. The stress–strain curve, showcased in Figure 11 as an example for column G-6-80, provides insights into the column’s performance under confinement and was used to calculate f/cc and f/co. Initially, the strain generated within the column was negligible or non-linear, attributed to the preservation of its entire cross-sectional area and the absence of cracks that could influence its behavior. As the column experienced crack initiation, it exhibited an approximately linear response up to the first peak load. The upper curve in the graph represents the confined concrete area defined by the centerline of the outer tie, while the lower curve corresponds to the total load divided by the total concrete cross-sectional area. The dashed colored curve in the middle (Path 0-I-II-III) depicts the concrete column’s actual response, which was predicted to be a blend of the two calculated curves. The table displays the ductility of the concrete as the ratio ε 85     /   ε 1 , where ε 85   is the axial strain defined at an axial load equivalent to 85% of the peak load ( 0.85   P f ) in the descending part of the load–strain curve (see Figure 12) and ε 1 is defined at a strain equivalent to the limit of elastic behavior on the ascending part. Once more, the initial non-linear behavior or low strain depicted in Figure 13 can be attributed to the intact cross-section’s resistance to the applied load.

Type of Reinforcement

The G-6-80 column is a structural component that was designed using six longitudinal bars of GFRP. The design aimed to achieve the same strength as the S-6-80 column, which is a similar structural component that uses six longitudinal steel bars. The strength equivalence was determined based on the areas of the longitudinal reinforcement, denoted as A f and A s t , for GFRP and steel, respectively, and the respective strength values of the materials, denoted as f f u and f y . To account for the compressive strength reduction of the GFRP bars, a reduction factor of 0.5 was assumed ( f y A s t = 0.5   f f u A f ) .
The axial load–strain behavior of the G-6-80 column was found to be the same as that of the steel–RC counterpart, S-6-80. Additionally, and as per Table 2, the confinement efficiency when using GFRP longitudinal bars and spirals in the G-6-80 column was found to be similar to that of the steel–RC counterpart, as measured by the strength enhancement of the concrete core at the maximum stress (f/cc/f/co). The ratios of f/cc/f/co at the maximum stress for the GFRP and steel–RC columns were found to be 1.80 to 1.95, respectively.
The GFRP–RC column had an axial capacity 15.8% lower than that of its steel–RC counterpart. Nevertheless, the G-6-80 column displayed similar ductile behavior and a similar rate of strength decay after reaching its peak strength to those of the S-6-80 column, indicating that it could tolerate a similar amount of deformation before failing. The ductility index, which measures a material’s ability to undergo plastic deformation before failure, was found to be close for the GFRP column (2.04) and its steel counterpart (2.53). The lower modulus of elasticity of the GFRP bars meant that they carried less stress than the steel bars. Due to this, the concrete in the G-6-80 column was anticipated to carry more stress than the S-6-80 column. These findings align with previous research and experimental results [13,14].

Axial GFRP Reinforcement Ratio

In Figure 10, the load–strain behavior of four GFPR–RC columns, namely G-6-80, G-10-80, G-6-40, and G-10-40, is displayed. These columns were designed with two different longitudinal reinforcement ratios: 2.4% and 4.0%. The column with a higher reinforcement ratio (4.0%), namely G-10-40, demonstrated brittle and explosive failure compared to the ductile behavior observed in specimens with a lower reinforcement ratio (2.4%). However, it is worth noting that the column with wider spiral spacing, G-10-80, exhibited less explosive failure. The sudden spalling of the concrete cover caused the GFRP specimens to lose between 5.0 and 15% of their maximum capacities after reaching the peak load, which significantly affected their ductility and confinement efficiency. However, as shown in the figure, the column with a higher reinforcement ratio (G-10-40) exhibited a secondary peak load, likely caused by the spirals’ confinement effect. This suggests that the spirals played a significant role in enhancing this column’s overall performance. Increasing the reinforcement ratio improved the confinement efficacy of the tested specimens, with the f/cc/f/co values ranging from 1.80 to 1.99. The specimens with a higher reinforcement ratio exhibited higher f/cc/f/co values. Additionally, increasing the longitudinal reinforcement from 2.4 to 4.0% reduced the axial strain at the same load level by 2 to 10%.
According to Table 2, a higher reinforcement ratio resulted in an 11 to 18% increase in strength. However, it cannot be definitively concluded that the enhanced strength was solely due to the longitudinal GFRP reinforcement ratio. This is because the spirals also played a crucial role in enhancing the strength of the GFRP–RC columns, providing effective confinement for the concrete core in columns G-10-80 and G-10-40, as illustrated in Figure 11.

Spacing of GFRP Spiral

The impact of spiral confining reinforcement, often referred to as the volumetric ratio, and the spacing of the spirals on the behavior of confined concrete has been extensively studied and documented in the field of structural engineering. Researchers such as Sharma et al. [11] have conducted comprehensive investigations revealing a consistent trend: increasing the volumetric ratio of spiral reinforcement or reducing the spacing between the spirals results in heightened lateral confining pressure. This phenomenon leads to a proportional enhancement in the effectiveness of confinement, which is critical in improving the strength and ductility of concrete under confinement conditions.
Furthermore, the role of the spiral spacing extends beyond enhancing the lateral pressure. It also plays a crucial role in stabilizing longitudinal reinforcement bars, particularly against local buckling when subjected to high stress levels. This was clearly observed in this experimental study, where a reduction in the spiral spacing from 80 to 40 mm corresponded with a noticeable increase in the lateral pressure. This increase was evidenced by the higher strain measured in the spirals, as illustrated in Figure 8.
Among the various GFRP–RC specimens tested in this study, the one featuring a well-optimized spiral configuration with 40 mm spacing (referred to as G-10-40) exhibited particularly promising behavior. This specimen demonstrated a secondary peak load even after the primary concrete cover had spalled off completely. This resilience translated into a significant 14% increase in ultimate strength and a 5% improvement in confinement efficiency (f/cc/f/co) as the volumetric ratio of the spirals increased from 1.0 to 2.0%.
Moreover, the comparative analysis between the columns with different spiral spacings (such as G-6-40 and G-6-80) revealed substantial performance differences. Column G-6-40, featuring tighter spiral spacing, exhibited 7% higher ultimate strength and 3.3% greater confinement efficiency compared to its counterpart with wider spacing (G-6-80). These results underscore the critical role of the spiral spacing in optimizing the structural performance of GFRP–RC columns.
Importantly, GFRP–RC columns with closer spiral spacing (specifically G-6-40 and G-10-40) demonstrated superior post-peak behavior, characterized by more controlled crack propagation and enhanced ductility. The tighter spiral spacing effectively constrained the cracked concrete core laterally, thereby delaying the onset of unstable crack propagation and promoting greater overall structural stability.
Overall, these findings highlight the importance of considering the spiral spacing as a key factor in designing GFRP–RC columns to optimize their performance and durability over time.

2.6. Design Standards and Ultimate Strength

The axial capacity of FRP–RC members can be predicted using three standards published across the world. These include two standards from North America, ACI 440.11-22 [24] and CSA-S806-12 [27], and one standard from Asia, JSCE-97 [28]. These standards include various factors that may affect the performance of FRP–RC members, such as the concrete matrix properties. By utilizing these standards, engineers and designers can ensure safe and reliable structures constructed with FRP–RC members.

2.6.1. American Standard ACI 440.11-22 [24]

As per the ACI 440.11-22 standard [24], it is acceptable to utilize FRP bars as longitudinal reinforcement in columns that experience only axial loads (P0). This standard recognizes the FRP bars’ contribution to the columns’ ultimate capacity, with stiffness equivalent to that of the surrounding concrete, as evidenced by Equation (1). The factor f c denotes the compressive strength of the concrete cylinder, and A G represents the cross-sectional areas of the concrete.
P O   = 0.85   f c / A G

2.6.2. Canadian Standard CSA-S806-12 [27]

According to the CSA-S806-12 standard [27], it is acceptable to use FRP bars as longitudinal reinforcement in columns that experience axial loads only, represented by P0. This standard disregards the contribution of FRP bars to the ultimate capacity of the columns, as evidenced by Equation (2). The factor α 1 denotes a reduction for the concrete contribution, while f c refers to the compressive strength of the concrete cylinder. A G and A F represent the cross-sectional areas for the concrete and FRP bars, respectively.
P O   = α 1   f c / ( A G A F )
α 1 = 0.85     0.0015 f c /   0.67

2.6.3. Japanese Standard JSCE-97 [28]

To estimate the axial loads of FRP–RC members, the JSCE-97 standard utilizes Equations (4) and (5). In cases where the column is reinforced with spirals as shear reinforcement, the larger value from both equations must be used.
P O   = 0.85   f c / A G   /   γ b
P O   = ( 0.85   f c / A e + 2.5   E S P   £ f s p d   A s p e ) /   γ b
The variable A e represents the cross-sectional area of the concrete that is enclosed by the spiral reinforcement. The Young’s modulus of the spirals is denoted by E S P , while £ f s p d represents the design value for the strain of the spiral reinforcement, which is usually assumed to be 2000 microstrains. The member factor, γ b , is 1.3. The cross-sectional area of the spiral, A s p e , can be calculated using Equation (6), where d s p represents the diameter of the concrete section enclosed by the spiral reinforcement, A s p is the cross-sectional area of the spiral, and s is the pitch of the spiral reinforcement.
A s p e = π   d s p A s p   /   s
Table 4 and Figure 13 present the projected axial loads based on the standards referenced above. The average experimental value compared to the ACI 440.11-22 [24] prediction is 1.53, with a coefficient of variation (COV) of 8.3%. Notably, in CSA-S806-12 [27], the axial load decreased by 6.7 kN, changing from 1442.5 kN (for G-6-40 and G-6-80) to 1435.8 kN (for G-10-40 and G-10-80) upon increasing the axial longitudinal reinforcement from 6 to 10 bars. This observed effect is attributed to the inadequacy of Equation (2) utilized in the standard. The average experimental to CSA-S806-12 [27] prediction resulted in a ratio of 1.71 with a COV of 9.0%.
It should be noted that the member factor in JSCE-97 [28], γ b , was assigned a value of one. JSCE-97 gave nearly a constant average prediction of 1595 kN for all GFRP–RC columns (Equation (5)). The average experimental to prediction results were slightly better than those of CSA-S806-12 [27] and nearly equivalent to the predictions from ACI 440.11-22 [24], with a ratio of 1.54 and a COV of 8.3%.

2.7. Proposed Axial Capacity Equation

Based on the discussion above, it is apparent that the three standards, which allow FRP bars to be utilized in members subjected to axial loads only, failed to provide an adequate prediction of the actual failure of the GFRP–RC axial members presented in the current work. Neither of the standards takes into account the contribution of the axial stiffness of the longitudinal GFRP bars, except ACI 440.11-22 [24]. Therefore, Equation (7) is proposed to address the deficiencies of these standards.
P O   = α 1   f c / ( A G A F ) + 0.2   f f u   A F + 2.5   E S P   £ f s p d   π   d s p   A s p   /   s
where α 1 = 0.85     0.0015 f c /   0.67 .
£ f s p d = 0.12   £ f u s p d .
This equation consists of three components. The initial part corresponds to Equation (2) in CSA-S806-12 [27]. The second component is an addition that considers the influence of the axial stiffness of the GFRP bars’ longitudinal reinforcement, limited to 20% of the ultimate tensile strain of the GFRP bars. This value represents the average strain value observed in the GFRP bars in the current work. The final element is a component that originates from Equation (5) used in JSCE-97 [28], which accounts for the impact of the spiral shear reinforcement’s confinement effect and limits the contribution to 12% of the ultimate strain of the spirals, £ f s p d = 0.12   £ f u s p d . The chosen value was also derived from the average tensile strain observed in the spirals within the context of this work.
Table 4 and Figure 13 display the results obtained from utilizing Equation (7). The predictions from the equation are closer to the experimental failure axial loads of the columns. The average experimental axial load to the one forecasted by the equation is 1.26 with a 4.0% COV.

2.8. Validation Based on the Literature

To validate the results and ensure the accuracy of Equation (7), a rigorous evaluation was conducted, which involved collecting 42 columns’ data from the existing literature. These columns served as the basis for the comparison against the following proposed equations put forth by other researchers in the field. It is important to note that none of the proposed equations that follow considers the confining effect of the spiral shear reinforcement.
Tobbi et al. [14] and Afifi et al. [16] proposed Equation (8):
P O   = 0.85   f c / ( A G A F ) + 0.35   f f u   A F
Afifi et al. [17] proposed Equation (9):
P O   = 0.85   f c / ( A G A F ) + 0.25   f f u   A F
Mohamed et al. [17] proposed Equation (10):
P O   = 0.85   f c / ( A G A F ) + 0.002   E f u   A F
Hadhood et al. [29] proposed Equation (11):
P O   = 0.85   f c / ( A G A F ) + 0.0024   E f u   A F
Hadi et al. [19] proposed Equation (12):
P O   = 0.85   f c / ( A G A F ) + 0.003   E f u   A F
Hadhood et al. [20] proposed Equation (13):
P O   = α 1   f c / ( A G A F ) + 0.0035   E f u   A F
where α 1 = 0.85     0.0015 f c /   0.67 .
Xue et al. [18] proposed Equation (14):
P O   = 0.85   f c / A G + 0.002   E f u   A F
In Appendix A, the proposed equations are explored. The results of this analysis showed that Equations (10), (11), (13), and (14) exhibited good predictive capabilities, and their forecasts were quite close to the values obtained from Equation (7). When comparing the forecasted axial loads from these equations to the average experimental values, the variations were found to be relatively small, with the experimental values falling within a range of 0.99 to 1.02 times the predicted values. This indicates a good level of accuracy in the predictions made by Equations (11), (13), and (14), which is crucial for any reliable scientific or engineering model. However, what sets Equation (7) apart and makes it particularly interesting is its unique feature—the smaller COV associated with its predictions. The COV is a statistical measure that quantifies the dispersion or scattering of a set of data points around their mean. In this context, the lower COV value means that the predicted axial loads generated by Equation (7) had less variability and were more consistent compared to those generated by Equations (10), (11), (13), and (14).
The bell curve, represented by Figure 14, is a symmetrical, bell-shaped statistical distribution commonly used to model various real-world phenomena. In this case, the bell curve was created to describe the distribution of the data for Equations (7), (10), (11), (13), and (14), each representing different models with varying mean and standard deviation values. Among these equations, Equation (7) appears to be a better fit for the data as it has a mean of 1.02 and a lower standard deviation of 0.115 compared to the other equations. A lower standard deviation suggests that the data are more tightly clustered around the mean, indicating a potentially better representation of the underlying distribution.

3. Conclusions

The present research is part of an ongoing program focused on examining the strain performance of FRP–RC columns. This study specifically investigates the strain generated within short concrete columns reinforced with GFRP bars and spirals and tested under concentric compressive axial loads. This research examined three independent variables: the reinforcement type (GFRP versus steel), the longitudinal GFRP reinforcement ratio, and the spacing of the spiral reinforcement. However, it should be noted that extrapolations to full-size columns cannot be performed directly from these results due to the potential size effect that may arise. Based on the experimental findings and analysis presented in this paper, the following conclusions regarding the strain can be drawn.
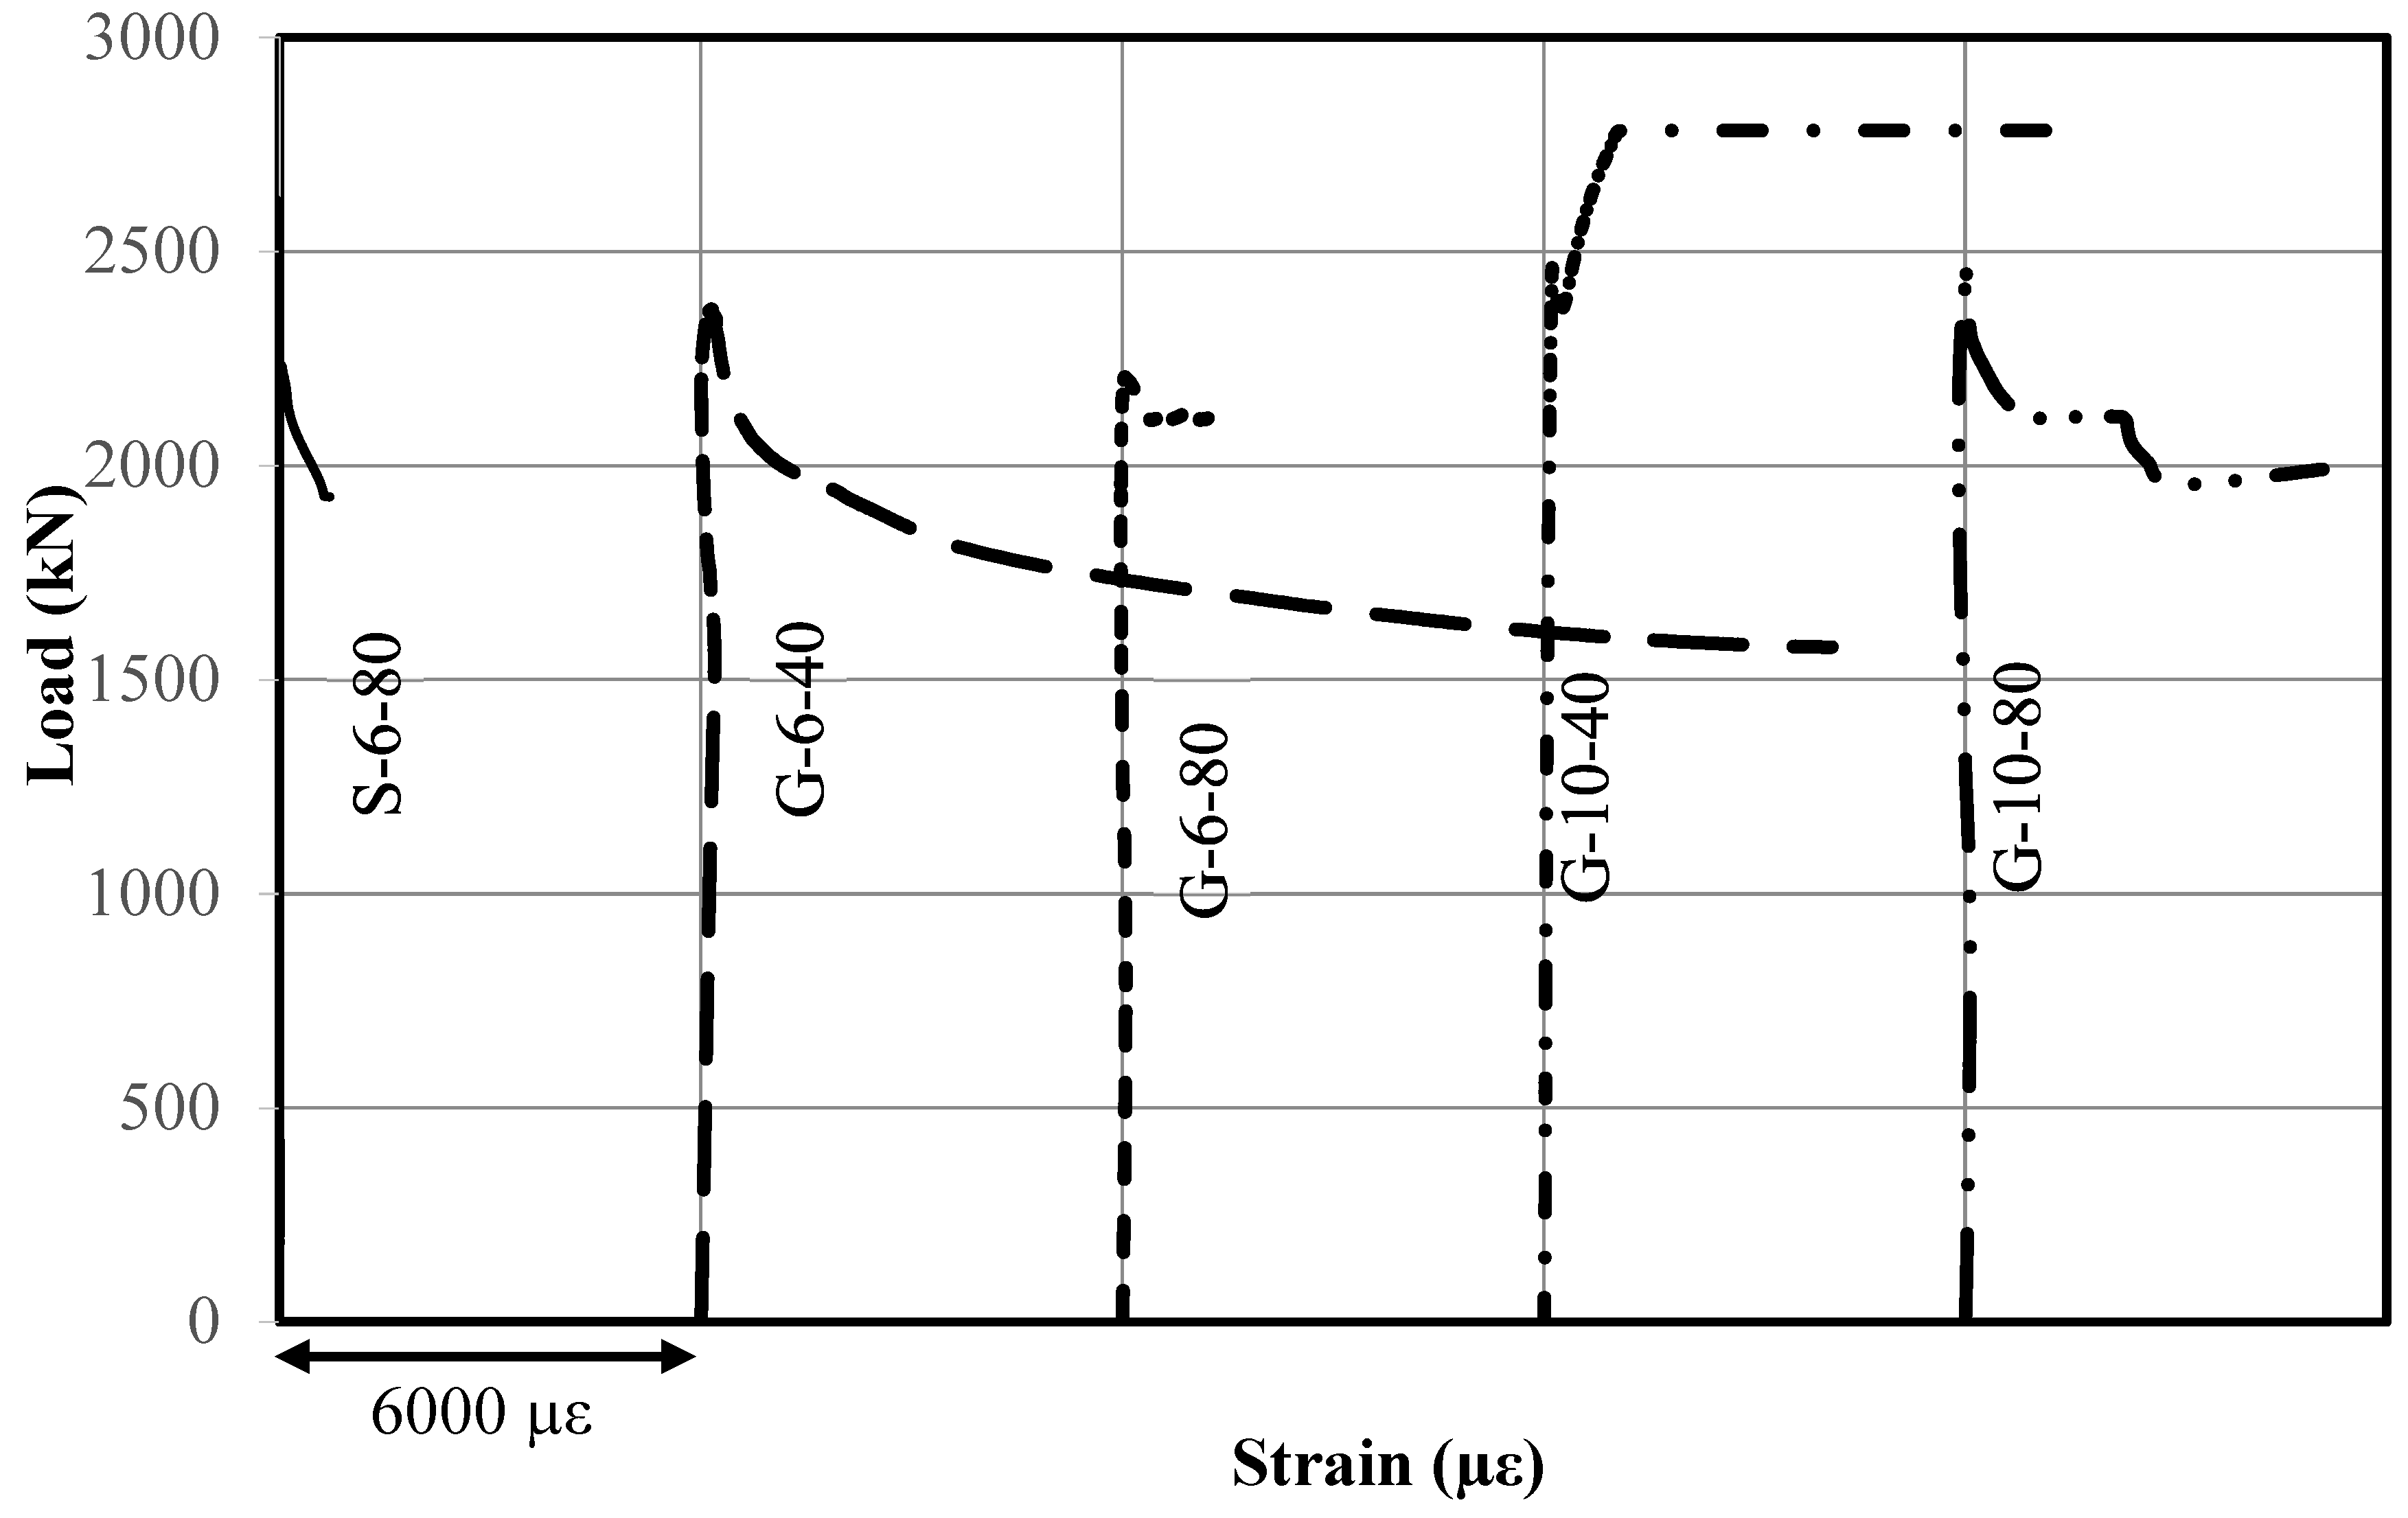
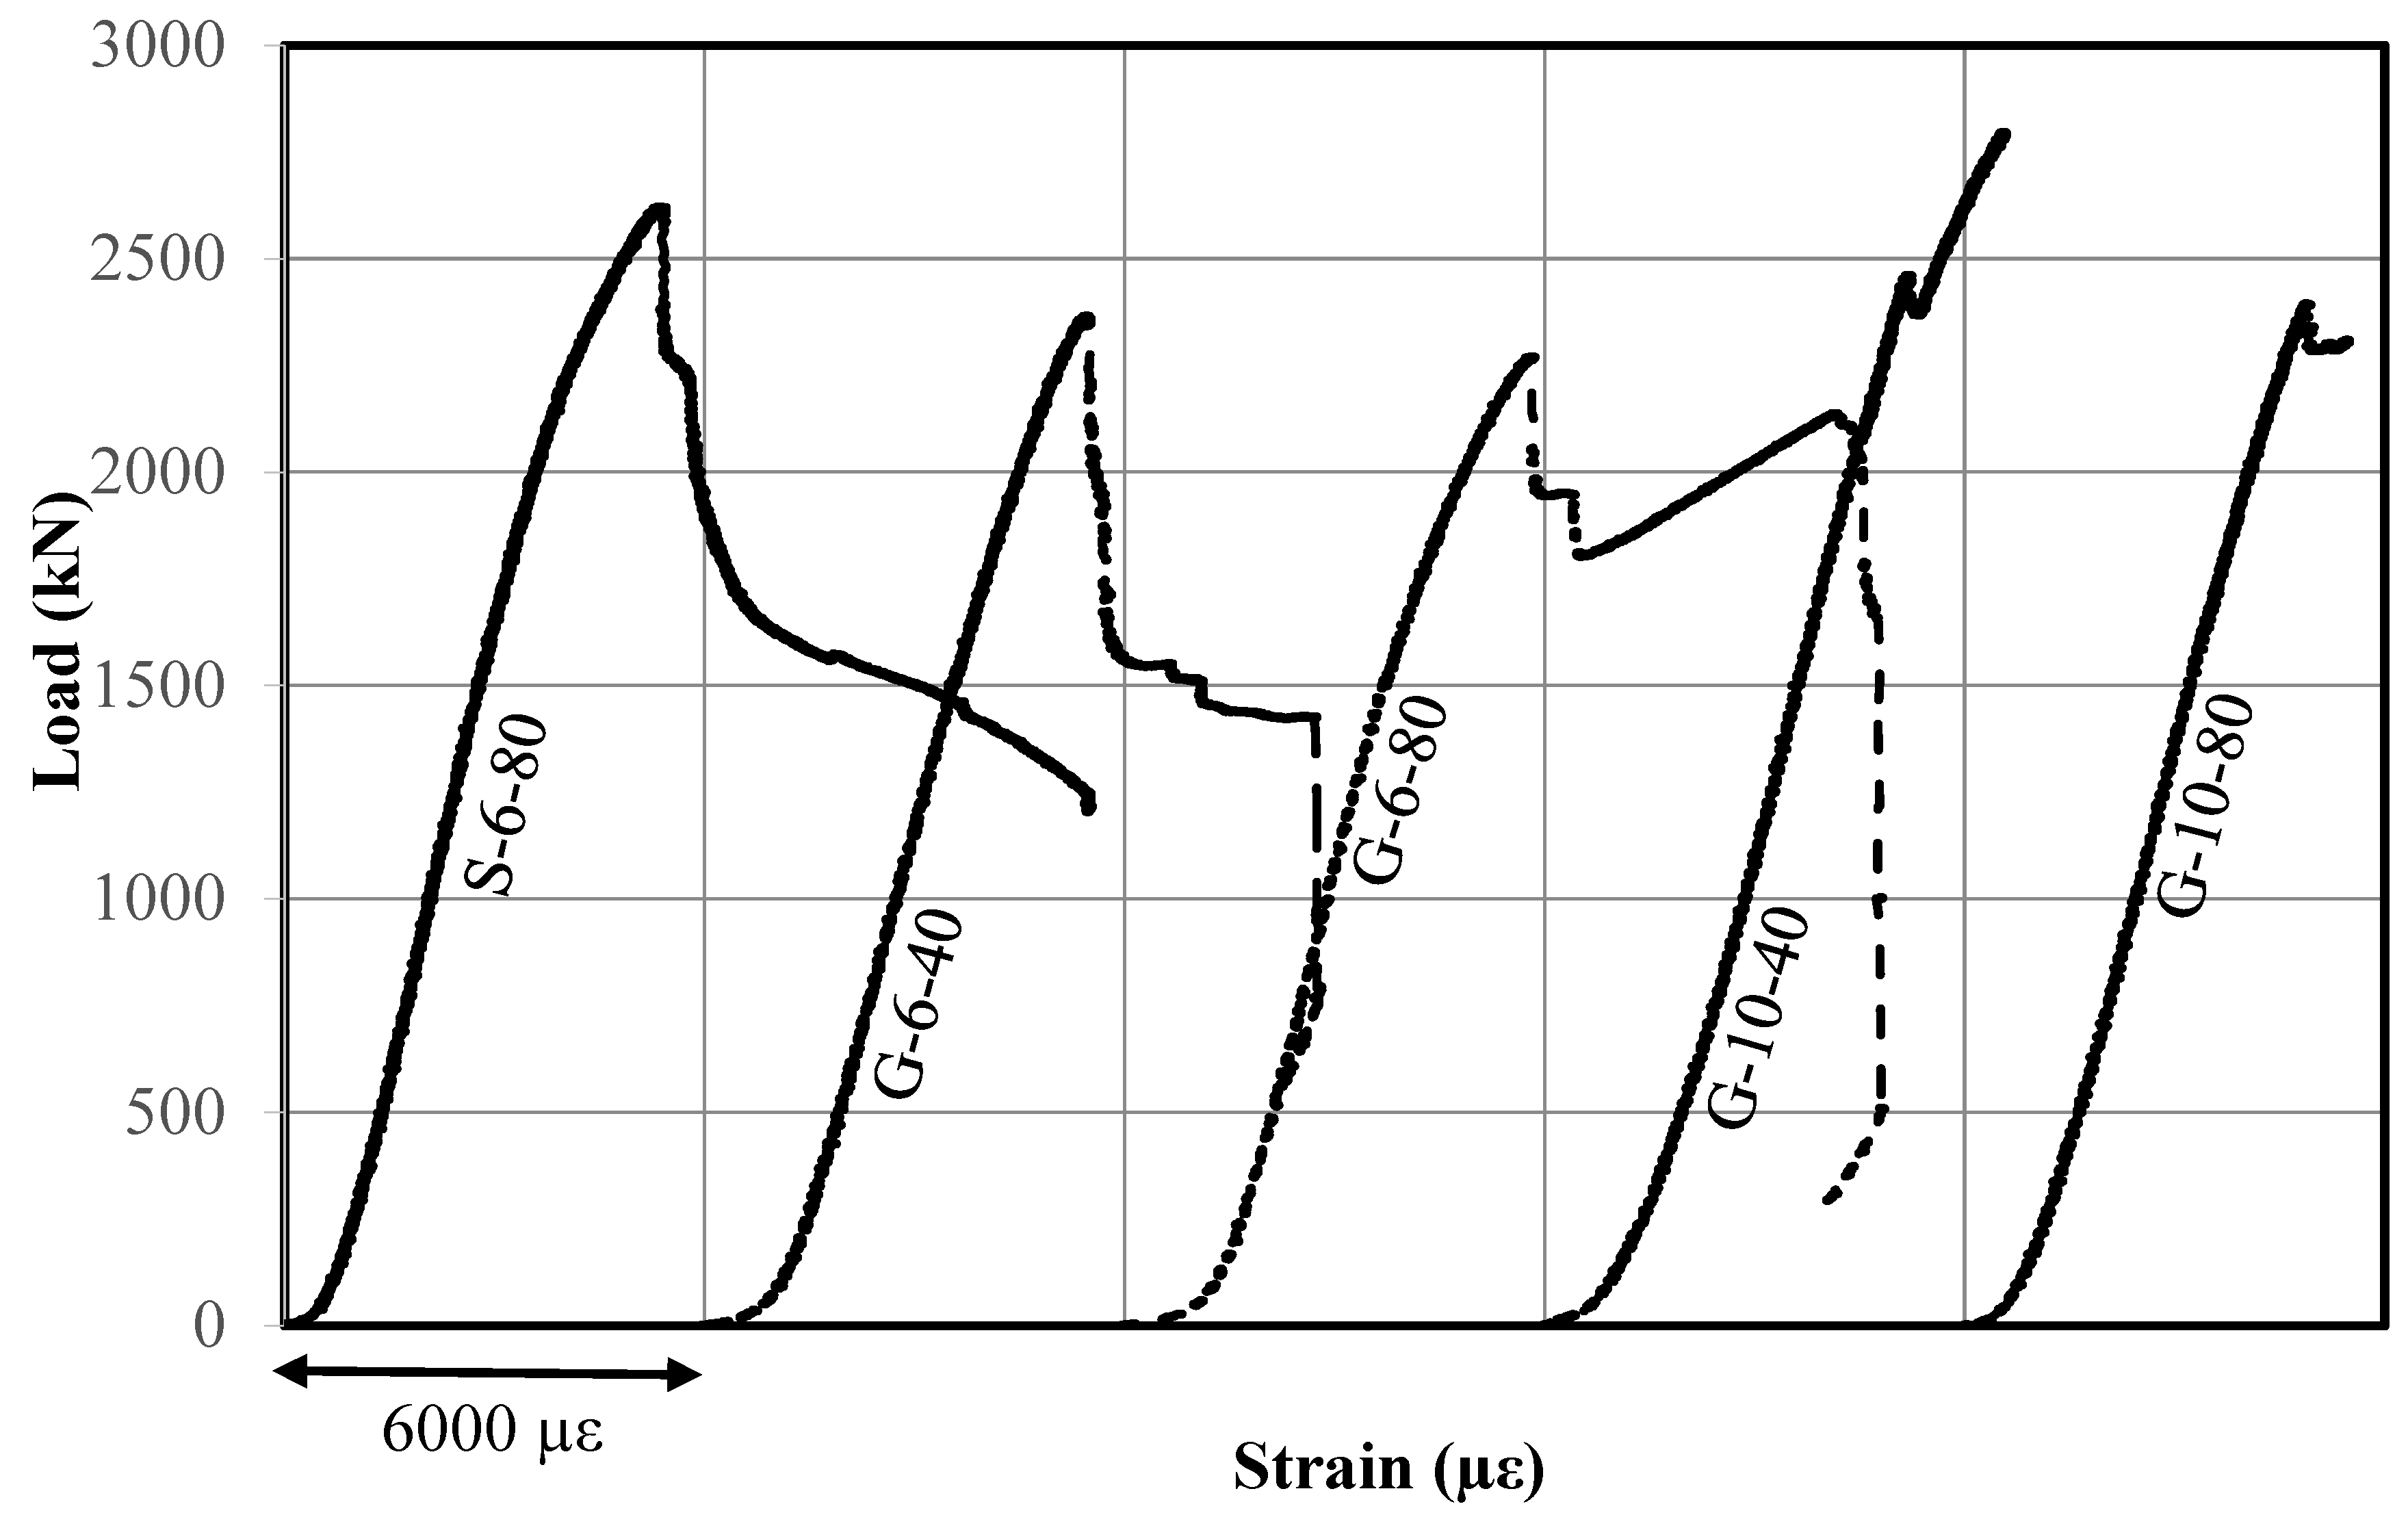
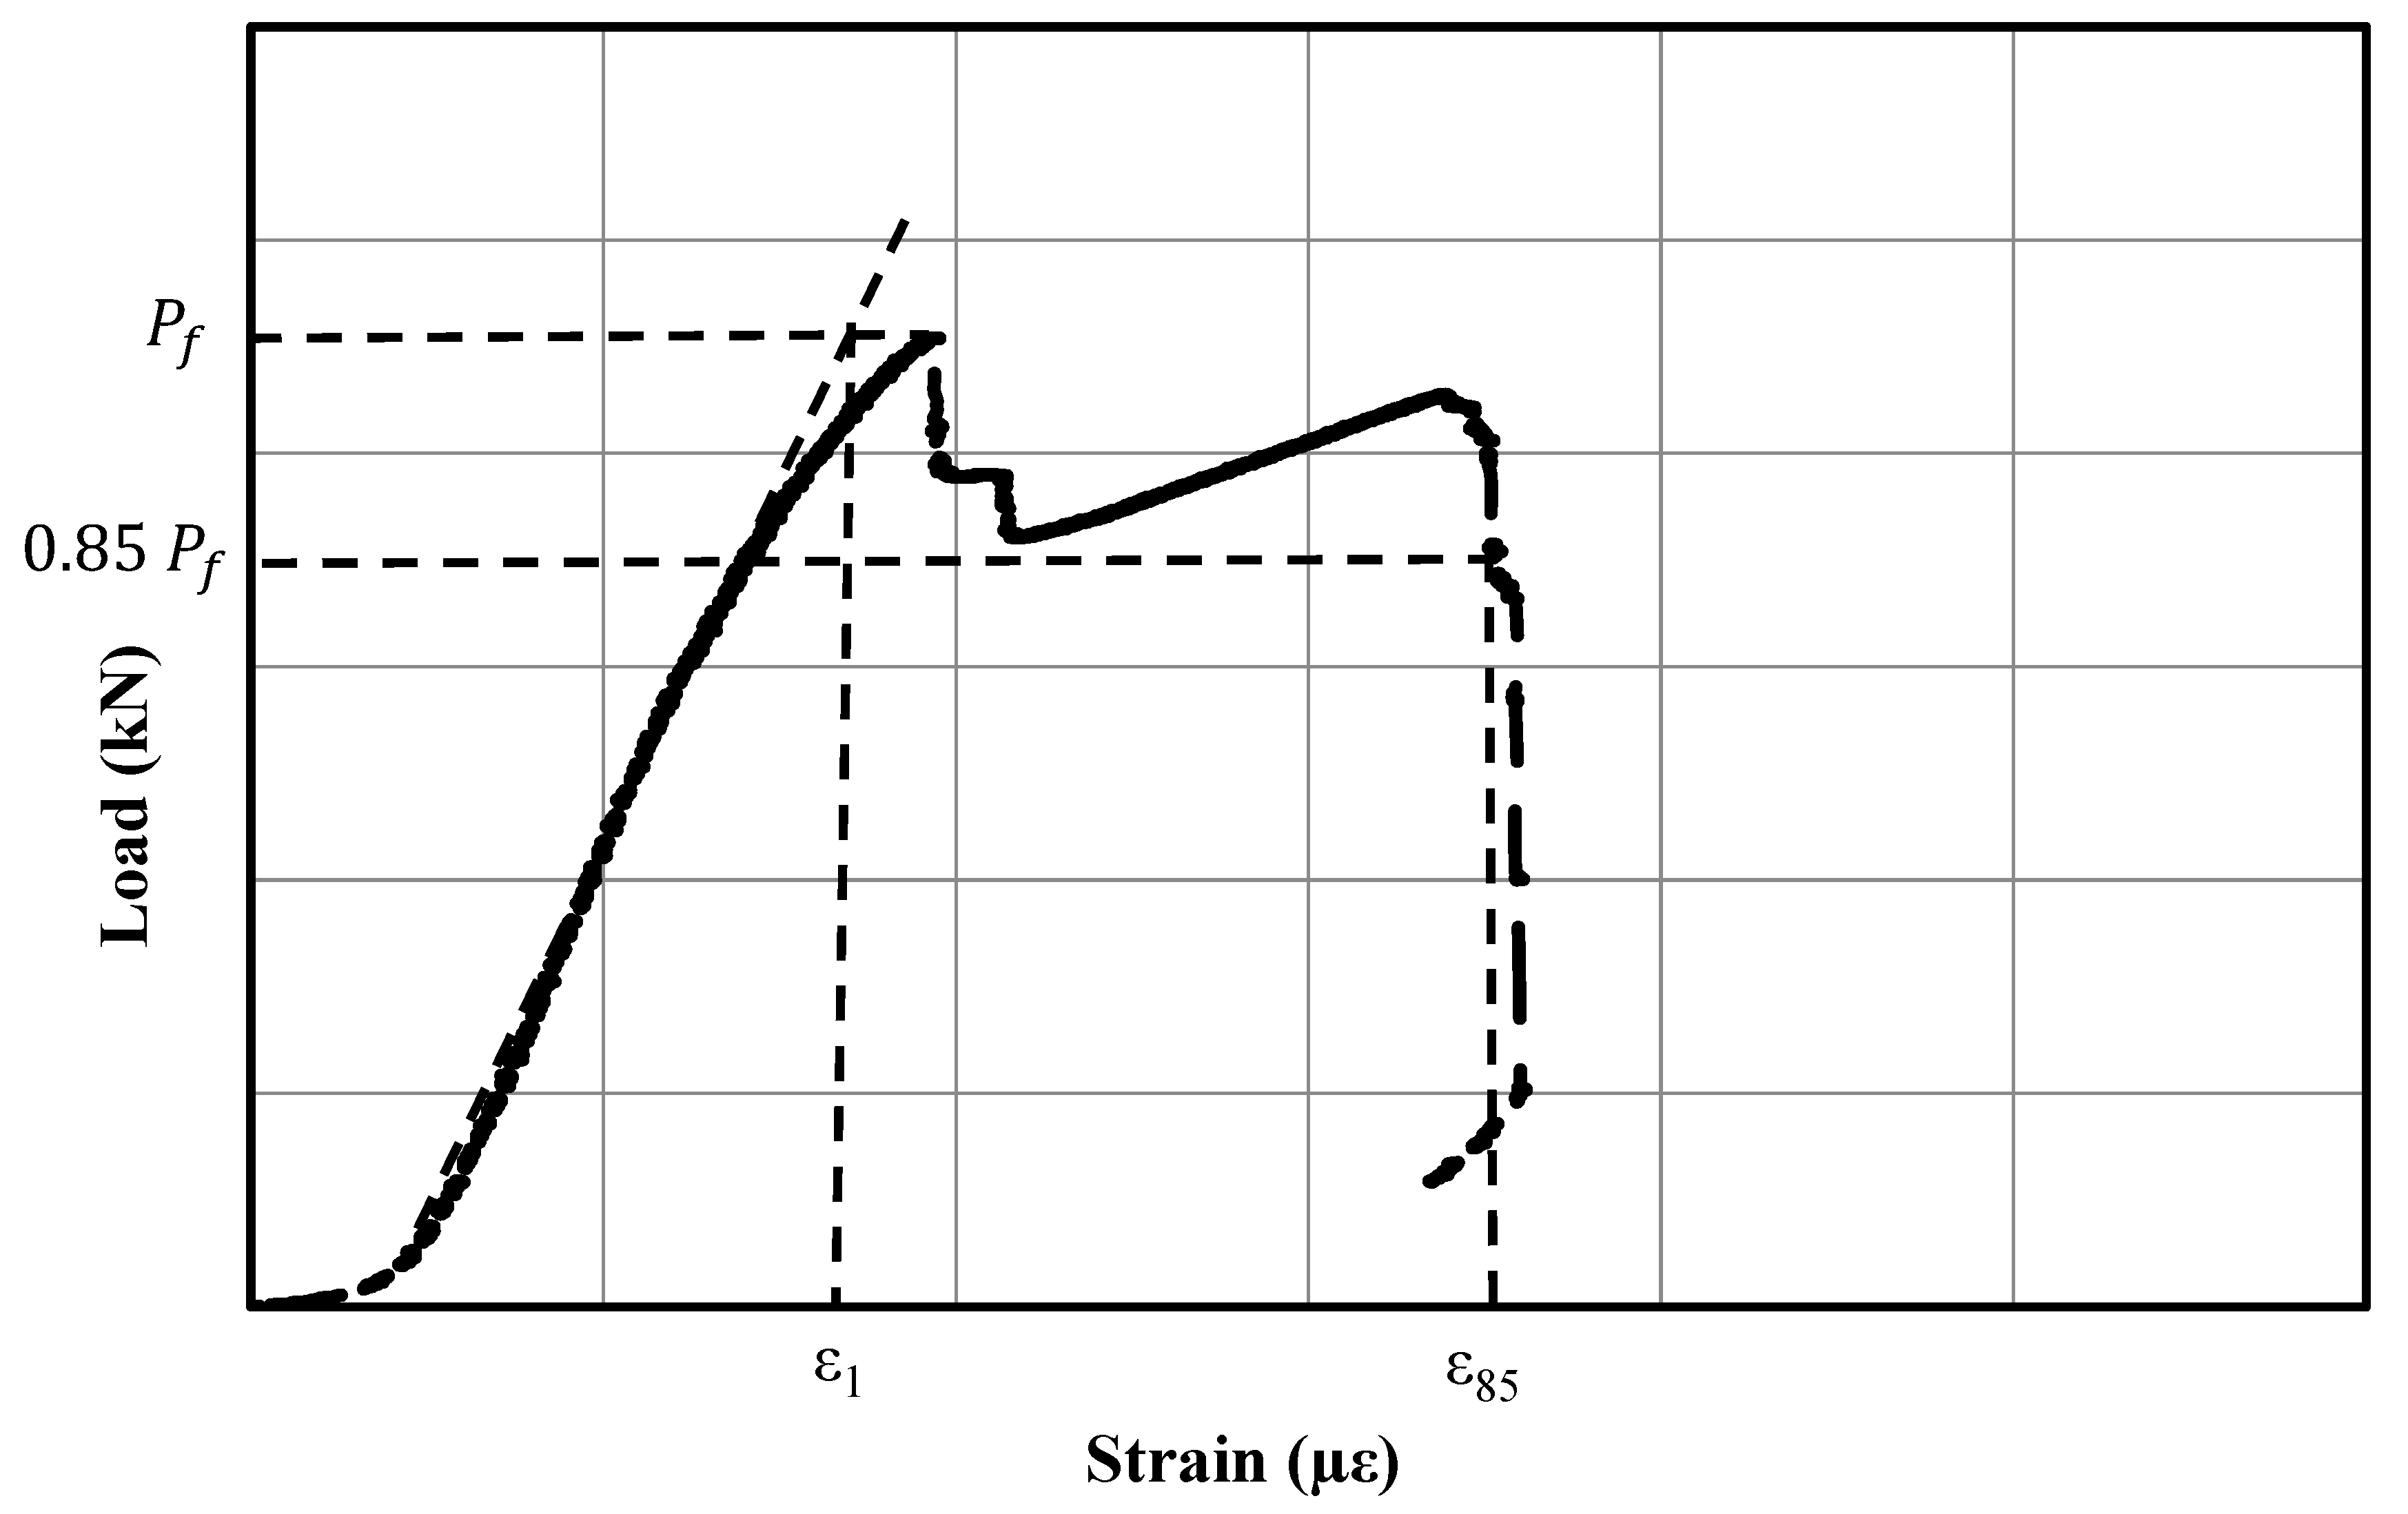
  • Up to 85% of their peak loads, both the GFRP–RC and steel–RC columns exhibited nearly linear load–strain patterns, showing comparable strain. The GFRP–RC column, labeled G-6-80, which had similar shear and flexural reinforcement to the corresponding steel–RC column labeled S-6-80, had a lower axial capacity by 15.8%. However, the GFRP–RC column labeled G-10-40, with a higher reinforcement ratio and tighter spiral, demonstrated a 6.7% greater axial capacity compared to S-6-80.
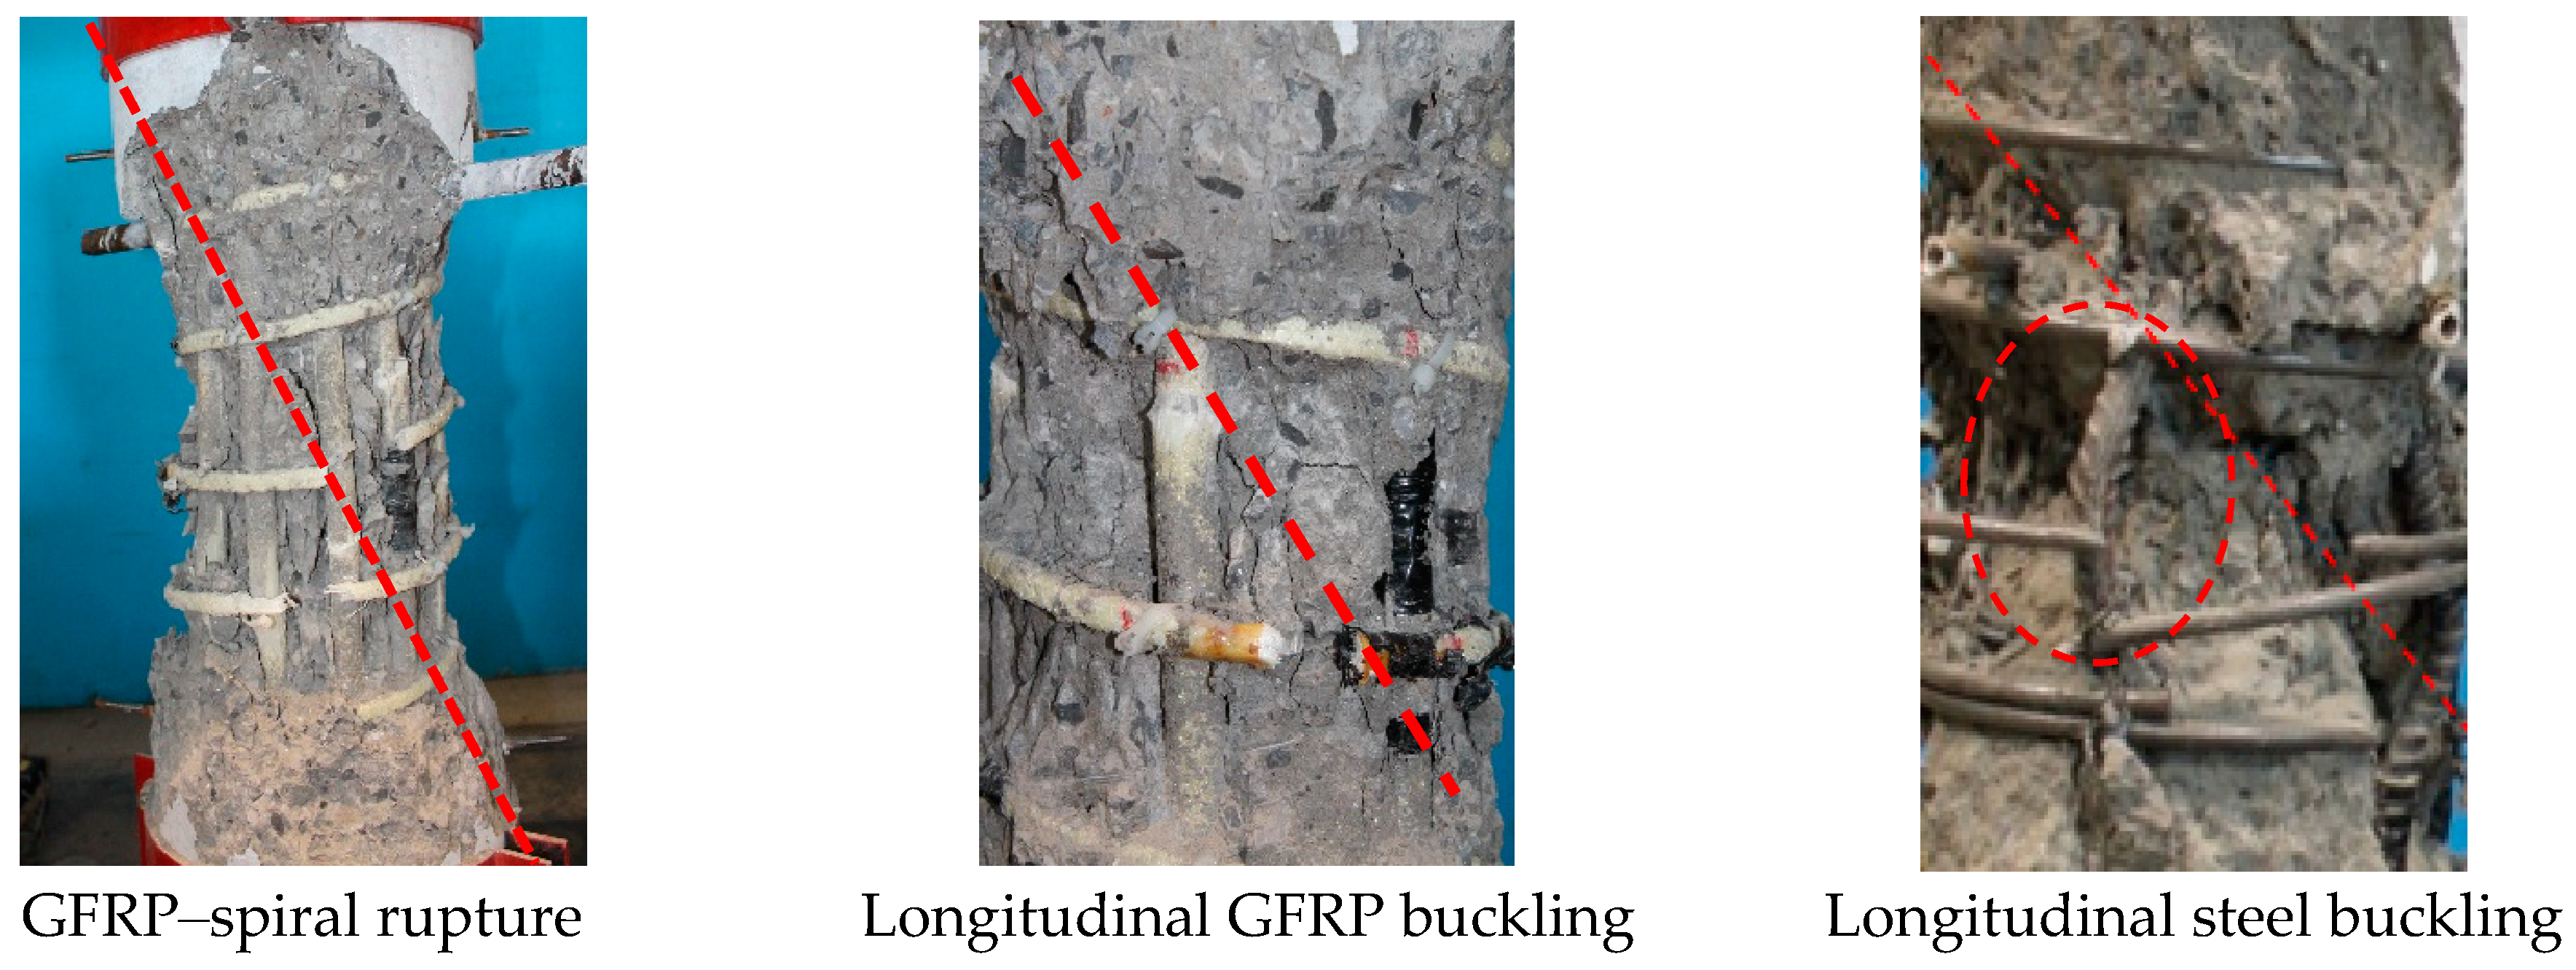
  • The GFRP–RC columns with wider spiral spacing failed due to bar buckling, while tightly confined ones failed due to concrete crushing and spiral rupture. Closer spiral spacing prevented bar buckling, improving the strain distribution. Optimized spirals notably enhanced the column performance, boosting both the strain and strength. Columns with correct spirals showed strain improvements of 7 to 14%.
  • The strain behavior in axial compression was notably affected by the amount and layout of longitudinal GFRP reinforcement and the effectiveness of concrete confinement. Increasing the longitudinal GFRP reinforcement ratio from 2.4 to 4.0% led to strain improvements of 11 to 18%.
  • The current design standards, such as ACI 440.11-22, CSA-S806-12, and JSCE-97, have limitations in predicting the failure capacity of GFRP–RC columns, leading to varying estimates of the axial loads. While these standards allow the use of GFRP bars for longitudinal reinforcement, they do not fully account for the strain behavior of GFRP–RC columns. Notably, CSA-S806-12’s equation reduces the axial load as the FRP reinforcement ratio increases, ignoring the contribution of longitudinal FRP reinforcement. JSCE-97 incorporates the effect of spirals but overlooks longitudinal bars. ACI 440.11-22 considers longitudinal reinforcement only up to the concrete failure strain. These discrepancies underscore the need for more precise design guidelines to ensure the reliable performance of GFRP–RC columns.
  • A new equation (Formula (7)) has been proposed to estimate the axial compression loads in GFRP–RC columns, considering contributions from concrete, shear reinforcement spirals, and longitudinal GFRP bars. Formula (7) shows improved accuracy in predicting the strain and axial capacity for these columns. Based on the experiments, the equation limits the contribution of longitudinal reinforcement to 20% of the ultimate strain of the bars, with a corresponding limit of 12% for spirals. Adherence to these guidelines should ensure the structural integrity and performance of GFRP–RC columns within safe operational limits.
    P O   = α 1   f c / ( A G A F ) + 0.2   f f u   A F + 2.5   E S P   £ f s p d   π   d s p   A s p   /   s
    where α 1 = 0.85     0.0015 f c /   0.67 ;
    £ f s p d = 0.12   £ f u s p d .

4. Future Research Directions

Future research in the area of GFRP–RC columns should focus on several key aspects to further enhance their understanding and application.
  • Long-Term Durability Studies: Investigate the long-term performance and durability of GFRP-reinforced concrete columns, particularly under varying environmental conditions such as temperature fluctuations, moisture exposure, and chemical environments.
  • Behavior Under Different Loading Conditions: Extend the study to include different types of loading conditions, such as cyclic, dynamic, and seismic loads, to understand the behavior of GFRP–RC columns in a wider range of real-world applications.
  • Optimization of Reinforcement Ratios: Conduct parametric studies to optimize the ratios of longitudinal and transverse reinforcement to achieve the best balance between strength, ductility, and cost-effectiveness.
  • Advanced Analytical Models: Develop and validate more advanced analytical and numerical models to predict the behavior of GFRP–RC columns under various conditions, incorporating factors such as non-linear material properties and complex loading scenarios.
By addressing these areas, future research can significantly contribute to the optimization and standardization of GFRP–RC columns, enhancing their performance and reliability in structural applications.

Author Contributions

Conceptualization, A.H.A. and H.M.M.; Methodology, H.M.M.; Validation, L.A. and A.G.; Formal analysis, A.G.; Investigation, A.H.A. and H.M.M.; Data curation, L.A. and A.H.A.; Writing—original draft, L.A.; Writing—review & editing, A.H.A.; Supervision, H.M.M.; Project administration, A.G. and L.A. All authors have read and agreed to the published version of the manuscript.

Funding

This research received no external funding.

Data Availability Statement

The original contributions presented in the study are included in the article, further inquiries can be directed to the corresponding author.

Conflicts of Interest

The authors declare that there are no conflicts of interest regarding the publication of the current article.

Appendix A

IDExperimental
Load, P f .
(kN)
Equation (7)Equation (8)Equation (9)Equation (10)Equation (11)Equation (12)Equation (13)Equation (14)
P o 7 .
(kN)
P f . P o 7 . P o 8 .
(kN)
P f . P o 8 . P o 9 .
(kN)
P f . P o 9 . P o 10 .
(kN)
P f . P o 10 . P o 11 .
(kN)
P f . P o 11 . P o 12 .
(kN)
P f . P o 12 . P o 13 .
(kN)
P f . P o 13 . P o 14 .
(kN)
P f . P o 14 .
Afifi et al. [15]
C6V-3H8029052661.81.093062.50.952915.51.002764.71.052808.11.032873.11.012734.41.062793.01.04
C10V-3H8030132840.41.063386.60.893141.60.962890.41.042962.71.023071.00.982969.81.012937.51.03
C14V-2H8031073018.91.033710.80.843367.80.923016.11.033117.21.003268.90.953205.30.973081.91.01
C10V-2H8029482831.41.043386.60.873141.60.942890.41.022962.71.003071.00.962969.80.992937.51.00
C10V-4H8031472863.31.103386.60.933141.61.002890.41.092962.71.063071.01.022969.81.062937.51.07
C10V-3H4030702853.01.083386.60.913141.60.982890.41.062962.71.043071.01.002969.81.032937.51.05
C10V-3H12029812836.11.053386.60.883141.60.952890.41.032962.71.013071.00.972969.81.002937.51.01
C10V-2H3531482836.11.113386.60.933141.61.002890.41.092962.71.063071.01.032969.81.062937.51.07
C10V-4H14529412847.31.033386.60.873141.60.942890.41.022962.70.993071.00.962969.80.992937.51.00
Afifi et al. [16]
G8V-3H8029202578.01.132974.10.982825.41.032630.01.112665.31.102718.21.072581.31.132686.61.09
G4V-3H8028262455.51.152742.11.032667.81.062570.11.102587.71.092614.21.082453.21.152598.41.09
G12V-3H8029982700.51.1132060.942982.91.012689.91.112742.91.092822.21.062709.51.112774.81.08
G8V-2H8028572572.41.112974.10.962825.41.012630.01.092665.31.072718.21.052581.31.112686.61.06
G8V-4H8030192587.61.172974.11.022825.41.072630.01.152665.31.132718.21.112581.31.172686.61.12
G8V-3H4029642586.11.152974.11.002825.41.052630.01.132665.31.112718.21.092581.31.152686.61.10
G8V-3H12028042575.41.092974.10.942825.40.992630.01.072665.31.052718.21.032581.31.092686.61.04
GBV-2H3529512575.51.152974.10.992825.41.042630.01.122665.31.112718.21.092581.31.142686.61.10
G8V-4H14528652579.71.112974.10.962825.41.012630.01.092665.31.072718.21.052581.31.112686.61.07
Mohamed et al. [17]
G2528572937.00.973408.40.843259.70.883064.40.933099.70.923152.60.912945.90.973131.00.91
G3529203537.40.834148.00.703999.30.733804.00.773839.30.763892.20.753540.70.823887.60.75
G4530193665.60.824300.70.704152.00.733956.60.763991.90.764044.80.753659.30.834043.80.75
G3H20028403328.80.853883.90.733735.20.763539.90.803575.10.793628.10.783332.10.853617.40.79
G3H40028713375.50.853942.60.733793.90.763598.60.803633.80.793686.80.783378.80.853677.50.78
G3H60029353426.60.864007.20.733858.50.763663.10.803698.40.793751.30.783429.90.863743.50.78
C2529483234.60.913870.10.763625.10.813373.90.873446.10.863554.50.833373.10.873429.90.86
C3530133458.90.874135.40.733890.40.773639.20.833711.40.813819.80.793588.40.843700.10.81
C4531473632.50.874324.00.734079.00.773827.80.823900.10.814008.40.793739.00.843892.30.81
C3H20028692959.80.973528.10.813283.10.873031.90.953104.10.923212.50.893089.30.933081.60.93
C3H40029603107.50.953705.00.803460.00.863208.80.923281.00.903389.40.873237.00.913261.70.91
C3H60030083296.60.913934.90.763689.90.823438.70.873510.90.863619.30.833426.10.883495.90.86
Maranan et al. [30]
GGC-8-0017721723.81.032038.40.871897.80.9316951.051724.81.031769.41.001702.81.041733.41.02
GGC-8-H5017911741.41.032038.40.881897.80.9416951.061724.81.041769.41.011702.81.051733.41.03
GGC-8-H10019811732.61.142038.40.971897.81.0416951.171724.81.151769.41.121702.81.161733.41.14
GGC-8-H20019881728.21.152038.40.981897.81.0516951.171724.81.151769.41.121702.81.171733.41.15
GGC-8-S5018381741.41.062038.40.901897.80.9716951.081724.81.071769.41.041702.81.081733.41.06
GGC-8-S10020631732.61.192038.41.011897.81.0916951.221724.81.201769.41.171702.81.211733.41.19
GGC-16-H10016241732.60.942038.40.801897.80.8616950.961724.80.941769.40.921702.80.951733.40.94
GGC-16-S10012081732.60.702038.40.591897.80.6416950.711724.80.701769.40.681702.80.711733.40.7
Hadhood et al. [20]
C1-P128402748.41.033236.40.883031.20.9426931.0527281.042780.41.022633.51.082751.11.03
C2-P128712748.41.043236.40.893031.20.9526931.0727281.052780.41.032633.51.092751.11.04
C3-P129352748.41.073236.40.913031.20.9726931.0927281.082780.41.062633.51.112751.11.07
C1-P225642348.41.092772.70.922567.51.002229.31.152264.21.132316.71.112233.51.152276.61.13
Average-1.02-0.87-0.92-1.00-0.99-0.96-1.01-0.99
COV %-11.3-12.0-12.0-13.4-12.9-12.8-12.0-12.7

References

  1. Zhou, Y. Reinforced Concrete Columns: Design, Behavior, and Advancements. J. Adv. Struct. Eng. 2016, 8, 97–110. [Google Scholar]
  2. Ali, M.F.; Faris, A.M.; Alkhalaf, M. Reinforced Concrete Columns: A Review of Literature. J. Eng. Appl. Sci. 2019, 14, 679–688. [Google Scholar]
  3. Al Farisi, A.A.; Qari, M.H.; Nizam, M. The Use of Reinforced Concrete Columns in Building Construction. J. Appl. Sci. 2018, 18, 153–160. [Google Scholar]
  4. Khan, Q.S.; Sheikh, M.N.; Hadi, M.N.S. Axial-Flexural Interactions of GFRP-CFFT Columns with and without Reinforcing GFRP Bars. J. Compos. Constr. 2016, 21, 04016109. [Google Scholar] [CrossRef]
  5. Hassanpour, A.; Ramezani, M.; Esmaeilpour, A. Experimental Study on the Compressive Behavior of Fiber-Reinforced Polymer Bars in Normal and High-Strength Concrete. Constr. Build. Mater. 2018, 159, 36–47. [Google Scholar]
  6. Gouda, A.; Ali, A.H.; Mohamed, H.M.; Benmokrane, B. Analysis of circular concrete members reinforced with composite glass-FRP spirals. Compos. Struct. 2022, 297, 115921. [Google Scholar] [CrossRef]
  7. Fakhri, M.A.; Darwish, M.A.; Al-Rubai, M.Y. Fiber-Reinforced Polymer Composites in Concrete Structures: A review. Eng. Sci. Technol. Int. J. 2019, 22, 4234–4243. [Google Scholar]
  8. Molla, H.B.; Nasser, A.S.; Al-Hussein, M. Flexural Behavior of Fiber Reinforced Polymer Bars Reinforced Concrete Beams. J. King Saud Univ.-Eng. Sci. 2018, 30, 153–159. [Google Scholar]
  9. Elkholy, A.F.; Hegazy, A.F.; Taha, R.M. Behavior of Fiber Reinforced Polymer Bars in Concrete Beams. J. King Saud Univ.-Eng. Sci. 2014, 26, 113–119. [Google Scholar]
  10. Ding, F.; Xiong, S.; Zhang, H.; Li, G.; Zhao, P.; Xiang, P. Reliability Analysis of Axial Bearing Capacity of Concrete Filled Steel Tubular Stub Columns with Different Cross Sections. Structures 2021, 33, 4193–4202. [Google Scholar] [CrossRef]
  11. Sharma, U.K.; Bhargava, P.; Kaushik, S.K. Behavior of Confined High Strength Concrete Columns under Axial Compression. J. Adv. Concr. Technol. 2005, 3, 267–281. [Google Scholar] [CrossRef]
  12. Lotfy, E.M. Behavior of Reinforced Concrete Short Columns with Fiber-Reinforced Polymer Bars. Int. J. Adv. Struct. Eng. 2010, 1, 545–557. [Google Scholar]
  13. De Luca, A.; Matta, F.; Nanni, A. Behavior of Full-Scale of Glass Fiber-Reinforced Polymer Reinforced Concrete Columns Under Axial Load. ACI Struct. J. 2010, 107, 589–596. [Google Scholar]
  14. Tobbi, H.; Farghaly, A.S.; Benmokrane, B. Concrete Columns Reinforced Longitudinally and Transversally with Glass Fiber-Reinforced Polymer Bars. ACI Struct. J. 2012, 109, 551–558. [Google Scholar]
  15. Afifi, M.Z.; Mohamed, H.M.; Benmokrane, B. Axial Capacity of Circular Concrete Columns Reinforced with GFRP Bars and Spirals. ASCE Am. Soc. Civ. Eng. 2014, 18, 04013017. [Google Scholar] [CrossRef]
  16. Afifi, M.Z.; Mohamed, H.M.; Benmokrane, B. Strength and Axial Behavior of Circular Concrete Columns Reinforced with CFRP Bars and Spirals. ASCE Am. Soc. Civ. Eng. 2014, 18, 04013035. [Google Scholar] [CrossRef]
  17. Mohamed, H.M.; Afifi, M.Z.; Benmokrane, B. Performance evaluation of concrete columns reinforced longitudinally with FRP bars and confined with FRP hoops and spirals under axial load. J. Bridge Eng. 2014, 19, 04014020. [Google Scholar] [CrossRef]
  18. Xue, W.; Peng, F.; Fang, Z. Behavior and design of slender rectangular concrete columns longitudinally reinforced with fiberreinforced polymer bars. Struct. J. 2018, 115, 311–322. [Google Scholar] [CrossRef]
  19. Hadi, M.N.S.; Hasan, H.A.; Sheikh, M.N. Experimental investigation of circular high-strength concrete columns reinforced with glass fiber-reinforced polymer bars and helices under different loading conditions. J. Compos. Constr. 2017, 21, 04017005. [Google Scholar] [CrossRef]
  20. Hadhood, A.; Mohamed, H.M.; Benmokrane, B. Strength of circular HSC columns reinforced internally with carbon-fiber-reinforced polymer bars under axial and eccentric loads. Constr. Build. Mater. 2017, 141, 366–378. [Google Scholar] [CrossRef]
  21. Youssef, J.; Hadi, M.N.S. Axial load-bending moment diagrams of GFRP reinforced columns and GFRP encased square columns. Constr. Build. Mater. 2017, 135, 550–564. [Google Scholar] [CrossRef]
  22. Alsuhaibani, E.; Alturki, M.; Alogla, S.M.; Alawad, O.; Alkharisi, M.K.; Bayoumi, E.; Aldukail, A. Compressive and Bonding Performance of GFRP-Reinforced Concrete Columns. Buildings 2024, 14, 1071. [Google Scholar] [CrossRef]
  23. Sajedi, S.F.; Saffarian, I.; Pourbaba, M.; Yeon, J.H. Structural Behavior of Circular Concrete Columns Reinforced with Longitudinal GFRP Rebars under Axial Load. Buildings 2024, 14, 988. [Google Scholar] [CrossRef]
  24. ACI 440.11-22; Building Code Requirements for Structural Concrete Reinforced with Glass Fiber-Reinforced Polymer (GFRP) Bars—Code and Commentary. ACI (American Concrete Institute): Farmington Hills, MI, USA, 2022.
  25. Balaguru, P.; Nawy, E.G. Structural Mechanics of Fibers, Yarns, and Fabrics: Carbon Fibers and Their Composites; Springer Science & Business Media: Berlin/Heidelberg, Germany, 2008; Volume 4. [Google Scholar]
  26. ASTM D3171-11; Standard Test Method for Constituent Content of Composite Materials. ASTM: West Conshohocken, PA, USA, 2011.
  27. CAN/CSAS806-12; Design and Construction of Building Components with Fiber Reinforced Polymers. Canadian Standards Association (CSA): Rexdale, ON, Canada, 2012.
  28. Japan Society of Civil Engineers (JSCE). Recommendation for Design and Construction of Concrete Structures Using Continuous Fiber Reinforcing Materials; Japan Society of Civil Engineers: Tokyo, Japan, 1997. [Google Scholar]
  29. Hadhood, A.; Mohamed, H.M.; Benmokrane, B. Axial load–moment interaction diagram of circular concrete columns reinforced with CFRP bars and spirals: Experimental and theoretical investigations. J. Compos. Constr. 2016, 21, 04016092. [Google Scholar] [CrossRef]
  30. Maranan, G.; Manalo, A.; Benmokrane, B.; Karunasena, W.; Mendis, P. Behavior of concentrically loaded geopolymer-concrete circular columns reinforced longitudinally and transversely with GFRP bars. Eng. Struct. 2016, 117, 422–436. [Google Scholar] [CrossRef]
Figure 1. Reinforcement details and dimensions.
Buildings 14 02180 g001
Figure 2. GFRP cages.
Buildings 14 02180 g002
Figure 3. Casting of concrete columns.
Buildings 14 02180 g003aBuildings 14 02180 g003b
Figure 4. Test setup.
Buildings 14 02180 g004
Figure 5. Typical column at different loading stages.
Buildings 14 02180 g005
Figure 6. Columns after testing.
Buildings 14 02180 g006
Figure 7. Longitudinal bars’ strain vs. axial load.
Buildings 14 02180 g007
Figure 8. Spirals’ strain vs. axial load.
Buildings 14 02180 g008
Figure 9. Test regions.
Buildings 14 02180 g009
Figure 10. Columns’ axial strain vs. axial load.
Buildings 14 02180 g010
Figure 11. Column G-6-80 (confined and unconfined behavior).
Buildings 14 02180 g011
Figure 12. Column G-6-80 (ductility).
Buildings 14 02180 g012
Figure 13. The average experimental to predicted values for the standards ACI 440.11-12 [24] CSA-S806-12 [27] and JSCE-97 [28].
Buildings 14 02180 g013
Figure 14. Bell curve.
Buildings 14 02180 g014
Table 1. Tensile properties of GFRP and steel reinforcement.
Bar
Size
Diameter
(mm)
Area
(mm2)
Elastic Tensile
Modulus
(GPa)
Tensile
Strength
(MPa)
Tensile Strain
(%)
GFRP
#39.57153.4ffu = 8891.66
#515.919955.4ffu = 9341.68
Steel
M109.571200fy = 4600.23
M1516200
Table 2. Columns’ details.
Column’s
ID
f c
(MPa)
Shear ReinforcementReinforcing Bars
ρ f
(%)
Pitch (mm)Longitudinal ρ f
(%)
S-6-8039.00.7806 M152.4
G-6-4038.01.4406 No. 52.4
G-6-8038.00.7806 No. 52.4
G-10-4038.51.44010 No. 54.0
G-10-8038.50.78010 No. 54.0
Table 3. Test results.
Column’s
ID
Failure Load ( P f . )
(kN)
Column’s Axial Strain at Peak Load (µε)Concrete’s Strain at Peak Load
(µε)
Longitudinal Reinforcement’s Strain at Peak Load
(µε)
Spiral Reinforcement’s Strain at Peak Load
(µε)
f c c / / f c o / Ductility
S-6-8026215450314786706631.952.53
G-6-4023654880310840691251.861.10
G-6-8022075520223624981271.802.07
G-10-40279766102534332573071.99-
G-10-8024505860273240092501.90-
Table 4. The standards’ estimates.
Column’s
ID
ACI 440.11-22 [24]
Forecast
CSA/S806-12 [27]
Forecast
JSCE [28] ForecastEquation (7) Forecast
P o   A C I .
(kN)
P f . P o   A C I . P o   C S A .
(kN)
P f . P o   C S A . P o   J S C E - 97 .
(kN)
P f . P o   J S C E - 97 . P o 7 .
(kN)
P f . P o 7 .
G-6-401584.71.491442.51.641584.71.491933.81.22
G-6-801584.71.391442.51.531584.71.391799.61.23
G-10-401605.61.741435.81.951605.61.742075.81.35
G-10-801605.61.531435.81.711605.61.531941.71.26
Disclaimer/Publisher’s Note: The statements, opinions and data contained in all publications are solely those of the individual author(s) and contributor(s) and not of MDPI and/or the editor(s). MDPI and/or the editor(s) disclaim responsibility for any injury to people or property resulting from any ideas, methods, instructions or products referred to in the content.

