Article

Study on the Repair Effect of Self-Healing Cementitious Material with Urea-Formaldehyde Resin/Epoxy Resin Microcapsule

1
Qinghai Provincial Department of Transportation, Xining 810001, China
2
School of Civil Engineering, Southwest Jiaotong University, 1426 Civil Building, West Park of Testing High-Tech Zone, Chengdu 610031, China
3
Key Laboratory of High-Speed Railway Engineering, Ministry of Education, Southwest Jiaotong University, 1426 Civil Building, No. 111, North 1st Section of Second Ring Road, Chengdu 610031, China
4
School of Transportation, Southwest Jiaotong University, No. 111, North 1st Section of Second Ring Road, Chengdu 610031, China
5
School of Mechanical Engineering, Institute of Tribology, Southwest Jiaotong University, No. 111, North 1st Section of Second Ring Road, Chengdu 610031, China
*
Author to whom correspondence should be addressed.
Buildings 2024, 14(7), 2201; https://doi.org/10.3390/buildings14072201
Submission received: 22 April 2024 / Revised: 27 June 2024 / Accepted: 8 July 2024 / Published: 17 July 2024
(This article belongs to the Special Issue Carbon-Neutral Infrastructure)

Abstract

:
Recent studies on microencapsulated self-healing cementitious materials have primarily focused on the particle size and preparation methods of the microcapsules. However, there has been limited attention paid to the microscopic aspects, such as the selection of curing agents and the curing duration of these materials. In this study, urea-formaldehyde resin/epoxy resin E-51 microcapsules were synthesized through in situ polymerization. This research investigates the feasibility of self-healing from a molecular mechanism perspective and evaluates the repair performance of microencapsulated self-healing cement mortar with varying microcapsule concentrations, curing agent types, and curing ages. The findings demonstrate that the microcapsule shells bond effectively with the cementitious matrix, with radial distribution function peaks all located within 3.5 Å. The incorporation of microcapsules enhanced the tensile strength of the modified cement mortar by 116.83% and increased the failure strain by 110%, indicating improved adhesion and mechanical properties. The restorative agent released from the microcapsule core provided greater strength after curing compared to the uncured state. Although the overall strength of the microencapsulated self-healing cement mortar decreased with higher microcapsule concentrations, the repair efficiency improved. The strength recovery rate of 28-day aged modified cement mortar had a significant improvement with the addition of X and Y curing agents, respectively.

1. Introduction

Since its inception in 1824, Portland cement has become the most extensively used construction material globally, favored for its cost-effectiveness and durability [1]. With China’s rapid economic and technological advancements, the demand for cement concrete in infrastructure projects such as highways, high-speed railways, and airports has surged. Despite its high compressive strength, cement concrete is susceptible to cracking under external loads and environmental factors. These cracks not only propagate and form significant structural weaknesses but also facilitate the ingress of aggressive ions like Cl, SO42−, and CO32−, which accelerate the degradation of both the cement matrix and the embedded steel reinforcement [2]. The corrosion products can reach 4–6 times the volume of the rebar and the volume increase causes internal tension to the concrete on the surface of the corrosion material; when the tensile stress exceeds the tensile strength of the concrete, the concrete will further produce cracking and spalling damage [3].
It can be seen that the presence of cracks is a key factor affecting the service life of cement concrete [4]. In order to extend the service life of cement concrete and to ensure its safe service during its economic life, the periodic inspection and maintenance of cement concrete is usually required. Figure 1 illustrates the relationship between maintenance and structural performance during the service life of cement concrete. At present, there are more mature repair techniques for the developed macro cracks in cement concrete, such as the grouting method, secondary reinforcement, and the application of surface functional coatings mentioned in EN1504:2004/2013, ACI562-16, and ACI546R-14 [5,6,7].
However, the existing cement concrete crack repair techniques have certain defects. First, the grouting method can only repair larger macro cracks and easy to run slurry problems affecting the structural aesthetics at the same time; therefore, the repair effect is difficult to guarantee [9]. Second, the secondary reinforcement method is only for the repair of larger cracks and the deterioration of the shedding part of the repair process in order to enhance the bonding effect between the old and new concrete. It is used to expand the cracked surface, increase the roughness, aid with reinforcement planting, improve the strength of the concrete and other measures, labor intensity, high construction requirements, pollution and other problems [10]. Coating surface functional coatings can somewhat enhance the performance of cement concrete resistance to infiltration, corrosion, and other properties. High construction requirements, pollution and other problems [10] must also be considered. Coating surface functional coatings can improve the permeability of cement concrete, corrosion resistance, and other properties to a certain extent, but coating surface functional coatings can not achieve the repair of internal cracks in cement concrete and there are problems such as rapid aging and the possibility of this falling off [11]. For example, in the European Union, 20% of cement concrete repairs fail within 5 years, 55% fail within 10 years, and 25% fail within 25 years of service, and the major cause leading to the failure of cement concrete repairs is cracking damage [12]. This, in turn, leads to a continuous cycle of repetitive repairs and life cycle cost accumulation. It is estimated that cement concrete production cost is 65–80 USD/m3, but its maintenance and repair cost during its service life is about 147 USD/m3 [13]. In the United States [14], the maintenance of cement concrete structures for transportation infrastructure such as bridges and pavements costs nearly $4 billion per year; in Australia [15], the maintenance and repair cost of cement concrete for transportation infrastructure is close to $550 million per year; and in Europe, nearly 50% of the annual construction budget is spent on the maintenance and repair of existing cement concrete infrastructure.
The traditional crack repair technology of cement concrete is difficult to meet the development needs of low-carbon and long-life cement concrete. Especially for cement concrete in harsh service environments and under the strong action of traffic dynamic load, it is more necessary to control the emergence and expansion of microcracks in cement concrete from the source. Inspired by the self-healing phenomenon of natural biological materials, people began to explore a variety of biomimetic self-healing intelligent materials, using self-healing technology, which can automatically detect and eliminate the hidden danger of micro-cracks in the material in a timely manner to maintain the performance of the material, ensure its safety, and prolong its service life. Since self-healing technology was introduced into cementitious materials, the cementitious self-healing materials have made great developments. The existing bionic intelligent self-repair cementitious materials are mainly divided into hollow fiber self-repair cementitious materials, mineral self-repair cementitious materials, microbial self-repair cementitious materials, shape memory alloy self-repair cementitious materials, electrochemical deposition self-repair cementitious materials, microcapsule self-repair cementitious materials and so on, according to the principle of repairing technology, among which microcapsule self-repair method is the most promising method for realizing engineering large-scale repair in the bionic intelligent self-repair methods of many cementitious materials. Among them, the microcapsule self-repair method is a bionic intelligent self-repair method which is most promising for realizing the large-scale popularization and application of engineering.
Therefore, this paper carries out research on the performance of self-healing cement mortar with microcapsules. Firstly, using the in-situ polymerization method, the microcapsules for self-repairing cement mortar were prepared; then, using molecular dynamics theory, molecular dynamics characterization between the capsule core/capsule wall-cement matrix was carried out; finally, the influence of the design parameters on the repairing effect of microcapsule self-repairing cement mortar was studied. The findings aim to provide a foundation for the optimal design of microcapsule-enhanced self-healing cement concrete and offer insights into the development of low-carbon, long-life concrete solutions.

2. Materials and Methods

2.1. Raw Material Characteristics

2.1.1. Microcapsule

The core material of the microcapsule, serving as the primary repair agent, should exhibit excellent stability, fluidity, alkali resistance, and rapid reaction capabilities. The microcapsule’s wall not only stores the core material but also needs to bond effectively with the cementitious material, requiring properties such as robust sealing and adhesion. Commonly used in civil engineering for crack repair, Bisphenol A type epoxy resin E-51 offers good adhesion, corrosion resistance, high strength, and minimal shrinkage upon curing. Urea-formaldehyde resin, chosen for the capsule wall, provides superior mechanical properties, heat resistance, and compatibility with cementitious materials, synthesized via solution polymerization in an aqueous dispersion medium. The core material was a diluted mixture of epoxy resin E-51 and n-butyl glycidyl ether in a 100:17.5 ratio. Triethanolamine solution was used as the catalyst, sodium dodecylbenzenesulphonate solution as the active agent (0.5% concentration), and custom-developed X-type and Y-type curing agents were employed to enhance the toughness of the bonding materials.

2.1.2. Cement Mortar

The experiment utilized ordinary silicate cement (P.O42.5 grade) detailed in Table 1 and Table 2, which outline its primary components and properties. River sand with a fineness modulus of 2.6 (Zone II) served as the fine aggregate, with key technical specifications in Table 3. The study employed homemade A-type and B-type curing agents, along with urea-formaldehyde resin/epoxy resin E-51 microcapsules.

2.2. Preparation Method

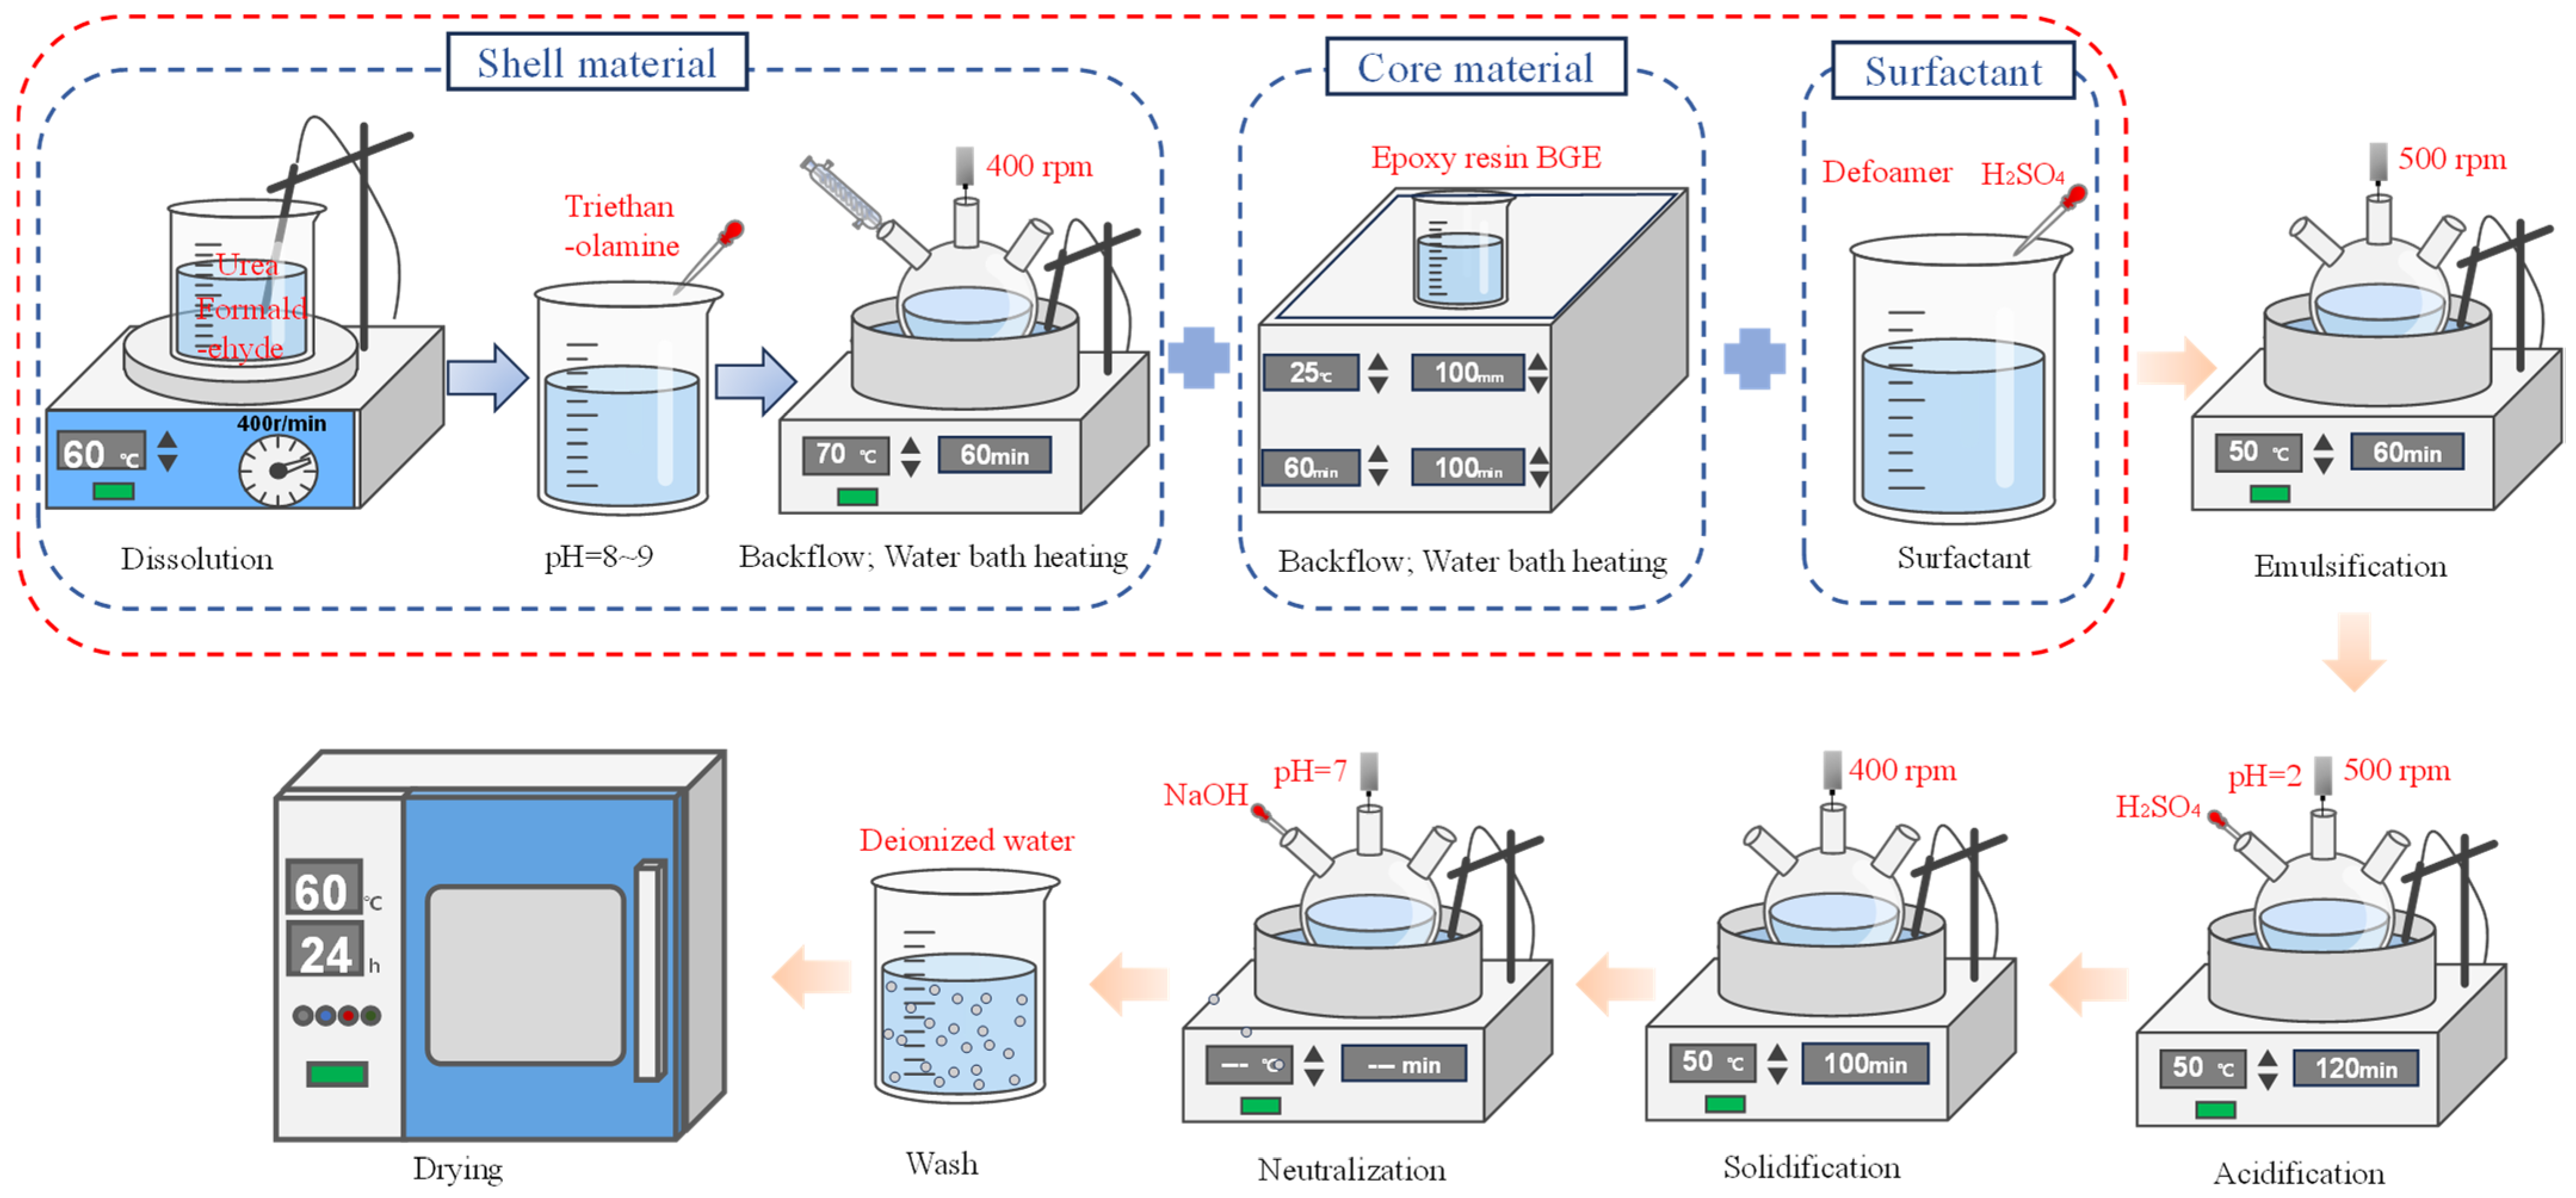
2.2.1. Microcapsule Preparation Process

The preparation of urea-formaldehyde resin-epoxy resin E-51 (UF-E) microcapsules is shown in Figure 2. The preparation involves several stages: (1) Prepolymerization: urea and a 37 wt% formaldehyde solution are mixed in a 2:3 molar ratio. After dissolving the urea, triethanolamine is gradually added to adjust the pH to 8–9. The mixture is then stirred at 70 °C for 40 min and cooled to room temperature. (2) Emulsification: a 0.5% sodium dodecylbenzene sulfonate solution is prepared with distilled water and the pH is adjusted to 7. This solution is mixed with the diluted epoxy resin E-51, stirred at 50 °C for 1 h to form a homogeneous emulsion. (3) Acidification: the pH is adjusted to 2–4 using dilute sulfuric acid over 2 h, maintaining a temperature of 50 °C. (4) Vesicle Wall Formation: as copolymerization progresses, the urea-formaldehyde resin precipitates and deposits on the emulsion droplets, forming and thickening the capsule wall. (5) Curing and Precipitation: the mixture is maintained at 50 °C and stirred for 1.5 h. Deionized water is added gradually to manage the viscosity. The resin solidifies into a non-soluble mesh, which is then filtered, dried, and sieved to obtain the microcapsules.
Figure 3 shows the surface morphology of microcapsules at different pH values and core/wall mass ratios. As can be seen from Figure 3, the lower the pH value, the denser and smoother is the capsule wall of the UF-E microcapsules. The particle sense gradually weakened, the three-dimensional network structure formed by the copolymerization reaction was more solid and close, and the capsule wall was more solid. When the mass ratio of the capsule core/capsule wall was 1:1, the polymerization reaction rate of the urea-formaldehyde resin was moderate, the deposition on the surface of the capsule core droplets was more uniform, the surface of the formed capsule wall was dense and smooth, the degree of agglomeration of the urea-formaldehyde resin was low, and the encapsulation effect of the capsule core material was good, with the encapsulation rate reaching 55.59%. There was also less adhesion between the microcapsules. Therefore, for the microcapsules with an average particle size of 495.56 μm prepared when the reaction system was pH = 2 the reaction temperature was kept at 50 °C, and those with a mass ratio of capsule core/capsule wall of 1:1 were more suitable for the self-repair of cement-based materials.

2.2.2. Cement Mortar Sample Preparation

(1)
Mixing ratios
To isolate the self-healing effects of the microcapsule bonding material, the experiment excluded coarse aggregates and other admixtures. The cement mortar’s fixed mixing ratio was water:cement:sand = 1:2:6. Microcapsules were added based on a percentage of the cement’s mass, with each curing agent (X and Y) constituting 50% of the microcapsules’ mass in the same batch. The mixing ratio of the self-healing cement mortar was as shown in Table 4.
(2)
Cement mortar test piece preparation
The mixing process began with blending the cementitious material, curing agents, and water in a mortar mixer. The microcapsules were introduced once the cement slurry was uniform, followed by sand after 2 min, and then mixed for an additional 3 min. The homogeneous mixture was then cast into 40 mm × 40 mm × 160 mm molds in two stages. After 24 ± 2 h, the specimens were demolded and maintained at standard conditions (20 °C ± 2 °C and 90% RH) until the specified test age, followed by natural drying in a ventilated, shade-free environment (as shown in Figure 4).

2.3. Test Methods

2.3.1. Molecular Dynamics Simulation Method

The interfacial properties between the microcapsule shell and the cement matrix, as well as between the encapsulated restorative and the cement matrix, are crucial for the self-healing efficacy of microcapsule-based systems. Gaining insights into these microencapsulated interfaces, particularly at the microscopic level, is challenging through experiments alone. Molecular dynamics (MD) simulations, which employ classical mechanics to model atomic motions and statistical mechanics to assess system properties, are instrumental in this research. This study utilizes MD to analyze the interfacial properties between the capsule components and the cement matrix, focusing on key hydration products like calcium silicate hydrate (C-S-H).
(1)
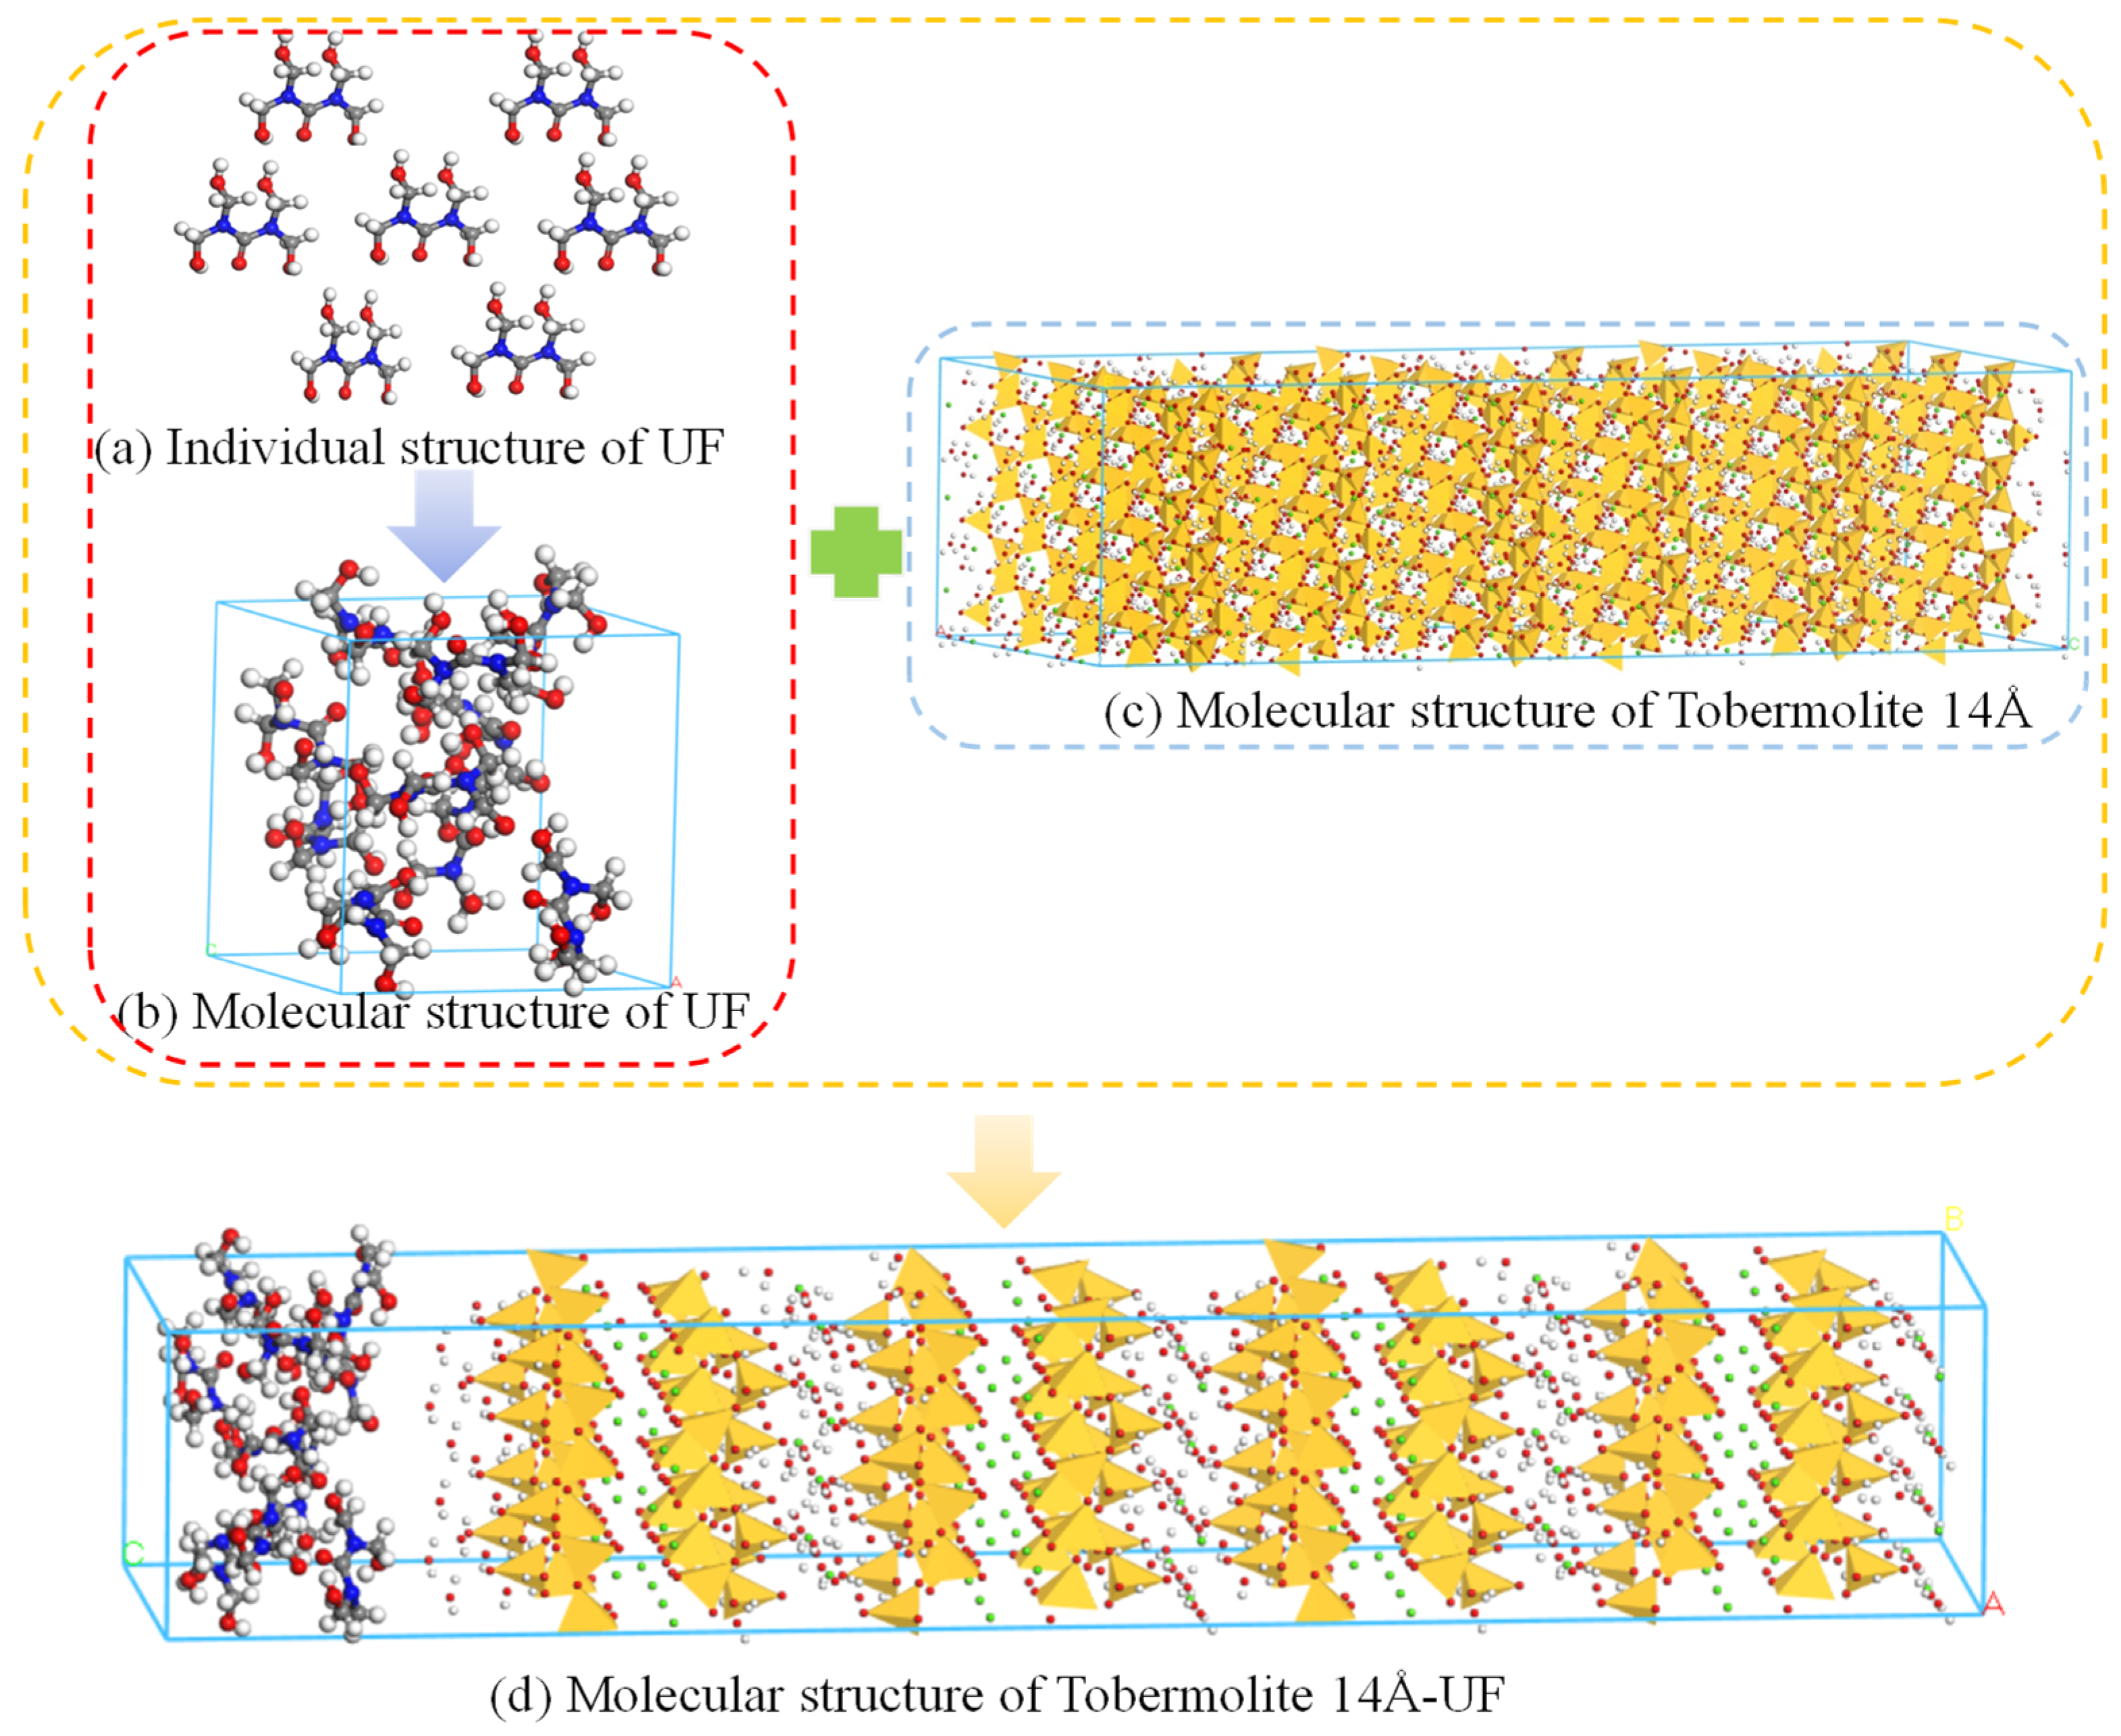
Cyst wall-cement matrix modelling
The modeling process for the vesicle wall-cement matrix is depicted in Figure 5. Tobermorite 14Å, with its interlayer structure resembling C-S-H, is used for modeling. The chemical formula for tobermorite 14Å is Ca5 Si O616 (OH)2-7H2 O. A urea-formaldehyde resin chain with seven repeating units (n = 7) is modeled to represent the organic component. The composite structure of C-S-H and urea-formaldehyde resin is then constructed as a super unit, optimizing the molecular arrangement for stability and interaction analysis.
(2)
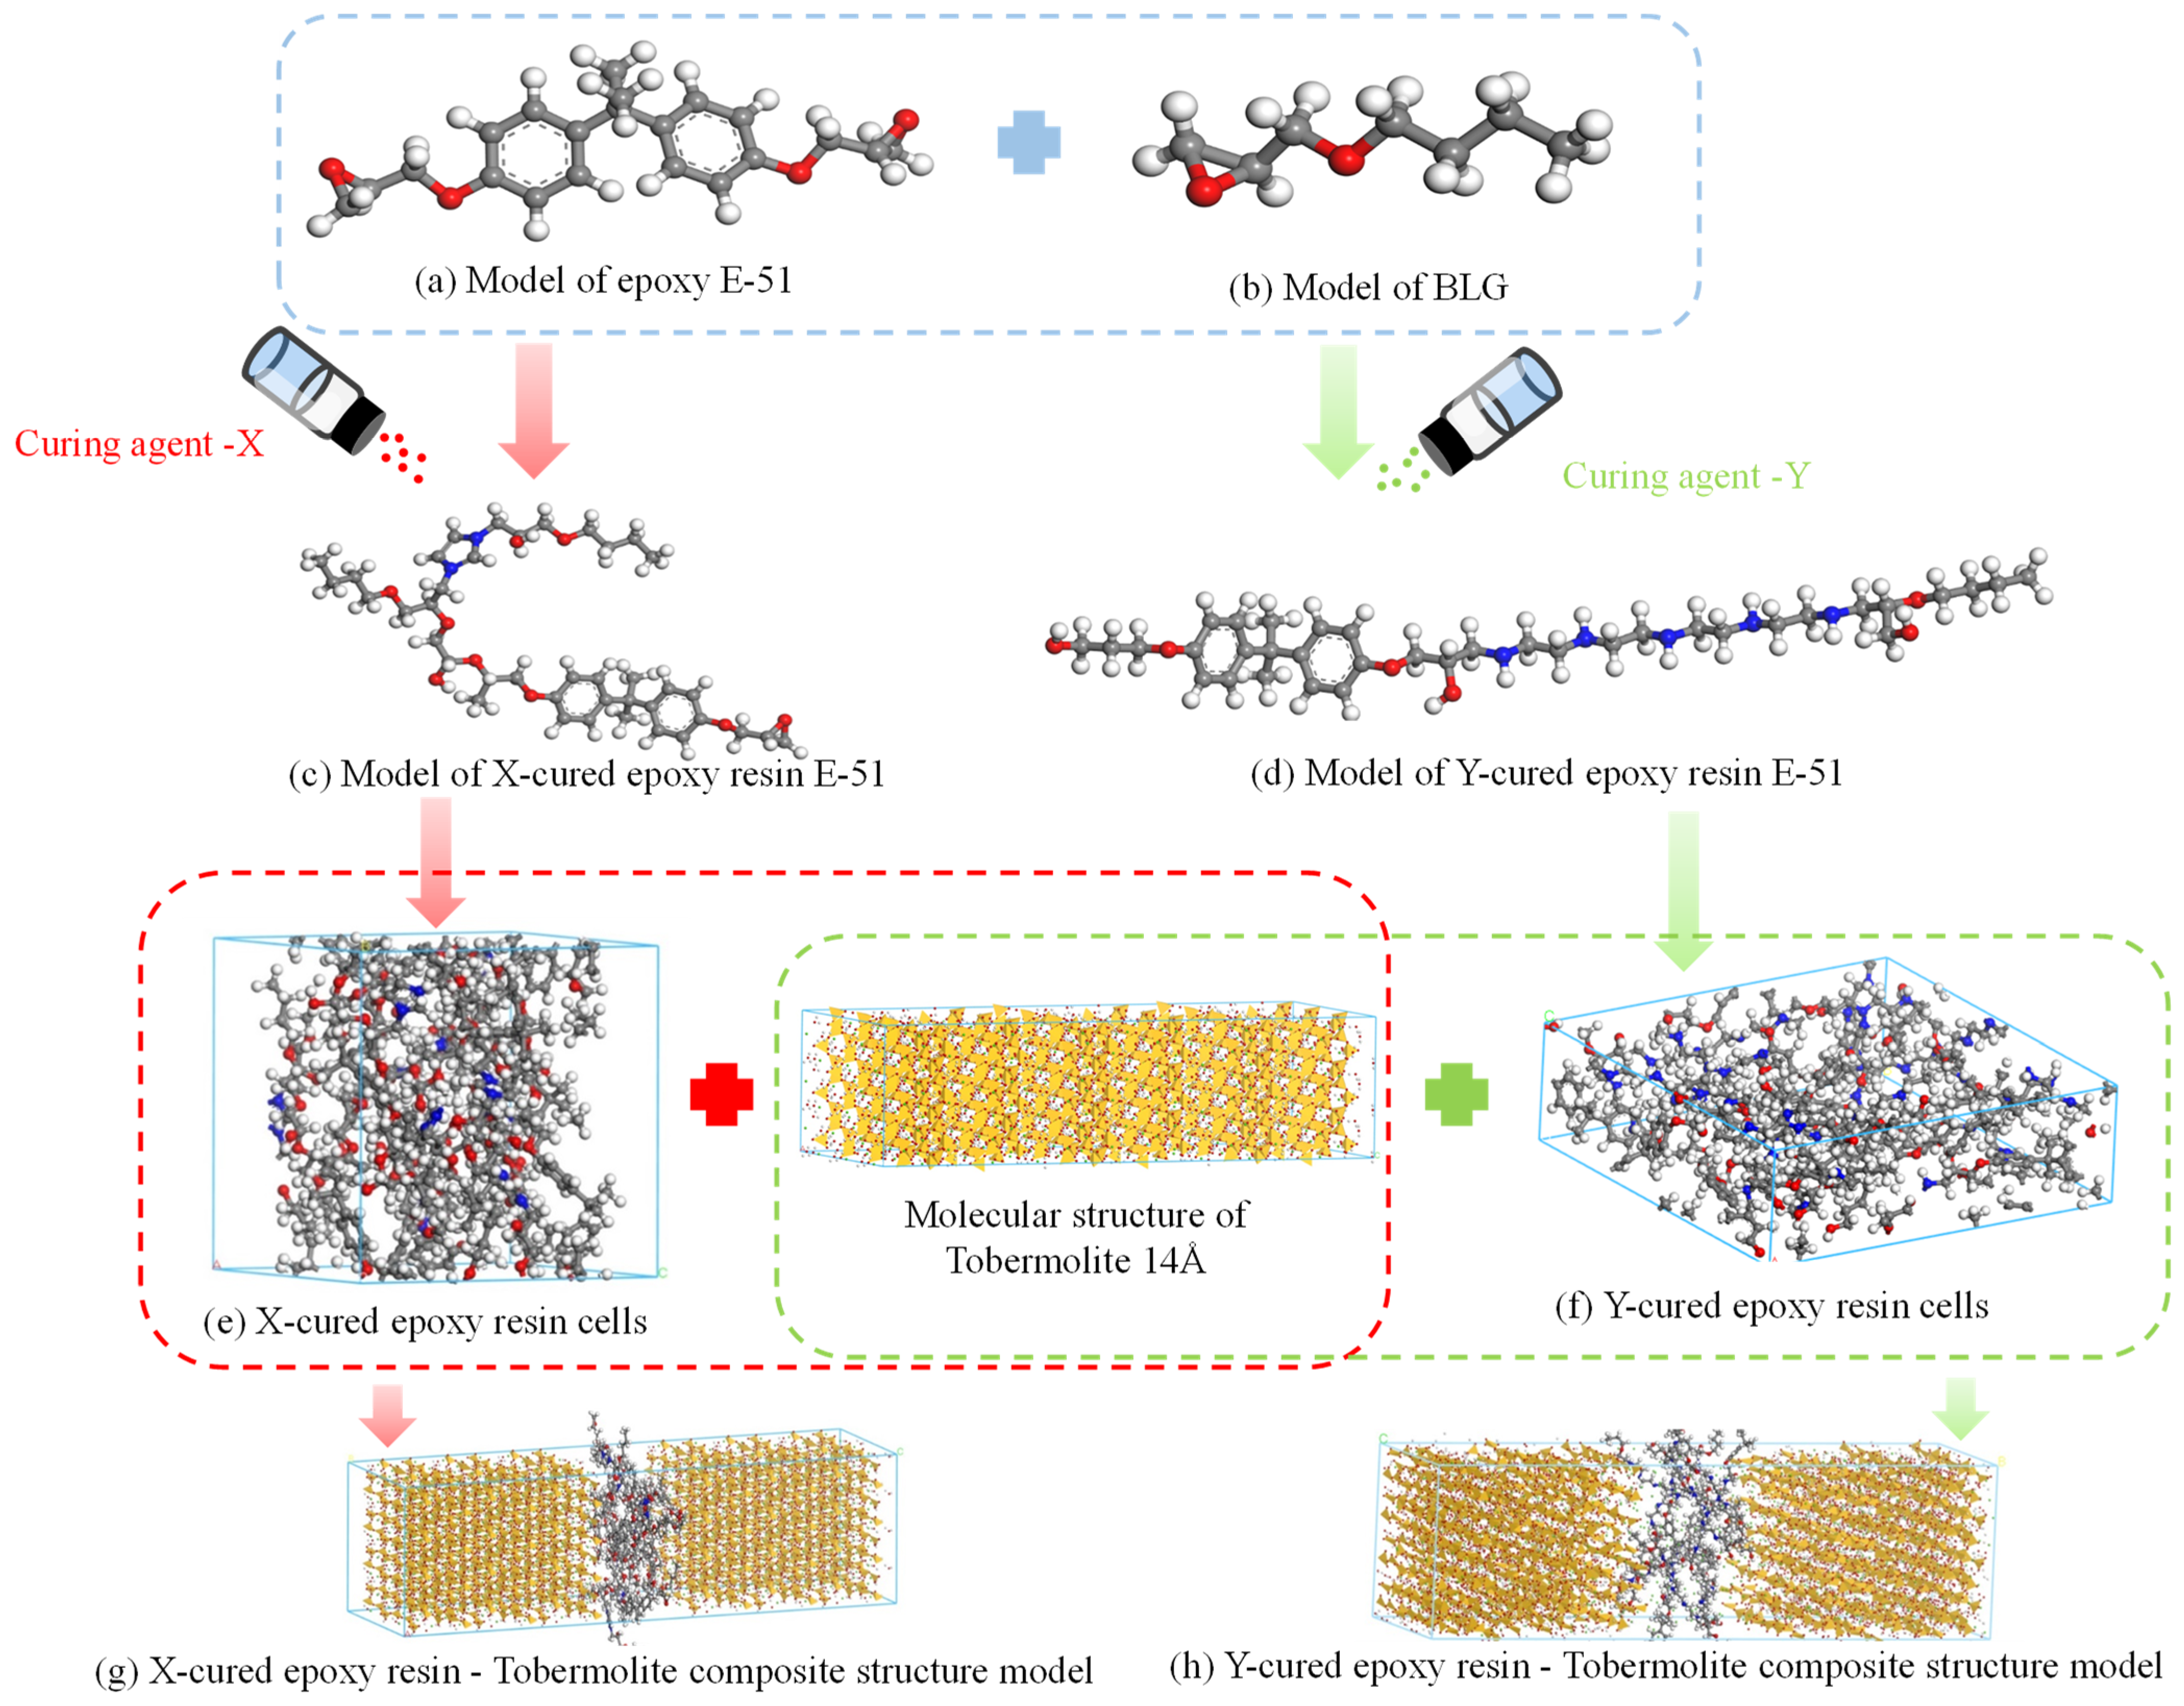
Sac-core-cement matrix modelling
The modeling process for the sac-core-cement matrix, shown in Figure 6, involves reducing the viscosity of E-51 epoxy resin using a diluent (BGE) to facilitate its penetration into cracks. The molecular structures of both the uncured and cured states of the epoxy resin are modeled in layers with tobermorite 14Å, reflecting the structural complexity of C-S-H. The entire composite structure is optimized for stability and analyzed under uniaxial tensile conditions to evaluate the interfacial properties and the effects of different curing agents.
(3)
Indicators for the evaluation of calculation results.
The evaluation of MD simulation results utilizes several indicators:
  • Bulk and Young’s Moduli: these measure the material’s deformation properties.
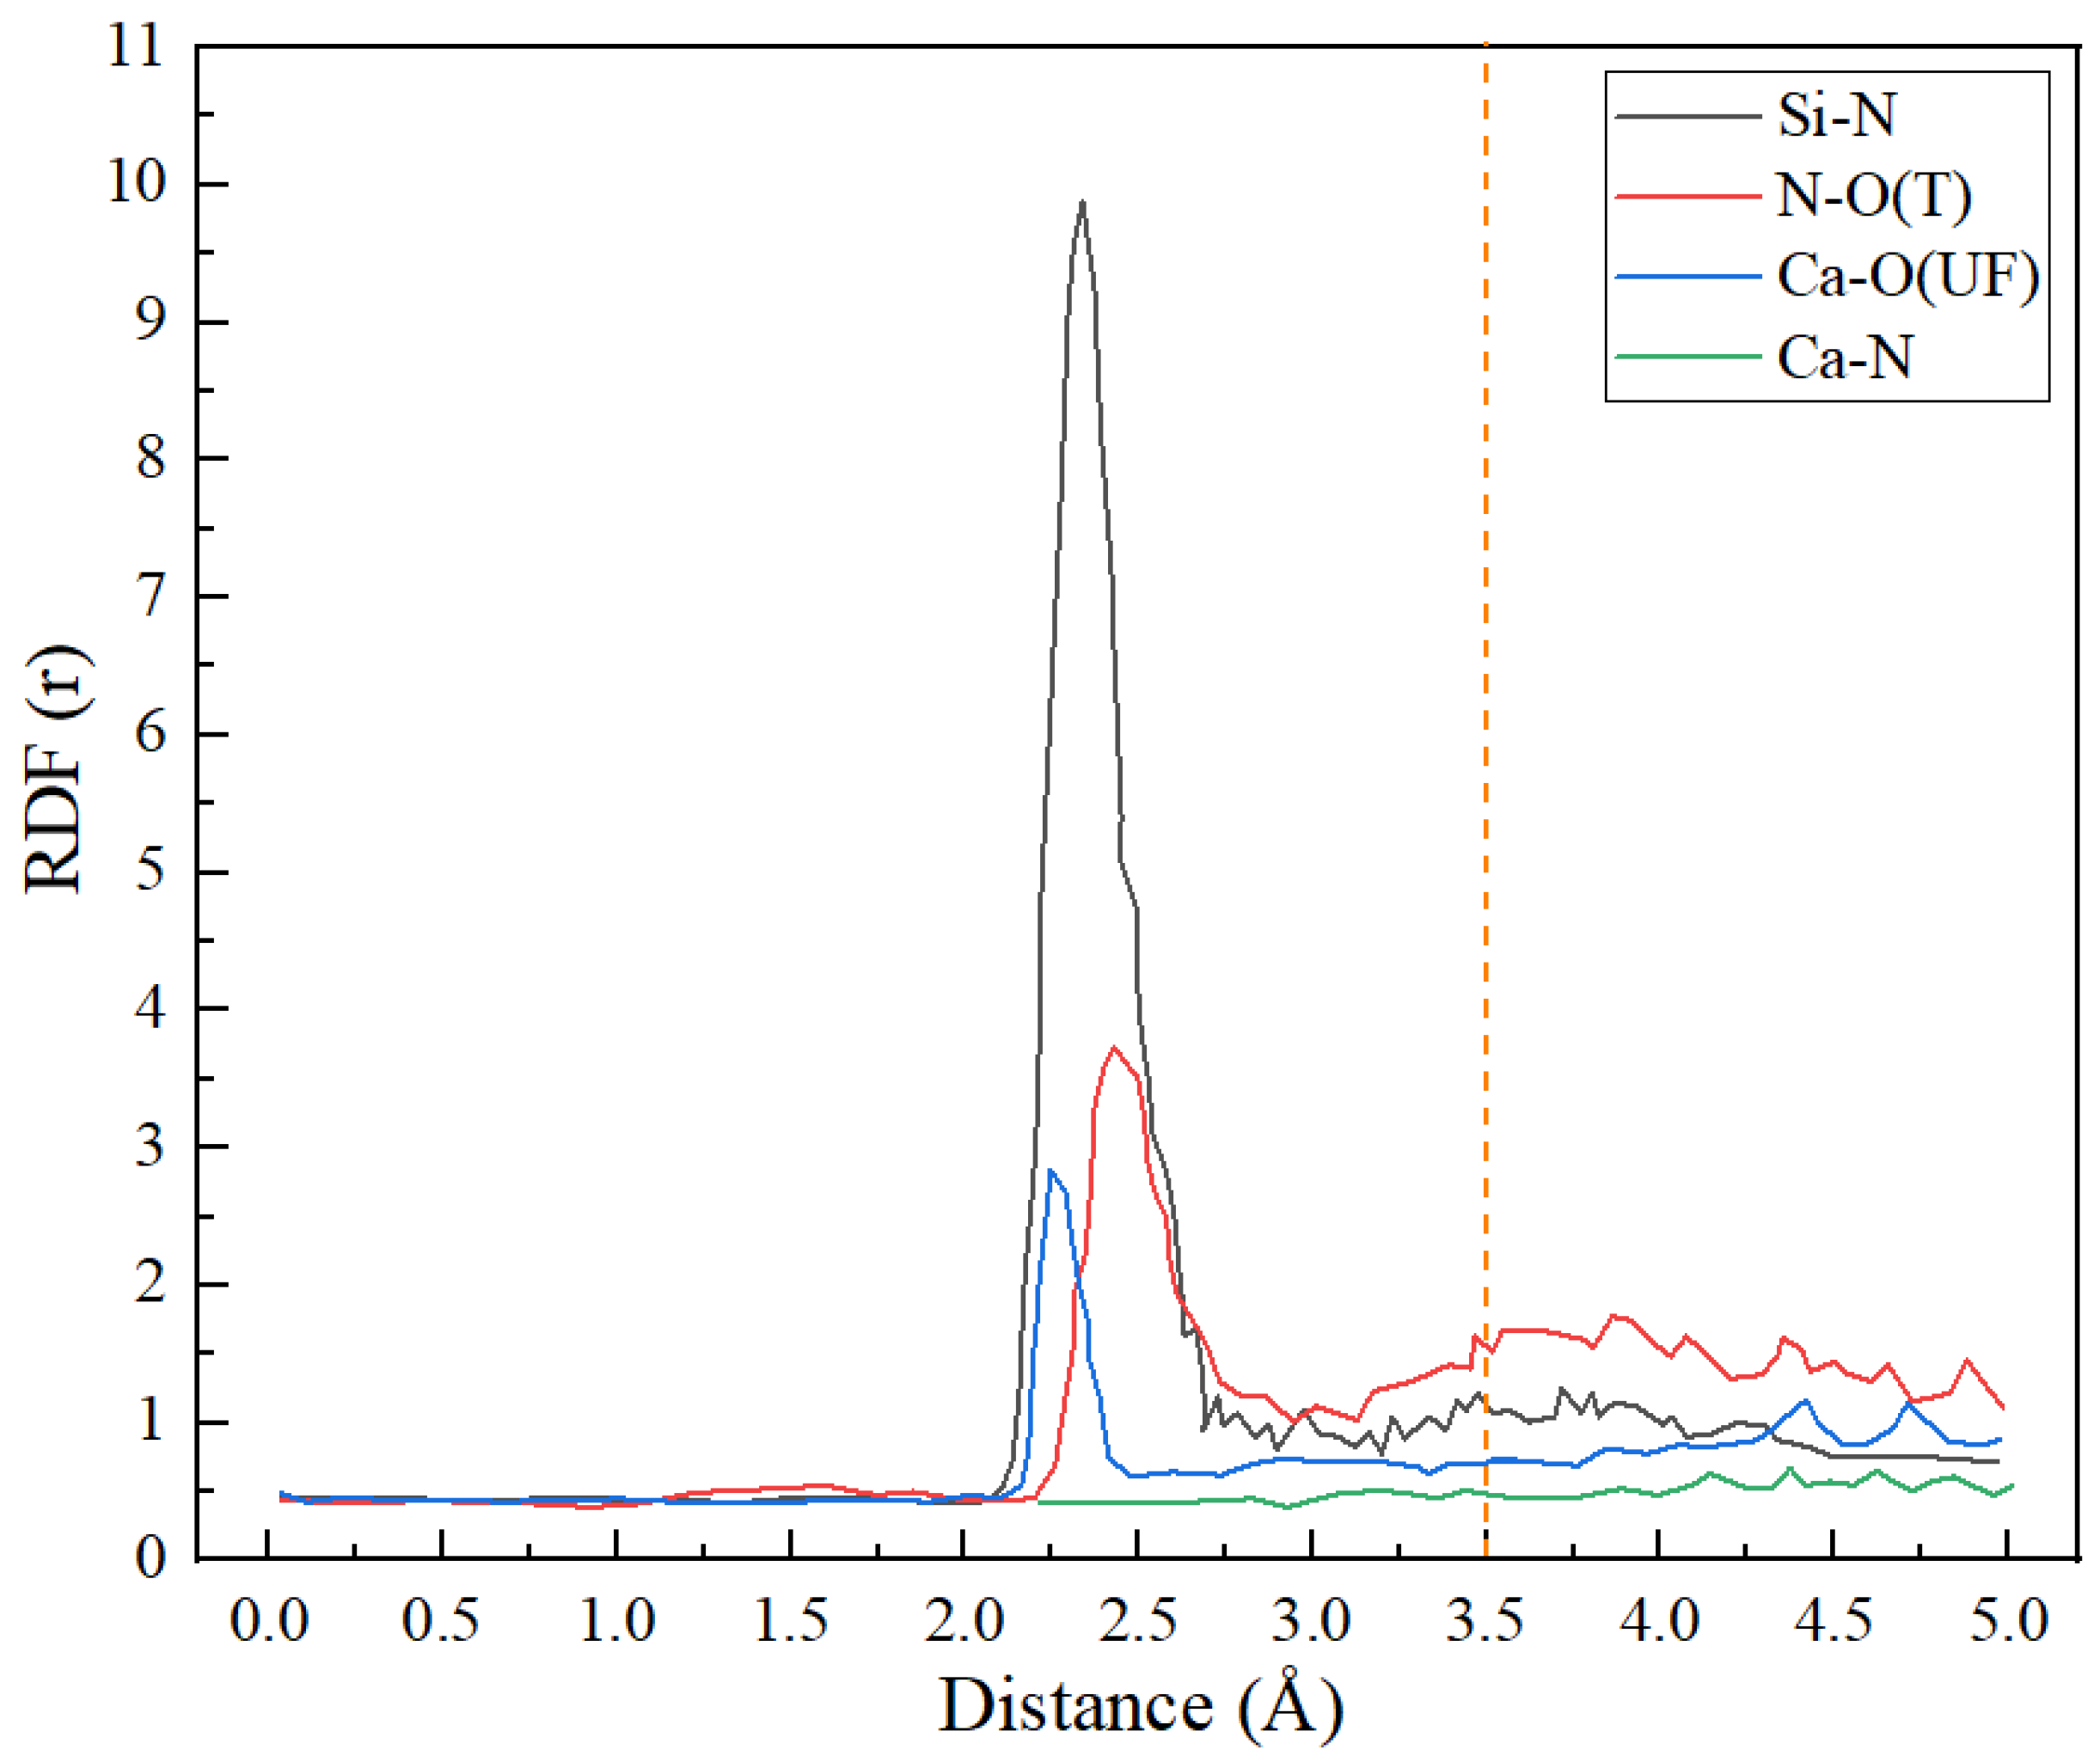
  • Radial Distribution Function (RDF): this function indicates the probability density of atomic proximity, providing insights into the potential for bonding at the interface.
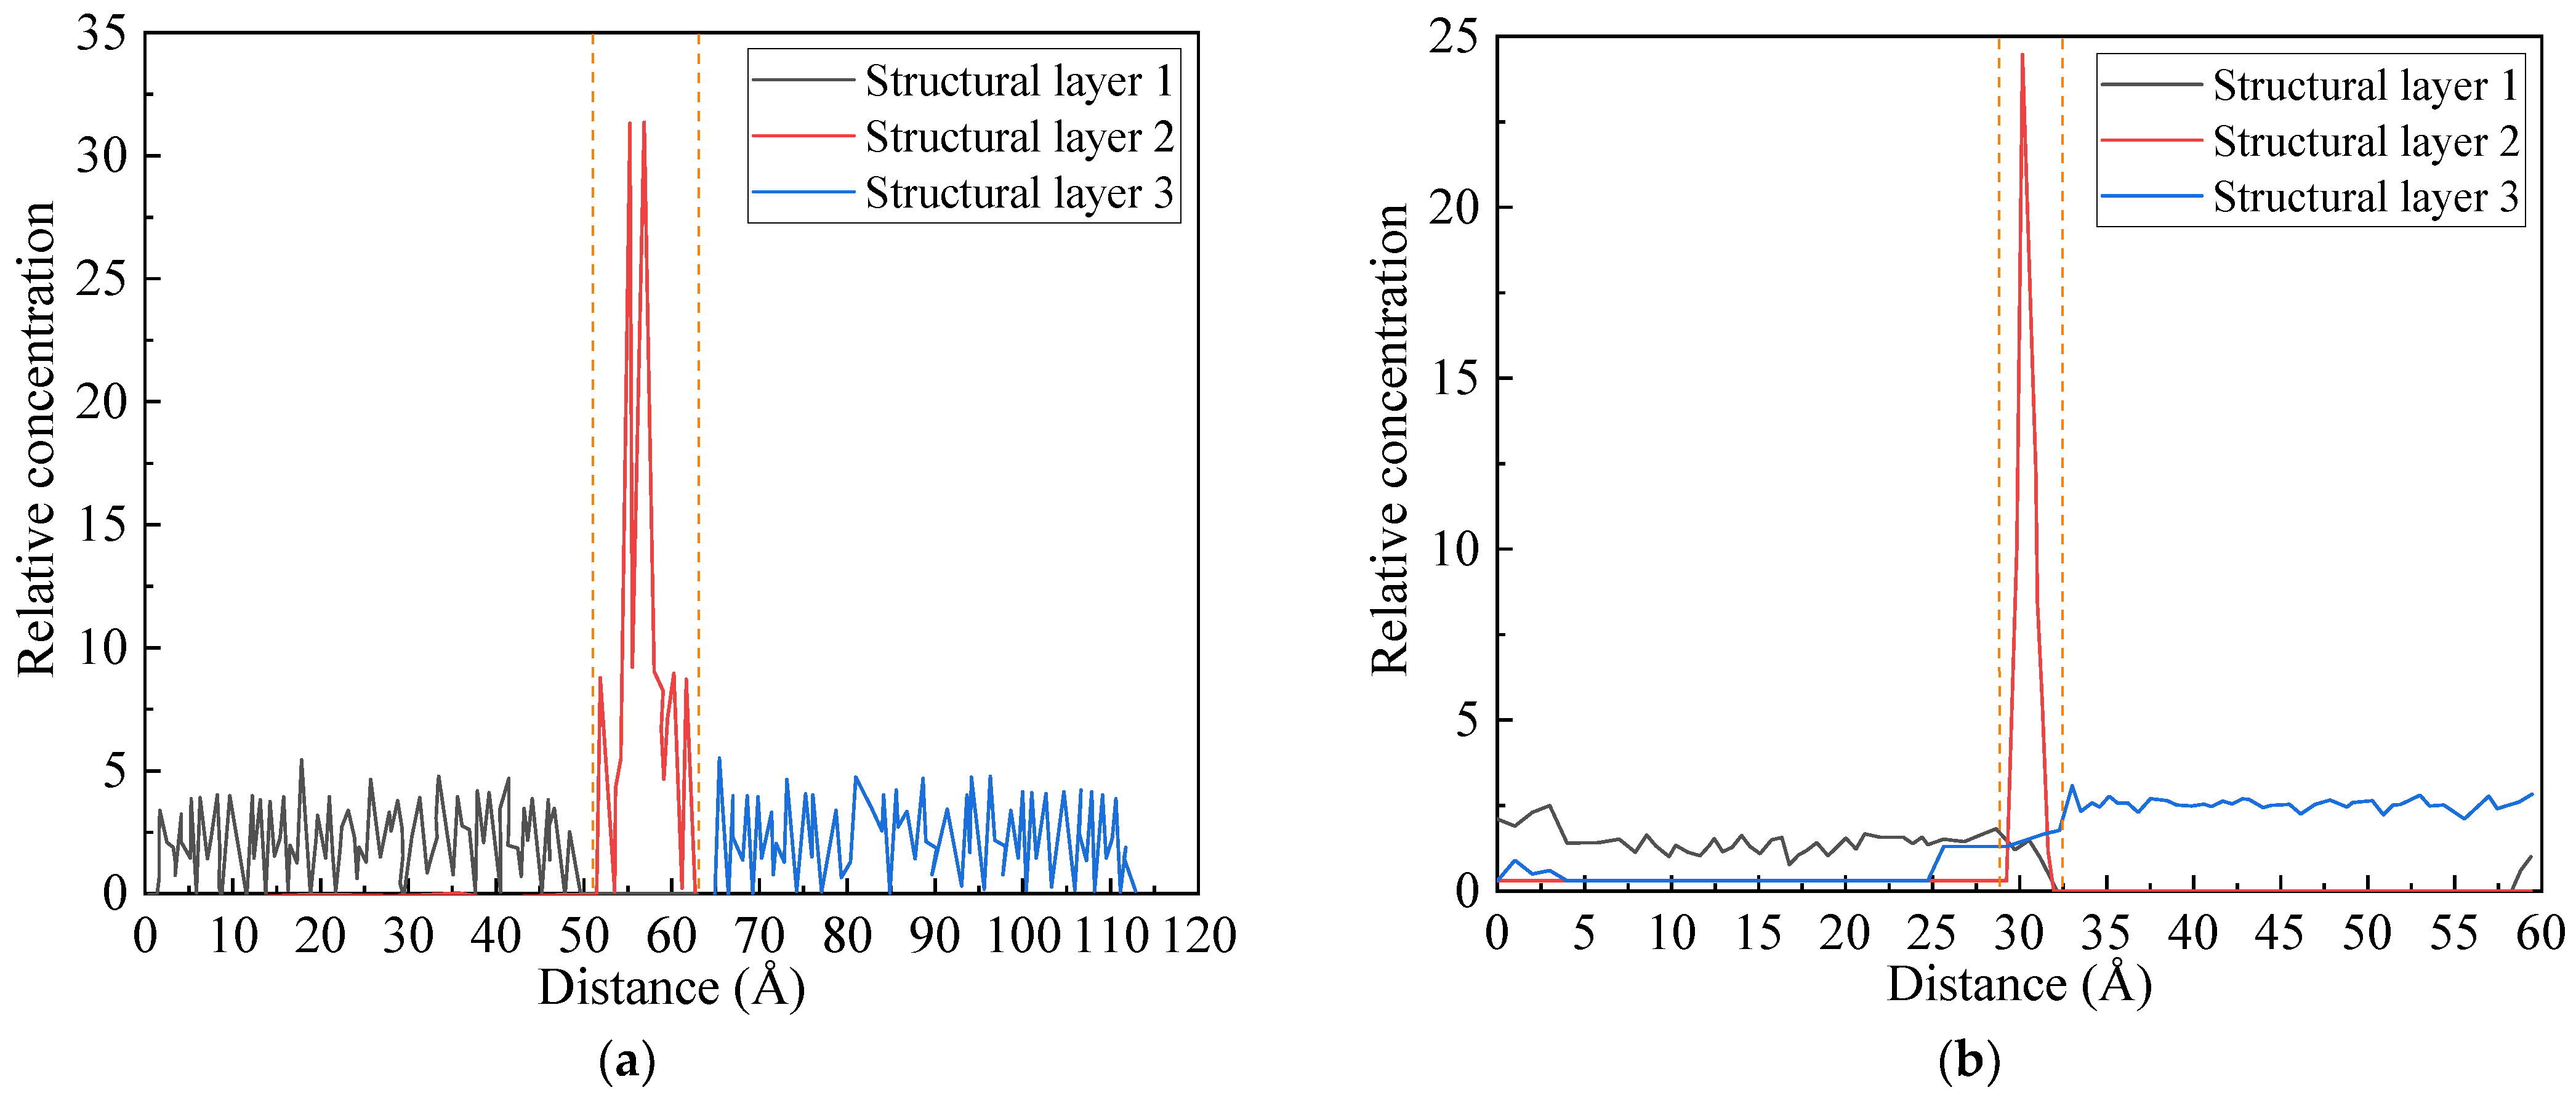
  • Relative Concentration: this metric assesses the concentration of each molecular component along an axis, revealing interactions within the layered structure.
  • Stress-Strain Curves: these curves demonstrate how the microcapsule repair materials influence the mechanical strength of the cement matrix.

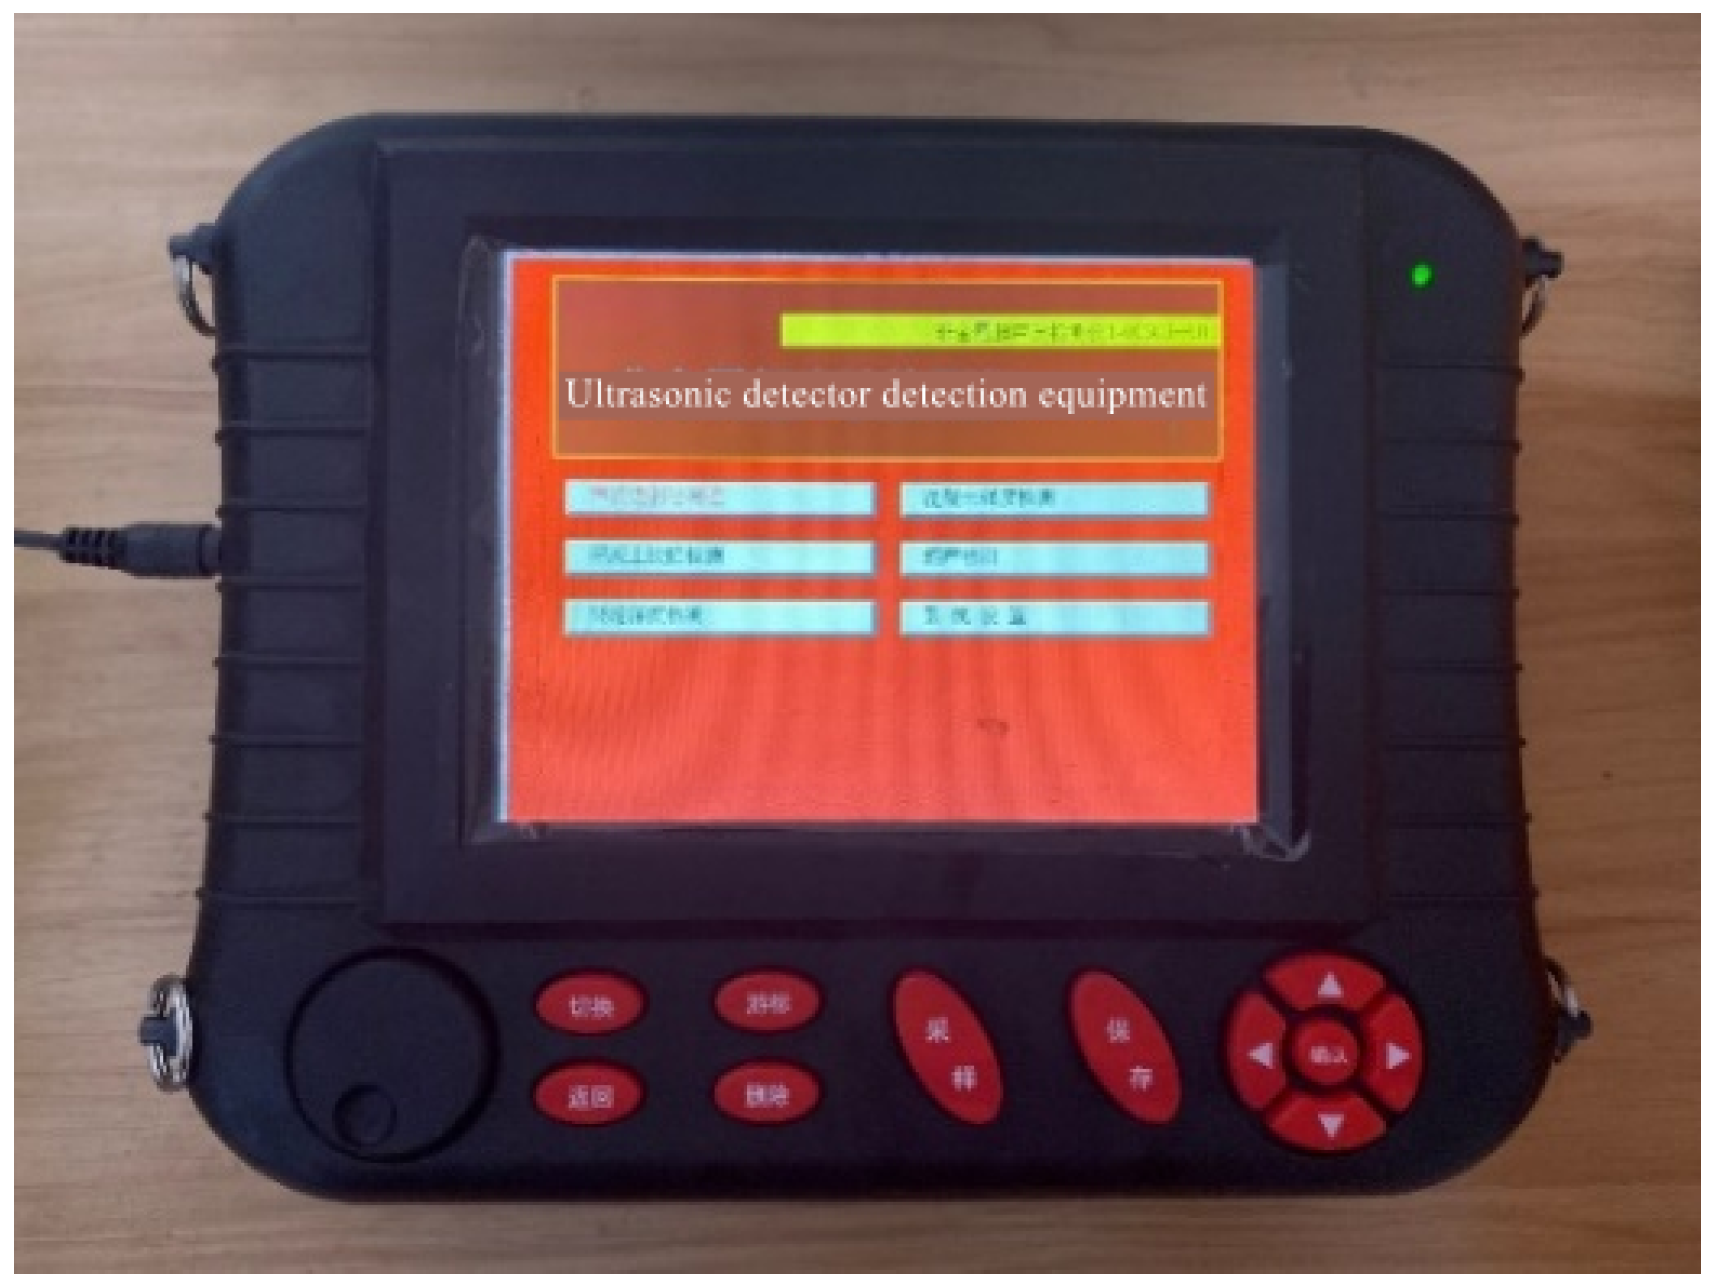
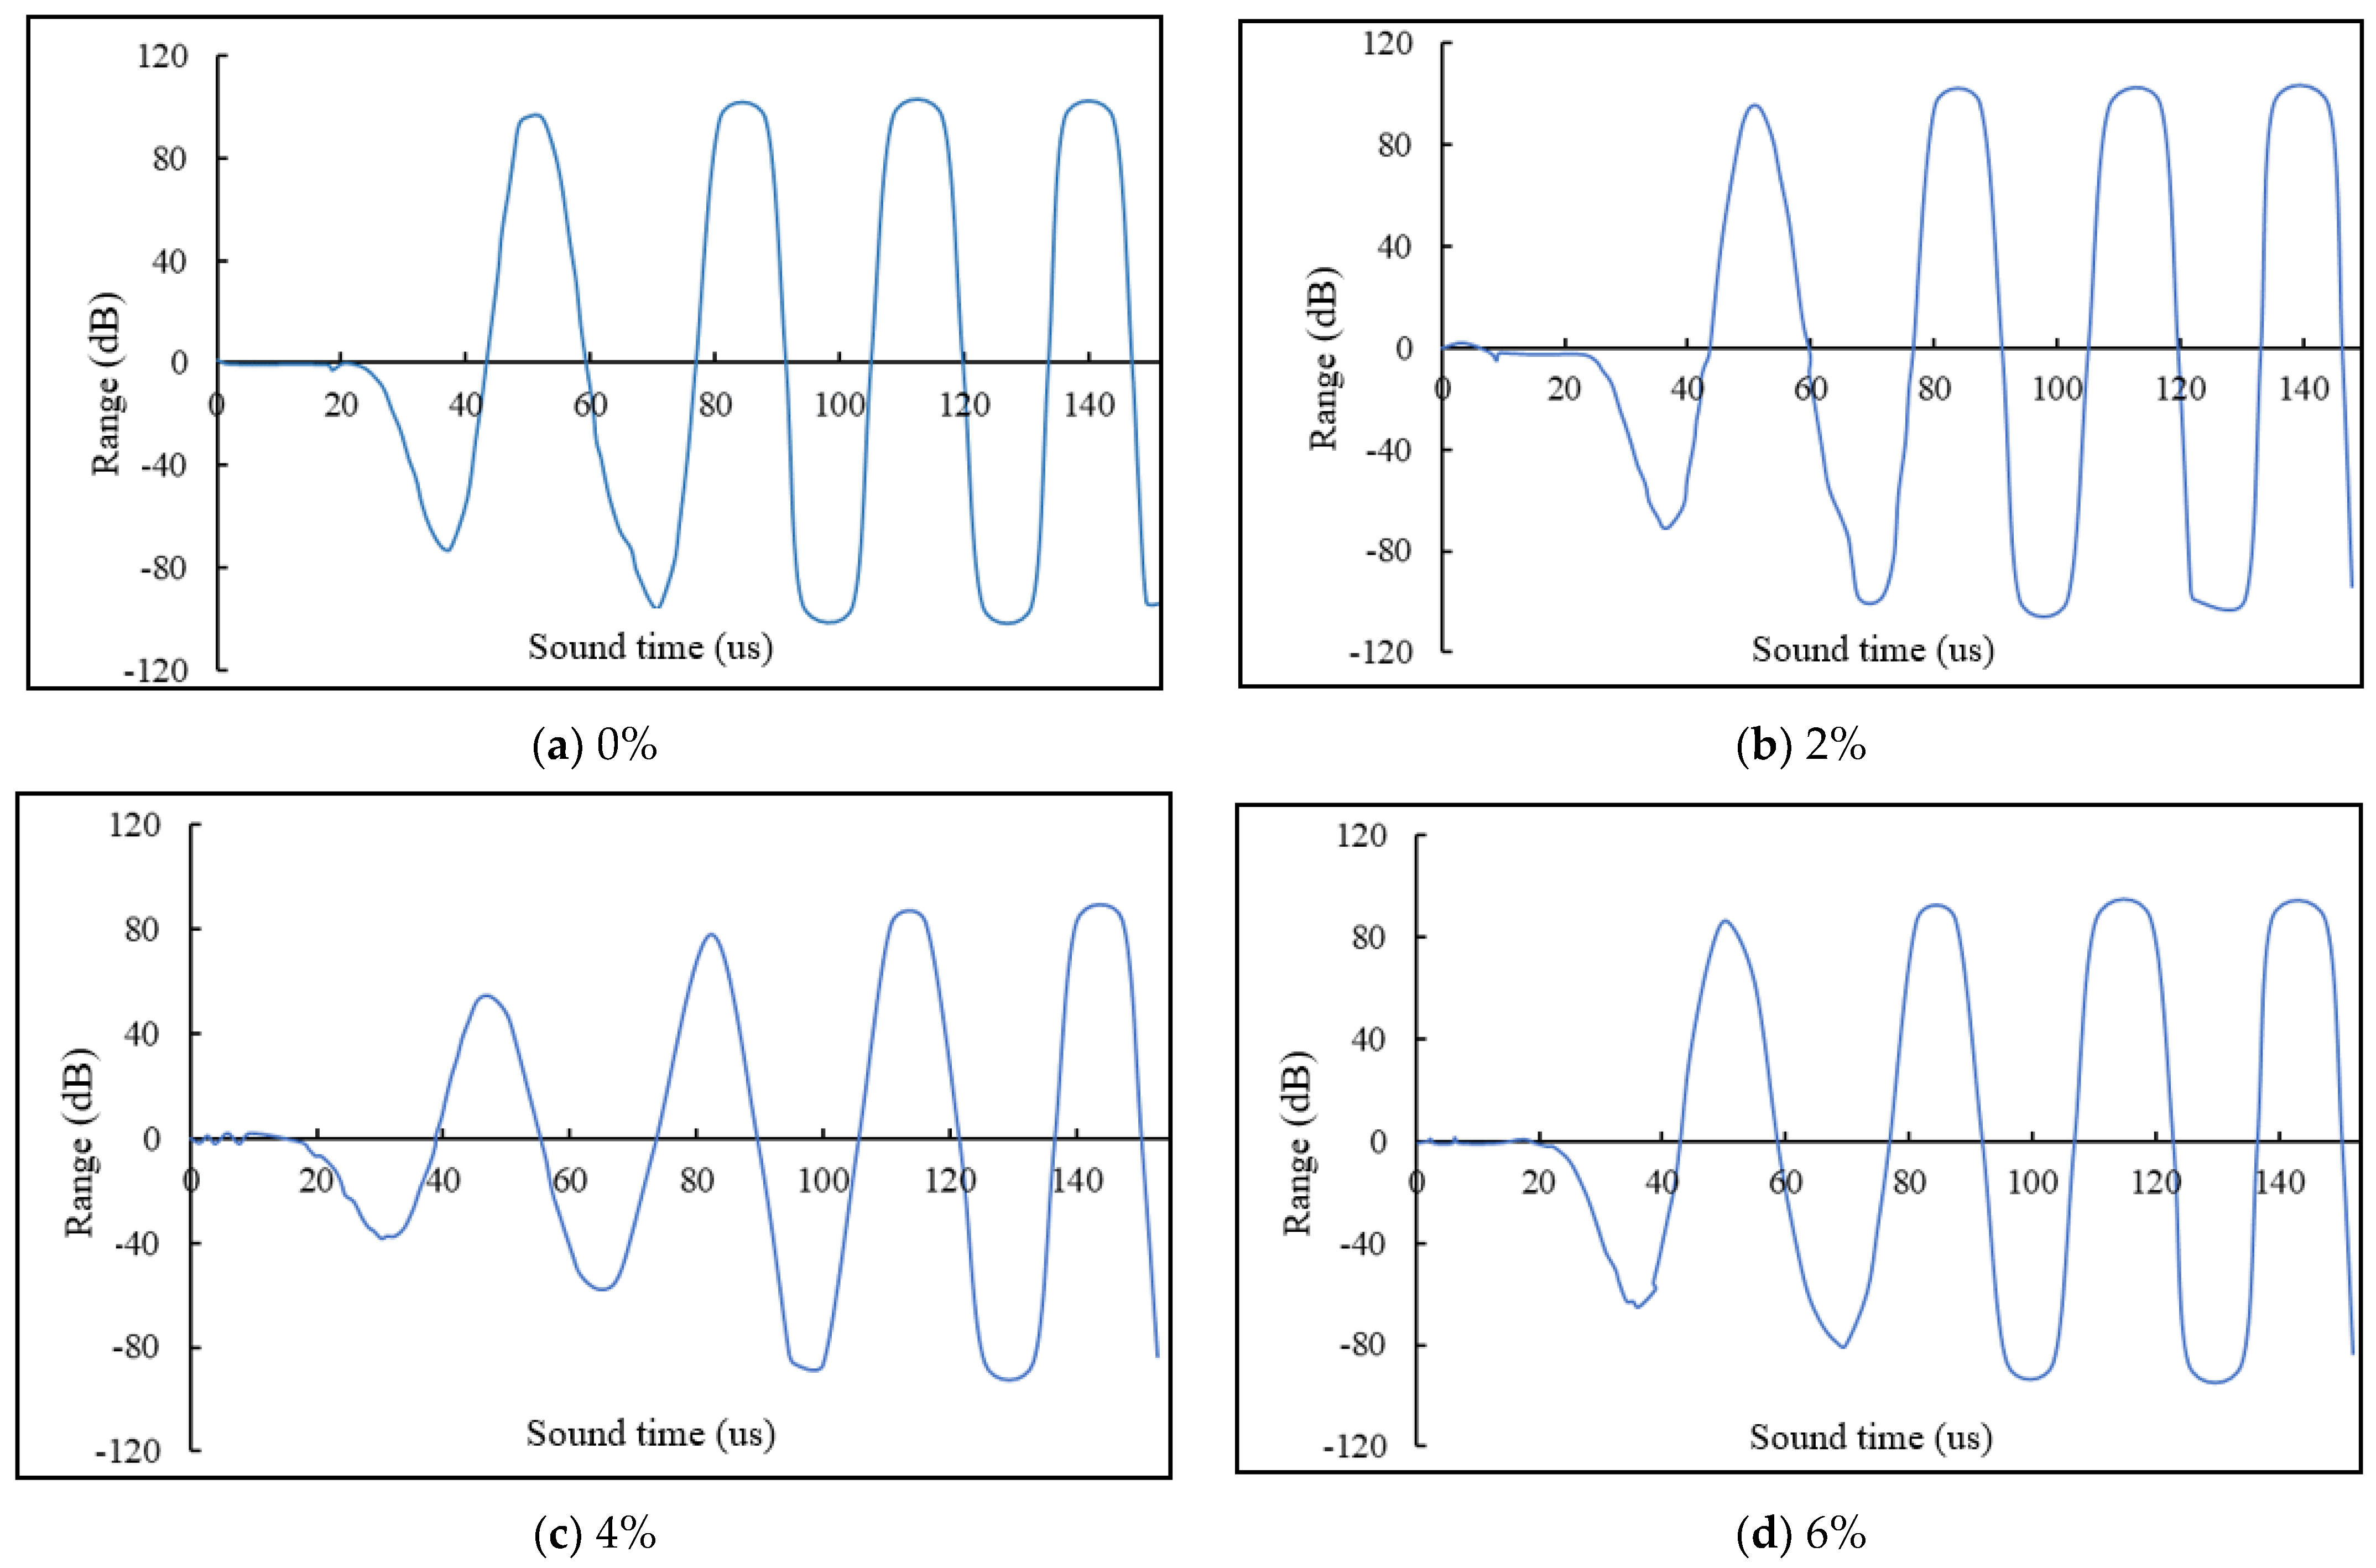
2.3.2. Self-Healing Function Detection

To evaluate the self-repair capabilities of the microcapsules in the cement mortar, it was necessary to pre-damage the specimens by introducing microcracks. This simulates the natural damage that triggers the microcapsules’ self-healing response, differentiating it from the natural healing mechanisms of standard cementitious materials.
The three-point bending method is a primary technique for inducing controlled structural cracks into cementitious materials due to its simplicity and the ability to control crack size. In this study, we performed a three-point bending test on prismatic cementitious specimens to introduce pre-damage. The deformation of each specimen was measured using two linear variable differential transformers (LVDTs) positioned at the center of the specimen’s bottom on both the front and back sides. The crack size was regulated by monitoring the bending strain at the specimen’s base.
Previous research indicates that pre-compression with at least 60% of the maximum compressive stress ( σ m a x ) can generate micro-cracks within the structure. Additionally, the stress at the crack tip can rupture the microcapsules, releasing a repair agent to fill these micro-cracks. To ensure adequate tip stress for microcapsule rupture, the specimens were pre-compressed to 70% of their damage load. The pre-damage procedure involved loading specimens, aged to their maintenance period, on an electro-hydraulic servo universal testing machine. The loading rate was maintained at 2400 N/s ± 200 N/s. After reaching 70% of the original specimen’s destructive load, the loading was halted, maintained for 180 s, and then released to complete the pre-damage process. Post-damage, the specimens were stored in a standard curing box for 7 and 28 days.
Ultrasonic testing, which is more effective in hardened concrete (4000~5000 m/s) compared to water (1480 m/s) or air (350 m/s), was employed to assess the repair efficacy of microcapsules (as shown in Figure 7 and Figure 8). The study designed three experimental conditions: original, damaged, and repaired, as depicted in Figure 9. The original condition involved testing specimens immediately after 28 days of standard curing post-molding. The damaged condition involved testing immediately post-pre-damage, and the repaired condition involved testing immediately after 28 days of standard post-repair curing.

2.3.3. Test Programme for the Effectiveness of the Repair

To evaluate the impact of microcapsules on the internal damage repair and mechanical property recovery of cement mortar specimens, flexural and compressive tests were conducted. Variables included the age of curing (7, 14, 28 days), specimen conditions (original, damaged, repaired), and repair age (7, 28 days), following the ISO 679:2009 [16]. The original compressive strength (F0), immediate post-damage strength (Fs), and post-repair strengths at 7 days (F7) and 28 days (F28) were recorded in MPa. The effectiveness of the repair was quantified using strength recovery and repair rates, calculated as per Equations (1)–(4).
7   d   s t r e n g t h   r e c o v e r y   r a t e : η i 7 , x = F 7 F 0 × 100 %
28   d   s t r e n g t h   r e c o v e r y   r a t e : η i 28 , x = F 28 F 0 × 100 %
7   d   s t r e n g t h   r e p a i r   r a t e : η S 7 , x = F 7 F S F s × 100 %
28   d   s t r e n g t h   r e p a i r   r a t e : η S 28 , x = F 28 F S F s × 100 %
η i 7 , x and η i 28 , x are the strength recovery rates in % of after 7 d or 28 d of repair of self repairing mortar specimens after pre-damage at x% microencapsulation dosage respectively. η S 7 , x and η S 28 , x are the strength recovery rates in % after 7 d or 28 d repair at of pre-damaged self-healing mortar with x% of microencapsulation, respectively.

2.3.4. Pore Size Distribution Test Method

A MicroMR23-025V NMR tester (Suzhou Newmax Analytical Instruments Co., Ltd., Suzhou, China) was used to determine the pore size distribution of the comparison samples and the self-repairing microencapsulated cement mortar after standard maintenance for 28 d. The size of the mortar specimen was 30 mm × 15 mm × 10 mm. The size of the mortar specimen for NMR test was 30 mm × 15 mm × 10 mm. Before the test, the surface of the mortar specimen was wiped clean and then placed in a vacuum drying oven for 24 h. Then, the sample was taken out and placed in a vacuum pressurized device to be saturated with water. The vacuum time was 60 min, the pressurized strength was 20 MPa, and the saturation time was 24 h. Then, the specimen was taken out and put into the instrument to carry out the test of the pore size distribution, and the resonance frequency was 23.40%. The resonance frequency was 23.40 MHz, the temperature was 32.00 ± 0.02 °C, the diameter of the probe was 25 mm, and the pore size distribution was calculated by applying Equation (5).
1 T 2 = ρ S V p o n e
where: T2—relaxation time;
ρ—surface relaxation rate (70 μm/ms);
s/v—pore surface area volume ratio.

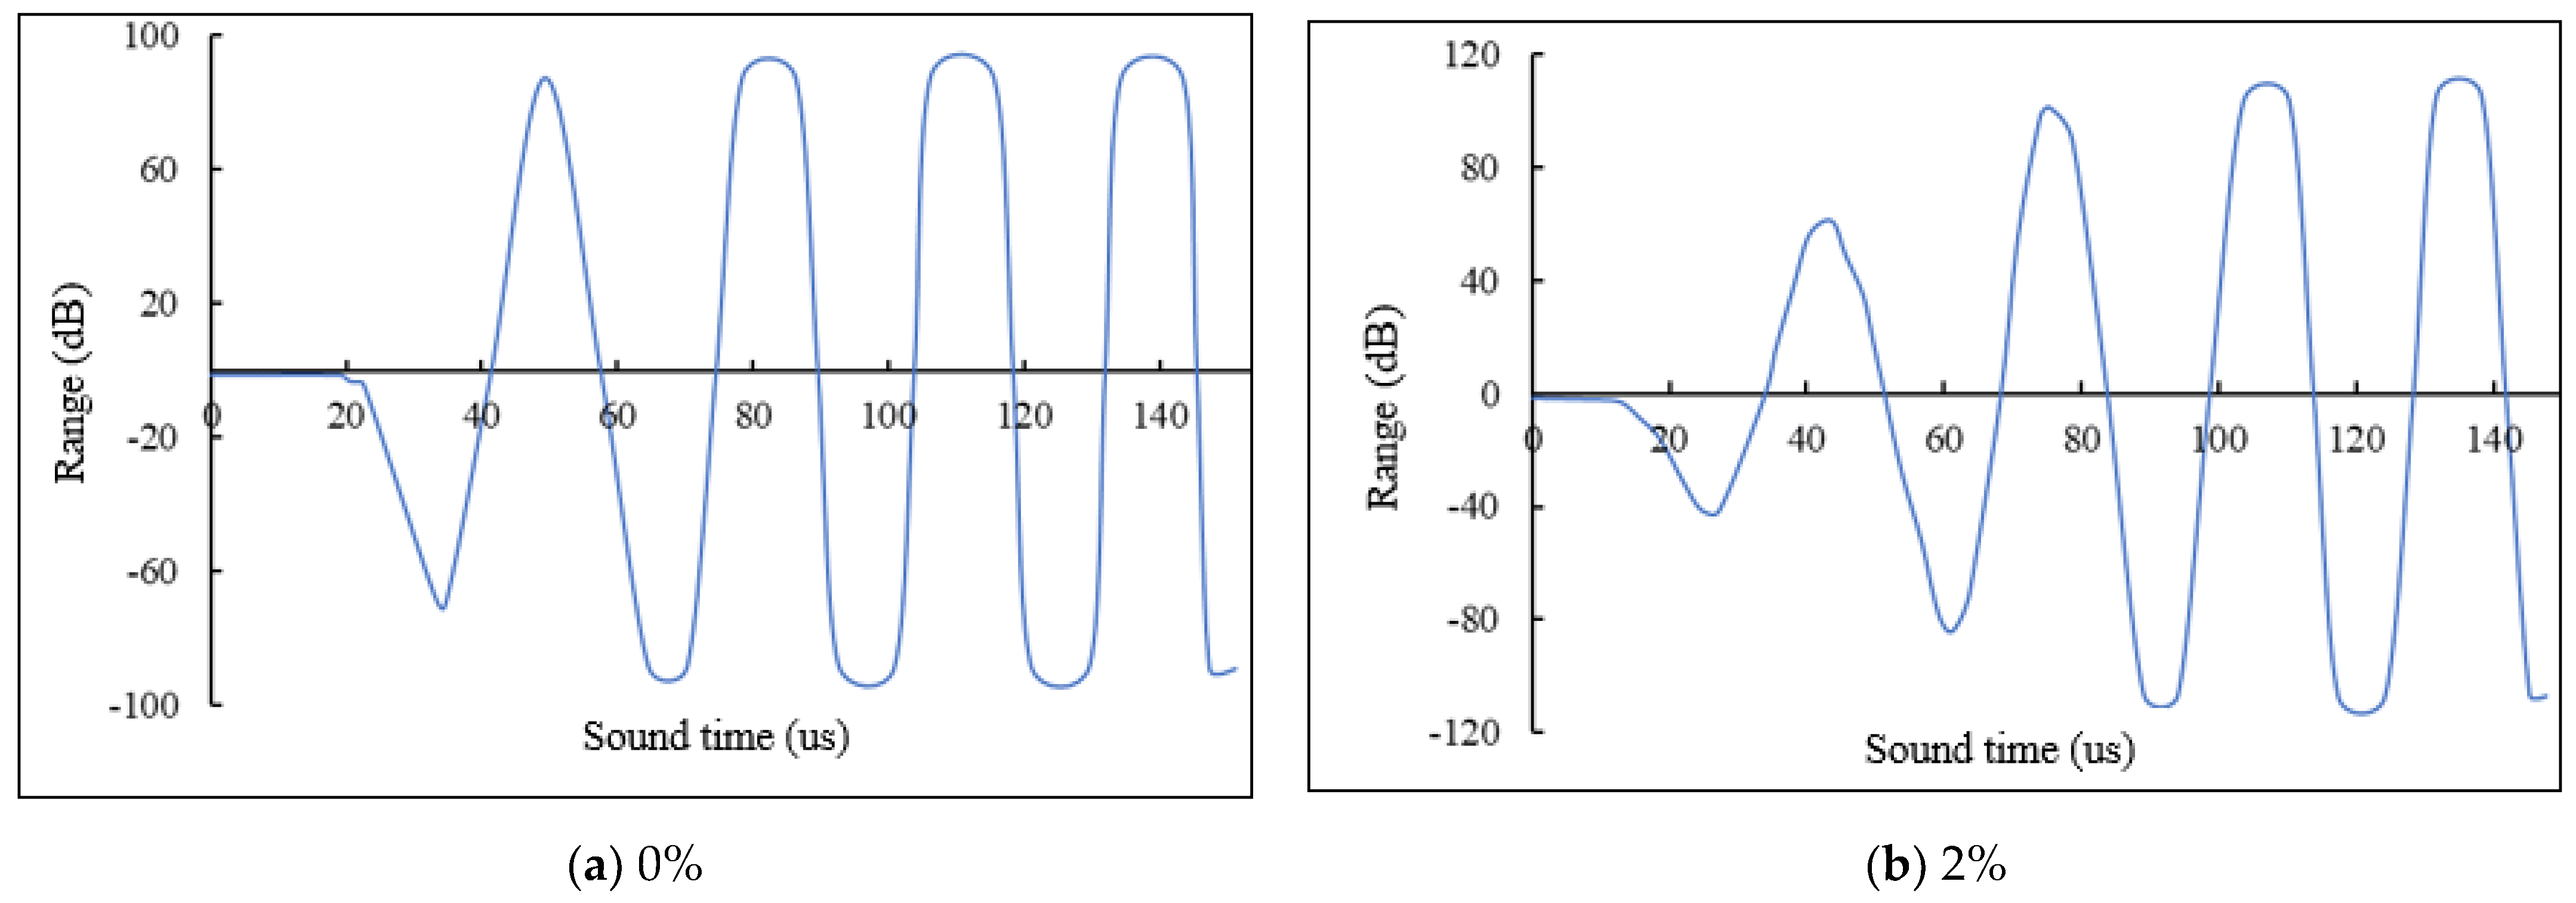
2.3.5. Rapid Chloride Diffusion Method

In accordance with the rapid chloride migration coefficient method (RCM method), the chloride diffusion coefficient of the comparison sample and the self-repairing microcapsule cement mortar after 28 d of standard maintenance were tested by using the RCM-6T chloride diffusion coefficient tester (Beijing Numerical Intelligence Yilong Instrument Co., Ltd., Beijing, China). Before testing, the mortar specimen block was cut into ϕ 100 mm × 50 mm samples. The chloride diffusion coefficient of the mortar was calculated according to Equation (6).
D R C M = 0.0239 × 273 + T L U 2 t X d 0.0238 273 + T L X d U 2
where: DRCM—diffusion coefficient of chloride ions in mortar (10−12 m2/s);
U—loading voltage (V);
T—mean value of the initial and ending temperatures of the anode (°C);
L—thickness of the mortar specimen (mm);
Xd—average depth of penetration of chloride ions (mm);
t—duration of the whole experimental test.

3. Results and Discussion

3.1. Interfacial Contact Properties and Microscopic Remediation

3.1.1. Cyst Wall-Cement Matrix

(1)
Moduli of the composite structure
The bulk, shear, and elastic moduli of the bladder-cement matrix composite are detailed in Table 5. Notably, the Young’s modulus is highest in the y-direction, likely due to the stability of silicate chains and the disruption of the hydrogen bonding network in other directions. The moduli for the T14Å-urea-formaldehyde ester composite are lower than those of pure tobermorite 14Å, indicating that microcapsule addition increases porosity and slightly diminishes the material’s mechanical properties. This reduction in elastic modulus at the microscopic level is attributed to increased interatomic distances, leading to decreased binding energy. However, this also suggests enhanced ductility due to greater elastic deformation.
(2)
Radial Distribution Function (RDF)
As shown in Figure 10, the RDF of tobermorite 14Å-urea-formaldehyde resin exhibits sharp peaks below 3.5 Å, indicating strong chemical bonding with the cementitious material, predominantly through electrostatic interactions between Ca2+, O2−, and N ions. This bonding is crucial for the material’s structural integrity, contrasting with the weaker Coulombic and Van der Waals’ forces.
(3)
Stress-strain behavior
The stress-strain curve for the z-direction (Figure 11) reveals three distinct phases: elastic, yield, and failure. The tensile strength of the tobermorite 14Å-urea-formaldehyde resin composite reaches 2.19 GPa, surpassing the 1.01 GPa of pure tobermorite 14Å. This enhancement is attributed to the urea-formaldehyde resin’s ability to mitigate crack propagation, thereby increasing the material’s strength. Additionally, the failure strain of the composite is 0.44, compared to 0.20 for pure tobermorite 14Å, indicating improved ultimate strain due to the inclusion of microcapsules.

3.1.2. Core-Cement Matrix

(1)
Relative concentration
Figure 12 illustrates the relative concentrations in the composite model, highlighting a reduction in the model’s length along the z-direction. Specifically, Figure 12a shows atom distribution in the second layer ranging from 50.74 to 61.92 Å, with no distribution in the first and third layers. Conversely, Figure 12b reveals atom distribution in the second layer from 26.81 to 34.33 Å, and in the first and third layers from 0 to 34.98 Å and from 25.35 to 59.23 Å, respectively. These distributions indicate that the atoms in the three-layer structure have interpenetrated post-simulation, suggesting enhanced interactions between the core material and the cement matrix.
(2)
Stress-strain curve
Figure 13 presents the stress-strain curves for three composite models derived from simulations. The maximum strains observed are 0.19, 0.34, and 0.27 for models with n = 0, X, and Y, respectively. Notably, the strain in the cured epoxy-cementitious material (with X or Y) is higher compared to the pure Tobermorillonite 14Å model (0.20), while the uncured model shows a slight reduction in strain. This underscores the significant impact of epoxy resin curing on the mechanical properties of microencapsulated self-healing cementitious materials.
(3)
Radial Distribution Function
Figure 14 displays the radial distribution functions (RDF) for the three models. The interaction between Tobermorite 14Å and epoxy resin primarily occurs through Ca ions in Tobermorite 14Å and N and O atoms in the epoxy resin. In the uncured n = 0 model, where N atoms are absent, the interaction is limited to Ca-O, resulting in weaker interatomic forces compared to the other models. The first RDF peak positions for Ca(T)-O(ex) atoms in the n = 0, X, and Y models are at 2.33 Å, 2.17 Å, and 2.16 Å, respectively, indicating stronger interactions in the cured models. Additionally, the interaction between Ca ions and N atoms is enhanced in the cured models, particularly when Y is used as the curing agent, leading to more pronounced directional interactions.

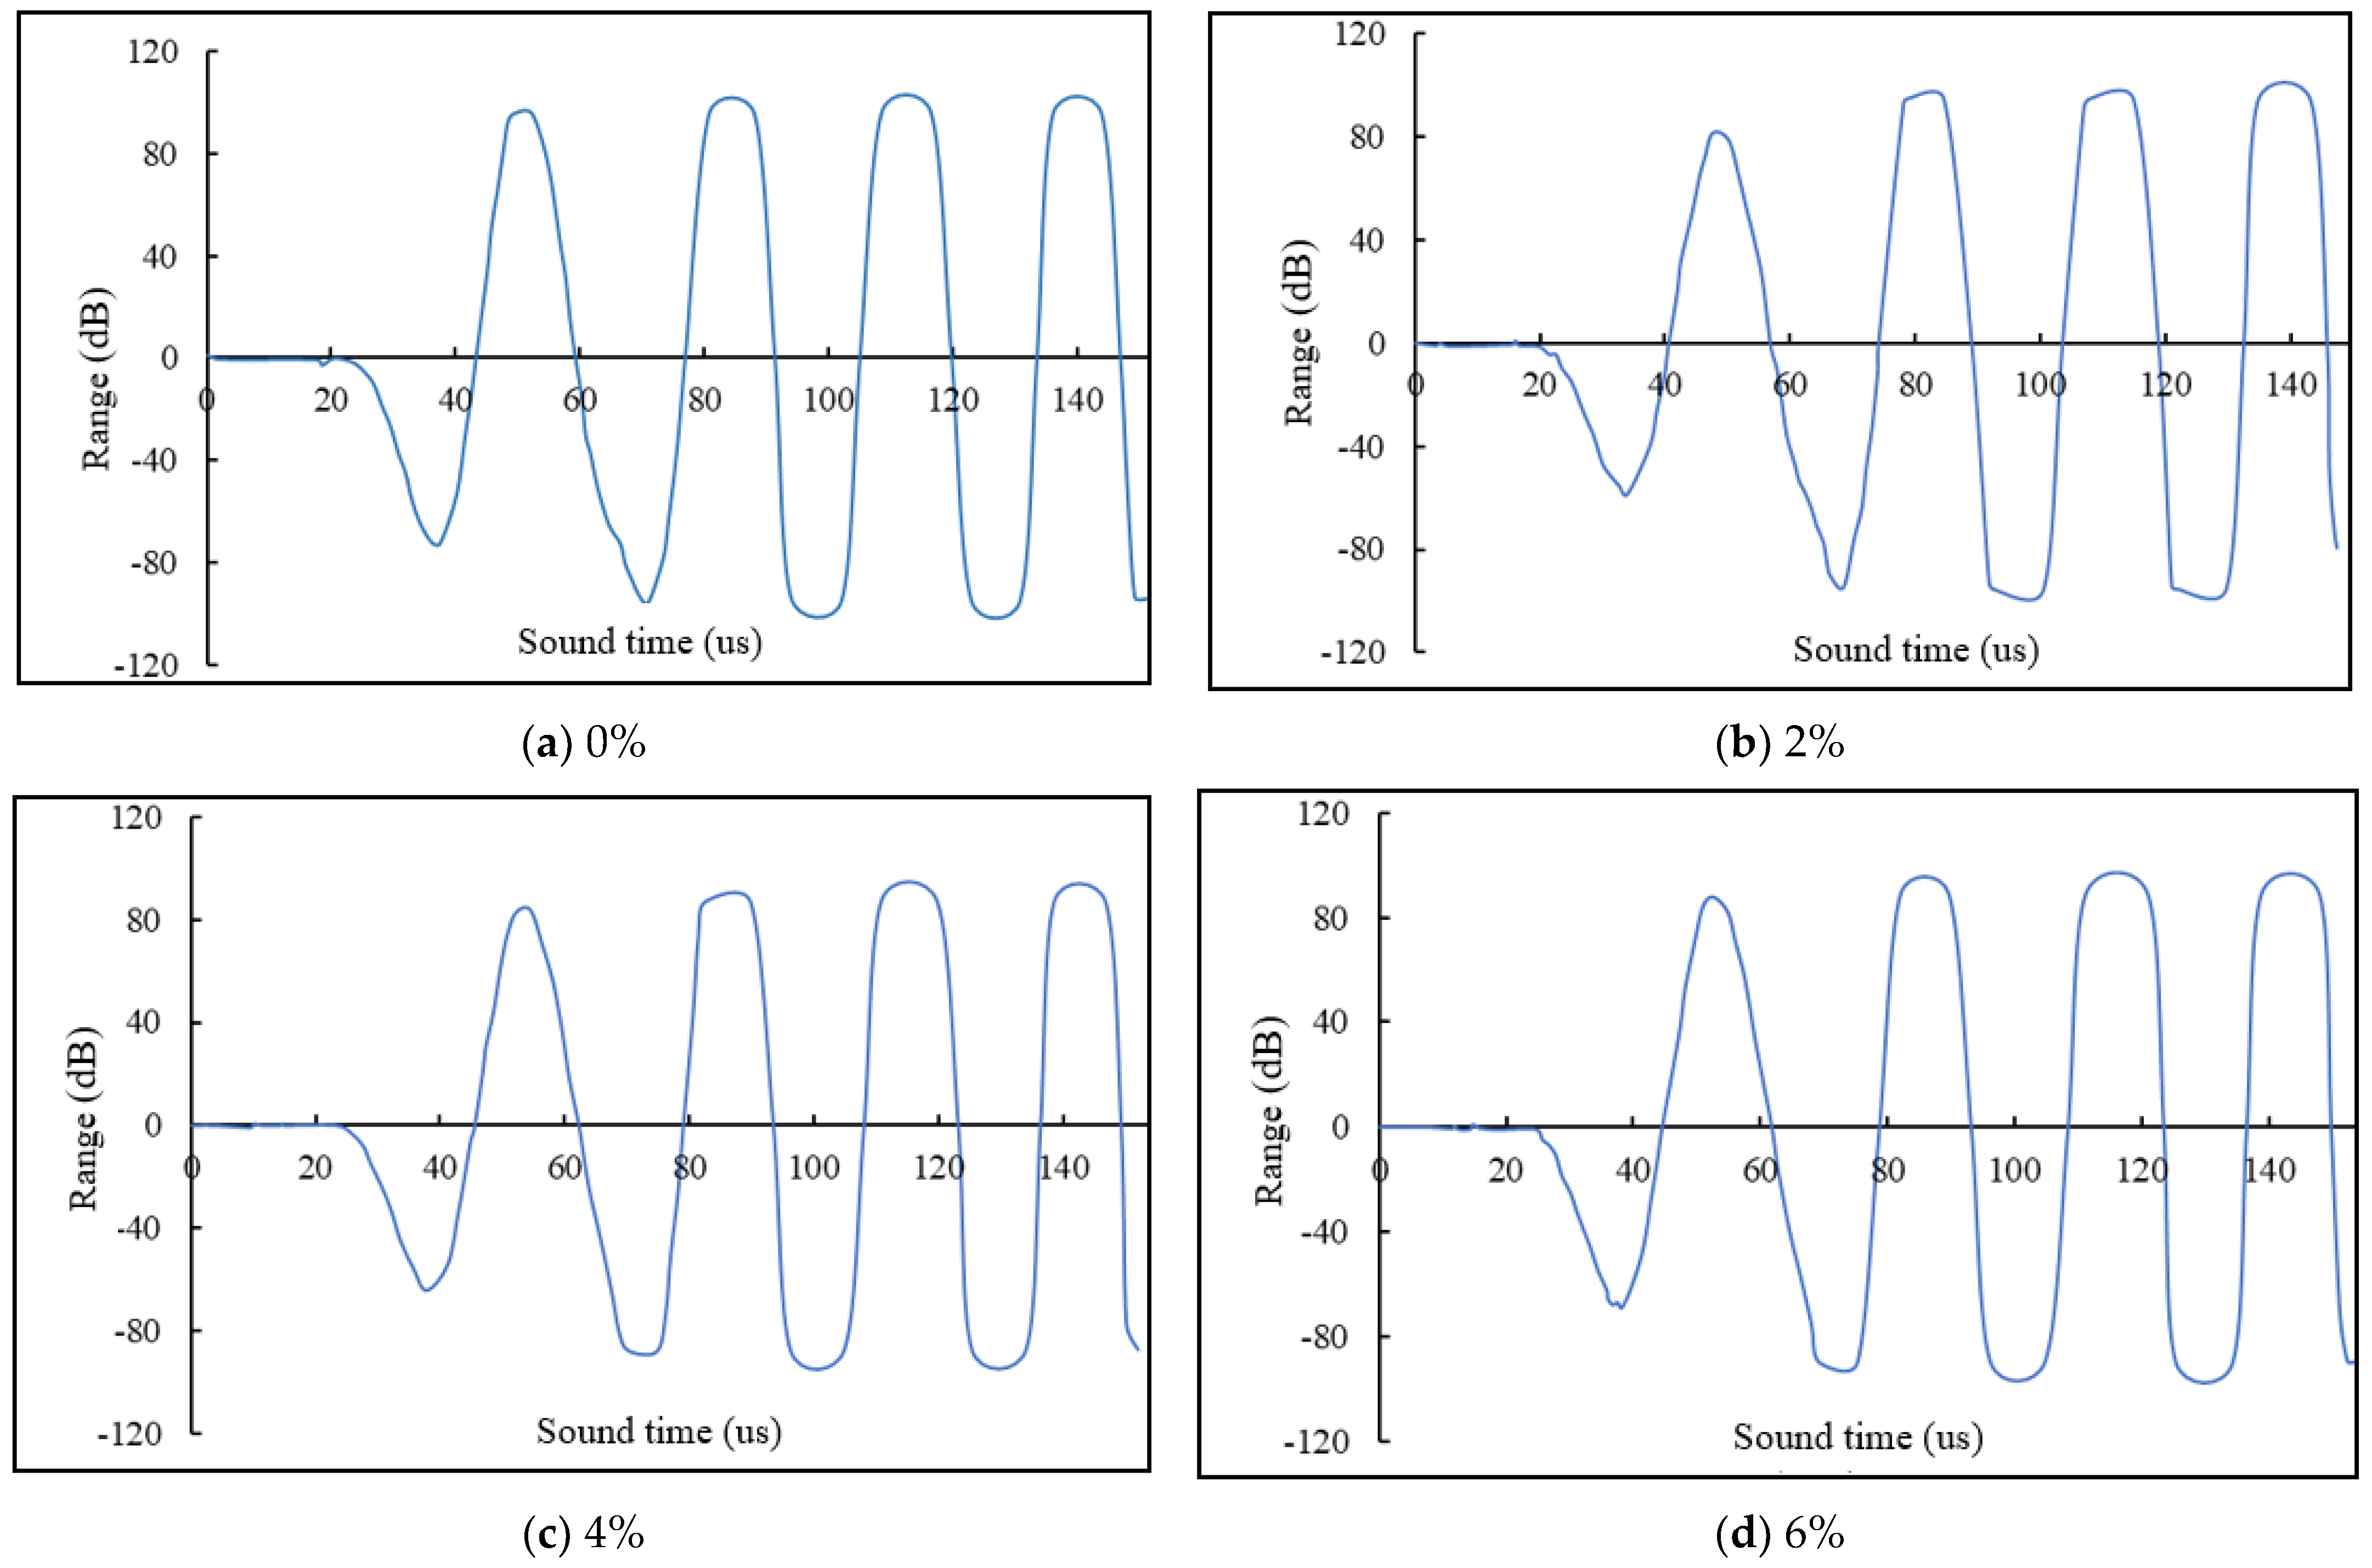
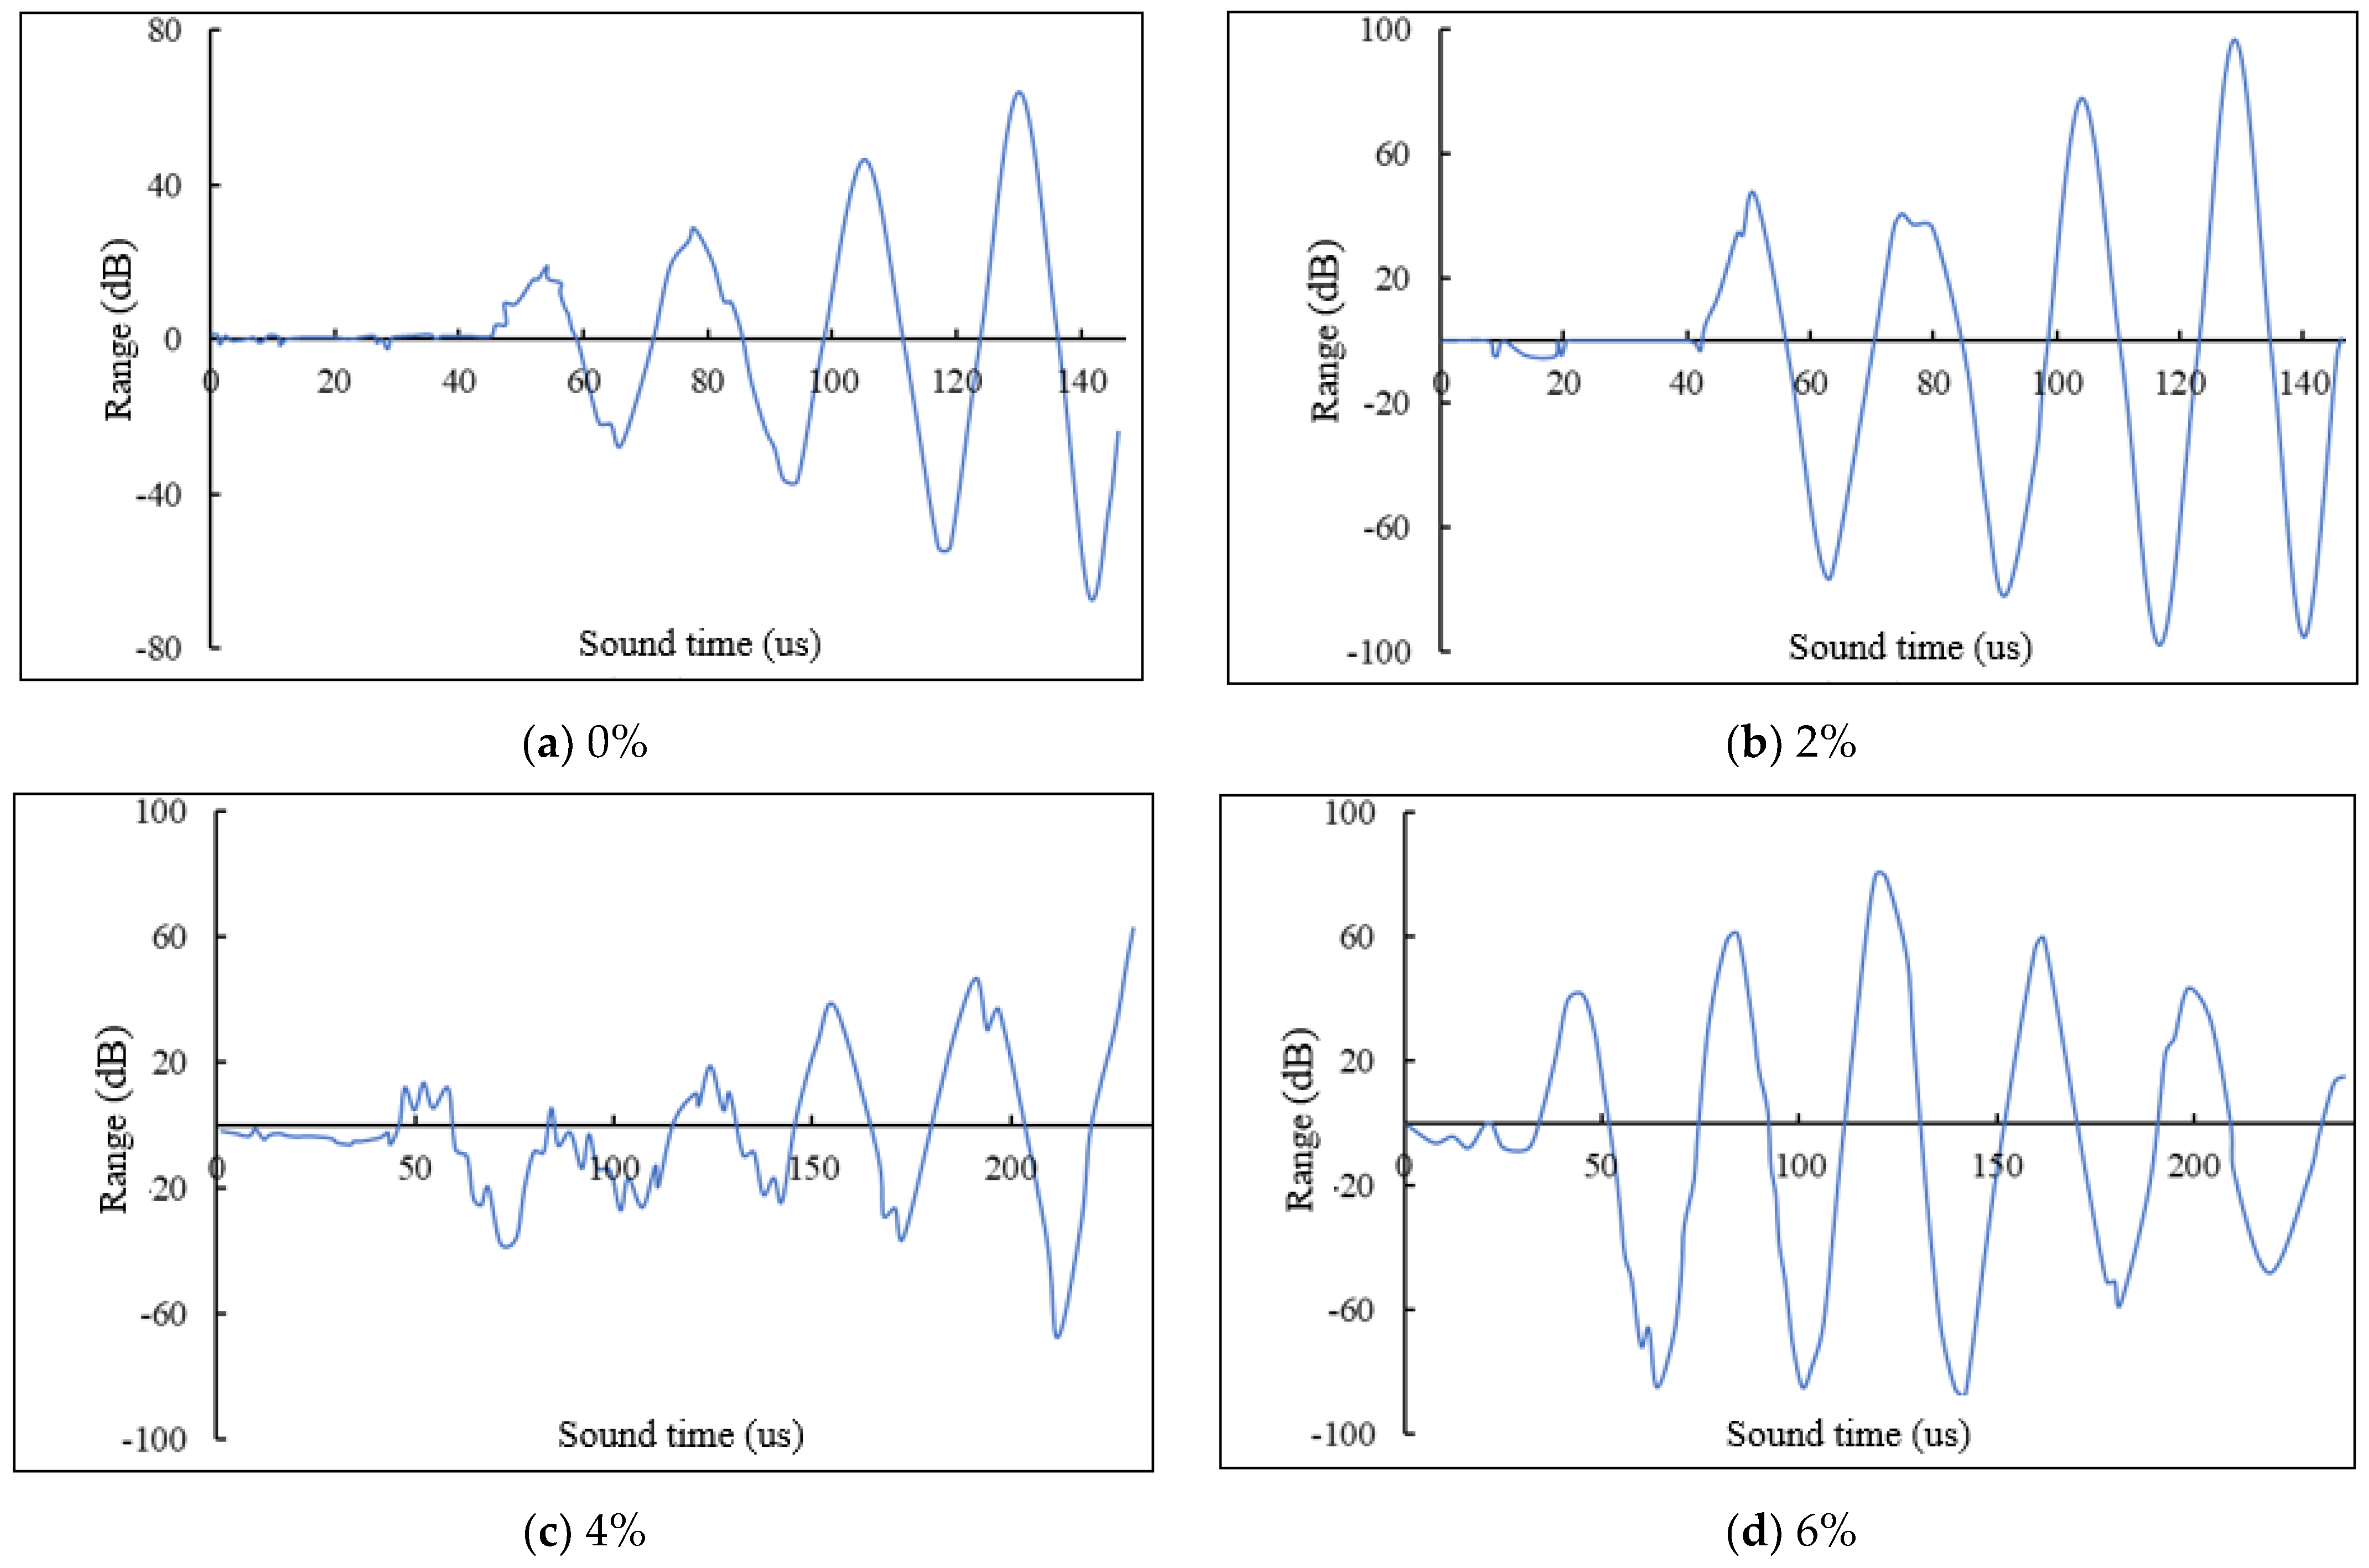
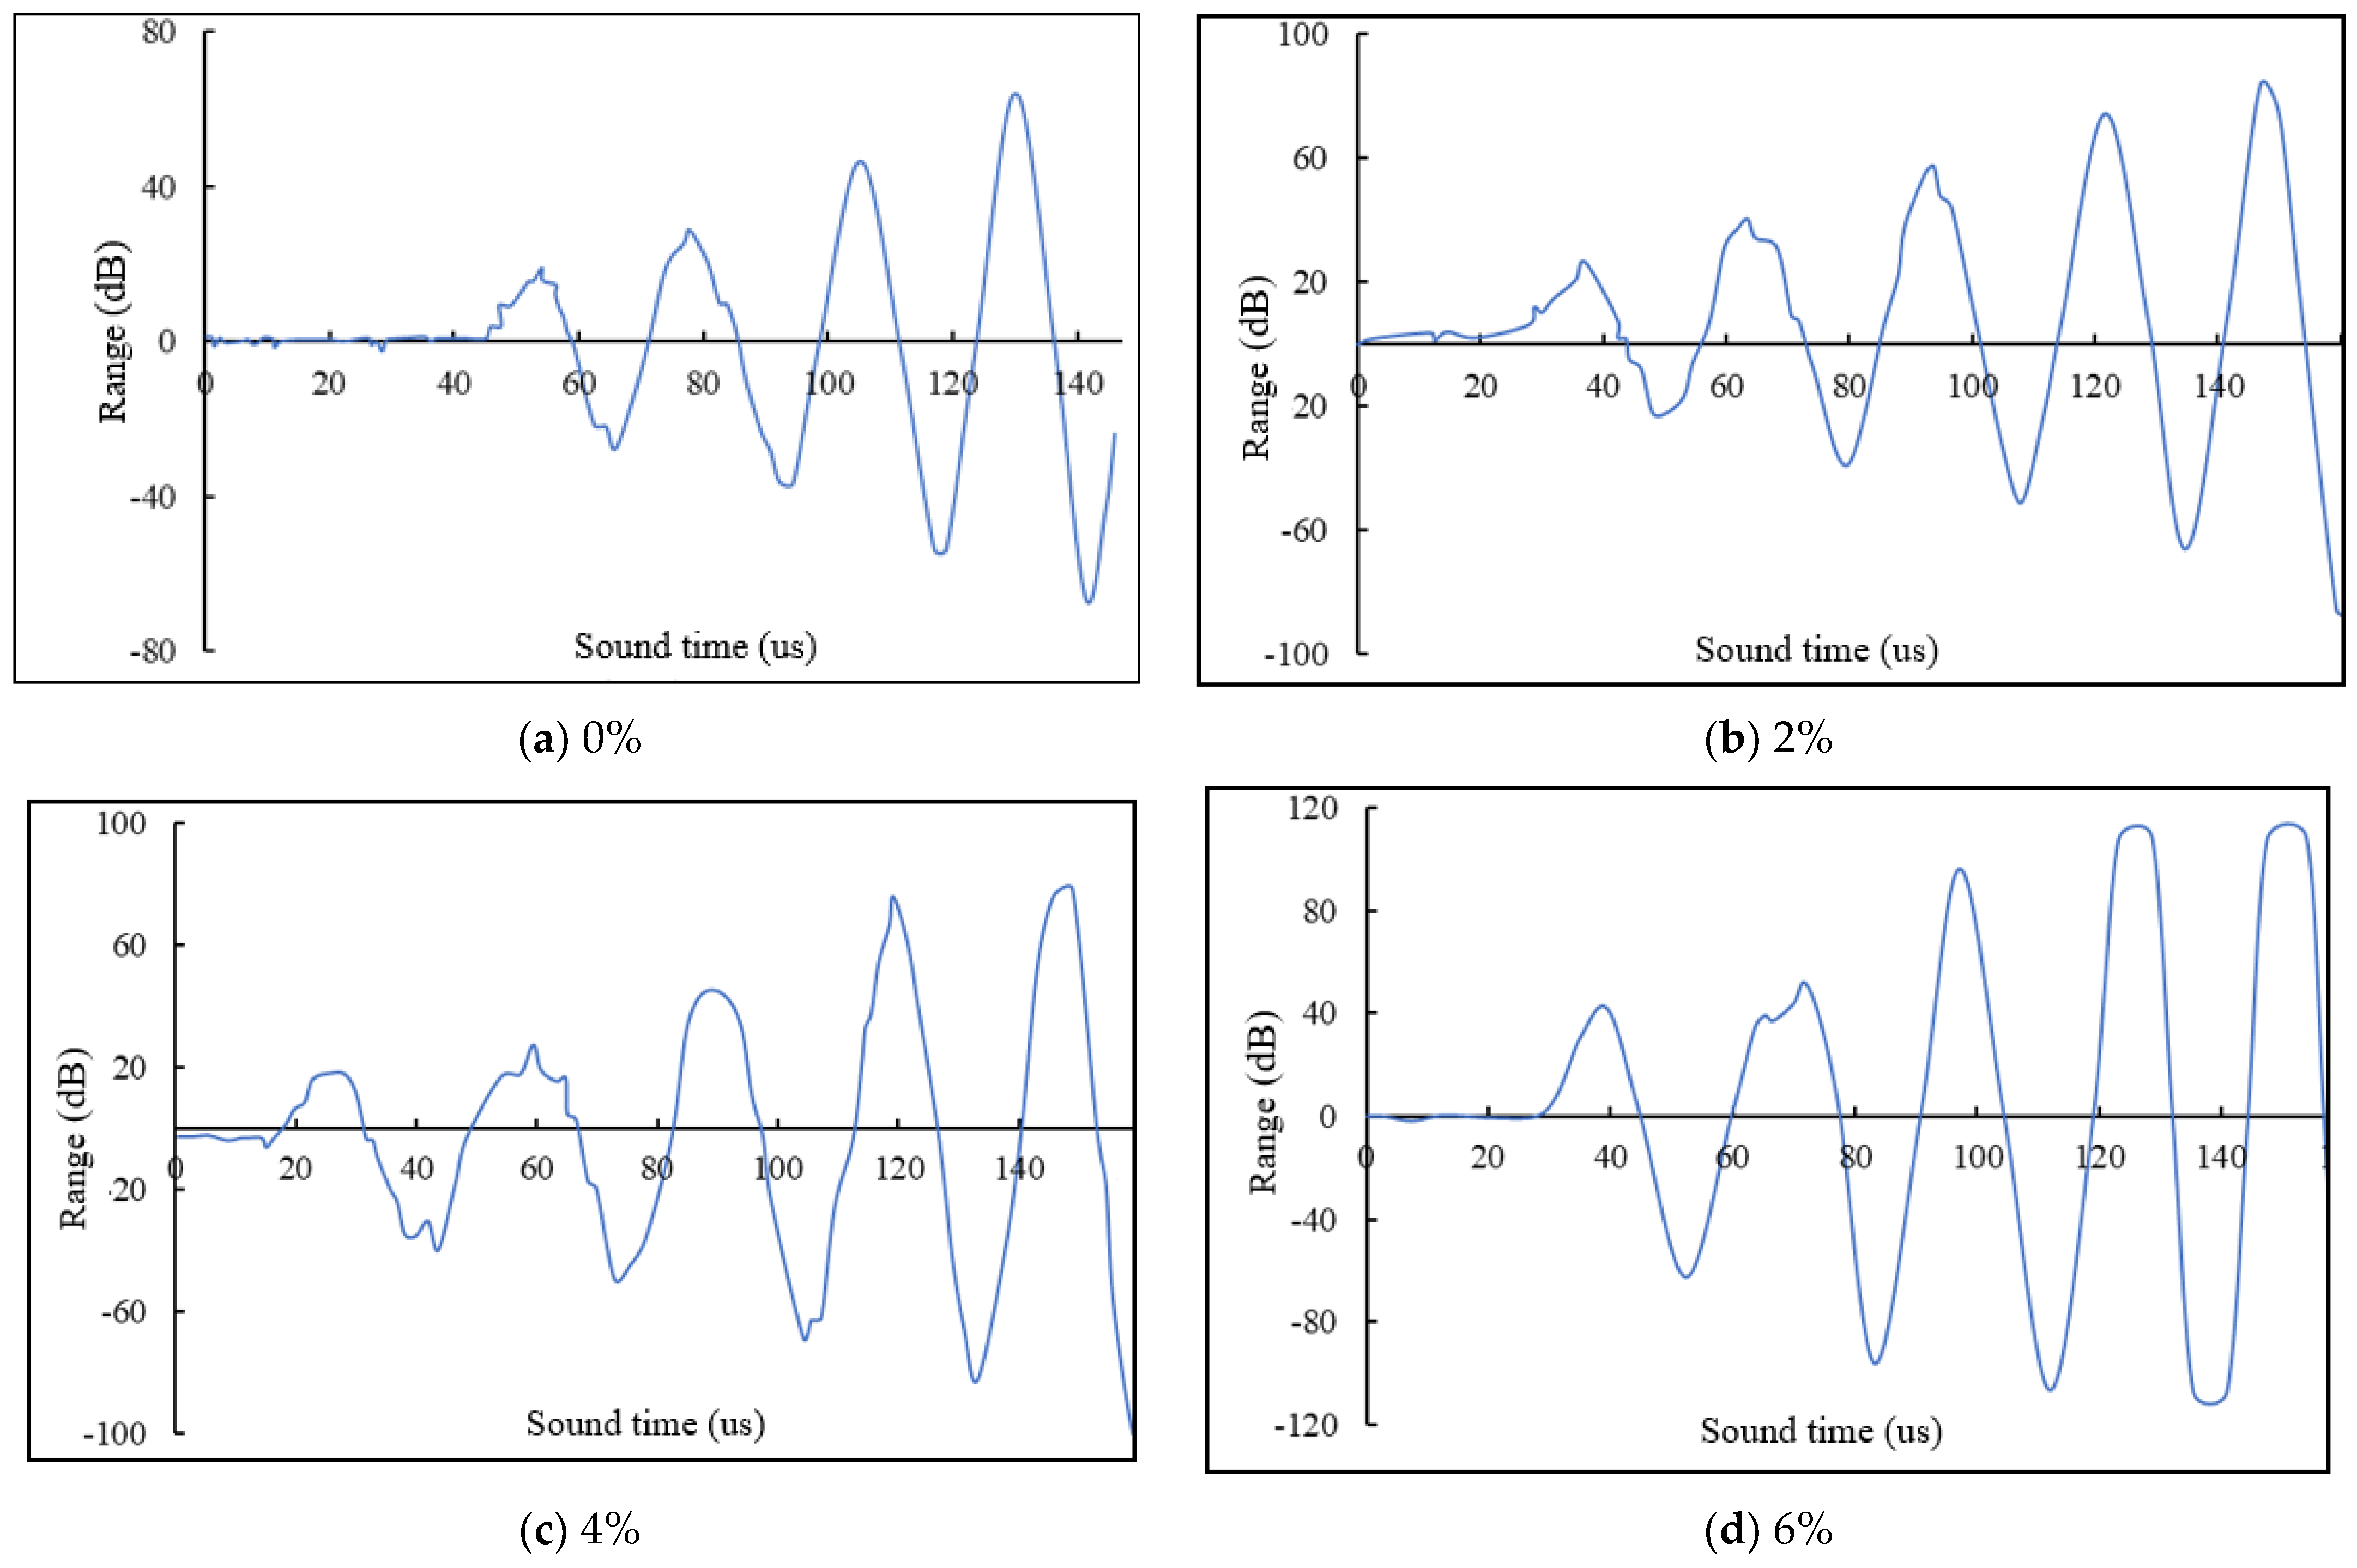
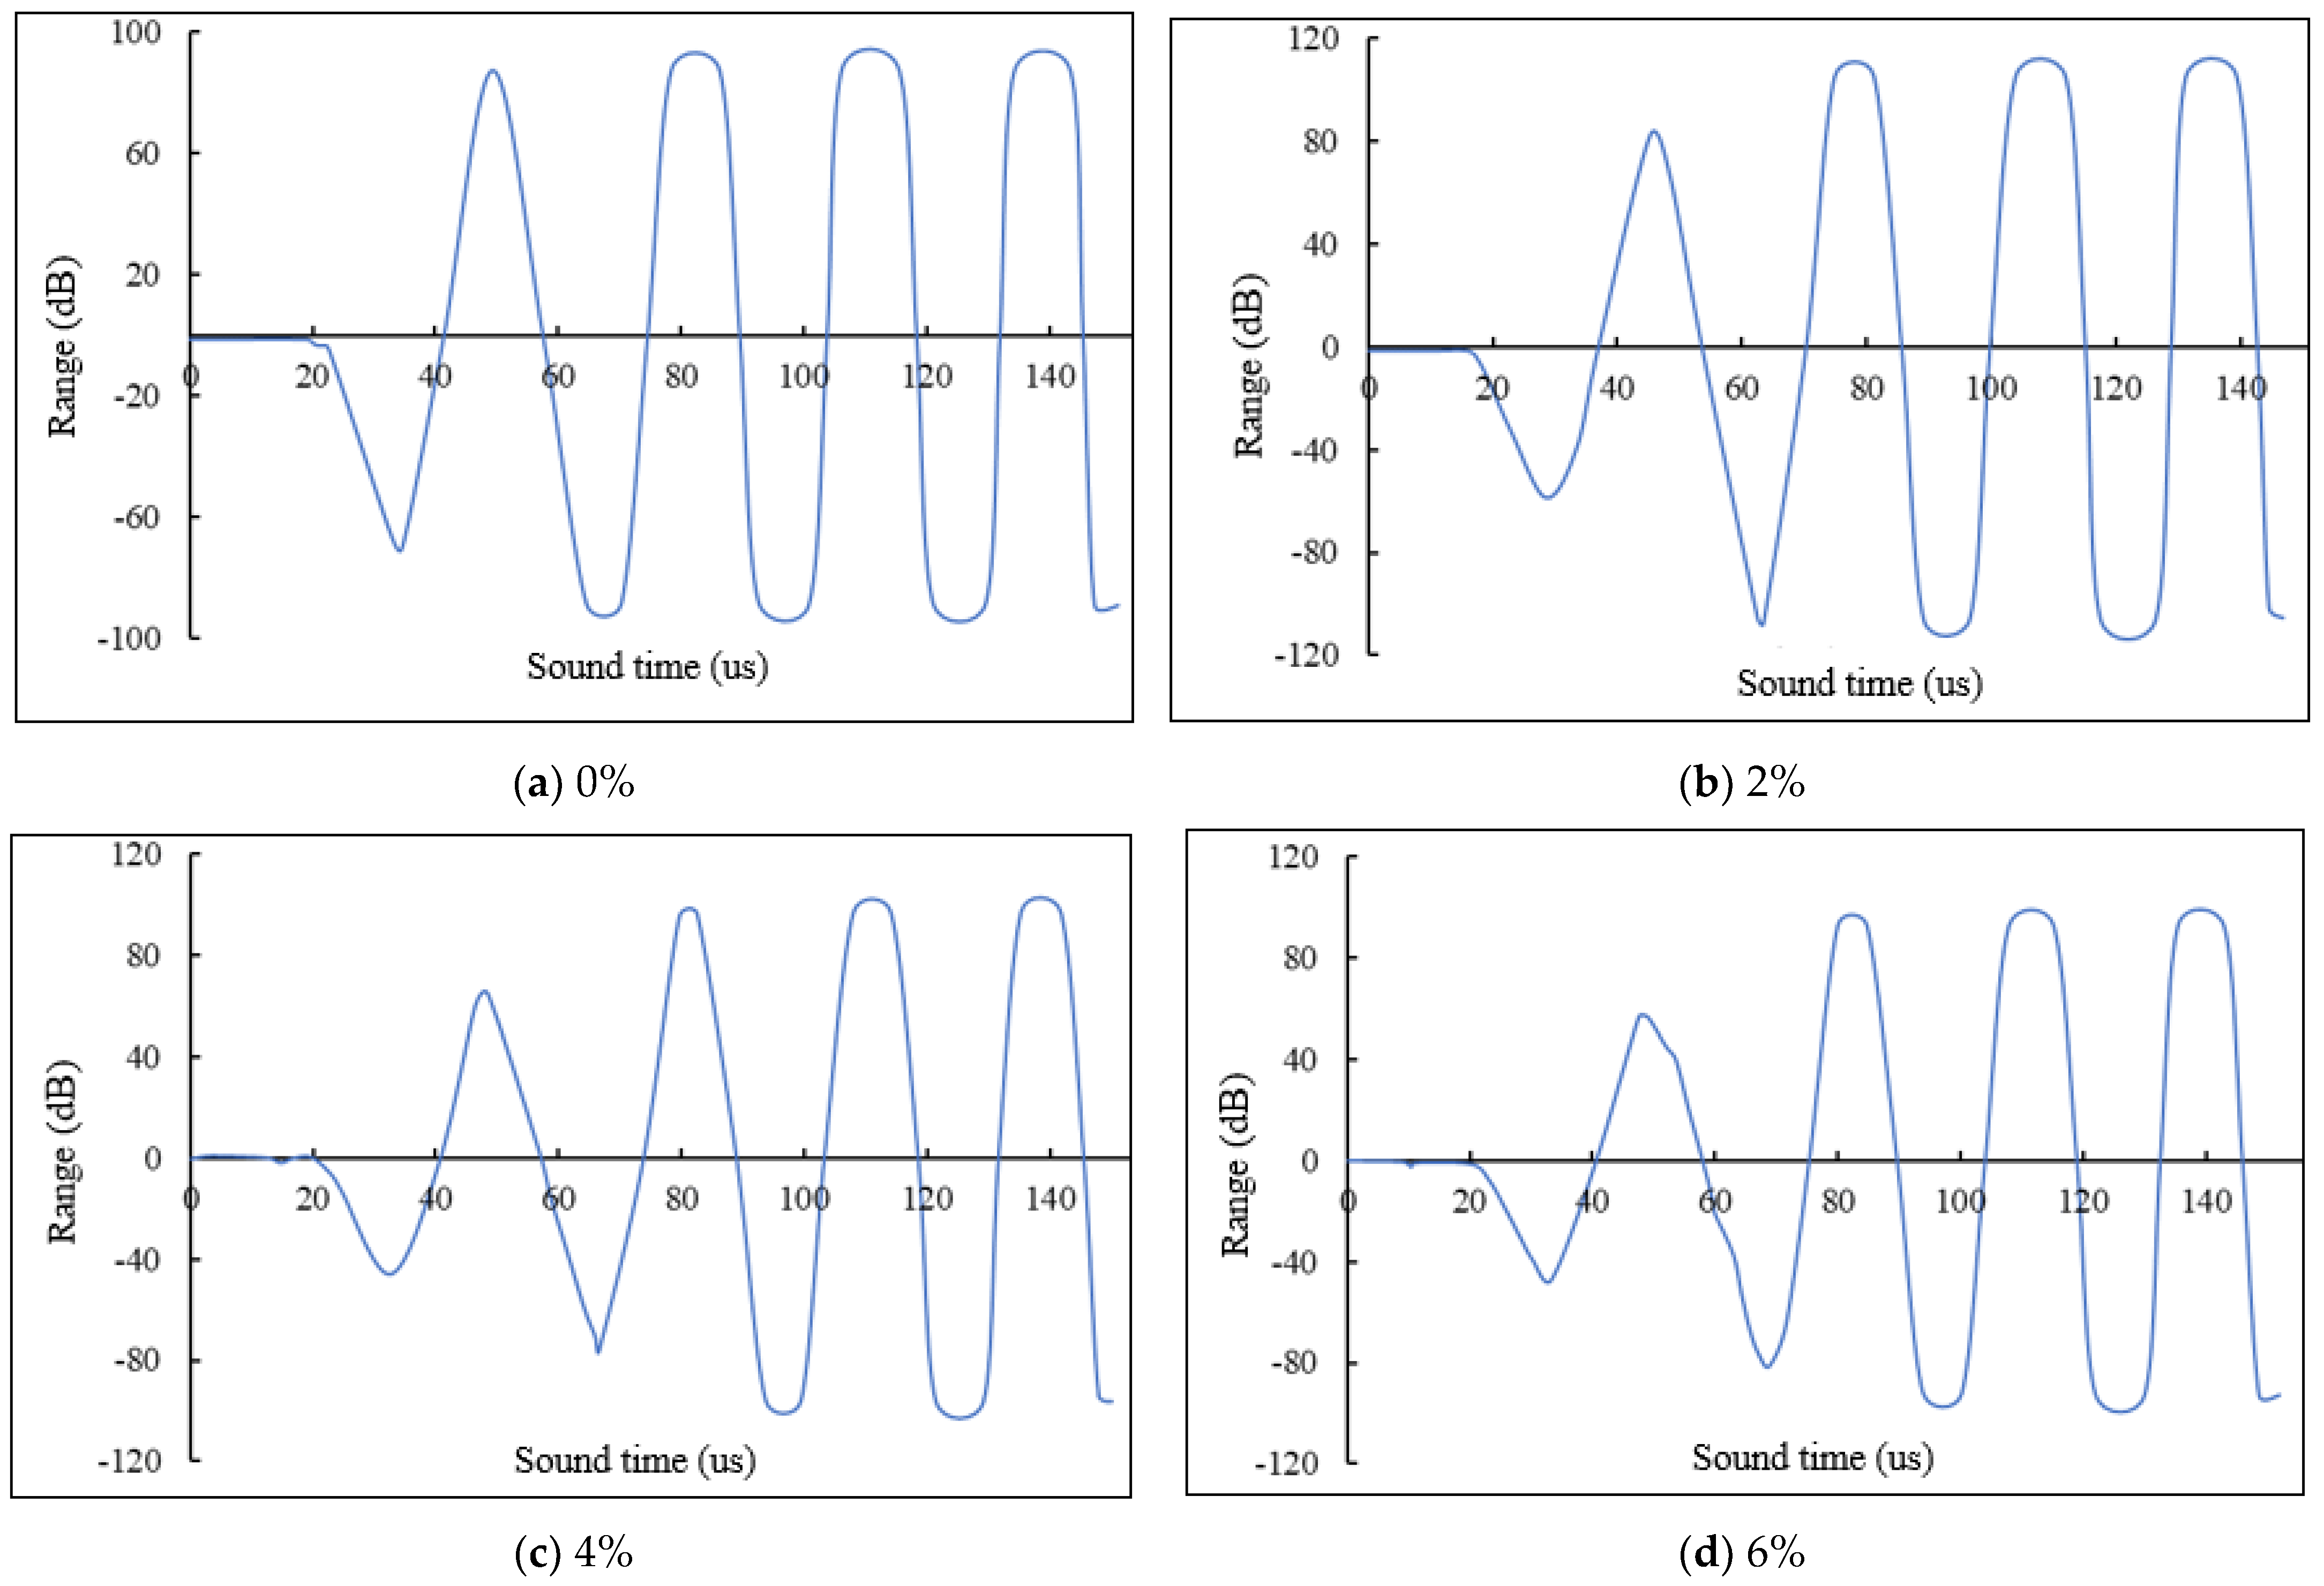
3.2. Structural Damage Repair Effect

The impact of microcapsule doping on ultrasonic propagation speed is depicted in Figure 15. It is observed that the speed decreases as the microcapsule concentration increases, with the lowest speed at 6% doping. This reduction is attributed to the microcapsules causing phenomena such as the reflection and bypassing of the ultrasonic waves within the cement mortar, which increases the path of propagation and attenuates the energy, thereby reducing the wave speed.
Figure 16 and Figure 17 show the ultrasonic waveforms for undamaged cement mortar specimens under normal conditions, displaying regular and complete sinusoidal patterns, indicating no internal structural damage.
From Figure 18, Figure 19 and Figure 20, it can be seen that the ultrasonic sound velocity of the damaged cement mortar specimen decreased significantly compared with that of the original working condition, that the waveforms were also distorted to different degrees, and that the waveforms were incomplete. As shown in Figure 18 and Figure 19, the most significant difference is the change of the direction of the first wave of the waveform. The first wave is changed from downward to upward, which fully proves that defective damage has been produced inside the specimen structure.
Under 28 days of repair conditions, the acoustic properties of microencapsulated self-healing cement mortar specimens are shown in Figure 21, Figure 22 and Figure 23. Although the ultrasonic speed has not fully returned to the original condition, the waveforms are more uniform and complete, and the speed is improved. This suggests that the microcapsules continue to function under varying temperatures, filling microcracks and maintaining the integrity of the repair material, which exhibits good low-temperature toughness and resistance to temperature-induced stress.

3.3. Effect of Initial Strength of Cement Mortar

The stress-time curves for flexural and compressive tests of specimens at various ages are shown in Figure 24 and Figure 25.
These curves reveal that the initial strength of both the compressive and flexural strength decreases with the incorporation of microcapsules, and the decrease in the initial strength of the specimen increases gradually with the increase in the amount of microcapsule incorporation, as shown in Figure 23. The effect is more pronounced on compressive strength than on flexural strength.
The decrease in the initial strengths is due to the mechanical properties of the microcapsules being inferior to those of the aggregate, reducing the overall component ratio in the cement matrix. The microcapsules act as fillers, creating numerous pores within the matrix. Microscopic analysis shows that the modulus values of the cementitious-urea-formaldehyde ester composite are lower than those of pure cement, indicating a reduction in the bonding energy and overall mechanical properties due to increased porosity. However, this also results in increased elastic deformation, enhancing the material’s ductility.
Figure 26 and Figure 27 also indicate that the initial strength of the cement mortar increases with specimen age, attributed to the enhanced hydration and densification of the cement matrix over time, which is further aided by the filling effect of the microcapsules.

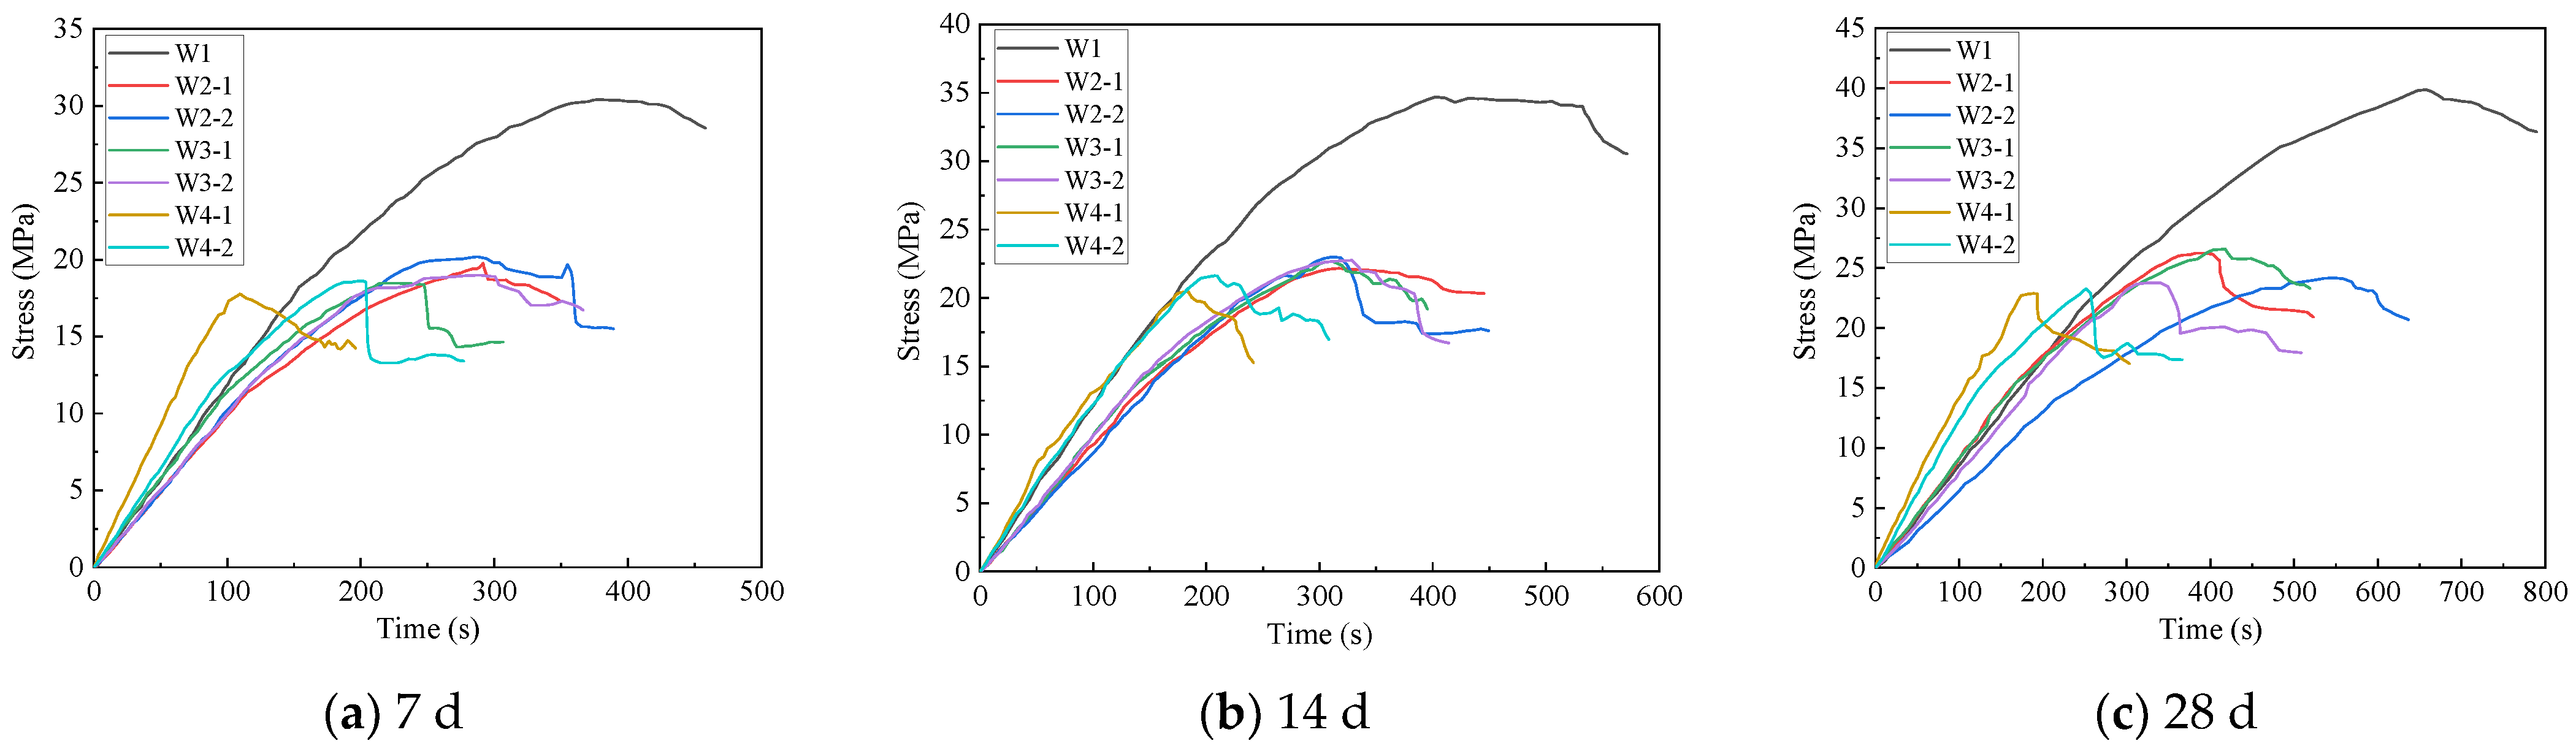
3.4. Influence of Cement Mortar Strength on the Effectiveness of Repair

3.4.1. Experimental Group without Microcapsule Incorporation

The strength recovery and repair rates of the W1 group specimens after 7 and 28 days of maintenance are depicted in Figure 28.
These rates decline as the maintenance period increases. At 7 and 14 days, the strength values showed some recovery after maintenance, with recovery rates of 107.81% and 115.03% at 7 days, and 102.65% and 106.46% at 14 days, respectively. The repair rates were 8.97% and 16.27% at 7 days, and 4.13% and 8.0% at 14 days. However, at 28 days, the strength decreased rather than increased post-maintenance, indicating a negative repair rate.
Cementitious materials exhibit inherent self-repair capabilities, though these are limited. Early in the maintenance period, unhydrated cement particles can rapidly hydrate upon damage, aiding strength recovery. Beyond 28 days, the hydration level is high, reducing the availability of unhydrated particles to contribute to repair, and thus failing to restore strength after damage.

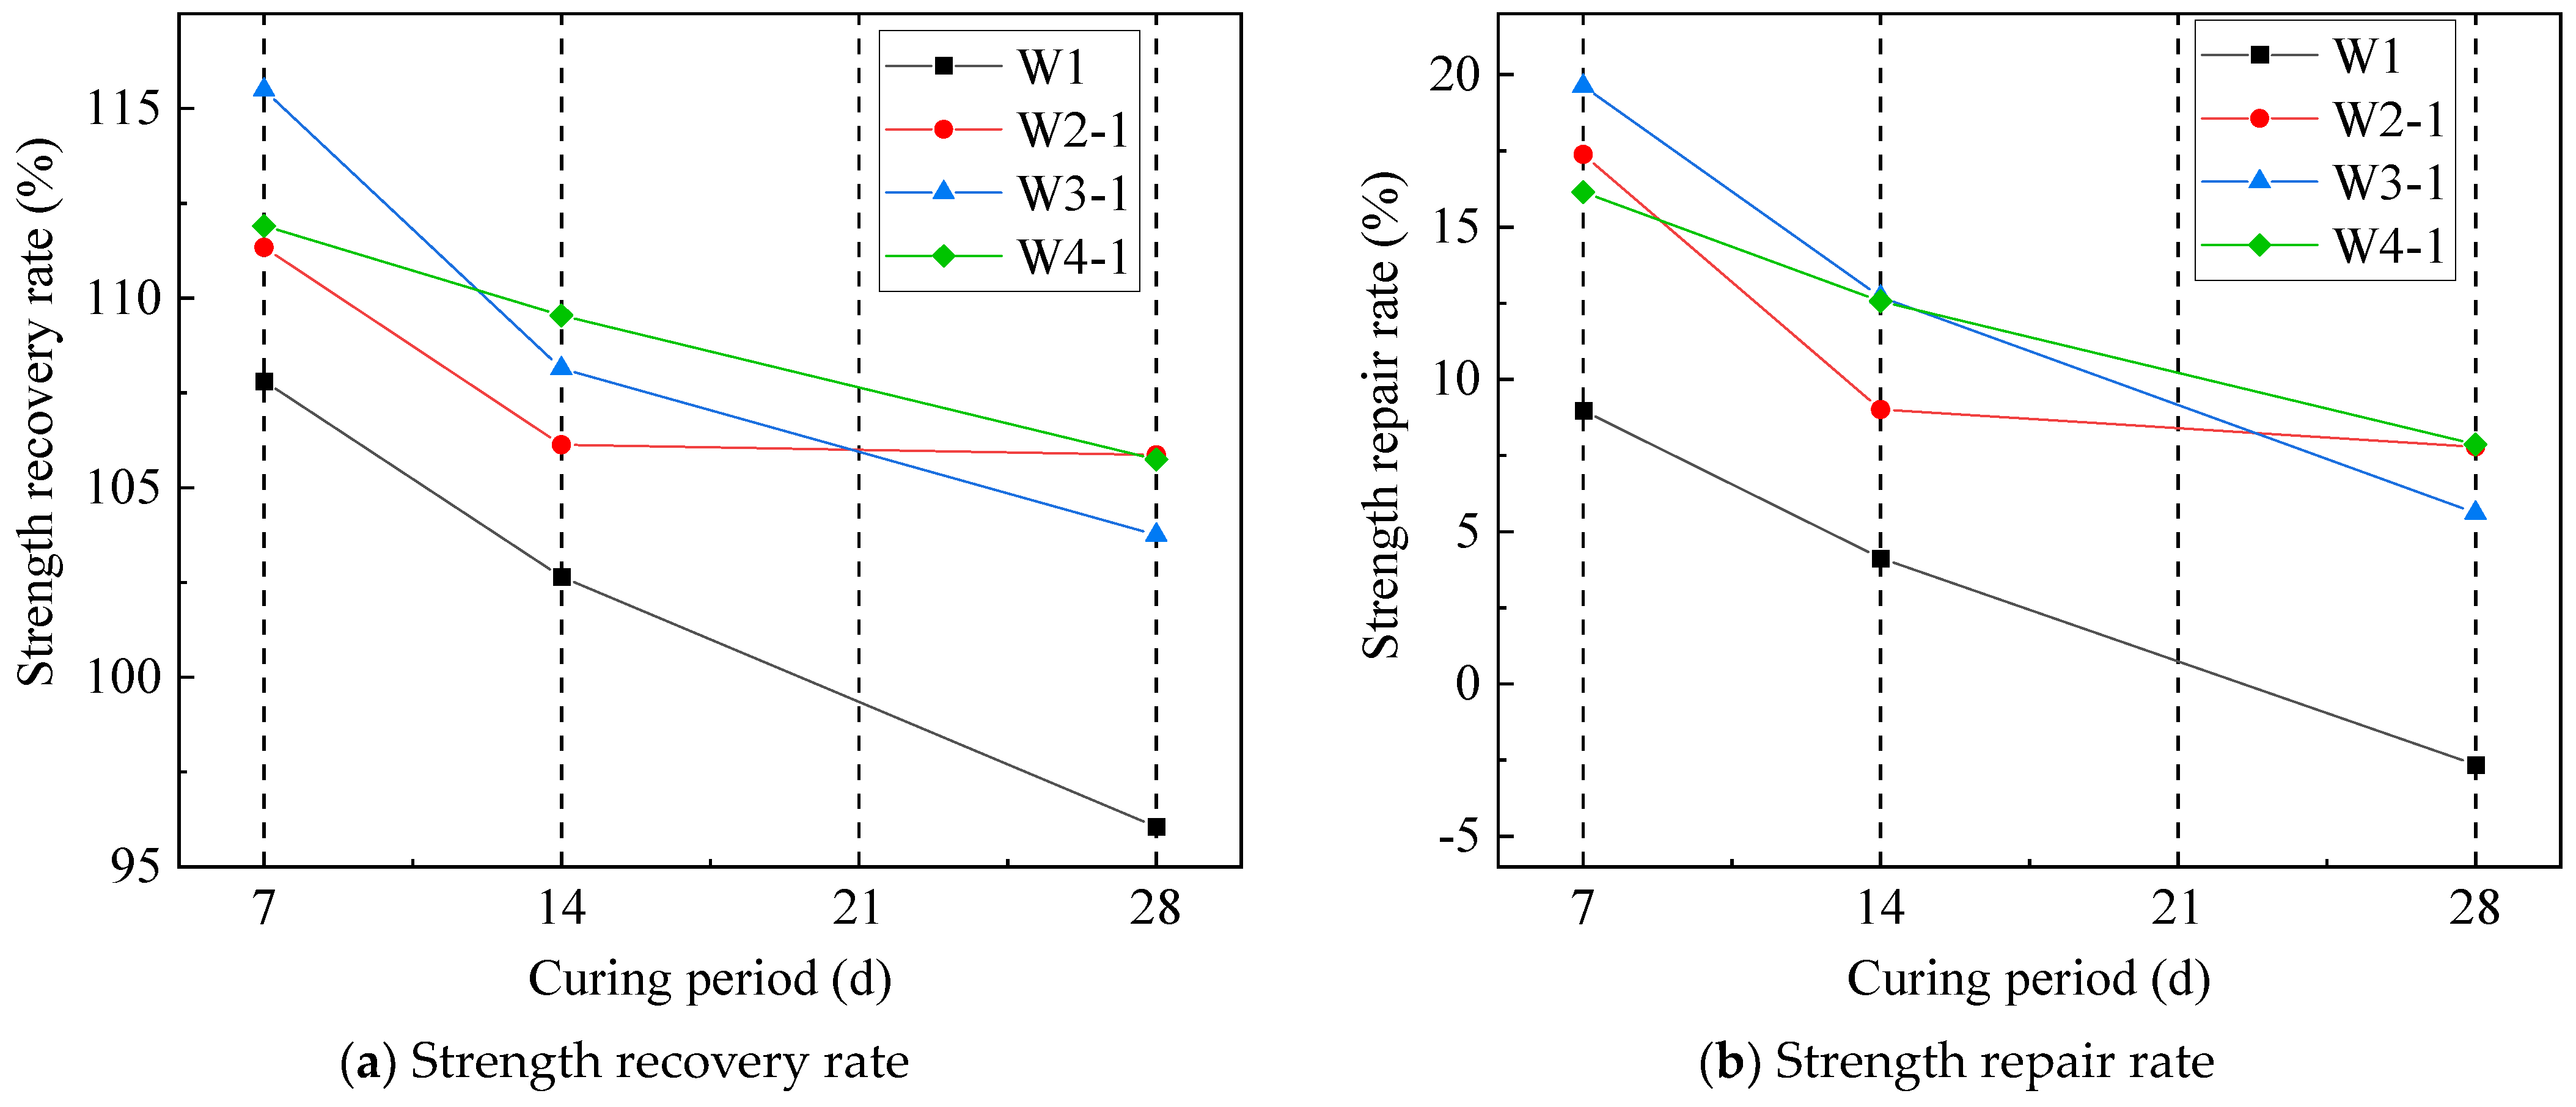
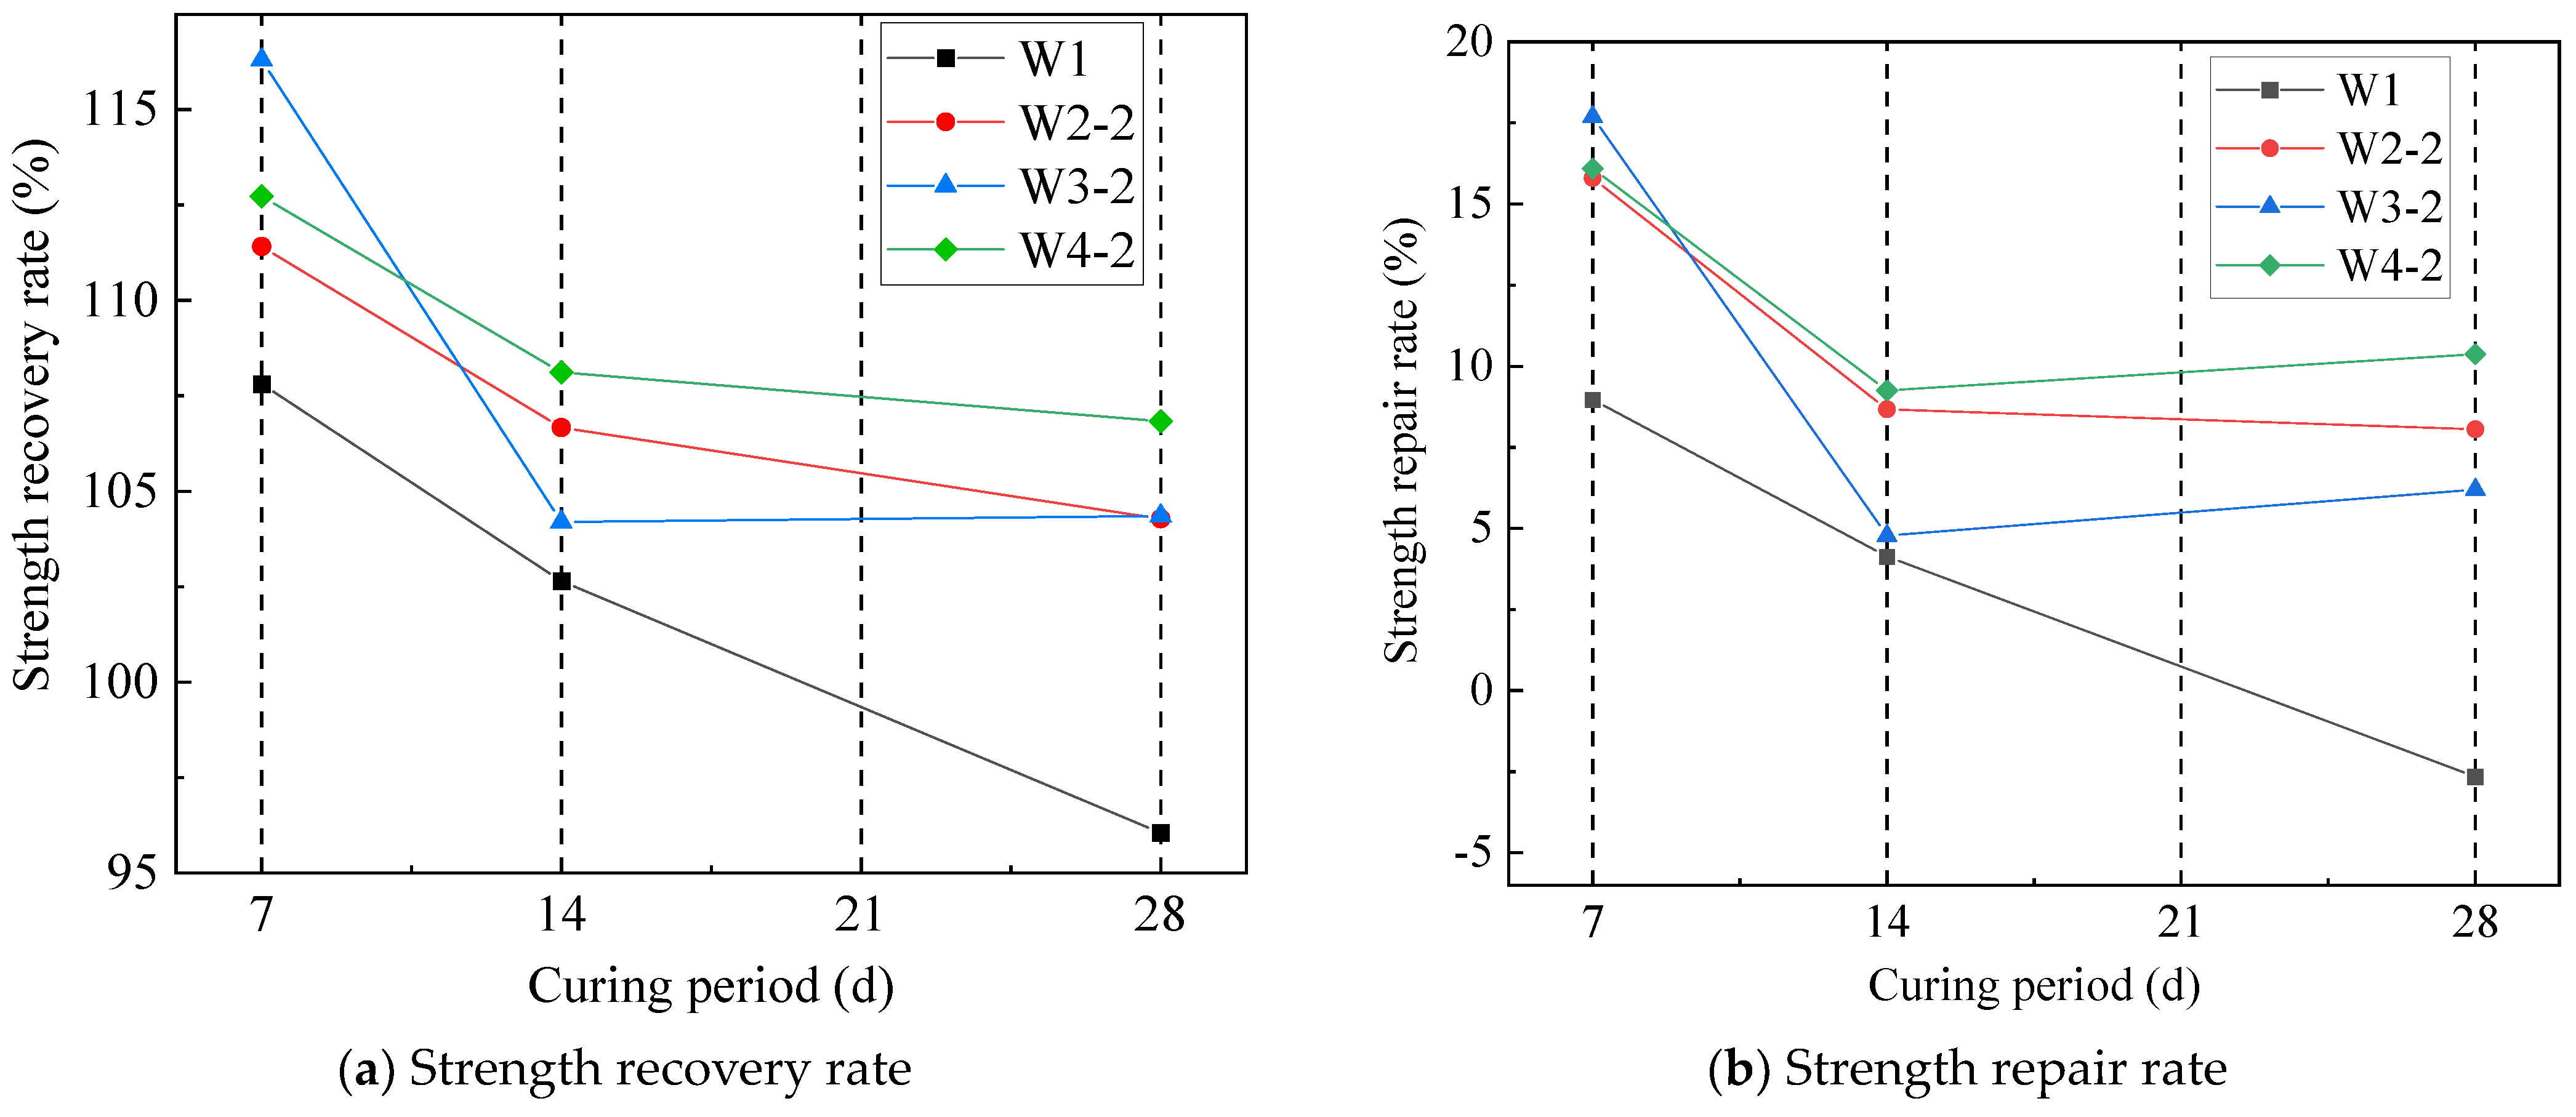
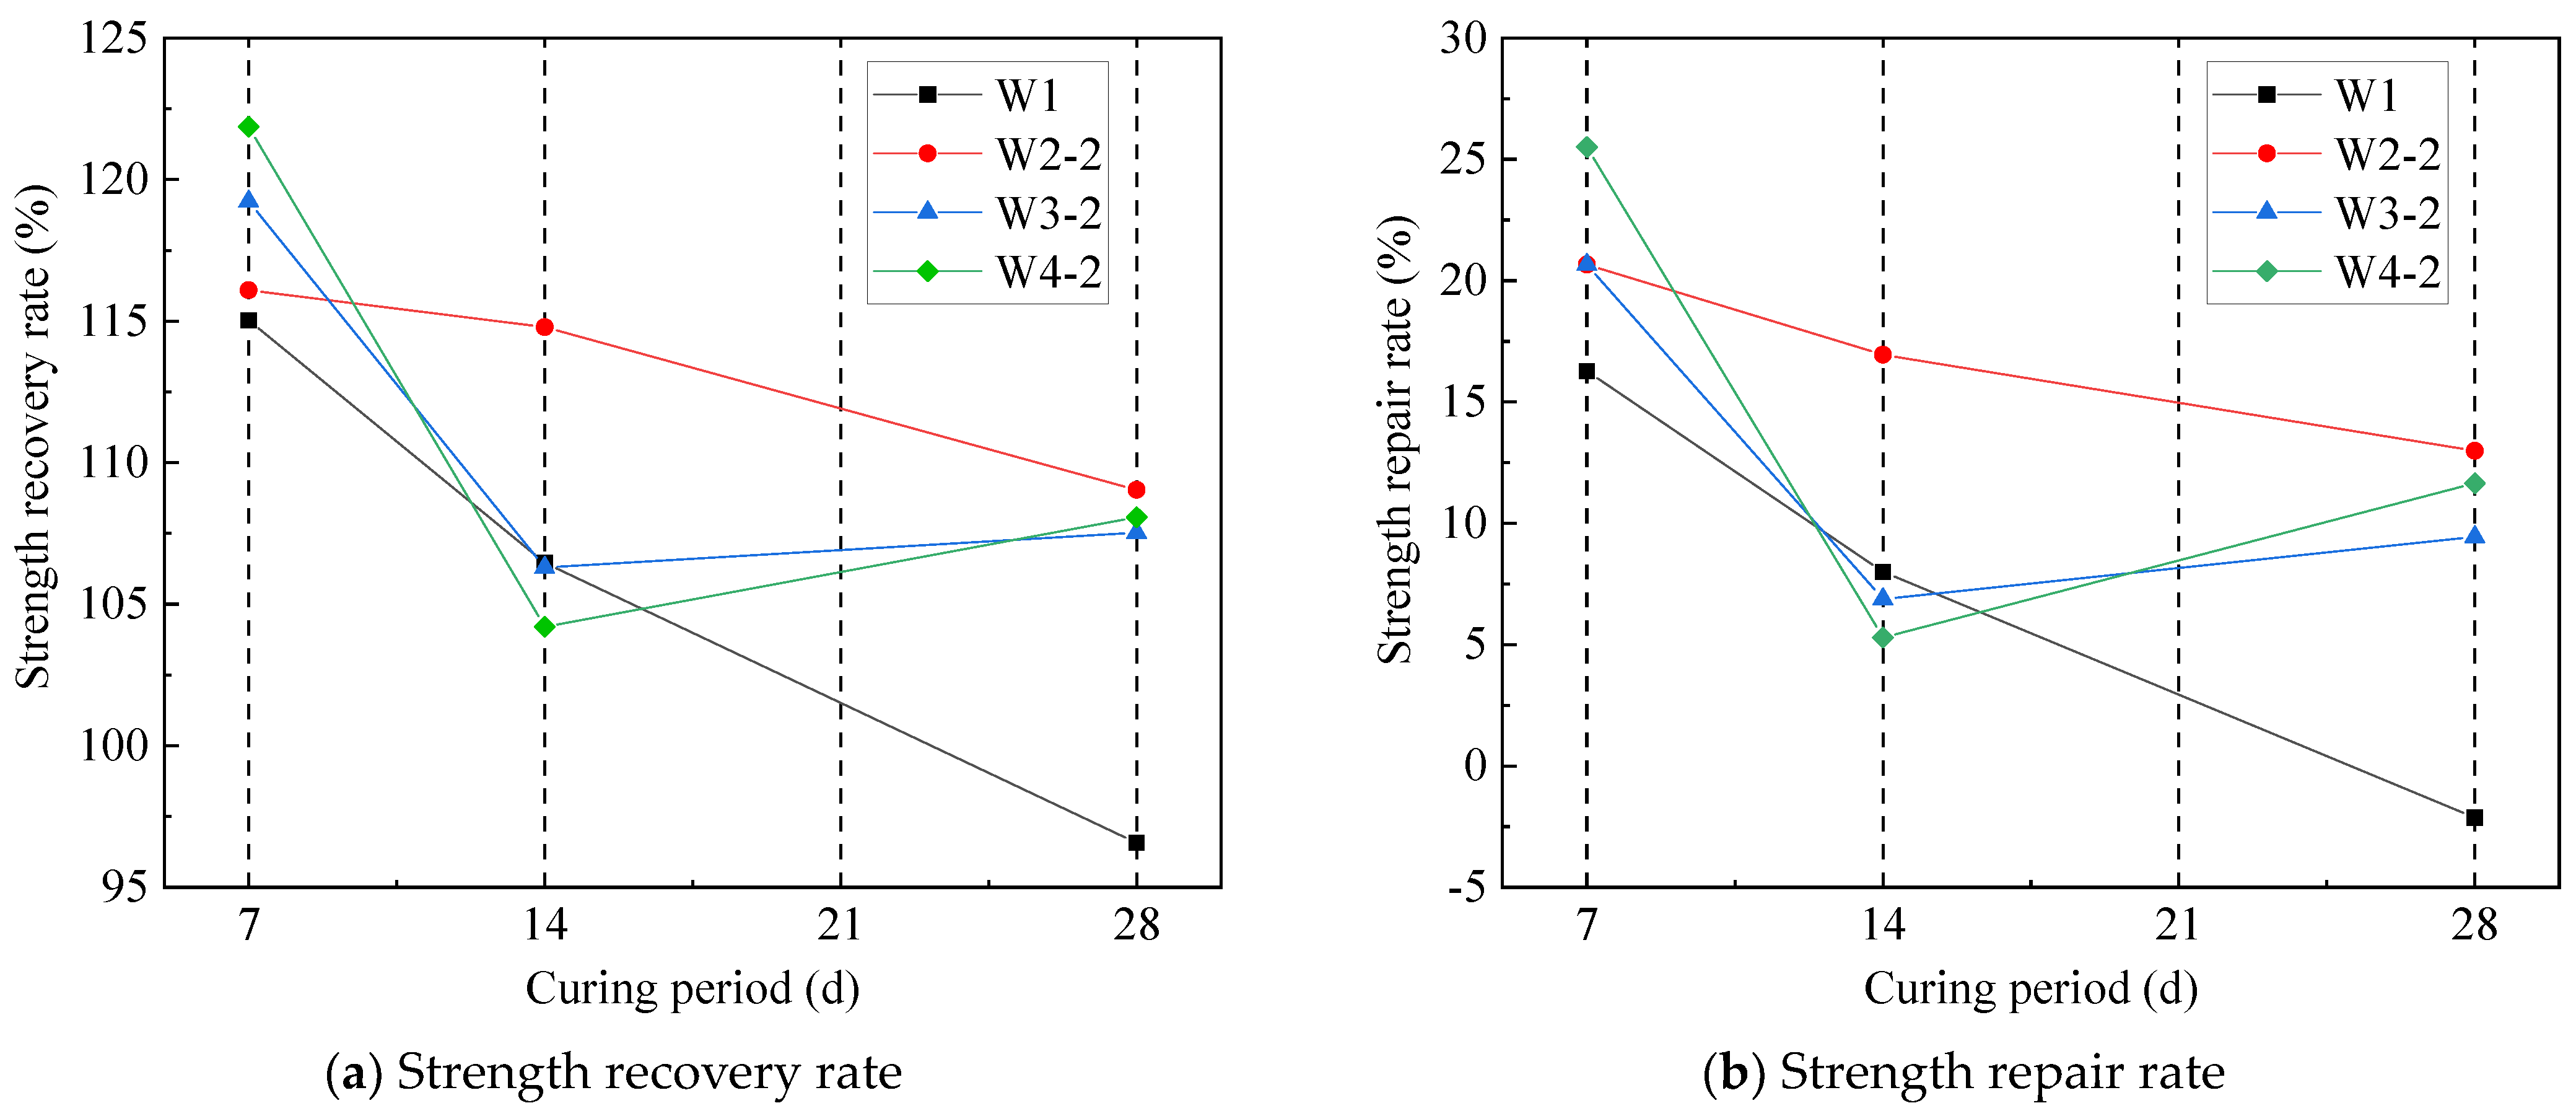
3.4.2. Test Group with Microencapsulation

Figure 29, Figure 30, Figure 31 and Figure 32 illustrate the strength repair effects of self-repair mortar specimens with microcapsules across various maintenance periods.
The microcapsules release a core repair agent upon damage, which reacts with the curing agents in the cementitious material to form a bond and restore strength. This process is confirmed by molecular mechanisms showing independent and concurrent repair actions from unhydrated cement hydration and microcapsule-based repair.
In groups W2-1, W3-1, and W4-1, using curing agent-X, the strength recovery rates after 7 and 28 days were 111.34% and 113.98%, 115.49% and 116.22%, and 111.91% and 121.63%, respectively. The rates were more stable over time compared to the non-microcapsule groups, likely due to the microcapsules compensating for the reduced number of unhydrated cement particles in the older specimens.
Groups W2-2, W3-2, and W4-2, using curing agent-Y, showed higher strength recovery rates than those using X, attributed to Y’s liquid form ensuring more uniform distribution and integration within the mortar.
The optimal microcapsule dosages varied with age and curing agent type. For agent X, the best results were at 4.0% dosage at 7 days, 6% at 14 days, and 2% at 28 days. For agent Y, 4% was optimal at 7 days, with 6% being most effective at both 14 and 28 days.

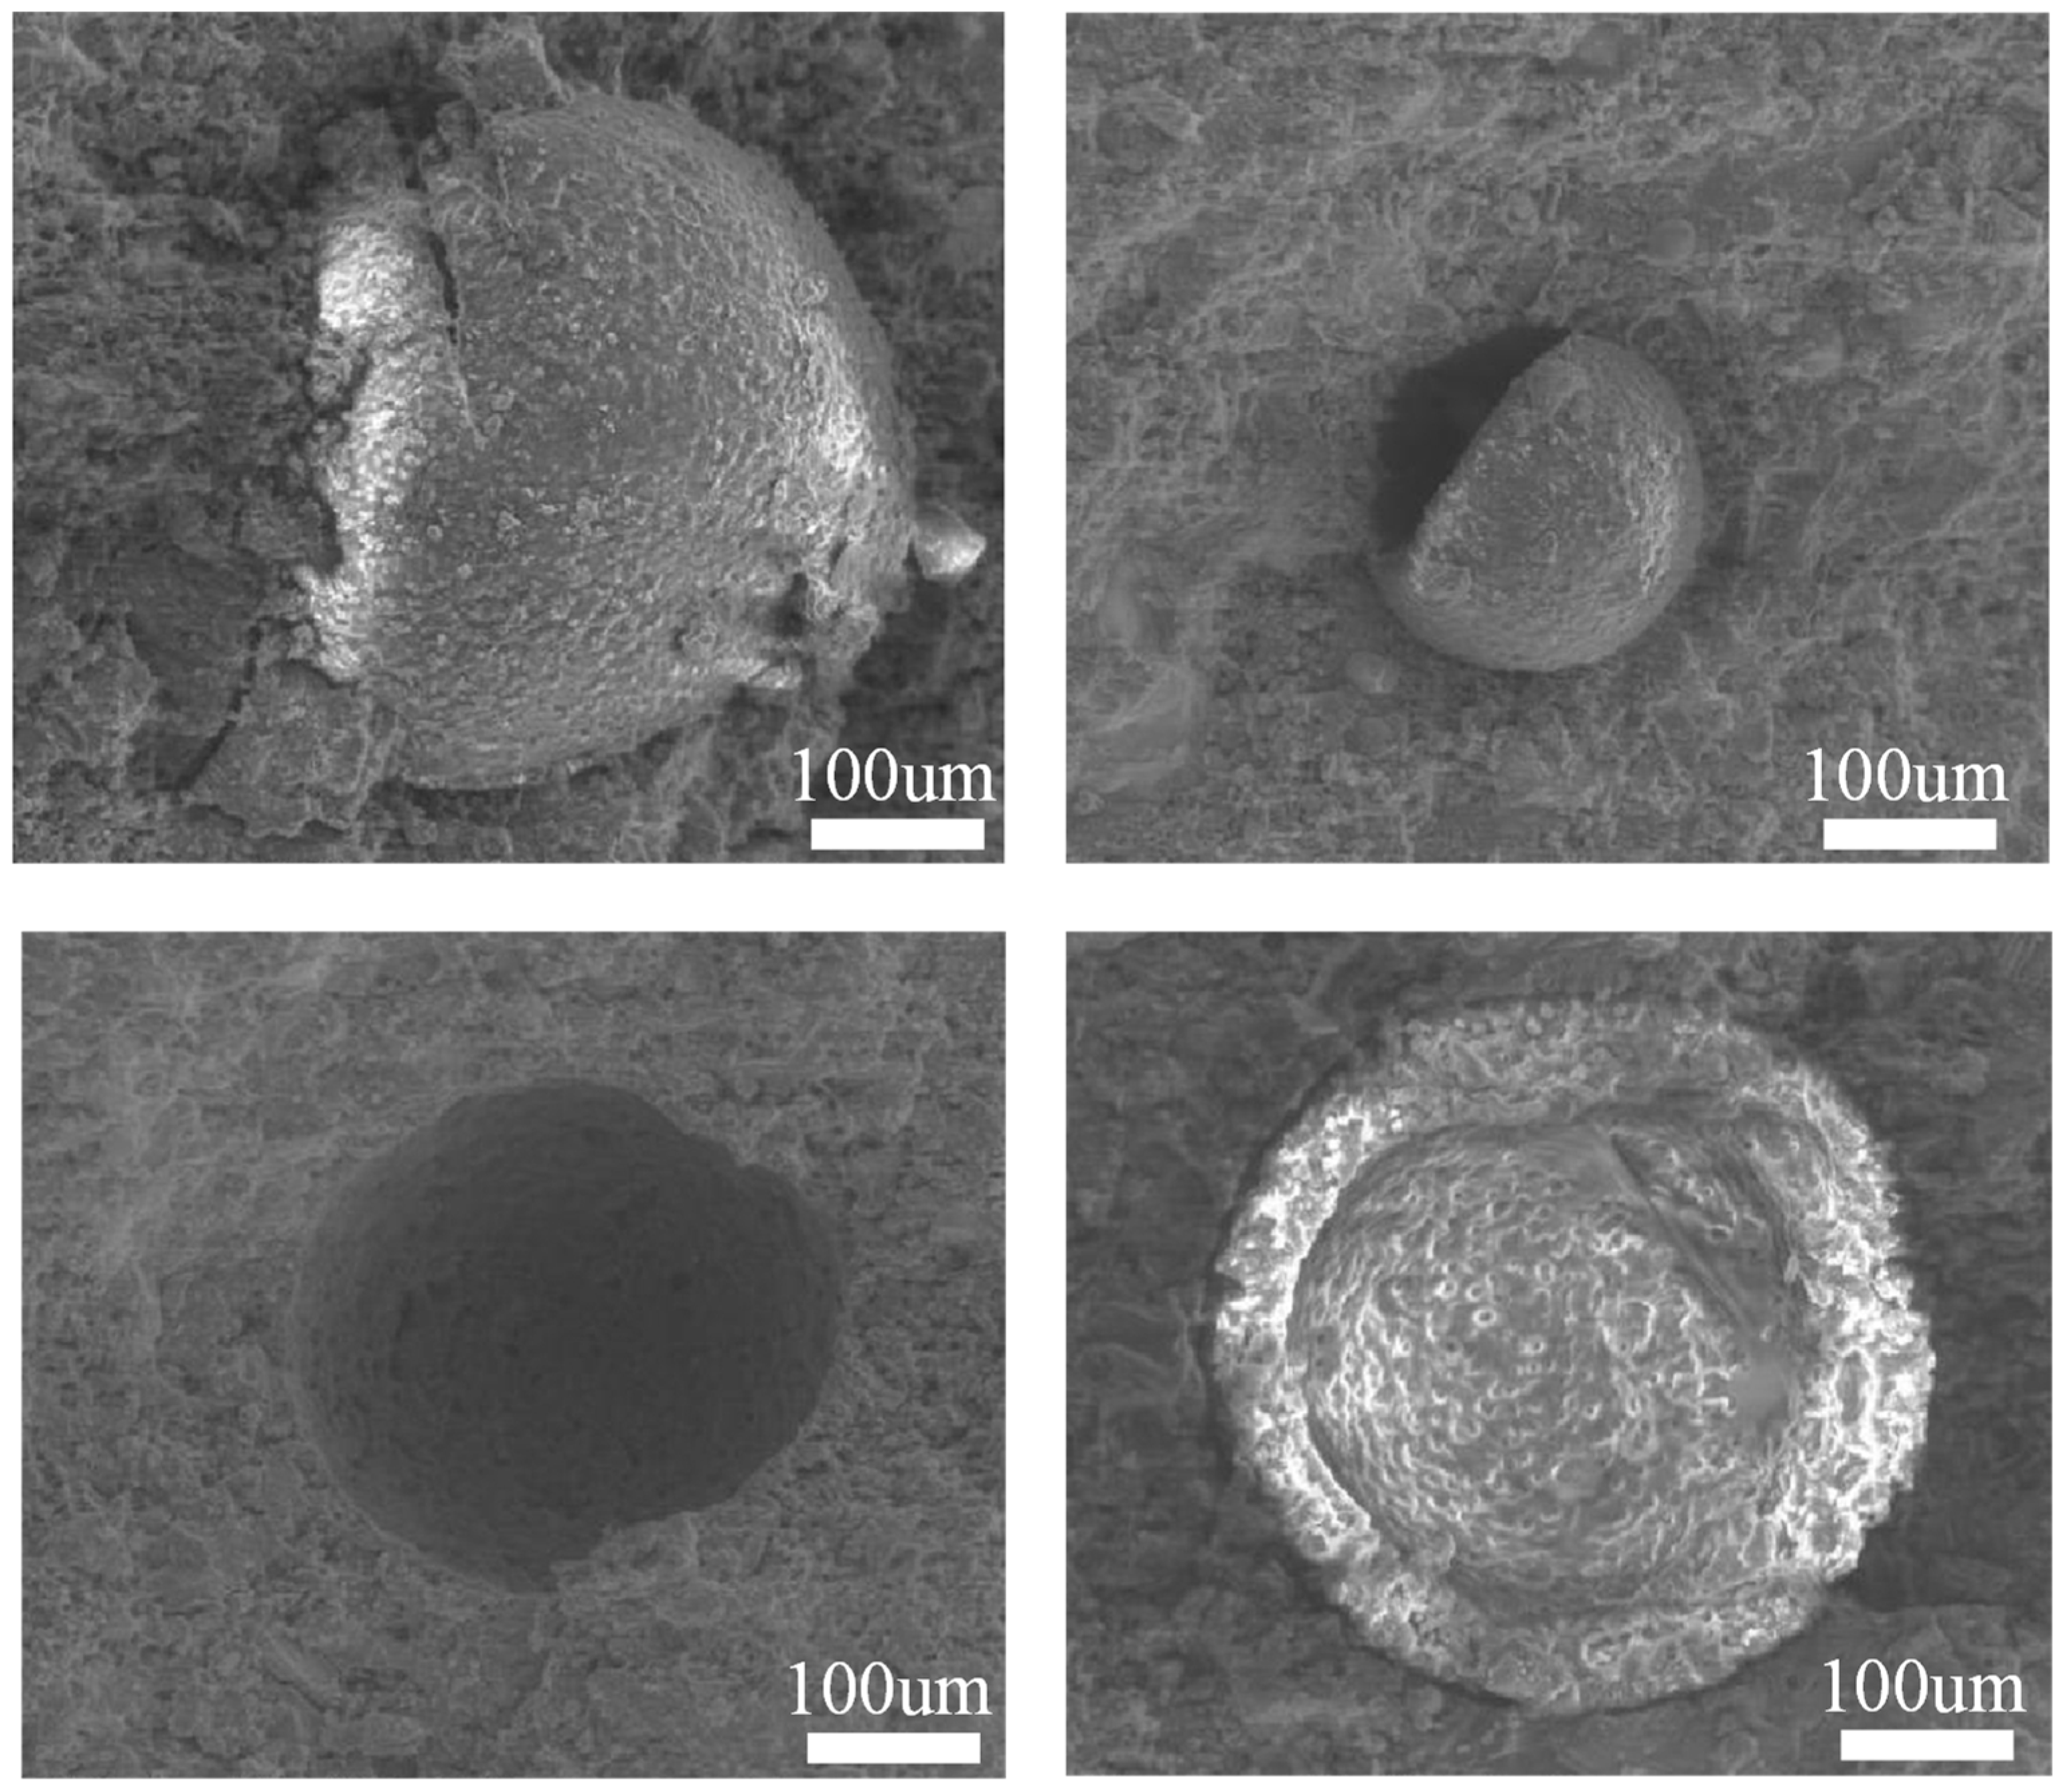
3.5. Microscopic Morphology of Cement Mortar Containing Microcapsules

The scanning electron microscopy results of cement mortar containing self-healing microcapsules are shown in Figure 33.
It can be seen in the figure that the self-repairing microcapsules are well embedded inside the structure of the cement matrix and well preserved without rupture during the mixing and molding process of the cement mortar. At the same time, the microcapsules can rupture at the right time when the cement structure is damaged, releasing the self-repairing agent stored inside for rapid repair of the damaged microcracks.

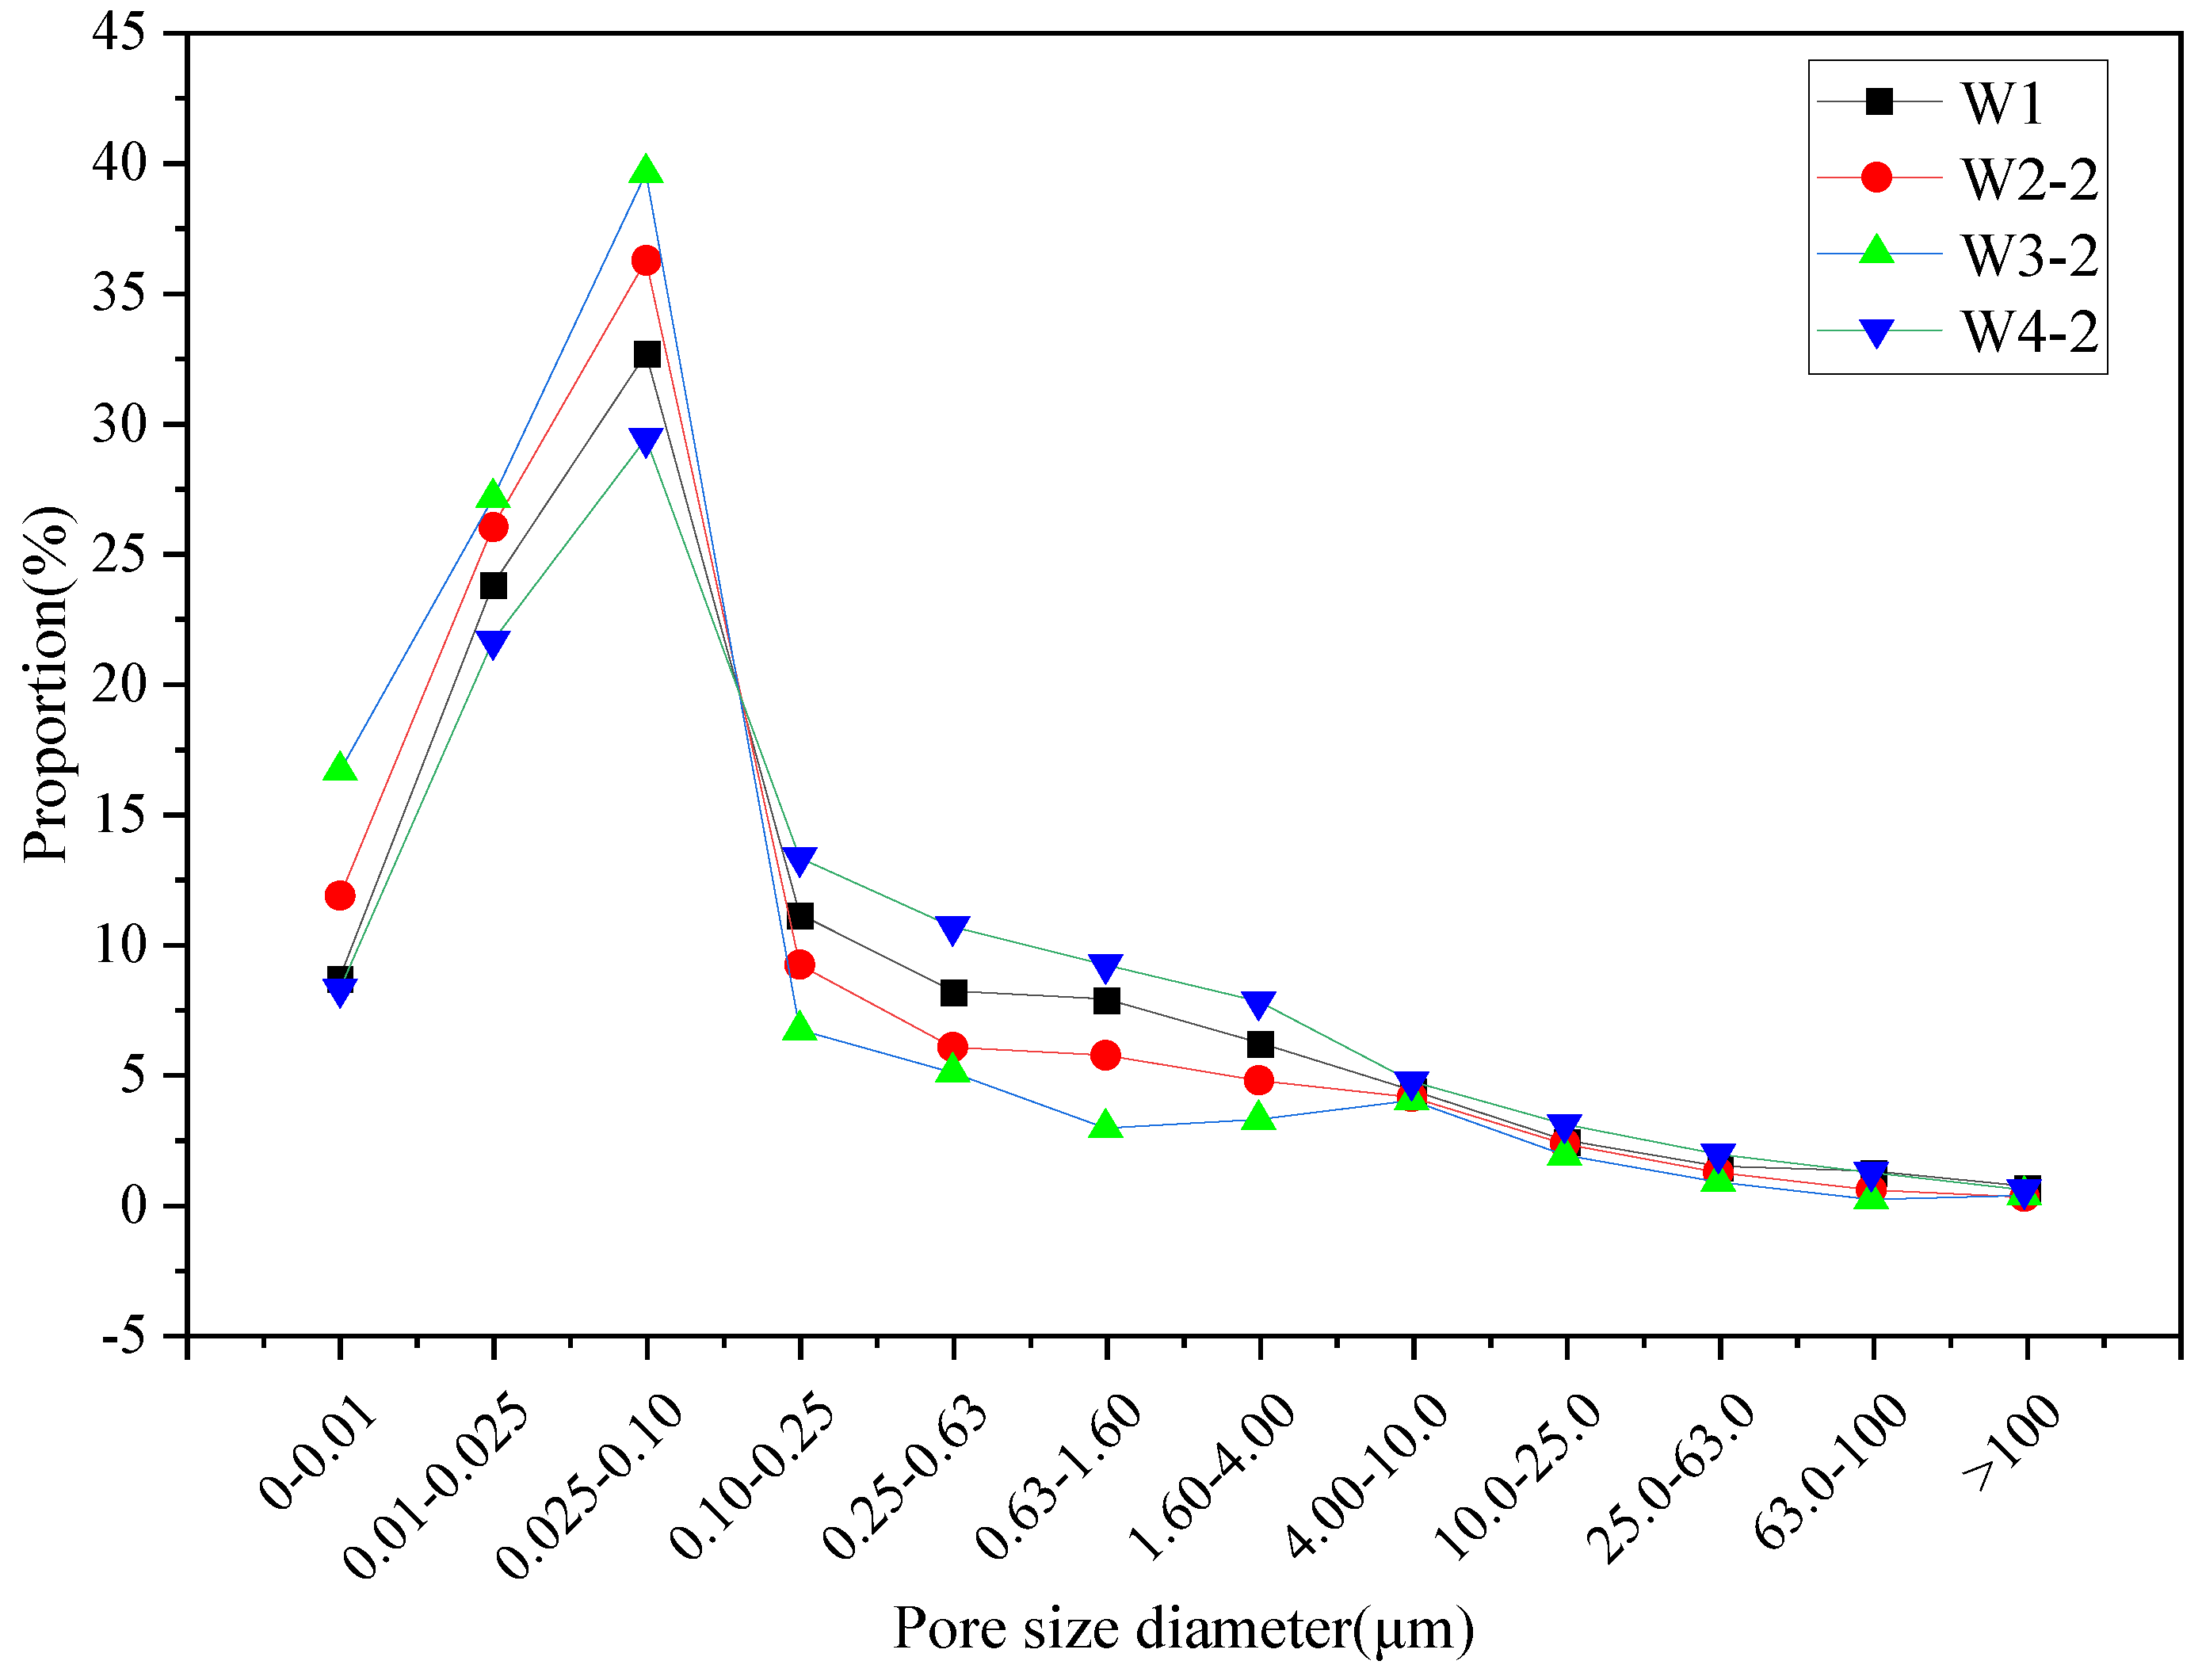
3.6. Effect of Microcapsules on the Pore Structure of Cement Mortar

The pores in concrete are categorized as harmless pores (below 20 nm), less harmful pores (20 nm~100 nm), harmful pores (100 nm~200 nm), and polyhazardous pores (above 200 nm).
Figure 34 shows the pore size distribution of cement mortar doped with different dosages of self-repairing microcapsules after 28 days of standard curing. As shown in Figure 34, the proportion of harmless or less harmful pores (pore size distribution of 0–0.1 μm) in the comparison sample (W1) after 28 days of standard maintenance was 65.17%, while the proportion of pores larger than 0.1 μm was 34.83%.
The proportion of harmless pores or less harmful pores in cement mortars (W2-2, W3-2 and W4-2) mixed with microcapsules according to the standard curing of 2%, 4% and 6% of the cement mass for 28 days was 74.11%, 83.38% and 59.3%, respectively, and the proportion of pores larger than 0.1 μm was 25.89%, 16.62% and 40.7%, respectively. As can be seen from Figure 34, compared with the comparison sample (W0), the proportion of pores larger than 0.1 μm in cement mortar (W2-2) with 2% of cement mass dosed with microcapsules decreased by 25.67%, and the proportion of pores larger than 0.1 μm in the cement mortar (W3-2) with 4% of cement mass dosed with microcapsules decreased by 52.28%. This indicates that the proportion of pores larger than 0.1 μm in the cement mortar decreases with the increase of microcapsule dosage from 0 to 4%, which implies that the densification of the cement mortar is improved. This is because the cement mortar is a kind of mixture prepared by a variety of different particle size materials; after molding, there will be a certain number of pores if the appropriate amount of microcapsules is added in the preparation process. Some of the pores inside the cement mortar can be filled so that the internal structure of the cement mortar is more dense, thus reducing the proportion of holes with a diameter greater than 0.1 μm in the cement mortar. From Figure 15, it can also be found that when the dosage of microcapsules in the cement mortar is increased from 4% to 6% (W4-2), the proportion of holes larger than 0.1 μm in the cement mortar rises by 16.85% compared to the comparison sample (W1). This indicates that when more microcapsules were added, the number of internal pores in the cement mortar was increased to a certain extent, which decreased the compactness of the cement mortar.

3.7. Effect of Microcapsules on the Impermeability of Cement Mortar

Figure 35 shows the chloride diffusion coefficients of cement mortars with different dosages of self-repairing microcapsules after 28 days of standard curing. As can be seen from Figure 35, the chloride ion diffusion coefficient of the comparison sample (W1) after 28 days of standard curing was 20.32 × 10⁻¹² m2/s, whereas the chloride ion diffusion coefficients of the cement mortars doped with 2%, 4%, and 6% of microcapsules by weight of cement (W2-2, W3-2 and W4-2) were 18.58 × 10⁻¹² m2/s, 15.95 × 10⁻¹² m2/s, and 22.18 × 10⁻¹² m2/s after 28 days of standard curing, respectively. The chloride diffusion coefficients of cement mortar (W2-2) with 2% of microcapsule doping decreased by 8.56% and that of cement mortar (W3-2) with 4% of microcapsule doping decreased by 21.51% compared with the comparison sample (W1). This is because cement mortar is a mixture of materials with different particle sizes, and a certain number of pores will exist inside the cement mortar after molding and maintenance. Adding the appropriate amount of microcapsules in the preparation process can fill some of the pores inside the cement mortar and increase the compactness of the internal structure of the cement mortar, which improves the impermeability of the cement mortar and leads to a decrease in the chloride ion diffusion coefficient of the cement mortar. However, when the doped microcapsules rose to 6% (W4-2), the chloride ion diffusion coefficient of the cement mortar increased by 9.15% compared with the comparison sample. This indicates that when excessive microcapsules are added to cement mortar, the number of internal pores of cement mortar is increased to a certain extent which decreases the densification of cement mortar, thus leading to a decrease in the impermeability of cement mortar.

4. Conclusions

(1)
Urea-formaldehyde resin/epoxy resin E-51 microcapsules were successfully synthesized via in-situ polymerization with optimal conditions identified for particle size, morphology, and encapsulation rate. The microcapsules made under the optimal conditions had a dense and smooth morphology, with an encapsulation rate of 55.59% at an average particle size of 495.56 μm.
(2)
The microcapsule wall and the cured core material exhibit strong interfacial contact with the cementitious material, enhancing ductility and providing significant strength support, whereas the uncured core material diminishes mechanical properties.
(3)
Microcapsule-enhanced cement mortar demonstrates a superior self-repair capability compared to ordinary cement mortar, although its initial strength is reduced with higher microcapsule dosages.
(4)
The repair effectiveness of microencapsulated self-healing cement mortar diminishes over time due to the ongoing hydration of cement particles and the release of the repair material from the capsule core. However, the self-healing effect remains stable over a longer period compared to ordinary cement mortar, which shows a nearly linear decline in repair capability.
(5)
The incorporation of microcapsules will have a significant effect on the flexural strength and compressive strength of the mortar. The effect on the compressive strength is greater the larger the dosage, the initial strength value of the cement mortar decreases more; the loss of strength of the cement mortar when using the Y curing agent is less than that of the use of the X curing agent, and the strength of the cement mortar with the use of the Y curing agent is more recovered.

Author Contributions

Conceptualization, D.C. and C.J.; Investigation, X.C. and M.G.; Writing—review & editing, H.M. All authors have read and agreed to the published version of the manuscript.

Funding

This research was funded by Qinghai Provincial Transportation Technology Project (Grant No. HYZD-KT-2023-01), Inner Mongolia Autonomous Region science and technology planning project (Grant No.2021GG0038), and the APC was funded by Qinghai Provincial Department of Transportation.

Data Availability Statement

The data presented in this study are available from the first and corresponding author upon request. The data are not publicly available due to the policy of the data provider.

Conflicts of Interest

The authors declare no conflicts of interest.

References

  1. Jonkers, H.M. Self Healing Concrete: A Biological Approach; Springer Series in Materials Science; Springer: Dordrecht, The Netherlands, 2007; Volume 100, pp. 195–204. [Google Scholar]
  2. Wedding, P.A.; Cady, P.D.; Weyers, R.E. Chloride Penetration and the Deterioration of Concrete Bridge Decks. Concr. Aggreg. 1983, 5, 81–87. [Google Scholar]
  3. Marsavina, L.; Audenaert, K.; De Schutter, G.; Faur, N.; Marsavina, D. Experimental and Numerical Determination of the Chloride Penetration in Cracked Concrete. Constr. Build. Mater. 2009, 23, 264–274. [Google Scholar] [CrossRef]
  4. Chahal, N.; Siddique, R.; Rajor, A. Influence of bacteria on the compressive strength, water absorption and rapid chloride permeability of fly ash concrete. Constr. Build. Mater. 2012, 28, 351–356. [Google Scholar] [CrossRef]
  5. BS EN 1504; Products and Systems for the Protection and Repair of Concrete Structures-Definitions, Requirements, Quality Control and Evaluation of Conformity Concrete Injection. BSI Standards: Hong Kong, China, 2013.
  6. ACI 562-16; Code Requirements for Assessment, Repair, and Rehabilitation of Existing Concrete Structures and Commentary (Metric). ACI: Farmington Hills, MI, USA, 2016.
  7. ACI 546R-14; Guide to Concrete Repair. ACI: Farmington Hills, MI, USA, 2014.
  8. Nishiwaki, T.; Mihashi, H.; Jang, B.-K.; Miuea, K. Development of self-healing system for concrete with selective heating around crack. J. Adv. Concr. Technol. 2006, 4, 267–275. [Google Scholar] [CrossRef]
  9. Fengbin, Y.; Juanru, J.; Xuejun, C. Preferred design methods for reinforcement of concrete structures. Constr. Technol. 2016, 45, 22–24. [Google Scholar]
  10. Lubelli, B.; Nijland, T.G.; Van Hees, R.P.J. Self-healing of lime based mortars: Microscopy observations on case studies. Heron 2011, 56, 81–97. [Google Scholar]
  11. Yuhong, Q.; Guoliang, Z.; Jinfeng, C. Research progress of anticorrosive coatings for concrete. Coat. Ind. 2018, 48, 63–71. [Google Scholar]
  12. Concrete Repairs. Performance in Service and Current Practice (EP 79); Building Research Establishment: Garston, UK, 2007. [Google Scholar]
  13. Taylor, H.F.W. Proposed Structure For Calcium Silicate Hydrate Gel. J. Am. Ceram. Soc. 1986, 69, 464–467. [Google Scholar] [CrossRef]
  14. Pacheco-Torgal, F.; Labrincha, J.A.; Leonelli, C.; Palomo, A.; Chindaprasirt, P. Handbook of Alkali-Activated Cements, Mortars and Concretes; Woodhead Publishing: Delhi, India, 2015. [Google Scholar]
  15. Bureau of Transport and Communications Economics. The Cost of Maintaining the Australian National Highway System; Australian Government Publishing Service: Canberra, Australia, 1992.
  16. ISO 679:2009-05; Cement—Test Methods—Determination of Strength. ISO: Geneva, Switzerland, 2009.
Figure 1. Relationship between building performance and its service life [8].
Buildings 14 02201 g001
Figure 2. Schematic diagram of the process of preparing UF-E microcapsules.
Buildings 14 02201 g002
Figure 3. Surface morphology of microcapsules at different pH values and core/wall mass ratios.
Buildings 14 02201 g003
Figure 4. Self-healing mortar repair performance and effect of specimens during indoor film curing.
Buildings 14 02201 g004
Figure 5. Flow of cyst wall-cement matrix model construction.
Buildings 14 02201 g005
Figure 6. Flow of the sac-core-cement matrix modelling process.
Buildings 14 02201 g006
Figure 7. Ultrasonic tester for self-repairing cement mortar specimens.
Buildings 14 02201 g007
Figure 8. Ultrasonic detector detection equipment.
Buildings 14 02201 g008
Figure 9. Self-healing mortar specimen ultrasonic testing flowchart.
Buildings 14 02201 g009
Figure 10. Radial distribution function of 7 Tobey mullite 14Å-urea-formaldehyde resin.
Buildings 14 02201 g010
Figure 11. Stress-strain behavior for 8 Tobey mullite 14Å-urea-formaldehyde resin model.
Buildings 14 02201 g011
Figure 12. Relative concentration distributions before and after molecular dynamics calculations (structural layers 1 and 3 are C-S-H layers and structural layer 2 is an epoxy resin layer): (a) Relative concentration distribution of the model before simulation, (b) Relative concentration distribution of the model after simulation.
Buildings 14 02201 g012
Figure 13. Stress-strain curves for three composite models.
Buildings 14 02201 g013
Figure 14. Radial distribution functions for three models: (a) n = 0, (b) X (c) Y.
Buildings 14 02201 g014
Figure 15. Ultrasonic wave velocity of microencapsulated self-healing cement mortar under original working conditions.
Buildings 14 02201 g015
Figure 16. Waveforms of microencapsulated self-repairing cement mortar under original working conditions (X).
Buildings 14 02201 g016
Figure 17. Waveforms of microencapsulated self-repairing cement mortar under original working conditions (Y).
Buildings 14 02201 g017
Figure 18. Comparison of ultrasonic velocities at 5 raw/damaged working conditions.
Buildings 14 02201 g018
Figure 19. Waveforms of microencapsulated self-healing cement mortar under damage conditions (curing agent-X).
Buildings 14 02201 g019
Figure 20. Waveforms of microencapsulated self-healing cement mortar under damage conditions (curing agent-Y).
Buildings 14 02201 g020
Figure 21. (a,b) Comparison of ultrasonic velocities under original/damaged/repaired working conditions.
Buildings 14 02201 g021
Figure 22. Waveforms of microencapsulated self-healing cement mortar under repair conditions (curing agent-X).
Buildings 14 02201 g022
Figure 23. Waveforms of microencapsulated self-healing cement mortar under repair conditions (curing agent-Y).
Buildings 14 02201 g023aBuildings 14 02201 g023b
Figure 24. Initial flexural strength of each test group at different ages.
Buildings 14 02201 g024
Figure 25. Initial compressive strength of each test group at different ages.
Buildings 14 02201 g025
Figure 26. X initial strength at various ages with different microcapsule dosage.
Buildings 14 02201 g026
Figure 27. Y initial strength at various ages with different microcapsule dosages.
Buildings 14 02201 g027
Figure 28. Strength recovery rate and strength repair rate of group W1 specimens after conservation repair.
Buildings 14 02201 g028
Figure 29. Strength recovery and repair rate of specimens of different ages after 7 d self−repair (X).
Buildings 14 02201 g029
Figure 30. Strength recovery and repair rate of specimens of different ages after 7 d self−repair (Y).
Buildings 14 02201 g030
Figure 31. Strength recovery and repair rate of specimens of different ages after 28 d self−repair (X).
Buildings 14 02201 g031
Figure 32. Strength recovery and repair rate (Y) of specimens of different ages after 28 d selfhealing.
Buildings 14 02201 g032
Figure 33. Scanning electron microscopy results of cement mortar containing microcapsules.
Buildings 14 02201 g033
Figure 34. Pore size distribution of cement mortars with different dosages of microencapsulated cement mortars.
Buildings 14 02201 g034
Figure 35. Chloride diffusion coefficients of cement mortars with different dosages of microencapsulated cements.
Buildings 14 02201 g035
Table 1. Basic properties of P.O42.5 grade ordinary silicate cement.
Water Consumption for Standard Consistency (%)Flexural Strength (MPa)Compressive Strength (MPa)
3 d28 d3 d28 d
28≥3.5≥6.5≥17≥42.5
Table 2. Basic indexes of P.O42.5 grade ordinary silicate cement.
Performance IndicatorsDensity (g/cm3)80 μm Sieve Residue (%)Content of CaO (%)Content of SiO2 (%)Content of Al2O3 (%)MgO in Clinker (%)Fineness (%)StabilityCondensation Time (min)
CondensationCongeal
standardised requirements------≤10.0eligible (voter etc.)≥180≤600
experimental3.150.362.421.76.62.243.5eligible (voter etc.)210250
Table 3. Technical specifications of fine aggregates.
CharacterisationApparent Density (kg/m3)Bulk Density (kg/m3)Voids (%)Moisture Content (%)Mud Content (%)
request>2500>1350<474%~6%≤2.0
measured value2614176135.54.35%0.4
Table 4. Mortar mixing ratios.
GroupsWater/gCement/gSand/gMicroencapsulation/gX/gY/g
W12254501350000
W2-1225450135094.50
W2-22254501350904.5
W3-122545013501890
W3-222545013501809
W4-122545013502713.50
W4-2225450135027013.5
Table 5. Bulk modulus, shear modulus, and elastic modulus of T14Å-urea-formaldehyde ester models.
ModellingBulk Modulus (GPa)Shear Modulus (GPa)Modulus of Elasticity (GPa)
xyz
T14Å-urea formaldehyde ester26.83329.012224.683437.533620.878
Disclaimer/Publisher’s Note: The statements, opinions and data contained in all publications are solely those of the individual author(s) and contributor(s) and not of MDPI and/or the editor(s). MDPI and/or the editor(s) disclaim responsibility for any injury to people or property resulting from any ideas, methods, instructions or products referred to in the content.

