Article

Study on Catastrophic Evolution Law of Water and Mud Inrush in Water-Rich Fault Fracture Zone of Deep Buried Tunnel

1
Faculty of Public Safety and Emergency Management, Kunming University of Science and Technology, Kunming 650093, China
2
Yunnan Construction Investment No. 6 Construction Co., Ltd., Yuxi 653199, China
3
Third Engineering Company of Yunnan Jiaotong Highway Construction Co., Ltd., Kunming 650103, China
4
Key Laboratory of Rock Mechanics and Geohazards of Zhejiang Province, Shaoxing University, Shaoxing 312099, China
*
Author to whom correspondence should be addressed.
Buildings 2024, 14(7), 2220; https://doi.org/10.3390/buildings14072220
Submission received: 14 May 2024 / Revised: 12 July 2024 / Accepted: 14 July 2024 / Published: 19 July 2024

Abstract

:
To study the evolution law of water and mud inrush disasters in the fractured zones of water-rich faults in deep buried tunnels, a self-developed 3D physical model test system was used to conduct experimental research about the evolution process. Additionally, MIDAS GTS NX 2022 version was used to analyze the evolution laws of displacement, stress, pore water pressure, and seepage flow velocity during the excavation process. The findings indicate that in the model testing, tunnel excavation caused different changes in the stress magnitude of the surrounding rock at different positions. The pore water pressure increases correspondingly with the loading water pressure at the same location. The function relationship between the relative water pressure coefficient of any point in the outburst-prevention rock mass, and the vertical distance from that point to the upper boundary of the fault, was obtained through nonlinear fitting. In numerical simulation, excavation affects the vertical displacement of the arch vault more than the arch ring, while it has a greater impact on the horizontal displacement of the arch ring compared to the arch vault. The maximum and minimum principal stresses show significant changes; the pore water pressure at each monitoring point decreases with the increase in excavation distance. The flow velocity of seepage shows a trend of first increasing and then decreasing. The research results can provide relevant references for the prevention of water and mud inrush disasters in fault areas.

1. Introduction

With the rapid development of transportation infrastructure in China, a large number of tunnel projects are constructed in mountainous and karst areas with extremely complex geology in southwestern China. Due to the complex engineering geological and hydrogeological conditions in the southwest mountainous area, the disaster situation faced by the tunnel in the construction process is very serious. When the tunnel construction passes through the fault fracture zone, karst, and other unfavorable geological areas, water and mud inrush disasters can be easily induced. They have the characteristics of suddenness, hugeness, many casualties, and large economic losses, and also cause environmental damage and other problems [1,2,3,4]. Therefore, the effective control of water and mud inrush disasters has become a significant issue in the area of underground engineering disaster prevention and mitigation.
The occurrence mechanism and control of water and mud inrush disasters have always been key scientific and technological issues restricting the construction and development of tunnels and underground engineering [5,6,7]. For example, the catastrophic accident of Shanghai Metro Line 4 in 2003 was a typical subway mud and water inrush accident [8,9]. Therefore, many scholars have carried out many studies on the disaster evolution law, mechanism, and control of water and mud inrush disasters in tunnels by different research methods and achieved many results. In terms of theoretical analysis, Ma et al. [10] studied the hydraulic development of tunnel water inrush in sandstone faults. The results show that particle migration has an important influence on the increase in permeability. Zhang et al. [11] derived a semi-analytical expression for the minimum safe thickness of rock against water inrush, and applied the calculation method of safe thickness to actual engineering. Based on the “triangular” geological mathematical model for water inrush, Li et al. [12] investigated the process of water inrush in coal seam strong water causing the collapse of columns. Tang et al. [13] studied the disaster mechanism and treatment technology of water inrush and mud inrush of tunnels in a water-rich fault zone, and summarized the drainage mechanism at different stages through monitoring data. In terms of experiments, Liu et al. [14] developed a large-scale experimental system with the fault fracture zone as the research object, and simulated the variation of some characteristic parameters during the excavation of rock surrounding the tunnel. Huang et al. [15,16] and Wang et al. [17] developed new fluid–solid coupling of similar materials based on different experimental theories and principles, which can truly reflect the response laws of various physical fields in the process of water and mud inrush disasters in fault tunnels. Guo et al. [18] developed a 3D visualization physical simulation test system for fluid–solid coupling of deep and long tunnels, and studied the disaster evolution mechanism of water and mud inrush in deep and long tunnels, and achieved good results.
In terms of monitoring and early warning, Hu et al. [19] proposed an improved Kriging filtering algorithm that improves the measurement accuracy of 3D laser scanning in tunnels by optimizing the point cloud gridding method, providing reliable safety warnings for tunnel construction. Liu et al. [20] designed a bandpass filter and RTM algorithm to effectively remove clutter from GPR data, and accurately reconstructed the geometric shape and position of the cavity behind the shield tunnel lining. Yin et al. [21] proposed a new model that combines LSTM and IForest to predict abnormal changes in drilling water levels in mining areas, successfully achieving efficient early warning of water inrush risks. Hu et al. [22] proposed a new model that combines IPSO and a BP algorithm to predict surface settlement caused by the construction of rectangular top tube tunnels, providing an effective reference for engineering settlement prediction. Zhang et al. [23,24] discussed the application of distributed fiber optic sensors (DFOSs) in deformation monitoring of tunnel infrastructure, demonstrating the outstanding potential of DFOSs in monitoring underground infrastructure. In terms of numerical simulation, Golian et al. [25] introduced a MODFLOW code in GMS software that can simulate the change in water inrush inflow rate of a tunnel during tunneling, and compared the predicted rate with the actual observation rate. The results were in good agreement. Moon and Fernandez [26] used UDEC 3.0 to establish a tunnel excavation model to analyze the influence of the groundwater table decline caused by tunnel excavation on the groundwater inflow rate and pore water pressure around the tunnel. Bahrami et al. [27] used DEM and FEM, respectively, to simulate and analyze the failure process of tunnel water and mud inrush. He et al. [28] used the Burger-creep visco-plastic (CVISC) model to study the impact of pipe jacking construction on the existing tunnel of Ningbo Metro Line 3, providing a reference for tunnel protection in adjacent construction in soft soil areas. Cai et al. [29], Annan Jiang et al. [30] established different coupling calculation models and conducted numerical simulation analysis on the evolution law and occurrence process of water and mud inrush in tunnels, respectively. Sweetenham et al. [31], Farhadian et al. [32], Zhang et al. [33], Zhao et al. [34], Wang et al. [35], and Ma et al. [36] used different models and algorithms to study the influencing factors of water and mud inrush in tunnels, the law and mechanism of disaster evolution, and the prevention and control of disasters based on actual projects.
Although there are many studies on water and mud inrush at present, the research on the evolution law of water and mud inrush disasters caused by fault fracture zone is not deep enough. The research on water and mud inrush mainly focuses on the disaster response, and research is lacking on the laws and mechanisms of disaster evolution through the combination of multiple methods. The paper investigates the mechanisms of water and mud inrush in fault fracture zones, using the Dazhu Mountain Tunnel of the Darui Railway in Yunnan as a case study. Through model testing and numerical simulation, the evolution mechanism of a water and mud inrush disaster in different fault structures is studied in detail. It is expected to provide a reference for the prediction and prevention of water and mud inrush disasters in the tunnel fault fracture zone.

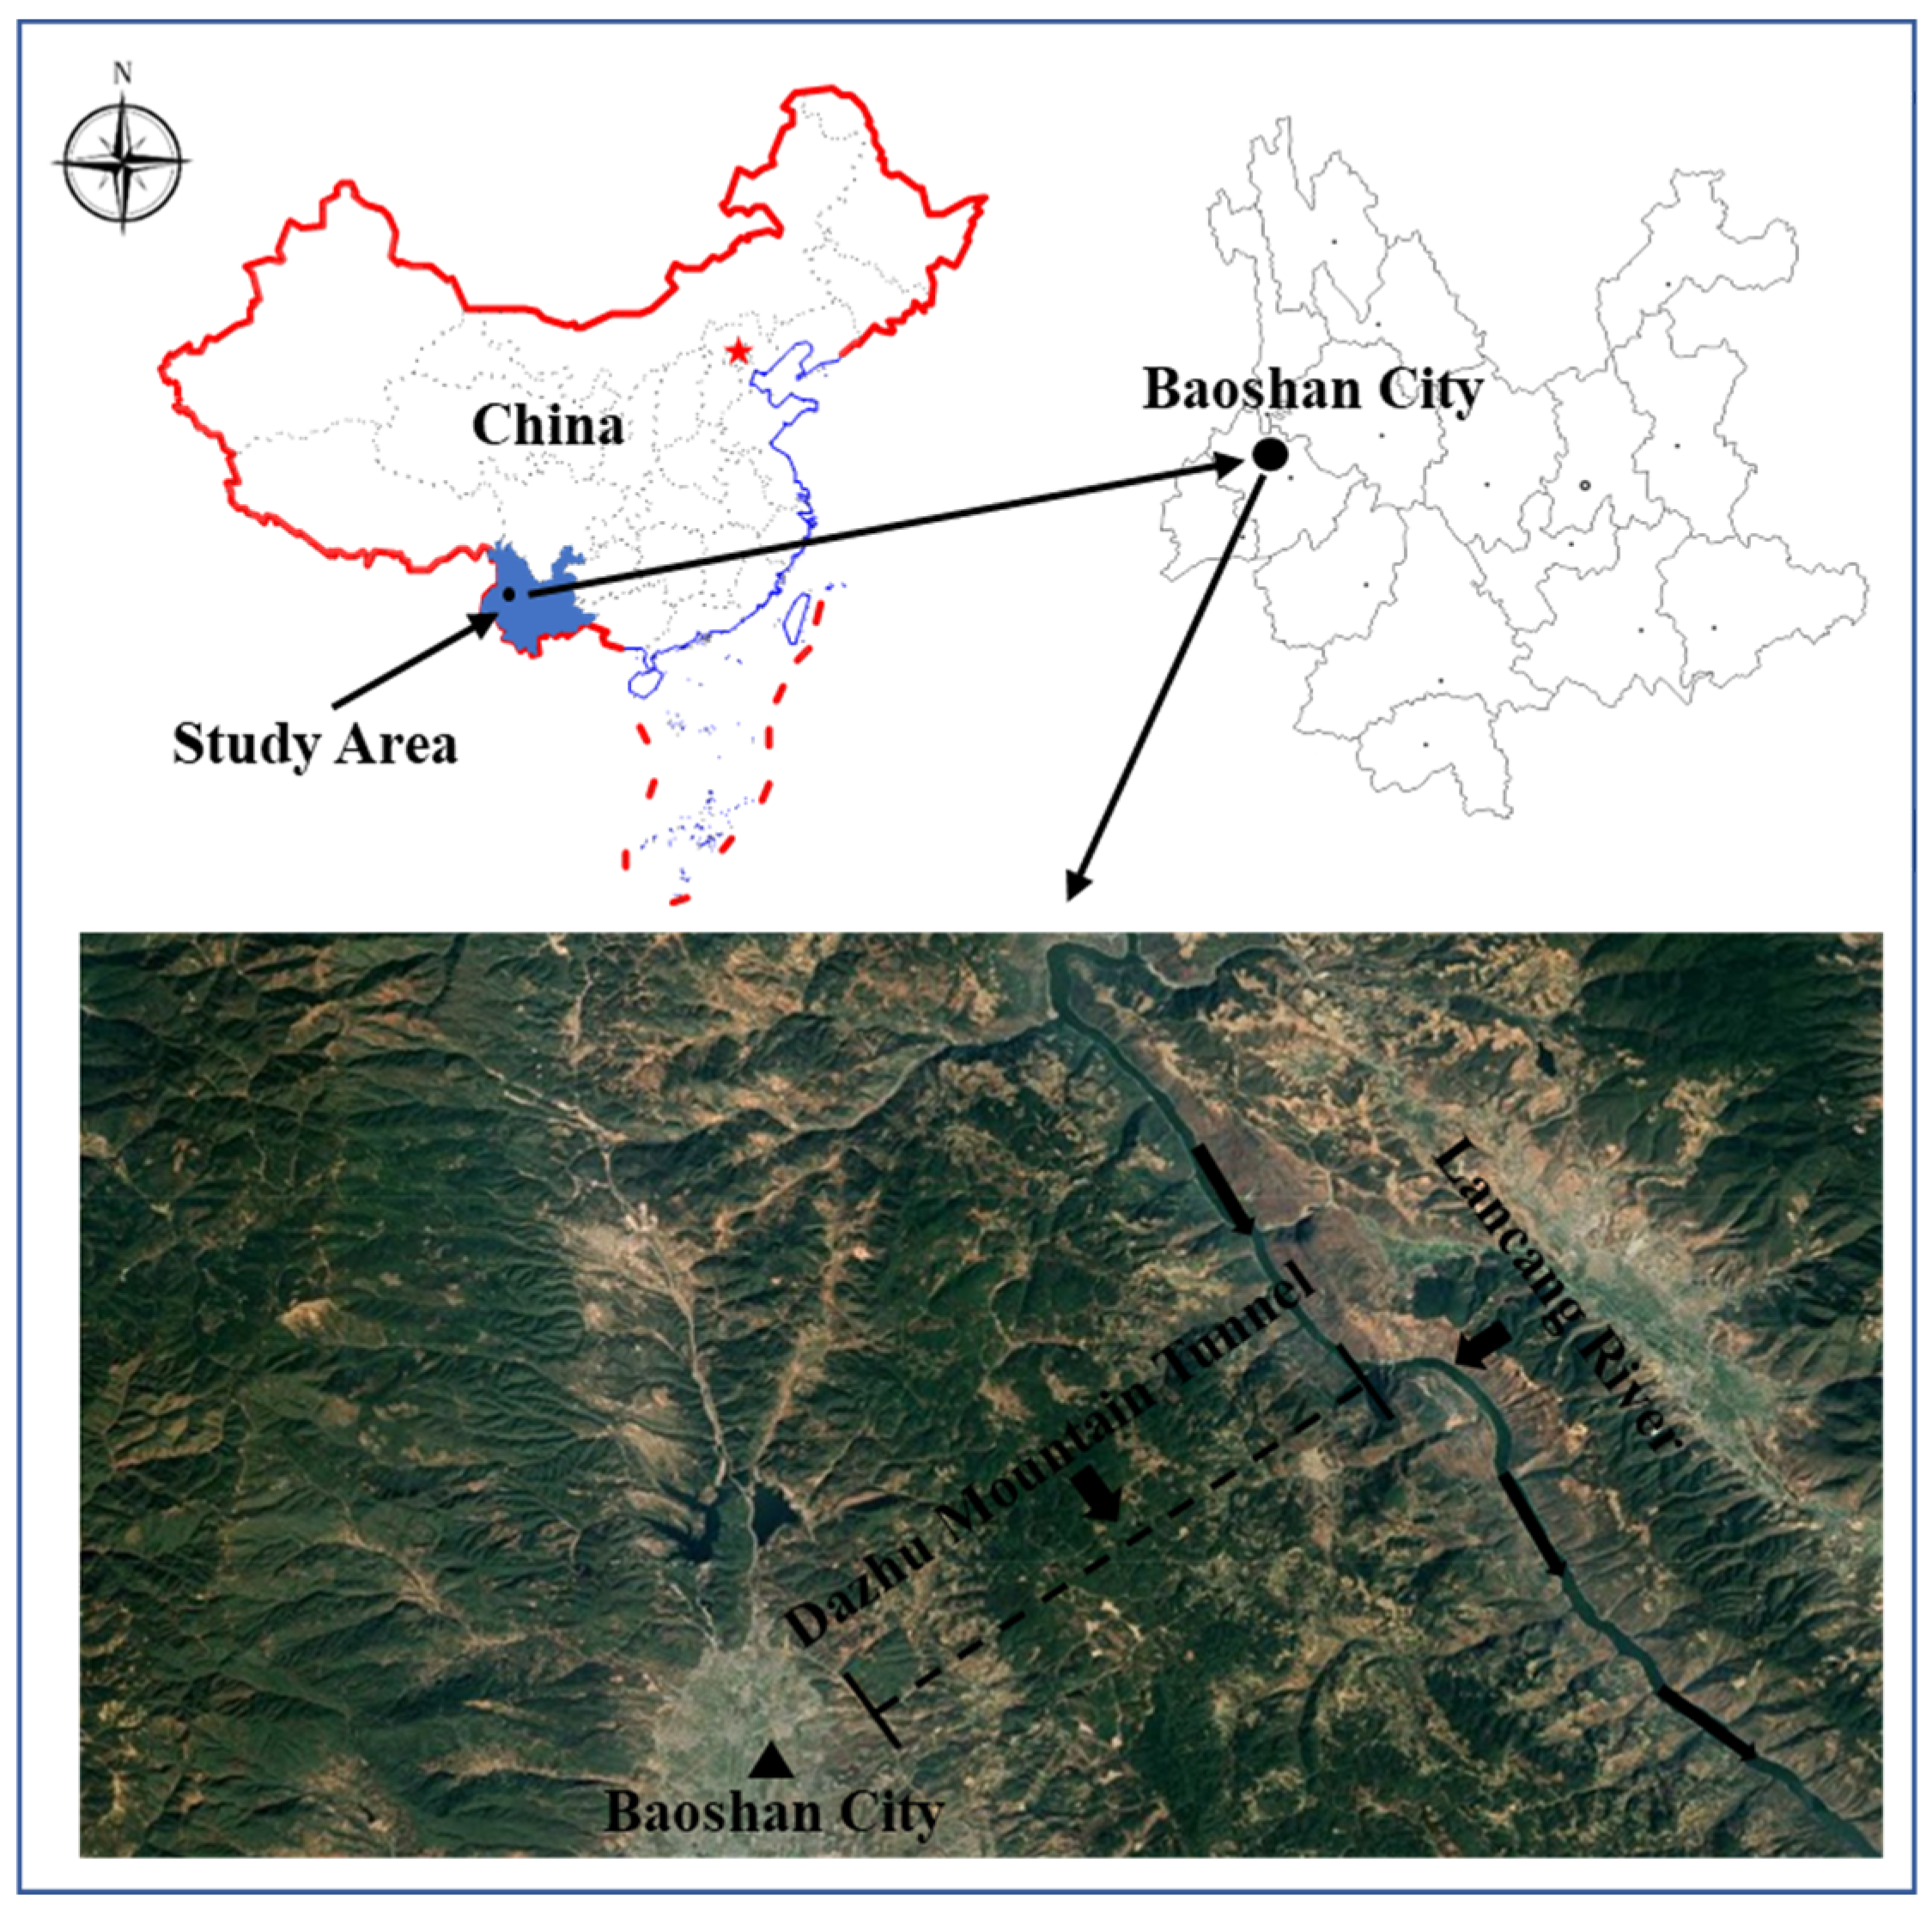
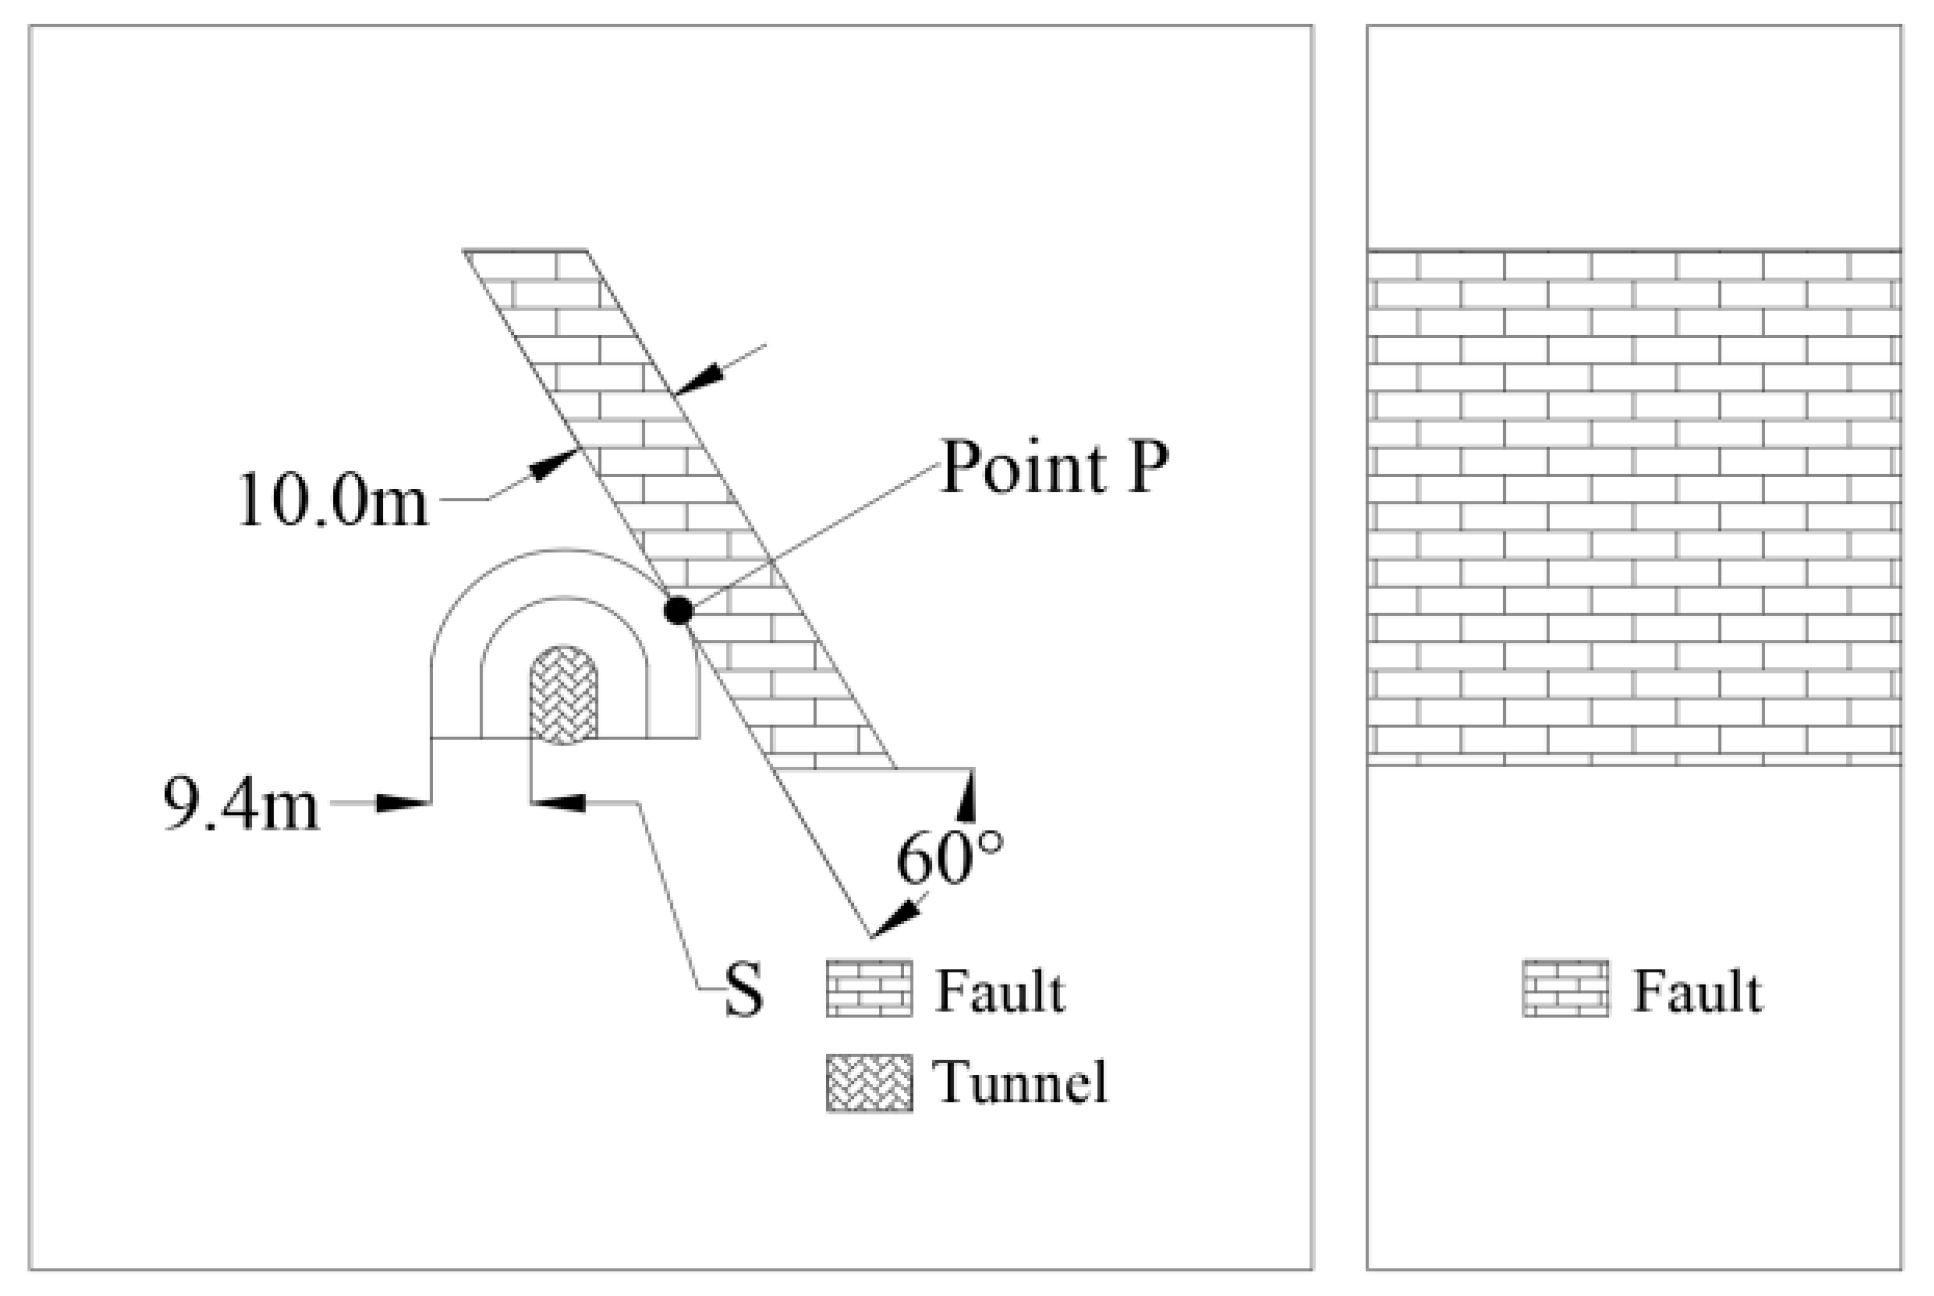
2. Tunnel Engineering Geology

The Dazhushan Tunnel is situated in Baoshan City, Yunnan Province, China, which is the highest-risk tunnel along the entire Darui Railway. The tunnel passes through the famous southern Hengduan Mountains, in which the length of the single main tunnel is 13,803 m and the total length is 14,484 m. The maximum buried depth of the tunnel is 995 m and the length of the large-span region is 680 m. The geological environment in the tunnel area is complex, and the strata it passes through are a typical representative of the complex geology in the western Yunnan region. Among them, the tunnel passes through six faults, such as Wulishao, Yanziwo, and Shuizhai, five karst development areas, and three fold structures, and has a designed maximum daily water inflow of 120,000 m3. There are geological risks, such as water inrush, rock burst, karst, radioactivity, geothermal, gas, and high ground heat risks, in local areas. The geometric dimensions of the excavation section of the Dazhu Mountain Tunnel are 6.16 m wide and 9.41 m high. Figure 1 illustrates the geographical position and surface topography of the Dazhu Mountain Tunnel.

3. Study of Physical Model Test on Water and Mud Inrush in Parallel Fault

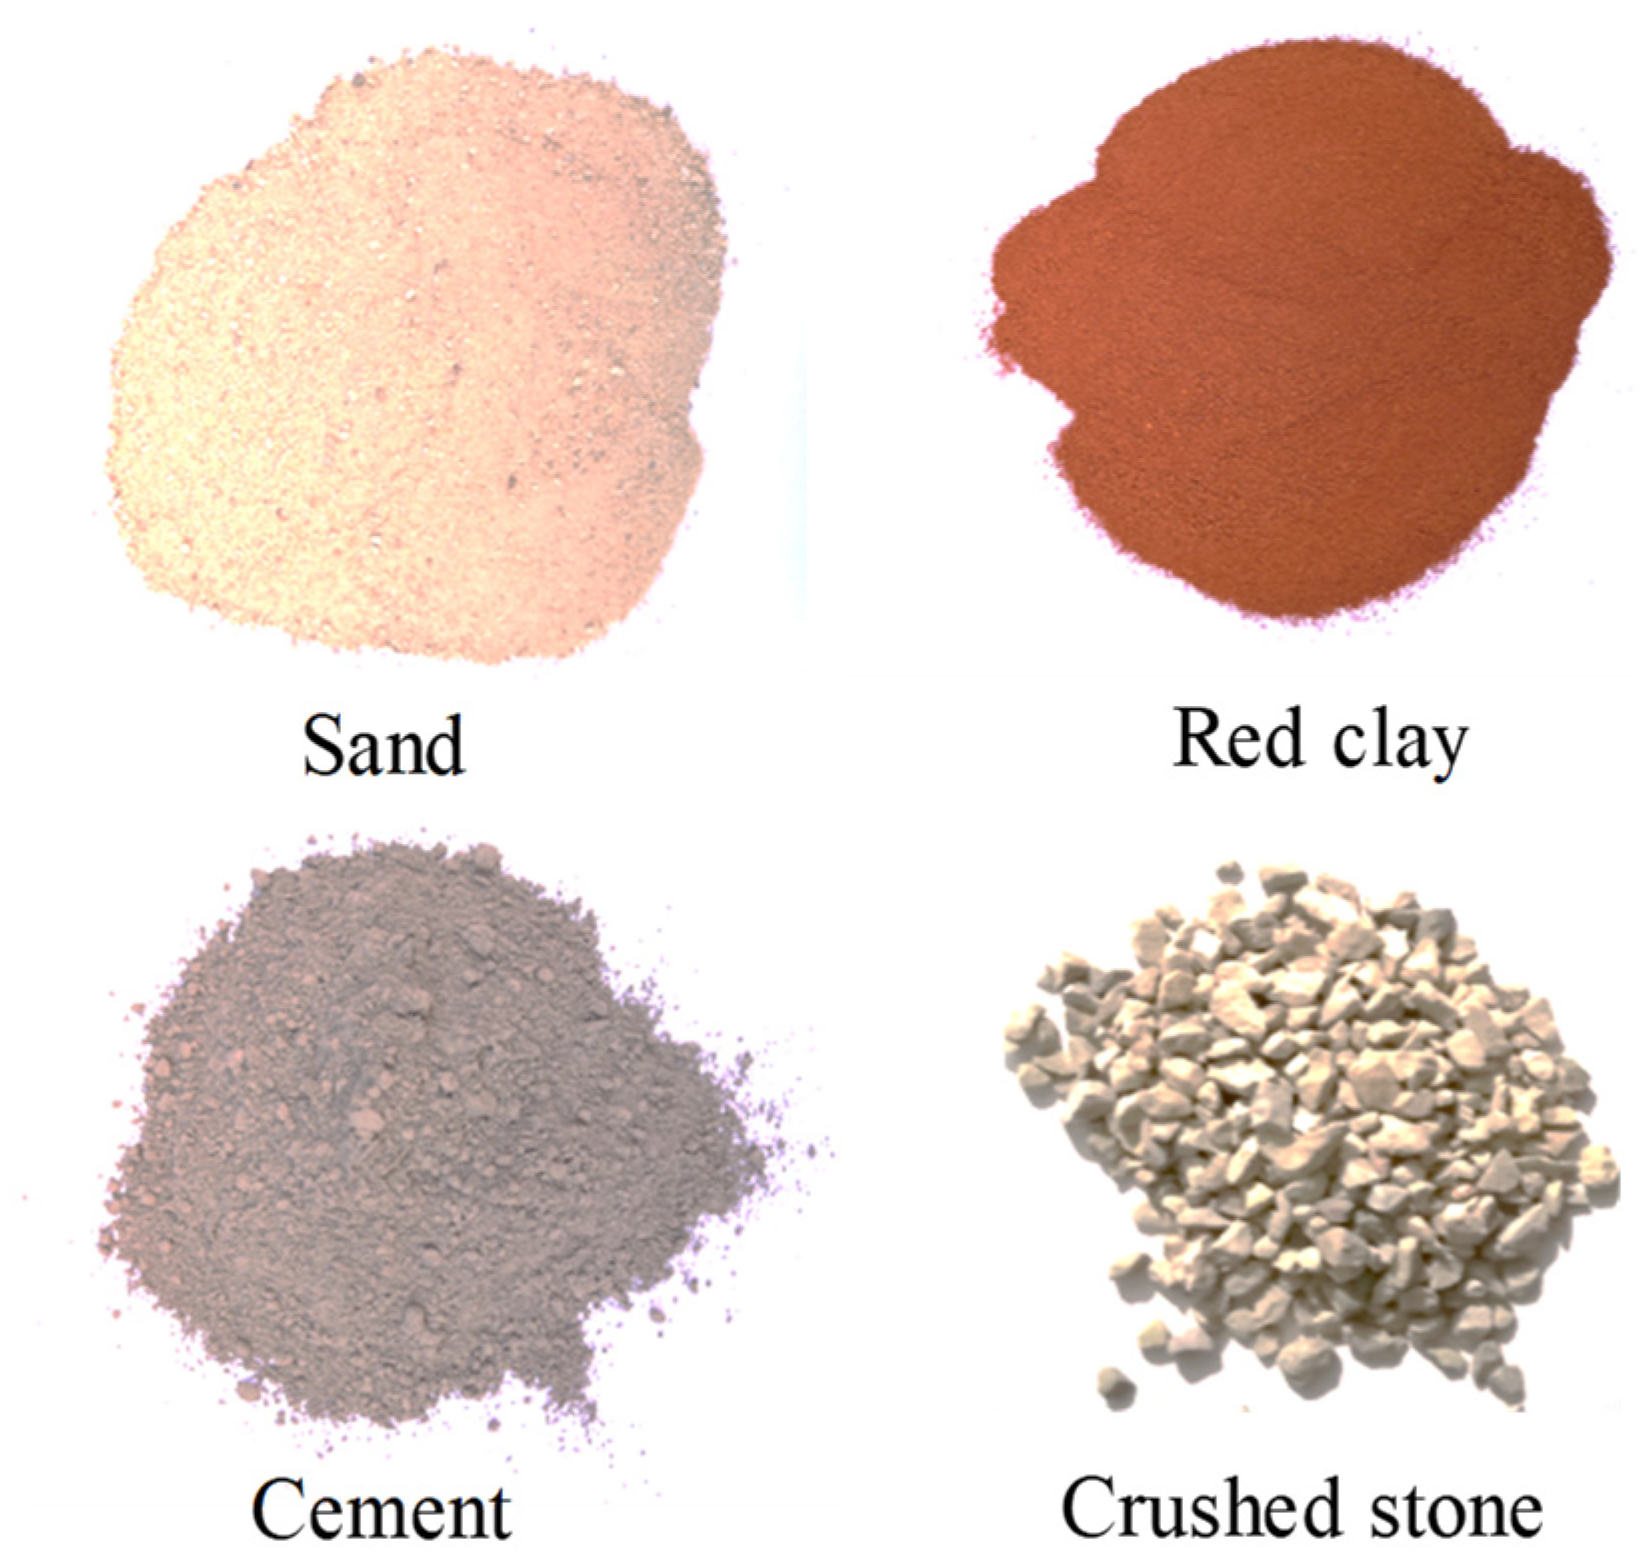
3.1. The Development of Fluid–Solid Coupling of Similar Materials

In a physical model test, choosing suitable similar materials is key to the test’s success. By using a mathematical model for fluid–solid coupling that includes the equilibrium equation, seepage equation, and effective stress equation of a homogeneous continuous medium, the theory of fluid–solid coupling similarity can be derived, and the expressions of the main similarity relationships can be obtained [37,38,39].
C G C u C l 2 = C λ C e C l = C G C e C l = C γ = C ρ C u C t 2
Because the similar materials used in the experiment are homogeneous and continuous media, letting Kx = Ky = Kz = K, the similarity relationships are substituted into Equation (1) to obtain:
C K C P C x 2 = C K C P C y 2 = C K C P C z 2 = C S C P C t = C e C t = C w
Based on Equations (1) and (2), the following expressions for similarity relationships can be derived:
C G = C λ
C u = C e C l
C σ = C E = C γ C l
C t = C l
C K = C l / C γ
where CG is the shear modulus of elasticity scale; Cu is the displacement scale; Cλ is the Lame constant scale; Cl is the model scale; Ce is the volume strain scale; CE is the elastic modulus scale; Cσ is the stress scale; Cγ is the bulk weight scale; Ct is the time scale; CK is the permeability coefficient.
According to the corresponding relationships in similarity theory, during the model test process, the geometric similarity ratio of Cl = 80 and the unit weight similarity ratio of Cγ = 1.2 were selected. Furthermore, the similarity ratios for stress, elastic modulus, and cohesion are Cσ = CE = Cc = 96, and the permeability coefficient similarity ratio is CK = 7.45.
In the process of configuring similar materials, it is comprehensive to consider selecting mountain sand, water, cement, and red clay as the raw materials for surrounding rock, as shown in Figure 2. Among them, mountain sand serves as the aggregate, cement as the binding material, red clay as the modifier, and water as the auxiliary material to simulate the actual surrounding rock in the tunnel. Meanwhile, red clay, mountain sand, and crushed stones serve as the raw materials for filling fractured zones.
When making similar materials, it is necessary to control the proportions of different raw materials to satisfy the criteria of the ultimate experimental similar materials. Due to the significant impart of red clay on the experimental similar materials, the ratio of red clay is increased on the basis of controlling the ratios of cement, mountain sand, and water to seek the optimal ratio that meets the experimental requirements. Before conducting physical model testing, it is necessary to test the fundamental mechanical and hydraulic characteristics of various ratios of similar materials, including unit weight, uniaxial compressive strength, and permeability coefficient.
Based on the property testing of similar materials, the relevant mechanical parameters were obtained to determine the optimal mass percentages for the surrounding rock similar materials needed for the physical model test, which are as follows: mountain sand:red clay:cement:water = 80.27%:6.35%:4.68%:8.70%. For filling fractured zones, the optimal percentages of similar materials are red clay:mountain sand:crushed stones = 42%:42%:16%. Simultaneously, based on the abundant presence of weak Class IV surrounding rock in the actual tunnel construction process and referencing the “Railway Tunnel Design Code”, the main parameters of Class IV surrounding rock are determined. By further integrating the theory of fluid–solid coupling similarity and the results of testing experiments, the parameters of surrounding rock similar materials under ideal conditions and for the final test are obtained, as indicated in Table 1.

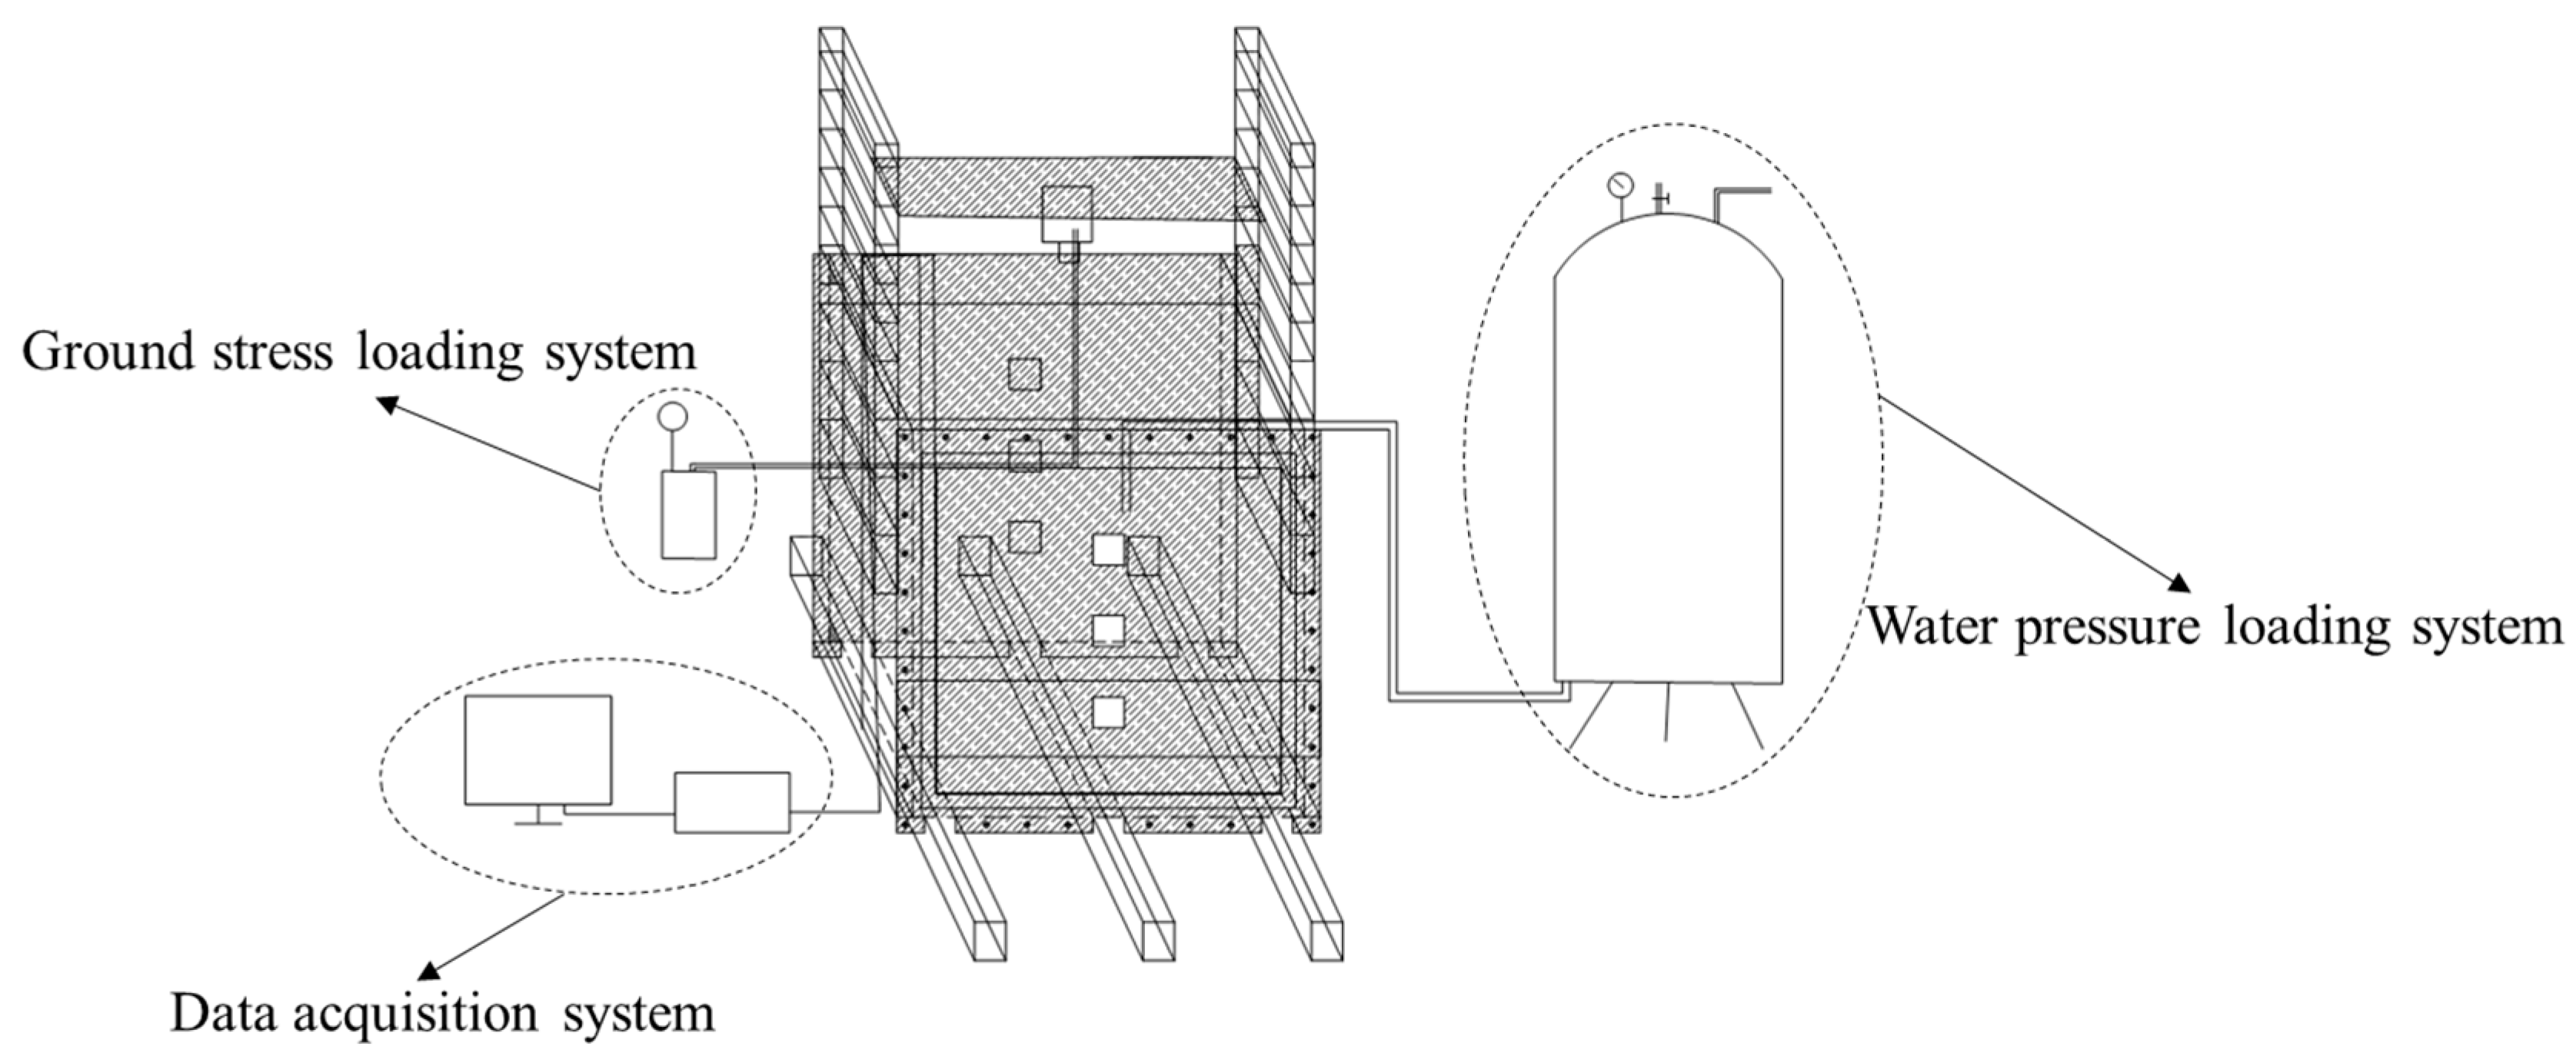
3.2. The Process of Physical Model Testing

This paper takes the Dazhushan Tunnel as the background and conducts a 3D physical model test on a parallel fault’s water and mud inrush using a self-made testing system. Figure 3 illustrates the testing system. The internal design dimensions of the testing frame are 1.0 m in length, 0.5 m in width, and 1.0 m in height, with a geometric similarity ratio of 80.
The depth of the tunnel simulated in this experiment is 500 m. The similar material filling the test device reaches a height of about 90 cm, with a distance of 40 cm from the top of the tunnel arch. The tunnel excavation section is 7.7 cm wide and 11.76 cm high. The designed filling-type fault intersects with the tunnel at a distance of 2 times the tunnel diameter, with a fault thickness of 12.5 cm and a length of 18.75 cm. The corresponding actual fault length and thickness are 15 m and 10 m, respectively. The designed fault makes a 60° angle with the horizontal direction. Meanwhile, watering devices are buried in the upper fault to provide stable water pressure, simulating a high-pressure water-rich fault encountered during tunnel construction. Soil pressure cells and a pore water pressure gauge are used to monitor changes in stress, pore water pressure, and other variables in the surrounding rock and fault during the model testing. The monitoring section measuring points are depicted in Figure 4.
With the self-developed 3D physical model test system, a simulation test was conducted on the section of the Dazhushan Tunnel crossing the Yanziwo Fault. Information monitoring was carried out at the surrounding rock and fractured zone of the tunnel excavation, collecting data on stress and pore water pressure, respectively. The final test installation diagram before excavation is shown in Figure 5.

3.3. The Analysis of Experimental Results

3.3.1. The Stress Variation of Surrounding Rock

At the same time as tunnel excavation, the data collection of surrounding rock stress variation began to be collected. The stress variation patterns at different monitoring points are depicted in Figure 6.
As shown in Figure 6a, during the excavation process, the radial stress at various positions along the tunnel vault gradually decreased. Initially, the stress variation at the vault locations remained relatively stable. However, at monitoring points 2-1 and 2-2, the stress began to decrease sharply around 1250 s into the excavation, while monitoring point 2-3 experienced minimal stress variation throughout the excavation process. This could be attributed to the initial distance between the tunnel excavation position and the monitoring section, resulting in less influence from excavation unloading on the monitoring points. Furthermore, as the face advanced beyond the monitoring section, there was a sudden release of radial stress in the surrounding rock, leading to a sharp decrease in stress at the vault monitoring points. As the face continued to advance, the stress values at the monitoring points gradually stabilized, indicating that points closer to the excavation profile were more affected by the excavation.
As indicated in Figure 6b–d, the vertical stresses on the tunnel’s left and right sidewalls generally exhibited minor variations during the early stages of excavation, followed by a significant increase in the mid-stage, and finally stabilization. Analysis shows that tunnel excavation leads to an increase in vertical stress at the sidewalls and vault positions of the surrounding rock, with the magnitude of the increase influenced by the distance from the excavation profile.

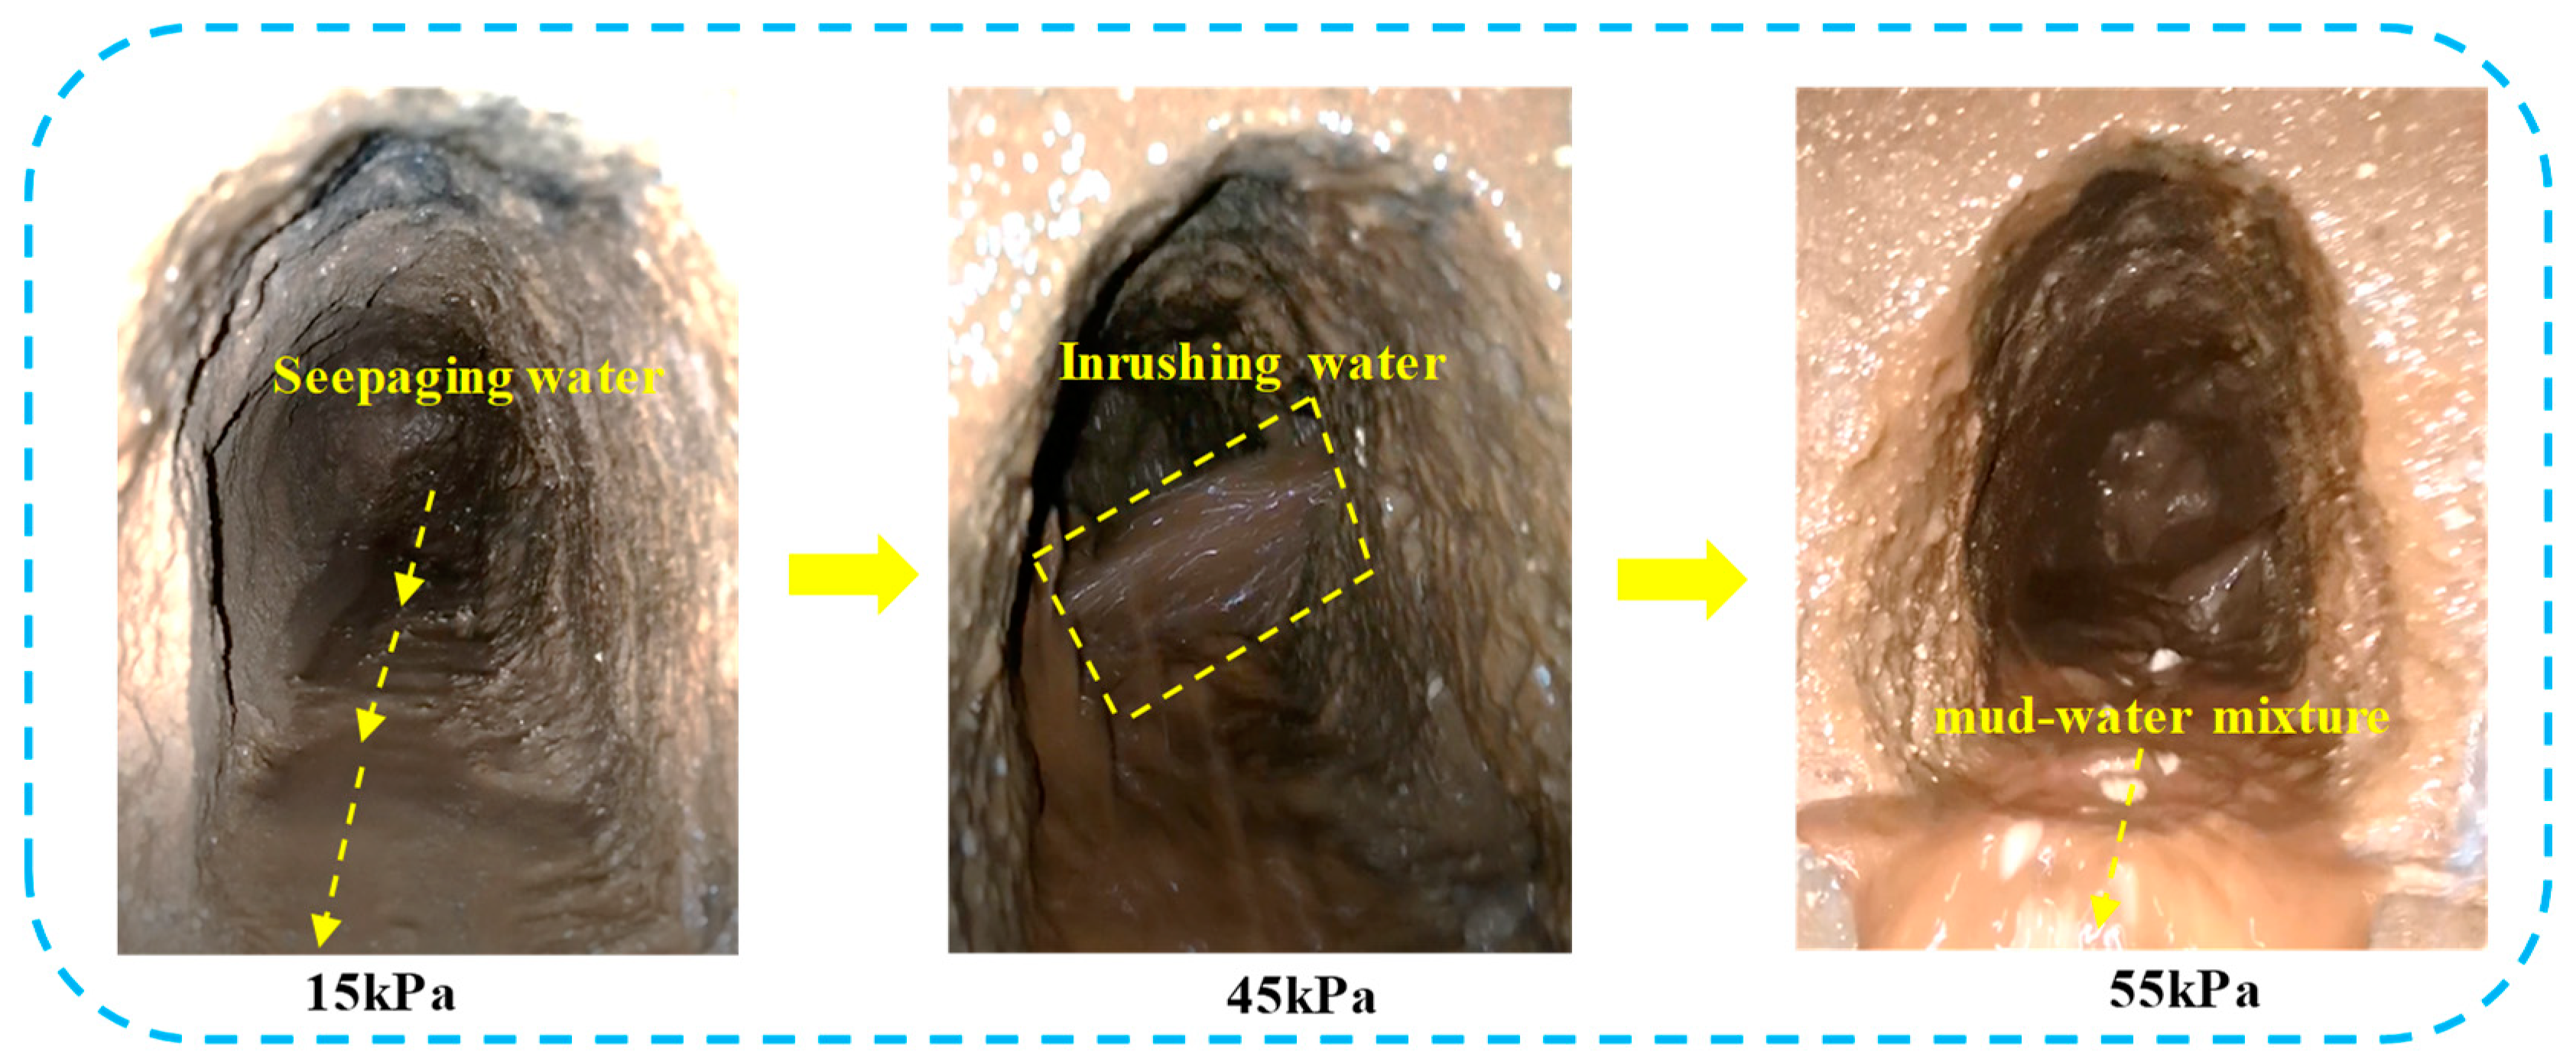
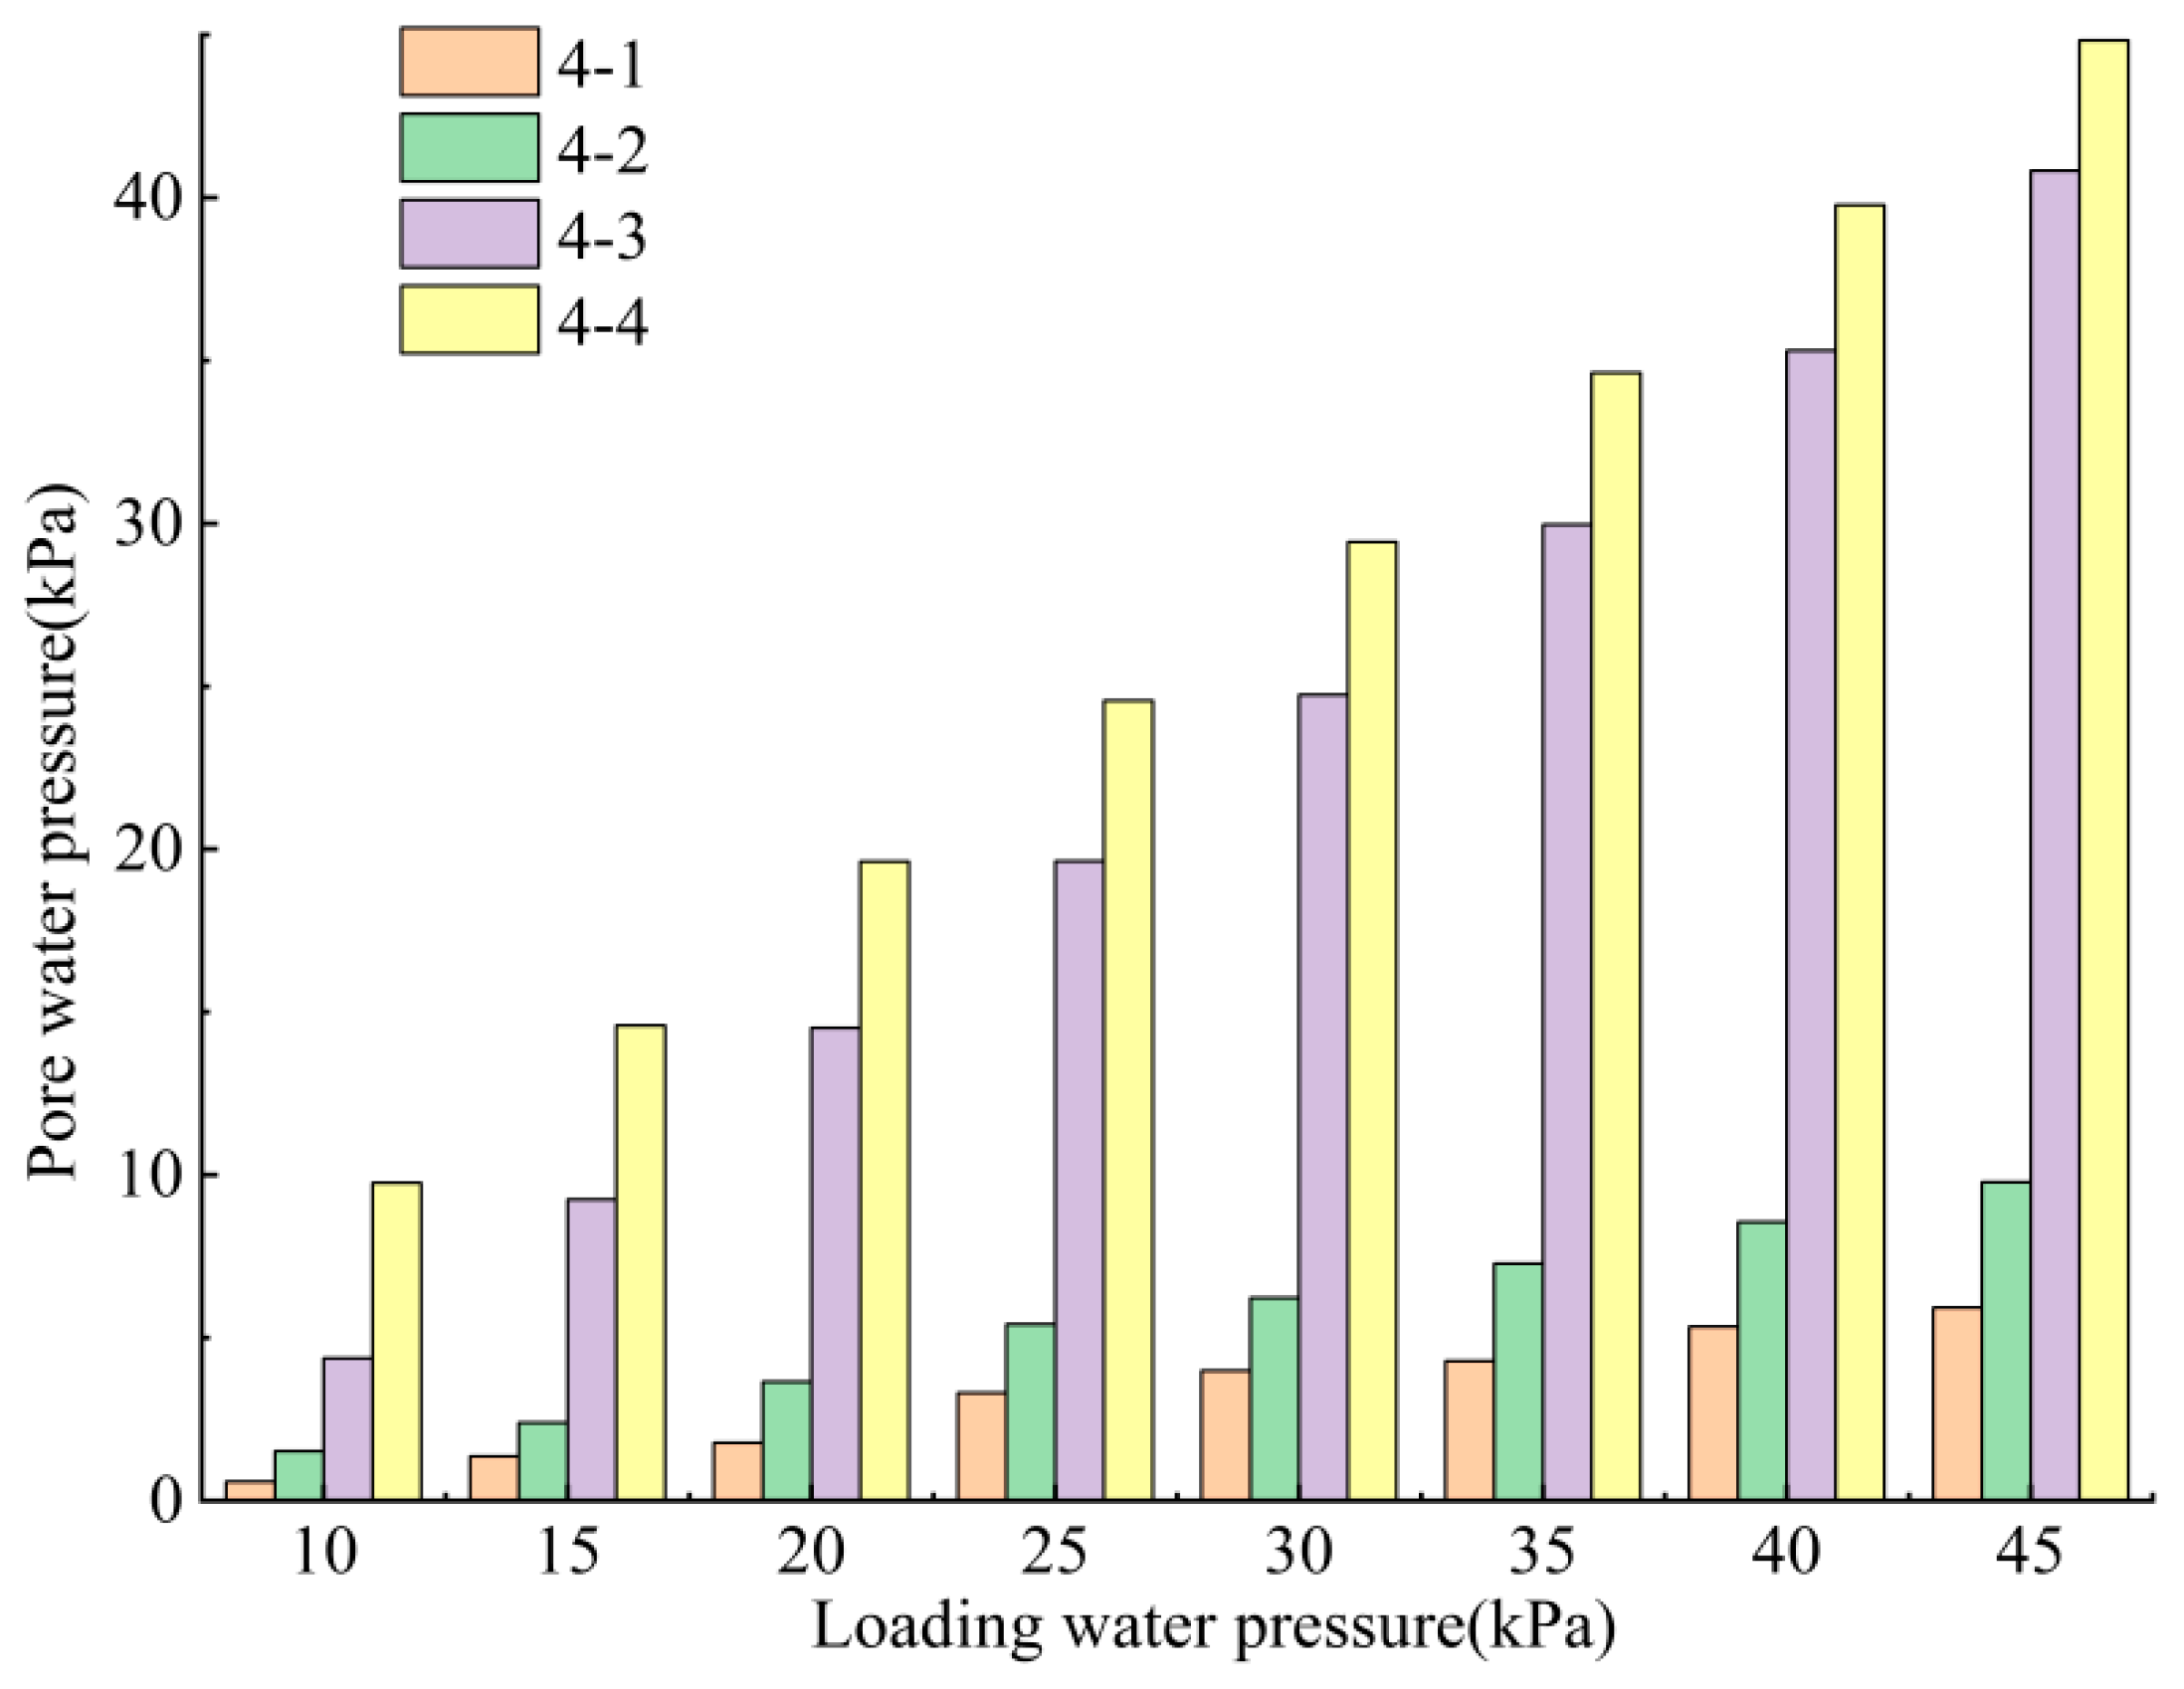
3.3.2. The Impact of Water Pressure Loading on the Evolutionary Law of Water and Mud Inrush

After tunnel excavation was completed, the hydraulic pressure system was utilized to apply water pressure. Water pressure was loaded incrementally, starting from a primary pressure of 10 kPa and increasing by 5 kPa for each increment. To ensure sufficient permeation coupling between water and surrounding rock materials and fault-filling materials, the water pressure loading to the next level was carried out only after the data acquisition software reached stability. When the pressure reached 15 kPa, seepage was initially observed in the right sidewall of the tunnel. As the water pressure continued to increase, the seepage area gradually expanded to the left sidewall, and the overall seepage flow continuously surged. When the pressure reached 45 kPa, cracks appeared in the right sidewall, and water began to flow out in streams. Continuing to increase the water pressure to 55 kPa, the right sidewall experienced permeation instability, and a sudden outburst of a mud–water mixture occurred in the fractured zone, resulting in water and mud inrush. After a period of time, the water and mud inrush tended to stabilize. The evolution of the tunnel water and mud inrush disaster is illustrated in Figure 7.
The variation trend of pore water pressure at different water pressure loading stages of the outburst-prevention rock mass and internal measurement points of the fault is illustrated in Figure 8.
From Figure 8, it is evident that during various stages of water pressure loading, the pore pressure at identical monitoring points escalates with increasing loading pressure. For instance, as the loading pressure escalates from 10 to 45 kPa, the values at monitoring points 4-1 and 4-2 surge from 0.55 kPa to 5.86 kPa and from 1.47 kPa to 9.83 kPa, respectively. Similarly, the values at monitoring points 4-3 and 4-4 increase from 4.35 kPa to 40.68 kPa and from 9.75 kPa to 44.78 kPa, respectively. Under the same loading water pressure conditions, as the vertical distance from each point to the fault’s upper boundary increases, the pore water pressure values gradually decrease. For example, at loading pressures of 25 kPa and 45 kPa, the values at monitoring points 4-1, 4-2, 4-3, and 4-4 measure 3.31 kPa, 5.42 kPa, 19.63 kPa, and 24.56 kPa, respectively. Upon reaching a loading pressure of 45 kPa, the pore water pressure at each monitoring point rises to 5.93 kPa, 9.78 kPa, 40.83 kPa, and 44.83 kPa, respectively. In addition, during various stages of water pressure loading, the pore water pressure at monitoring point 4-4 consistently approaches the water pressure values. This suggests that placing a gravel layer between the watering device and the fault can significantly diminish the degree of water pressure attenuation across the layer and effectively distribute the water pressure uniformly.
In the actual experimental process, due to the limitations of objective conditions, it is not feasible to obtain the values at arbitrary points within the rock mass at the monitoring section. Instead, the variations in water pressure at corresponding positions can only be monitored by installing pore water pressure sensors at key locations. Therefore, this paper normalizes the pore water pressure values at internal monitoring points of the rock mass at each hydraulic pressure loading stage and fits curves to obtain the variations in pore water pressure at arbitrary points within the rock mass. The pore water pressure values at each monitoring point are normalized by dividing by the value at monitoring point 4-3. Let P3 denote the pore water pressure value at monitoring point 4-3, and Pi denote the pore water pressure value at arbitrary points within the rock mass. The pressure coefficient of pore water pressure at arbitrary points relative to monitoring point 4-3 is calculated as Pi/P3 (normalized value). Table 2 displays the normalized pore water pressure values at various monitoring points within the rock mass under distinct loading pressures, while the fitted curves are illustrated in Figure 9.
From Table 2 and Figure 9, it can be observed that under different loading pressures, the pressure coefficients of pore water pressure at arbitrary points within the rock mass relative to monitoring point 4-3 decrease with increasing vertical distance from the upper boundary of the fault. In other words, the pore water pressure at arbitrary points gradually decreases with increasing vertical distance S. Taking the loading water pressure of 20 kPa as an example, points with vertical distances of 14 cm, 16 cm, 18 cm, and 20 cm from the upper boundary of the fault are selected for analysis. When the loading pressure is 20 kPa, the relative pressure coefficients at the selected points are 0.719, 0.466, 0.301, and 0.195, respectively. The corresponding pore water pressures are 10.43 kPa, 6.76 kPa, 4.37 kPa, and 2.83 kPa, with a decrease in pressure coefficient compared to the previous point of 35.19%, 35.41%, and 35.21%, respectively. Based on the variations in water pressure coefficients and pore water pressures at the selected points under distinct water pressures, it can be concluded that both the water pressure coefficients and pore water pressure at arbitrary points within the rock mass decrease with increasing vertical distance from the fault’s upper boundary.
By using the least squares method to perform nonlinear fitting on the experimental values of relative pressure coefficients at monitoring points under distinct water pressure loading stages, it can be observed that the fitting curve follows an exponential function relationship. The functional expression is as follows:
P i P 3 = a e b s
where Pi/P3 is the water pressure coefficient of the pore water pressure at any point in the monitoring section of the anti-breakthrough rock body relative to the reference point, a and b are fitting parameters, and S is the vertical distance between any point and the fault’s upper boundary.
Table 3 presents the parameters of the fitting curve for different loading pressures.
The range of the error parameter R-Square of the fitting curve, as shown in the table, is from 0.9657 to 0.9994. This value is close to 1, indicating that the nonlinear fitting of the seepage law within the rock mass under different loading pressures using an exponential function is quite effective.

4. Simulation Scheme and Calculation Model Establishment

4.1. Numerical Simulation Scheme Design

In order to further compare with physical model experiments, according to the actual working conditions and the spatial position of the tunnel and fault, a numerical simulation scheme for parallel fault excavation was designed, as shown in Figure 10. Point P is one of the key monitoring points, which is the intersection of the Y = 26 m cross-section staggered distance line and the left boundary of the fault.

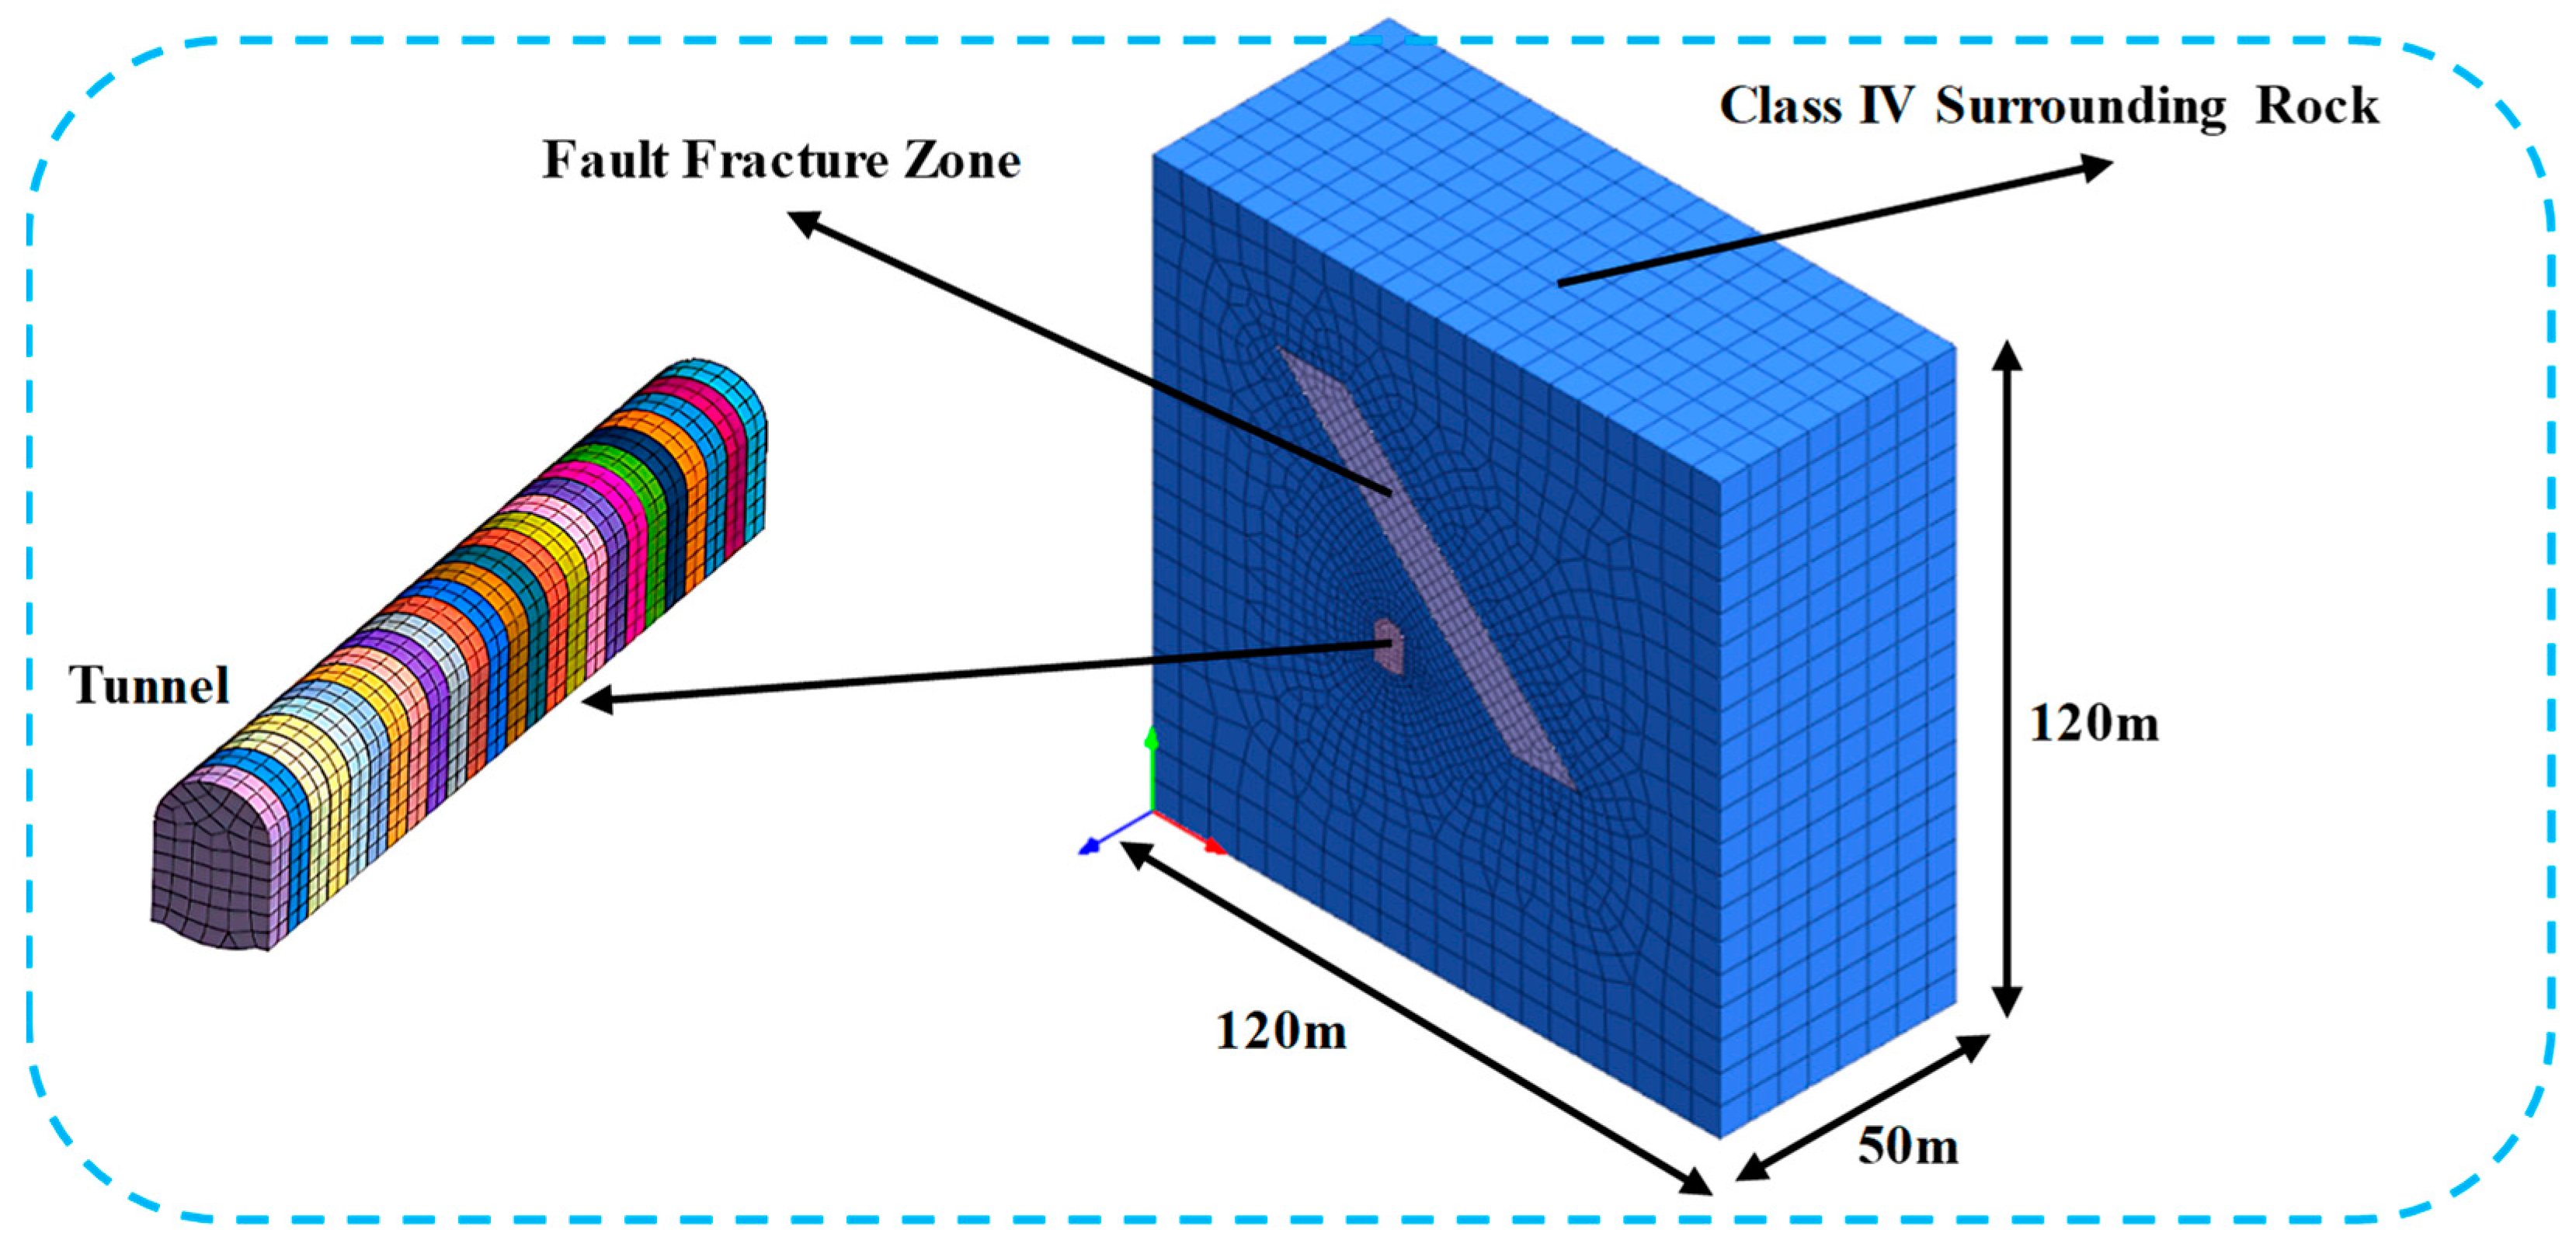
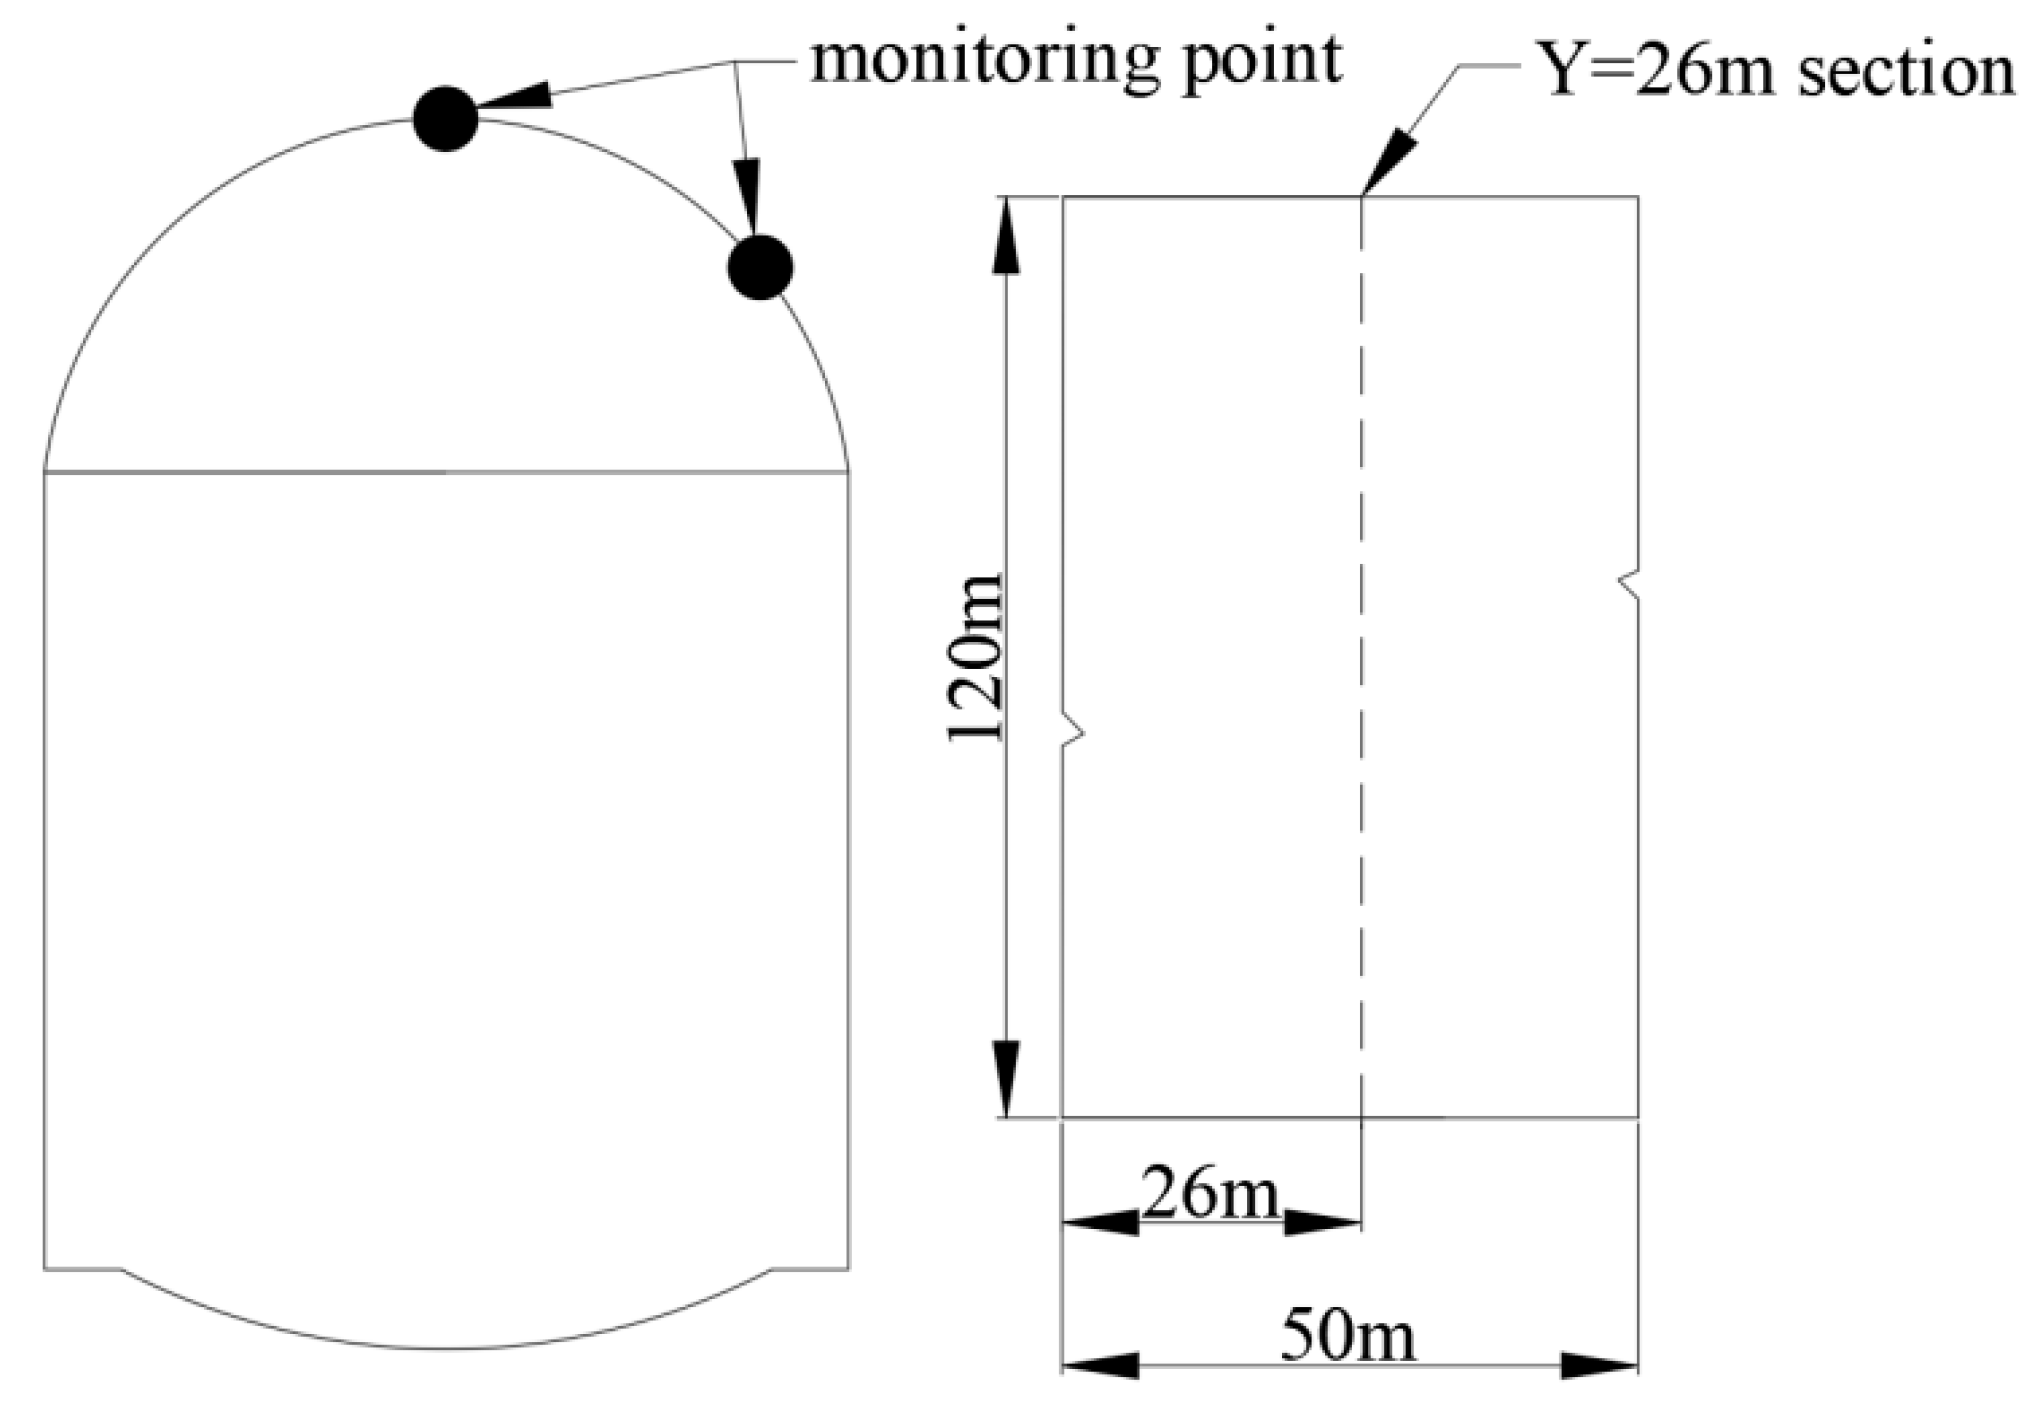
4.2. Establishment of Computational Model

When establishing a three-dimensional numerical calculation model, the influence of the tunnel excavation radius and seepage field should be considered. The length and height of the model of the tunnel excavation at the footwall of fault are 120 m and 120 m respectively, and the width along the tunnel axis is 50 m. The model grid is a uniform grid which radiates outward from the tunnel in a certain proportion. The minimum size of the grid is 0.8 m, and the mesh is mainly hexagonal. The tunnel is excavated by the full-section method and the excavation footage is 2 m. In the model, the height and width of the tunnel excavation are 9.408 m and 6.16 m, respectively. The model established by numerical calculation is shown in Figure 11.
The Mohr–Coulomb constitutive model is adopted in numerical simulation calculation [40]. The surrounding rock and fault parameters in the model were obtained by referring to relevant specifications and experiments. Table 4 shows the parameters of surrounding rock and fault materials. The model’s boundary conditions are a fixed constraint at the bottom and a normal constraint around. In order to simulate groundwater, nodal water heads are applied on the left and right boundaries of the model, and the seepage boundary is set at the excavation surface formed in each cycle of tunnel excavation.

5. Analysis of Evolution Law of Water and Mud Inrush in Fault Fracture Zone

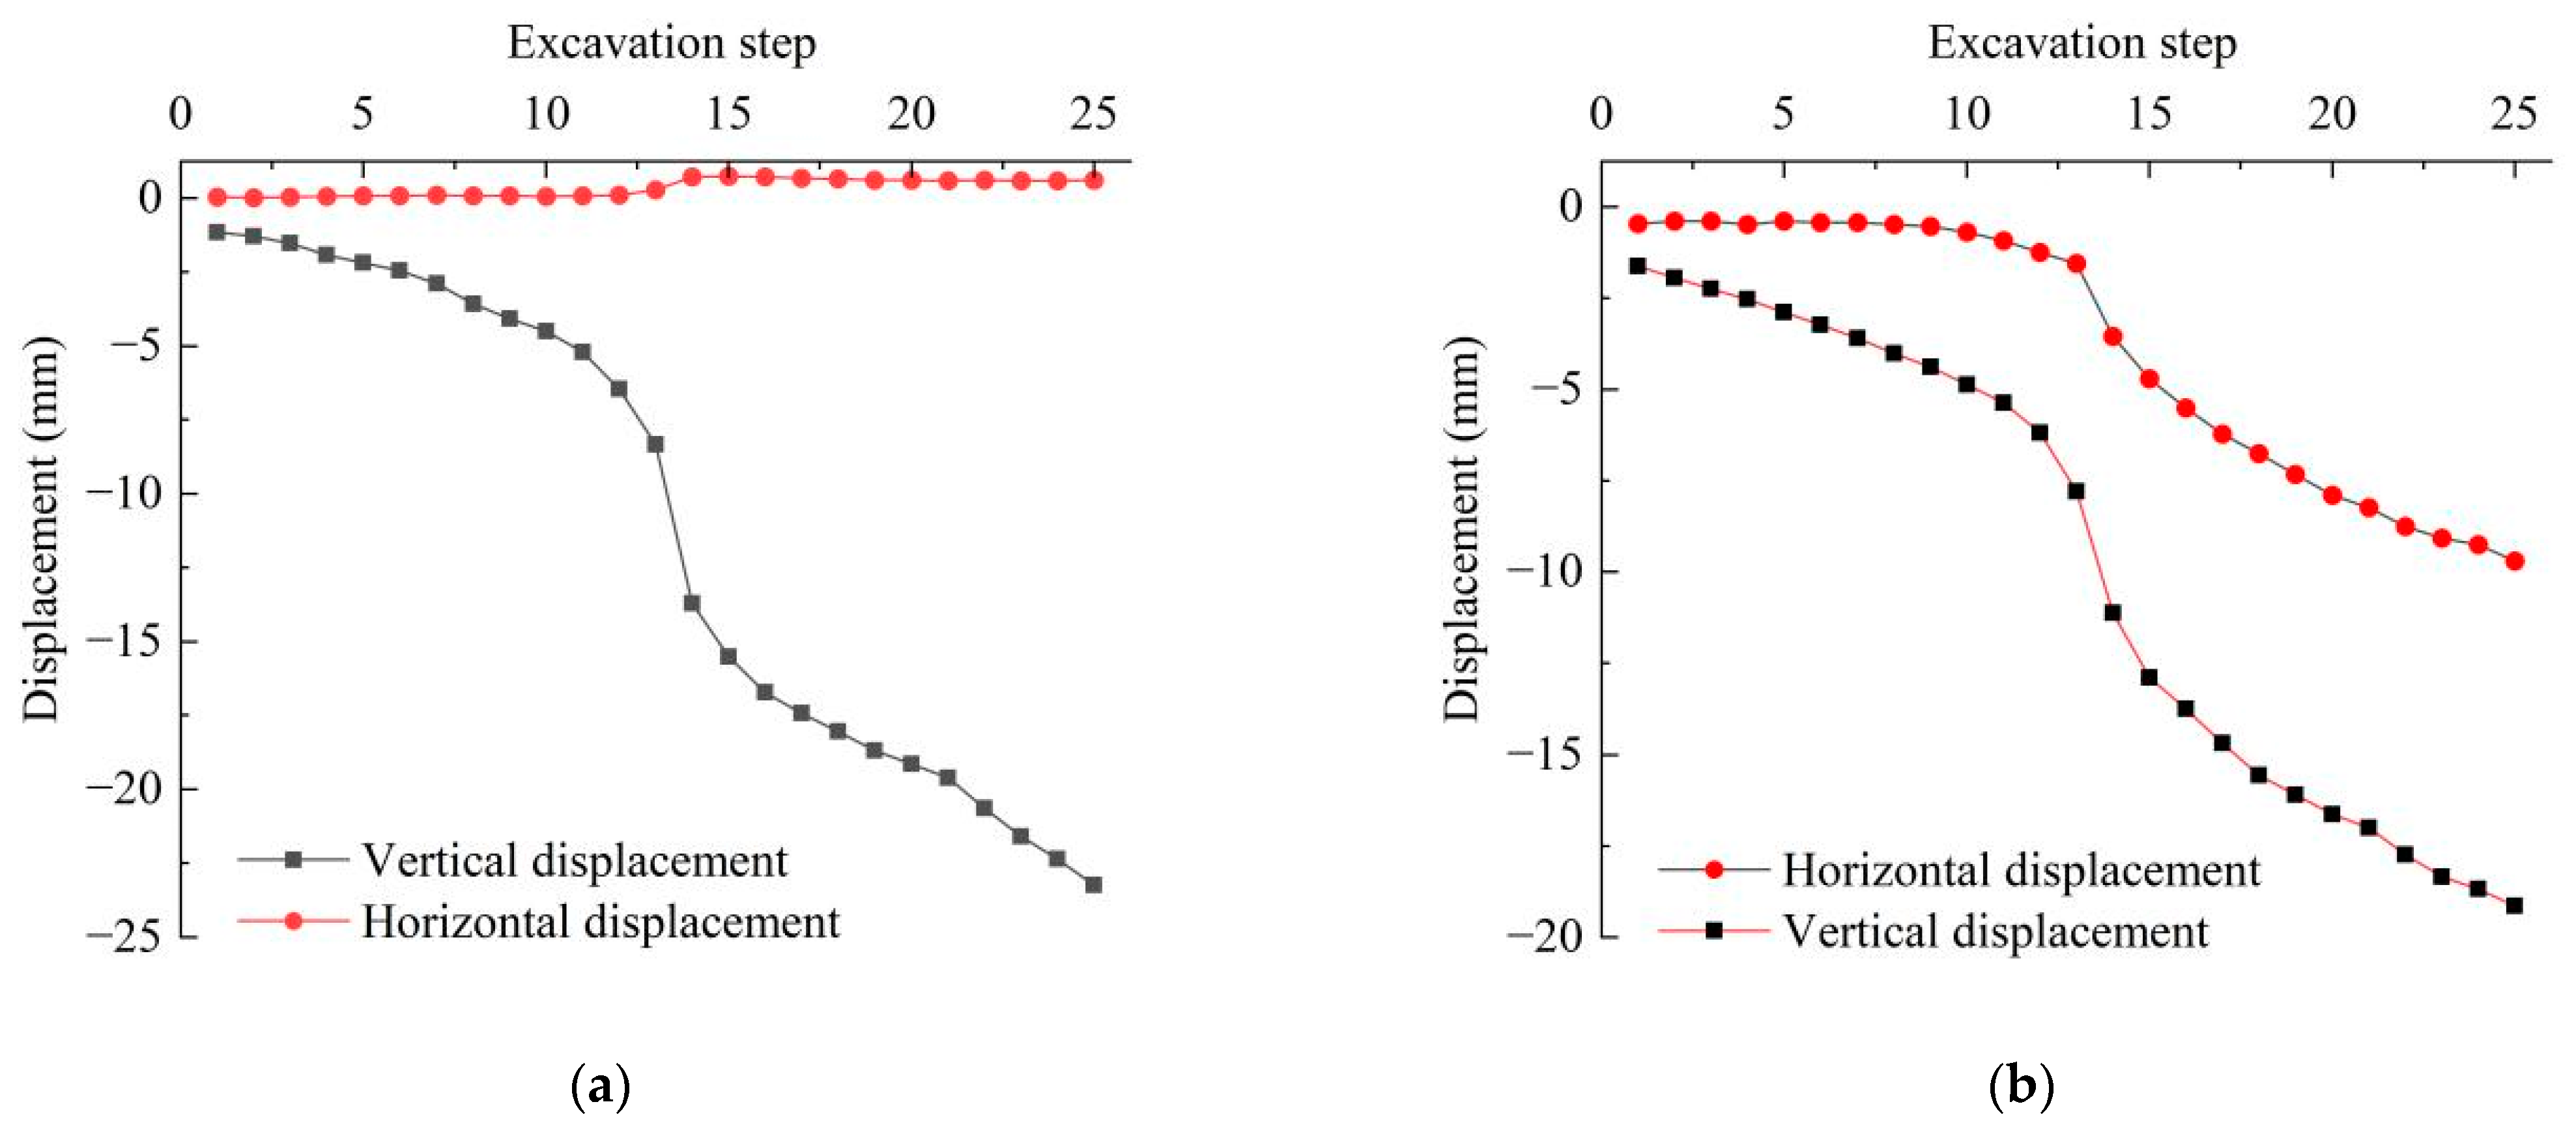
5.1. Analysis of Displacement Field Evolution Law

During the numerical model analysis, it is necessary to reset the displacement field and velocity field generated by the initial stress field calculation, and then proceed with the fluid–solid coupling calculation and analysis of tunnel excavation [41,42]. The displacement field distribution of surrounding rock at different stages of tunnel excavation is also different. When analyzing the law of displacement field through a cloud diagram, the longitudinal profile at the excavation length of 48 m is selected to analyze the vertical displacement of the surrounding rock. Simultaneously, the Y = 25 m profile at this stage is chosen to analyze the horizontal displacement of the surrounding rock.
Figure 12 shows the vertical and horizontal displacement nephograms of surrounding rock after 48 m of tunnel excavation, respectively. According to Figure 5, after excavating 48 m into the tunnel, the vertical displacement of the surrounding rock is mainly concentrated at the vault and invert, with a maximum value of 2.63 cm. Meanwhile, the horizontal displacement of the surrounding rock exhibits a symmetrical distribution pattern, primarily concentrated at the left and right sidewalls, with a maximum value of 3.31 cm.
In the tunnel excavation process, the influence of excavation on the stability of the tunnel surrounding rock can be analyzed by monitoring the surrounding rock displacement at the key points around the tunnel. Therefore, multiple points are selected for vertical and horizontal displacement monitoring in this paper. When analyzing the displacement influence of excavation on key points, the selected points are located at the vault and right arch ring of the Y = 26 m section. The intersection point of the staggered distance line on the Y = 26 m section and the left boundary of the fault is the monitoring point P, which has been marked in Figure 10. The selected key positions are shown in Figure 13.
Figure 14 illustrates the displacement variations of the vault and right arch ring for the Y = 26 m section. According to Figure 14a, as excavation steps increase, the settlement value of the vault gradually increases. Specifically, from excavation step 13 to step 15, there is a steep increase in vault settlement. After excavation step 16, the rate of vault settlement growth slows down, with a final settlement value of 23.236 mm. Analysis reveals that when the excavation face is further away from the monitoring section, the variation in tunnel vault settlement is smaller, but it significantly increases as the excavation face approaches the monitoring section. In contrast, the horizontal displacement of the vault remains relatively stable, with the maximum horizontal displacement of the vault throughout the excavation process being 0.622 mm. According to Figure 14b, the horizontal displacement of the right arch ring sharply changes after the monitoring section is exposed, while the vertical displacement experiences a sharp change before the monitoring section is exposed during excavation steps. After tunnel excavation is completed, the vertical displacement of the right arch ring is 19.144 mm, representing a 17.61% decrease compared to the vault’s vertical displacement. The horizontal displacement is 9.685 mm, indicating a 9.063 mm increase compared to the vault’s horizontal displacement. The comparative analysis demonstrates that tunnel excavation has a greater impact on the vertical displacement of the vault than the arch ring, while its influence on the horizontal displacement of the vault is less than that of the arch ring.

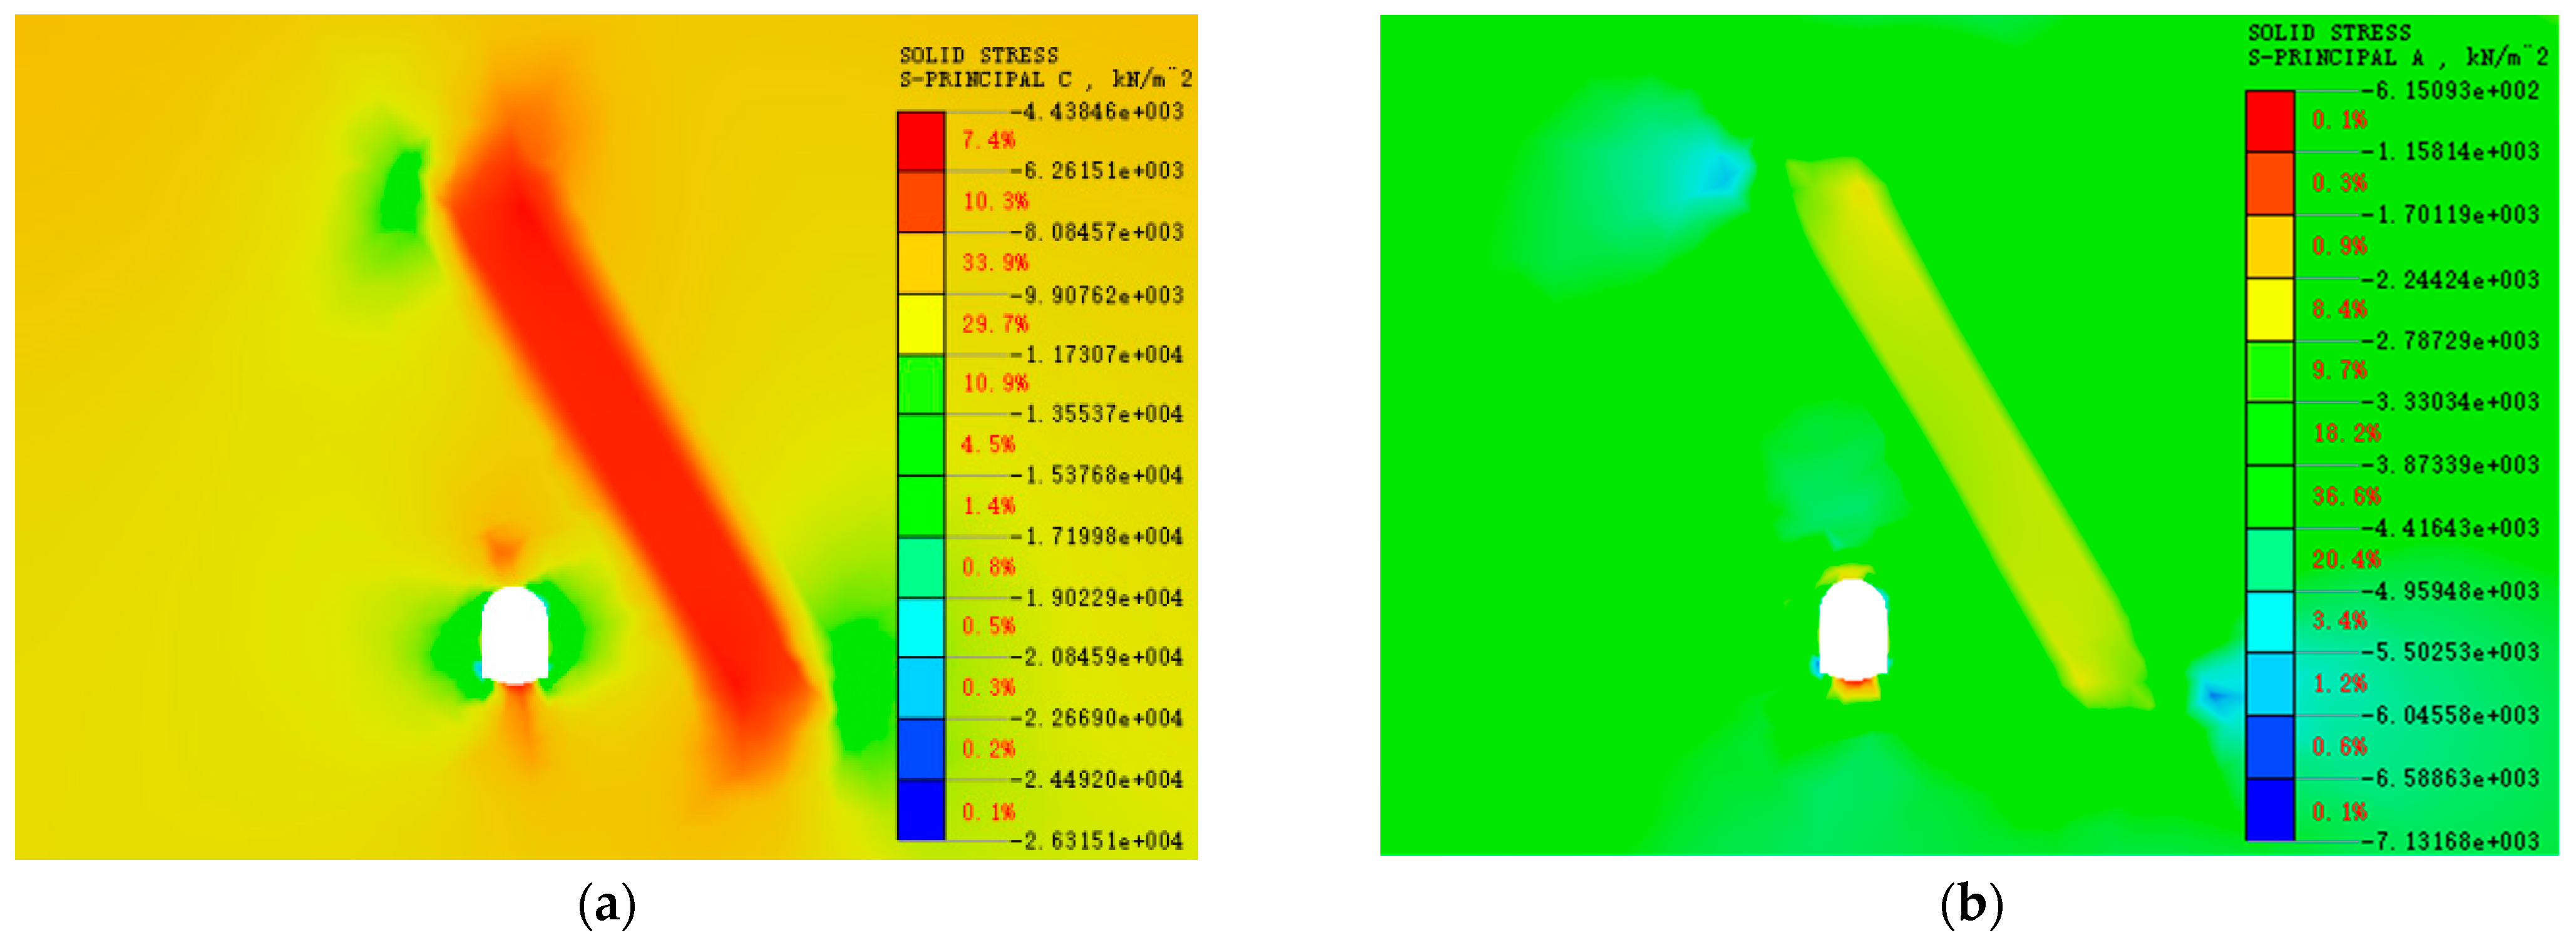
5.2. Analysis of Stress Field Evolution Law

Excavating tunnels will disrupt the initial stress conditions of surrounding rock, prompting a redistribution of stress within the rock mass., especially in the excavation disturbance area [43]. In order to study the stress distribution law of the surrounding rock during tunnel excavation, the maximum and minimum principal stress cloud maps of the surrounding rock at the cross-section Y = 25 m of the model are selected with an excavation length of 30 m for analysis (as shown in Figure 15).
According to Figure 15, when the tunnel is excavated to 30 m, the maximum and minimum principal stresses of the surrounding rock are both compressive stresses. The maximum principal stress is mainly concentrated in the surrounding rock near the upper left and lower right corners of the fault and at the tunnel vault, with a maximum value of 26.315 MPa. The high-value zone of the minimum principal stress is mainly located in the surrounding rock near the upper left and lower right corners of the fault and at the tunnel invert, with a maximum value of 7.132 MPa. Therefore, monitoring and reinforcement measures should be implemented during tunnel construction to prevent excessive stress in the surrounding rock, which could lead to instability and deformation of the surrounding rock, triggering water and mud inrush disasters in the tunnel.
Gaining a detailed understanding of the variation law of surrounding rock stress in each stage of tunnel excavation can be realized by arranging monitoring units. The surrounding rock stress monitoring unit is arranged near the vault and right arch ring in the middle section of the model (Y = 25 m). The variation law of the maximum principal stress and minimum principal stress of each monitoring unit is shown in Figure 16.
From Figure 16a, it can be observed that from excavation step 1 to step 12, both the maximum and minimum principal stresses of the units near the tunnel vault gradually increase. From step 12 to 13, due to the excavation face corresponding to the excavation step passing through the monitoring section, the principal stresses of the vault units experience a sharp decrease due to excavation unloading. With the increase in excavation steps, as the excavation face gradually moves away from the monitoring section, the principal stresses of the vault units first rise slightly and then remain relatively constant. Meanwhile, the minimum principal stress values of the vault units at each excavation step are relatively close, while the maximum principal stress values vary significantly. From Figure 16b, it can be seen that the variations in the maximum and minimum principal stresses of the arch ring units with excavation steps are distinctly different. As the excavation steps increase from 1 to 11, both the maximum and minimum principal stresses slowly increase. When the excavation steps increase from 11 to 15, the maximum principal stress sharply rises, while the minimum principal stress undergoes a process of sharp increase, sharp decrease, and then slow increase. During this stage, the maximum principal stress increases sharply from 10.609 MPa to 15.384 MPa, with an increase of 45.01%, while the minimum principal stress increases from 4.219 MPa to 5.014 MPa, then decreases to 3.373 MPa, and finally gradually increases to 3.966 MPa. From step 15 to 25, both the maximum and minimum principal stresses gradually stabilize.

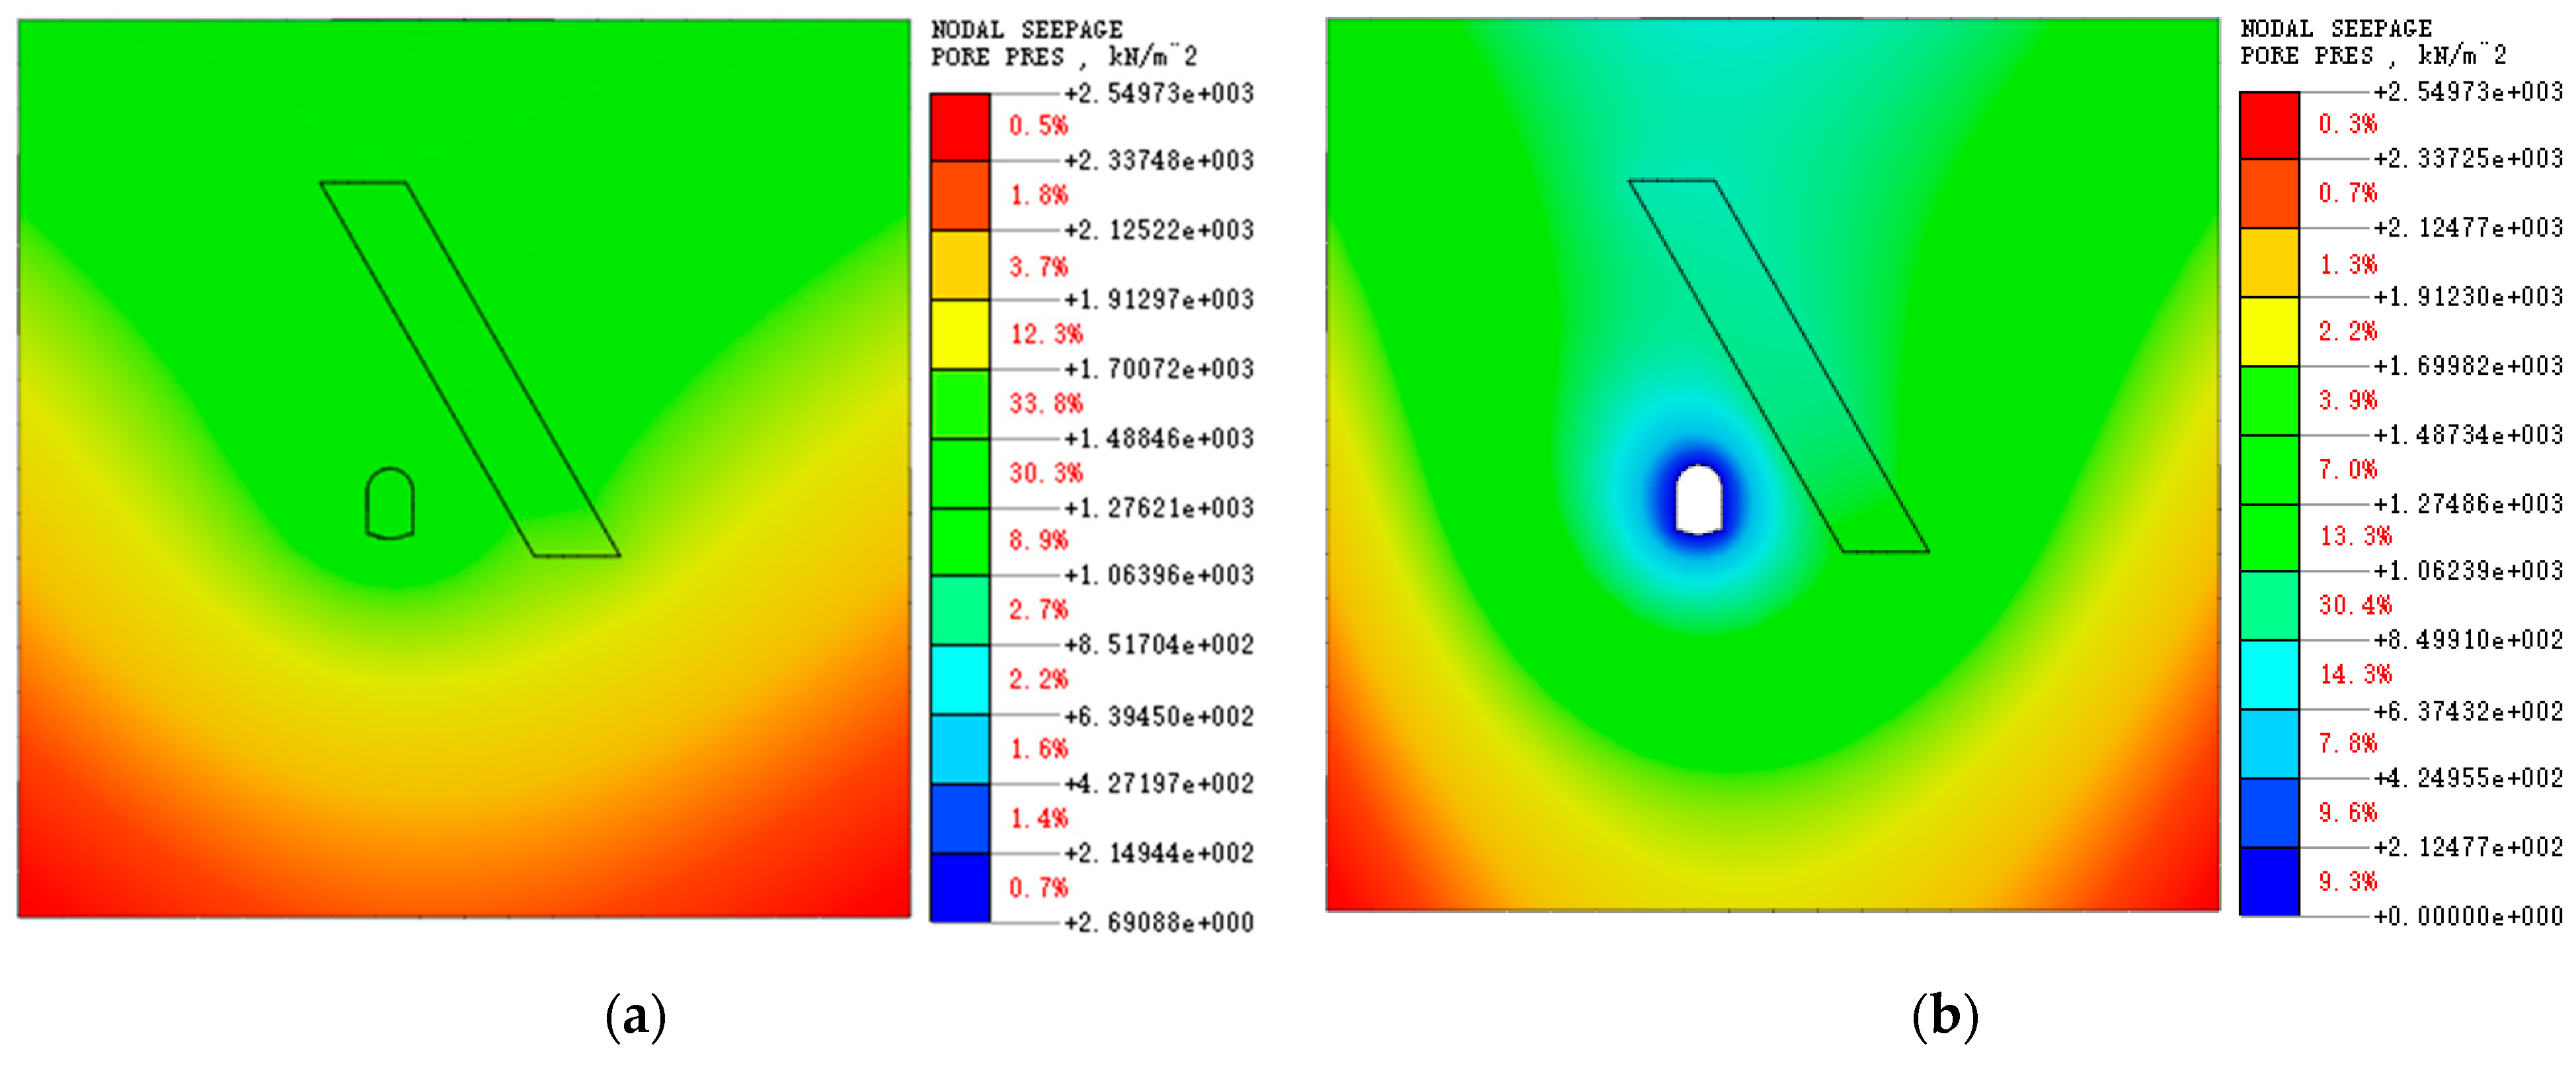
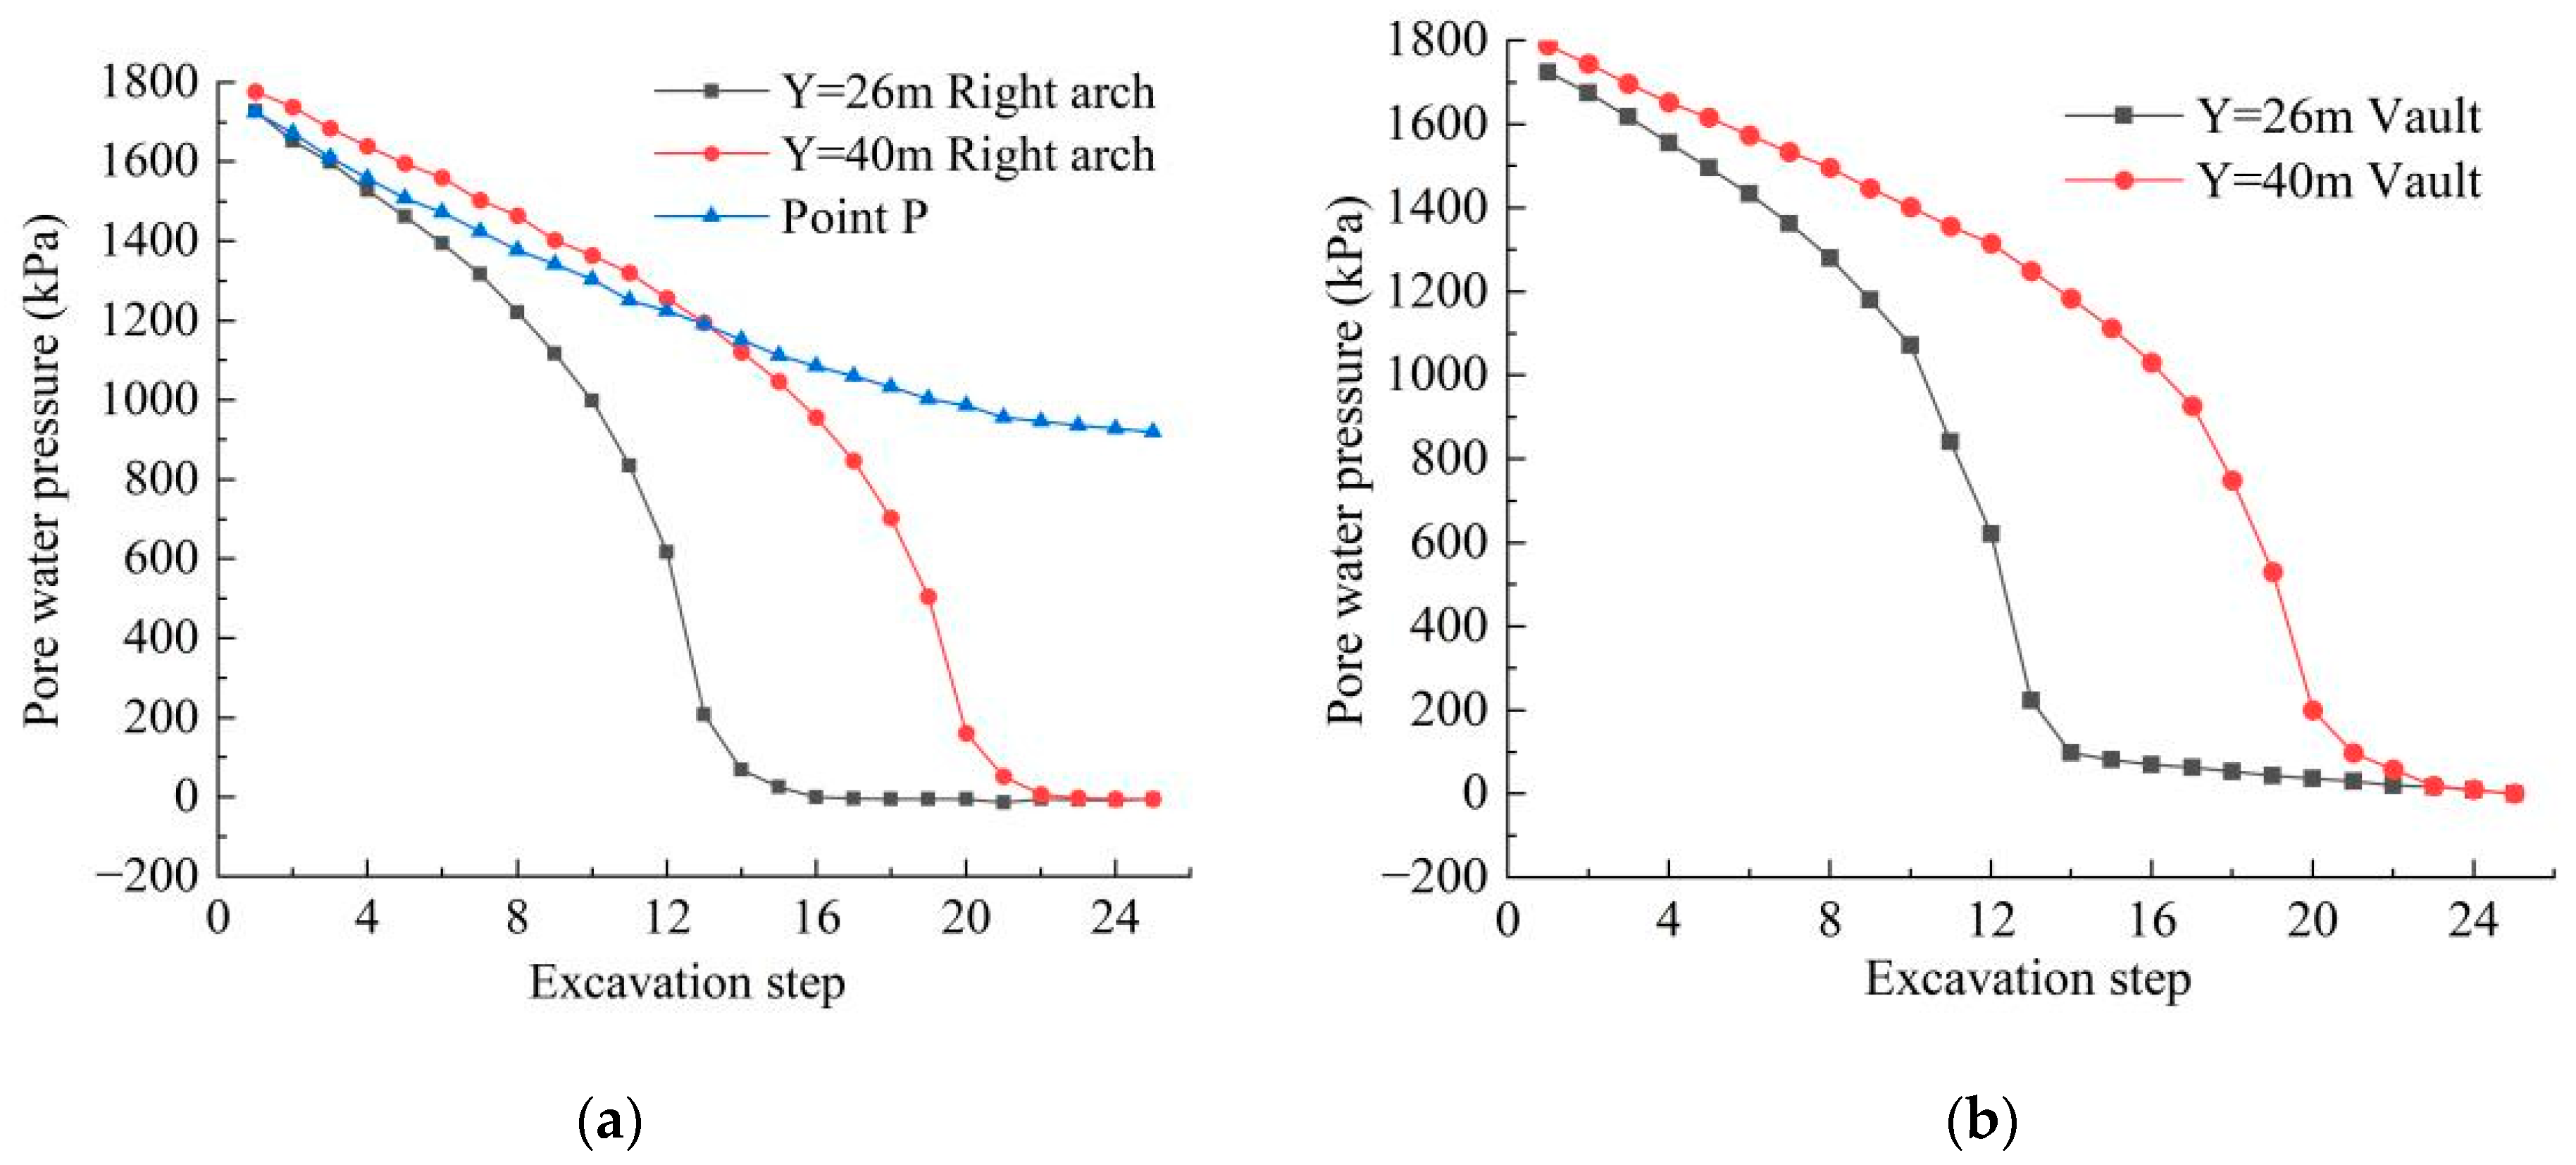
5.3. Analysis of Evolution Law of Pore Water Pressure

In the process of tunnel excavation, the distribution of pore water pressure in the surrounding rock and fault fracture zone varies with different excavation stages. When studying the pore water pressure distribution, the cross-section (Y = 25 m) of the middle position of the model when the tunnel is excavated to 10 m and 50 m is selected for analysis. The pore water pressure distribution in each analysis condition is shown in Figure 17.
According to Figure 17a, the distribution of pore water pressure in the model is affected by the burial depth. Under this working condition, the pore water pressure shows an increasing trend from top to bottom. However, from the left and right sides of the model to the direction of the tunnel axis, the pore water pressure inside the surrounding rock at the same burial depth gradually decreases. The pore water pressure in the entire profile shows a “U”-shaped distribution, and the maximum and minimum values of the pore water pressure in the model are 2.550 MPa and 2.691 kPa, respectively. According to Figure 17b, after tunnel excavation is completed, a low pore water pressure zone is formed around the excavation face of the tunnel in this section. Groundwater in the surrounding rock flows towards the void created by the tunnel excavation, resulting in a funnel-shaped distribution of pore water pressure across the entire section.
The pore water pressure cloud map can only reflect the approximate values of the pore water pressure in the surrounding rock and the fault fracture zone of a particular section under certain conditions, and cannot simultaneously reflect the specific numerical change law of the pore water pressure at each position under various conditions. Therefore, when analyzing the variation of pore water pressure, the sections of Y = 26 m and Y = 40 m are selected as the monitoring sections, and the points of the right arch ring and the intersection point P (as shown in Figure 13) are selected as the monitoring points for water pressure variation analysis.
Figure 18 shows the variation of pore water pressure at each monitoring point with excavation steps. According to Figure 18a, it can be observed that with the increase in excavation steps, the pore water pressure at the monitoring point of the right arch ring of the tunnel at the Y = 26 m profile decreases significantly. After excavation step 15, the pore water pressure at this monitoring point stabilizes and gradually approaches 0. Similarly, at the monitoring point of the right arch ring of the tunnel at the Y = 40 m profile, the pore water pressure decreases significantly between excavation steps 1 and 21 and then stabilizes gradually, also approaching 0. The analysis indicates that when the excavation length of the tunnel does not reach the monitoring section, there is a significant variation in the pore water pressure at the monitoring section’s right arch ring. However, when the excavation length reaches the monitoring section, the variation in pore water pressure becomes smaller. This may be due to excavation causing high-pressure water in the surrounding rock to gradually flow towards the excavation face, resulting in a gradual decrease in the pore water pressure of the surrounding rock near the tunnel excavation face. After reaching the monitoring section, the release of high-pressure water is completed, causing the pore water pressure at the monitoring point to gradually approach 0. Additionally, the pore water pressure at point P is initially lower than that at the right arch ring of the Y = 40 m monitoring section but becomes higher in the later stages of excavation. This is related to the distance between the excavation face formed during excavation and the monitoring point.
Figure 18b represents the pore water pressure variation curve at the monitoring section’s vault. It can be seen that the trend of pore water pressure variation at the vault of each monitoring section is similar to that at the arch ring of the same section. From excavation step 1 to 9, the pore water pressure at the vault monitoring points of Y = 26 m and Y = 40 m profiles decreases from 1725.13 kPa and 1779.75 kPa to 1122.29 kPa and 1412.87 kPa, respectively, with a decrease of 34.94% and 20.61%. By excavation step 25, the pore water pressure decreases to 0.00 kPa and 0.70 kPa, respectively.

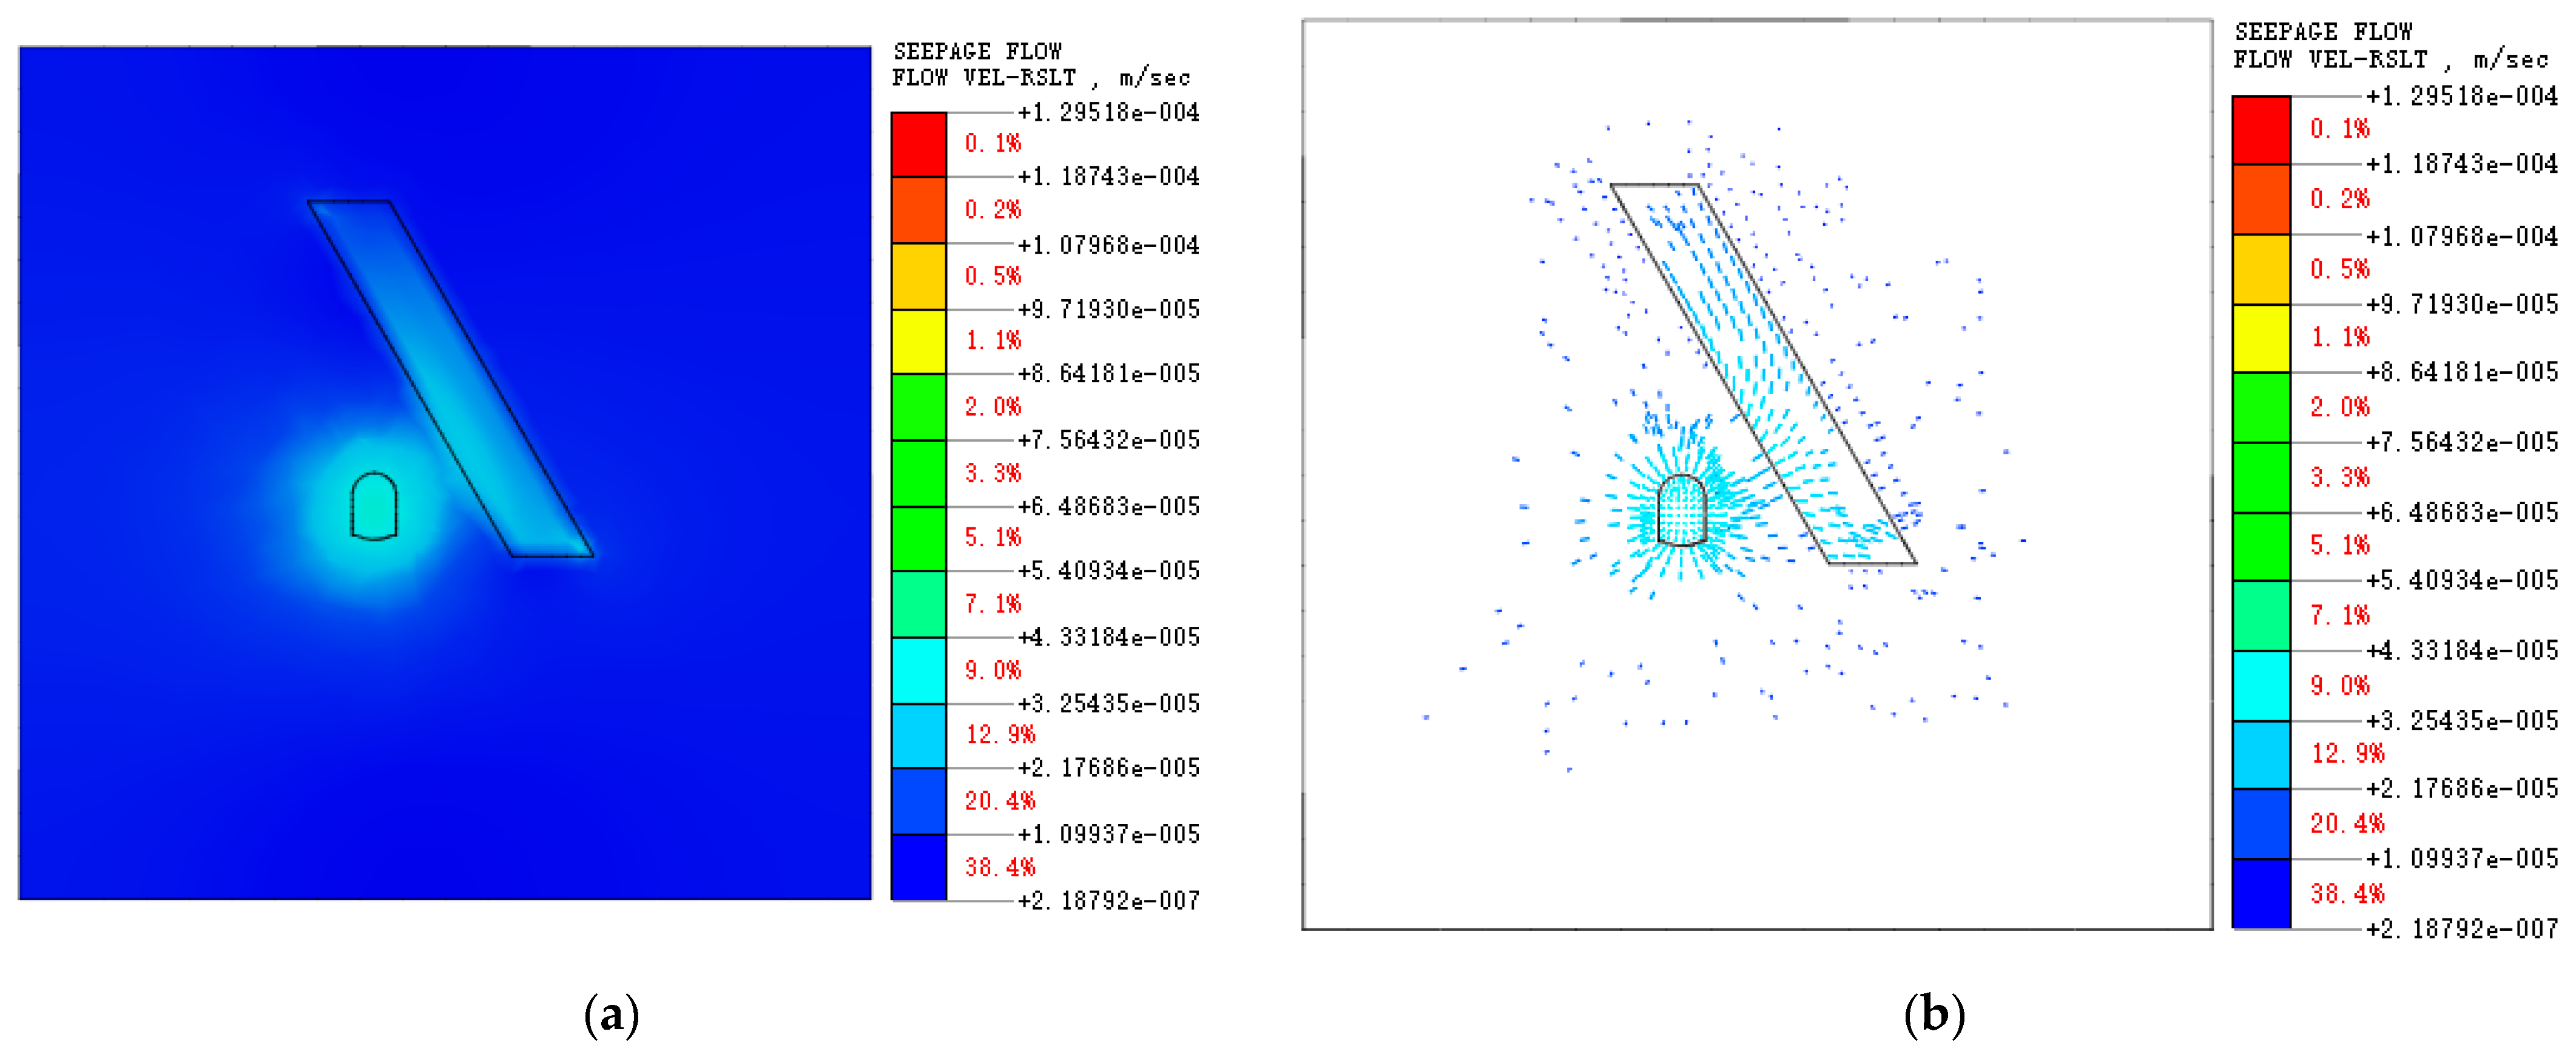
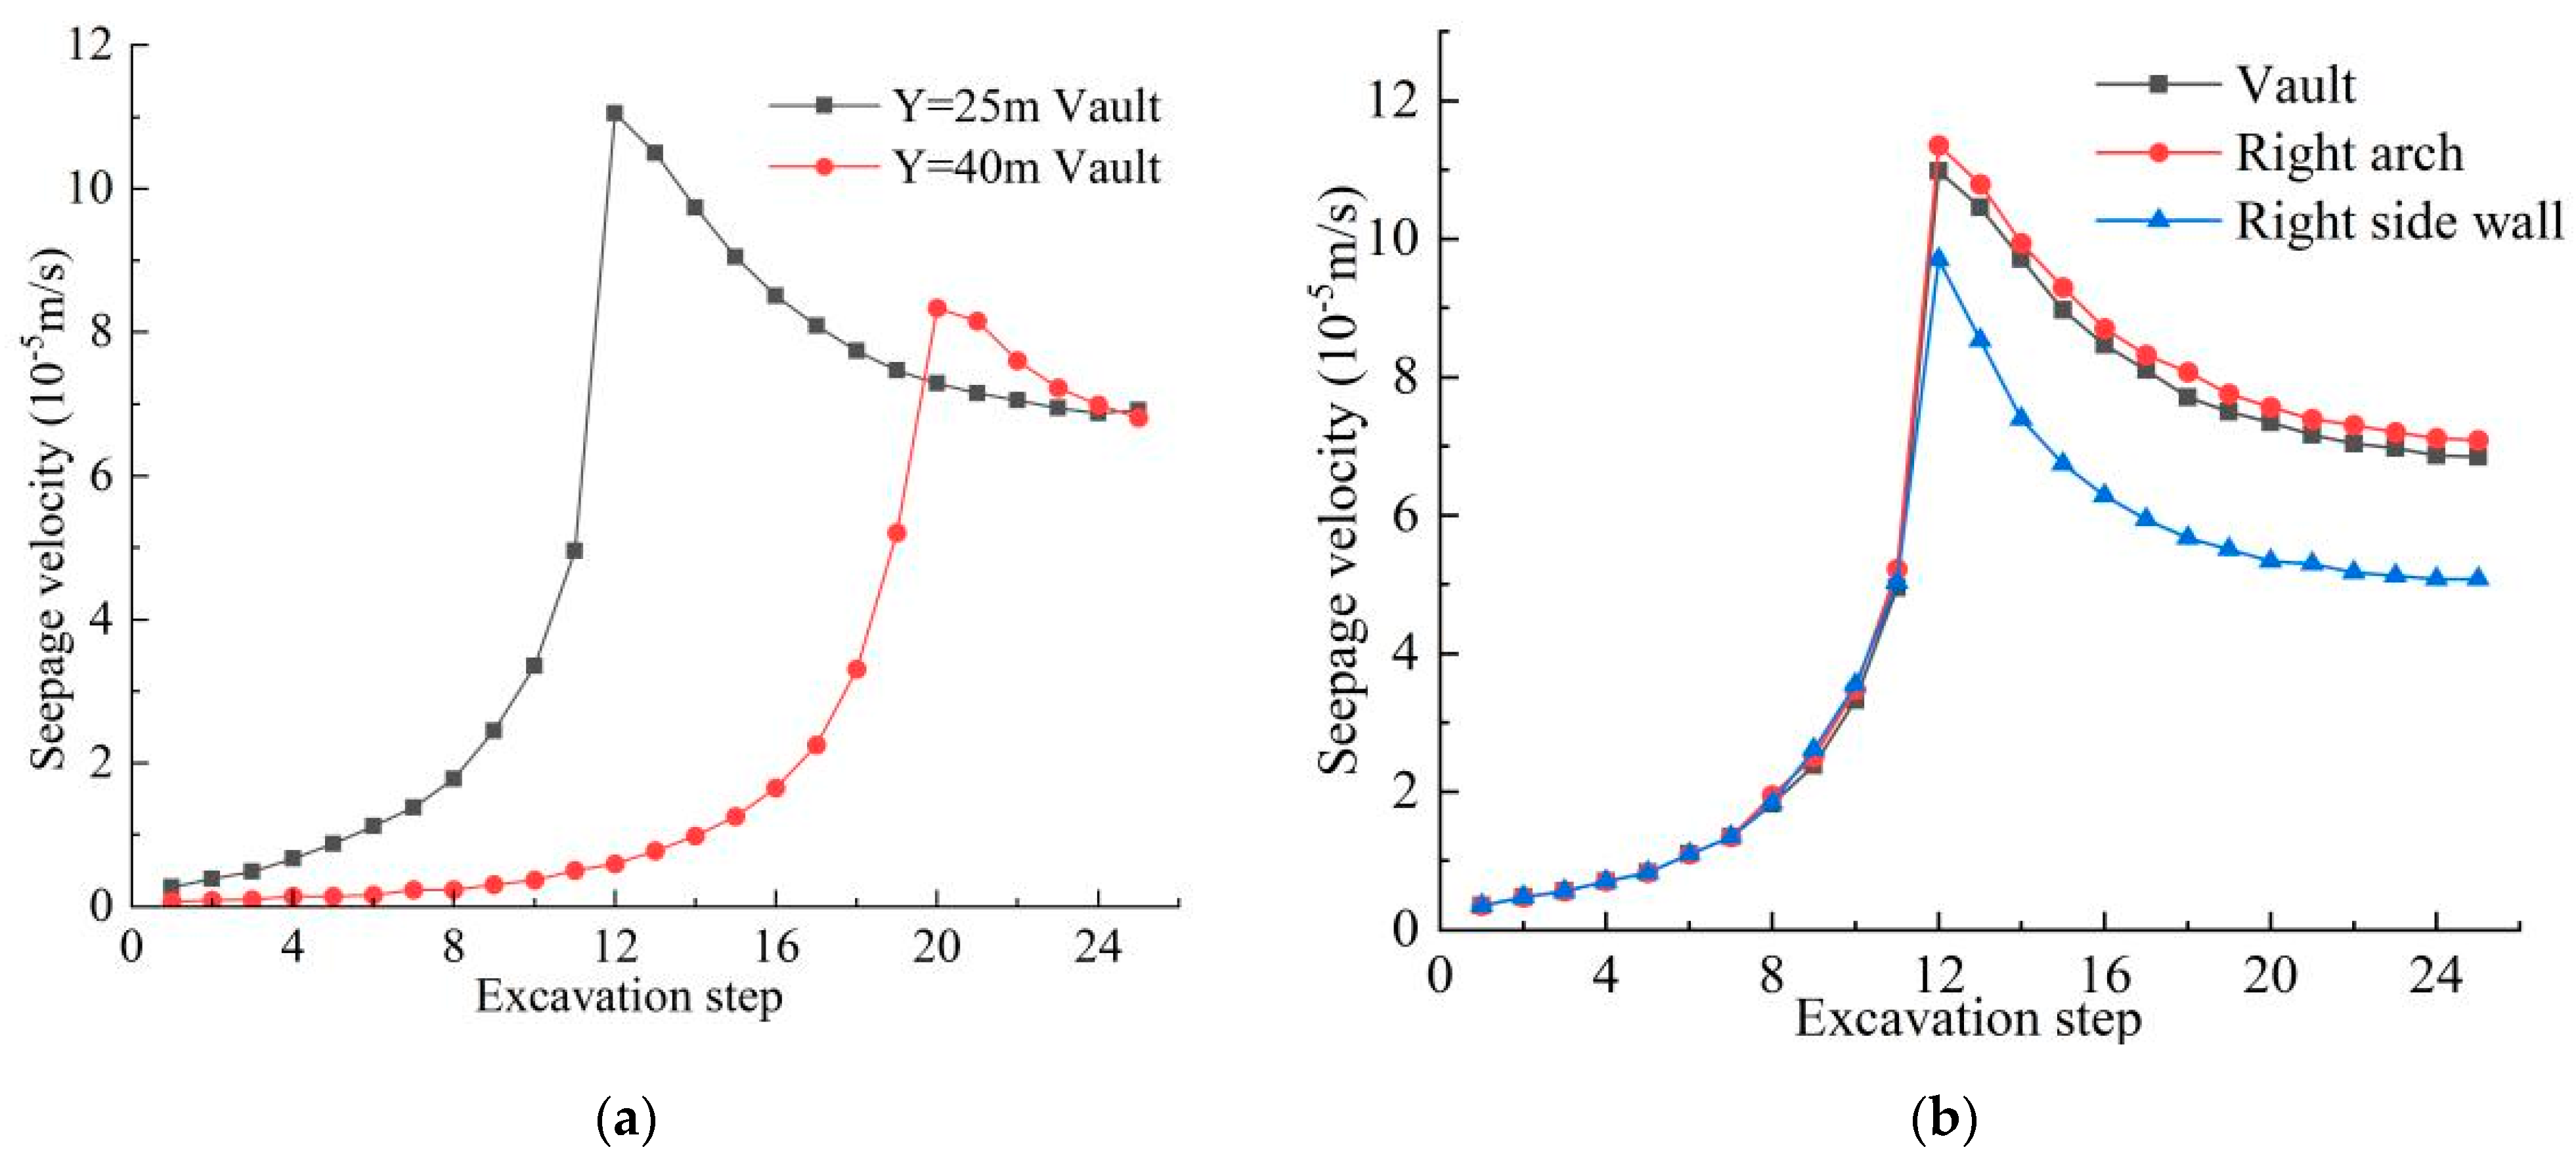
5.4. Analysis of Seepage Velocity Law

When conducting the analysis of seepage flow velocity within the surrounding rock and fault zone at each stage of tunnel excavation, the seepage flow velocity diagram at the Y = 25 m cross-section is selected as the analysis subject. The excavation progress of 20 m and 50 m is selected as the analysis stages. The velocity cloud maps for each analysis stage are shown in Figure 19 and Figure 20.
According to Figure 19, it can be observed that when the tunnel is excavated to 20 m, the high-velocity zone of the model is mainly located in the surrounding rock near the excavation face, along with the fault zone at positions closer to the excavation contour line. At this stage, the high-velocity zone of the surrounding rock is close to the high-velocity zone of the fault, indicating a tendency for groundwater to flow towards the rock mass at the location where the tunnel is to be excavated. From Figure 20, after tunnel excavation is completed, the distribution range of the high-velocity zone significantly increases. The high-velocity zone in the fault area is no longer confined within the fault but also appears outside at the upper left and lower right corners of the fault. In this stage, the connection between the high-velocity zones of the surrounding rock and the fault becomes more pronounced. The maximum velocity in the entire model is 8.463 × 10⁻⁵ m/s.
To study the variation of velocity at critical points with excavation stages, the Y = 25 m and Y = 40 m profiles are selected as monitoring sections. The vault, right arch ring, and right sidewall units of the profile are chosen as monitoring units for internal seepage flow velocity in the surrounding rock. The variation of seepage flow velocity at each monitoring point with excavation steps is shown in the Figure 21.
From Figure 21a, it can be seen that the seepage flow velocity of each monitoring section’s vault unit gradually increases before the excavation face exceeds the monitoring section. However, after the excavation face progresses beyond the monitoring section, the velocity of the vault unit decreases with the increase in excavation steps. Since the excavation face first advances to the Y = 25 m monitoring section, the seepage flow velocity of the vault unit at this section decreases earlier. From Figure 21b, during the tunnel excavation process, the variation trends of seepage flow velocity for the vault unit, right arch ring unit, and right sidewall unit on the monitoring section are basically the same. At the excavation step when the monitoring section is first exposed, the seepage flow velocity of the right arch ring unit is greater than that of the vault unit, followed by the right sidewall unit. This indicates that the tunnel’s location most susceptible to sudden water inflow when excavating using the full-face method is likely to be at the right arch ring position, where the tunnel is closest to the fault vertically.

6. Conclusions

(1)
Taking the Dazhushan Tunnel as the research background, a self-developed 3D physical model test system and similar materials were used to carry out physical model testing of water and mud inrush in a parallel fault. The evolution process of water inrush and mud inrush disasters in weak surrounding rocks was reproduced. Multiple pieces of information, such as the rock stress at different positions of the tunnel during excavation and water pressure loading stages, pore water pressure between the anti-rock mass and the fault interior, and images of the evolution process of water and mud inrush, were obtained. Among these, the optimal ratio of similar materials for the surrounding rock required for physical model testing is sand:red clay:cement:water = 80.27%:6.35%:4.68%:8.70%, and the optimal ratio of similar materials for filling faults is red clay:sand:gravel = 42%:42%:16%.
(2)
During the physical model test, as the tunnel is excavated, radial stress in the surrounding rock at the arch gradually decreases owing to stress releasing, while the vertical stress at the left and right walls gradually increases. Closer to the excavation contour line, the changes are more significant. During water pressure loading, pore water pressure at each measuring point increases with higher loading. Additionally, at the same loading conditions, pore water pressure decreases as the vertical distance from each point to the fault’s upper boundary increases. By non-linear fitting, the experimental values of the relative water pressure coefficient of monitoring points under various loading water pressures, and the exponential function relationship between the relative water pressure coefficient of any point in the outburst-prevention rock mass of the monitoring section and its vertical distance from the fault’s upper boundary, were obtained.
(3)
For the numerical simulation of the parallel fault excavation in the tunnel, the maximum vertical displacement is observed at the arch’s top and bottom, while the maximum horizontal displacement happens at the left and right walls. Excavation affects the vertical displacement of the arch vault more than the arch ring, while it has a greater impact on the horizontal displacement of the arch ring compared to the arch vault. The maximum principal stress value is mainly concentrated near the upper left and lower right corners of the arch wall and fault. The maximum and minimum principal stresses of the arch top unit will first increase, then decrease, and then increase again. The trend of the maximum and minimum principal stresses of the right arch ring unit is significantly different. The changes in the pore water pressure field are significant when the tunnel is excavated to 10 m and 50 m, showing a U-shaped distribution and a funnel-shaped distribution, respectively. The pore water pressure at each monitoring point decreases with the increase in excavation distance; the seepage flow velocity of each monitoring point shows a trend of first increasing and then decreasing, and the right arch, which is closer to the vertical distance from the fault, is most prone to water inrush. The results can provide relevant references for the prevention of water and mud inrush disasters due to other fault types in the future.

Author Contributions

Conceptualization, Y.G.; methodology, Y.G.; software, Y.G., S.L., S.M., L.Z. and H.Y.; validation, Y.G., S.L., S.M. and H.Y.; formal analysis, Y.G., S.L., Q.S., L.Z., X.L. and Y.N.; investigation, Y.G., S.L., S.M., Q.S., L.Z., H.Y., X.L. and Y.N.; resources, Y.G., S.L., S.M., L.Z., H.Y., X.L. and Y.N.; writing—original draft preparation, Y.G. and S.L.; writing—review and editing, S.M., Q.S., L.Z., H.Y., X.L. and Y.N.; funding acquisition, Y.G. All authors have read and agreed to the published version of the manuscript.

Funding

This study was supported by General projects of Yunnan Fundamental Research Projects (no. 202301AT070454); Special Project for Young Talents of Yunnan Province’s Xingdian Talent Support Program (no. KKXX202467043); The talent training fund of Kunming University of Science and Technology (no. KKZ3202367014); B-level Science and Technology Plan Project of Yunnan Construction Investment Holding Group Co., Ltd. (no. 2024DJR005); National Innovation and Entrepreneurship Training Project for College Student of China (no. 2021106740085 and 2021106740086); Youth Innovation and Entrepreneurship Training Program for College Students of Yunnan Province (no. S202310674163).

Data Availability Statement

All relevant data are within the paper.

Conflicts of Interest

Authors Shilin Mao, Qin Song and Lei Zheng were employed by the company Yunnan Construction Investment No. 6 Construction Co., Ltd. Authors Hang Yan and Xiaoqiang Li were employed by the company Third Engineering Company of Yunnan Jiaotong Highway Construction Co., Ltd. The remaining authors declare that the research was conducted in the absence of any commercial or financial relationships that could be construed as a potential conflict of interest.

References

  1. Li, S.C.; Xu, Z.H.; Huang, X.; Lin, P.; Zhao, X.C.; Zhang, Q.S.; Yang, L.; Zhang, X.; Sun, H.F.; Pan, D.D. Classification, geological identification, hazard mode and typical case studies of haz-ard-causing structures for water and mud inrush in tunnels. Chin. J. Rock Mech. Eng. 2018, 37, 1041–1069. [Google Scholar]
  2. Gao, M.; Xie, J.; Guo, J.; Lu, Y.; He, Z.; Li, C. Fractal evolution and connectivity characteristics of mining-induced crack networks in coal masses at different depths. Geomech. Geophys. Geo-Energy Geo-Resour. 2021, 7, 9. [Google Scholar] [CrossRef]
  3. Zhu, C.; Karakus, M.; He, M.; Meng, Q.; Shang, J.; Wang, Y.; Yin, Q. Volumetric deformation and damage evolution of Tibet interbedded skarn under multistage constant-amplitude-cyclic loading. Int. J. Rock Mech. Min. Sci. 2022, 152, 105066. [Google Scholar] [CrossRef]
  4. Hu, L.; Wang, J.; Karrech, A.; Li, X.; Zhao, P.; Liu, L. Exploring the frontiers of deep underground sciences and engineering—China Yun-long Lake Laboratory is striving to be the best. Deep. Undergr. Sci. Eng. 2022, 1, 131–137. [Google Scholar] [CrossRef]
  5. Sousa, R.L.; Einstein, H.H. Lessons from accidents during tunnel construction. Tunn. Undergr. Space Technol. 2021, 113, 103916. [Google Scholar] [CrossRef]
  6. He, M.; Sui, Q.; Tao, Z. Excavation compensation theory and supplementary technology system for large deformation disasters. Deep. Undergr. Sci. Eng. 2023, 2, 105–128. [Google Scholar] [CrossRef]
  7. Dou, Z.; Tang, S.; Zhang, X.; Liu, R.; Zhuang, C.; Wang, J.; Zhou, Z. Influence of shear displacement on fluid flow and solute transport in a 3D rough fracture. Lithosphere 2021, 2021, 1569736. [Google Scholar] [CrossRef]
  8. Tan, Y.; Lu, Y.; Wang, D. Catastrophic Failure of Shanghai metro line 4 in July, 2003: Occurrence, emergency response, and disaster relief. J. Perform. Constr. Facil. 2021, 35, 04020125. [Google Scholar] [CrossRef]
  9. Tan, Y.; Lu, Y.; Wang, D. Catastrophic failure of Shanghai Metro Line 4 in July 2003: Postaccident Rehabilitation. J. Perform. Constr. Facil. 2023, 37, 04023006. [Google Scholar] [CrossRef]
  10. Ma, D.; Rezania, M.; Yu, H.-S.; Bai, H.-B. Variations of hydraulic properties of granular sandstones during water inrush: Effect of small particle migration. Eng. Geol. 2017, 217, 61–70. [Google Scholar] [CrossRef]
  11. Zhang, L.W.; Wu, J.; Zhang, X.Y. Mechanism of water inrush from the tunnel face induced by fault and its application. J. Cent. South Univ. 2023, 30, 934–946. [Google Scholar] [CrossRef]
  12. Li, Z.H.; Feng, G.R.; Zhai, C.Z. Study on “triangle” water-inrush mode of strong water-guide collapse column. J. Cent. South Univ. 2016, 23, 2402–2409. [Google Scholar] [CrossRef]
  13. Tang, R.; Li, S.Q.; Wang, J.; Xiang, L.; Xie, W. Research on Mechanism and Treatment Technology of Water lnrush and Mud lnrush in Tunnel of Water-rich Fault Zone. Chin. J. Undergr. Space Eng. 2021, 17, 1264–1272+1290. [Google Scholar]
  14. Liu, J.; Chen, W.; Liu, T.; Yu, J.; Dong, J.; Nie, W. Effects of Initial Porosity and Water Pressure on Seepage-Erosion Properties of Water Inrush in Completely Weathered Granite. Geofluids 2018, 11, 4103645. [Google Scholar]
  15. Huang, Z.; Li, X.Z.; Li, S.J.; Zhao, K.; Xu, H.W.; Wu, R. Research and development of similar material for liquid-solid coupling and its application in tunnel water-inrush model test. J. Cent. South Univ. (Sci. Technol.) 2018, 49, 3029–3039. [Google Scholar]
  16. Huang, Z.; Li, S.J.; Zhao, K.; Wu, Y.; Wu, Z. Liquid-solid Coupling Model Test to Investigate Seepage Failure Mechanism of Intact Con-fining Rocks of Tunnels. J. Basic Sci. Eng. 2019, 27, 1345–1356. [Google Scholar]
  17. Wang, K.; Li, S.C.; Zhang, Q.S.; Zhang, X.; Li, L.P.; Zhang, Q.Q.; Liu, C. Development and application of new similar materials of surrounding rock for a flu-id-solid coupling model test. Rock Soil Mech. 2016, 37, 2521–2533. [Google Scholar]
  18. Guo, Y.; Kong, Z.; He, J.; Yan, M. Development and Application of the 3D Model Test System for Water and Mud Inrush of Water-Rich Fault Fracture Zone in Deep Tunnels. Math. Probl. Eng. 2021, 16, 8549094. [Google Scholar] [CrossRef]
  19. Hu, D.; Li, Y.; Yang, X.; Liang, X.; Zhang, K.; Liang, X. Experiment and Application of NATM Tunnel Deformation Monitoring Based on 3D Laser Scanning. Struct. Control Health Monit. 2023, 2023, 3341788. [Google Scholar] [CrossRef]
  20. Liu, H.; Yue, Y.; Lian, Y.; Meng, X.; Du, Y.; Cui, J. Reverse-time migration of GPR data for imaging cavities behind a reinforced shield tunnel. Tunn. Undergr. Space Technol. 2024, 146, 105649. [Google Scholar] [CrossRef]
  21. Yin, H.; Wu, Q.; Yin, S.; Dong, S.; Dai, Z.; Soltanian, M.R. Predicting mine water inrush accidents based on water level anomalies of borehole groups using long short-term memory and isolation forest. J. Hydrol. 2023, 616, 128813. [Google Scholar] [CrossRef]
  22. Hu, D.; Hu, Y.; Yi, S.; Liang, X.; Li, Y.; Yang, X. Surface Settlement Prediction of Rectangular Pipe-Jacking Tunnel Based on the Machine-Learning Algorithm. J. Pipeline Syst. Eng. Pract. 2023, 15, 04023061. [Google Scholar] [CrossRef]
  23. Zhang, X.; Zhu, H.; Jiang, X.; Broere, W. Distributed fiber optic sensors for tunnel monitoring: A state-of-the-art review. J. Rock Mech. Geotech. Eng. 2024, in press. [CrossRef]
  24. Zhang, X.H.; Broere, W. Design of a distributed optical fiber sensor system for measuring immersed tunnel joint deformations. Tunn. Undergr. Space Technol. 2023, 131, 104770. [Google Scholar] [CrossRef]
  25. Golian, M.; Teshnizi, E.S.; Nakhaei, M. Prediction of water inflow to mechanized tunnels during tunnel-boring-machine advance using numerical simulation. Hydrogeol. J. 2018, 26, 2827–2851. [Google Scholar] [CrossRef]
  26. Moon, J.; Fernandez, G. Effect of excavation-induced groundwater level drawdown on tunnel inflow in a jointed rock mass. Eng. Geol. 2010, 110, 33–42. [Google Scholar] [CrossRef]
  27. Bahrami, S.; Ardejani, F.D.; Aslani, S.; Baafi, E. Numerical modelling of the groundwater inflow to an advancing open pit mine: Kolahdarvazeh pit, Central Iran. Environ. Monit. Assess. 2014, 186, 8573–8585. [Google Scholar] [CrossRef]
  28. He, H.; Wang, S.; Shen, W.; Zhang, W. The influence of pipe-jacking tunneling on the deformation of existing tunnels in soft soils and the effectiveness of protection measures. Transp. Geotech. 2023, 42, 101061. [Google Scholar] [CrossRef]
  29. Cai, M.; Kaiser, P.; Morioka, H.; Minami, M.; Maejima, T.; Tasaka, Y.; Kurose, H. FLAC/PFC coupled numerical simulation of AE in large-scale underground excavations. Int. J. Rock Mech. Min. Sci. 2007, 44, 550–564. [Google Scholar] [CrossRef]
  30. Jiang, A.; Zheng, S.; Wang, S. Stress-seepage-damage coupling modelling method for tunnel in rich water region. Eng. Comput. 2019, 37, 2659–2683. [Google Scholar] [CrossRef]
  31. Sweetenham, M.G.; Maxwell, R.M.; Santi, P.M. Assessing the timing and magnitude of precipitation-induced seepage into tunnels bored through fractured rock. Tunn. Undergr. Space Technol. 2017, 65, 62–75. [Google Scholar] [CrossRef]
  32. Farhadian, H.; Katibeh, H.; Huggenberger, P.; Butscher, C. Optimum model extent for numerical simulation of tunnel inflow in fractured rock. Tunn. Undergr. Space Technol. 2016, 60, 21–29. [Google Scholar] [CrossRef]
  33. Zhang, X.; Sanderson, D.J.; Barker, A.J. Numerical study of fluid flow of deforming fractured rocks using dual permeability model. Geophys. J. Int. 2002, 151, 452–468. [Google Scholar] [CrossRef]
  34. Zhao, K.; Janutolo, M.; Barla, G.; Chen, G. 3D simulation of TBM excavation in brittle rock associated with fault zones: The Brenner Exploratory Tunnel case. Eng. Geol. 2014, 181, 93–111. [Google Scholar] [CrossRef]
  35. Wang, M.; Feng, Y.T.; Owen DR, J.; Qu, T.M. A novel algorithm of immersed moving boundary scheme for fluid–particle interactions in DEM–LBM. Comput. Methods Appl. Mech. Eng. 2019, 346, 109–125. [Google Scholar] [CrossRef]
  36. Ma, D.; Li, Q.; Cai, K.-C.; Zhang, J.-X.; Li, Z.-H.; Hou, W.-T.; Sun, Q.; Li, M.; Du, F. Understanding water inrush hazard of weak geological structure in deep mine engineering: A seepage-induced erosion model considering tortuosity. J. Central South Univ. 2023, 30, 517–529. [Google Scholar] [CrossRef]
  37. Wu, P.; Fang, Z.; Wang, X.; Zhu, G. Reliability evaluation and prediction of deep buried tunnel based on similarity theory and model test. KSCE J. Civ. Eng. 2023, 27, 2654–2665. [Google Scholar] [CrossRef]
  38. Li, Z.; Lv, S.; Zhao, J.; Liu, L.; Hu, K. Research on the experimental system of reinforcing the base of shallow buried and wet collapsible loess tunnels. Buildings 2023, 13, 1740. [Google Scholar] [CrossRef]
  39. Zheng, Q.; Zhang, X.; Shen, Y.S.; Qiu, J.T.; Wang, Y.D.; Chen, K.F. Failure mechanism of segmental lining structure in fault-crossing tunnel: An experimental and numerical investigation. J. Cent. South Univ. 2023, 30, 2392–2410. [Google Scholar] [CrossRef]
  40. Chen, D.; Wang, L.; Versaillot, P.D.; Sun, C. Triaxial creep damage characteristics of sandstone under high crustal stress and its constitutive model for engineering application. Deep. Undergr. Sci. Eng. 2023, 2, 262–273. [Google Scholar] [CrossRef]
  41. Jiang, X.; Zhang, X.; Zhang, X.; Long, L.; Bai, Y.; Huang, B. Advancing Shallow Tunnel Construction in Soft Ground: The Pipe-Umbrella Box Jacking Method. Transp. Res. Rec. J. Transp. Res. Board 2024, 1–19. [Google Scholar] [CrossRef]
  42. Zhang, X.H.; Chen, J.; Bai, Y.; Chen, A.; Huang, D.Z. Ground surface deformation induced by quasi-rectangle EPB shield tunneling. J. Zhejiang Univ. (Eng. Sci.) 2018, 52, 317–324. [Google Scholar] [CrossRef]
  43. Han, X.; Ye, F.; Han, X.; Ren, C.; Song, J.; Zhao, R. Mechanical responses of underground carriageway structures due to construction of metro tunnels beneath the existing structure: A case study. Deep. Undergr. Sci. Eng. 2024, 3, 231–246. [Google Scholar] [CrossRef]
Figure 1. Geological location map around Dazhu Mountain tunnel.
Buildings 14 02220 g001
Figure 2. Raw materials for configuring fluid–solid coupling similar materials.
Buildings 14 02220 g002
Figure 3. Three-dimensional physical model test system.
Buildings 14 02220 g003
Figure 4. Layout plan of measurement points.
Buildings 14 02220 g004
Figure 5. The final test installation diagram before excavation.
Buildings 14 02220 g005
Figure 6. Total stress variation of measured points in various excavation stages: (a) radial stress variation; (b) vertical stress around the hole; (c) vertical stress at 1 times the diameter of the hole; (d) vertical stress at 2 times the diameter of the hole.
Buildings 14 02220 g006
Figure 7. Evolution of water and mud inrush.
Buildings 14 02220 g007
Figure 8. The variation laws of pore water pressure at different monitoring points.
Buildings 14 02220 g008
Figure 9. Variation of relative water pressure coefficient with distance S of outburst-proof rock mass under distinct loading water pressure: (a) loading pressure 10 kPa; (b) loading pressure 15 kPa; (c) loading pressure 20 kPa; (d) loading pressure 25 kPa; (e) loading pressure 30 kPa; (f) loading pressure 35 kPa; (g) loading pressure 40 kPa; (h) loading pressure 45 kPa.
Buildings 14 02220 g009aBuildings 14 02220 g009b
Figure 10. Simulation scheme of parallel fault excavation.
Buildings 14 02220 g010
Figure 11. Numerical calculation model of fluid–solid coupling in tunnel excavation.
Buildings 14 02220 g011
Figure 12. Displacement nephogram of surrounding rock when the tunnel is excavated to 48 m: (a) vertical displacement; (b) horizontal displacement.
Buildings 14 02220 g012
Figure 13. Location diagram of key monitoring points.
Buildings 14 02220 g013
Figure 14. The displacement variation of the vault and right arch ring at the Y = 26 section: (a) displacement variation of the vault; (b) displacement variation of the right arch ring.
Buildings 14 02220 g014
Figure 15. Principal stress nephogram of surrounding rock when the tunnel is excavated to 30 m: (a) maximum principal stress; (b) minimum principal stress.
Buildings 14 02220 g015
Figure 16. The variation law of principal stress in each monitoring unit: (a) principal stress of vault; (b) principal stress of right arch ring.
Buildings 14 02220 g016
Figure 17. Nephogram of pore water pressure when the tunnel is excavated to 10 m and 50 m: (a) when the tunnel is excavated to 10 m; (b) when the tunnel is excavated to 50 m.
Buildings 14 02220 g017
Figure 18. Variation law of pore water pressure at measuring points: (a) variation law of at P point and right arch ring; (b) variation law of vault.
Buildings 14 02220 g018
Figure 19. Seepage flow velocity map of tunnel excavation for 20 m: (a) flow velocity cloud map; (b) flow velocity vector map.
Buildings 14 02220 g019
Figure 20. Seepage flow velocity map of tunnel excavation for 50 m: (a) flow velocity cloud map; (b) flow velocity vector map.
Buildings 14 02220 g020
Figure 21. Flow velocity comparison diagram of each monitoring unit: (a) flow velocity of vault unit; (b) velocity of Y = 25 section monitoring units.
Buildings 14 02220 g021
Table 1. Parameters of surrounding rock and similar materials.
MaterialsBulk Density
(kN/m3)
Compressive Strength
(MPa)
Permeability
Coefficient
(cm/s)
Surrounding rock20~23384.23 × 10−4
Ideal similar materials16.67~19.170.395.62 × 10−5
Tested similar materials17.860.405.58 × 10−5
Table 2. Relative water pressure coefficients of each measuring point under distinct loading water pressure.
Measuring PointsLoading Water Pressure/kPa
1015202530354045
4-10.1350.1470.1230.1690.1610.1430.1510.145
4-20.3480.2580.2520.2760.2520.2430.2420.240
4-311111111
Table 3. Relevant parameters of fitting curve under distinct loading water pressures.
ParametersLoading Water Pressure/kPa
1015202530354045
a9.034013.322415.103011.127913.095614.828614.471715.0029
b0.17620.20760.21750.19330.20630.21610.21420.2171
R-Square0.99940.97710.98770.96910.96570.97490.96930.9727
Table 4. Relevant parameters of tunnel excavation simulation.
Material TypeBulk Density
(kN/m3)
Saturated Bulk Density
(kN/m3)
Elastic Modulus (GPa)Cohesion
(MPa)
Internal Friction Angle
(°)
Poisson’s RatioPermeability Coefficient
(cm/s)
Class IV surrounding rock21.722.54.110.632.540.324.13 × 10−4
Fault17180.90.05220.304.02 × 10−3
Disclaimer/Publisher’s Note: The statements, opinions and data contained in all publications are solely those of the individual author(s) and contributor(s) and not of MDPI and/or the editor(s). MDPI and/or the editor(s) disclaim responsibility for any injury to people or property resulting from any ideas, methods, instructions or products referred to in the content.

