
The Consistency of Subjective and Objective Factors Influencing Walking Path Choice around Rail Transit Stations


Abstract
:1. Introduction
2. Literature Review
2.1. Research on Walking Path Choice Behavior
2.2. Research on the Influence of Built Environment and Social Attributes on Wayfinding Behavior
2.3. Research on the Consistency of Subjective and Objective Factors
2.4. Research Gap
- How can the built environment of walking paths within a rail transit station area be described?
- Do objective built environment factors and subjective perception factors jointly influence path choice decisions during pedestrian travel? If so, what is the relationship between the two?
- Can the interaction between these subjective and objective factors be quantified?
2.5. Motivations and Contributes
- (1)
- We propose a set of basic pathfinding models and a system of descriptive indicators that can be used to describe the characteristics of the built environment elements of walking paths in railway station areas;
- (2)
- An analytical process for comparing the consistency of subjective and objective factors is constructed by combining the basic principles of neuroscience with the results of research on “environment-behavior” interactions in the field of urban science;
- (3)
- The laws and mechanisms of the influence of path-built environmental factors on the synergistic effects of subjectivity and objectivity are analyzed, and on this basis, the indirect influence paths of individual socio-economic attributes are explored in depth;
- (4)
- Based on the discussion of subjective and objective consistency, we propose urban design strategies that can enhance the level of service of walking paths in urban rail station areas.
3. Research Methods and Processes
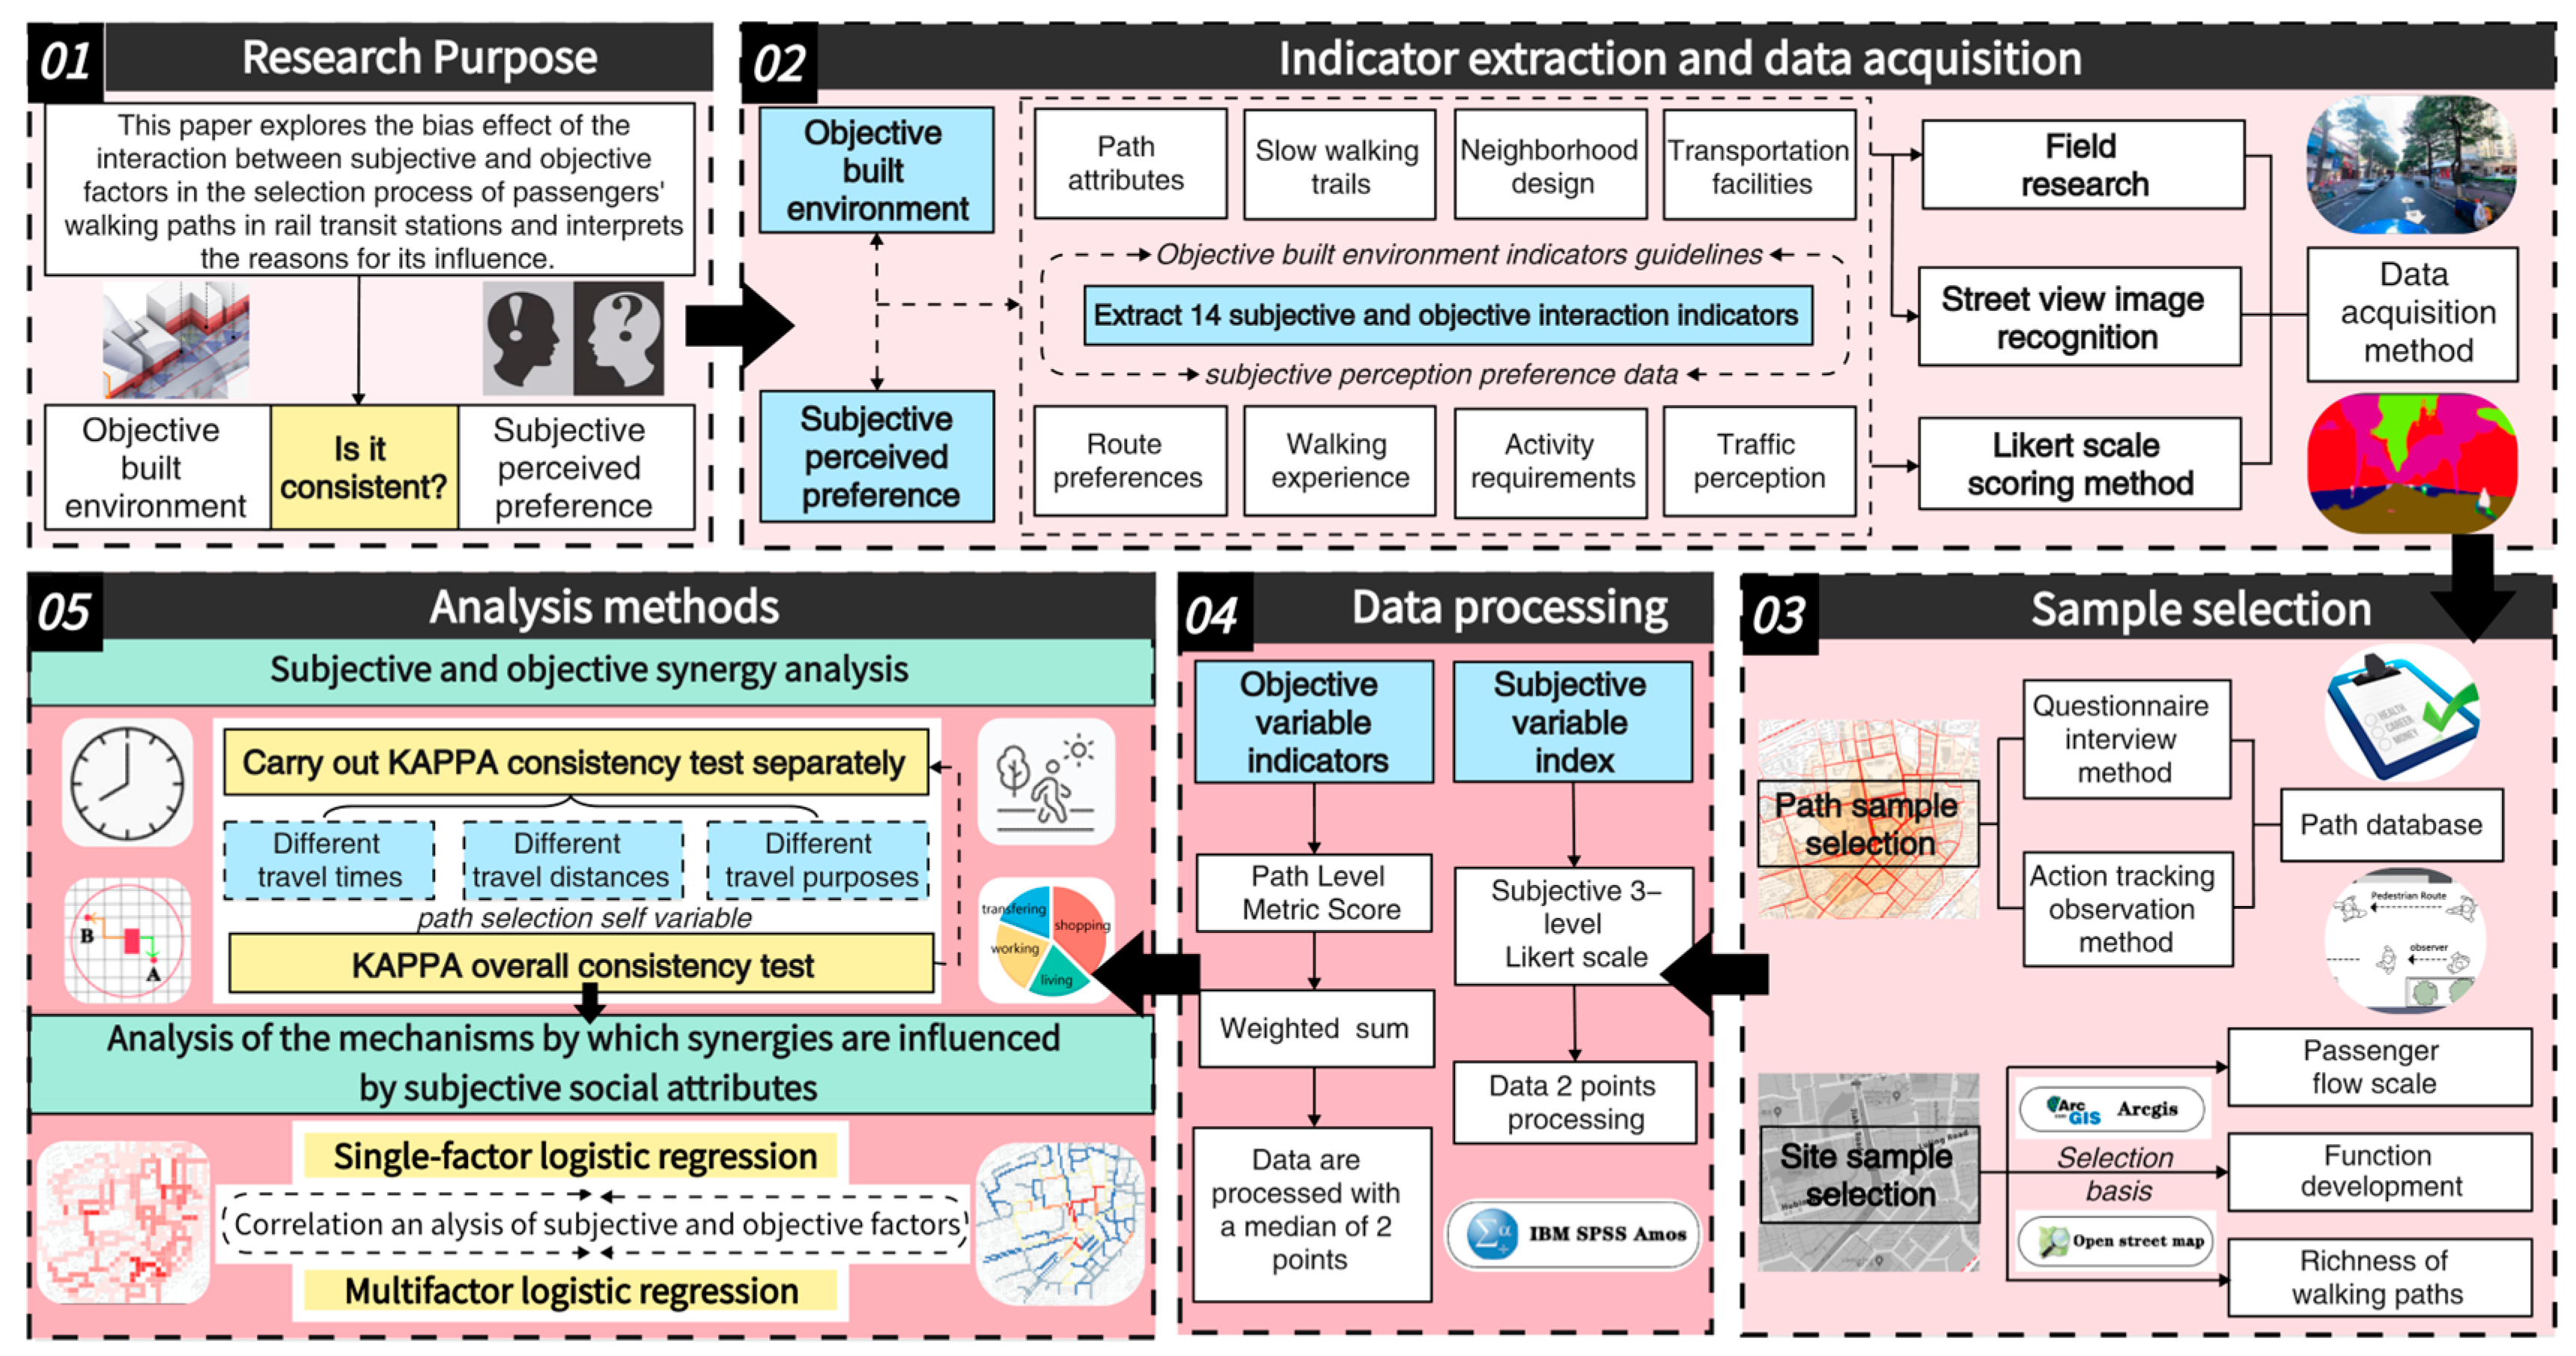
3.1. Research Framework
- (1)
- It analyzes the synergistic mechanism between subjective perception and objective environment, and the results produced, as the basis for determining the dependent variable in the later section;
- (2)
- Based on the references and combined with the field research, it determines the objective built environment indicator system applicable to describing the basic characteristics of walking paths in the station area;
- (3)
- Based on the objective environment indicators, combined with the established scholars’ research, it determines the content and reasonable acquisition method of subjective environmental perception indicators;
- (4)
- Based on the characteristics of the data required by the Kappa consistency test method, it processes the subjective and objective data to form the commonality indicators and conduct quantitative analyses;
- (5)
- It introduces multivariate logistic regression to analyze the influence relationship between the socio-economic attributes of the individual and the types of subjective and objective synergistic effects. The overall process is shown in Figure 5.
3.1.1. Relevance of Subjective Perception to the Objective Environment
3.1.2. Access to Objective Environmental Elements
- (1)
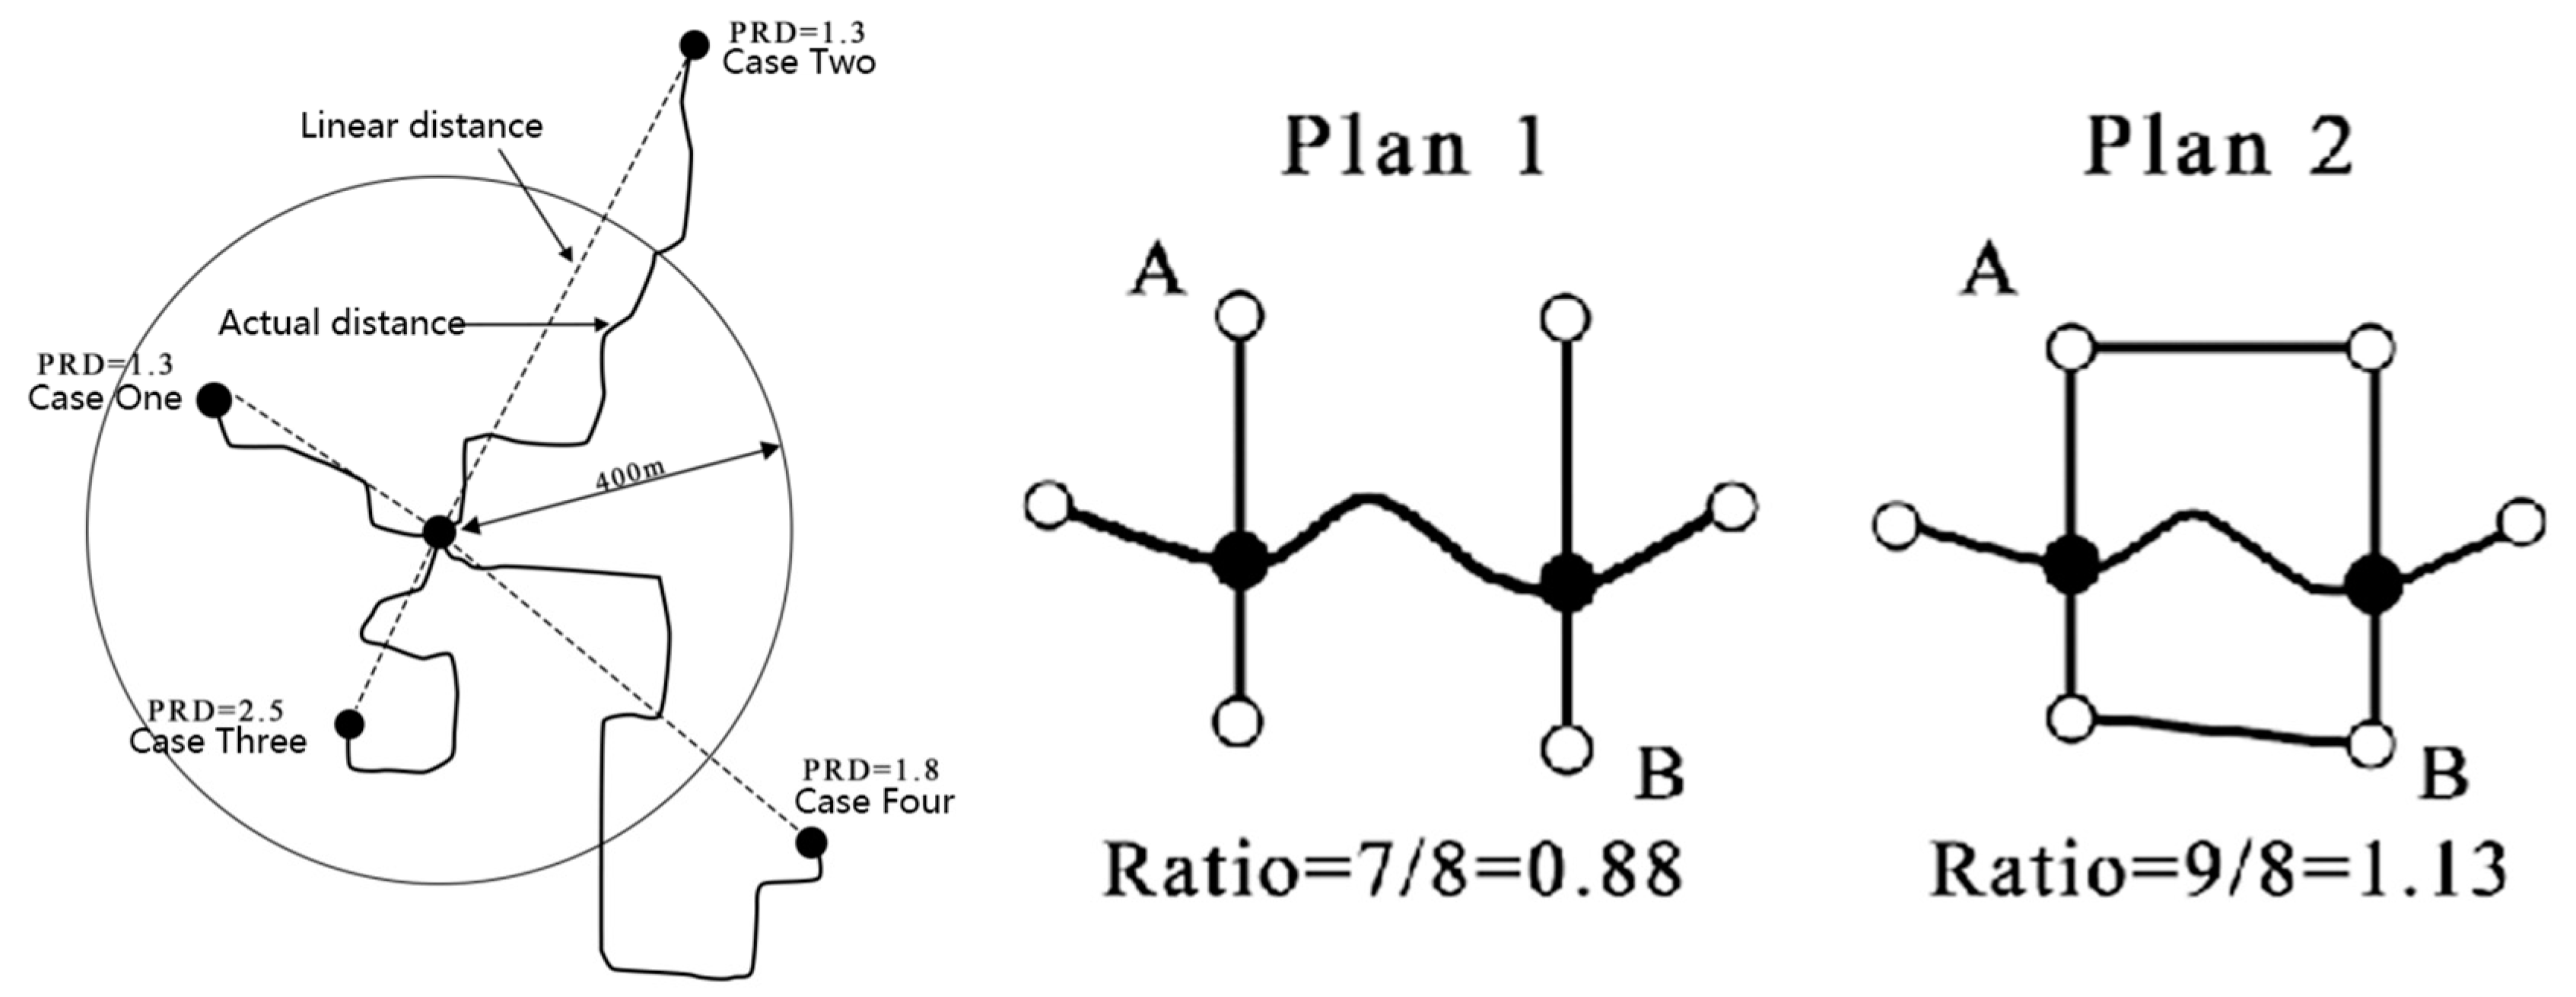
- Inherent Attributes of the Path: These include detour degree, length, direction, etc.
- (2)
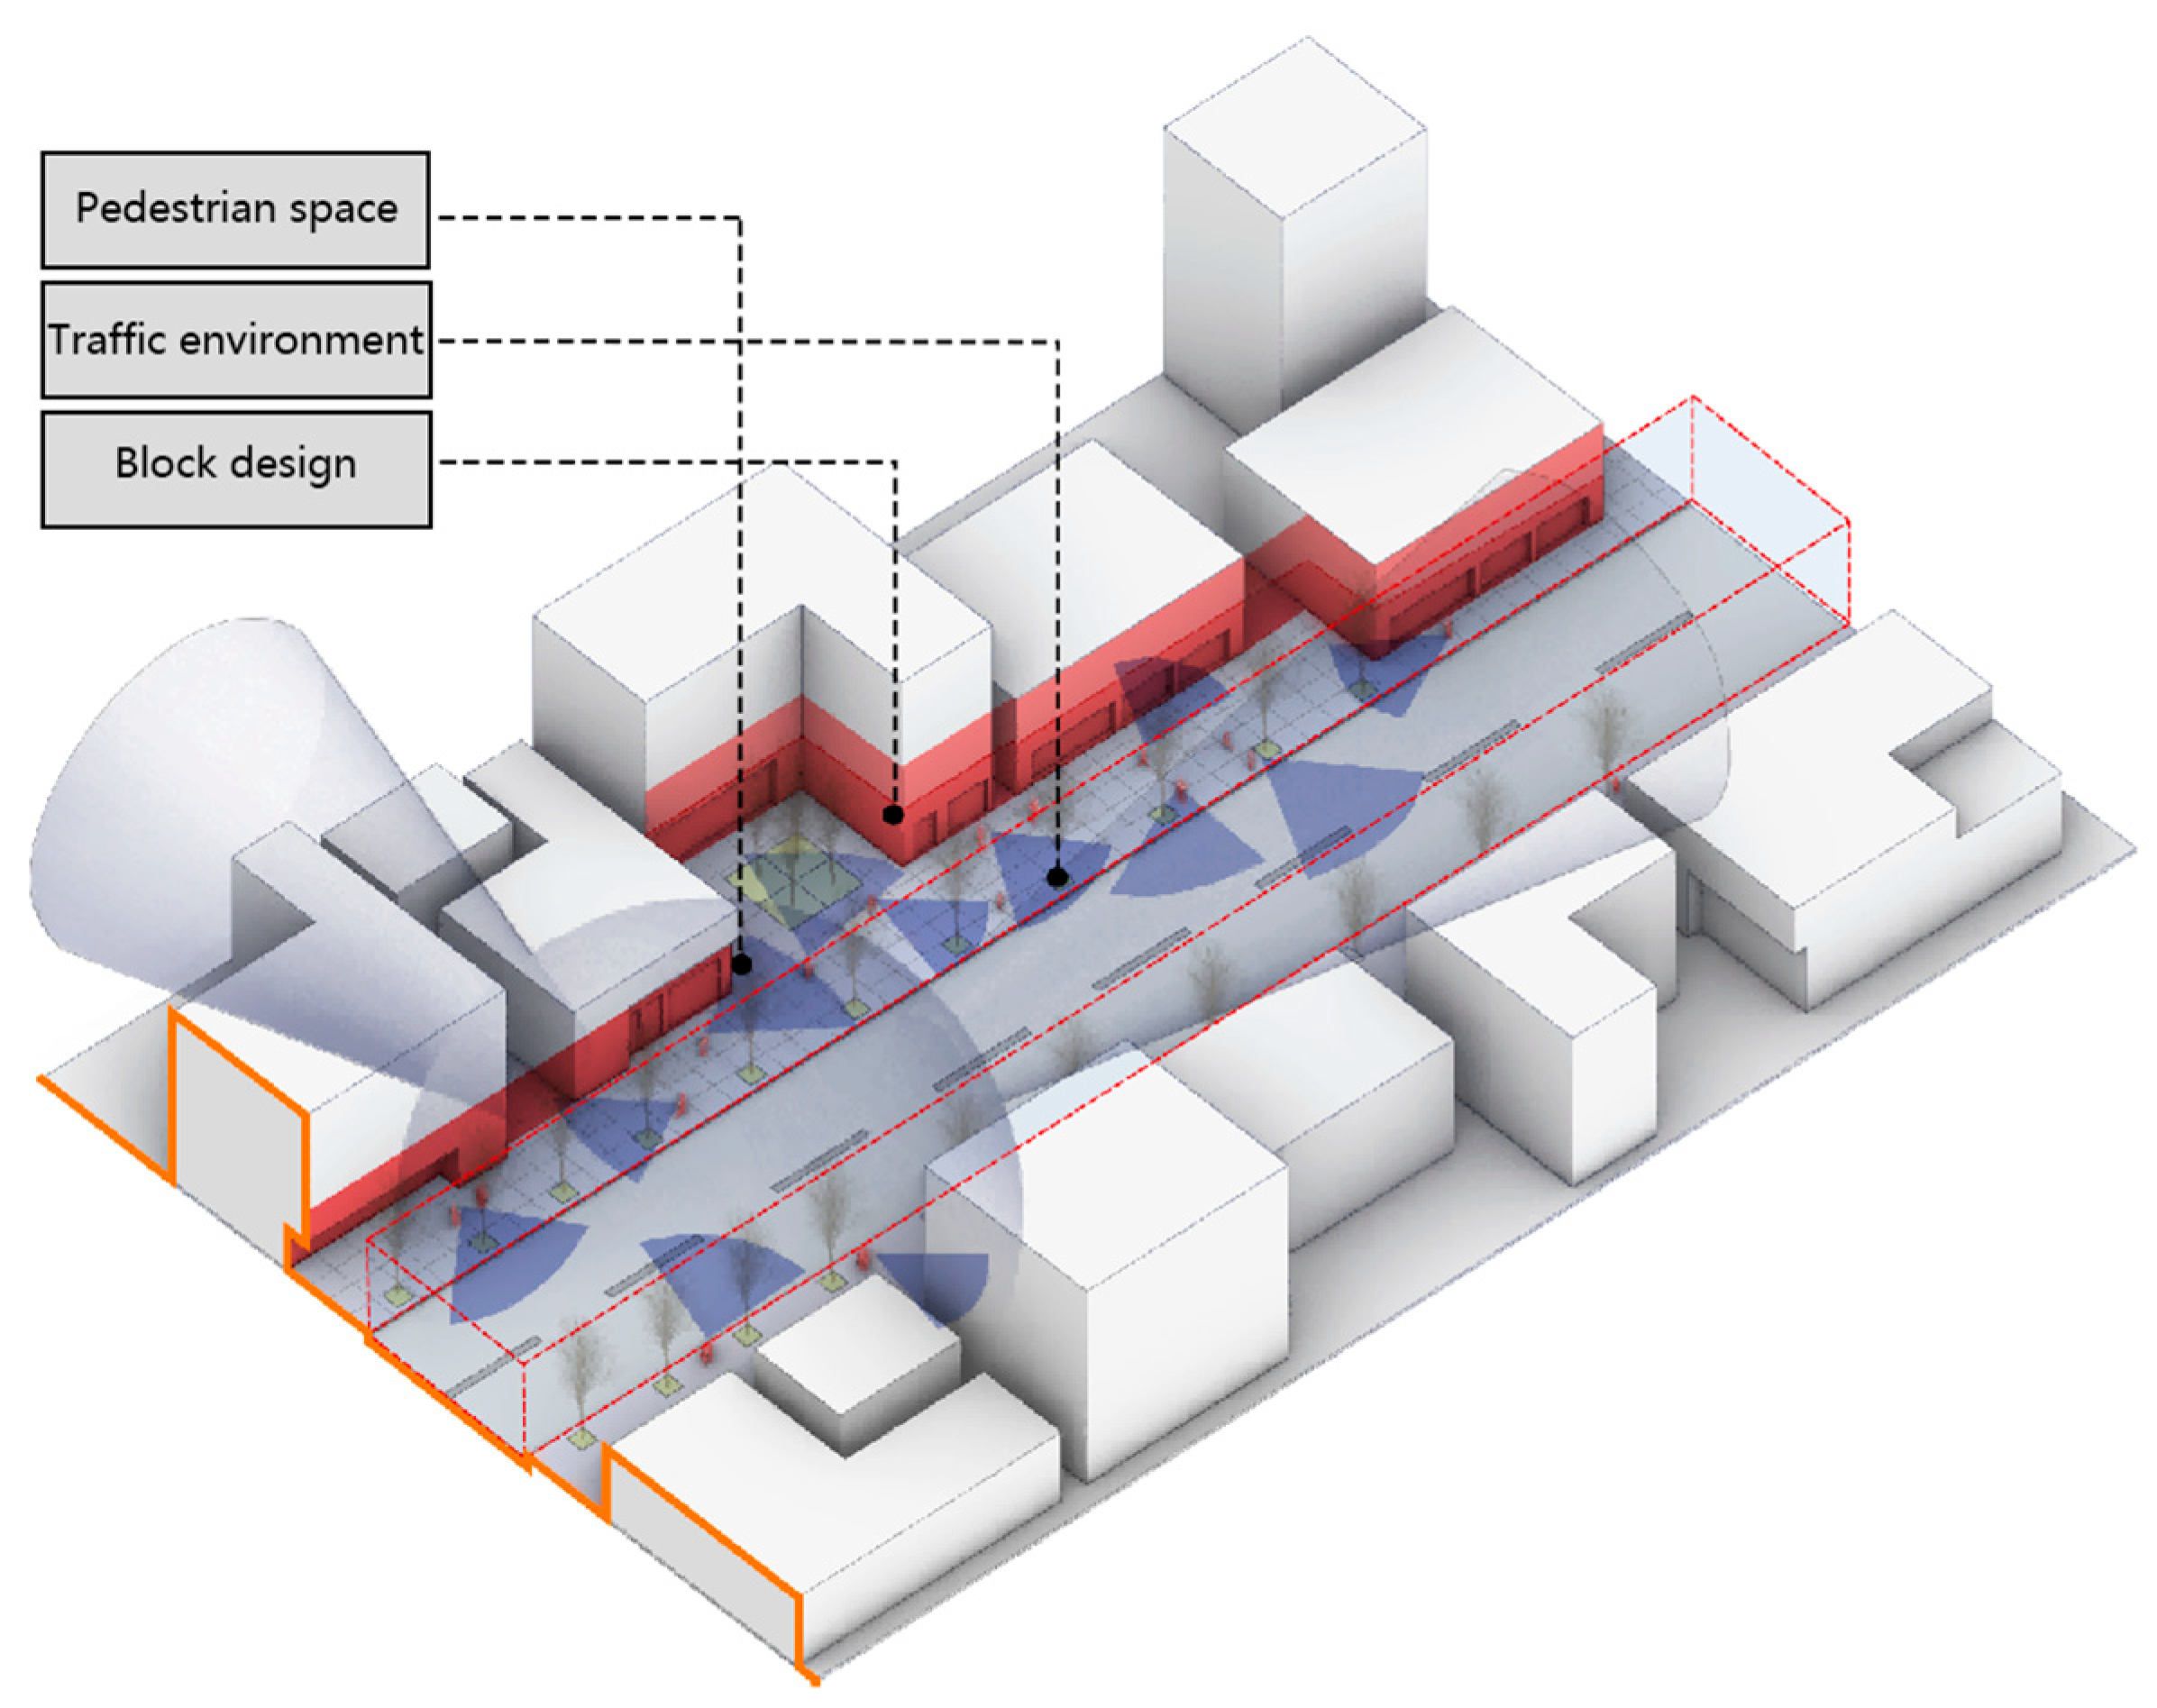
- Built Environment Along the Path: Scholars have described the built environment from land use, transportation facilities, and urban design perspectives. This paper adopts a similar method, applying these three elements to the street level. Numerous scholars have summarized environmental factor indicators in built environment and transportation behavior research [44,45], but these are not directly applicable to path studies. Figure 7 below illustrates the decomposition of walking path elements into walking space, street block function, and transportation facilities [46,47].
- Walking space: This includes walking experience, walking barriers, and walking aids.
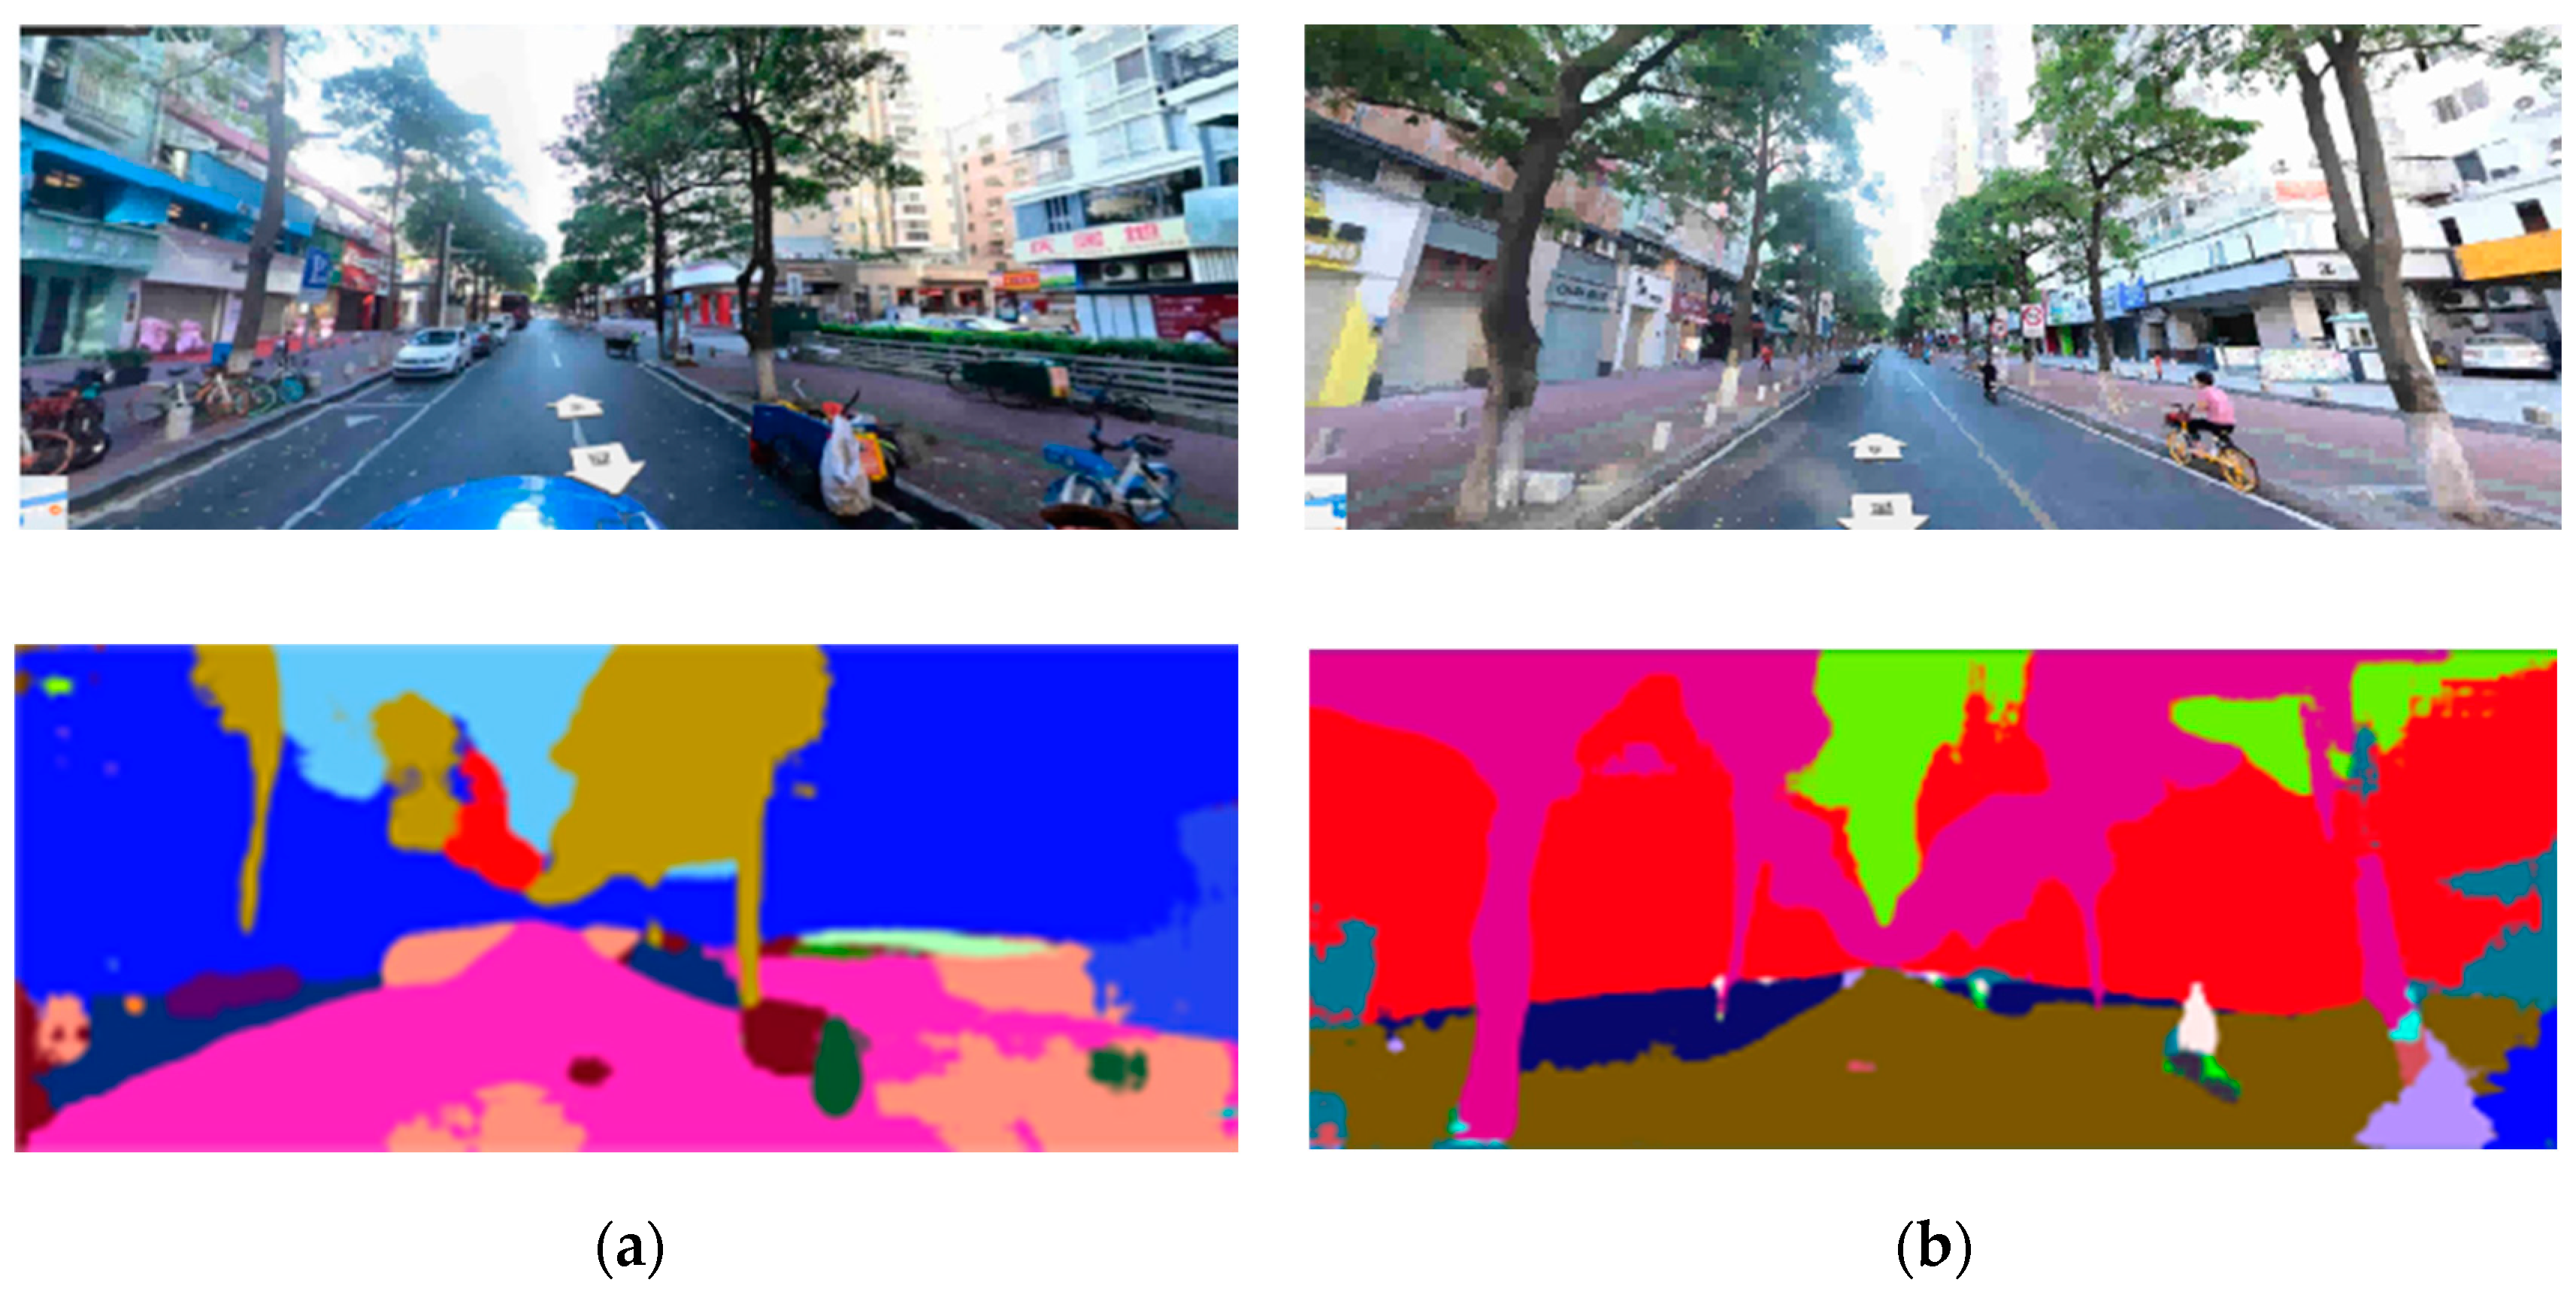
- Neighborhood Environment Along the Path: These mainly include street form characteristics (height–width ratio, building density, etc.), facility types, and landscape levels. Factors like street activity facility diversity, the proximity of street shops to walkways, and window visibility have been proven to affect walking activities, though their specific effects vary.
- Traffic Environment: This is primarily considered from the aspects of walking safety and convenience.
Walking Space
3.1.3. Subjective Perceptual Indicators of Walking Wayfinding
3.1.4. Subjective and Objective Factor Interaction Metrics
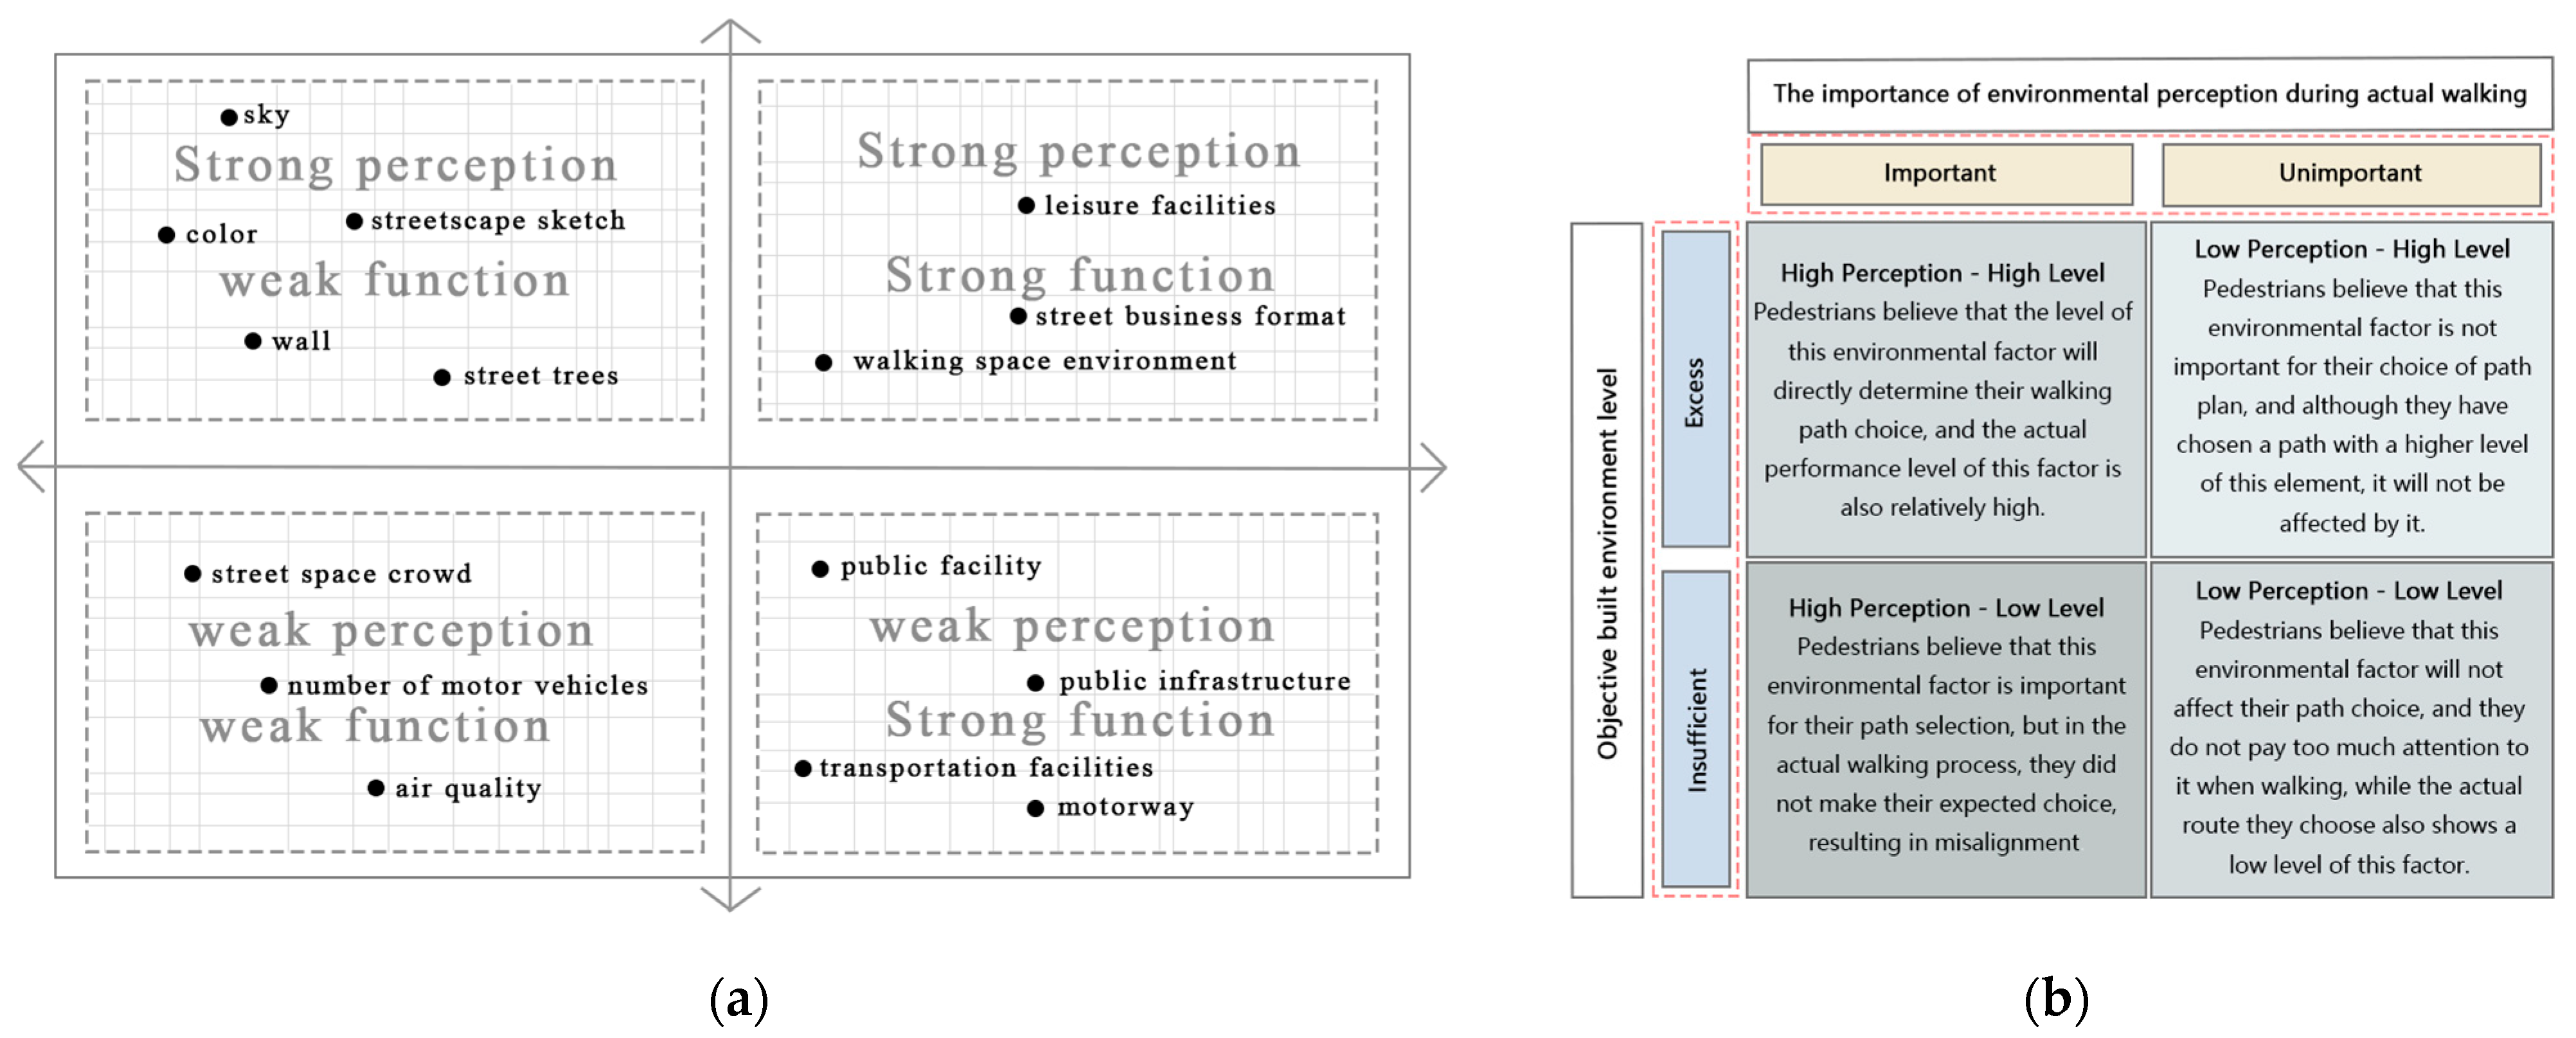
- Based on the subjective questions, we calculate the weights of objective indicators for weighted summation. Since there are many objective indicators, the weight factors are determined using principal component analysis. The total score of the comprehensive objective indicators is calculated and the median is taken as the threshold to convert continuous variable values into binary variables. Scores below the median are coded as 0, and those above are coded as 1, indicating the high and low levels of the factor in question [59,60,61].
- The results of the three-level Likert scale are dichotomized (combining 0 and 1 indicates that the factor is not important for decision making), forming positive or negative cognitive attitudes that correspond to the high and low levels of objective scores. This creates the four types of subjective–objective interaction proposed earlier.
- After completing the data processing, we perform consistency tests and subsequent analysis.
3.1.5. Process of Subject–Objective Perceptual Consistency Analysis
- Selection and Establishment of Subjective and Objective Influence Parameters: Based on the characteristics and components of walking paths, we extract the objective built environment description indicators. We convert these into subjective cognitive parameters and further refine interactive indicators for consistency comparison analysis, clarifying their corresponding relationships.
- Comprehensive Scoring of Common Objective Built Environment Influence Parameters: Using a weighted summation method, we derive comprehensive scores for objective built environment parameters and combine them with subjective scoring data. We standardize the data for mutual comparison.
- Consistency Analysis from Two Perspectives: We classify the data from both perspectives and perform consistency analysis on the entire path sample and path samples under different travel scenarios. We visualize the path data to describe the interaction of subjective and objective factors from both mathematical and spatial perspectives and analyze the causes of deviation.
3.2. Kappa Consistency Test
3.3. Multinomial Logit Regression
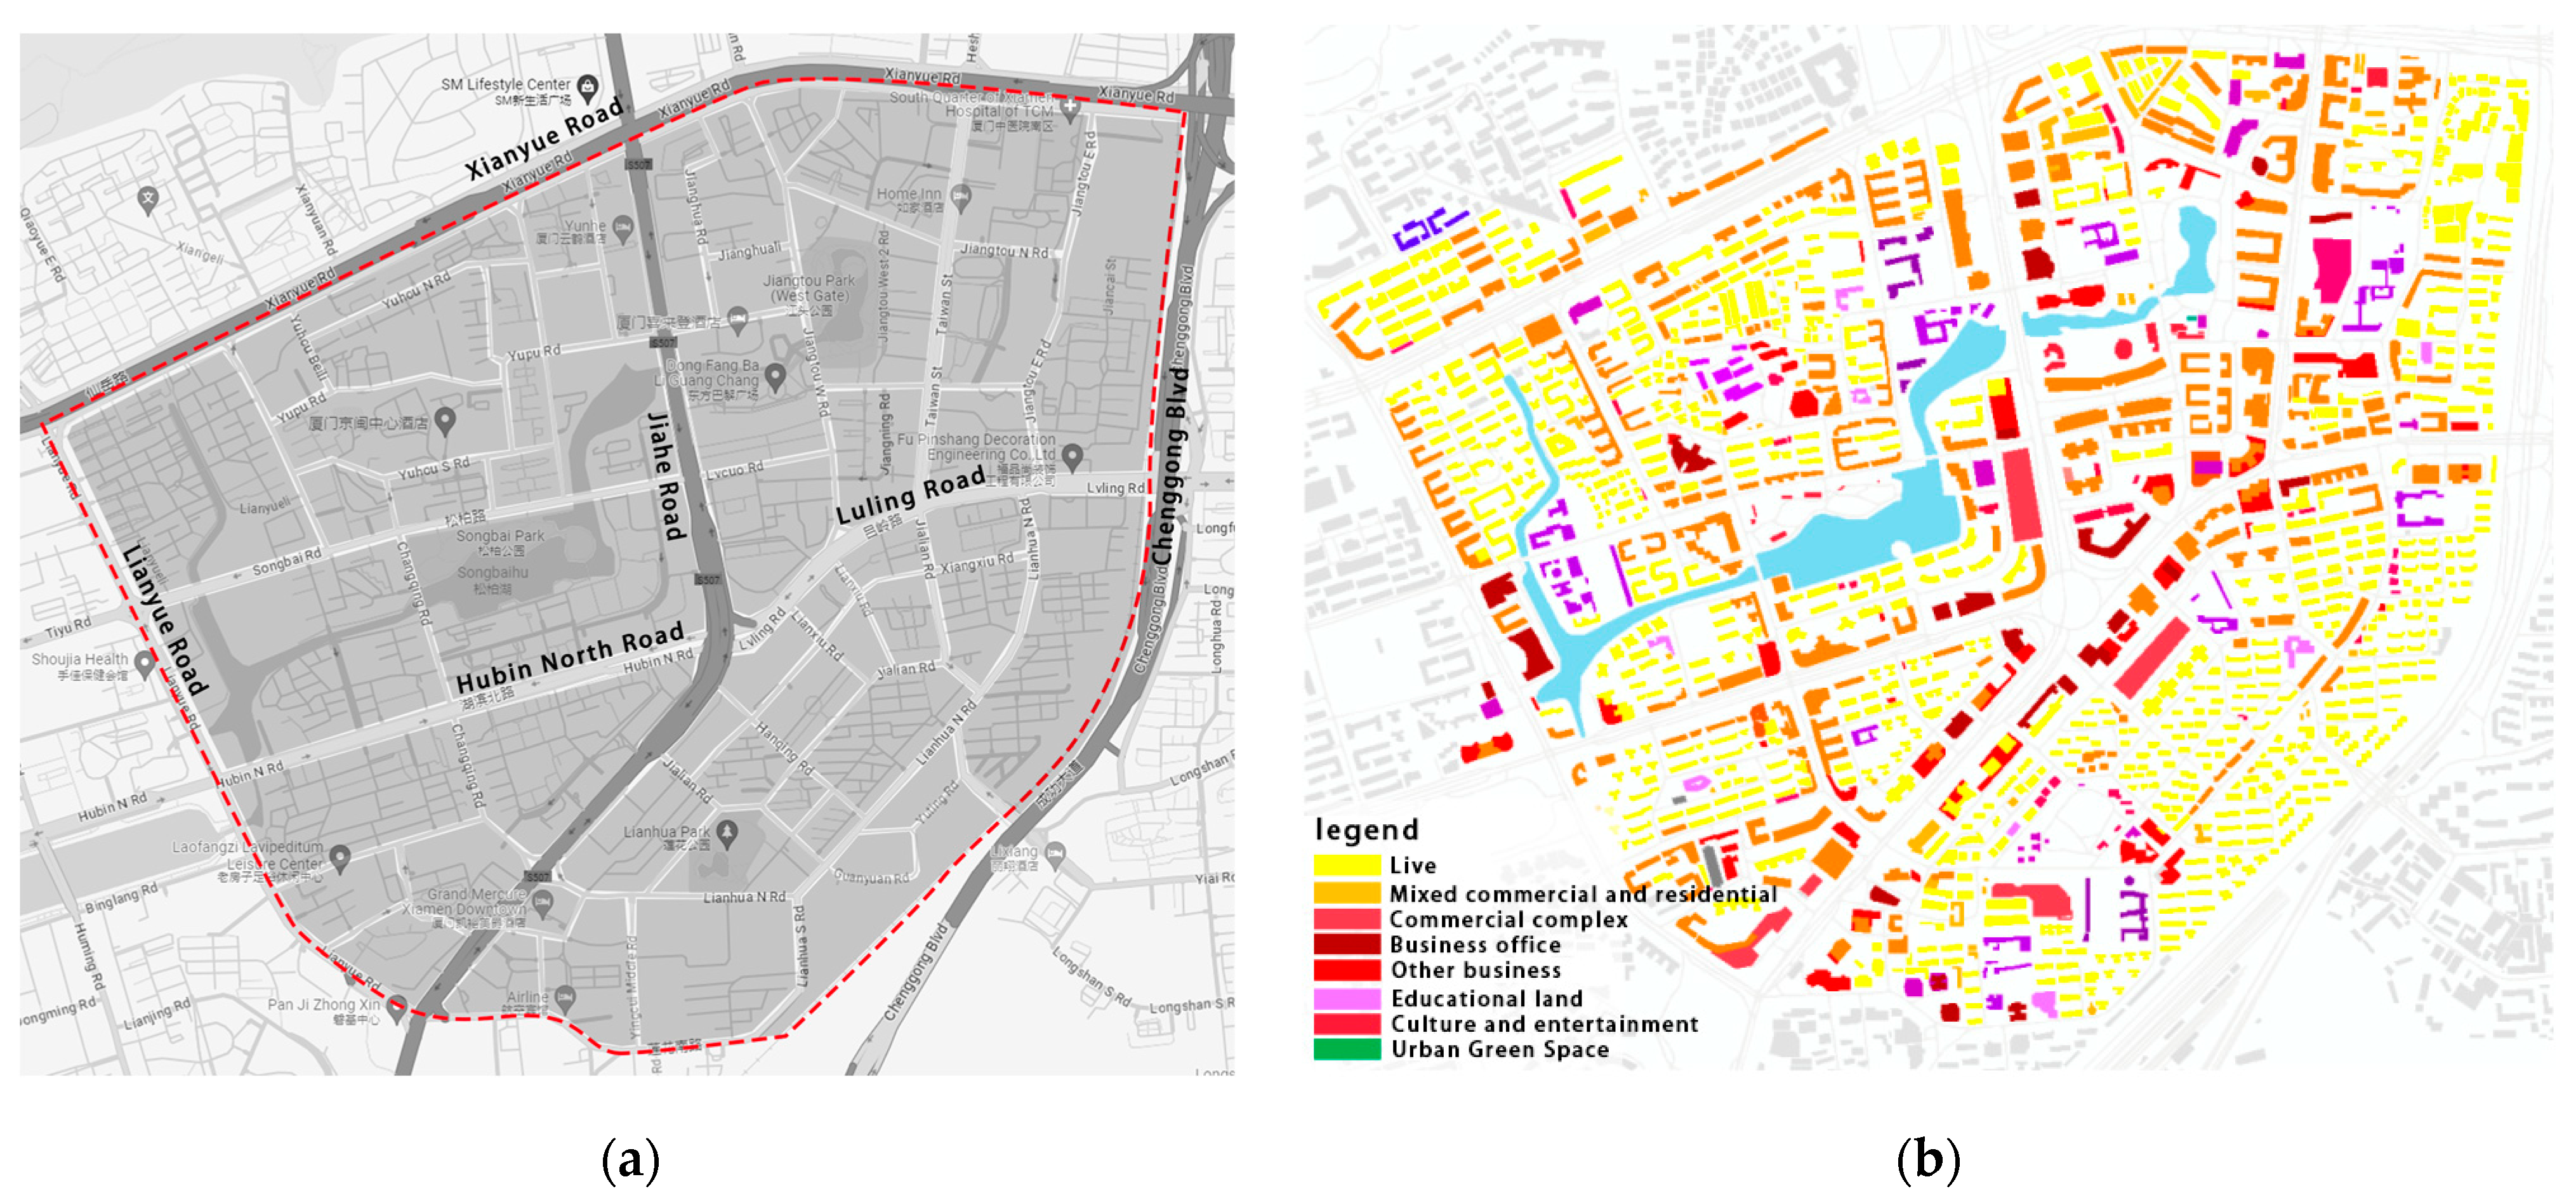
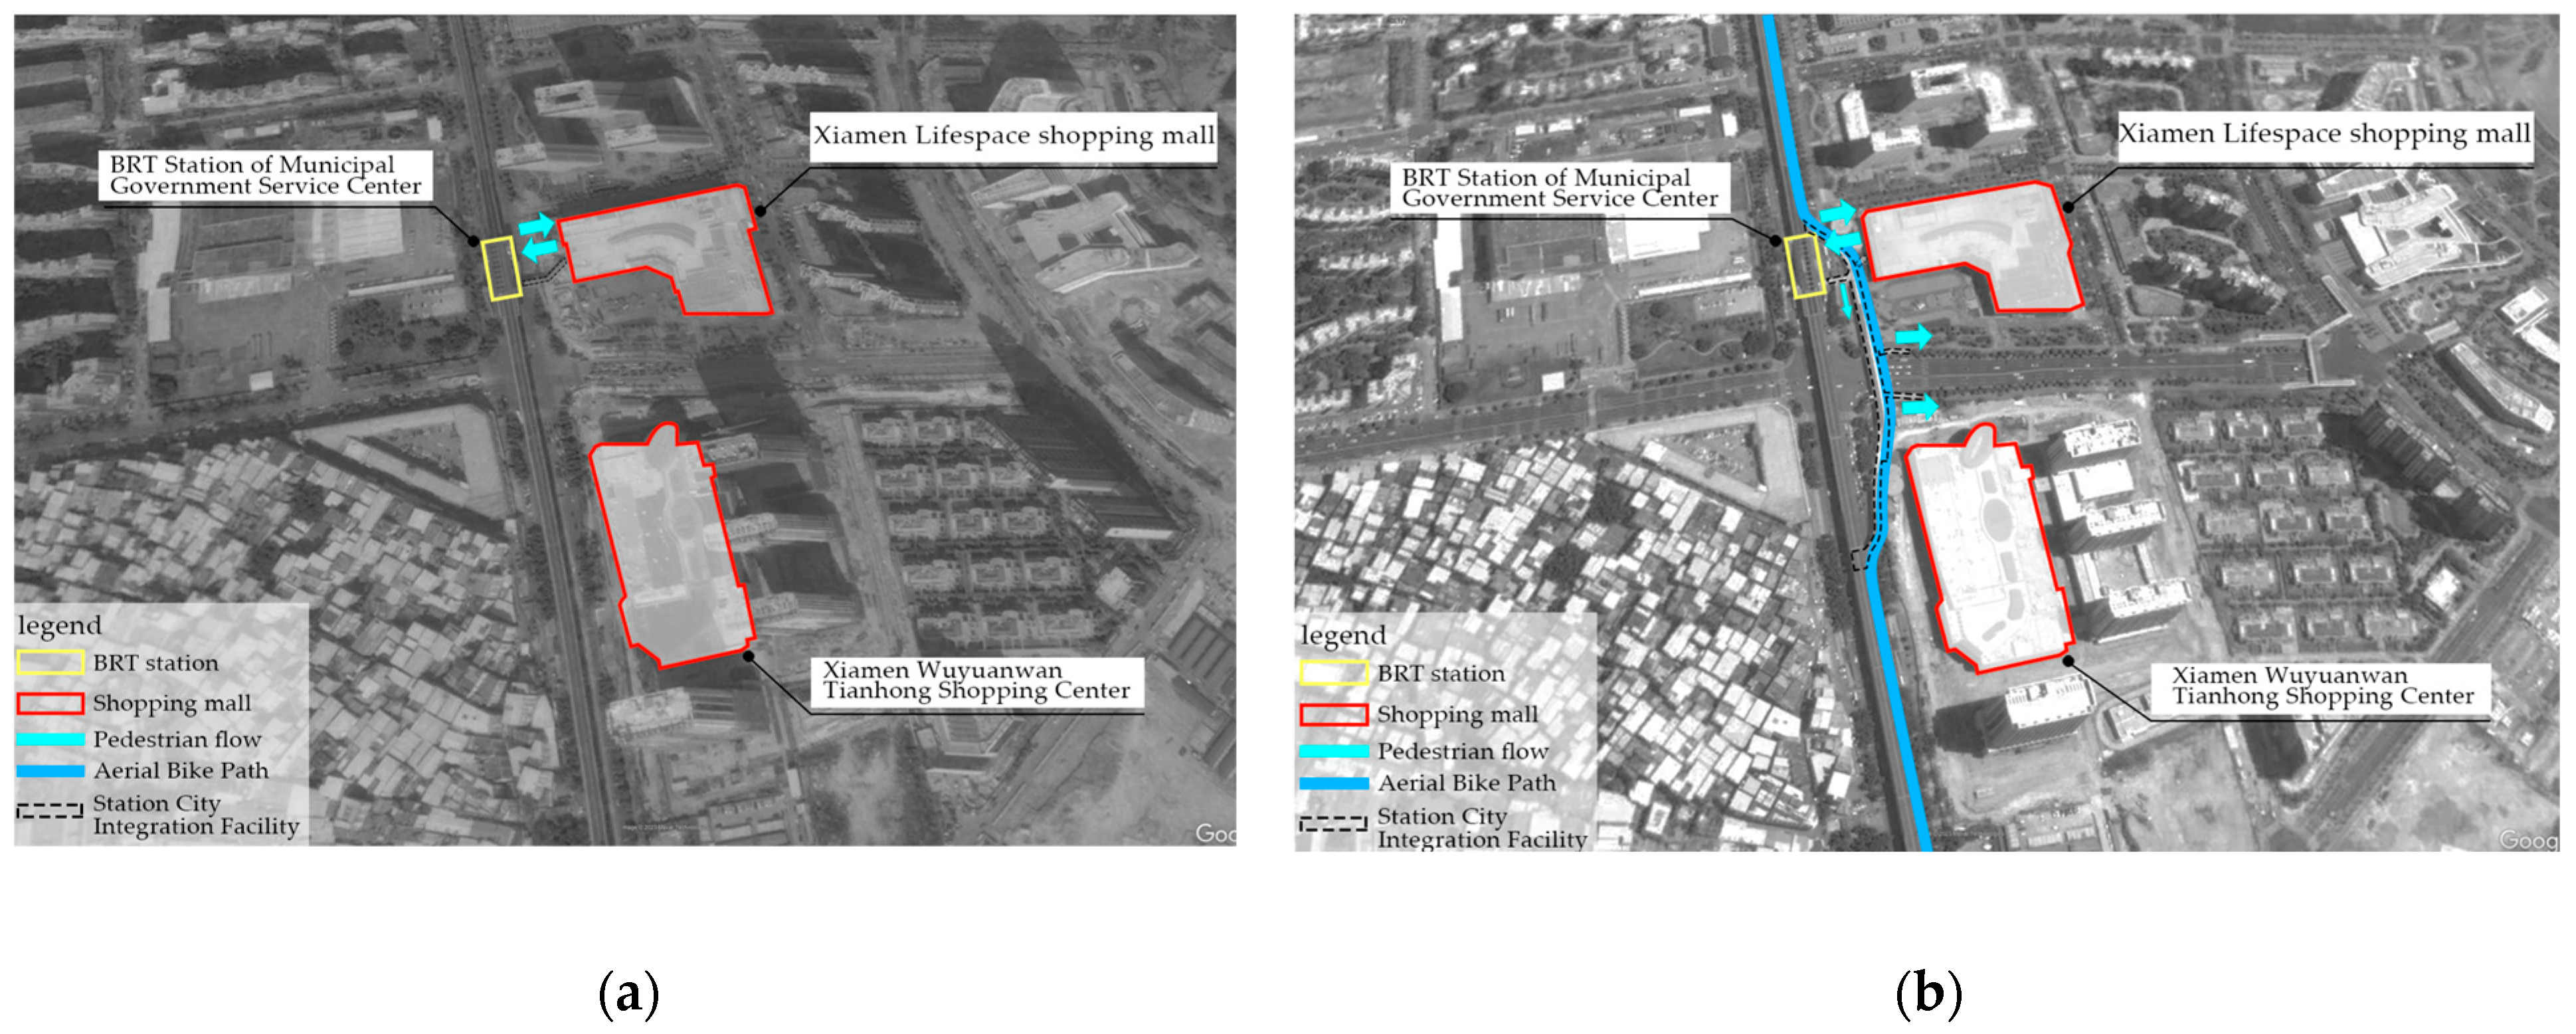
4. Study Area and Data Source
5. Results
5.1. Overall Analysis of Pedestrian Wayfinding Decisions at the Station Area
5.2. Consistency Analysis under Different Travel Scenarios
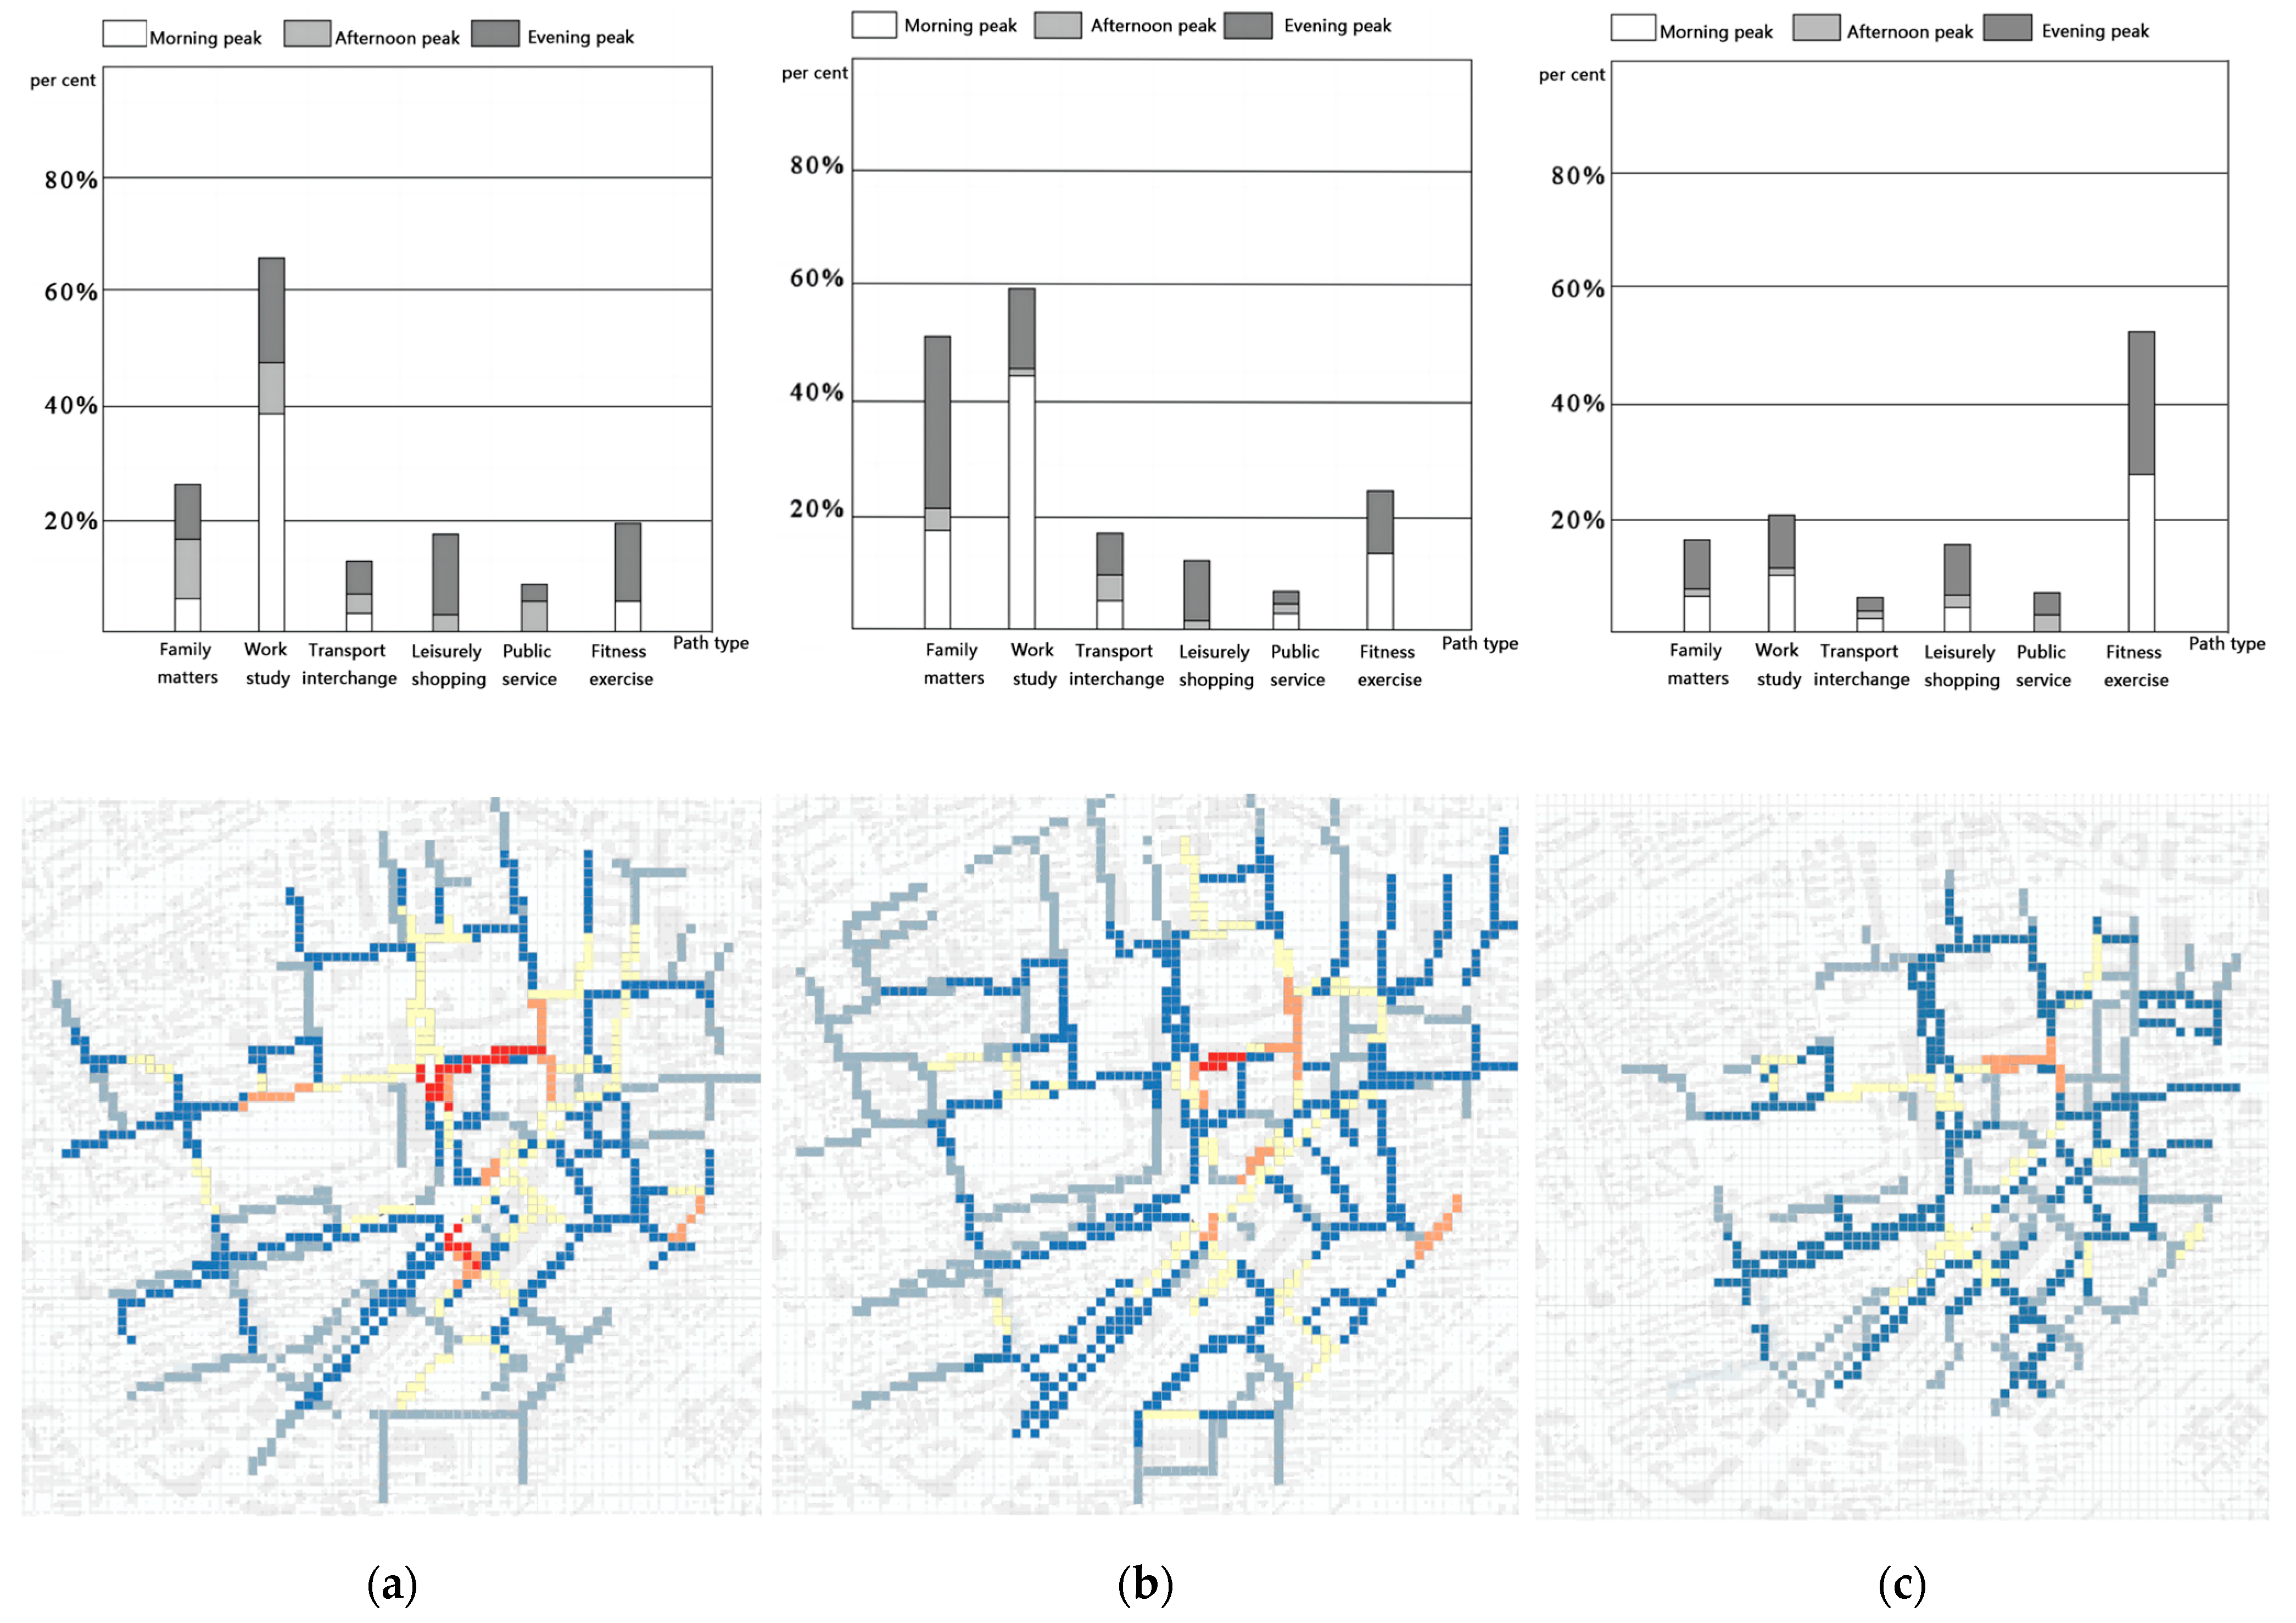
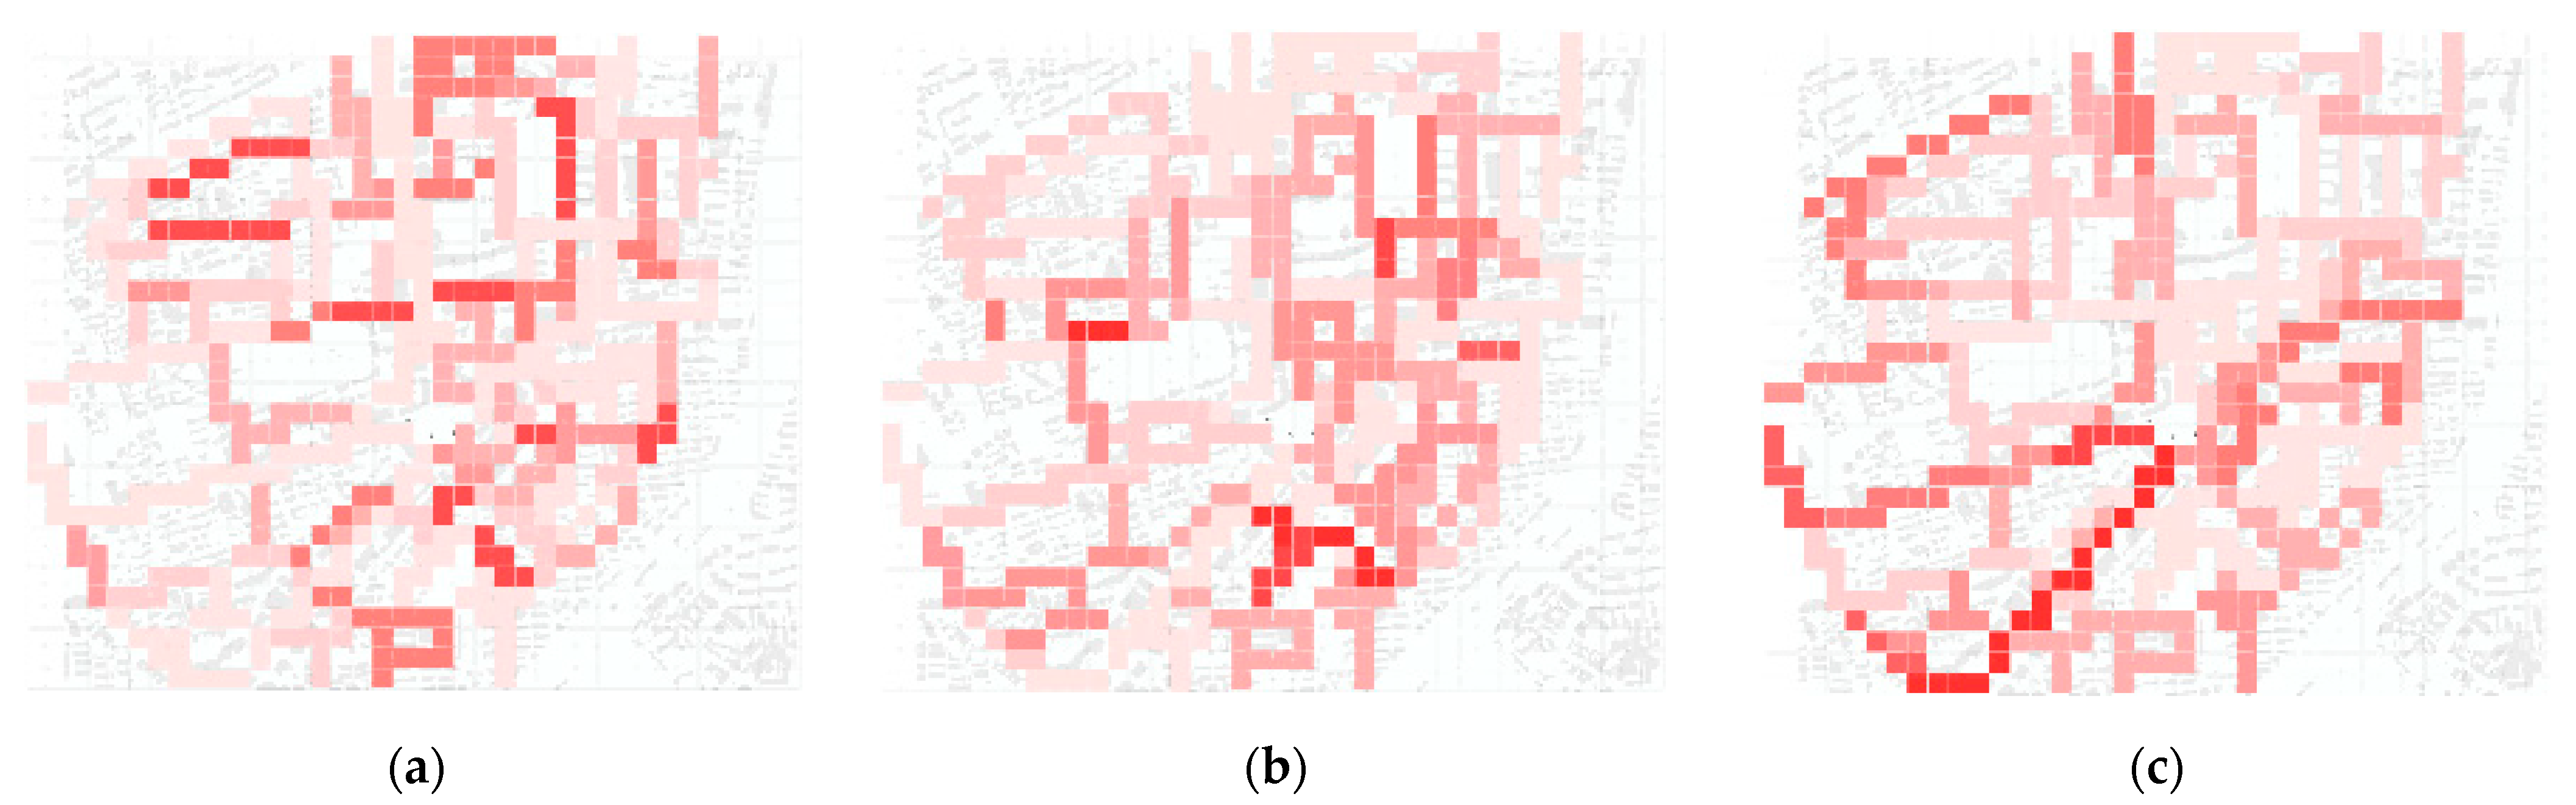
5.2.1. Consistency Analysis of Subjective and Objective Factors at Different Times of Day
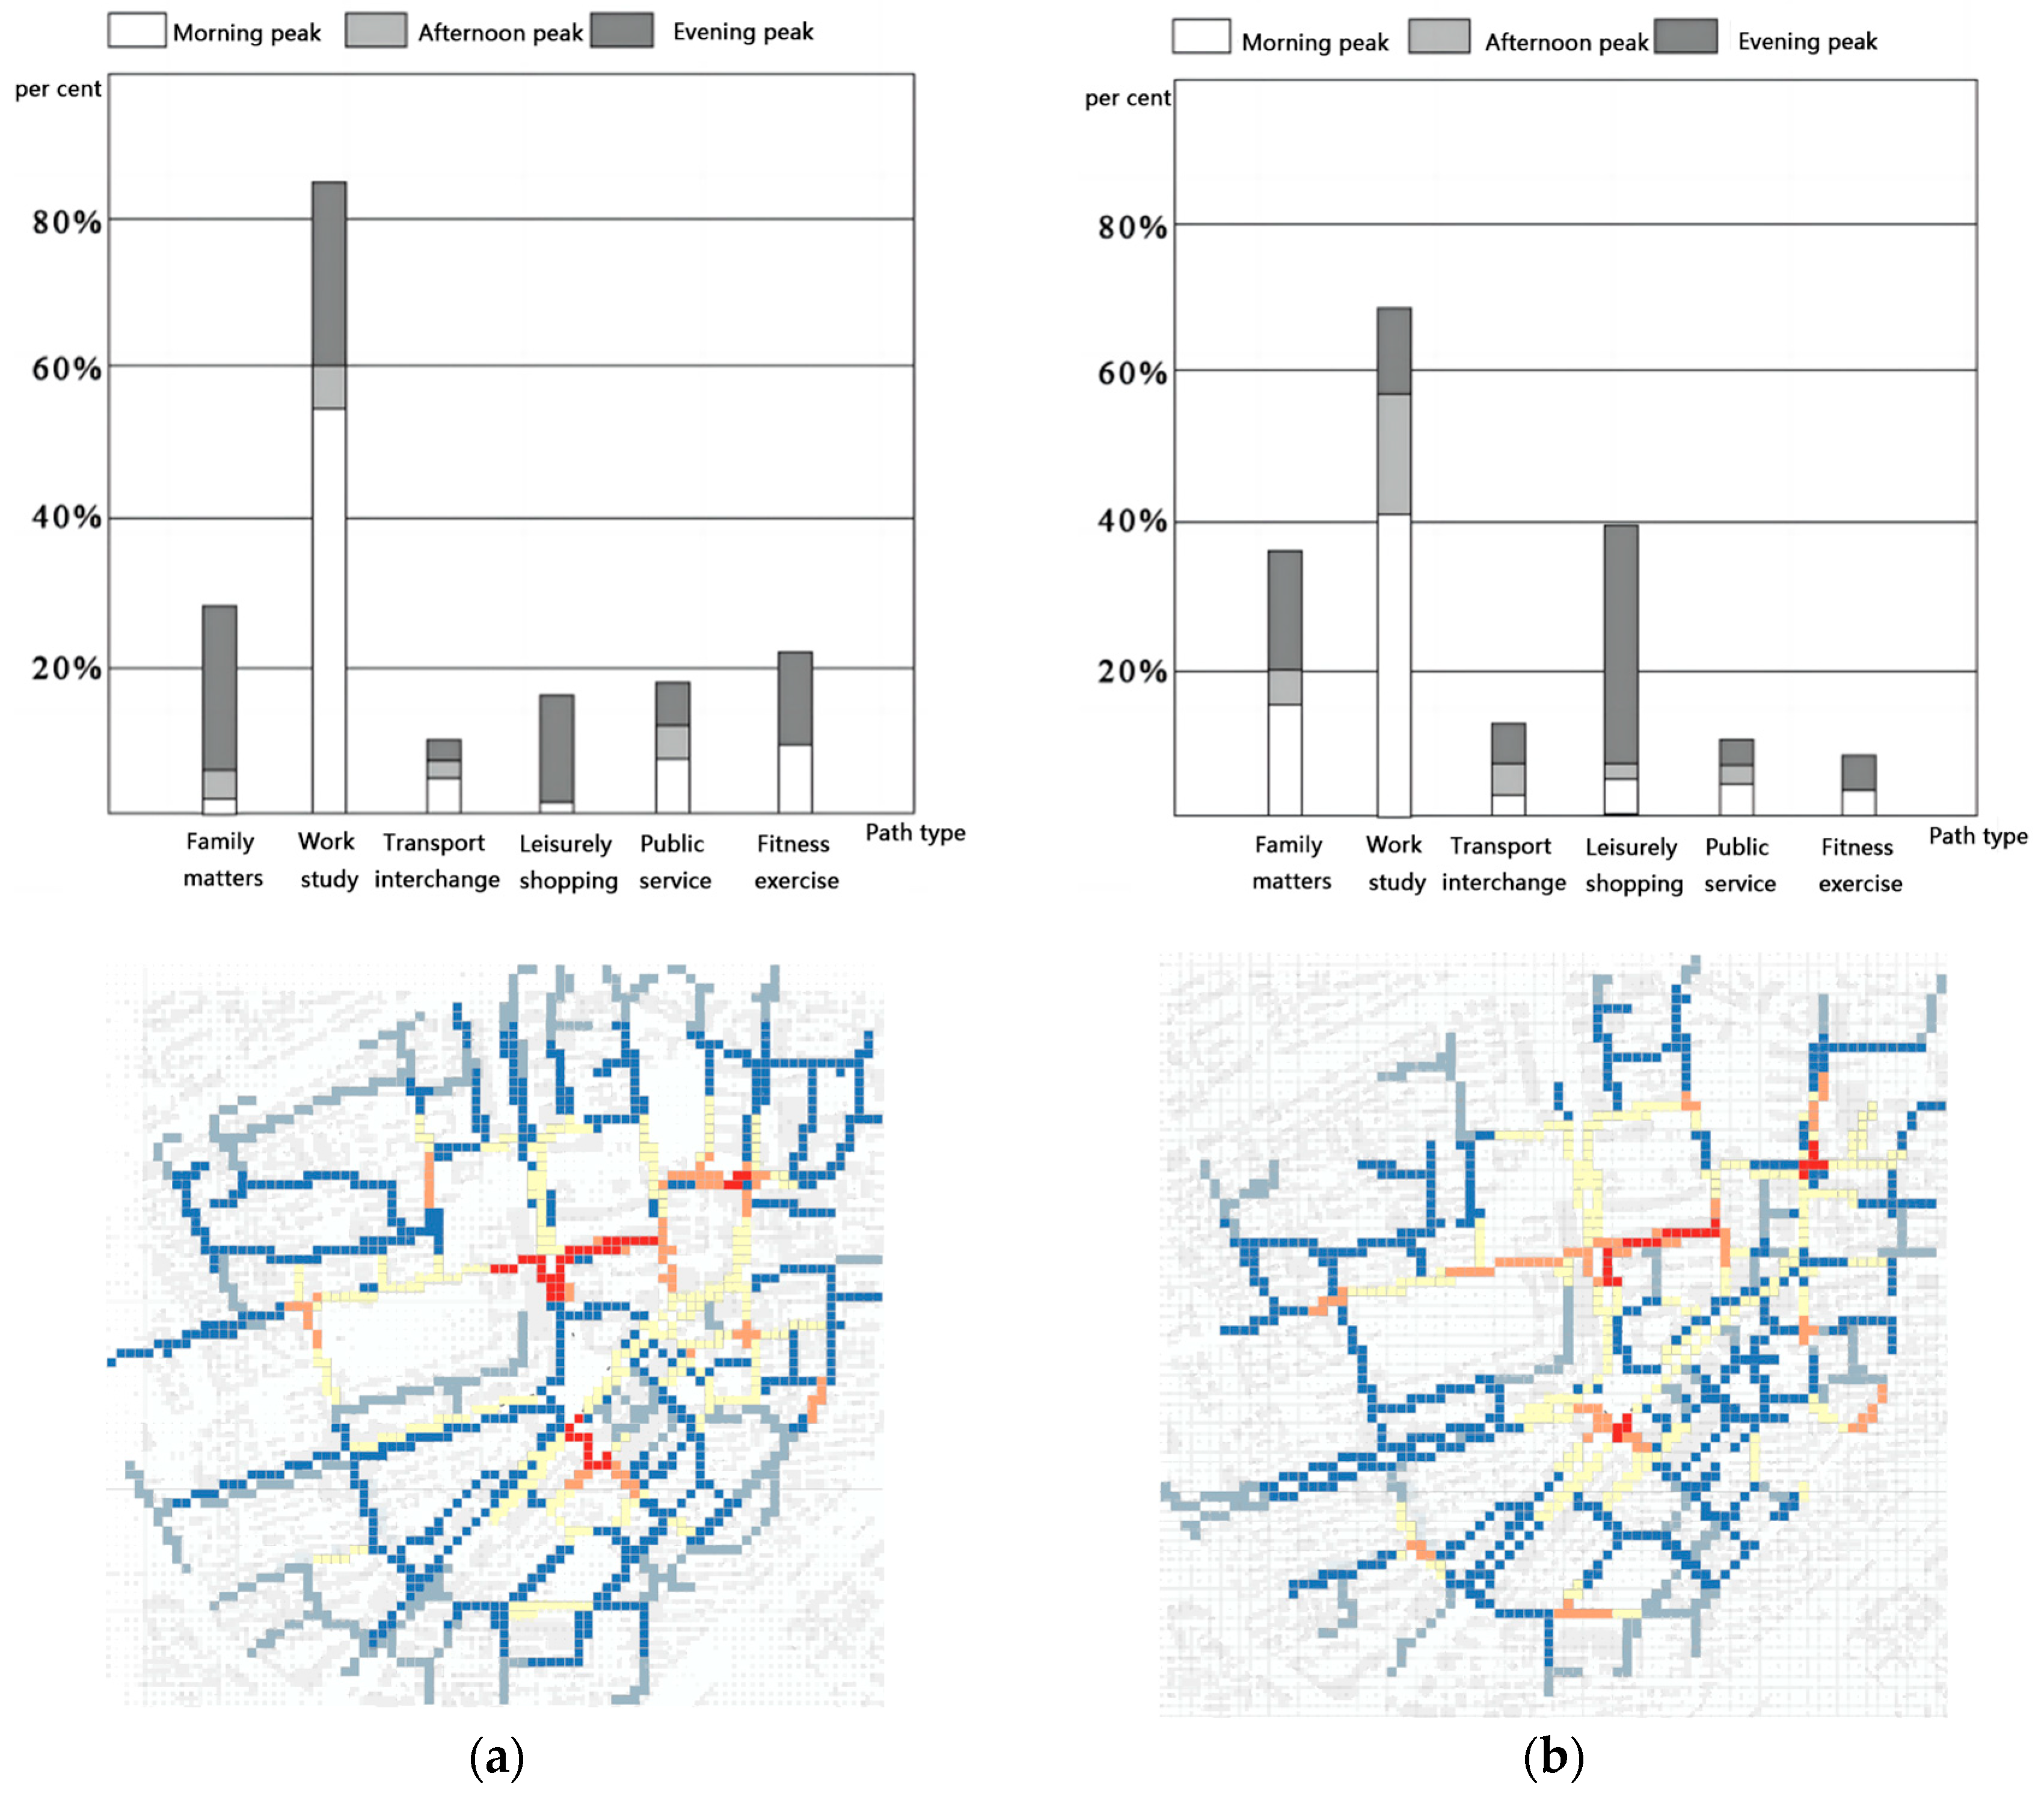
5.2.2. Consistency Analysis of Subjective and Objective Factors by Walking Distance
- Pedestrians have a certain tolerance threshold for walking distance. As the distance increases, fatigue sets in, influencing subjective perception.
- The radiation effect of rail transit stations creates a layering effect, with different environmental factors performing differently within each layer.
- The 700–1100 m range covers the optimal walking distance (around 800 m), allowing pedestrians to transition from uncertainty in wayfinding to street stability.
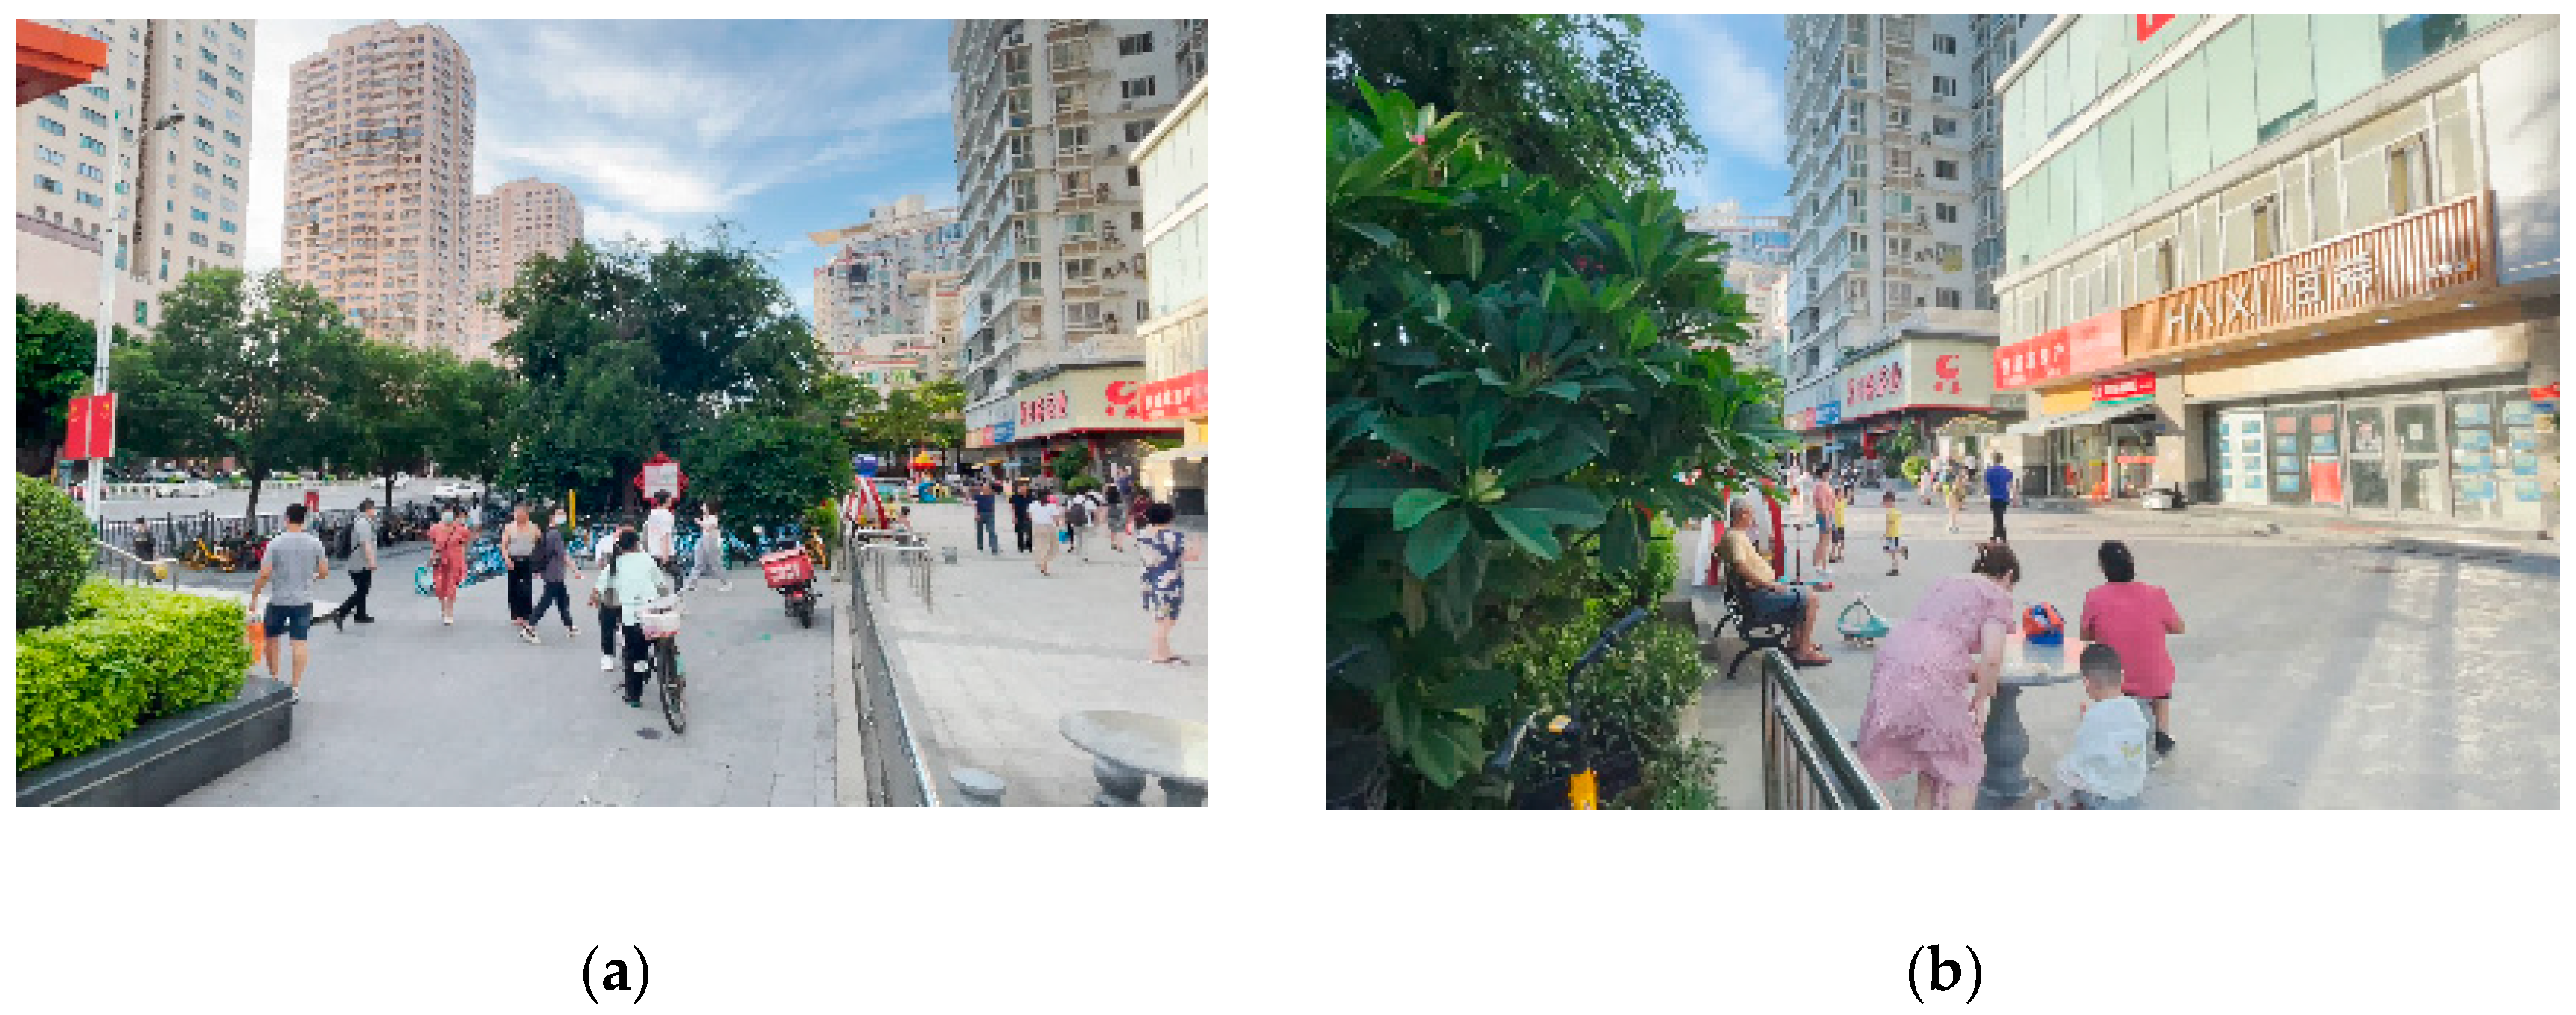
- The middle layer’s street function and facility arrangement better match pedestrian preferences and the street design is more pedestrian-friendly. Field observations show that some neighborhood environment elements have a motivating effect. For instance, the plaza in front of Zhongmin Baihui Mall, accessed directly from Exit 8 of Lvcuo Station, attracts pedestrians during the evening peak, altering walking paths (Figure 20). In contrast, the dedicated pedestrian paths along the roadway are less utilized. Although pedestrians must navigate steps, barriers, and other pedestrians, the vibrant urban scene and public commercial properties positively impact pedestrian perceptions. In the third distance layer, most elements of path attributes, walking space quality, and neighborhood environment show “negative deviations”, highlighting the impact of walking distance on physical tolerance thresholds and subjective cognition.
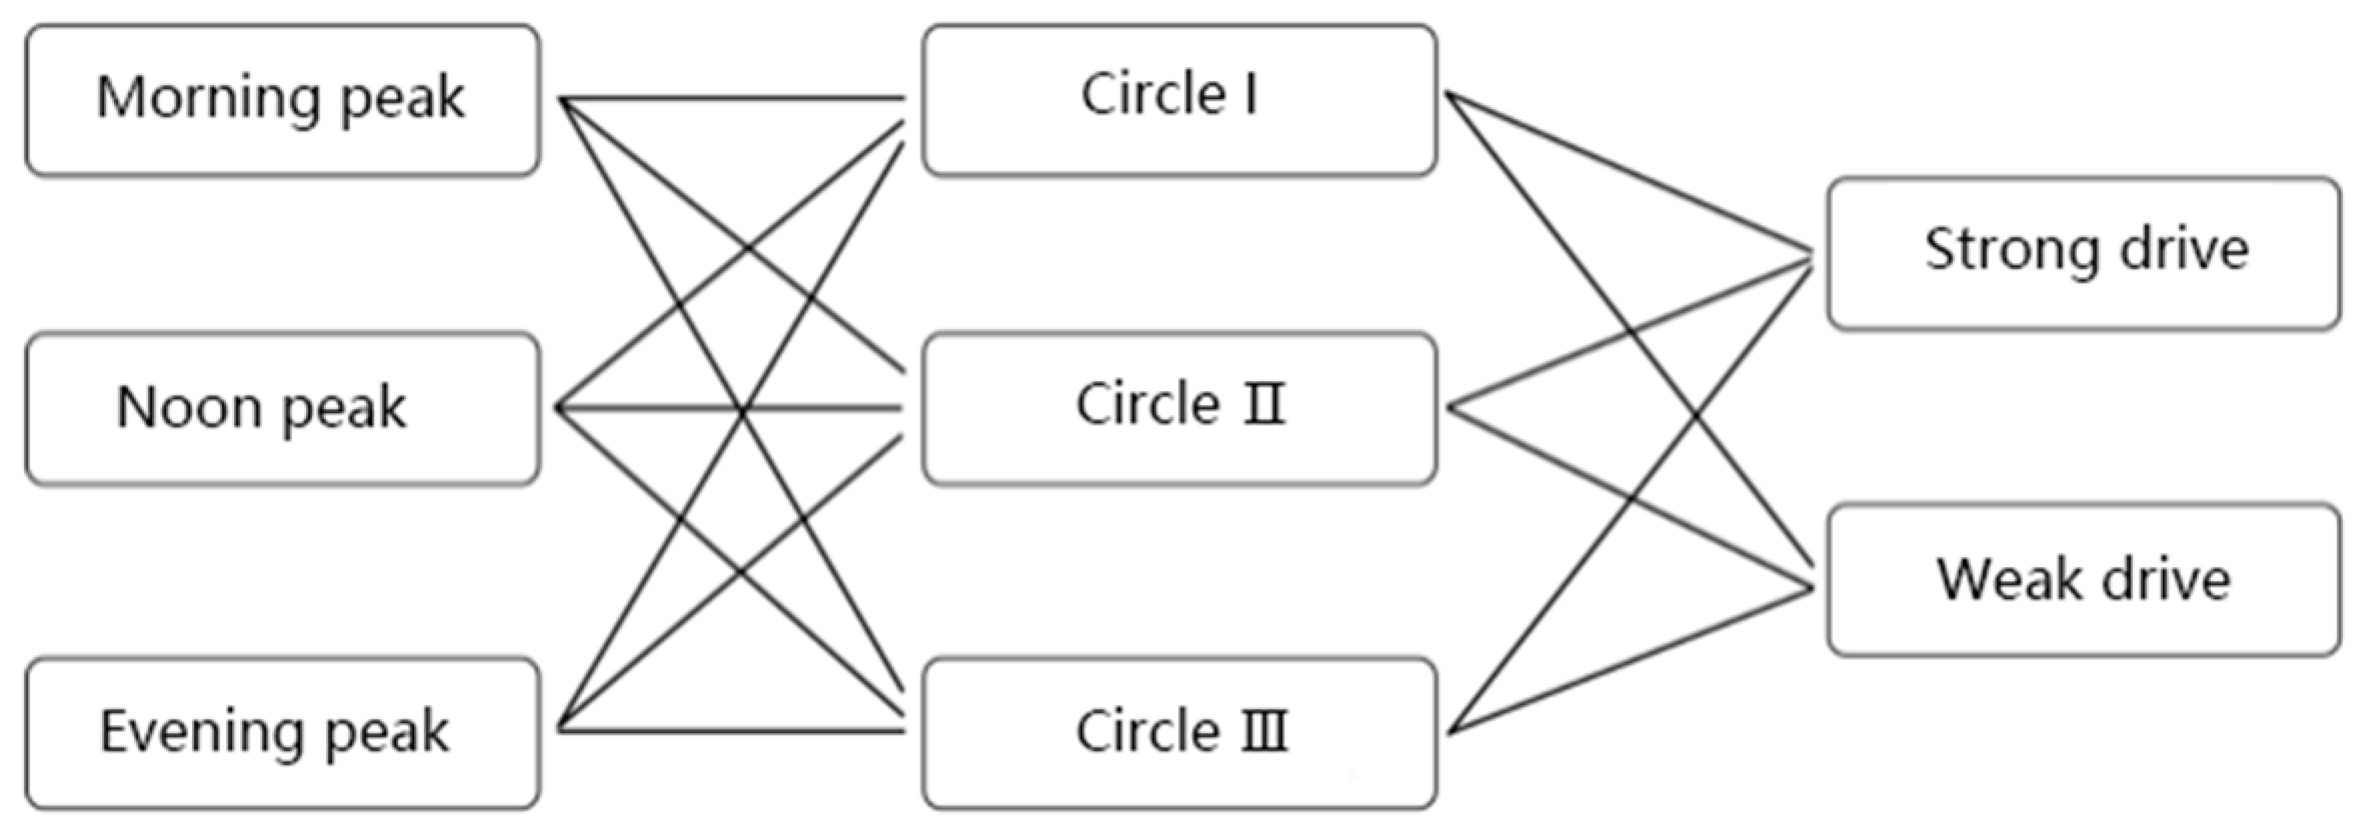
5.2.3. Consistency Analysis of Subjective and Objective Factors for Different Travel Purposes
5.3. Effect of Individual Socio-Economic Attributes on Perceived Consistency
5.3.1. Single-Factor Logistic Regression
5.3.2. Multifactor Logistic Regression
5.3.3. Correlation Analysis of Subjective and Objective Factors
5.4. Mechanism Analysis of Subjective and Objective Synergy in the Process of Walking Path-Finding in Rail Transit Station Area
- (1)
- Gender
- (2)
- Social Context
- (3)
- Age
- (4)
- Motor Vehicle Dependence
- (5)
- Weather
6. Discussions
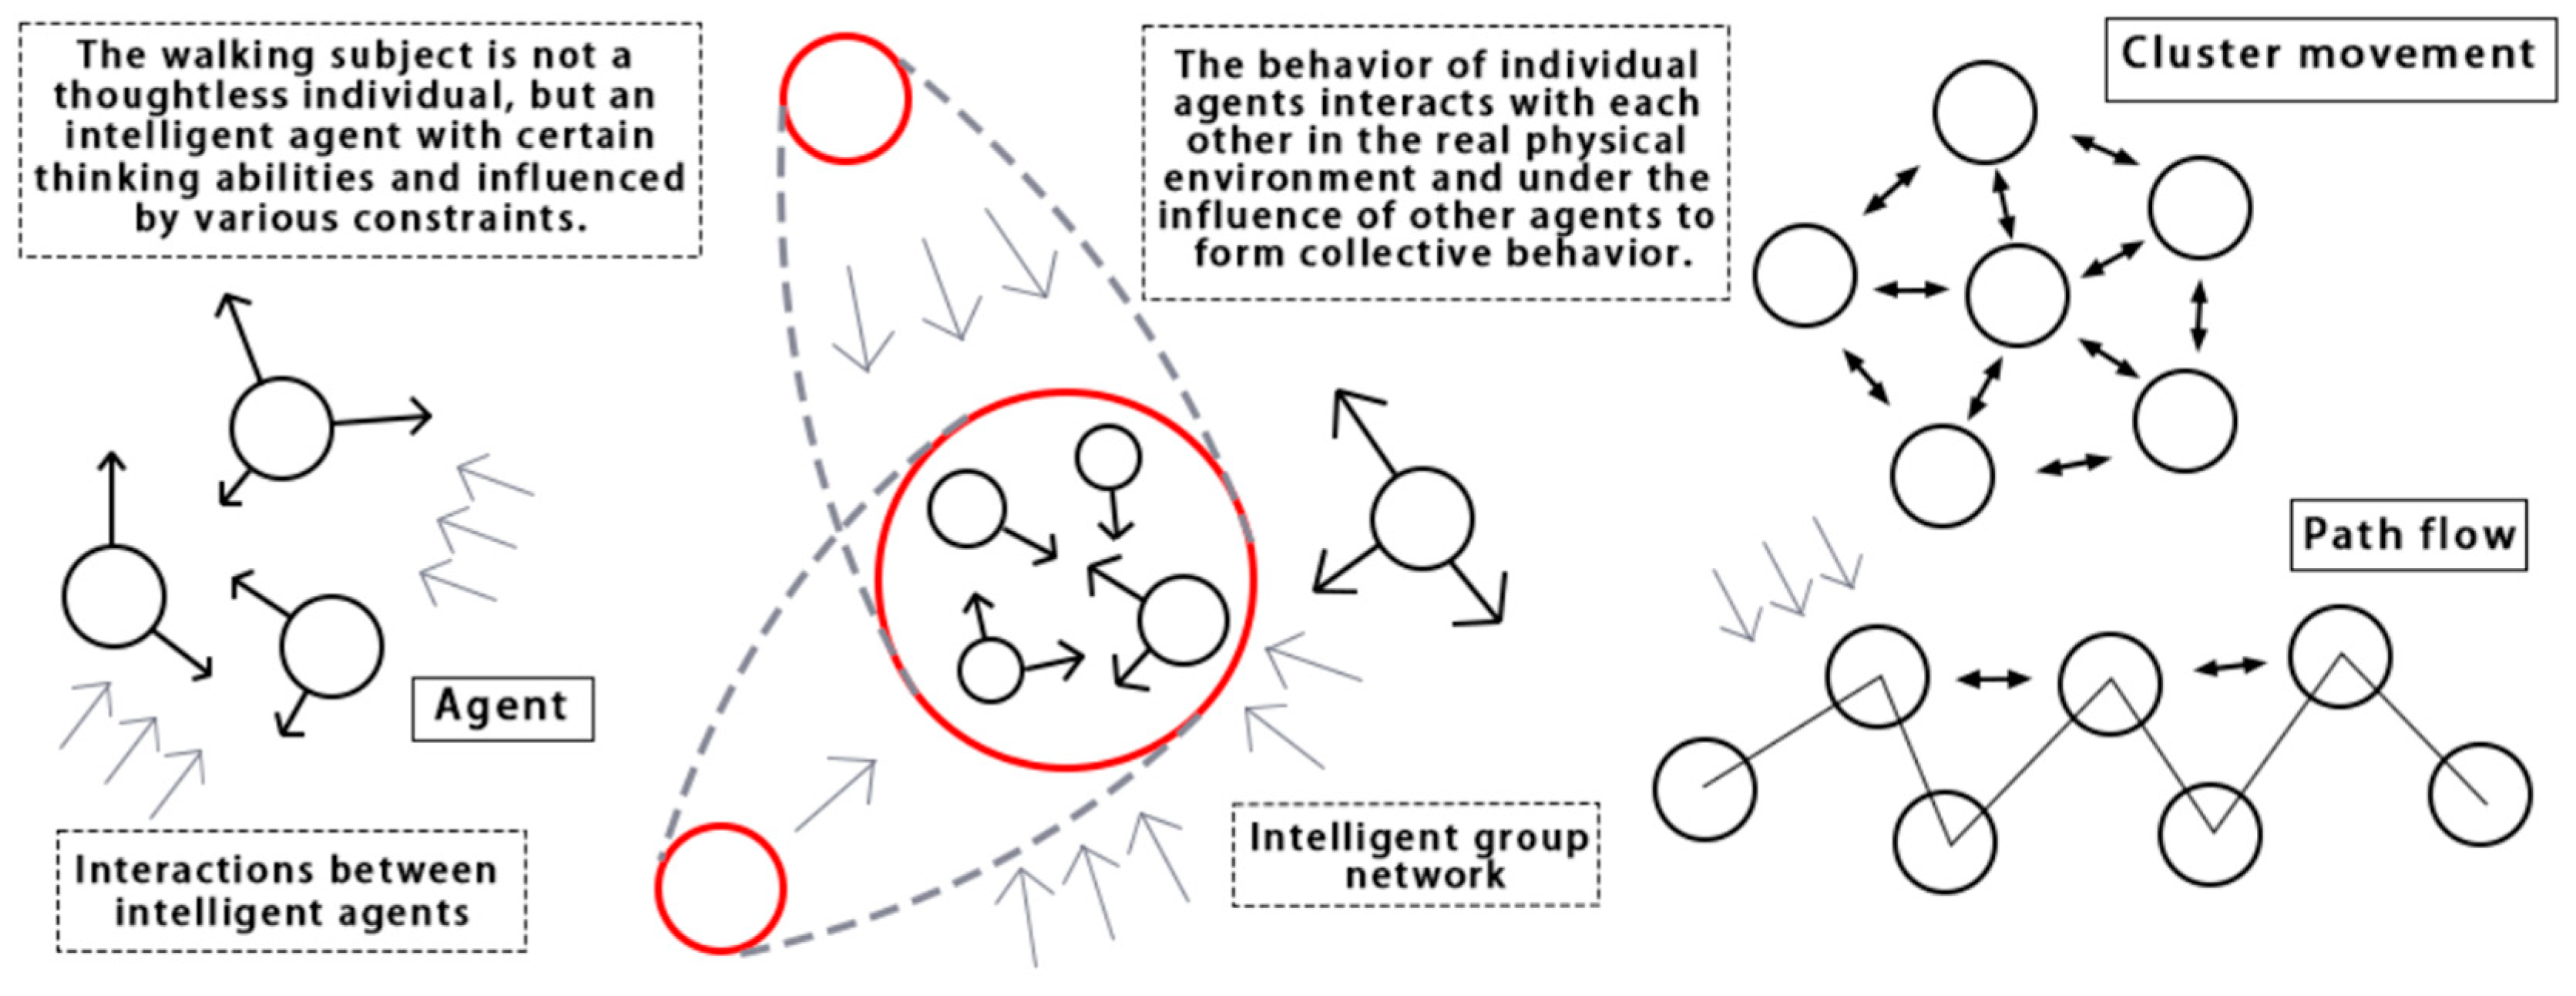
- Based on the traditional behavioral dynamics model, an abstract model of walking paths has been proposed, and it has been demonstrated through the observation and investigation of the entire process of passenger flow generation, and it is used to quantify the built environments of walking paths.
- Consistency analysis and a logistic regression model verified that the objective built environment and subjective perception factors have a common influence, but in most cases, it is deviation rather than synergy.
- Consistency analysis mainly analyzed the degree of synergy between the two. The components of this quantitative relationship need to be compared with each other to reflect different synergy effects. The coefficients analyzed by the logistic regression method have a substantial impact.
6.1. Theoretical Innovation of the Research
6.2. Practical Application of Research in Reality
- (1)
- Firstly, it is essential to recognize that the “top-down” approach—starting from observing phenomena, analyzing problems, making design decisions, and generating plans—still predominantly relies on the subjective perspectives of designers. However, plans based on subjective judgments may not always effectively influence pedestrian behavior. The actual walking paths, spatial occupancy rates, and facility usage by pedestrians can differ significantly from initial design intentions and expectations:
- (a)
- The analysis of the consistency between subjective environmental perceptions and objective environmental conditions often reveals discrepancies, indicating that these two aspects rarely align perfectly. Relying solely on built environment design may fail to meet actual usage needs, underscoring the necessity of thorough preliminary demand research to avoid resource wastage.
- (b)
- From a subjective perspective, different types of users have varied understandings of street environments during wayfinding. This study proposed a multi-layered street space experience model. The interaction mechanisms between pedestrians of different genders, age groups, social backgrounds, and cognitive habits and their environments show significant differences. These differences act as mediating factors that influence individual environmental perceptions. The complexity and flexibility of urban spatial systems are thus reflected through these human–environment interactions.
- (2)
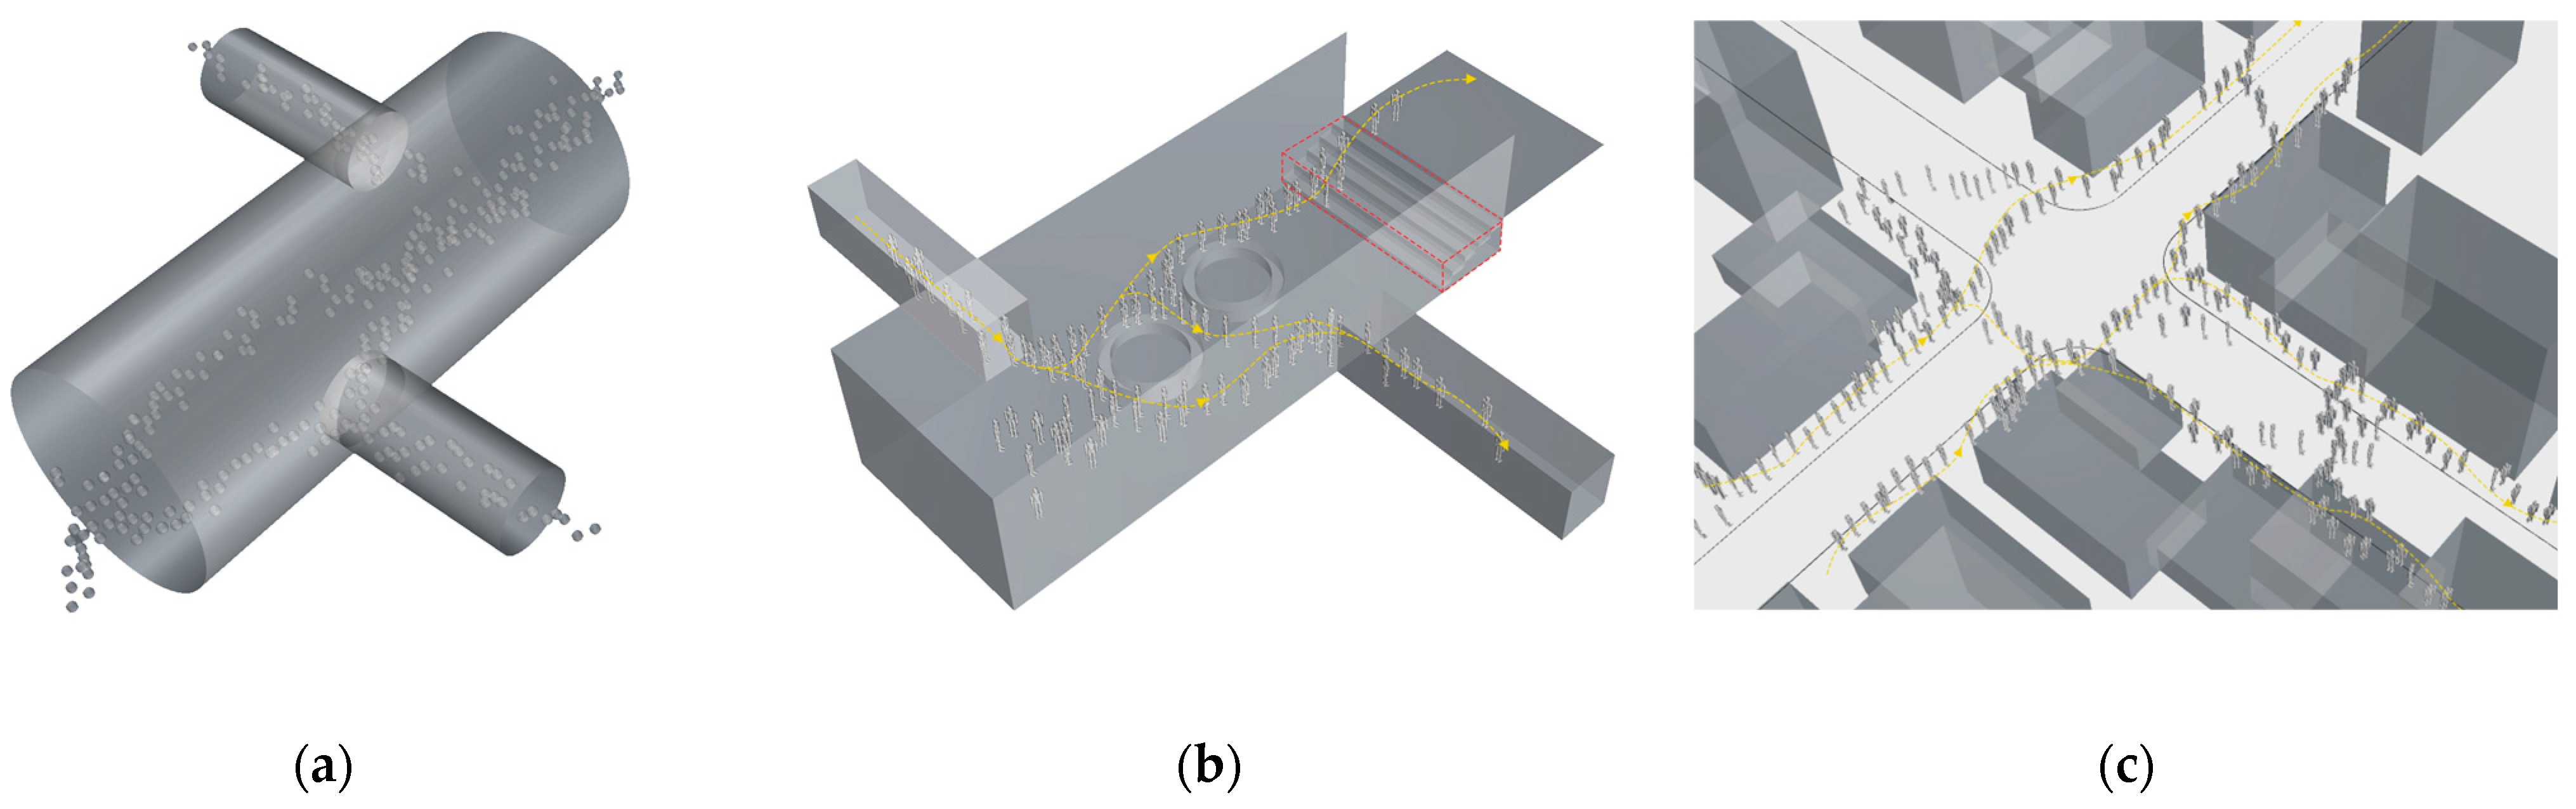
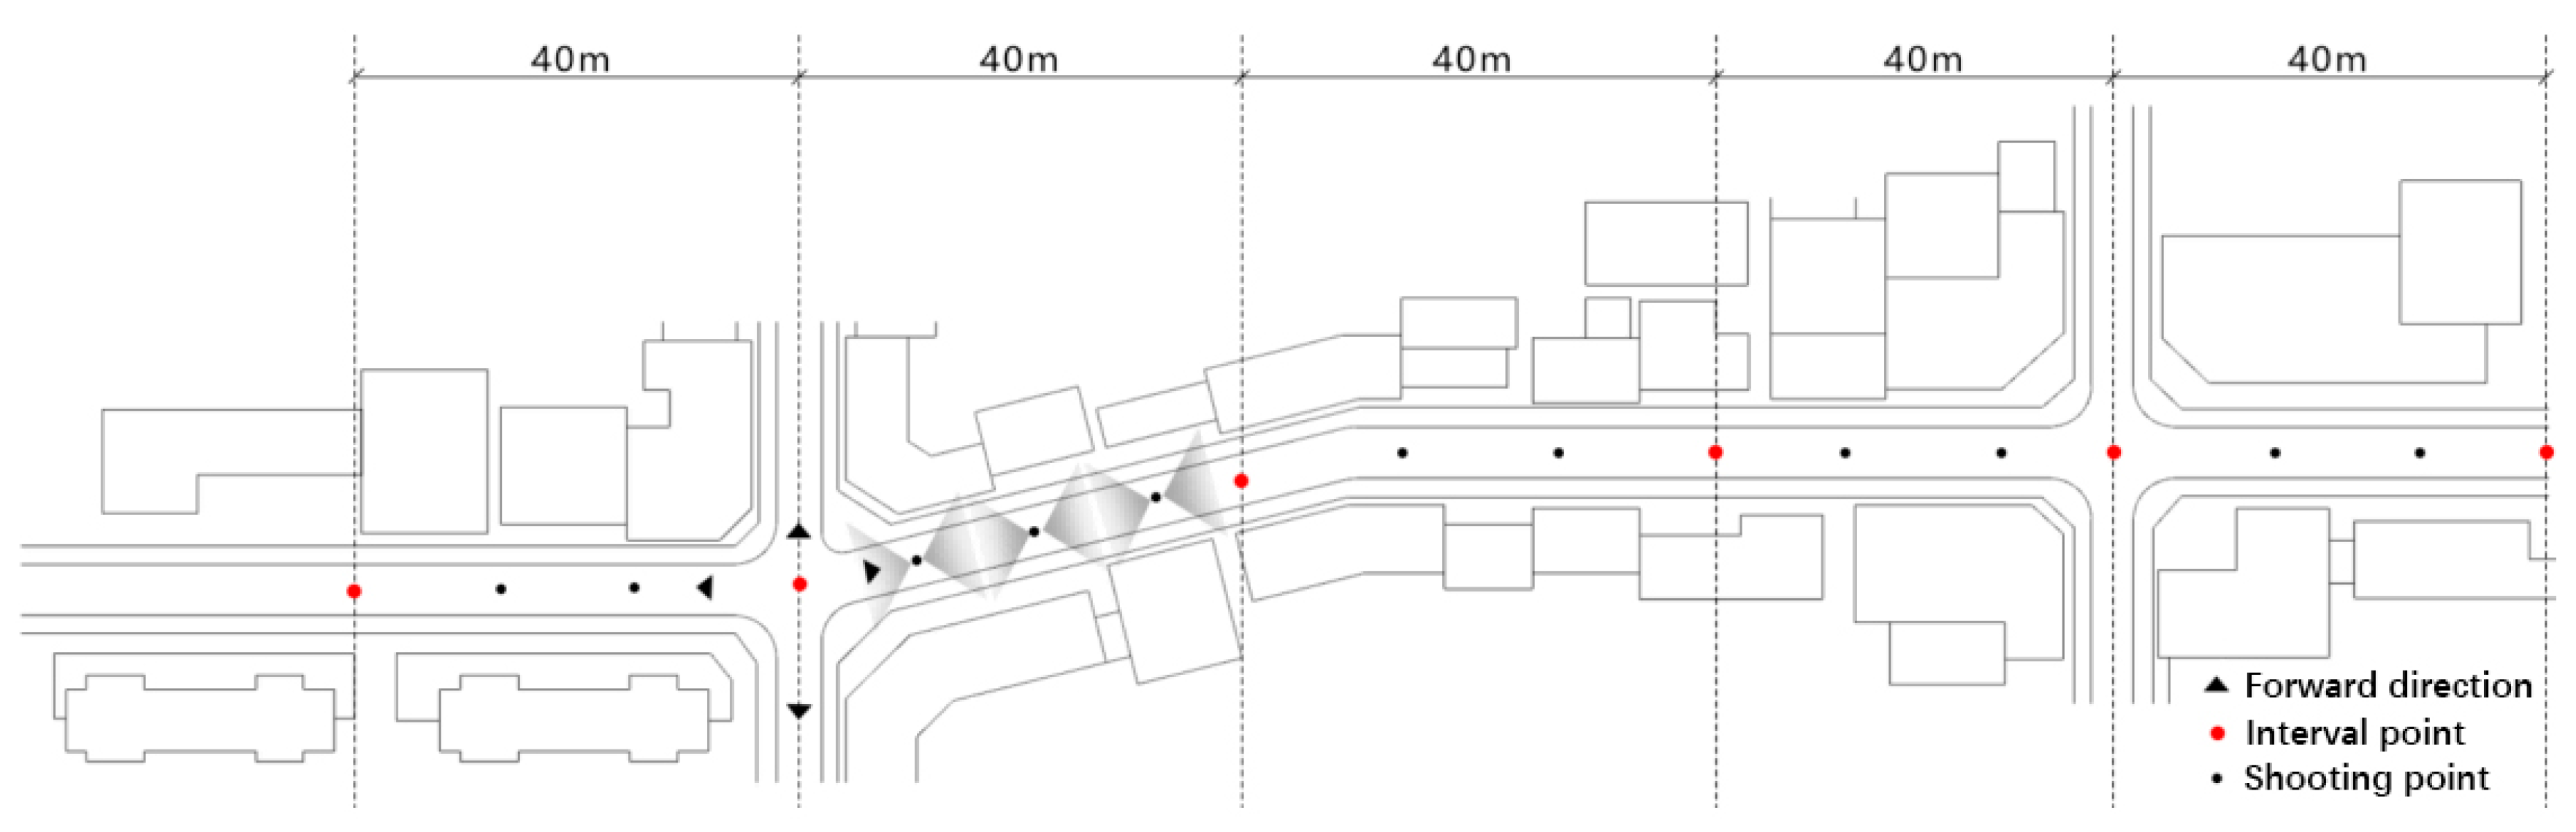
- This study focused on the specific urban space of areas surrounding rail transit stations. During peak commuting hours, large volumes of passengers emerge from station exits, creating a phenomenon of “emergence” that, after a short period, self-organizes into orderly “path flows”. These flows impact the existing street network system. During this process, pedestrian paths may intersect and overlap, and without active intervention policies, the pedestrian path system may become disordered, potentially affecting the daily use of street spaces and resulting in negative consequences. This research has systematically deconstructed the logic by which pedestrians read and understand their environments after exiting the station and investigated the internal mechanisms of pedestrian wayfinding from the perspective of the pedestrians themselves. This understanding will help researchers and decision-makers better comprehend how rail transit stations impact the surrounding urban space and the spatiotemporal dynamics of pedestrian activities within this area.
6.3. Limitations of the Research and Future Directions
7. Conclusions
- (1)
- Based on the research work, the path formation mechanism and pedestrian path selection behavior of Xiamen City Line 1 Lvcuo Station under high pressure were explained and the differences in the path selection behaviors of different types of pedestrians were discovered. Behavior is potentially linked to the style and level of the built environment, as well as to pedestrians’ subjective perceptions of the environment. Through the idea of orthogonal combination, four types of interaction between subjective and objective factors were sorted out, namely “strong perception–strong level”, “strong perception–weak level”, “weak perception–strong level”, and “weak perception–weak level”, explaining the applicable scenarios and perception mechanisms of each type, and further, this paper constructed the “balance model” of two-way interaction between objective environment and subjective perception. While clarifying the data collection, processing, and translation methods, we also refined subjective and objective interaction indicators with common influence.
- (2)
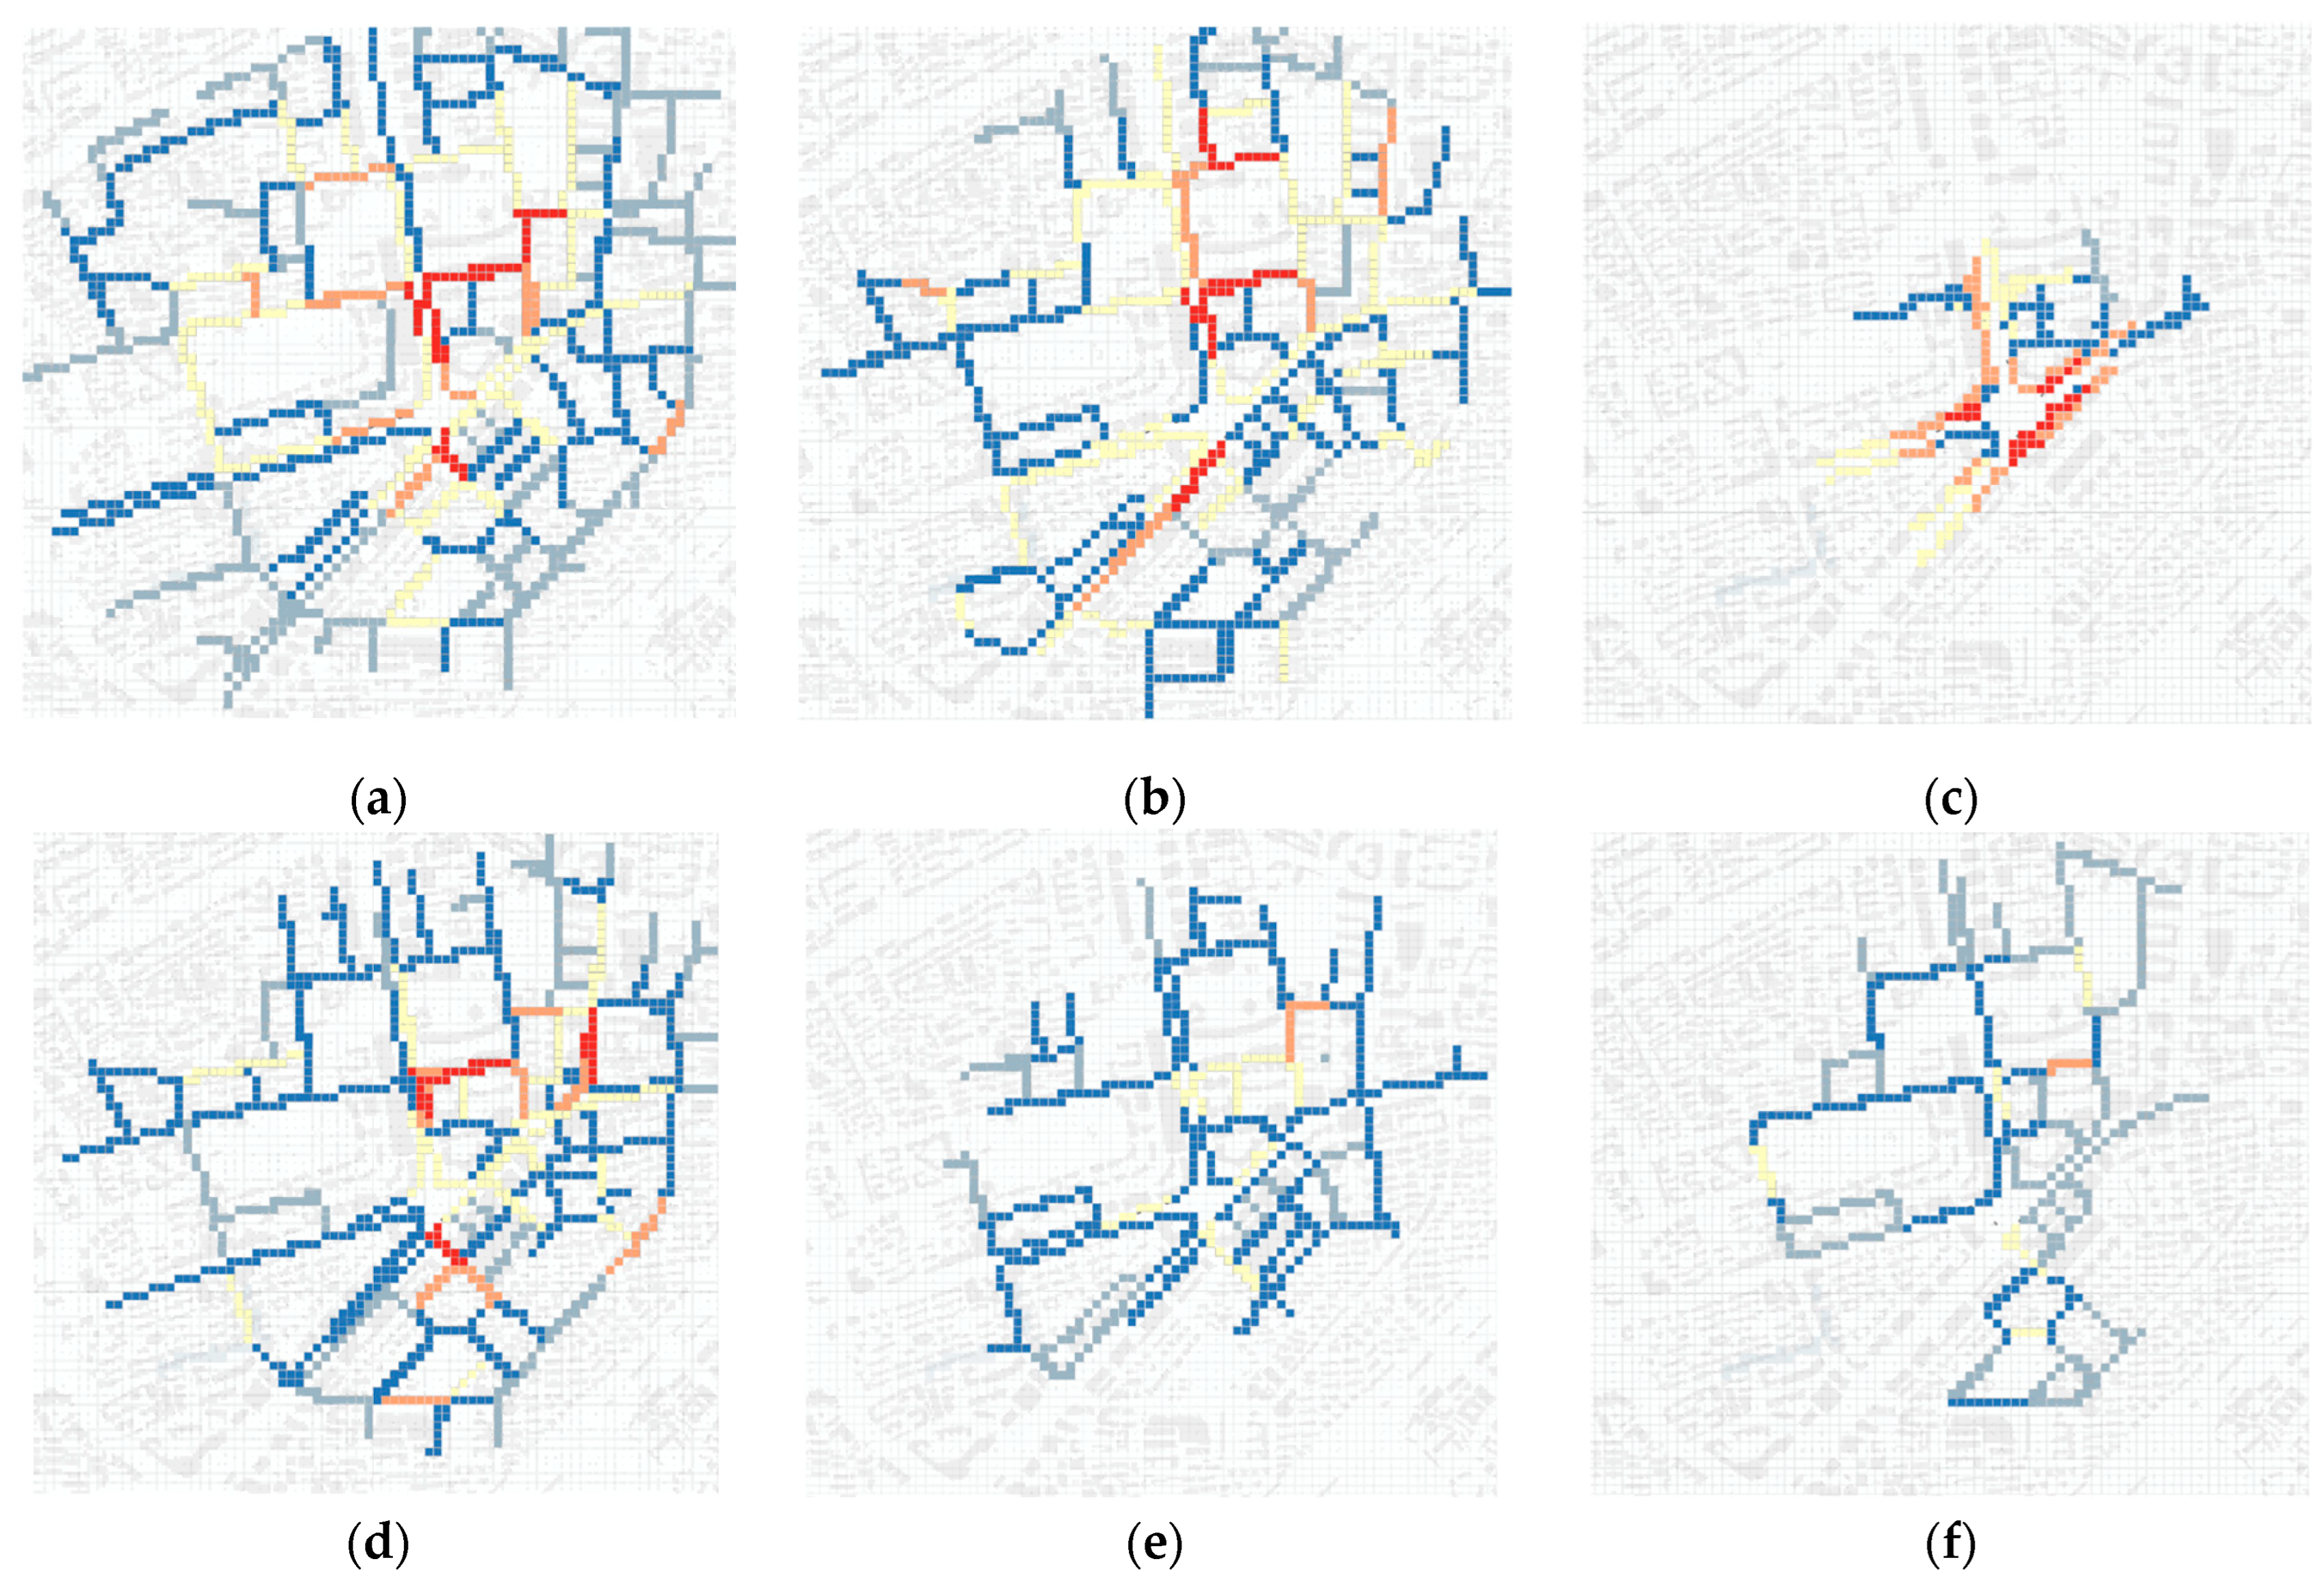
- In the work of subjective and objective consistency testing, first of all, the consistency of mathematical relationships was interpreted for all path samples and mapped to the spatial level. It was found that there were many deviations in the subjective and objective effects, and a few showed subjective and objective coordination. Among them, negative events occurred. The directional deviations were concentrated in the pedestrian spaces on both sides of the site’s intersection main roads while the positive deviations were concentrated in areas with strong community atmosphere and rich urban activities but low level of pedestrian space itself; further, based on the path samples of different travel situations conducting consistency analysis, it was found that the subjective collaborative perceptions were different in different peak periods and for different travel purposes and different travel distances. Among them, the consistent perceived collaborative performance of the traveling crowd during the evening peak period was the best, and the subjective collaborative perception under strong and weak driving purposes was the best. There was an obvious gap in the understanding of perceived elements among traveling pedestrians, and pedestrians’ perceived synergy of built environment elements was the highest within the 700–1100 m circle of the travel path. However, under different scenarios, the perceived synergy of travel distance, urban activities, and transportation facilities environment was relatively stable.
- (3)
- In the work of constructing a logistic regression model to analyze the impact of individual socio-economic attributes on perceived synergy, the results showed that visual attraction, the occurrence of urban activities, the traversability of streets, and the connectivity of routes are positively correlated with subjective perceived attitudes. That is, when the levels of these objective factors are high, they will have a positive promotion effect on pedestrians’ subjective perception and are conducive to the formation of a synergistic effect of subjective and objective interactions; meanwhile, the negative correlation factors are “supporting walking facilities” and “consumer needs can be met along the way”—that is, the more recreational facilities there are, the richer the street functions and formats and the stronger the perception. Among individual basic attributes, gender, age, and travel preference factors have significant impacts while social background factors do not have a significant impact on the walking process.
Author Contributions
Funding
Data Availability Statement
Acknowledgments
Conflicts of Interest
References
- Liu, H.L. From sprawl to smart growth—A review of the concept of “urban growth frontier” in the United States. Urban Probl. 2005, 3, 67–72. [Google Scholar]
- Ma, Q. Research progress on “TOD” in North America in recent years. Urban Plan. Int. 2009, S1, 227–232. [Google Scholar]
- Lv, G.W.; Yang, J.Z.; Yang, C.Z.; Zhang, W.X. Study on the Accessibility of High-Speed Railway Station Based on the Highway Network and Railway Timetable: Taking Tianjin Tanggu Station as an Example. Urban Dev. Stud. 2014, 4, 53–58. [Google Scholar]
- Zhang, L.Z. Three-dimensional Spatial Network Analysis and Its Application in a High Density City Area, Central Hong Kong. Urban Plan. Int. 2019, 1, 46–53. [Google Scholar] [CrossRef]
- Chen, F.; Zhang, C.Y.; Ding, S.Y. A Study on the Measurement of Pedestrian Accessibility of Living-block Rail Transit Station: A Case Study of Shenzhen and Hong Kong. South Archit. 2021, 4, 31–38. [Google Scholar]
- Boakye-Dankwa, E.; Barnett, A.; Pachana, N.A.; Turrell, G.; Cerin, E. Associations between Latent Classes of Perceived Neighborhood Destination Accessibility and Walking Behaviors in Older Adults of a Low-Density and a High-Density City. Aging Phys. Act. 2019, 27, 553–564. [Google Scholar] [CrossRef] [PubMed]
- Cao, Z.; Asakura, Y.; Tan, Z. Coordination between node, place, and ridership: Comparing three transit operators in Tokyo. Transp. Res. Part D Transp. Environ. 2020, 87, 102518. [Google Scholar] [CrossRef]
- Humpel, N.; Owen, N.; Iverson, D. Perceived environment attributes, residential location, and walking for particular purposes. Am. J. Prev. Med. 2004, 26, 119–125. [Google Scholar] [CrossRef] [PubMed]
- Turrell, G.; Haynes, M.; Wilson, L.A. Can the built environment reduce health inequalities? A study of neighbourhood socioeconomic disadvantage and walking for transport. Health Place 2013, 19, 89–98. [Google Scholar] [CrossRef]
- Lian, H.T.; Zhang, J.X.; Hu, Y.K.; Bai, M. Research Frontier of Pedestrian Choice Simulation in Built Invironment. New Archit. 2019, 6, 32–35. [Google Scholar]
- Helbing, D.; Buzna, L.; Johansson, A.; Werner, T. Self-Organized Pedestrian Crowd Dynamics: Experiments, Simulations, and Design Solutions. Transp. Sci. 2005, 39, 1–24. [Google Scholar] [CrossRef]
- Arthur, P.; Passini, R. Wayfinding: People, Signs, and Architecture, 1st ed.; McGraw-Hill Book Co.: New York, NY, USA, 1992; pp. 45–52. [Google Scholar]
- Dalton, R.C.; Hölscher, C.; Montello, D.R. Wayfinding as a Social Activity. Front. Psychol. 2019, 10, 116–124. [Google Scholar] [CrossRef] [PubMed]
- Iftikhar, H.; Luximon, Y. The syntheses of static and mobile wayfinding information: An empirical study of wayfinding preferences and behaviour in complex environments. Facilities 2022, 40, 452–474. [Google Scholar] [CrossRef]
- Adler; Jeffrey, L. Route Choice: Wayfinding in Transport Networks, 3rd ed.; Kluwer Academic: Hingham, MA, USA, 1993; pp. 167–183. [Google Scholar]
- Xu, J.; Zhu, X.L.; Wang, S. An Experimental Study on Route Choice of Metro Station Based on Field Measurement of Eye Movement and Virtual Scence: Case Studies of Three Metro Stations in Guang Zhou. New Archit. 2019, 4, 26–32. [Google Scholar]
- Zhao, Y.; Liang, J.P.; Yan, L.Q.; Kong, X.Q. The influences of guidance system on tourists’ wayfinding behaviour: A case study based on eye-tracking techniques. Tour. Trib. 2020, 9, 63–73. [Google Scholar]
- Hu, Y.; Wang, L. Research on the Influential Factors of Street Plan Index on the Pedestrian Route: Comparative Analysis of Four Street Networks. New Archit. 2021, 2, 31–36. [Google Scholar]
- Liu, Y.; Wu, J.R.; Lin, H.F. Study on Pedestrian Route Choice within a Rail Transit Station. Urban Transp. China 2008, 6, 46–53. [Google Scholar]
- Hill, M.R. Spatial Structure and Decision-Making Aspects of Pedestrian Route Selection through an Urban Environment. Ph.D. Dissertation, The University of Nebraska—Lincoln, Lincoln, NE, USA, 1982. [Google Scholar]
- Guo, Z.; Loo, B.P.Y. Pedestrian Environment and Route Choice: Evidence from New York City and Hong Kong. J. Transp. Geogr. 2013, 28, 124–136. [Google Scholar] [CrossRef]
- Handy, S.; Boarnet, M.; Ewing, R.; Killingsworth, R. How the built environment affects physical activity: Views from urban planning. Am. J. Prev. Med. 2002, 23, 64–73. [Google Scholar] [CrossRef]
- Chan, E.T.H.; Schwanen, T.; Banister, D. The role of perceived environment, neighbourhood characteristics, and attitudes in walking behaviour: Evidence from a rapidly developing city in China. Transportation 2021, 48, 431–454. [Google Scholar] [CrossRef]
- Ball, K.; Jeffery, R.W.; Crawford, D.A.; Roberts, R.J.; Salmon, J.; Timperio, A.F. Mismatch between Perceived and Objective Measures of Physical Activity Environments. Prev. Med. 2008, 47, 294–298. [Google Scholar] [CrossRef] [PubMed]
- Orstad, S.L.; McDonough, M.H.; Stapleton, S.; Altincekic, C.; Troped, P.J. A systematic review of agreement between perceived and objective neighborhood environment measures and associations with physical activity outcomes. Environ. Behav. 2017, 49, 904–932. [Google Scholar] [CrossRef]
- Huang, X.; Han, C.; Ma, M. Visual preferences for outdoor space along commercial pedestrian streets under the influence of plant characteristics. PLoS ONE 2022, 17, e0264482. [Google Scholar] [CrossRef]
- Gehl, J. Life between Buildings: Using Public Space, 1st ed.; The Danish Architectural Press: København, Danmark, 2003; pp. 53–67. [Google Scholar]
- Nagata, S.; Nakaya, T.; Hanibuchi, T.; Amagasa, S.; Kikuchi, H.; Inoue, S. Objective scoring of streetscape walkability related to leisure walking: Statistical modeling approach with semantic segmentation of Google Street View images. Health Place 2020, 66, 102428. [Google Scholar] [CrossRef]
- Xu, G.; Zhong, L.; Wu, F.; Zhang, Y.; Zhang, Z. Impacts of Micro-Scale Built Environment Features on Tourists’ Walking Behaviors in Historic Streets: Insights from Wudaoying Hutong, China. Buildings 2022, 12, 2248. [Google Scholar] [CrossRef]
- Alfonzo, M.A. To Walk or Not to Walk? The Hierarchy of Walking Needs. Environ. Behav. 2005, 37, 808–836. [Google Scholar] [CrossRef]
- Aditjandra, P.T.; Mulley, C.A.; Nelson, J.D. Neighbourhood design impact on travel behaviour: A comparison of US and UK experience. Newctle. Univ. 2009, 9, 12–18. [Google Scholar]
- Young, G. Stimulus-organism-response model: Soring to new heights. Unifying Causality Psychol. 2016, 28, 699–717. [Google Scholar]
- Mokhtarian, C.P. Correlation or causality between the built environment and travel behavior? Evidence from Northern California. Transp. Res. Part D Transp. Environ. 2005, 10, 427–444. [Google Scholar]
- Bagley, M.N.; Mokhtarian, P.L. The impact of residential neighborhood type on travel behavior: A structural equations modeling approach. Ann. Reg. Sci. 2002, 36, 279–297. [Google Scholar] [CrossRef]
- Bosnjak, M.; Ajzen, I.; Schmidt, P. The Theory of Planned Behavior: Selected Recent Advances and Applications. Eur. J. Psychol. 2020, 16, 352–356. [Google Scholar] [CrossRef] [PubMed]
- Yang, Y.; Diez-Roux, A.V. Adults’ daily walking for travel and leisure: Interaction between attitude toward walking and the neighborhood environment. Am. J. Health Promot. 2017, 31, 435–443. [Google Scholar] [CrossRef]
- Larranaga, A.M.; Ignacio, R.L.; Arellana, J. The influence of built environment and travel attitudes on walking: A case study of Porto Alegre, Brazil. Int. J. Sustain. Transp. 2016, 10, 1–5. [Google Scholar] [CrossRef]
- Joh, K.; Mai, T.N.; Boarnet, M.G. Can Built and Social Environmental Factors Encourage Walking among Individuals with Negative Walking Attitudes? J. Plan. Educ. Res. 2012, 32, 219–236. [Google Scholar] [CrossRef]
- Cao, X.; Handy, S.L.; Mokhtarian, P.L. The Influences of the Built Environment and Residential Self-Selection on Pedestrian Behavior: Evidence from Austin, TX. Transportation 2006, 33, 1–20. [Google Scholar] [CrossRef]
- Hanibuchi, T.; Nakaya, T.; Yonejima, M.; Honjo, K. Perceived and objective measures of neighborhood walkability and physical activity among adults in Japan: A multilevel analysis of a nationally representative sample. Int. J. Environ. Res. Public Health 2015, 12, 13350–13364. [Google Scholar] [CrossRef] [PubMed]
- Koohsari, M.J.; McCormack, G.R.; Shibata, A.; Ishii, K.; Yasunaga, A.; Nakaya, T.; Oka, K. The relationship between walk score® and perceived walkability in ultrahigh density areas. Prev. Med. Rep. 2021, 23, 101393. [Google Scholar] [CrossRef] [PubMed]
- Guo, X.; Lai, J.D.; Ma, Z.F.; Xia, J.Z. A Study on the Consistency between Street View Survey and on-Site Survey: Shenzhen Example. Planners 2021, 38, 70–80. [Google Scholar]
- Zheng, Y. Research on Foramtion Pattern of Urban Image Based on Streetview Data: From the Perspective of Subjective Perception and Objective Enviroment Deviation. Ph.D. Dissertation, Southeast University, Nanjing, China, 2022. [Google Scholar]
- Cao, X.Y. Examining the Relationship between Neighborhood Built Environment and Travel Behavior: A Review from the US Perspective. Urban Plan. Int. 2015, 30, 46–52. [Google Scholar]
- Saelens, B.E.; Handy, S.L. Built Environment Correlates of Walking: A Review. Med. Sci. Sports Exerc. 2008, 40, S550–S556. [Google Scholar] [CrossRef]
- Shatu, F.; Tan, Y. Development and validity of a virtual street walkability audit tool for pedestrian route choice analysis—Swatch. J. Transp. Geogr. 2018, 70, 148–160. [Google Scholar] [CrossRef]
- Shatu, F.; Yigitcanlar, T.; Bunker, J. Shortest path distance vs. least directional change: Empirical testing of space syntax and geographic theories concerning pedestrian route choice behaviour. J. Transp. Geogr. 2019, 74, 37–52. [Google Scholar] [CrossRef]
- Basu, N.; Haque, M.M.; King, M.; Kamruzzaman, M.D. A systematic review of the factors associated with pedestrian route choice. Transp. Rev. 2021, 45, 672–694. [Google Scholar] [CrossRef]
- Ozbil, A.; Argin, G.; Yesiltepe, D. Pedestrian route choice by elementary school students: The role of street network configuration and pedestrian quality attributes in walking to school. Int. J. Des. Creat. Innov. 2016, 4, 67–84. [Google Scholar] [CrossRef]
- Yang, J.Y.; Wu, H.; Zhen, G.Y. Research on Characteristics and Interactive Mechanism of Street Walkability Through Multi-source Big Data: Nanjing Central District as a Case Study. Urban Plan. Int. 2019, 5, 33–42. [Google Scholar] [CrossRef]
- Jiang, B.; Mak, C.N.S.; Zhong, H.; Larsen, L.; Webster, C.J. From broken windows to perceived routine activities: Examining impacts of environmental interventions on perceived safety of urban alleys. Front. Psychol. 2018, 9, 2450. [Google Scholar] [CrossRef] [PubMed]
- Yuan, Q.; Chen, Y. Walkable Environments for the Elderly from the Perspective of Cognitive Impairment: A Case Study Based on Living in Downtown Shanghai. South Archit. 2022, 5, 64–72. [Google Scholar]
- Tribby, C.P.; Miller, H.J.; Brown, B.B.; Werner, C.M.; Smith, K.R. Analyzing walking route choice through built environments using random forests and discrete choice techniques. Environ. Plan 2017, 44, 1145–1167. [Google Scholar] [CrossRef]
- Guo, R.Y.; Huang, H.J.; Wong, S. Route choice in pedestrian evacuation under conditions of good and zero visibility: Experimental and simulation results. Transp. Res. Part B-Methodol. 2012, 46, 669–686. [Google Scholar] [CrossRef]
- Cerin, E.; Conway, T.L.; Saelens, B.E.; Frank, L.D.; Sallis, F. Cross-validation of the factorial structure of the Neighborhood Environment Walkability Scale (NEWS) and its abbreviated form (NEWS-A). Int. J. Behav. Nutr. Phys. Act. 2009, 6, 1–10. [Google Scholar] [CrossRef]
- Cerin, E.; Saelens, B.E.; Sallis, J.F.; Frank, L.D. Neighborhood Environment Walkability Scale: Validity and development of a short form. Med. Sci. Sports Exerc. 2006, 38, 1682–1691. [Google Scholar] [CrossRef] [PubMed]
- Werner, C.M.; Brown, B.B.; Gallimore, J. Light rail use is more likely on “walkable” blocks: Further support for using micro-level environmental audit measures. J. Environ. Psychol. 2010, 30, 206–214. [Google Scholar] [CrossRef]
- Klaus, G.; Adrian, B.; Neville, O. Correlates of Non-Concordance between Perceived and Objective Measures of Walkability. Ann. Behav. Med. A Publ. Soc. Behav. Med. 2009, 37, 228–238. [Google Scholar]
- Mccormack, G.R.; Cerin, E.; Leslie, E.; Toit, L.D.; Owen, N. Objective Versus Perceived Walking Distances to Destinations: Correspondence and Predictive Validity. Environ. Behav. 2008, 40, 401–425. [Google Scholar] [CrossRef]
- Richard, P.; Anke, A.; Horst Klazine, H.V.D.; Johannes, B. Objective and perceived availability of physical activity opportunities: Differences in associations with physical activity behavior among urban adolescents. Int. J. Behav. Nutr. Phys. Act. 2009, 6, 70. [Google Scholar]
- Kelsey, L.; Andrew, K. Correspondence of perceived vs. objective proximity to parks and their relationship to park-based physical activity. Int. J. Behav. Nutr. Phys. Act. 2009, 6, 53. [Google Scholar]
- Solbraa, A.K.; Anderssen, S.A.; Holme, I.M.; Kolle, E.; Hansen, B.H.; Ashe, M.C. The built environment correlates of objectively measured physical activity in Norwegian adults: A cross-sectional study. J. Sport Health Sci. 2018, 7, 19–26+127. [Google Scholar] [CrossRef] [PubMed]
- Shao, Y.; Ye, D.; Ye, Y. Measuring the Transparency of Street Interface Based on Street View Images and Deep Learning: Taking Shanghai as an Example. Urban Plan. Int. 2023, 06, 37–49. [Google Scholar]
- Liu, Z.Q.; Lv, J.J.; Yao, Y.; Zhang, J.Q.; Kou, S.H.; Guan, Q.F. Research method of interpretable urban perception model based on street view imagery. J. Geo-Inf. Sci. 2022, 24, 2045–2057. [Google Scholar]
- Wertheimer, M. Laws of Organization in Perceptual Forms. In A Source Book of Gestalt Psychology; Ellis, W.D., Ed.; Routledge and Kegan Paul: London, UK, 1938; pp. 71–88. [Google Scholar]
- Qin, Y.C.; Zhang, Y.K.; Yao, M.F.; Chen, Q.W. How to Measure the Impact of Walking Accessibility of Suburban Rail Station Catchment Areas on the Commercial Premium Benefits of Joint Development. Sustainability 2023, 15, 4897. [Google Scholar] [CrossRef]
- Alexander, C.; Ishikawa, S.; Silverstein, M.; Jacobson., M.; King, F.I.; Angel, S. A Pattern Language: Towns, Buildings, Construction, 1st ed.; Oxford University Press: Cambridge, MA, USA, 1977; pp. 1219–1232. [Google Scholar]
- Porta, S.; Crucitti, P.; Latora, V. The network analysis of urban streets: A primal approach. Environ. Plan. B: Plan. Des. 2023, 33, 705–725. [Google Scholar] [CrossRef]
- Batty, M. The New Science of Cities, 1st ed.; MIT Press: Cambridge, MA, USA, 2013; pp. 88–126. [Google Scholar]
- Ternero, R.; Sepúlveda, J.; Alfaro, M.; Fuertes, G.; Vargas, M.; Sepúlveda-Rojas, J.P.; Soto-Jancidakis, L. Analysis of Pedestrian Behavior for the Optimization of Evacuation Plans in Tall Buildings: Case Study Santiago, Chile. Buildings 2023, 13, 2907. [Google Scholar] [CrossRef]
- Ekstrom, A.D.; Huffman, D.J.; Starrett, M. Interacting networks of brain regions underlie human spatial navigation: A review and novel synthesis of the literature. J. Neurophysiol. 2017, 118, 3328–3344. [Google Scholar] [CrossRef] [PubMed]


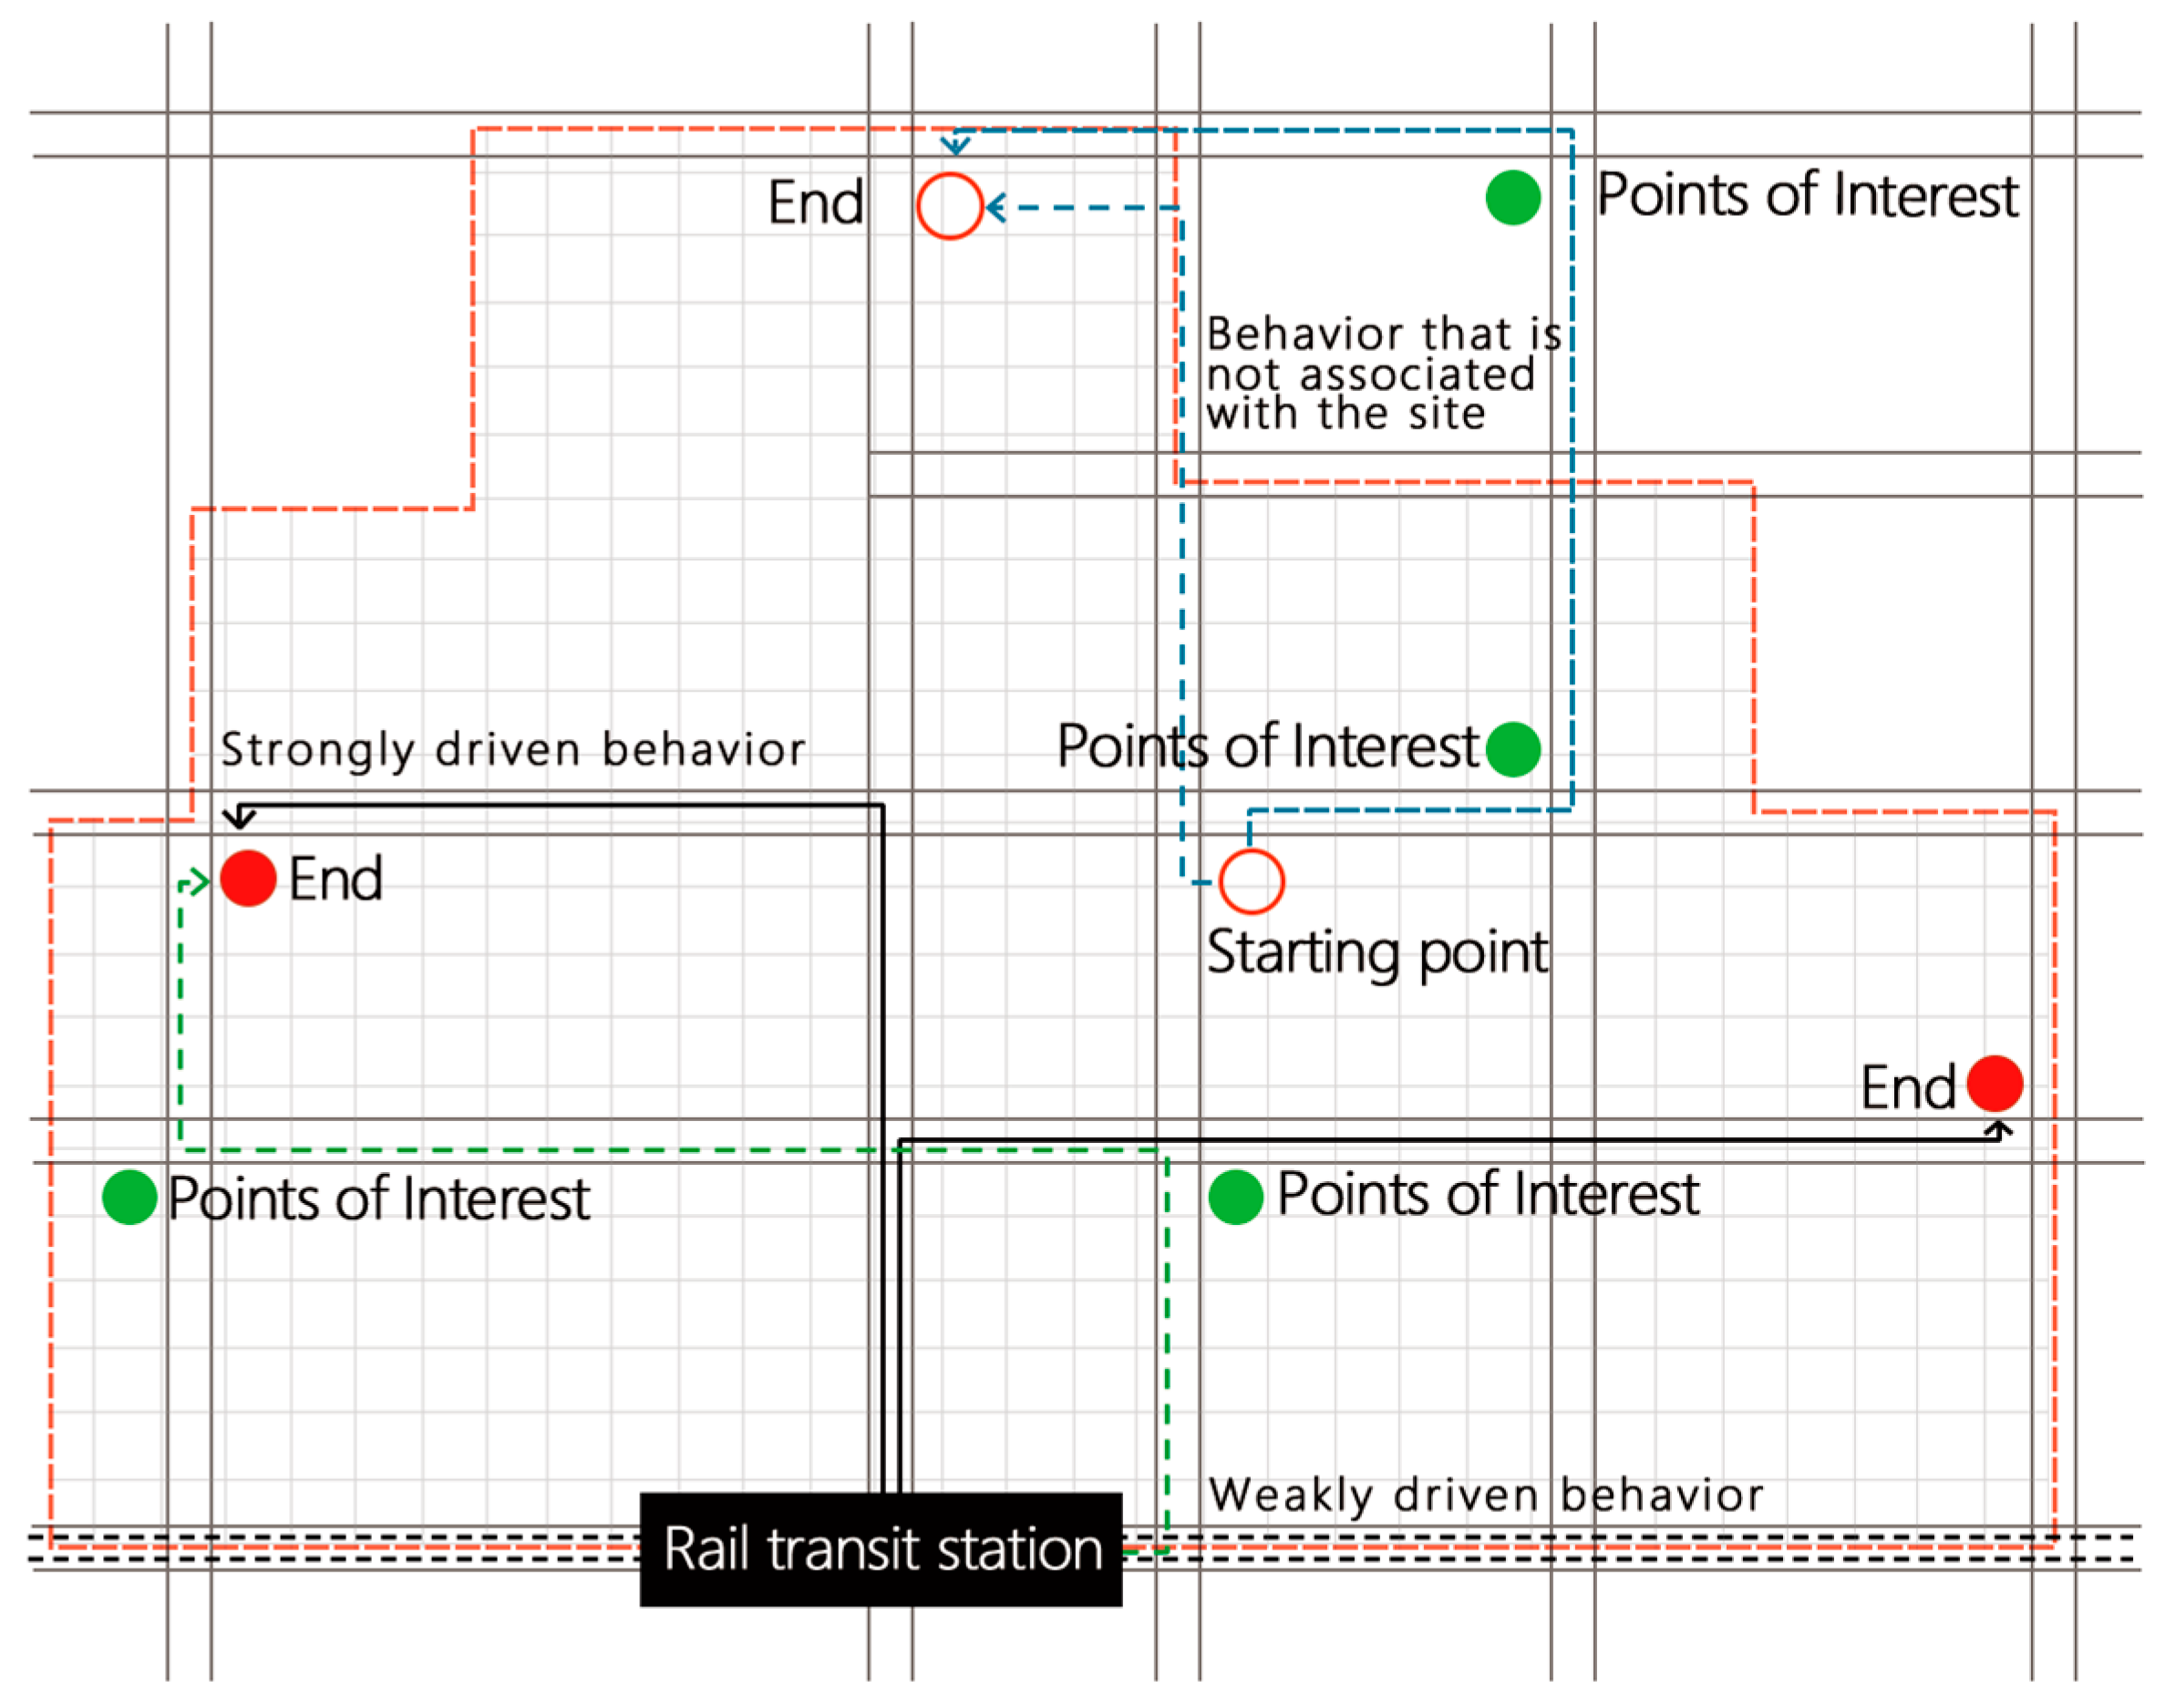
| Type of Behavior | Characterization | Type of Activity | Subject to Environmental Disturbance | Route Choice |
|---|---|---|---|---|
| Strong drive | Destination accessibility efficiency as the first requirement, with clear time constraints and relatively weak attraction of other points of interest along the way. | Work/school, transportation transfer, family affairs | Weak | Relatively fixed |
| Weak drive | No apparent purpose, no clear time constraints, strong attraction to points of interest along the way. | Leisure and shopping, domestic services, fitness workout | Strong | Generally random |
| Indicator Name | Calculation Method | |
|---|---|---|
| Walking trails | Walking path width | Average field measurements. |
| Pavement quality | The calculation method of pavement quality per unit street segment is the ratio of the walking space area after removing the damaged area of the pavement to the total area. The larger the value is, the better the quality is. | |
| Walking continuity | X = (X1 + X2 + X3 + ……Xn)/N; Xn is the walking continuity value of the nth street segment of the path; Xn = 1 − (transverse cross − sectional area/total area of street segment) × 100%. | |
| Obstacle level | The calculation method for a unit street segment is the ratio of the number of obstacles occupying the pedestrian space to the total area of the pedestrian path. | |
| Shade situation | The calculation method for unit street segments is to extract color patches from satellite plans and calculate the area ratio. | |
| Rest facilities | Count. | |
| Density of people | Count. | |
| Neighborhood design | Functional mix | X = −∑(Pi × LnPi). Among them, P1 = (N1 × A1)/(N1 × A1 + N2 × A2 + …Ni × Ai) Pi is the proportion of functional facilities in the i-th street and the A and N points determine the area and number of functional buildings. |
| Distance from exterior edge of building along street to sidewalk | Field measurement. | |
| Landscape greening level | Calculate the percentage of green area identified in street-view images. | |
| Consumer store density | The ratio of the total number of consumer stores (such as convenience stores, food, clothing, department stores, etc.) to the total number of facilities. | |
| Entertainment store density | The ratio of the total number of entertainment stores (such as KTV, chess and card rooms, etc.) to the total number of facilities. | |
| Service store density | The ratio of the total number of service stores (such as banks, activity centers, community studios, express delivery, hospitals, etc.) to the total number of facilities. | |
| Window transparency | The proportion of window display area facing the street space of shops along the street. Variables include the length of the open store interface with the facade fully opened (X1), the length of the transparent glass window interface that can directly see the interior (X2), and the length of the advertising glass window interface with product scenery (X3) (including opaque print advertisements). The weights are 1.25, 1, 0.75, and 0, in order, which are the ratios to the total length (AL) of the street facades on both sides. X = (X1 × 1.25 + X2 + X3 × 0.75)/total length of street wall facade (AL). | |
| Activity record | Count. | |
| Degree of surveillance | X = S people/S total; S people represents the pixel area occupied by pedestrians in the street-view image and S total is the overall pixel area. | |
| Traffic environment | Difficulty of crossing the intersection | Calculate the waiting and crossing time as the total time and measure the crossing difficulty in minutes. Path level score total time. |
| Motor vehicle traffic | Track and record the average traffic volume of the street segment during the period when the target individual passes through the street. | |
| People and vehicle isolation facilities | The sum of the lengths of pedestrian and vehicle isolation facilities (guardrails, green belts, etc.) for each street segment is divided by the total length of the street segment. The entire line level is the average of the street segment level. | |
| Non-motor vehicle traffic density | Track and record the average number of non-motorized vehicles (bicycles, electric vehicles, shared trams, etc.) that the target individual passes on the street during a period of time. | |
| Crossing the street along the way | The opening along the line can be calculated by the ratio of the transverse length to the length of the entire isolation fence. | |
| The number of other types of roads that the path connects to | Count. | |
| The number of service roads connected at the end of the street segment | Count. | |
| Path attribute | The shortest distance from the starting point | ArcGIS calculation |
| Actual walking distance | ||
| Detour rate | PRD = D1/D2; D1 is the actual walking distance and D2 is the shortest path distance calculated based on GIS. | |
| Direction change rate | R = D1/D2 (the sum of angle changes during the pedestrian’s actual walking journey divided by the sum of angle changes when following the shortest route). | |
| Road segment node ratio | LNR = Number of road segments/(number of intersections + number of end nodes at the end of the road). | |
| Walking speed | X = (X1 + X2 + X3 + ……Xn)/n. The cumulative speed Xi of each street segment is divided by the number of street segments to obtain the average speed. | |
| Route type | 0 represents weak driving behavior; 1 represents strong driving behavior. (see Section 5.2 for specific event types of walking behavior) |
| Category | Subjective Attitude |
|---|---|
| Route preferences | The shortest time |
| Shortest distance | |
| Daily habits | |
| Direct direction | |
| Walking experience | Good quality sidewalk walking space |
| Fewer obstacles to walking | |
| There are more recreational facilities available | |
| Not crowded | |
| Others choose to go on this route too | |
| Neighborhood feel | Good privacy and security |
| This street has people/buildings, landscapes, shops, etc. that can attract attention | |
| There are more urban activities happening | |
| You can see the activities inside the shops along the way | |
| Shopping, dining, and other needs can be met along the way | |
| Traffic perception | Convenient to cross the street |
| The route does not need to pass through more roads with complex traffic environments | |
| Good connection with other sidewalks/pedestrian streets/passages | |
| Lower non-pedestrian traffic |
| Hierarchy of Needs | Reason for Route Selection | Subjective | Objective | Objective Descriptive Indicators |
|---|---|---|---|---|
| Route preferences | The shortest time | 0/1 | 0/1 | Detour rate |
| direct direction | 0/1 | 0/1 | Direct rate | |
| Walking experience | Good quality walking trails | 0/1 | 0/1 | Walking paths are uniformly wide |
| 0/1 | 0/1 | Walking continuous level | ||
| 0/1 | 0/1 | Pedestrian pavement quality | ||
| There are few facilities to hinder | 0/1 | 0/1 | Number of obstacles (trash cans, parking spaces, store signs, etc.) | |
| There are many recreational facilities to assist walking. | 0/1 | 0/1 | Shade area ratio (shade ratio, awning, etc.) | |
| 0/1 | 0/1 | Rest facilities | ||
| Not crowded | 0/1 | 0/1 | Traffic density during slicing period | |
| Neighborhood feel | Good privacy and security | 0/1 | 0/1 | The distance between the building facing the street and the pedestrian path |
| 0/1 | 0/1 | Crowd surveillance | ||
| High visual appeal (Internet celebrity buildings, landscapes, public art, etc.) | 0/1 | 0/1 | Density of cultural and entertainment facilities | |
| 0/1 | 0/1 | Greening rate level | ||
| Shopping, dining, and other needs can be met along the way. | 0/1 | 0/1 | Functional mix | |
| 0/1 | 0/1 | Density of consumer facilities along the street | ||
| 0/1 | 0/1 | Window transparency | ||
| There are many activities to stop and participate in. | 0/1 | 0/1 | Number of active events along the route (occurring regularly) | |
| Traffic perception | Cross city roads with ease | 0/1 | 0/1 | Intersection crossing level |
| 0/1 | 0/1 | Crossing levels along the road | ||
| Stable walking environment | 0/1 | 0/1 | Level of isolation facilities for people and vehicles | |
| 0/1 | 0/1 | Non-motor vehicle traffic density | ||
| Lower traffic flow | 0/1 | 0/1 | Vehicle traffic level | |
| 0/1 | 0/1 | Number of other types of lanes connected at the end of the street segment | ||
| Connected to other important roads (paths connecting city squares, branch roads entering shopping malls, pedestrian streets, etc.) | 0/1 | 0/1 | Road segment node ratio | |
| 0/1 | 0/1 | The number of other types of roads that can be connected along the street segment |
| Interaction Metrics | Frequency | Subjective | Objective | Interaction Metrics | Frequency | Subjective | Objective |
|---|---|---|---|---|---|---|---|
| Shortest distance | 177 | 1 | 1 | High visual appeal | 60 | 1 | 1 |
| 67 | 1 | 0 | 144 | 1 | 0 | ||
| 65 | 0 | 1 | 128 | 0 | 1 | ||
| 104 | 0 | 0 | 78 | 0 | 0 | ||
| Direct direction | 65 | 1 | 1 | Meet consumer needs along the way | 119 | 1 | 1 |
| 121 | 1 | 0 | 103 | 1 | 0 | ||
| 153 | 0 | 1 | 81 | 0 | 1 | ||
| 71 | 0 | 0 | 107 | 0 | 0 | ||
| Good walking quality | 57 | 1 | 1 | City activity attraction | 188 | 1 | 1 |
| 102 | 1 | 0 | 65 | 1 | 0 | ||
| 158 | 0 | 1 | 59 | 0 | 1 | ||
| 93 | 0 | 0 | 108 | 0 | 0 | ||
| Smooth and continuous walking | 65 | 1 | 1 | Cross city roads with ease | 126 | 1 | 1 |
| 114 | 1 | 0 | 89 | 1 | 0 | ||
| 172 | 0 | 1 | 82 | 0 | 1 | ||
| 59 | 0 | 0 | 113 | 0 | 0 | ||
| There are many walking facilities | 114 | 1 | 1 | Stable walking environment | 64 | 1 | 1 |
| 163 | 1 | 0 | 171 | 1 | 0 | ||
| 70 | 0 | 1 | 116 | 0 | 1 | ||
| 63 | 0 | 0 | 59 | 0 | 0 | ||
| Not crowded | 68 | 1 | 1 | Lower non-pedestrian traffic | 66 | 1 | 1 |
| 142 | 1 | 0 | 157 | 1 | 0 | ||
| 127 | 0 | 1 | 128 | 0 | 1 | ||
| 73 | 0 | 0 | 59 | 0 | 0 | ||
| Good privacy and security | 73 | 1 | 1 | Have better connectivity | 120 | 1 | 1 |
| 117 | 1 | 0 | 91 | 1 | 0 | ||
| 136 | 0 | 1 | 71 | 0 | 1 | ||
| 84 | 0 | 0 | 128 | 0 | 0 |
| Path Plan Serial Number | Travel Plan |
|---|---|
| ① | Morning rush hour → Walk 400–700 m → Work/School |
| ② | Morning rush hour → Walk 700–1000 m → Work/School |
| ③ | Morning rush hour → Walk 1100–1500 m → Go home |
| ④ | Noon rush hour → Walk 400–700 m → Family shopping |
| Interaction Variable | Protocol Measurement Kappa Value | Consistent Decision Making (%) | Positive Deviation (%) | Negative Deviation (%) | |
|---|---|---|---|---|---|
| Morning peak | Shortest distance | 0.366 *** | 74.20 | 14.53 | 11.27 |
| Direct direction | 0.301 *** | 63.87 | 12.21 | 23.92 | |
| Good walking quality | −0.086 *** | 40.83 | 27.04 | 33.13 | |
| Smooth and continuous walking | −0.154 *** | 24.16 | 31.17 | 54.67 | |
| There are many walking facilities | −0.053 ** | 44.12 | 25.73 | 20.15 | |
| Not crowded | −0.211 *** | 34.14 | 38.31 | 27.55 | |
| Good privacy and security | −0.066 *** | 45.70 | 21.61 | 33.29 | |
| High visual appeal | −0.232 *** | 33.55 | 33.02 | 32.43 | |
| Meet consumer needs along the way | −0.141 *** | 37.62 | 27.64 | 34.74 | |
| City activity attraction | −0.102 *** | 41.26 | 23.01 | 35.73 | |
| Cross city roads with ease | 0.103 *** | 39.10 | 30.85 | 30.05 | |
| Stable walking environment | −0.247 ** | 38.17 | 39.76 | 22.07 | |
| Lower non-pedestrian traffic | −0.210 *** | 33.20 | 44.61 | 22.19 | |
| Have better connectivity | 0.392 *** | 81.37 | 11.50 | 7.33 | |
| Noon peak | Shortest distance | 0.403 *** | 84.12 | 8.80 | 7.38 |
| Direct direction | −0.346 *** | 32.11 | 26.60 | 41.29 | |
| Good walking quality | −0.043 *** | 49.10 | 20.63 | 20.27 | |
| Smooth and continuous walking | −0.161 *** | 39.14 | 33.31 | 27.55 | |
| There are many walking facilities | −0.017 *** | 46.86 | 29.17 | 23.97 | |
| Not crowded | −0.076 *** | 45.22 | 37.68 | 17.10 | |
| Good privacy and security | −0.067 *** | 46.10 | 26.29 | 27.61 | |
| High visual appeal | −0.121 *** | 35.06 | 35.72 | 29.22 | |
| Meet consumer needs along the way | −0.321 *** | 22.73 | 18.37 | 58.90 | |
| City activity attraction | −0.234 *** | 34.04 | 33.49 | 32.47 | |
| Cross city roads with ease | 0.161 *** | 41.22 | 23.05 | 35.73 | |
| Stable walking environment | 0.084 ** | 49.12 | 24.08 | 26.80 | |
| Lower non-pedestrian traffic | −0.271 *** | 29.62 | 23.18 | 47.20 | |
| Have better connectivity | 0.411 *** | 85.54 | 10.74 | 5.47 | |
| Evening peak | Shortest distance | 0.243 *** | 62.36 | 20.36 | 17.28 |
| Direct direction | 0.101 * | 51.50 | 16.49 | 32.01 | |
| Good walking quality | −0.398 * | 19.38 | 23.50 | 57.12 | |
| Smooth and continuous walking | −0.302 ** | 20.33 | 37.06 | 42.61 | |
| There are many walking facilities | −0.291 *** | 25.09 | 26.88 | 48.03 | |
| Not crowded | 0.090 | 31.03 | 42.09 | 26.88 | |
| Good privacy and security | −0.287 *** | 24.62 | 28.08 | 47.30 | |
| High visual appeal | 0.112 *** | 54.32 | 30.09 | 17.59 | |
| Meet consumer needs along the way | −0.098 * | 47.55 | 16.60 | 47.30 | |
| City activity attraction | 0.254 *** | 58.17 | 16.49 | 35.85 | |
| Cross city roads with ease | −0.090 *** | 41.16 | 39.76 | 19.08 | |
| Stable walking environment | −0.523 ** | 11.42 | 54.05 | 34.53 | |
| Lower non-pedestrian traffic | −0.480 *** | 15.24 | 62.09 | 22.67 | |
| Have better connectivity | 0.371 *** | 77.03 | 17.16 | 5.81 |
| Interaction Variable | Protocol Measurement Kappa Value | Consistent Decision Making (%) | Positive Deviation (%) | Negative Deviation (%) | |
|---|---|---|---|---|---|
| 400–700 | Shortest distance | 0.391 *** | 78.04 | 16.22 | 5.74 |
| Direct direction | 0.132 *** | 56.33 | 30.21 | 13.46 | |
| Good walking quality | −0.102 *** | 30.42 | 18.49 | 51.09 | |
| Smooth and continuous walking | −0.114 *** | 27.15 | 28.28 | 44.57 | |
| There are many walking facilities | −0.092 *** | 41.80 | 16.55 | 41.65 | |
| Not crowded | −0.178 *** | 27.16 | 45.89 | 26.95 | |
| Good privacy and security | −0.402 *** | 16.23 | 17.69 | 66.08 | |
| High visual appeal | −0.367 ** | 19.41 | 23.36 | 54.23 | |
| Meet consumer needs along the way | −0.215 *** | 33.24 | 26.75 | 40.01 | |
| City activity attraction | −0.341 * | 20.11 | 52.07 | 27.82 | |
| Cross city roads with ease | −0.211 *** | 39.31 | 32.15 | 28.54 | |
| Stable walking environment | −0.276 ** | 30.79 | 28.05 | 41.16 | |
| Lower non-pedestrian traffic | −0.252 *** | 32.08 | 41.33 | 26.59 | |
| Have better connectivity | 0.341 *** | 72.11 | 13.43 | 14.46 | |
| 700–1100 | Shortest distance | 0.309 ** | 64.12 | 20.20 | 15.68 |
| Direct direction | 0.146 | 33.12 | 37.62 | 29.27 | |
| Good walking quality | −0.378 *** | 17.01 | 19.73 | 63.26 | |
| Smooth and continuous walking | −0.224 ** | 21.03 | 40.16 | 38.81 | |
| There are many walking facilities | 0.089 *** | 48.82 | 30.16 | 21.02 | |
| Not crowded | −0.273 *** | 30.11 | 39.98 | 29.91 | |
| Good privacy and security | −0.220 *** | 32.04 | 12.80 | 55.16 | |
| High visual appeal | 0.104 * | 36.02 | 37.16 | 26.82 | |
| Meet consumer needs along the way | 0.288 *** | 61.40 | 28.03 | 10.57 | |
| City activity attraction | 0.165 ** | 45.11 | 15.60 | 39.29 | |
| Cross city roads with ease | 0.078 ** | 46.20 | 13.75 | 40.05 | |
| Stable walking environment | −0.144 ** | 25.50 | 23.59 | 50.91 | |
| Lower non-pedestrian traffic | −0.211 *** | 26.91 | 32.89 | 40.20 | |
| Have better connectivity | 0.287 *** | 60.72 | 19.00 | 20.28 | |
| 1100–1500 | Shortest distance | 0.176 | 30.02 | 42.31 | 27.67 |
| Direct direction | 0.141 | 17.65 | 8.73 | 73.62 | |
| Good walking quality | −0.056 *** | 17.13 | 19.67 | 63.20 | |
| Smooth and continuous walking | −0.077 * | 15.07 | 17.92 | 67.01 | |
| There are many walking facilities | 0.081 ** | 40.11 | 15.06 | 44.83 | |
| Not crowded | −0.041 *** | 17.90 | 27.88 | 54.22 | |
| Good privacy and security | −0.019 *** | 14.52 | 18.03 | 67.45 | |
| High visual appeal | −0.080 *** | 41.17 | 29.93 | 28.90 | |
| Meet consumer needs along the way | 0.366 *** | 74.11 | 17.72 | 91.83 | |
| City activity attraction | 0.202 * | 51.03 | 32.07 | 16.90 | |
| Cross city roads with ease | −0.127 ** | 32.10 | 19.80 | 48.10 | |
| Stable walking environment | 0.055 | 20.45 | 25.43 | 54.12 | |
| Lower non-pedestrian traffic | −0.045 ** | 15.89 | 29.55 | 54.56 | |
| Have better connectivity | 0.310 ** | 60.09 | 13.28 | 26.63 |
| Interaction Variable | Protocol Measurement Kappa Value | Consistent Decision Making (%) | Positive Deviation (%) | Negative Deviation (%) | |
|---|---|---|---|---|---|
| Strong drive | Shortest distance | 0.455 *** | 87.02 | 9.14 | 3.84 |
| Direct direction | 0.231 ** | 52.55 | 26.37 | 21.08 | |
| Good walking quality | 0.020 | 16.98 | 7.92 | 75.10 | |
| Smooth and continuous walking | −0.086 *** | 44.20 | 19.36 | 36.44 | |
| There are many walking facilities | −0.112 *** | 16.62 | 22.34 | 61.04 | |
| Not crowded | −0.211 ** | 16.02 | 38.20 | 45.78 | |
| Good privacy and security | −0.544 *** | 13.21 | 29.17 | 57.62 | |
| High visual appeal | 0.120 | 27.08 | 34.18 | 38.74 | |
| Meet consumer needs along the way | −0.112 ** | 27.11 | 26.08 | 46.81 | |
| City activity attraction | 0.401 *** | 77.02 | 10.23 | 12.75 | |
| Cross city roads with ease | 0.143 *** | 54.34 | 13.69 | 31.97 | |
| Stable walking environment | −0.202 ** | 17.81 | 26.54 | 30.14 | |
| Lower non-pedestrian traffic | −0.264 *** | 19.53 | 29.78 | 50.69 | |
| Have better connectivity | 0.389 *** | 70.03 | 12.34 | 17.63 | |
| Weak drive | Shortest distance | 0.067 * | 17.33 | 59.46 | 23.21 |
| Direct direction | −0.232 ** | 15.88 | 57.39 | 26.73 | |
| Good walking quality | −0.566 ** | 13.06 | 40.11 | 46.83 | |
| Smooth and continuous walking | −0.442 | 11.21 | 42.08 | 46.71 | |
| There are many walking facilities | 0.217 *** | 48.46 | 27.21 | 24.33 | |
| Not crowded | −0.370 *** | 32.31 | 39.18 | 28.51 | |
| Good privacy and security | −0.302 ** | 38.93 | 20.37 | 40.70 | |
| High visual appeal | 0.221 ** | 50.47 | 14.47 | 35.06 | |
| Meet consumer needs along the way | −0.244 ** | 14.02 | 18.48 | 67.50 | |
| City activity attraction | 0.118 *** | 30.23 | 28.06 | 41.71 | |
| Cross city roads with ease | −0.311 ** | 62.08 | 10.11 | 27.81 | |
| Stable walking environment | −0.184 *** | 17.09 | 42.12 | 40.79 | |
| Lower non-pedestrian traffic | −0.578 ** | 11.20 | 66.02 | 22.78 | |
| Have better connectivity | 0.212 *** | 57.02 | 10.21 | 27.77 |
| B | Exp (B) | Degrees of Freedom | Significance (p) | 95% Confidence Interval for EXP (B) | ||
|---|---|---|---|---|---|---|
| Lower Limit | Upper Limit | |||||
| Route distance | — | — | — | — | — | — |
| Direction of travel | — | — | — | — | — | — |
| Walking trail quality | 1.140 | 3.126 | 1 | 0.000 | 2.073 | 4.717 |
| Smooth and continuous walking | −0.318 | 0.727 | 1 | 0.138 | 0.477 | 1.108 |
| Support pedestrian facilities | −0.361 *** | 0.697 | 1 | 0.027 | −0.554 | 5.902 |
| Not crowded | 0.483 | 1.620 | 1 | 0.380 | 0.254 | 2.153 |
| Privacy and security | 0.281 | 1.325 | 1 | 0.167 | 0.042 | 0.824 |
| visual appeal. | 1.011 ** | 2.748 | 1 | 0.000 | 1.025 | 4.076 |
| Meet consumer needs along the way | −0.179 *** | 0.836 | 1 | 0.023 | −0.234 | 2.462 |
| City activity attraction | 0.717 ** | 2.048 | 1 | 0.041 | 0.319 | 0.994 |
| Cross city roads with ease | 0.845 *** | 2.328 | 1 | 0.000 | 1.605 | 6.467 |
| Stable walking environment | 1.056 | 2.875 | 1 | 0.001 | 1.562 | 4.033 |
| Lower non-pedestrian traffic | −0.966 | 0.380 | 1 | 0.000 | 0.243 | 0.595 |
| Have better connectivity | 1.446 *** | 4.246 | 1 | 0.000 | 1.021 | 5.769 |
| The perceived synergy is recorded as (0), the positive deviation is recorded as (1), and the negative deviation is recorded as (2). The perceived synergy is used as the reference group. | ||||||||||||||
| Explanatory Variables | Shortest Distance | Direct Direction | Walking Quality | Easy to Walk | Support Pedestrian Facilities | Not Crowded | Shortest Distance | |||||||
| 1 | 2 | 1 | 2 | 1 | 2 | 1 | 2 | 1 | 2 | 1 | 2 | 1 | 2 | |
| Age | ||||||||||||||
| 15–25 years old | — | — | — | — | — | — | — | — | — | — | — | — | — | — |
| 26–45 years old | 0.688 ** | 0.421 ** | 1.171 *** | 0.714 *** | 0.824 *** | 0.408 ** | 0.113 | 0.186 ** | 0.723 ** | 0.351 * | 1.154 ** | 0.247 ** | 1.504 *** | 0.620 ** |
| Over 46 years old | −0.367 * | −0.762 * | −0.254 | −0.426 ** | −0.549 ** | −0.315 ** | 0.362 ** | 0.243 *** | 0.094 ** | 1.120 * | 0.776 | 1.041 | 1.022 | 0.326 * |
| Gender | ||||||||||||||
| 1 | 1.223 *** | −0.720 *** | 1.020 *** | 0.063 | 0.801 ** | 0.922 | −1.451 ** | −1.026 * | −1.021 ** | −0.630 * | 0.216 ** | 0.419 * | 0.834 * | 0.530 *** |
| 0 | — | — | — | — | — | — | — | — | — | — | — | — | — | — |
| Education level | ||||||||||||||
| High school, junior college, and below | — | — | — | — | — | — | — | — | — | — | — | — | — | — |
| Bachelor degree and above | 0.811 * | 0.452 * | 0.326 | 0.290 | 0.565 ** | 0.209 * | 0.736 | −0.642 * | 0.404 | −0.773 | 1.055 | −0.546 * | 0.743 | 0.611 |
| Individual/family income (year) | ||||||||||||||
| Less than RMB 100,000 | — | — | — | — | — | — | — | — | — | — | — | — | — | — |
| 100,000–200,000 RMB | 0.501 | 0.917 | 1.405 | 0.805 | 1.578 | 0.711 ** | 1.525 | 0.813 *** | 1.578 * | 0.913 | 1.525 | 0.813 | 0.113 | 0.457 |
| More than 200,000 | 0.639 * | 0.209 * | 0.318 | 0.660 | 0.422 * | 0.223 * | 0.342 * | 0.667 * | 0.503 | 0.279 | 0.422 | 0.301 | 0.405 | 0.654 |
| Do you have a driving license? | ||||||||||||||
| Yes | 0.603 ** | 0.458 ** | 0.613 | 0.339 | 0.437 | −0.313 | −0.616 ** | −0.702 * | −1.276 ** | 0.786 * | 0.762 | 0.610 | 1.651 | 1.424 |
| No | — | — | — | — | — | — | — | — | — | — | — | — | — | — |
| Select motor vehicle travel frequency | ||||||||||||||
| Occasionally | 1.241 *** | 0.262 | 0.985 ** | 0.732 ** | 0.726 * | 1.026 * | 1.121 *** | 0.533 * | 0.468 *** | 0.619 | 0.475 *** | 0.445 | 1.667 *** | 0.313 |
| Generally | 0.886 *** | 0.451 | 0.833 *** | 0.510 ** | 0.507 * | 0.414 ** | 0.414 ** | 0.126 * | 0.311 | 0.420 | 0.310 ** | 0.276 | 0.774 ** | 0.604 |
| Frequently | — | — | — | — | — | — | — | — | — | — | — | — | — | — |
| Years of residence in this city | ||||||||||||||
| In less than a year | — | — | — | — | — | — | — | — | — | — | — | — | — | — |
| 2–5 years | 0.472 *** | 0.271 ** | 0.275 *** | 0.232 ** | 0.426 | 0.074 | 1.022 *** | 0.533 | 0.468 | 0.619 | 0.306 | 0.350 | 0.768 | 0.511 |
| More than 5 years | 0.80 3*** | 0.164 ** | 0.569 *** | 0.410 ** | 0.612 ** | 0.423 | 0.414 ** | 0.127 | 0.311 | 0.403 | 0.410 | 0.276 | 0.406 | 0.322 |
| Weather conditions affect travel | ||||||||||||||
| Yes | 1.043 ** | 0.568 *** | 0.704 *** | 0.631 ** | 0.511 *** | 0.102 * | 1.043 ** | 0.620 *** | 0.577 *** | 1.083 ** | 1.015 *** | 0.665 ** | 1.776 *** | 0.665 ** |
| No | — | — | — | — | — | — | — | — | — | — | — | — | — | — |
| The perceived synergy is recorded as (0), the positive deviation is recorded as (1), and the negative deviation is recorded as (2). The perceived synergy is used as the reference group. | ||||||||||||||
| Explanatory Variables | Good Privacy Security | Lower Non-Pedestrian Traffic | Better Connectivity | Consumption Needs Can Be Met along the Way | Activities Available | Cross City Roads with Ease | Stable Walking Environment | |||||||
| 1 | 2 | 1 | 2 | 1 | 2 | 1 | 2 | 1 | 2 | 1 | 2 | 1 | 2 | |
| age | ||||||||||||||
| 15–25 years old | — | — | — | — | — | — | — | — | — | — | — | — | — | — |
| 26–45 years old | 1.066 | 0.532 * | 0.446 ** | −0.722 | −1.367 *** | 0.480 | 0.662 ** | 0.157 *** | 1.026 ** | 0.762 *** | 0.548 * | 0.125 | 0.554 *** | 0.326 * |
| Over 46 years old | 0.631 | 0.164 * | 0.801 ** | −0.620 | 0.911 ** | 0.203 | 0.320 * | 0.031 *** | 0.681 | 0.473 | 0.251 | 0.087 | 0.830 * | 0.028 |
| gender | ||||||||||||||
| 1 | −0.725 *** | −0.532 *** | −1.446 ** | −0.657 ** | 0.541 *** | 0.432 * | −1.754 *** | −0.561 *** | 0.613 ** | 1.138 ** | 0.681 ** | 0.223 | −1.330 ** | −0.676 * |
| 0 | — | — | — | — | — | — | — | — | — | — | — | — | — | — |
| Education level | ||||||||||||||
| High school, junior college, and below | — | — | — | — | — | — | — | — | — | — | — | — | — | — |
| Bachelor degree and above | 0.362 | 0.257 | 0.415 | 0.290 * | 0.565 | 0.402 | 0.407 * | −0.320 | 0.427 * | −0.622 * | 1.074 | −1.251 ** | 0.536 | −0.621 |
| Individual/family income (year) | ||||||||||||||
| Less than RMB 100,000 | — | — | — | — | — | — | — | — | — | — | — | — | — | — |
| 100,000–200,000 RMB | −0.621 | −0.407 | −1.02 | −0.402 | 0.710 *** | 0.420 | 0.140 *** | −0.229 | 0.340 ** | 1.182 | 0.681 | 0.250 | −1.011 * | −0.589 |
| More than 200,000 | −0.553 | −0.682 | −1.44 | −0.657 | 0.902 ** | 0.456 | 1.223 *** | −0.364 * | 0.795 * | 1.529 | 0.420 | 0.541 | −1.510 ** | −0.024 |
| Do you have a driving license? | ||||||||||||||
| yes | 1.451 | 1.030 | 0.878 ** | 0.562 * | 1.042 *** | 0.356 | 1.138 *** | 0.147 ** | 1.175 ** | 0.470 ** | 1.005 ** | 0.257 * | 0.761 *** | 0.450 |
| no | — | — | — | — | — | — | — | — | — | — | — | — | — | — |
| Select motor vehicle travel frequency | ||||||||||||||
| Occasionally | 1.422 | 1.016 | 1.335 *** | 0.526 | 1.431 *** | 0.220 * | 0.782 ** | 0.422 ** | 1.121 ** | 0.652 | 1.015 ** | 0.660 | 0.655 | 0.361 |
| Generally | 0.510 | 0.403 | 1.120 ** | 0.210 | 0.566 *** | 0.637 | 0.531 ** | 0.360 * | 1.220 *** | 0.530 | 1.038 *** | 0.433 | 1.112 ** | 0.550 |
| Frequently | — | — | — | — | — | — | — | — | — | — | — | — | — | — |
| Years of residence in this city | ||||||||||||||
| In less than a year | — | — | — | — | — | — | — | — | — | — | — | — | — | — |
| 2–5 years | 0.621 | 0.330 | 0.782 | 0.221 | 0.623 | 0.108 | 0.234 ** | 0.426 ** | 0.542 | 0.654 | 0.420 * | 0.520 * | 0.211 | 0.437 |
| More than 5 years | 1.155 | 0.728 | 1.022 | 0.542 | 0.211 | 0.042 | 0.665 *** | 0.588 ** | 0.206 | 0.778 | 0.657 *** | 0.601 ** | 0.430 ** | 0.720 |
| Weather conditions affect travel | ||||||||||||||
| Yes | 0.574 ** | 0.420 ** | 1.22 2 *** | 0.567 ** | 0.106 * | 0.412 | 0.680 *** | 0.502 | 1.041 ** | 0.723 * | 1.110 | 0.443 | 1.125 | 0.567 |
| No | — | — | — | — | — | — | — | — | — | — | — | — | — | — |
Disclaimer/Publisher’s Note: The statements, opinions and data contained in all publications are solely those of the individual author(s) and contributor(s) and not of MDPI and/or the editor(s). MDPI and/or the editor(s) disclaim responsibility for any injury to people or property resulting from any ideas, methods, instructions or products referred to in the content. |
© 2024 by the authors. Licensee MDPI, Basel, Switzerland. This article is an open access article distributed under the terms and conditions of the Creative Commons Attribution (CC BY) license (https://creativecommons.org/licenses/by/4.0/).
Share and Cite
Chen, Q.; Qin, Y.; Yao, M.; Zhang, Y.; Zhai, Z. The Consistency of Subjective and Objective Factors Influencing Walking Path Choice around Rail Transit Stations. Buildings 2024, 14, 2225. https://doi.org/10.3390/buildings14072225
Chen Q, Qin Y, Yao M, Zhang Y, Zhai Z. The Consistency of Subjective and Objective Factors Influencing Walking Path Choice around Rail Transit Stations. Buildings. 2024; 14(7):2225. https://doi.org/10.3390/buildings14072225
Chicago/Turabian StyleChen, Qiwei, Yuchen Qin, Minfeng Yao, Yikang Zhang, and Zhijunjie Zhai. 2024. "The Consistency of Subjective and Objective Factors Influencing Walking Path Choice around Rail Transit Stations" Buildings 14, no. 7: 2225. https://doi.org/10.3390/buildings14072225