Article

Study on Stability and Deformation Characteristics of Ultra-Deep Diaphragm Wall during Trench Excavation

1
China Harbour Engineering Co., Ltd., Beijing 100027, China
2
China Gezhouba Group Investigation & Design Co., Ltd., Wuhan 430000, China
3
School of Civil Engineering and Architecture, Wuhan University of Technology, 122 Luoshi Rd., Wuhan 430070, China
*
Author to whom correspondence should be addressed.
Buildings 2024, 14(7), 2227; https://doi.org/10.3390/buildings14072227
Submission received: 17 May 2024 / Revised: 15 July 2024 / Accepted: 16 July 2024 / Published: 19 July 2024
(This article belongs to the Section Building Energy, Physics, Environment, and Systems)

Abstract

:
The stability and deformation during trenching of ultra-deep diaphragm walls have a greater impact on the construction of diaphragm walls. The conventional limit equilibrium method, known as the vertical slices method, assumes homogeneity within the rock and soil mass, making it challenging to account for their stratification. Based on the limit equilibrium method, the horizontal strip method takes into account the stratification of the foundation soil. Based on the actual project, considering the different mud unit weights and heights, the horizontal strip method was used to analyze the stability of the groove trench and analyze the deformation law of the groove trench by the finite element method. The results indicate the following: The horizontal strip method can effectively assess the influence law of mud weight and height on the safety coefficient of groove trench stabilization. The higher the unit weight and level of slurry, the greater the wall safety coefficient. Moreover, the mud unit weight obtained by the horizontal strip method is about 12.70~12.64 kN/m3, which is close to the actual maximum mud weight of 12.5 kN/m3. The estimated mud unit weight aligns more closely with actual conditions. Additionally, through finite element analysis, the deformation law of the groove trench of ultra-deep diaphragm walls has been analyzed and summarized. The soil around the groove trench does not move inward, which shows three different deformation modes with different depths.

1. Introduction

As urbanization continues to progress, the demand for construction projects in deep underground areas increases. In the construction process of subway projects, basements of ultra-high-rise buildings, underground projects of rainwater and sewage treatment, sponge cities, and so on, the problem of pit engineering is also becoming more and more complicated. Diaphragm walls are widely used in deep and large foundation pit projects because of their advantages such as high stiffness, high strength, good seepage resistance, high construction efficiency, low construction vibration, a wide range of stratigraphic adaptation, and adaptability to different formations [1,2,3,4]. The main construction processes for diaphragm walls include mechanical hole forming, mud protection, steel cage installation, and concrete pouring [5].
The research on deep foundation pit diaphragm walls can be divided into three stages based on the construction process: the grooving stage [6], the pouring stage [7,8], and the excavation stage [9,10]. During the grooving stage, the primary concerns include the stability of the groove trench, soil stress redistribution, and soil deformation. Studies have shown various factors that influence the stability of the groove trench, such as mud properties, foundation soil properties, groundwater levels, trough section shape, excavation machinery, and construction techniques [11]. It is well known that mud protection is an important means of safety for the formation of diaphragm walls, in which the weight and height of the slurry have a particularly prominent influence. The slurry weight in engineering mainly relies on empirical and theoretical analysis methods [12]. Theoretical analysis methods include the widely used limit equilibrium method [13,14,15], limit analysis method [16], and finite element method. The finite element strength reduction method shows that the mud weight of an ultra-deep diaphragm wall should be greater than 12 kN/m3 and less than 14 kN/m3 [17]. The grooving process of underground continuous walls leads to the redistribution of soil stress and soil deformation [18,19], which should not be ignored. Settlement problems also arise during the grooving construction of continuous walls [20]. Pei et al. [21] showed that the construction of underground continuous walls has a significant impact on the deformation of foundation pits, and scholars have conducted research based on the deformation of a large number of engineering foundation pits [22,23,24]. Pei et al. [25] utilized complex elastic theory and the finite difference method to analyze soil stress and displacement during the grooving process. Britto and Kusakabe [26] hypothesized the instability states of seven different types of trench excavation. Toyosawa et al. [27] conducted an analysis and compiled statistics on the damage caused by the construction of underground continuous walls. Lei et al. [11] analyzed the factors that affect the stability of underground continuous wall groove formation. Oblozinsky et al. [28] analyzed the stability of underground continuous walls using the finite element method. The safety factor was calculated using the shear strength reduction technique in the FEM and verified by comparison with centrifuge tests, which proves the applicability of the finite element method in groove trench analysis. Xu et al. [29] studied the factors that affect the stability of underground continuous walls in soft soil layers. Xu Q et al. [30] used a 3D sliding body to analyze the minimum amount of slurry. An C L et al. [31] studied the influence of weak interlayers on the local failure stability of trenches. Some researchers have also used numerical simulation methods to study trench stability [32,33,34].
At present, there is no recognized theory on the stability of groove formation, and scholars have conducted multiple studies on it. While the conventional limit equilibrium method (vertical strip method) is commonly employed in geotechnical engineering stability analysis, it is difficult to consider the stratification of geotechnical bodies, particularly when the geotechnical properties of the layers vary considerably. In such cases, the horizontal strip method [13] proves to be more suitable. This study aims to address this gap by utilizing the horizontal strip method to evaluate the stability of mud-retaining walls in underground continuous walls. Based on the deep foundation pit project of Section C2A of the Tuas Sewage Treatment Plant at Ayer Chawan Island, Jurong Town, Singapore, specifically, the stability of trenches under various mud heights and density conditions is analyzed using the horizontal strip method. The results show that calculated mud parameters are closer to actual values, which verifies the adaptability of the method.
Most of the studies adopt the finite element strength reduction method [17,35] to obtain the stability safety factor. The deformation mechanism and law of groove trench are seldom studied by the finite element method. The construction process of underground continuous wall grooving in the actual project mentioned above is simulated through 3D numerical simulation using the finite element method. The deformation of soil around the groove trench and surface deformation were carefully analyzed and summarized through numerical simulation. The conclusions drawn from this analysis provide valuable insights and serve as a reference for similar projects and future studies.

2. Engineering Background

2.1. Project Overview

The C2A lot project of the Ayitchawan Island Tuas Sewage Treatment Plant in Jurong Town consists of circular ultra-deep foundation pits. These foundation pits have a depth ranging from 67.7 to 79.1 m and a diameter of 28.0 to 55.4 m. During the construction process of the diaphragm wall, a grab grooving machine and an impact drill are utilized. The slurry is installed to secure the excavated area, the diaphragm wall segmental construction. Details are given in Figure 1 and Figure 2 and Table 1.
The project utilizes a circular foundation pit and the single groove section is carried out in three stages using a grooving machine, firstly excavating the left part, then the right part (each with a length of 2.8 m and a thickness of 1.2 m), and lastly the center part. The total length of a single slot section is 6.5 m and the excavation process follows a linear arrangement. Throughout the implementation of the project, each section of the pit was excavated using a jumping excavation method. This paper focuses on analyzing the stability and deformation of the groove trench in the process of excavation and takes a single groove trench as the research object.

2.2. Engineering Geological Conditions

Yayi Chawan Island in Jurong Town was created through reclamation work. The average thickness of the upper filler is approximately 15 m. Table 2 provides detailed information on the marine clay and fully weathered to slightly weathered argillaceous siltstone layers that are located beneath the filler. The site is close to the ocean and the strata are hydraulically connected to the ocean. Based on data from Ayicha Bay Island, the water level elevation ranges between −0.8 and −0.6 m relative to the site’s ±0 elevation. For the numerical analysis conducted in this study, a water level elevation of 0.6 m was utilized, which is approximately 2.0 m below ground level.

3. Analysis of Two-Dimensional Wedge Failure Model for Groove Trench Stability

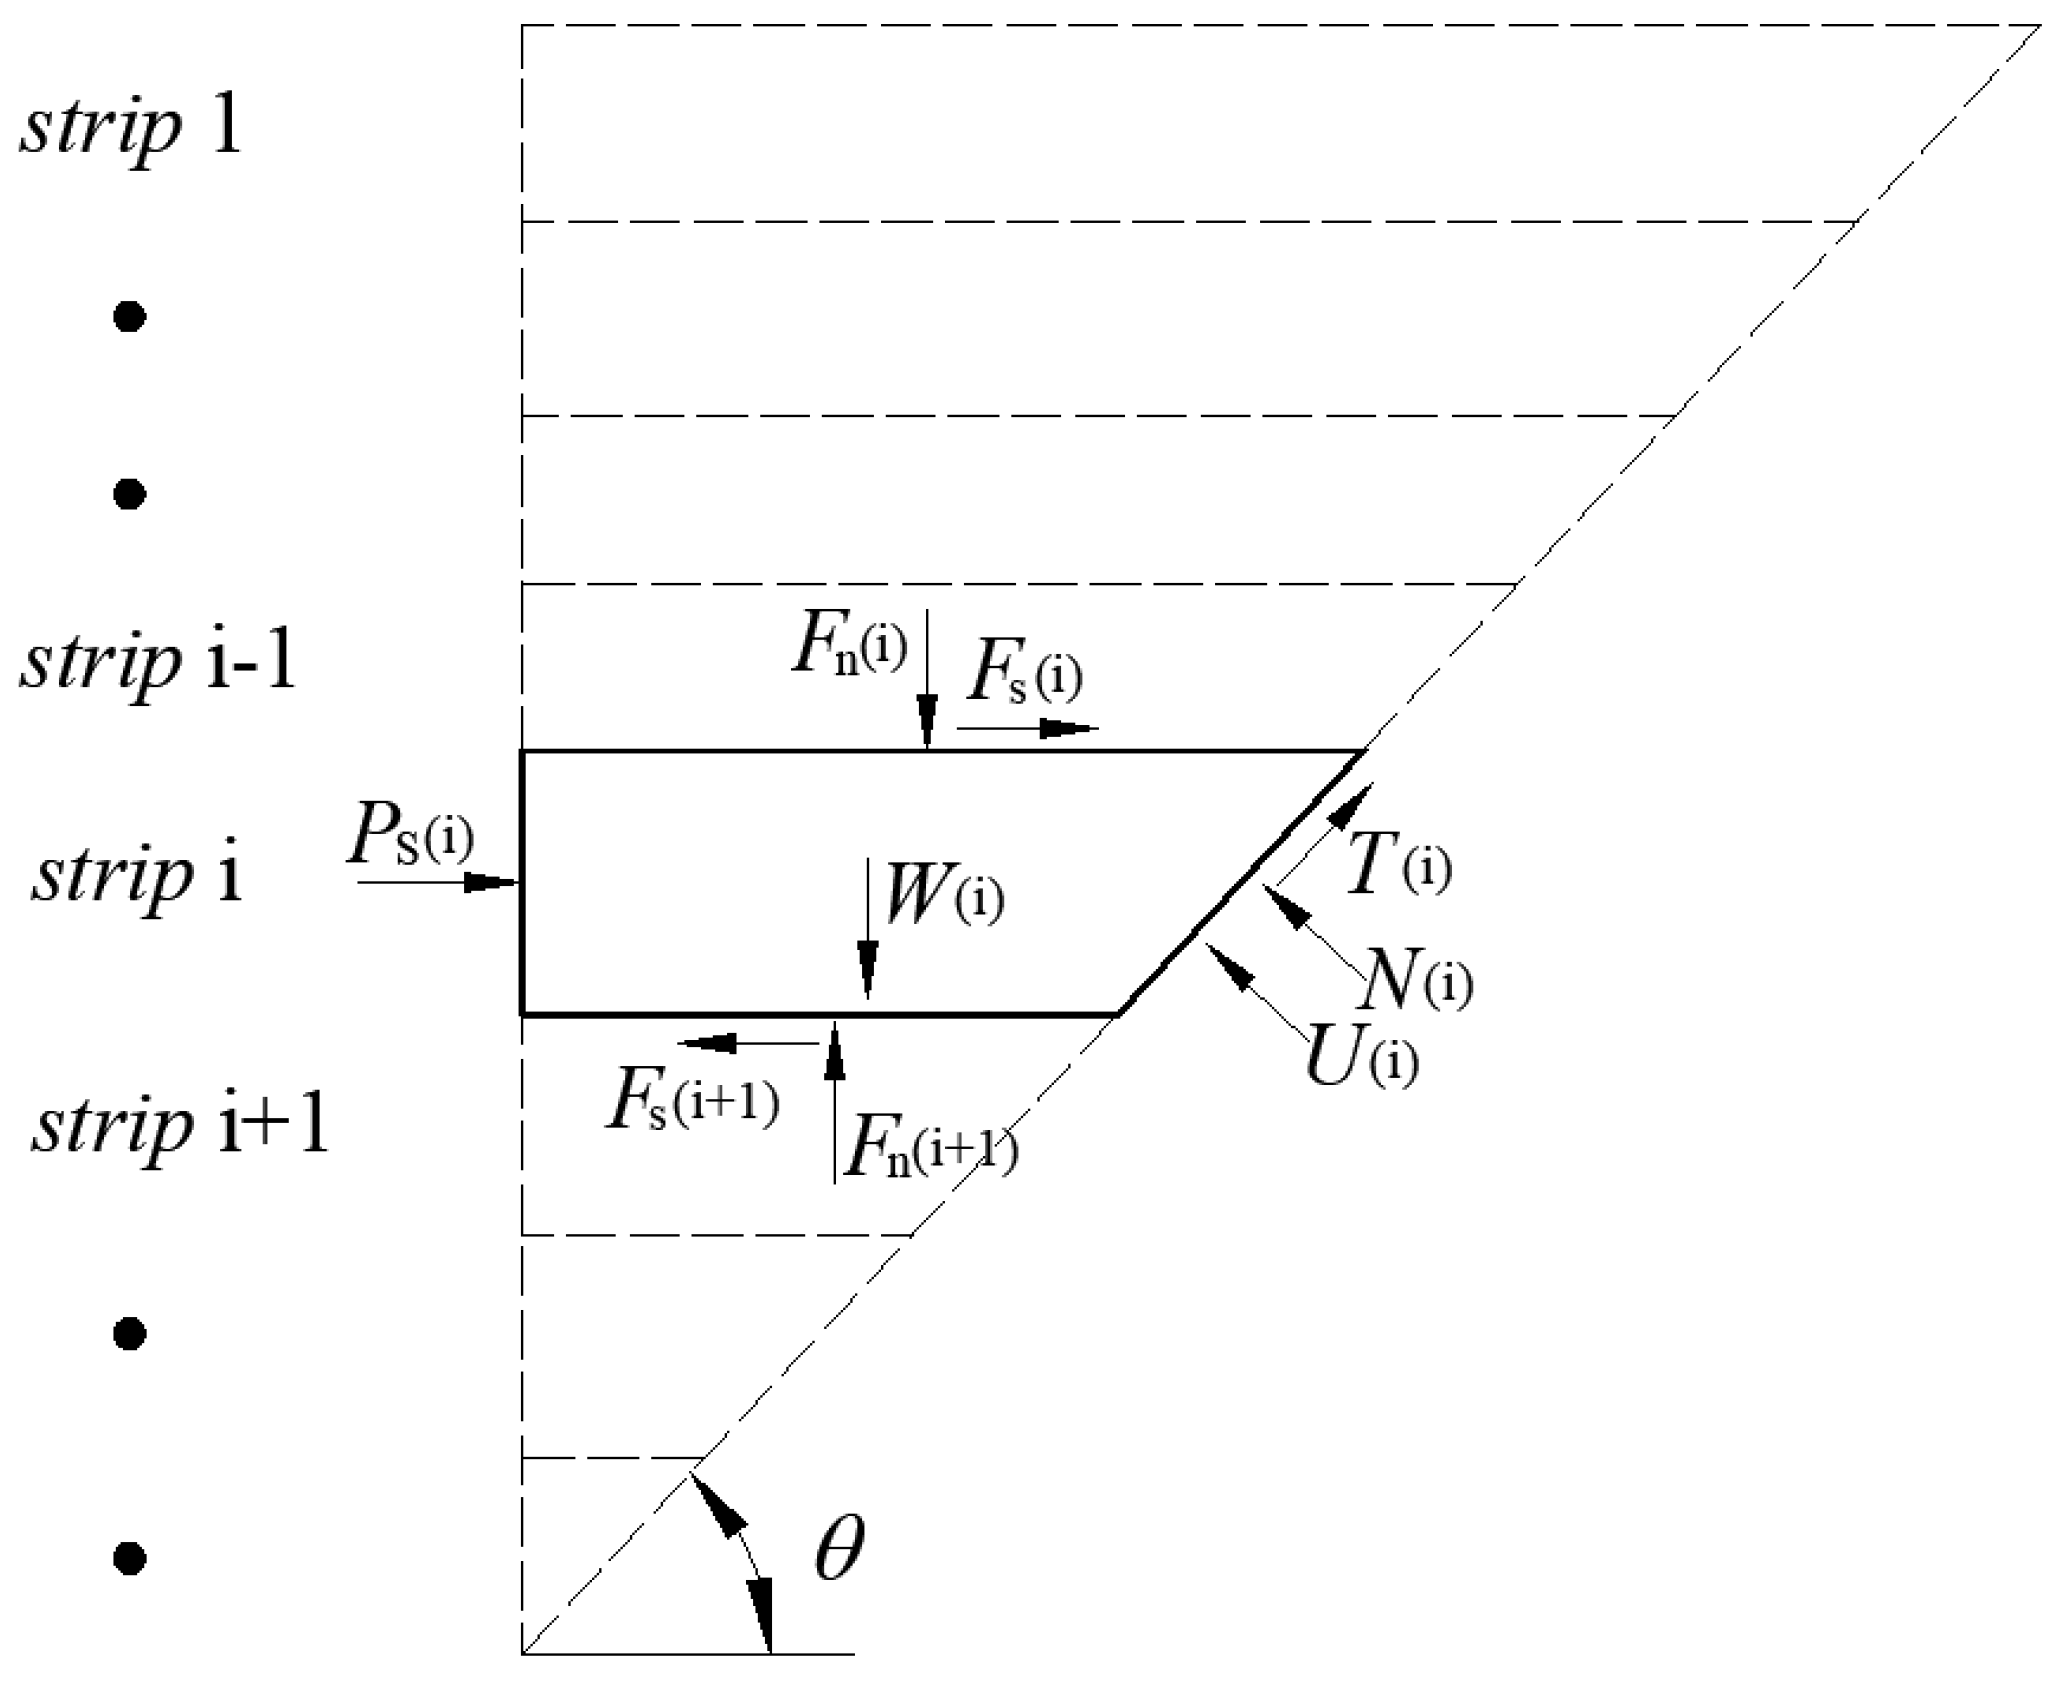
3.1. The Horizontal Strip Method

The slider body model based on Coulomb’s theory is commonly employed in practical engineering due to its clear concept, simple formulas, and ease of parameter selection. The horizontal strip method can fully consider the layered nature of the soil body and meet the equilibrium of the force of the slide body. The force schematic of the horizontal strip method is shown in Figure 3.
The basic assumptions are as follows:
(1)
The failure model is a wedge destruction along a linear sliding surface;
(2)
The strata are horizontal and the strata interfaces are perpendicular to the groove surface;
(3)
Destruction is an instantaneous process.
Based on the above assumptions, the equation [36] of horizontal and vertical force balance is as follows:
W i + F n i F n i + 1 c o s θ + P s i s i n θ U i + F s i F s i + 1 s i n θ = N ( i )
W i + F n i F n i + 1 s i n θ P s i c o s θ F s i F s i + 1 c o s θ = T ( i )
According to the strength of the soil reserve capacity safety factor FS:
F S = c i l i + N ( i ) t a n φ ( i ) T ( i )
According to formulas (1)~(3), the equation system for this construction consists of 3N equations, where N is the number of soil layers, 1 ≤ iN. The unknown values in this system include N(i), T(i), Fn(i), Fs(i), and FS, with each unknown number being N, N, N − 1, N − 1, and 1. Therefore, the total number of unknowns is 4N − 1. Assuming that the force Fn(i) between the strips represents an additional stress concentration force, i.e., Fn(i) is known, the number of unknowns can be reduced to 4N – 1 − (N − 1) = 3N. So, with the number of equations being equal to the number of unknowns, the equations can be solved simultaneously.
To solve the system of equations mentioned above, the first step is to construct the Jacobi matrix. It is important to note that the Jacobian matrix of this equation is nonsingular, which can be solved iteratively by Newton’s method. During the solving process, different sliding surface angles θ are assumed to solve the above equations, which can obtain a series of safety factors FS. The minimum value of FS is FSmin and the corresponding angle θ is identified as the critical fracture angle θcr.

3.2. Parameters in Calculation

The stability of the groove trench is influenced by several key factors, including:
(1)
The characteristics of the foundation soil;
(2)
The properties of the mud, including its composition, severity, and height;
(3)
The underground water level;
(4)
The grooving method;
(5)
Construction-related factors, such as mechanical vibrations, construction sequence, and overloading.
Taking into account the specific conditions of the sewage treatment plant project, the analysis focuses on the height and weight of the slurry. The values of the height and weight are shown in Table 3 and Table 4. Additionally, considering the construction layout and loading conditions, an average distribution load of 20 kPa was applied to the surface.
The strata within the grooved range consist of artificial filler, marine clay, and fully weathered to strongly weathered argillaceous siltstone. Considering that artificial fill and marine clay layers exhibit less fluctuation while the strong regolith layer exhibits large fluctuation, two groups of strata have been selected for analysis.
The first group represents the worst stratigraphic conditions and includes the following layers: artificial filler with a thickness of 16 m, marine clay with a thickness of 3 m, and fully weathered to strongly weathered argillaceous siltstone with a thickness of 61 m. The depth of the groove trench is 80 m.
The second group represents the best stratigraphic conditions and includes the following layers: artificial filler with a thickness of 16 m, marine clay with a thickness of 3 m, and fully weathered to strongly weathered argillaceous siltstone with a thickness of 18 m. The depth of the groove trench is 37 m. Below, the above strata are considered as weathered~slightly weathered argillaceous siltstone, and the stability of the groove trench within the hard rock is not considered.

3.3. Calculation Results

Under the two different stratigraphic conditions, various mud heights and weights were selected to investigate the relationship between the critical fracture angle θcr and the safety factor FSmin, which is shown in Table 3 and Table 4.
Based on the statistical findings from the Table 3 and Table 4, under the first stratigraphic conditions, when the trough wall is stable (safety factor FSmin greater than 1), the following correlations were observed:
For mud heights ranging from 0 to 1 m (the mud height is the distance between the slurry level and the ground), the corresponding mud severity varied from 13.0 to 14.0 kN/m3.
For mud heights between 1.5 and 2.0 m, the corresponding mud severity remained at 13.5 to 14.0 kN/m3.
It should be noted that under the first stratigraphic conditions, when the mud height is greater than 1 m, the FSmin are all less than 1, which means instability, so this is not displayed.
Under the second geological condition, when the groove trench is stable, the following relationships were observed:
For a mud height of 0 m, the corresponding mud weight ranged from 12.5 to 14.0 kN/m3.
For a mud height ranging from 0.5 to 1.0 m, the corresponding mud weight varied from 13.5 to 14.0 kN/m3.
For a mud height ranging from 1.5 to 2.0 m, the corresponding mud weight remained at 13.5 to 14.0 kN/m3.
Comparing the two geological conditions, it is evident that under the same mud weight and height, the safety factor of the former is lower than that of the latter due to the greater depth of the groove wall in Formation 1.
During the actual construction of the project, the maximum mud weight chosen was 12.5 kN/m3 with a corresponding mud height of 0.2m. Based on the above table for the linear difference, when the groove trench is stable, the mud height of 0.2 m corresponds to the mud weight of 12.7 (first stratigraphic conditions) and 12.64 kN/m3 (second stratigraphic conditions). This difference could be attributed to the fact that the two-dimensional wedge slice method used in the calculations did not account for the slot size. Consequently, the calculated results may have been slightly higher than the actual values.
Figure 4 and Figure 5 show how the relationship between the mud height, mud weight, and critical fracture angle under two different geological conditions can be calculated.
Figure 4 illustrates that as the mud weight increases, the critical fracture angle θcr gradually decreases. Additionally, the θcr has a similar reduction with different mud heights. Figure 5 demonstrates that as the height of the mud increases (mud surface elevation decreases), the critical fracture angle θcr gradually increases. Furthermore, the larger the mud weight, the more reduced the increase in the angle of the θcr.
The relationship between the mud height, mud weight, and safety factor can be observed in Figure 6 and Figure 7.
Figure 6 indicates that as the mud weight increases, the safety factor FSmin gradually increases. Moreover, the FSmin has the same increase trend for different mud heights. Figure 7 reveals additional insights into the relationship between the mud height, mud weight, and safety factor. In these figures, it can be observed that as the height of the mud increases (with a corresponding decrease in mud surface elevation), the safety factor gradually decreases. Furthermore, for different mud weights, the FSmin shows the same magnitude of variation.

4. Numerical Analysis of Deformation Characteristics of Strata during the Process of Groove Construction

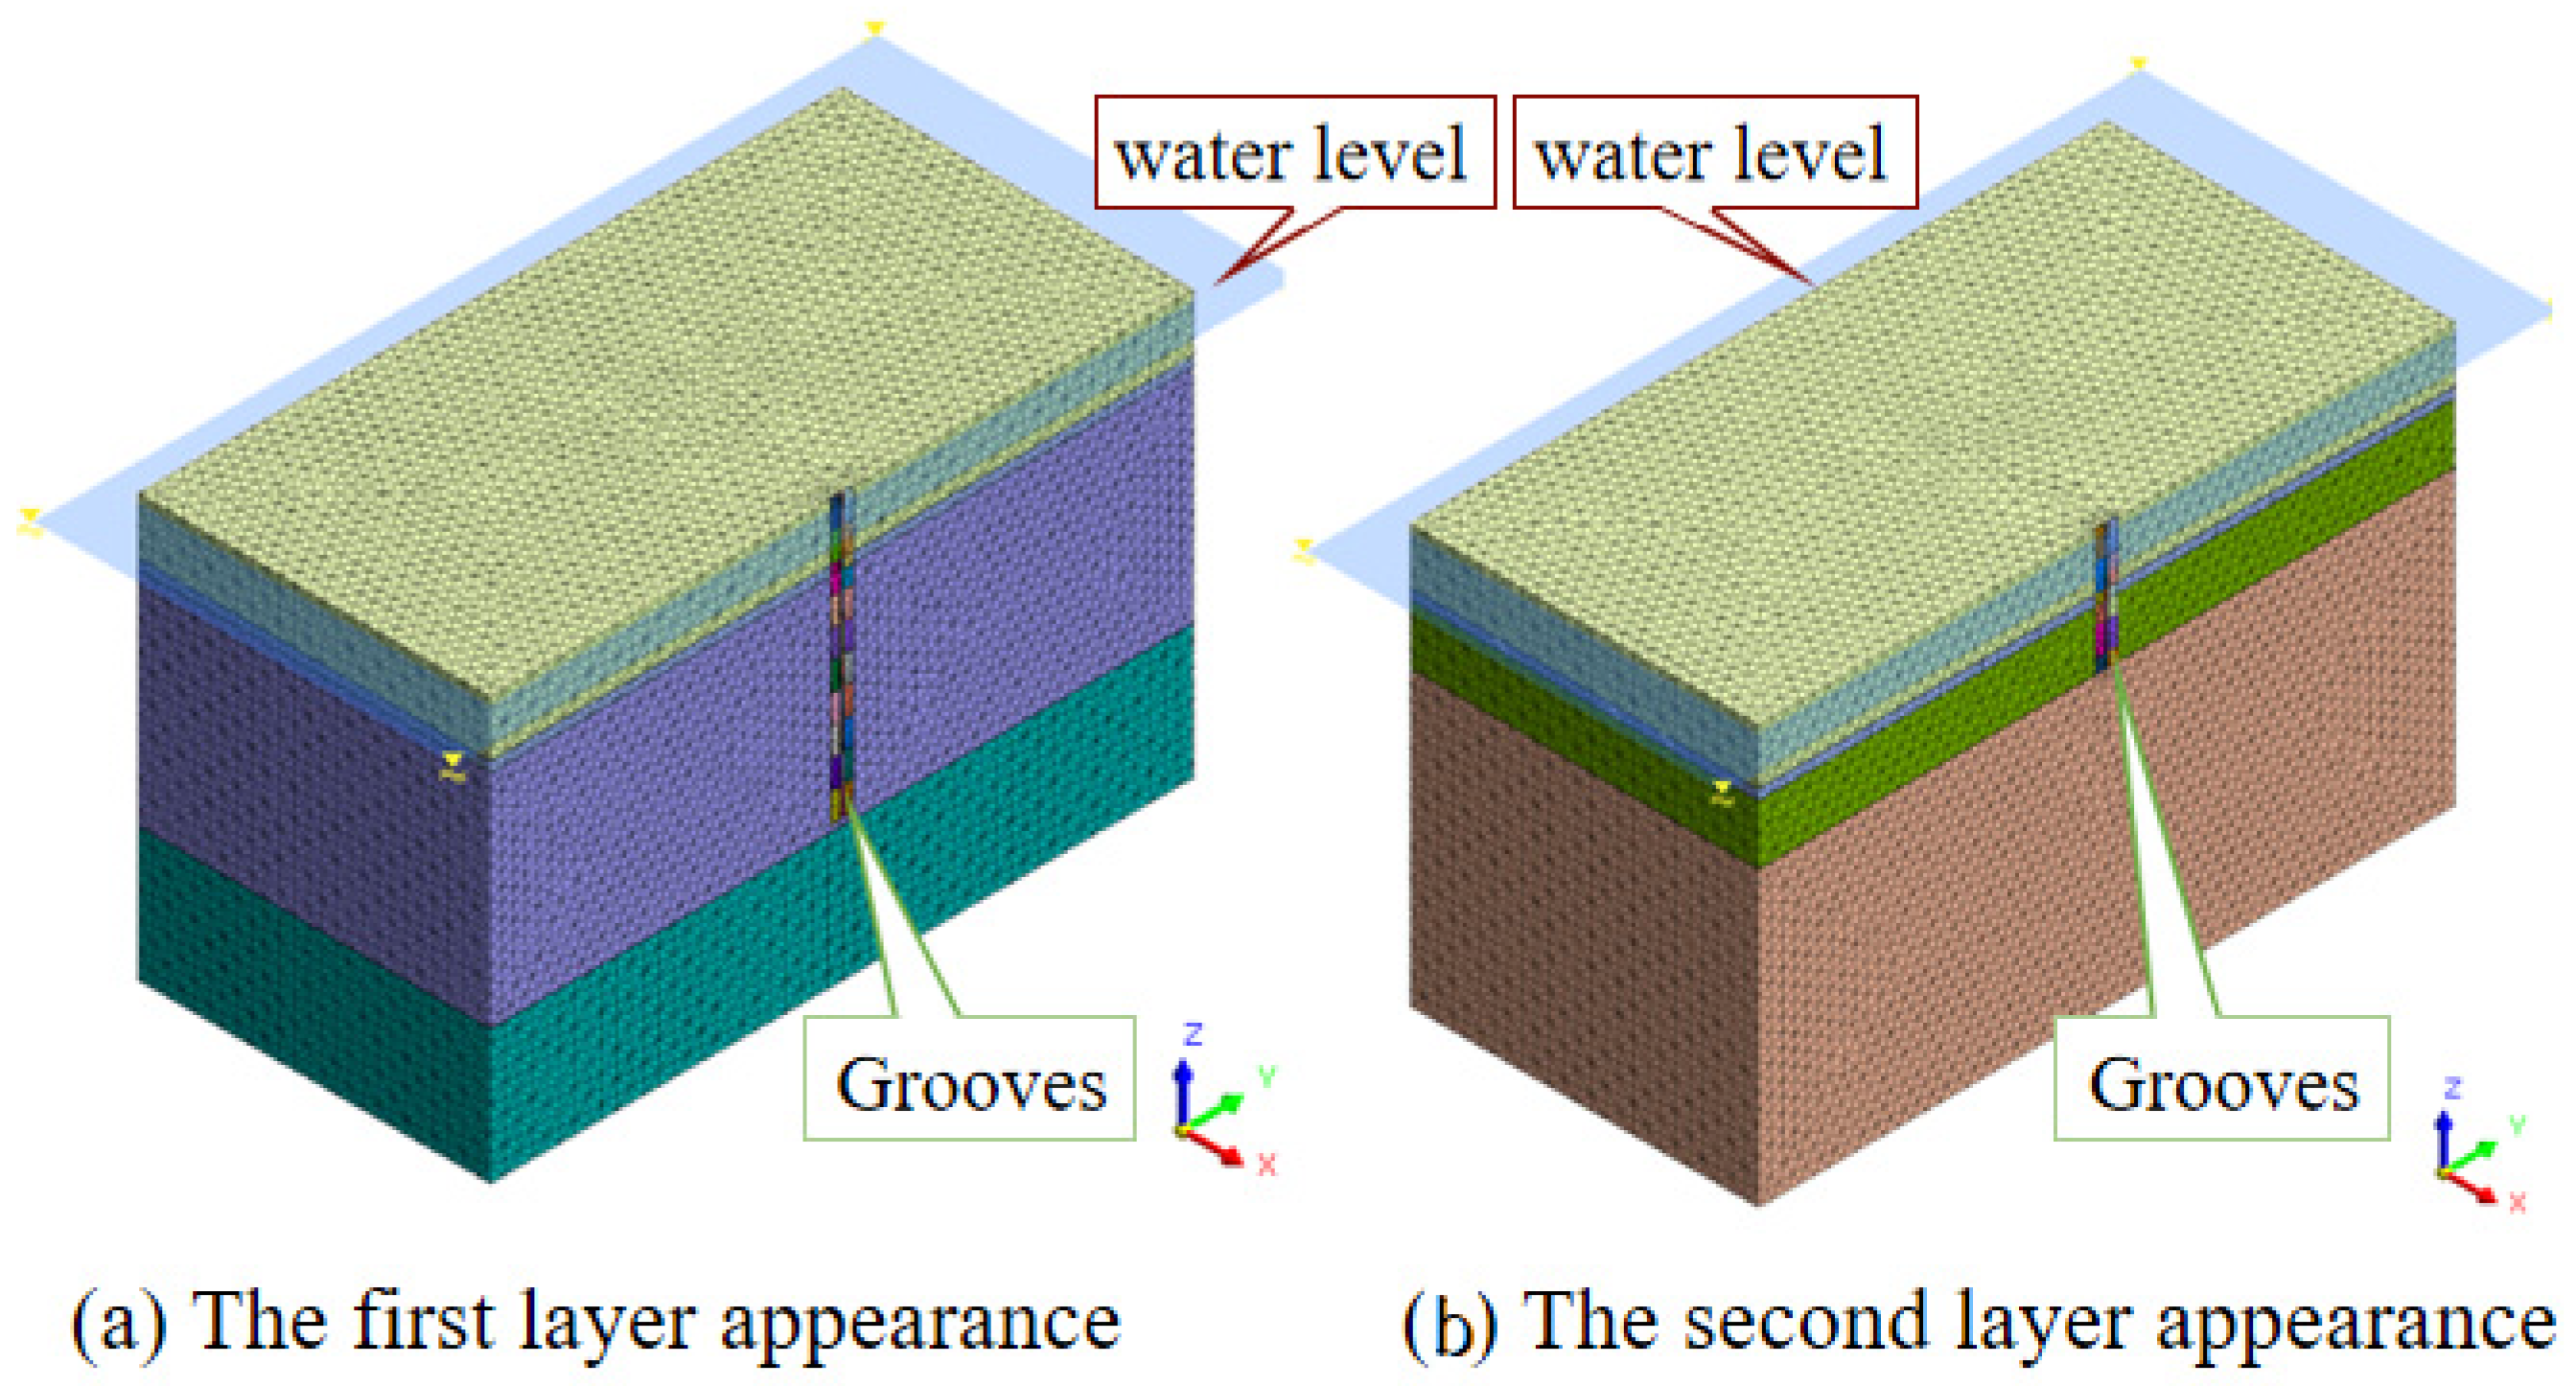
4.1. Numerical Model

The large-scale finite element software MIDAS GTS (version: GTS NX 2020 R1) has been utilized to analyze the groove construction. The numerical analysis focuses on the drilling strata near the ocean side and considers the actual dimensions of the groove. The groove dimension is 6.5 m long and 1.2 m thick. The numerical simulation adopts the conventional Mohr–Coulomb constitutive model, the geotechnical parameters of which are listed in Table 2, and the model uses tetrahedral mesh elements. The appearance of the numerical model is depicted in Figure 8, with the model exhibiting symmetry along the axis of the groove short side. To perform calculations and analysis, a half-edge model is used, with a model size of 200 m (length) × 100 m (width) × 120 m (height). During the numerical analysis, the mud height is 0.2 m and the mud weight is set at 12.5 kN/m3.
The numerical analysis in this study considers two types of geological conditions, as described in Section 3.2. The steps involved in the numerical analysis are as follows:
(1)
Under the initial constraint boundary and hydrological boundary conditions, the model calculates to equilibrium. At this point, displacements are reset to zero.
(2)
An upper overload of 20 kPa is applied to the model surface and the analysis is performed until an equilibrium state is achieved, then the displacements are cleared and set back to zero. This step simulates the application of construction loads before the excavation of the groove wall.
(3)
The soil in the groove trench is excavated according to the actual formation of the diaphragm wall groove, and slurry pressure is applied simultaneously on the groove lateral (simulating slurry pressure by applying lateral pressure on the trench sidewalls) groove.
(4)
The soil in the groove is excavated sequentially, following the same procedure as in Step 3. The process is repeated until the entire excavation is completed.

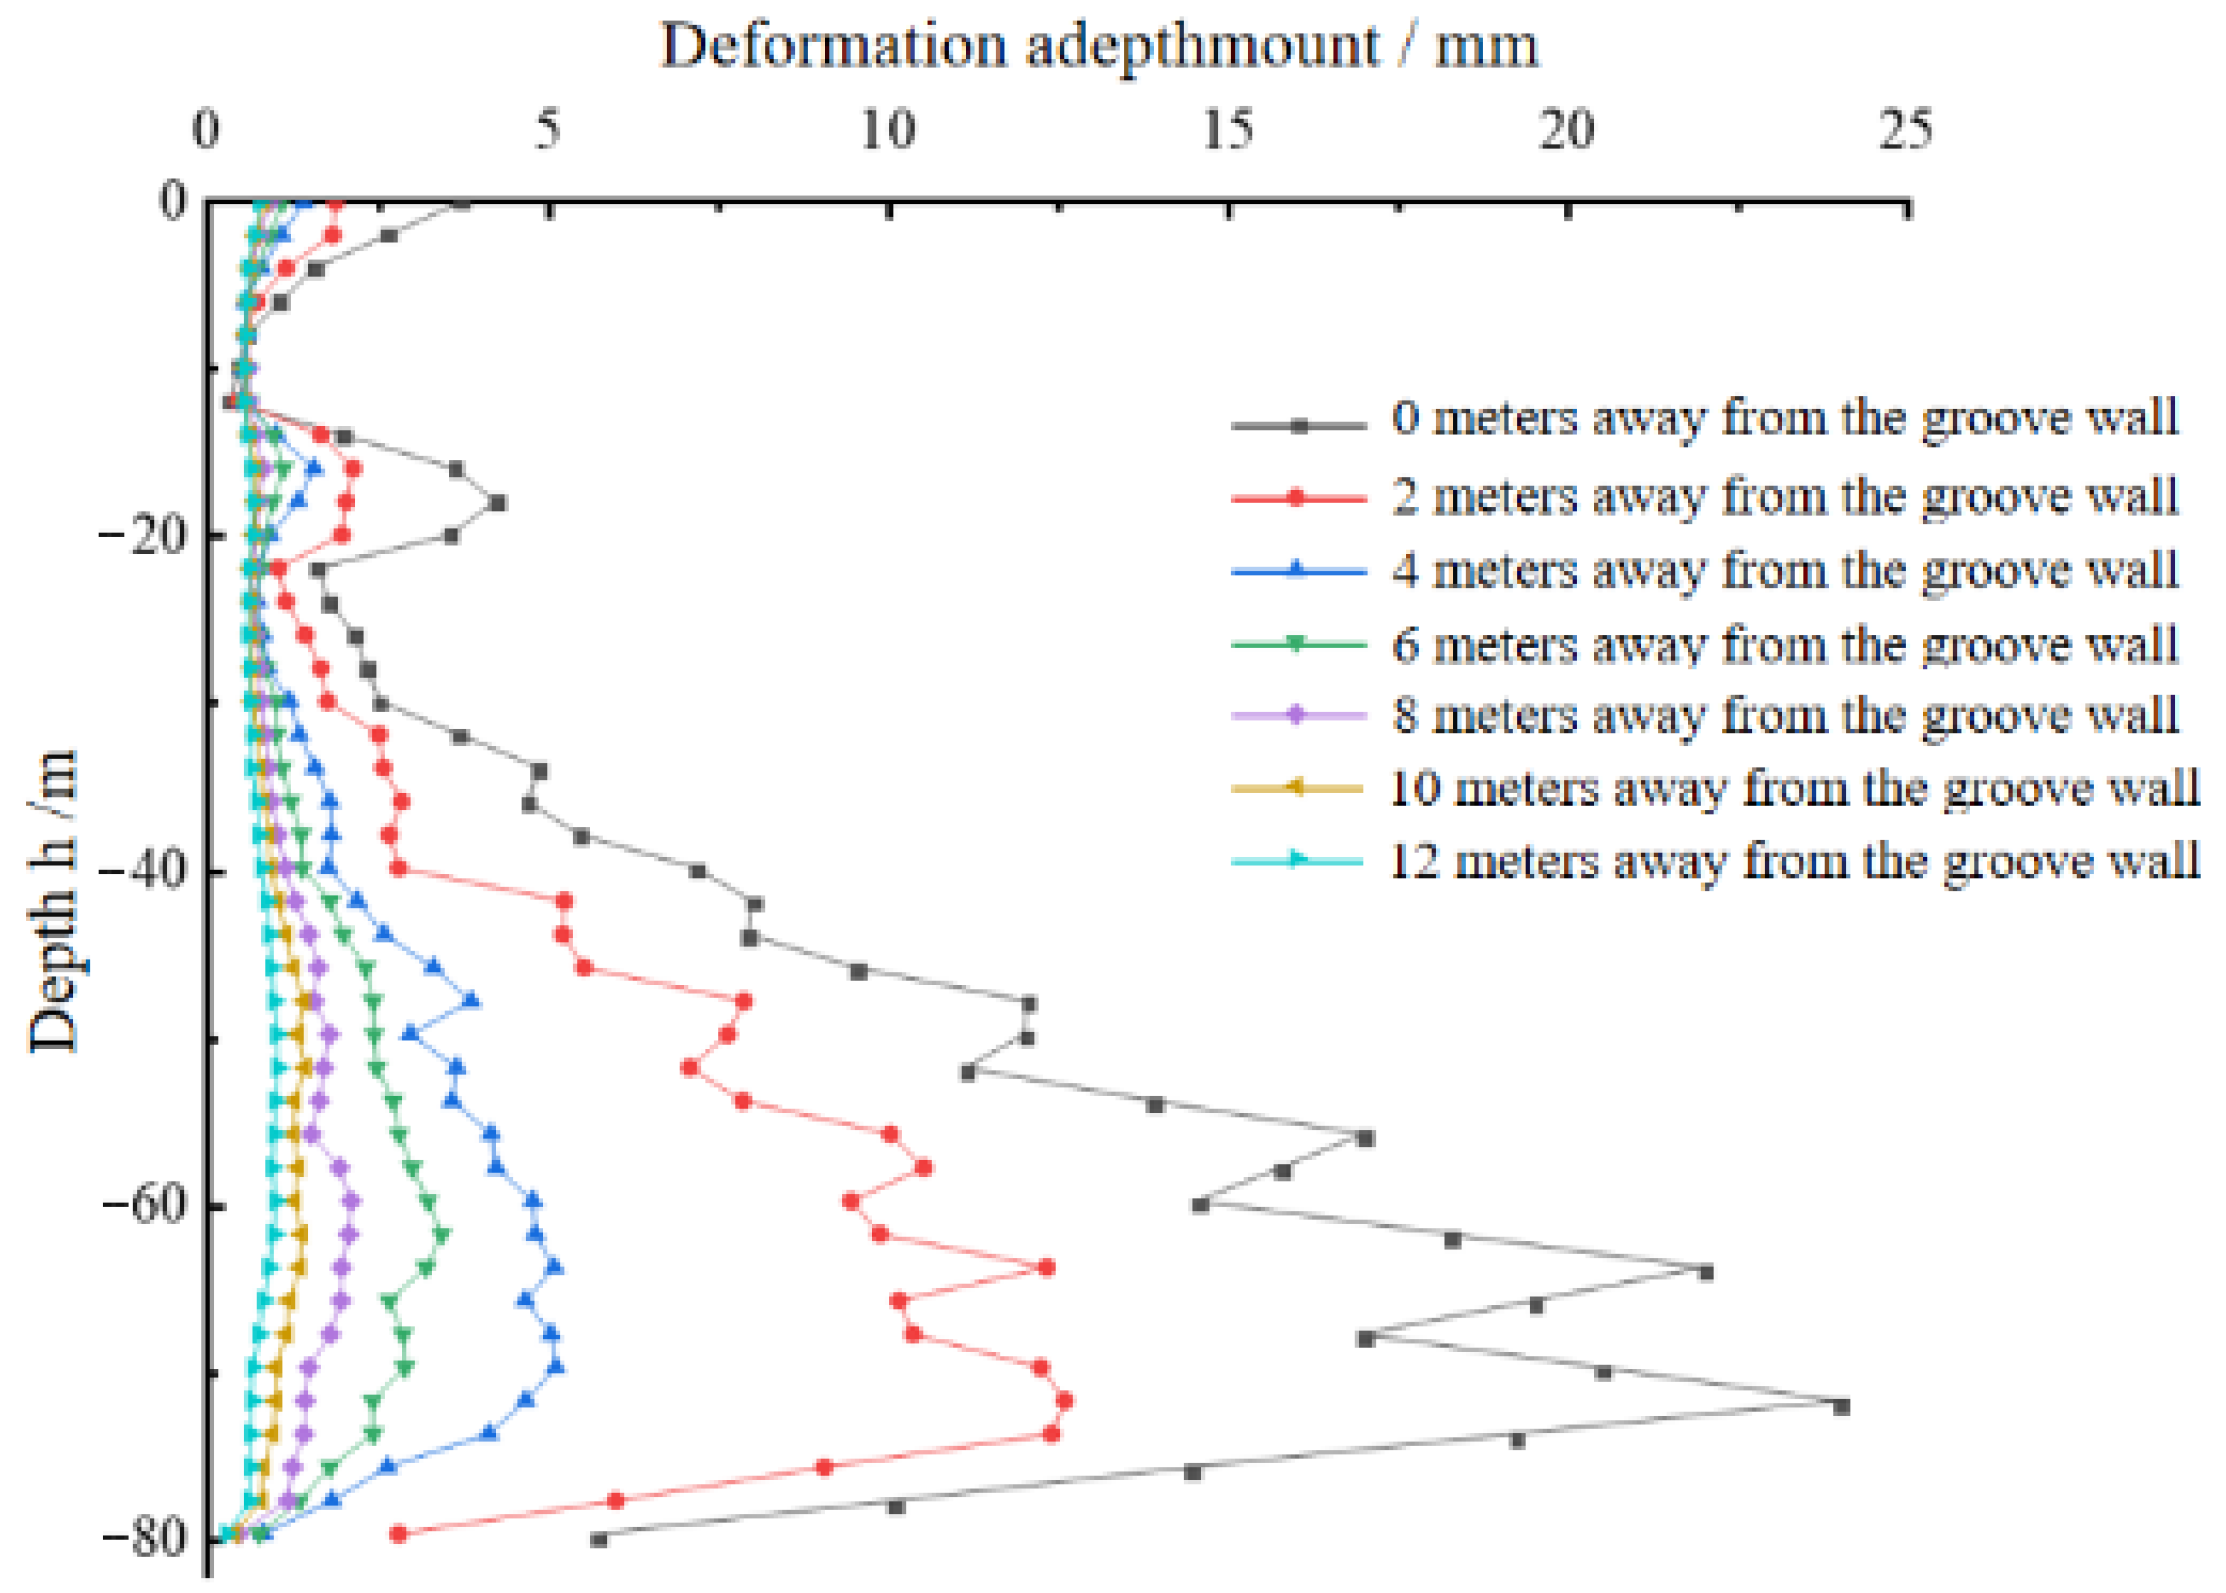
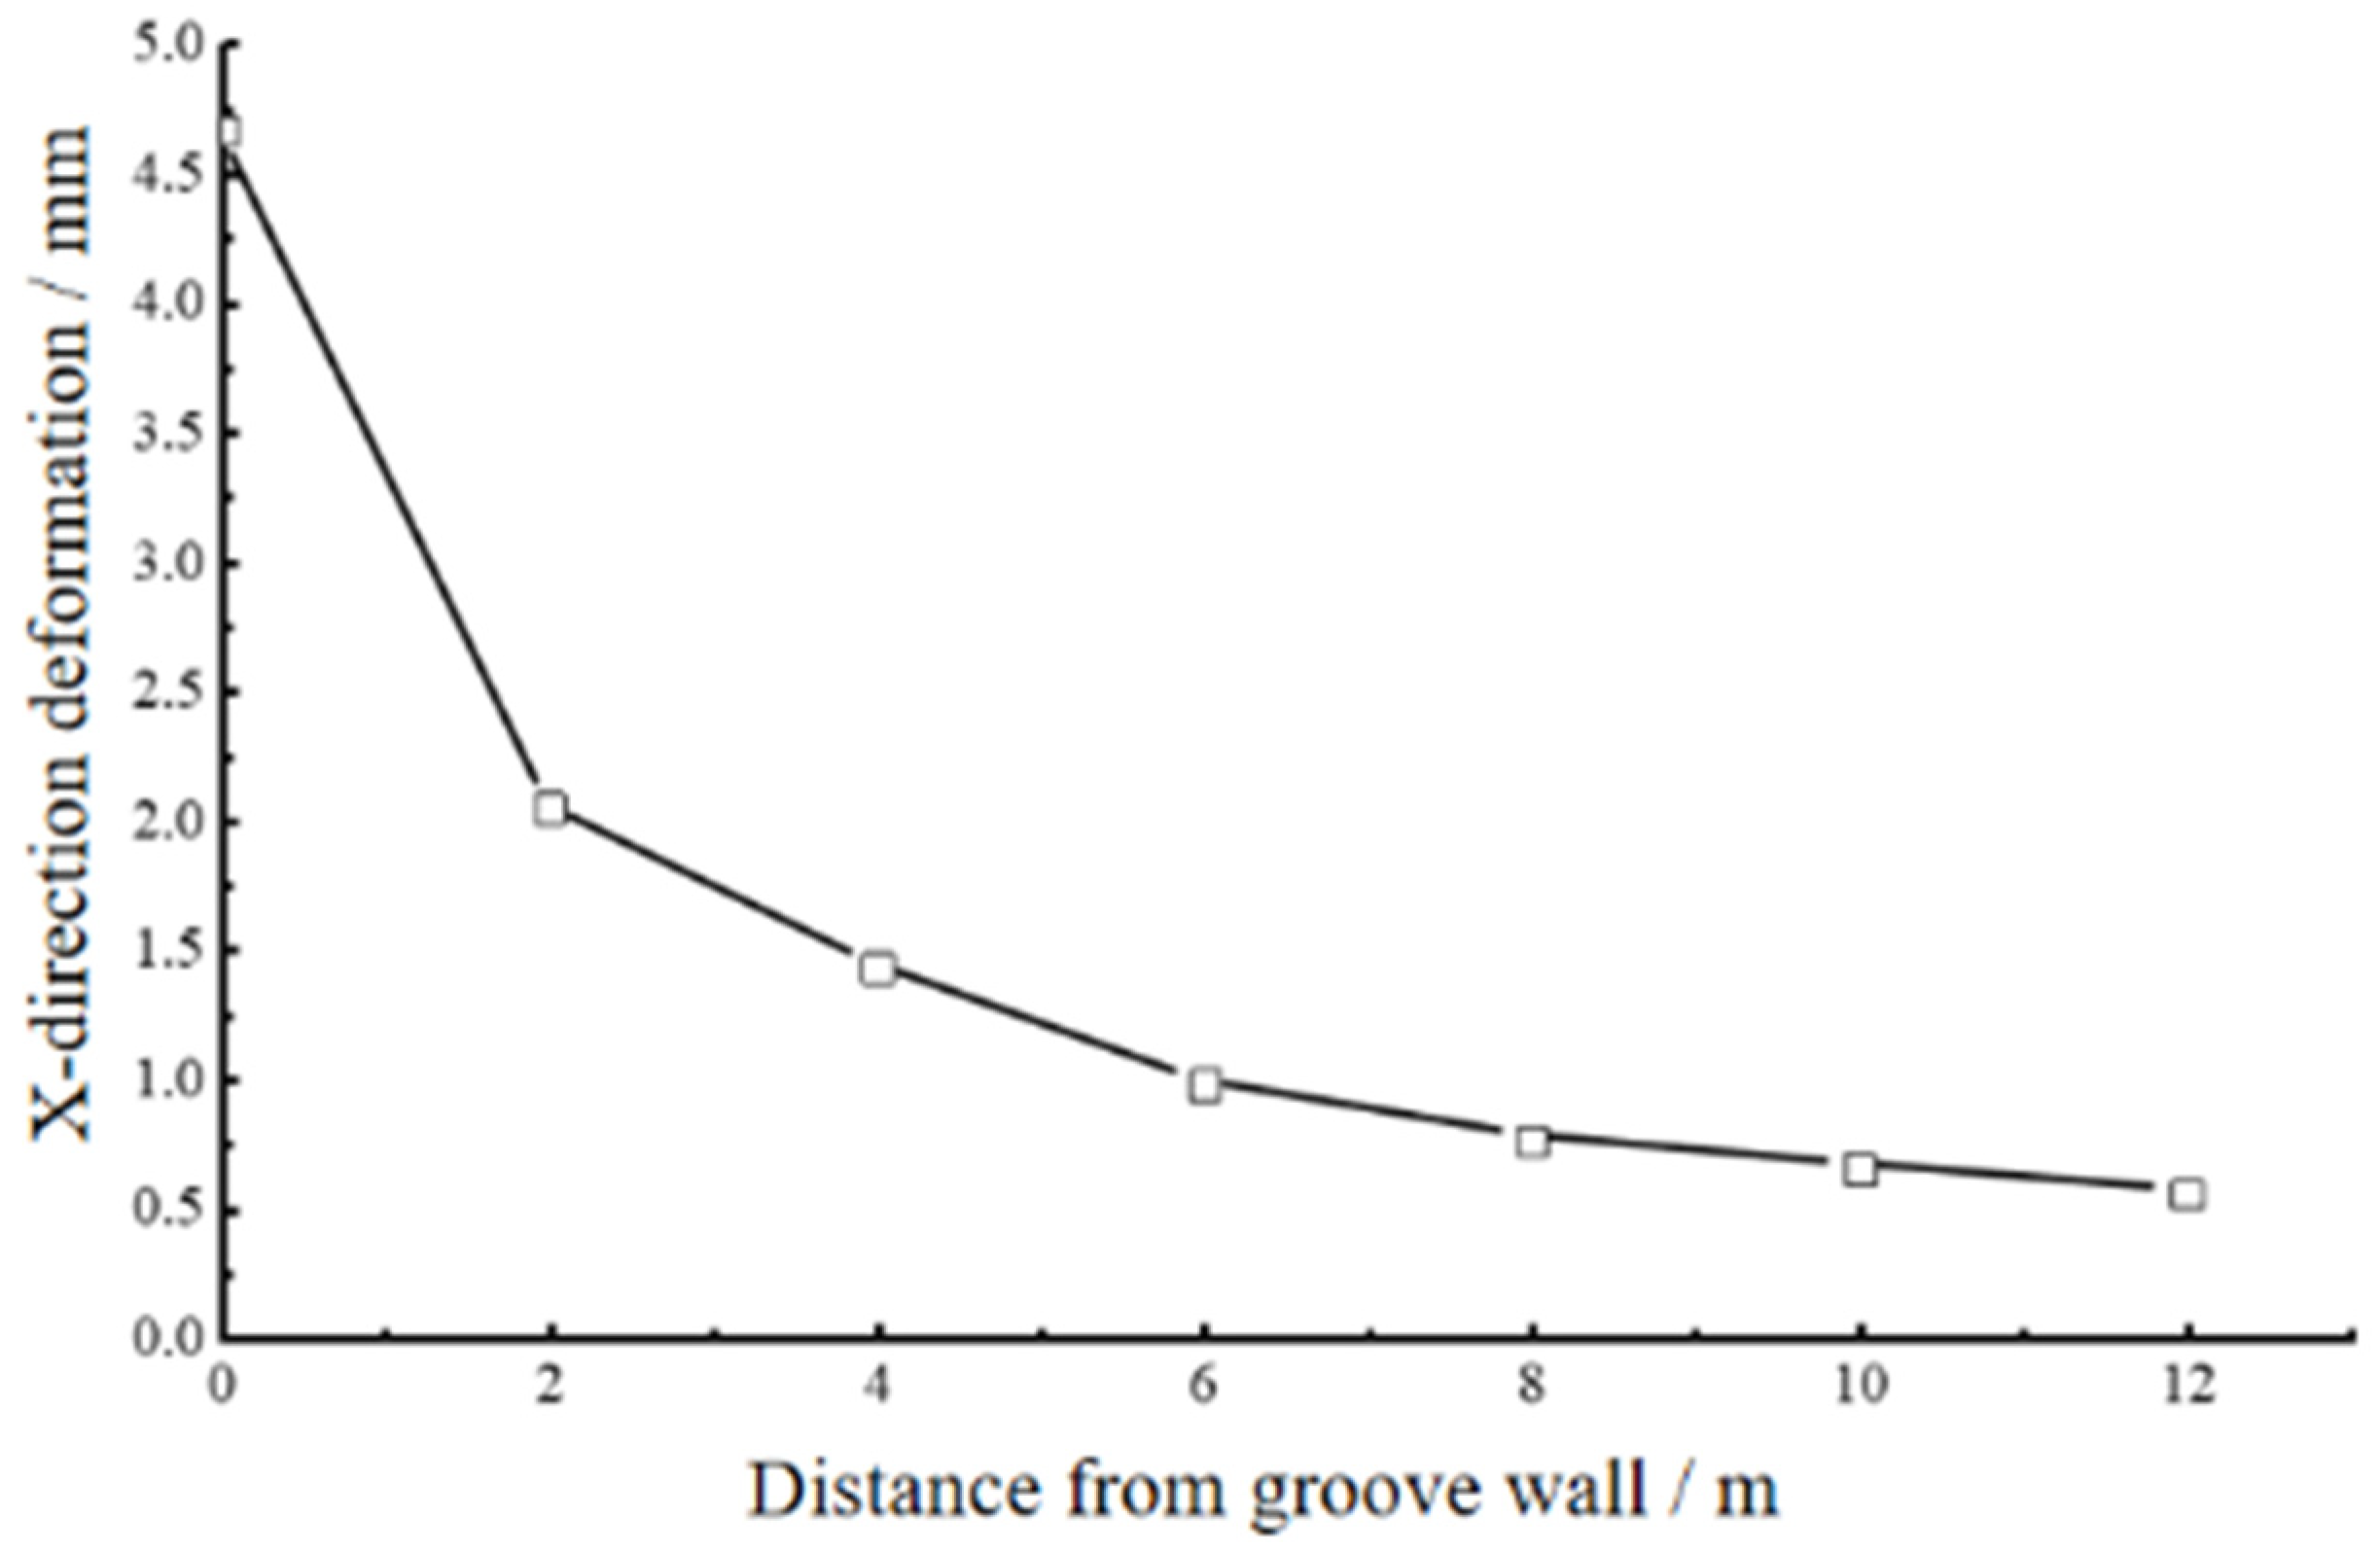
4.2. Analysis of X-Direction Deformation Characteristics of Groove Trench (Long Side)

Figure 9 and Figure 10 illustrate the X-direction deformation at the center of the long side of the groove trench. The lateral deformation of the long side of the groove section exhibits fluctuations due to the comprehensive influence of geological differences, soil arching effect, and soil pressure.
Under the first geological condition, the deformation of the groove trench initially decreases and then increases. It reaches the first peak in the marine clay layer. As the depth increases further, the deformation continues to fluctuate, with a maximum value of 24.02 mm observed at a distance of 7.8 m from the bottom. The deformation then gradually decreases due to the boundary constraint effect at the bottom.
Under the second geological condition, the depth of the groove formation is relatively small compared to the first condition. As a result, the deformation pattern of the groove trench is generally the same as the first geological condition. The maximum deformation of the groove trench is observed in the marine clay layer, with a maximum value of 4.66 mm.
Figure 11 and Figure 12 present the X-direction deformation maps at different distances from the long side of the groove trench. From these figures, it can be observed that as the distance from the groove trench increases, the soil deformation decreases. Beyond a distance of 6m from the groove trench, the deformation gradually stabilizes and the rate of deformation reduction significantly slows down. Considering that the excavation width of the groove trench in this project is 6.5 m, the results suggest that the intense impact area of the soil is within the length of the groove long side. However, once the distance exceeds the length of the groove trench, the impact becomes relatively small.

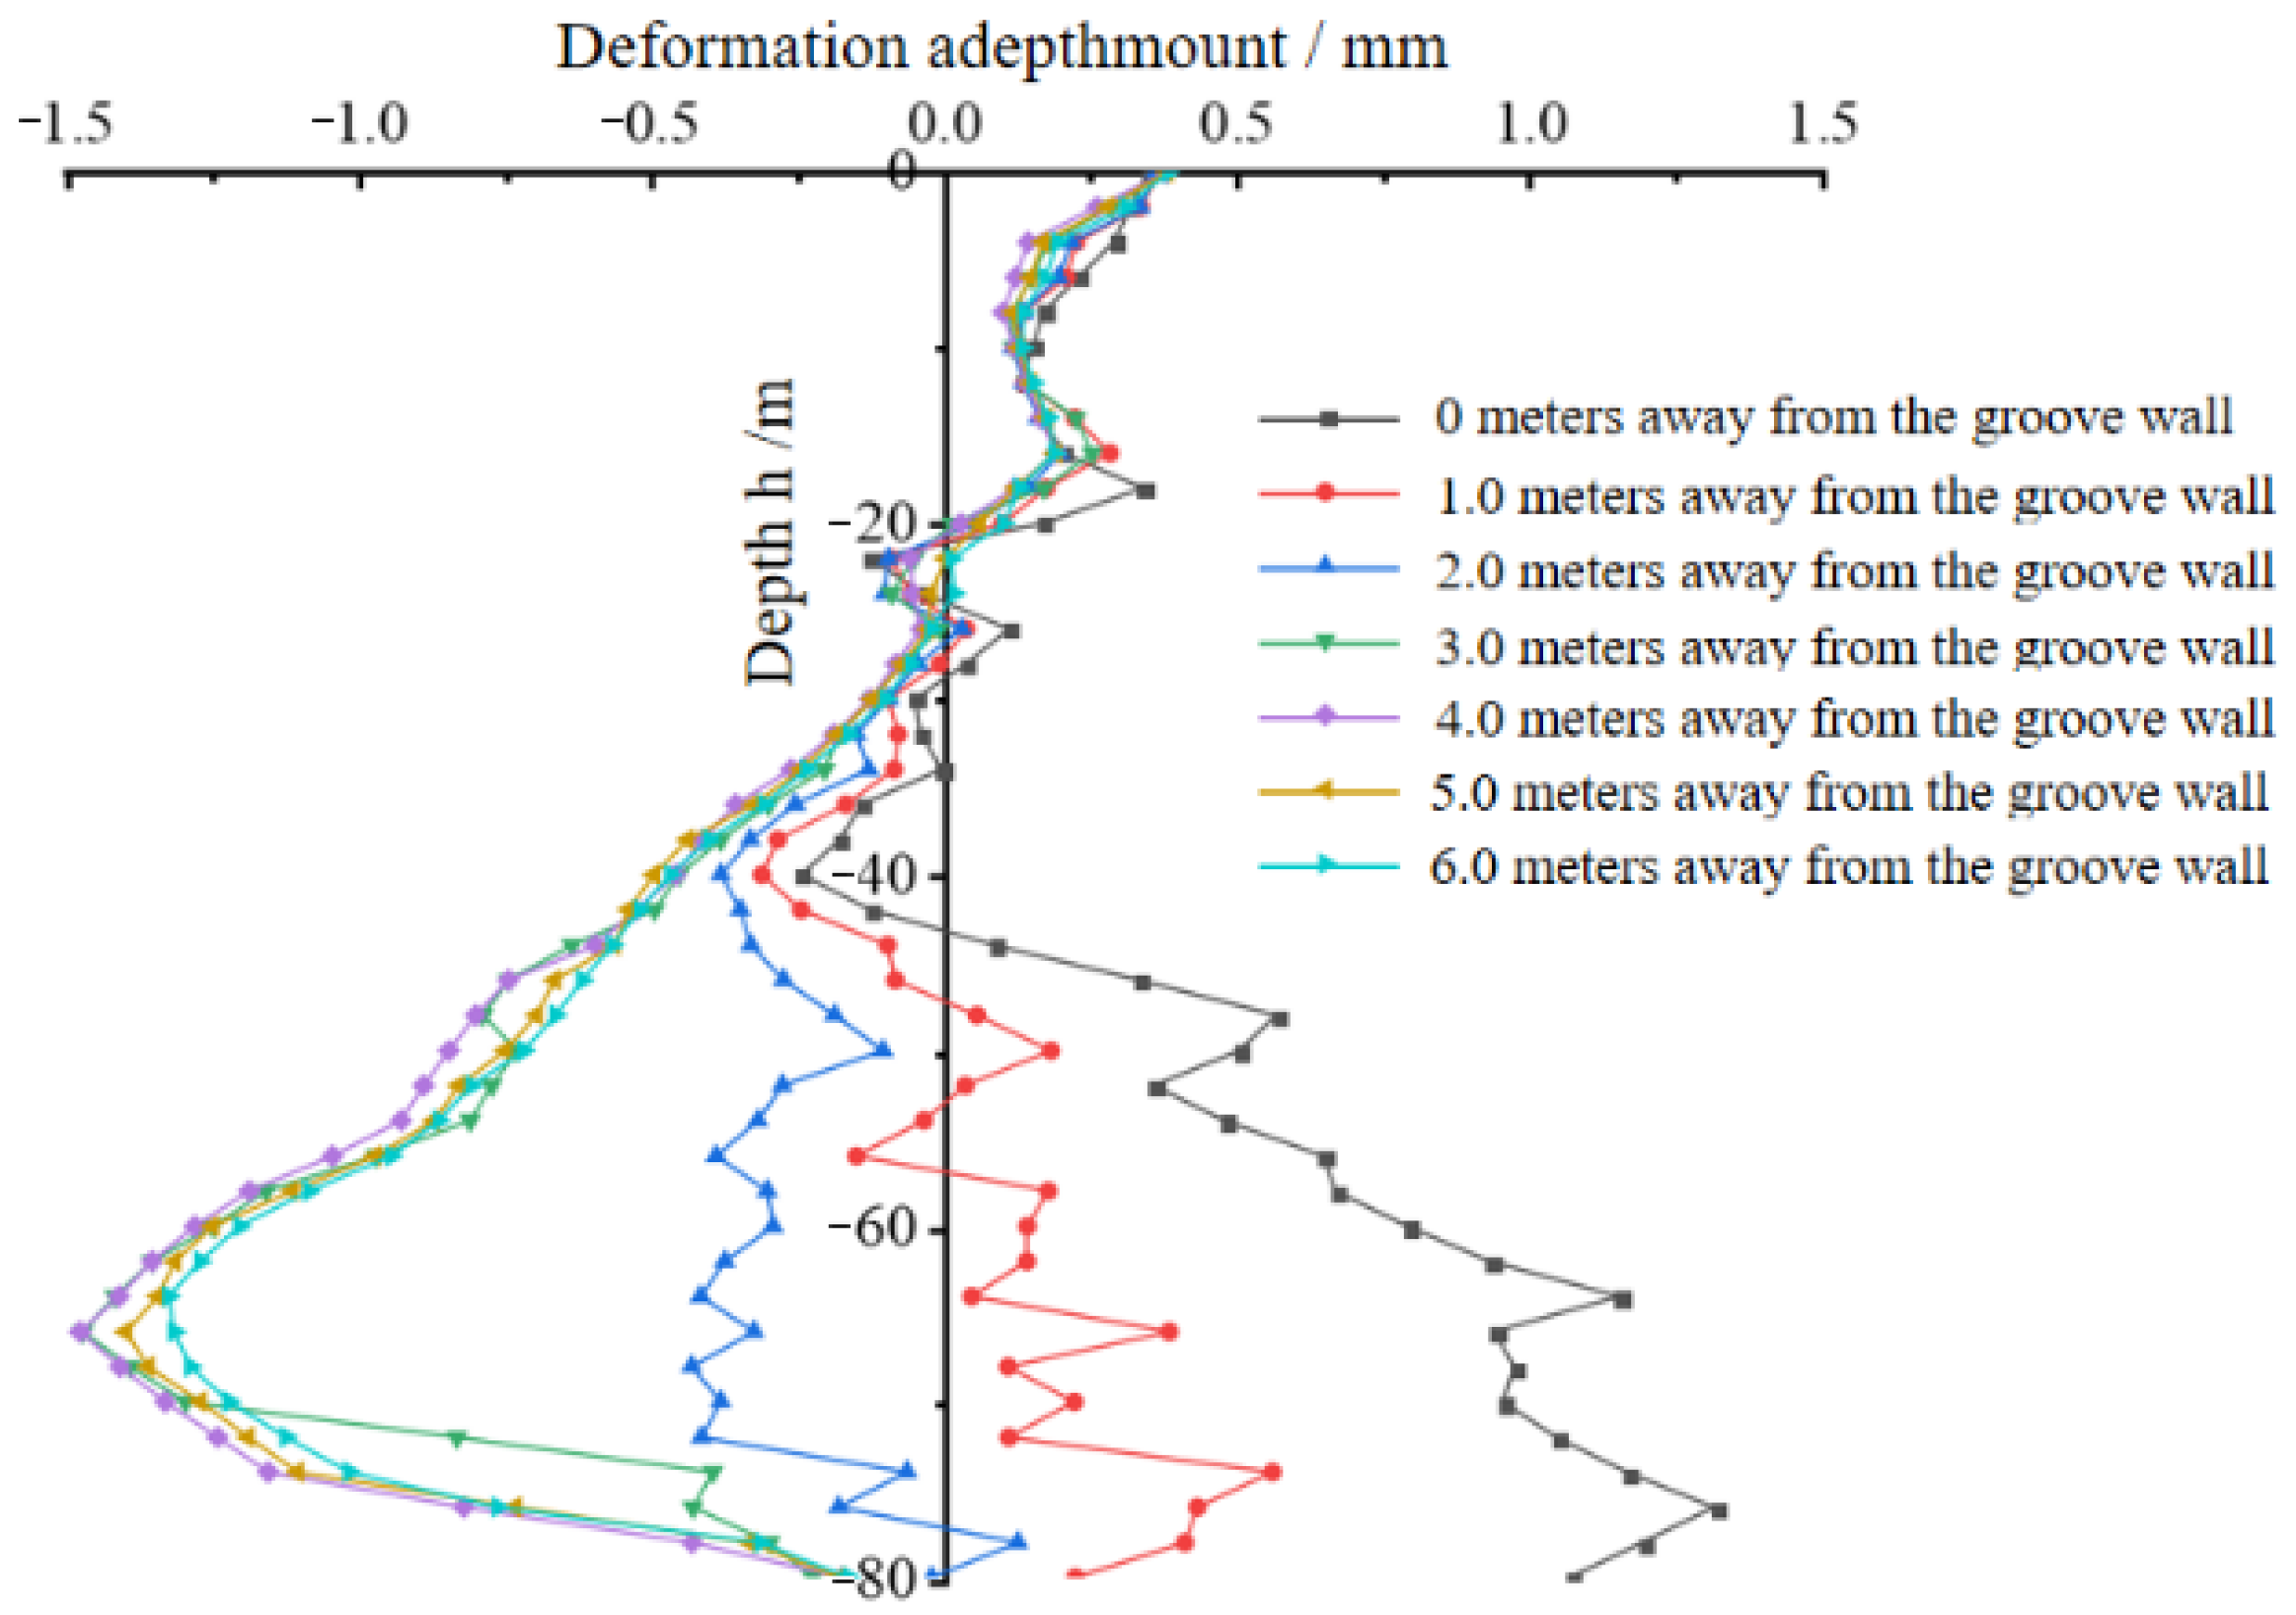
4.3. Analysis of Y-Direction Deformation Characteristics of Groove Trench (Short Side)

Figure 13 and Figure 14 display the Y-direction deformation diagrams at different distances along the short side of the groove trench.
Under the first geological condition, the deformation pattern at the groove trench initially decreases and then increases, displaying slight fluctuations. As the distance from the groove trench increases, the upper part of the groove trench deformation experiences a gradual decrease but the lower part of the groove trench deformation goes from inward to outward. The maximum lateral deformation is 1.48 mm at 4 m.
Under the second geological condition, the deformation trend of the groove trench is largely consistent with the first geological condition. However, due to the relatively shallow excavation depth of the groove, the overall deformation is relatively small.

4.4. Analysis of Y-Direction Deformation Characteristics of Groove Trench (Short Side)

Considering the combined influence of the groove dimension and soil arching effect, we can summarize the deformation patterns in both the X and Y directions of the groove trench. The above results show that the soil around the groove of the ultra-deep diaphragm wall does not simply deform into the inside and it reflects a variety of different deformation modes. The deformation characteristics of the groove wall at different depths can be described as follows.
The first type: The upper filling material and marine clay is characterized by poor geological parameters and weak soil self-stability. Both the long and short sides of the groove move inward after the excavation. In the filling material and marine clay layer, the surrounding soil within the groove section exhibits a deformation trend toward the groove, as depicted in Figure 15a.
The second type: This involves the upper portion of the strongly weathered rock layer, which boasts relatively favorable geological parameters. Due to the relatively larger size of the long side of the groove, the soil around the long side moves inward, while the short side experiences compression by the long side, which shows an outward movement trend. The deformation of the surrounding soil is divided into two areas: the soil within the long side of the groove deforms inward, while the soil on the short side deforms outward, as illustrated in Figure 15b.
The third type: At the middle and lower portions of the strongly weathered rock layer, the soil around the long side of the groove still moves toward the inside, exerting pressure on the soil around the short side. For the large depth, the inner wall of the groove experiences relatively high soil pressure. The combined effect of the mud balance pressure and compression on the long side of the groove results in a rather complex deformation pattern. The surrounding soil deformation can be divided into three regions: Zones 1 and 2 deform toward the inner groove, while Zone 3 deforms toward the outer groove, as depicted in Figure 15c–e.

4.5. Analysis of Z-Direction Deformation Characteristics of Surface

The surface settlement along the centerline of the groove is depicted in Figure 16. Under the first geological condition, the maximum surface settlement on the long side centerline measures 2.98 mm, while the maximum surface settlement on the short side centerline reaches 1.76 mm. Meanwhile, under the second geological condition, the maximum surface settlement on the long side centerline is 1.78 mm, with the maximum surface settlement on the short side centerline measuring 0.58 mm.
Due to the greater excavation depth, the surface settlement of the first stratum is larger than the second type. Based on the aforementioned analysis, the lateral deformation of the long side of the groove surpasses that of the short side, leading to a considerably larger surface settlement on the long side. Moreover, the settlement diminishes as the distance from the slot increases. The observed surface deformation pattern aligns with the lateral deformation behavior of the trough section.

5. Conclusions

The horizontal strip method is introduced to analyze the stability of the groove trench of the ultra-deep diaphragm wall and the applicability of the method is verified. Through finite element numerical simulation, the deformation law of the soil around the groove trench is analyzed and summarized and the deformation characteristics of the groove trench of the ultra-deep ground are discussed. Based on the analysis of the stability and deformation characteristics of the groove trench, the following main conclusions have been drawn:
(1)
The stability of the diaphragm wall groove trench in this project was analyzed using the two-dimensional wedge horizontal strip method. Through calculations, it was determined that the mud weight required to ensure the stability of the groove trench is approximately 12.70 kN/m3 (Stratum 1) and 12.64 kN/m3 (Stratum 2). These values are slightly higher than the actual maximum mud weight of 12.5 kN/m3. The results highlight the effectiveness of the horizontal strip method in accurately determining the required mud weight.
(2)
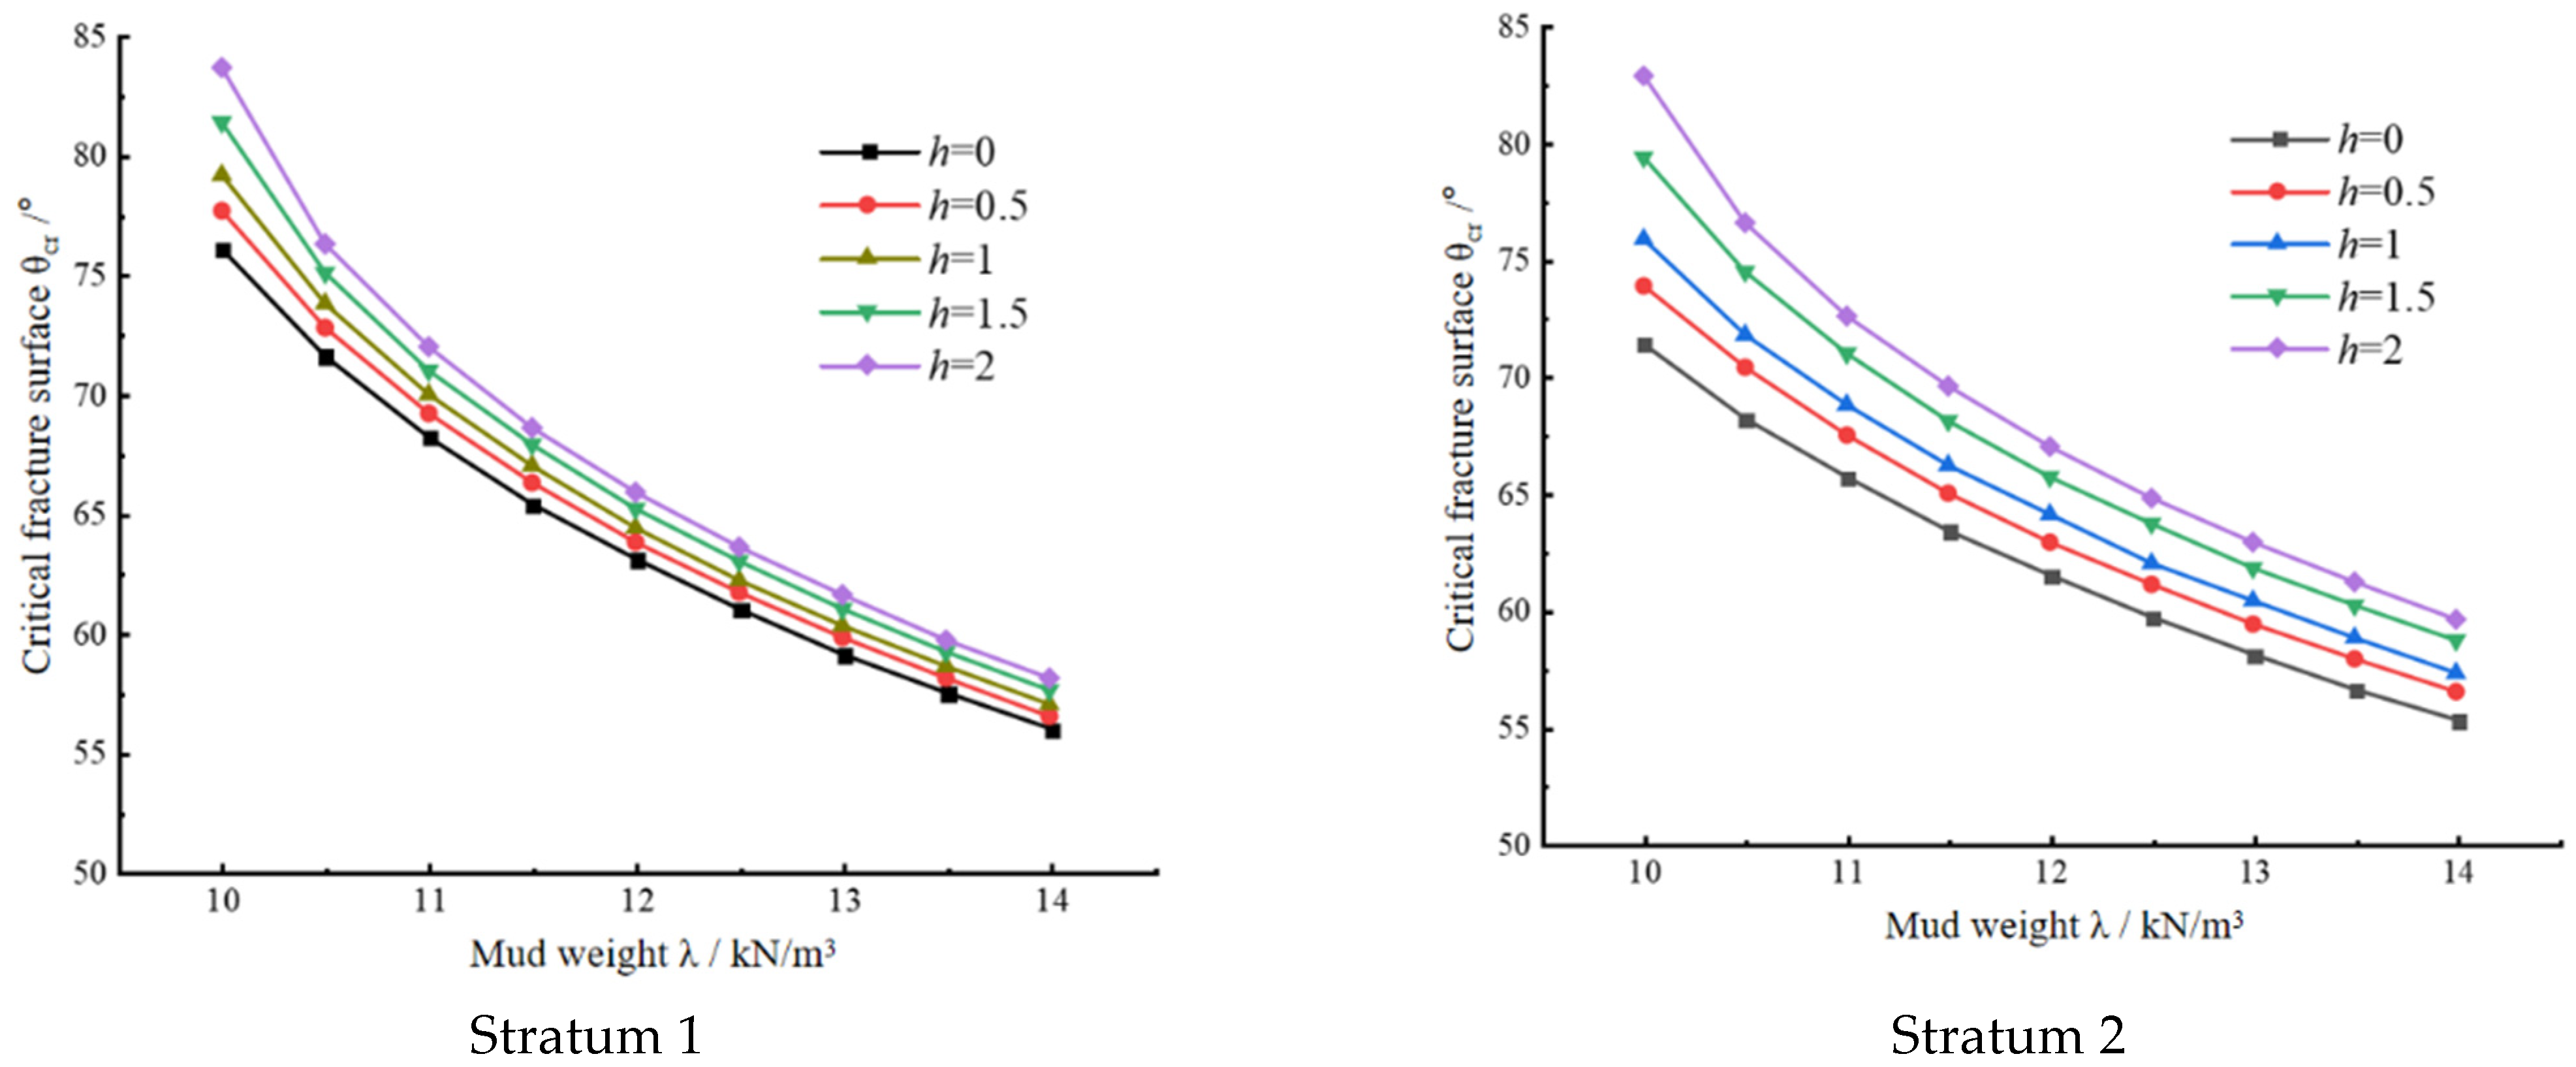
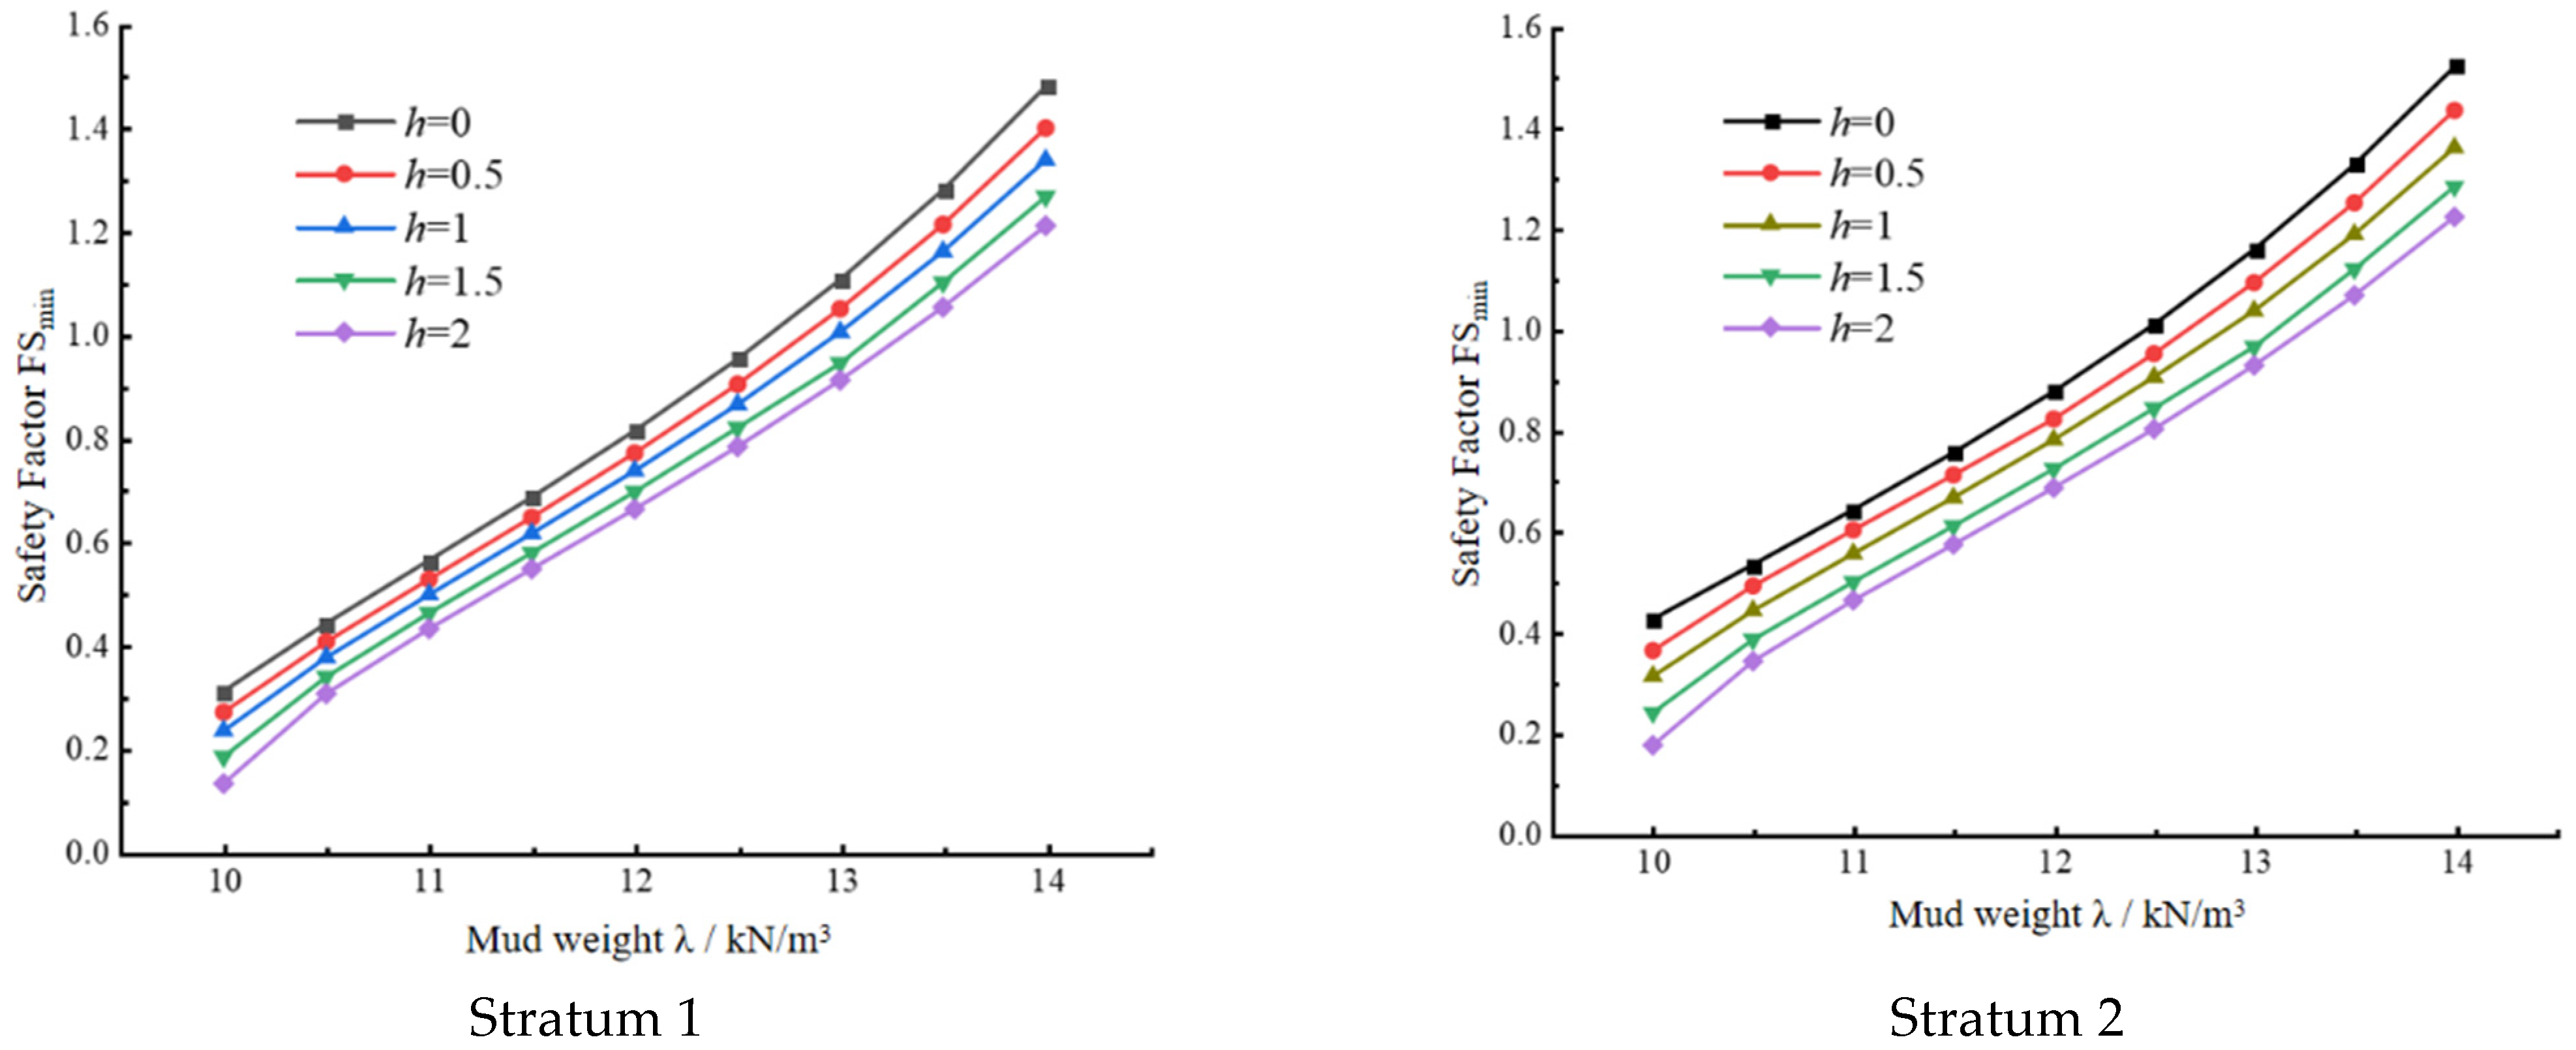
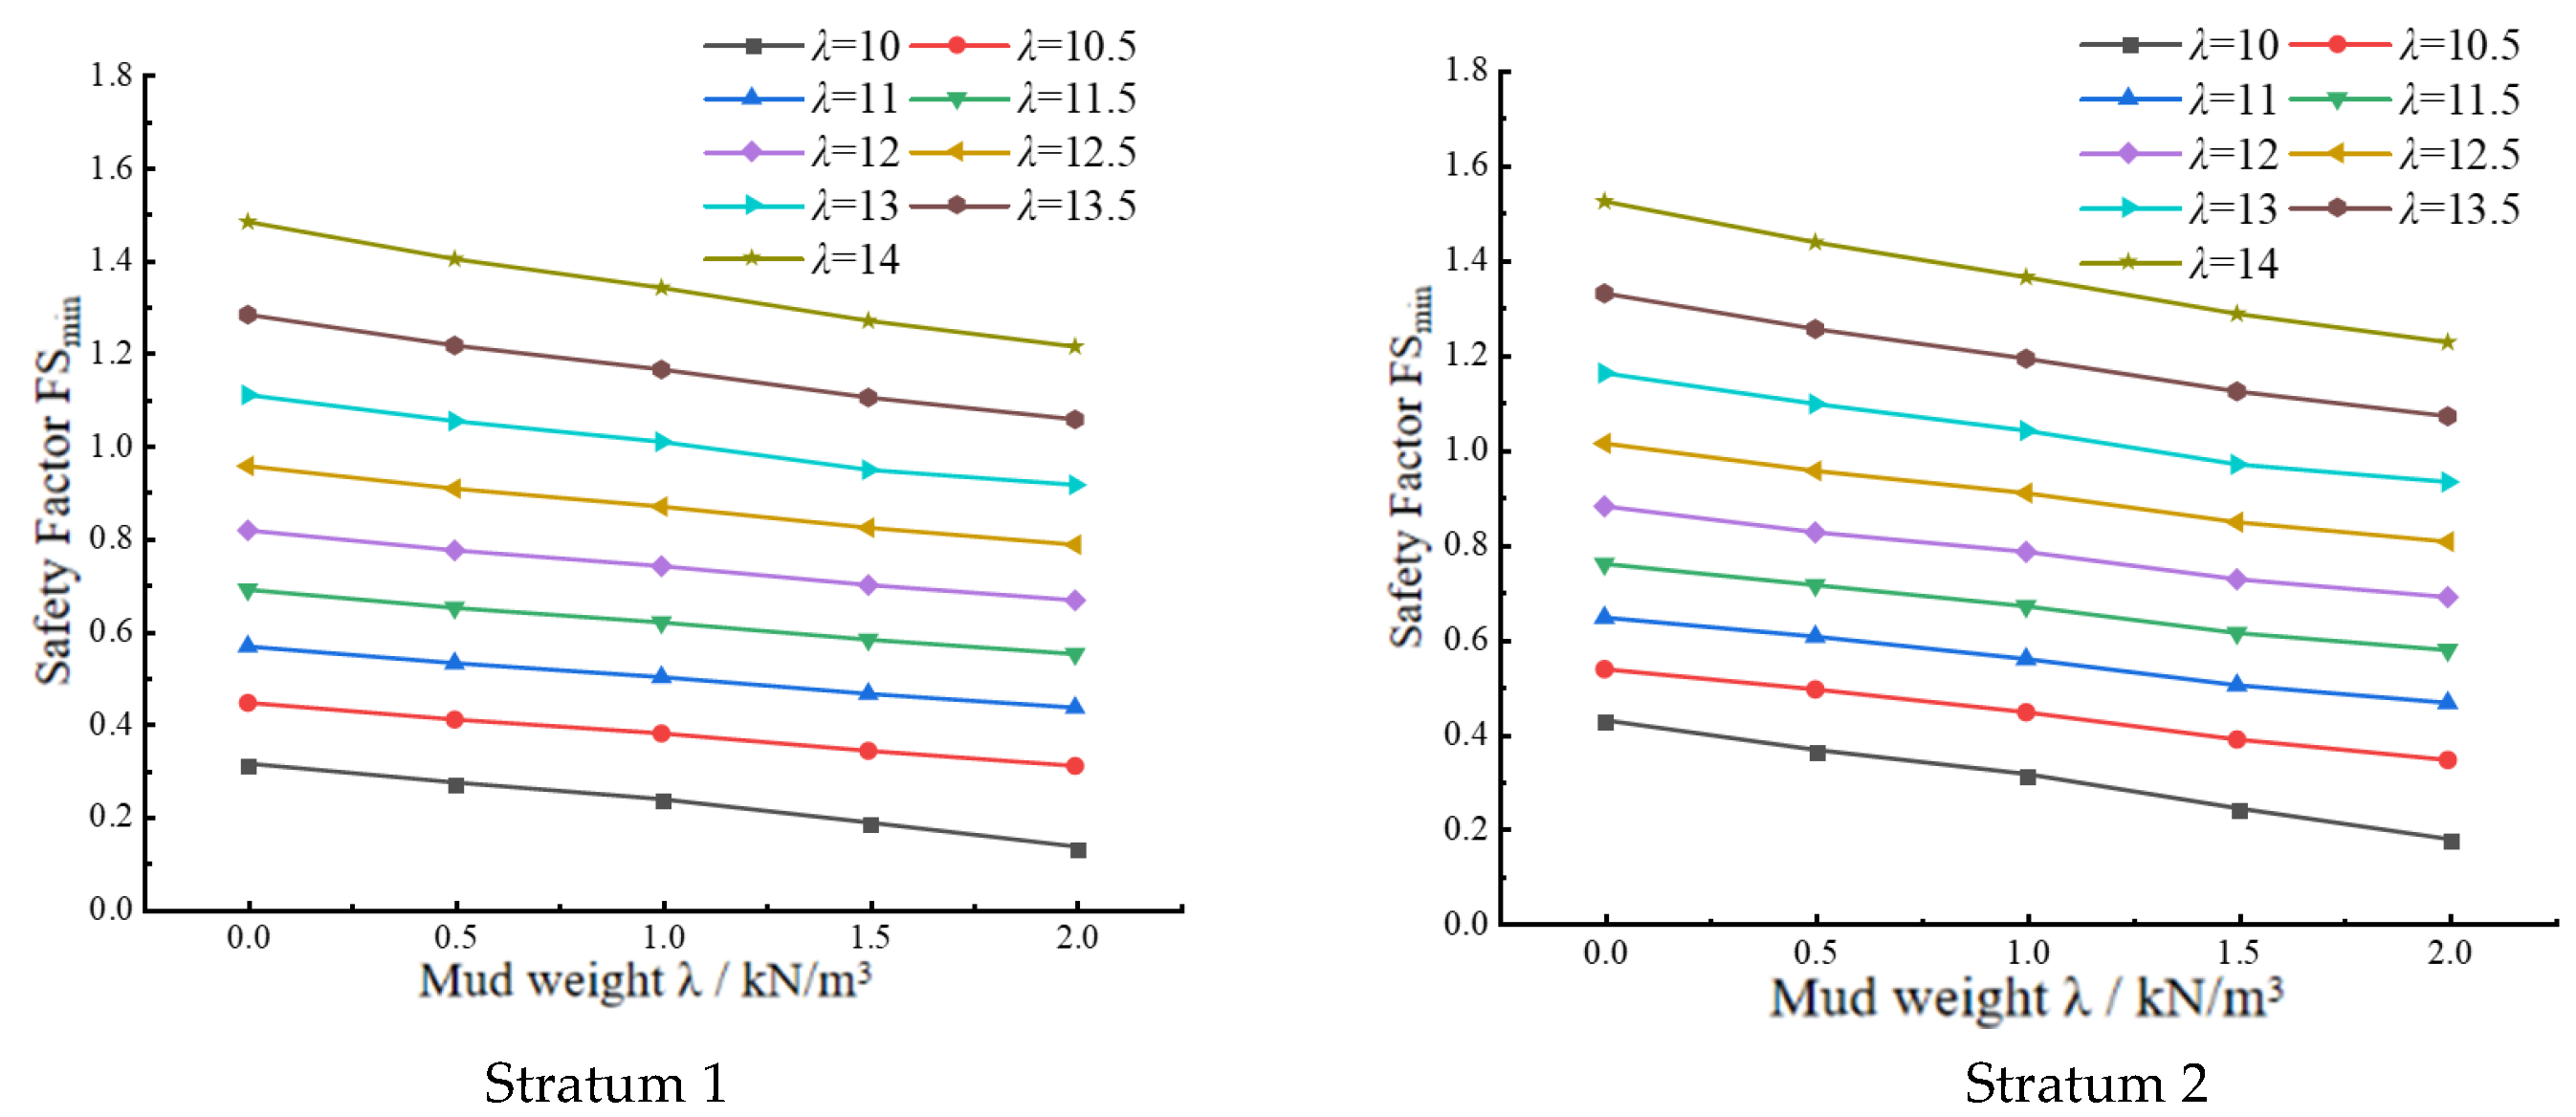
The mud weight and mud level elevation significantly impact the critical fracture angle and stability coefficient of the groove trench. A higher mud weight and elevated slurry surface lead to a relatively larger stability coefficient. The findings emphasize the importance of considering the mud weight and mud level in ensuring the stability of the groove trench.
(3)
On the long side of the groove trench, soil deformation decreases as the distance from the wall increases. When the distance exceeds 6m, the maximum deformation at the lower part of the groove trench tends to stabilize, with a significant reduction in the rate of deformation. In this project, the excavation width of the groove trench is 6.5m. The soil within the range of groove trench long side size is heavily influenced, while the impact diminishes beyond this range. On the short side of the groove trench, the deformation fluctuation is relatively small compared to the long side.
(4)
Considering the combined effect of the dimensional differences and the soil arching, the soil around the groove of the ultra-deep diaphragm wall does not simply move toward the groove, which shows three distinct deformation modes.

Author Contributions

Conceptualization, J.M. and G.H.; methodology, R.R.; software, G.H.; validation, J.M. and G.H.; formal analysis, R.D.; investigation, G.H.; resources, J.M.; data curation, T.S.; writing—original draft preparation, G.H.; writing—review and editing, R.D.; visualization, J.M.; supervision, J.M.; project administration, J.M.; funding acquisition, G.H. All authors have read and agreed to the published version of the manuscript.

Funding

This work was financially supported by the National Natural Science Foundation of China (Funding Number: Grant No. 42272315) and the National College Students Innovation and Entrepreneurship Training Program of China (Funding Number: 202210497084). Their support is greatly appreciated.

Data Availability Statement

Relevant data can be obtained by contacting the author Hu Gang (email: [email protected]).

Conflicts of Interest

Author Jianhua Ma was employed by the company China Harbour Engineering Co., Ltd. Author Gang Hu was employed by the company China Gezhouba Group Investigation & Design Co., Ltd. The remaining authors declare that the research was conducted in the absence of any commercial or financial relationships that could be construed as a potential conflict of interest.

Nomenclature

The following symbols are used in this paper:
FSsafety factors based on the horizontal strip method;
FSminthe minimum value of FS;
θ sliding surface inclination;
θcrthe corresponding angle θ to the FSmin;
c′(i)the effective cohesion of strip i, each strip represents a layer of soil;
φ′(i)the effective internal friction angle of strip i;
l(i)the length of slide surface of strip i;
W(i)the dead weight of strip i;
Fn(i)the vertical force acting on the upper side of strip i, downward is positive;
Fs(i)the shear force acting on the upper side of strip i, right is positive;
Ps(i)the horizontal slurry force acting on the left side of strip i, right is positive;
U(i)the water pressure acting on the sliding surface of strip i;
Fn(i + 1)the vertical force acting on the downward side of strip i, upward is positive;
Fs(i + 1)the shear force acting on the downward side of strip i, left is positive;
N(i)sliding surface normal force of strip i;
T(i)sliding surface sheer force of strip i.

References

  1. Zhang, L. Study on construction technology of three walls unified into one for underground diaphragm wall. Build. Constr. 2009, 31, 161–164. [Google Scholar]
  2. Liu, Y.T.; Xu, W.; Guo, H.G. Excavation simulation of super deep foundation pit braced by circular rock-socketed diaphragm wall. J. Fujian Univ. Technol. 2004, 1, 39–43. [Google Scholar] [CrossRef]
  3. Yang, G.H. Practical calculation method of retaining structures for deep excavations and its application. Rock Soil Mech. 2004, 12, 1885–1896, 1902. [Google Scholar] [CrossRef]
  4. Li, F. Studies on circle-style retaining structures. Chin. J. Geotech. Eng. 2006, S1, 1522–1524. [Google Scholar] [CrossRef]
  5. Zhai, J.Q.; Wang, Q.; Wang, S.S.; Zhang, Z.B.; Wan, J.C. Design, construction, and monitored behavior of two large-diameter cylindrical diaphragm walls on an offshore reclamation island. In IOP Conference Series: Earth and Environmental Science; IOP Publishing: Bristol, UK, 2024; Volume 1336, p. 012016. [Google Scholar] [CrossRef]
  6. Cao, H.R.; Peng, L.M.; Lei, M.F.; Tang, Q.L. Research Status of the Instability Mode and its Stability Calculation Method of Underground Diaphragm Wall. J. Railw. Sci. Eng. 2019, 16, 1743–1748. [Google Scholar] [CrossRef]
  7. Xia, Y.Y.; Pei, Y.Y.; Wang, Z.; Chen, S.Y.; Chen, C. Numerical Simulation of Stress Redistribution During Diaphragm Wall Construction. Rock Soil Mech. 2012, 33, 3433–3438. [Google Scholar] [CrossRef]
  8. Dong, Y.; Whittle, A.J. Effect of concreting pressure on ground response caused by installation of diaphragm wall panels. Géotechnique 2022, 74, 81–98. [Google Scholar] [CrossRef]
  9. Yang, M.; Lu, J.Y. Estimation of Ground Settlement Aroused by Deep Excavation. Chin. J. Geotech. Eng. 2010, 32, 1821–1828. [Google Scholar]
  10. Zhao, H.; Shen, X.; Jia, P.; Zhou, X. Diaphragm Wall Deformation Behavior and Inclinometer Data Analysis for Braced Deep Excavations. Int. J. Geomech. 2024, 24, 04024092. [Google Scholar] [CrossRef]
  11. Lei, G.H.; Wang, X.; Lei, G.G. Stability Influencing Factors and Instability Mechanism of Slurry-supported Excavations. Adv. Sci. Technol. Water Resour. 2006, 26, 82–86. [Google Scholar] [CrossRef]
  12. Lei, G.H.; Wang, X.; Lei, G.G. Sliding Wedge Shape and Analysis Method of Global Stability of Rectangular Excavated Trenches. J. Southeast Univ. (Nat. Sci. Ed.) 2006, 1, 102–106. [Google Scholar] [CrossRef]
  13. Xia, Y.Y.; Pei, Y.Y.; Wang, Z.D. Horizontal Slice Method for Stability of Slurry Trench. Chin. J. Geotech. Eng. 2013, 35, 1128–1133. [Google Scholar]
  14. Ahmed, A.; Ugai, K.; Yang, Q.Q. Assessment of 3D Slope Stability Analysis Methods Based on 3D Simplified Janbu and Hovland methods. Int. J. Geomech. 2018, 12, 81–89. [Google Scholar] [CrossRef]
  15. Yi, A.F. Calculation Method of Slurry Volume-weight During Trenching Construction of Diaphragm Wall. J. Railw. Sci. Eng. 2017, 14, 1019–1023. [Google Scholar] [CrossRef]
  16. Miao, Y.B.; Jiang, S.; Huang, M.; Huang, X.; Shen, Q.W. Local Stability Calculation and Factors of Slurry Trench With Strength Reduction Method. J. Eng. Geol. 2017, 26, 874–880. [Google Scholar] [CrossRef]
  17. Meng, D.P. Stability Analysis of Slurry Trench of Diaphragm Based on Strength Reduction Finite Element Method. Geotech. Eng. Tech. 2018, 32, 69–73. [Google Scholar]
  18. Mrton, K.; Cater, R.W.; Linney, L. Observed Settlements of Buildings Adjacent to Stations Constructed for the Modified Initial System of the Mass Transit Railway, Hong Kong. In Proceedings of the 6th Southeast Asian Conference of Soil Engineering, Taipei, Taiwan, 19–23 May 1980; pp. 415–429. [Google Scholar]
  19. Poh, T.Y.; Wong, I.H. Effects of Construction of Diaphragm Wall Panels on Adjacent Ground: Field Trial. J. Geotech. Geoenviron. Eng. 1998, 124, 749–756. [Google Scholar] [CrossRef]
  20. Ou, Z.Y. Analysis and Design Theory and Practice of Deep Excavation Engineering; Science and Technology Books Limited Company: Taibei, Taiwan, 2004. [Google Scholar]
  21. Pei, Y.J.; Zheng, G.; Liu, J.Q. Model test and numerical analysis of diaphragm wall with hinged joints on both sides. Rock Soil Mech. 2008, 29, 279–284. [Google Scholar] [CrossRef]
  22. Liu, M. Structural performance of the deep foundation pit bracing with circular diaphragm wall. J. Highw. Transp. Res. Dev. 2005, 22, 100–103, 118. [Google Scholar]
  23. Chen, F.Q.; Yang, G.H.; Zhang, Y.C.; Yao, L.N. Discussion on value of coefficient α in structural design of circular diaphragm wall. Chin. J. Geotech. Eng. 2012, 34, 203–206. [Google Scholar]
  24. Shen, J.; Wang, W.D.; Weng, Q.P. Analytic method of diaphragm walls of circular foundation pits. Chin. J. Geotech. Eng. 2008, 30, 280–285. [Google Scholar]
  25. Pei, Y.Y.; Xia, Y.Y.; Zhou, Z.Y.; Wang, Z.D.; Zhou, X. Analytical Solution for Horizontal Stress and Displacement Distribution Due to Diaphragm Wall Construction. J. Wuhan Univ. Technol. 2014, 36, 103–108. [Google Scholar]
  26. Britto, A.M.; Kusakabe, O. Stability of unsupported axisymmetric excavations in soft clay. Géotechnique 1982, 32, 261–270. [Google Scholar] [CrossRef]
  27. Toyosawa, Y.; Horii, N.; Tamate, S. Analysis of fatal accidents caused by trench failure. Int. Conf. Case Hist. Geotech. Eng. 1993, 2, 751–758. [Google Scholar]
  28. Oblozinsky, P.; Ugai, K.; Katagiri, M.; Saitoh, K.; Ishii, T.; Masuda, T.; Kuwabara, K. A design method for slurry trench wall stability in sandy ground based on the elasto-plastic fem. Comput. Geotech. 2001, 28, 145–159. [Google Scholar] [CrossRef]
  29. Xu, Y.G.; Wei, Z.L.; Zhou, G.N.; Sun, Y.Y. Analysis of stability of slurry trench sides of diaphragm wall based on construction parameters. Chin. J. Rock Mech. Eng. 2011, 30, 3464–3470. [Google Scholar]
  30. Xu, Q.; Xie, J.; Sun, Z.; Lu, L.; Yu, H. Stability Analysis of Trench Wall for Diaphragm Wall in Ultra-Deep Circular Foundation Pit: A Comprehensive Investigation. Appl. Sci. 2023, 13, 12037. [Google Scholar] [CrossRef]
  31. An, C.L.; Feng, W.X.; Zhao, Q.H.; Ji, L.L.; He, D.L.; He, B.G. Local Stability of Trench for Diaphragm Walls Passing through Deep Weak Interlayer. Adv. Mater. Sci. Eng. 2021, 2021, 9934516. [Google Scholar] [CrossRef]
  32. Gunn, M.J.; Satkunananthan, A.; Clayton, C.R.I. Finite element modelling of installation effects. In Retaining Structures: Proceedings of the Retaining Structures Conference held at Robinson College, Cambridge, Thomas Telford 1992; Thomas Telford Publishing: London, UK, 1993; pp. 46–55. [Google Scholar]
  33. Ng, C.W.W.; Springman, S.M.; Norrish, A.R.M. Centrifuge Modeling of Spread-Base Integral Bridge Abutments. J. Geotech. Geoenviron. Eng. 1998, 124, 376–388. [Google Scholar] [CrossRef]
  34. Gourvenec, S.M.; Powrie, W. Three dimensional finite element analysis of diaphragm wall excavation. Géotechnique 1999, 49, 801–823. [Google Scholar] [CrossRef]
  35. Ning, J.; Yu, J.; Huang, M. Effect of slurry infiltration on trench stability of diaphragm wall. In Proceedings of the Eleventh International Symposium on Geotechnical Aspects of Underground Construction in Soft Ground, Macao, China, 14–17 June 2024; pp. 190–197. [Google Scholar]
  36. Pei, Y.Y. The Environmental Effect of Diaphragm Wall Panel Construction; Wuhan University of Technology: Wuhan, China, 2013. [Google Scholar]
Figure 1. Schematic diagram of the foundation pit plan.
Buildings 14 02227 g001
Figure 2. WDP01 foundation pit support profile.
Buildings 14 02227 g002
Figure 3. Schematic diagram of the force on the strip.
Buildings 14 02227 g003
Figure 4. Relationship between mud weight and critical rupture angle.
Buildings 14 02227 g004
Figure 5. Relationship between mud height and critical fracture angle.
Buildings 14 02227 g005
Figure 6. Relationship between mud weight and safety factor.
Buildings 14 02227 g006
Figure 7. Relationship between mud height and safety factor.
Buildings 14 02227 g007
Figure 8. Appearance of numerical model.
Buildings 14 02227 g008
Figure 9. Relationship between the depth of the groove section and the X-direction deformation of the long side of the groove section (Stratum 1).
Buildings 14 02227 g009
Figure 10. Relationship between the depth of the groove section and the X-direction deformation of the long side of the groove section (Stratum 2).
Buildings 14 02227 g010
Figure 11. Relationship between different distances and maximum X-direction deformation (Stratum 1).
Buildings 14 02227 g011
Figure 12. Relationship between different distances and maximum X-direction deformation (Stratum 2).
Buildings 14 02227 g012
Figure 13. Relationship between the depth of the groove section and the Y-direction deformation of the short side of the groove section (Stratum 1).
Buildings 14 02227 g013
Figure 14. Relationship between the depth of the groove section and the Y-direction deformation of the short side of the groove section (Stratum 2).
Buildings 14 02227 g014
Figure 15. Deformation of soil around groove sections at different depths. (a) The first type of deformation. (b) The second type of deformation. (c) Deformation of the first zone toward the inner section of the groove. (d) Deformation of the second zone toward the inner section of the groove. (e) Deformation of the third zone toward the outer section of the groove.
Buildings 14 02227 g015
Figure 16. Surface settlement at the centerline of the trough section.
Buildings 14 02227 g016
Table 1. Support size and form.
Foundation Pit
Numbering
Diameter (m)Depth (m)Form of Support
WIP012867.7Diaphragm wall + ring inner brace
WIP1247.469.1Diaphragm wall + ring inner brace; bolt + shotcrete
WDP013878.2Diaphragm wall + ring inner brace
WDP1255.479.1Diaphragm wall + ring inner brace; bolt + shotcrete
WDP2255.479.1Diaphragm wall + ring inner brace; bolt + shotcrete
Table 2. Formation parameters.
StratumDensity
γ (kN/m3)
Cohesion
c (kPa)
Internal
Friction
Angle ϕ (°)
Permeability Coefficient k
(Micrometer/s)
Modulus E (MPa)
Artificial filler18.50301.00 × 10−110
Marine clay16.50221.00 × 10−311
Fully weathered~strongly weathered argillaceous siltstone19~203~531~331.00 × 10−140~150
Weathered~slightly weathered argillaceous siltstone 25330351.00 × 10−16000
Table 3. Critical fracture angle θcr and safety factor FSmin statistical table (Formation 1).
Height h(m)00.51
Density λ
(kN/m3)
θcrFSminθcrFSminθcrFSmin
1076.10.31071277.70.27006279.20.233697
10.571.60.44207572.80.40602973.80.375807
1168.20.56395669.20.52755700.497722
11.565.40.68644266.30.647492670.616014
12.063.10.81499263.80.77186764.40.73736
12.5610.95397661.70.90503362.20.866197
1359.11.10782659.81.05113160.31.006503
13.557.51.28171558.11.21481358.61.162572
14561.48226156.51.401837571.339578
Table 4. Critical rupture angle θcr and safety factor FSmin statistical table (Formation 2).
Height h(m)00.511.52
Density λ
(kN/m3)
θcrFSminθcrFSminθcrFSminθcrFSminθcrFSmin
1071.40.42564673.90.36310775.90.31202981.40.183583.70.13129
10.568.20.5339570.40.49113771.80.44241975.10.3381176.30.30542
1165.70.64272467.50.60253368.80.555303710.46158720.43133
11.563.40.756268650.71173566.20.66680767.90.5784468.60.54754
1261.50.87796862.90.82325864.10.78182165.20.696665.90.663462
12.559.71.01119261.10.953125620.906329630.8207263.60.78408
1358.11.15974859.41.09444360.41.038119610.9456661.60.913232
13.556.61.32832957.91.25277358.81.1902659.21.1023659.71.054626
1455.31.52304456.51.43651957.31.36236457.61.2684258.11.212454
Disclaimer/Publisher’s Note: The statements, opinions and data contained in all publications are solely those of the individual author(s) and contributor(s) and not of MDPI and/or the editor(s). MDPI and/or the editor(s) disclaim responsibility for any injury to people or property resulting from any ideas, methods, instructions or products referred to in the content.

