Abstract
In view of the problem that vibration of superstructures under vibration loads of metro trains causes, this research used a metro depot and superstructure project as its background and proposed a numerical simulation method based on the impedance analytical model and finite element model to simulate and predict the vibration and secondary noise response of subway trains affecting multi-story buildings at different locations on the ground and in the superstructure. The method’s accuracy was verified using real measurement data. The research shows that vibrations generated by subway operations vertically at lower floors remain relatively unchanged, then slowly attenuate before increasing near the top floors. Mitigation measures should primarily address four aspects: rails, fasteners, sleepers, and roadbed. The adverse effects of vibration can be controlled by reducing the excitation intensity of the vibration source, attenuating vibrations along the propagation path, and isolating vibrations in the foundation and interior of the building. This research method can quickly and accurately predict the vibration and noise conditions of superstructure properties and provide support for vibration and noise reduction in practical engineering.
1. Introduction
Transit-oriented development (TOD) represents a development paradigm that has seen increasing implementation along railroad lines in China in recent years. Many subway lines produce low-frequency microvibrations attributable to track irregularities, passing curves, train offsets, and wheel–rail abrasion, which are propagated through the tracks, tunnels, and soil strata to adjacent high-rise buildings [1]. Although the amplitude of these low-frequency vibrations is low, prolonged exposure may detrimentally affect the psychological and physiological well-being of residents, and in severe cases, could potentially result in cognitive decline [2,3,4].
Given the distinct vibration and noise characteristics of the vehicle section and the main line, implementing targeted interventions to attenuate vibrations and noise constitutes a critical technological approach in developing rail-proximate structures. Consequently, it is of substantial importance to simulate, predict, and analyze the vibration response of subway trains in the vehicle section affecting structures at varied ground positions and rooftop levels, in addition to assessing the resultant structural secondary noise [5,6,7]. Scholars worldwide have developed various methodologies and prediction models to address vehicle-induced environmental vibrations. Rossi F and colleagues established a predictive model for soil vibrations induced by trains, capable of providing root mean square velocities and vibration levels [8]. After validating the feasibility of the impedance method, Masoud Sanayei and colleagues utilized an impedance-based analytical model to simulate the dynamic behavior of a four-story, full-scale building and to predict the floor’s response to train-induced vibrations [9]. Wang Yimin and his team conducted empirical analyses on the propagation patterns of environmental and structural vibrations induced by train operations in junction areas [10]. Quanmin Liu and his team employed an FE-SEA hybrid method to investigate the structural noise of steel–concrete composite bridges [11]. Liang Ruihua and colleagues developed a probabilistic prediction model based on Bayesian neural networks (BNNs) for forecasting ground vibrations induced by trains [12]. Considering these research methodologies, this paper utilized a comprehensive combination of numerical simulations and field experiments for the study.
In this research, the vibration response to subway train-induced loads on superstructural elements within a specific section in Wuhan was thoroughly analyzed in the context of an ongoing vehicle section project. The impedance function model [6] and finite element numerical simulation [13] were applied to develop dynamic models encompassing train-track [14,15], roadbed–soil layers, and adjacent buildings [16,17] for the Wuhan section. Subsequently, these computational models were refined using empirical data [18], confirming the appropriateness of the model parameters, boundary conditions, and train loads [19]. This study implemented this method for the detailed predictive analysis of superstructure elements in the sensitive zones of the Ping Sheng vehicle section, assessing both structural vibrations within the subway section [4,20] and the resultant secondary acoustic comfort [20,21]. The closeness of the outcomes to preliminary predictions further corroborates the prediction method’s accuracy [22]. The method predicts the vibration and noise conditions of the superstructure under vibration load of metro trains quickly and accurately.
This study not only applies the finite element method but also systematically innovates it to predict subway vibration. Using finite elements, we propose a method that focuses on the vibration and noise of the subway superstructure. This method can accurately and quickly predict the vibration and noise of superstructure properties, providing support for vibration and noise reduction in actual engineering projects.
2. Methodology
The prediction model in this paper consists of two parts: a vehicle–track interaction dynamics model [23] and a moving load–track structure-surrounding strata–buildings structure finite element model [24]. This coupled train-track dynamics model accurately simulates the motion of a six-car subway train running on the track, enabling the calculation of the fastener reaction force, which can then be used as an excitation input for the track–buildings–soil finite element model to determine the building’s vibration response. The method has been validated in papers by He L [17], Li H [25], and Qiu Y, Zou C [26].
This paper used a real engineering project as the research background. A finite element model was established that encompassed track structures, surrounding strata, and building structures, reflecting actual operational conditions within a specific section of the Wuhan Metro. Parameters derived from B-type subway cars were integrated into the vehicle–rail dynamics model, allowing for the calculation of wheel–rail forces [27]. These forces were subsequently used in the finite element analysis to compute vibration responses resulting from subway train operations. Finally, the computed vibration responses were compared with measured values obtained from the Wuhan Metro, demonstrating the predictive model’s effectiveness and feasibility in capturing environmental vibrations induced by metro operations. Based on this, the impact of subway operations on vibration and secondary noise prediction for the new building above the subway vehicle section was investigated [18], as shown in Figure 1.
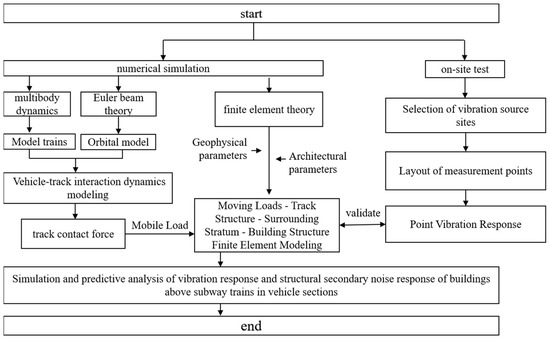
Figure 1.
Flowchart of research methodology.
This hybrid prediction method, based on ground vibration measurements and predictive modeling of building structures considering soil-structure interactions, calculates the vibration response of a new building using a predictive model of the building structure after obtaining measured ground surface vibrations. This approach has the advantage of not needing to consider tunnels and different soil layers in the model [28,29].
2.1. Modeling of Vehicle–Track Interaction Dynamics
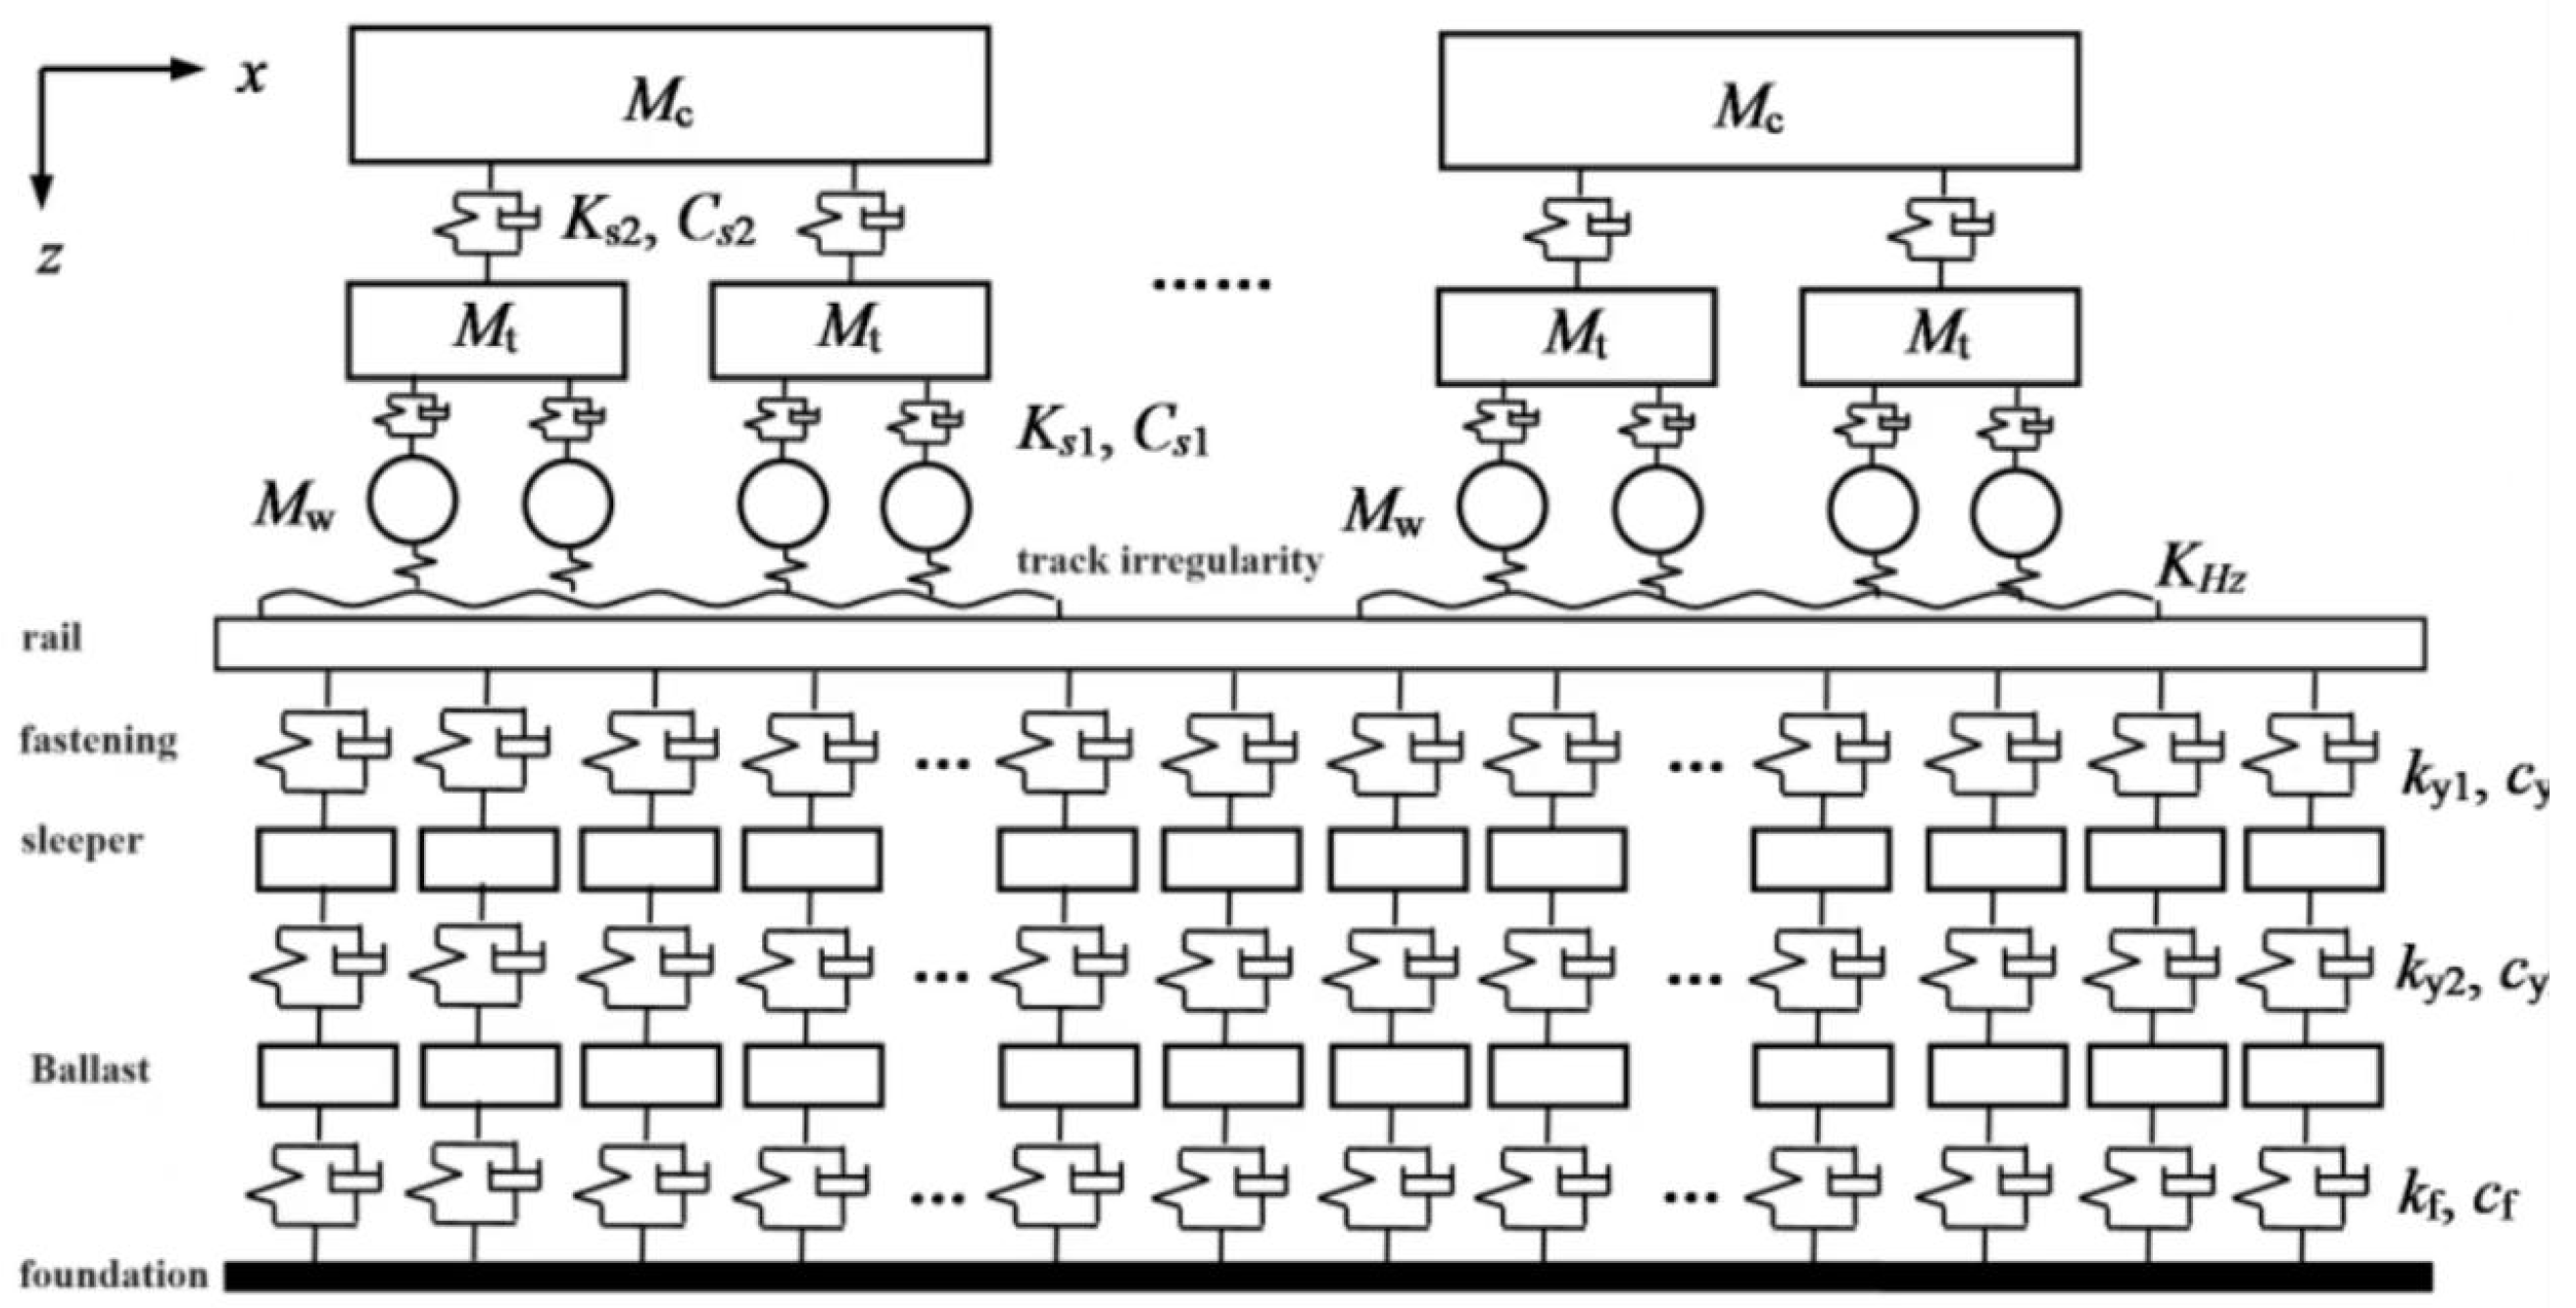
The vehicle–track interaction dynamics model is shown in Figure 2. The model includes a vehicle submodel and a track structure submodel; the x-direction represents the train’s running direction, and the z-direction denotes the vertical orientation [30]. Wheel pairs were coupled with the track using Hertzian nonlinear elastic contact theory, accounting for high- and medium-frequency vibrations in the wheel–rail system due to short-wave irregularities. Introducing track irregularities at the wheel–rail contact point allowed the derivation of interaction forces between the wheel and rail, inducing vibrations in both the vehicle and track systems. Subsequently, vehicle–track coupling was achieved through displacement compatibility and force equilibrium between the wheel and rail.

Figure 2.
Dynamic interaction model between vehicle and track.
Using multi-rigid body dynamics theory, the subway train dynamics model considered the train as a multi-section vehicle spaced at equal intervals [31]. Each segment was modeled as a multi-rigid body system consisting of a car body, two bogies, and four wheelsets. This model accounted for two degrees of freedom—vertical and pitching movements—for the car body and bogies, while wheelsets were modeled with vertical and lateral movements, resulting in a ten-degree-of-freedom model for each vehicle segment, interconnected by elastic suspension elements [32].
The track structure model included rails, sleepers, and ballast, with the latter representing the overall roadbed in this context. Rails were modeled as finite-length Euler beams, while sleepers and ballast were considered concentrated masses that supported vertical loads only. Connections between rails and sleepers, sleepers and ballast, and ballast and foundation were facilitated through tri-layered equivalent elastic and damping elements. Wheel–rail contact was modeled using the conventional Hertz nonlinear elastic contact theory.
Table 1 displays the dynamic parameters of the subway vehicle model utilized in this study. The excitation of the wheel–rail interaction employed six-level spectral amplitude samples from the United States, incorporating considerations for short-wave disturbances.

Table 1.
Parameters of vehicle dynamics.
A total of 24 moving wheel loads, representing the dynamic loads of a six-car subway train, were applied to the rails within the track–soil–building model [22]. Figure 3 illustrates the calculated dynamic contact forces between wheel and rail at various locations. The dynamic contact force between wheel and rail serves as the moving load input parameter, introduced into the model via the subroutine VDLOAD to act upon the track structure.
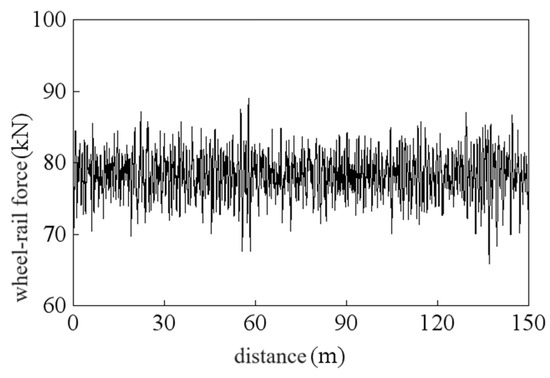
Figure 3.
Typical wheel–rail contact force as a function of distance.
2.2. Development of a Three-Dimensional Finite Element Model for Analyzing Track Structures, Surrounding Strata, and Building Interactions
Using the finite element software ABAQUS 6.1, a comprehensive three-dimensional finite element analysis model was developed. This model included the track structure, surrounding soil layers, and the building structure [33].
The vibration-sensitive zone within the Pingsheng vehicle section was chosen as the focus of this study, for which a three-dimensional finite element analysis model encompassing the track structure, surrounding strata, and building structures was developed. Infinite elements were used to model the natural foundation, aiming to negate the effects of artificially truncated boundaries. Calculated dynamic contact forces between wheel and rail served as input parameters for moving loads. These loads were applied using the subroutine VDLOAD to calculate the vibration responses across different building layers. Following this, the secondary noise responses of the structures were calculated [34,35].
The data for the model were derived from actual engineering. Using a ballasted roadbed as an example, the track and roadbed model included rails, fasteners, sleepers, and the roadbed itself (including the surface layer and ballast). The track gauge was set at 1.435 m, featuring a seamless line; the quantitative density of sleepers was 1680 per kilometer; and the roadbed consisted of a gravel layer with a thickness of 0.45 m. Relevant physical property parameters can be found in Table 2.
Table 2.
Parameters of the orbital structure model’s physical properties.
The model’s soil strata were simplified into four distinct layers, each simulated via a linear elastic model derived from geological borehole data and shear wave velocity measurements. Considering the influences of weak soil layers, variability among borehole data, and similar shear wave velocities across different strata, the foundation soil was categorized into artificial fill, silty soil, sand layer, and sandstone [36,37]. The sandstone layer’s thickness was considered infinite, reflecting the boundary conditions applied within the infinite element simulation model utilized in this study. Soil properties are listed in Table 3.
Table 3.
Key physico-mechanical parameters of the foundation soil model.
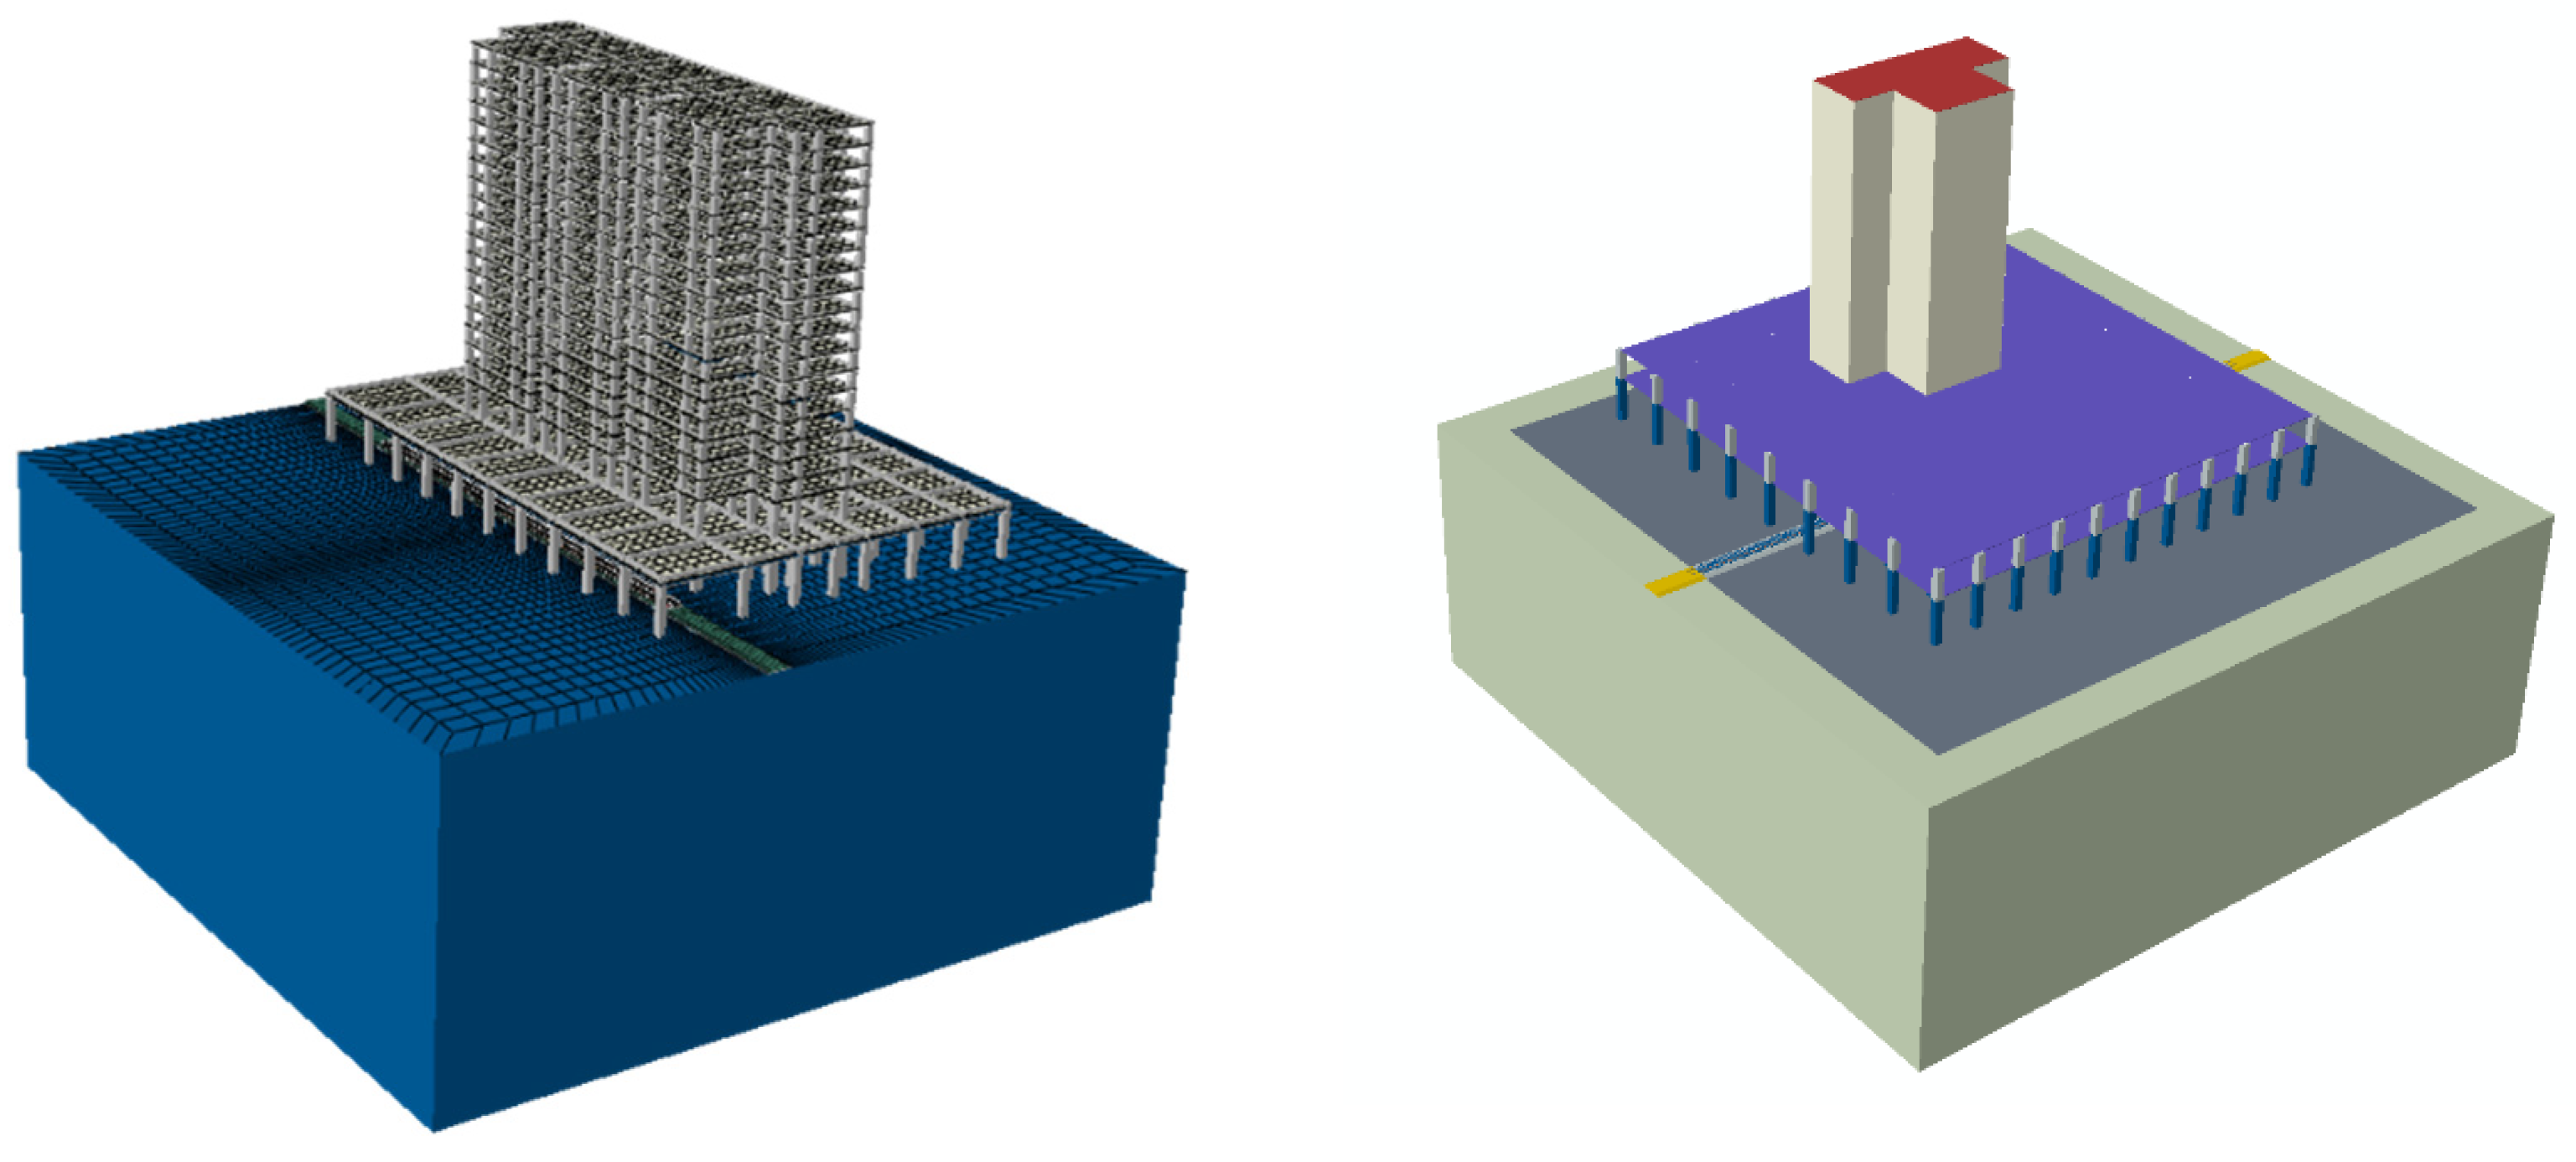
Following the specified parameters, individual building structure models were developed for the sensitive area. Beam elements simulated beams and frame columns, while shell elements were used for walls and floor slabs. To accurately capture soil-structure interaction, the embed contact method was employed. Reflecting the vibration propagation mechanism, the numerical model used a foundation separation approach. This method ensured that the track structure’s foundation was isolated from the building’s foundation, preventing direct vibration wave transfer from the track structure to the superstructure, thereby mitigating significant vibrations. Figure 4 illustrates a representative finite element model.
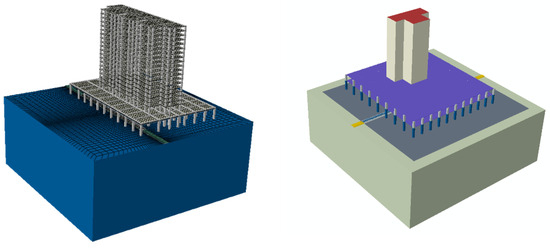
Figure 4.
Finite element model of a typical building structure.
Furthermore, the incremental time step was set to 0.002 s to satisfy the computational frequency (200 Hz) requirement. This research method was applied in the actual process of Foshan City Urban Rail Transit Line 4, providing technical support for the vibration and noise reduction in the Ping Sheng Vehicle Section. Two weeks of computational time were required for one analysis, and the method met the engineering needs with higher accuracy and efficiency.
3. Field Testing and Model Verification Processes
3.1. Overview of Test Sites
The total construction area extends over 524,000 m2, and the land area covers 171,942 m2, comprising a total of 635 residential units. Currently, this vehicle section is recognized as Wuhan’s largest subway vehicle depot, covering an area of 823 acres. It is equipped to facilitate parking for up to 32 trains and includes four maintenance bays. Significantly, the depot’s inner areas are equipped with vibration-damping measures, including fasteners and seamless tracks, while its outer areas utilize damping joint cleats as part of their strategy.
3.2. Evaluation Indicators
The indoor vibration of buildings caused by rail transit should be evaluated based on the indoor vibrations detectable by humans and whole-body vibration reflections. Vibration acceleration was evaluated as a source of noise, mainly using the weighted root-mean-square acceleration to assess the impact of vibration on occupants. For residential buildings (including commercial and residential buildings), the single-value evaluation metric for indoor vibration was the Z vibration level. The crossover frequency vibration measurement evaluation metric was the 1/3 octave plumb vibration acceleration level, with a frequency range of 1 to 80 Hz.
The maximum 1/3 octave band sound pressure level within the interior secondary structure noise space of a building when the train passes was used to calculate the model for secondary structural noise, which is defined as:
Equation (1) is applicable to a typical room renovation with a height of around 2.8 m and a reverberation time of approximately 0.8 s, covering an area of about 10 to 12 m2. Deviation from these conditions necessitates calculations based on Equation (2).
where is the maximum 1/3 octave band sound pressure level in the indoor space of a building during the passage of a single train. is the central vertical 1/3 octave band vibration velocity level in the indoor floor of buildings during the passage of a single train. σ is the sound radiation efficiency. H is the average room height in meters. is the reverberation time in seconds.
3.3. Model Validation
Measurements were conducted with the vibration source in its normal operating condition to minimize the influence of external environmental factors on the vibration measurements. These factors included extreme temperature gradients, strong electromagnetic fields, and high winds, as well as avoiding conditions such as rain, snow, thunder, lightning, and wind speeds exceeding 5 m per second at the measurement site.
Vertical accelerations of ground vibration at distances of 6 m, 12 m, 18 m, and 28 m from the test line within the vehicle section were computed. These computed values were then compared with the measured vertical accelerations near the test line. To facilitate comparison, time-domain diagrams were generated from the train passing process curve, with a data length of 9 s specifically selected to encompass the train passing event. Acceleration time-domain data were converted to acceleration spectrograms using the fast Fourier transform (FFT). One-third octave plots for acceleration levels were derived by applying the specific calculations and weighting criteria outlined in the “Standard for Limits of Vibration and Secondary Radiated Noise of Buildings Caused by Urban Rail Transit and its Measurement Methods” (JGJ/T 170-2009) [38] and the “Methods for Measurement of Ambient Vibration in Urban Areas” (GB 10070-88) [39], as illustrated in Figure 5, Figure 6, Figure 7 and Figure 8.
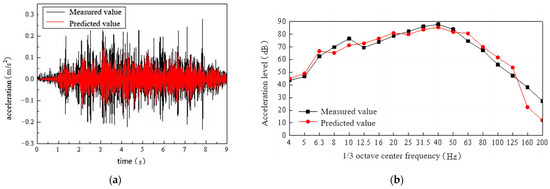
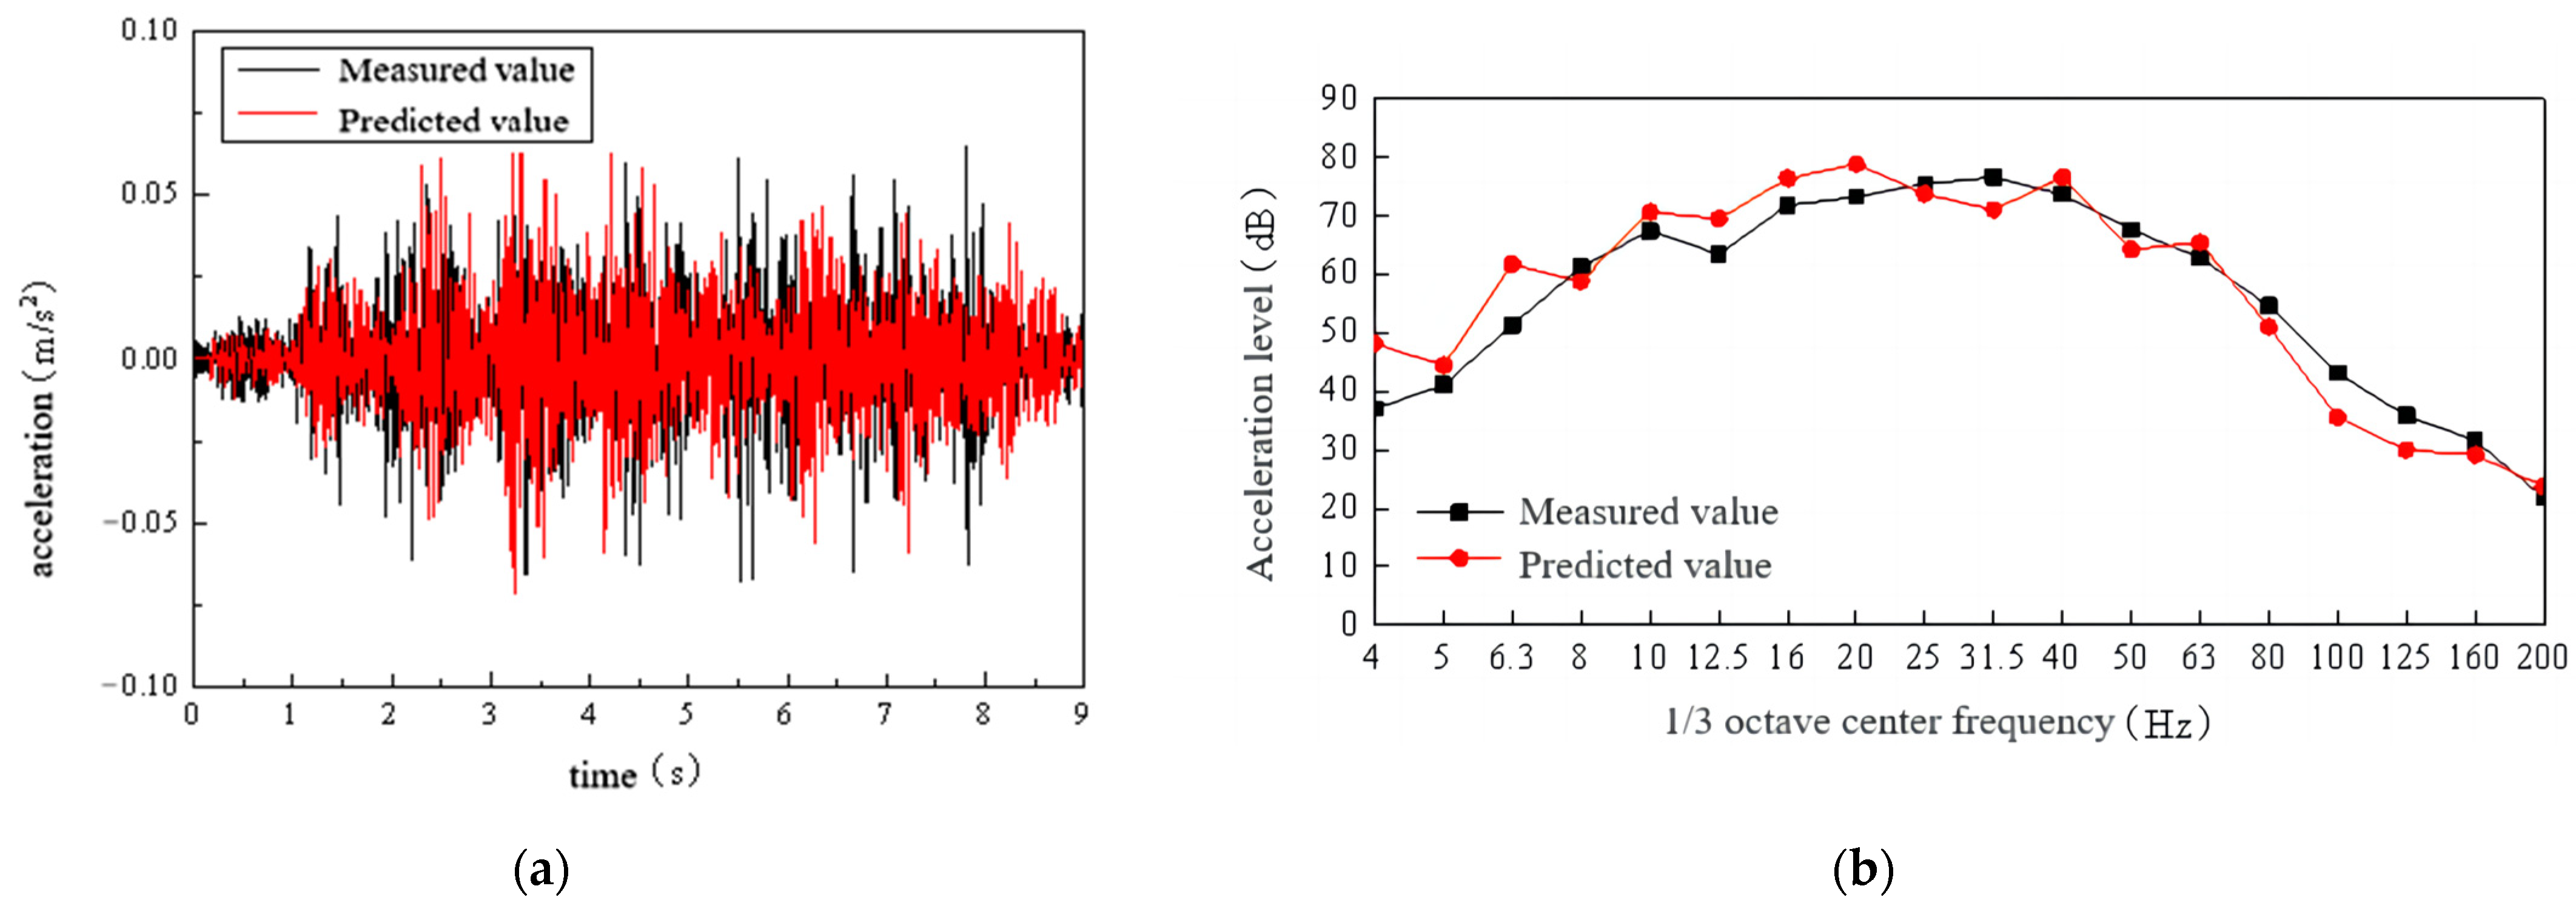
Figure 5.
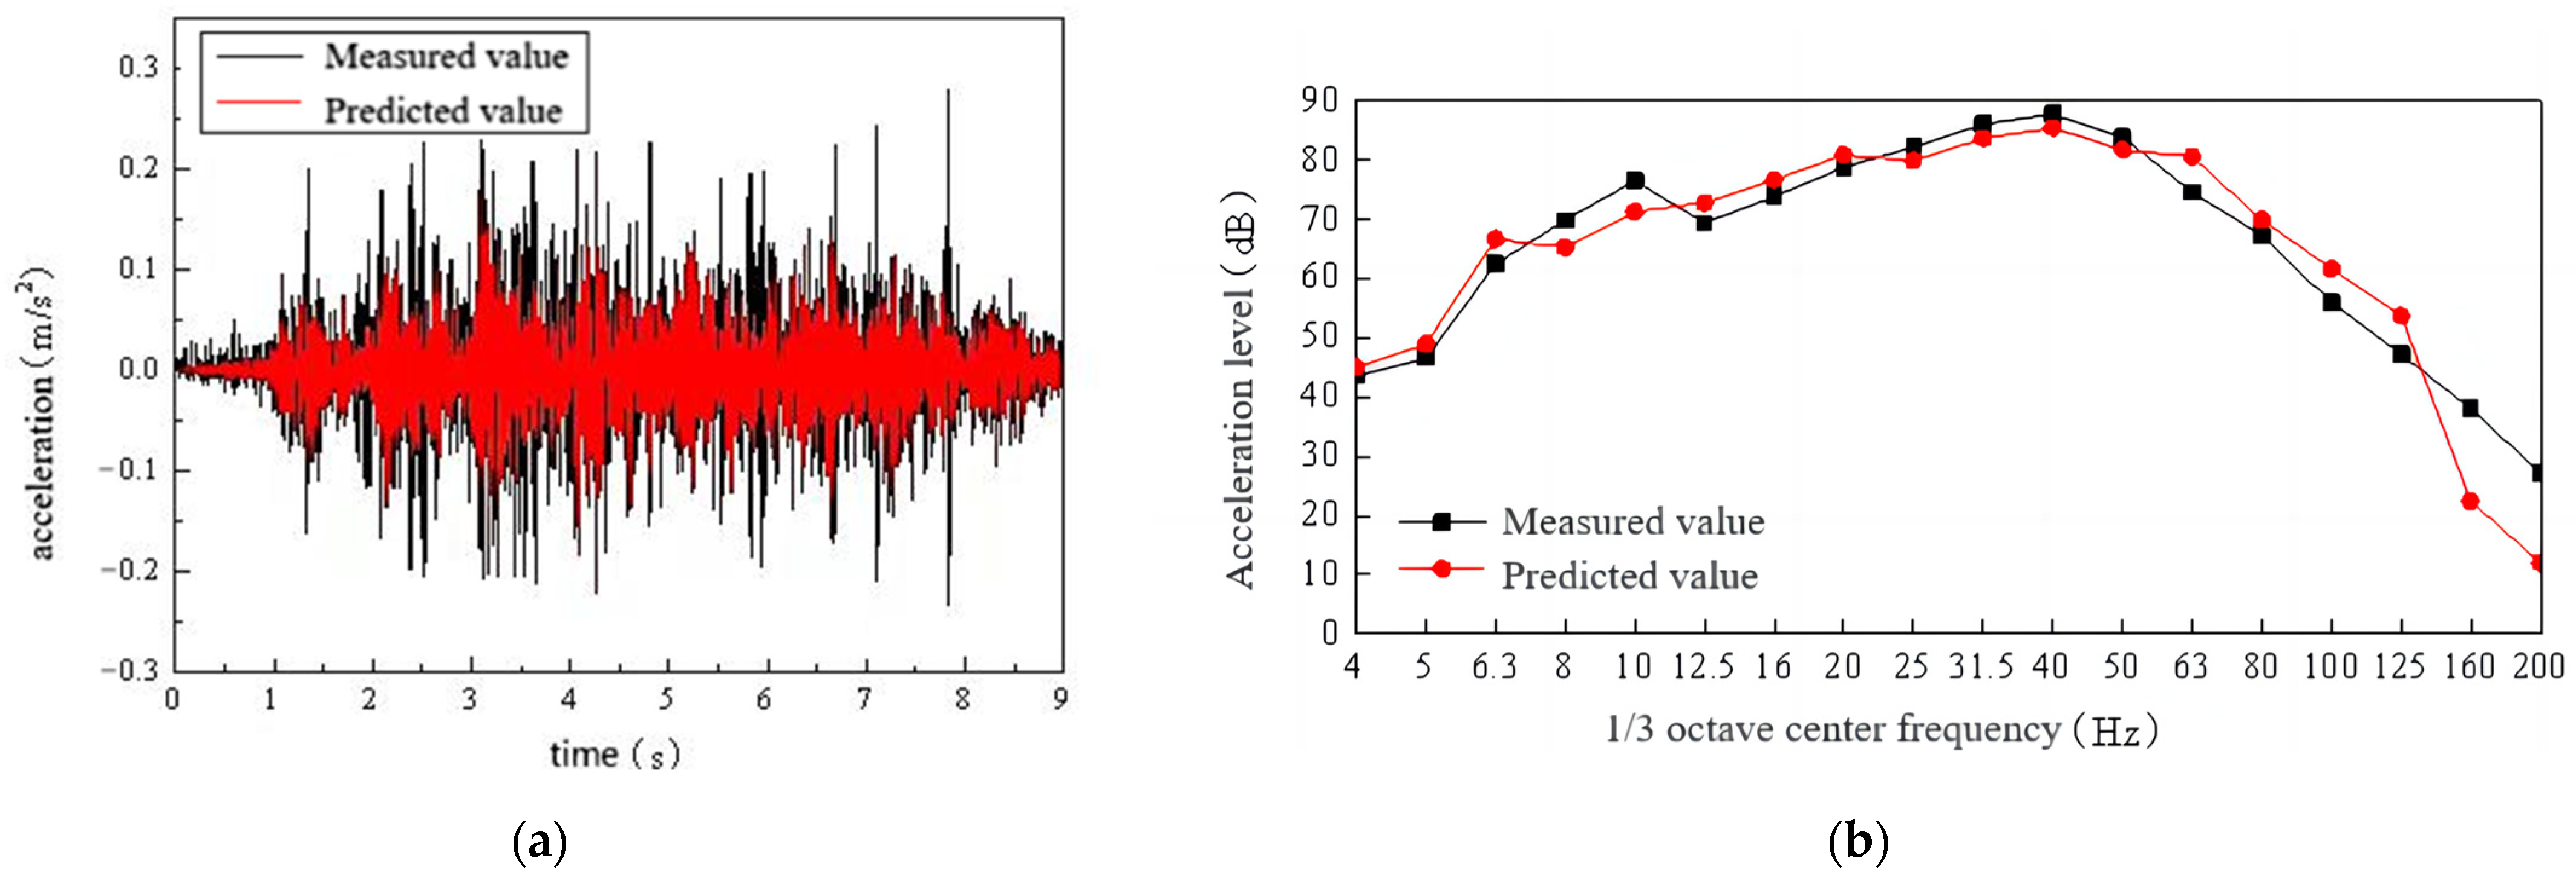
Comparison of measured and calculated acceleration values at 6 m from the track’s centerline for both time-domain and frequency-domain analyses: (a) time-domain plot of acceleration: measured vs. calculated at 6 m from the track’s centerline; (b) frequency-domain analysis of acceleration at 6 m from the track’s centerline: measured vs. predicted.

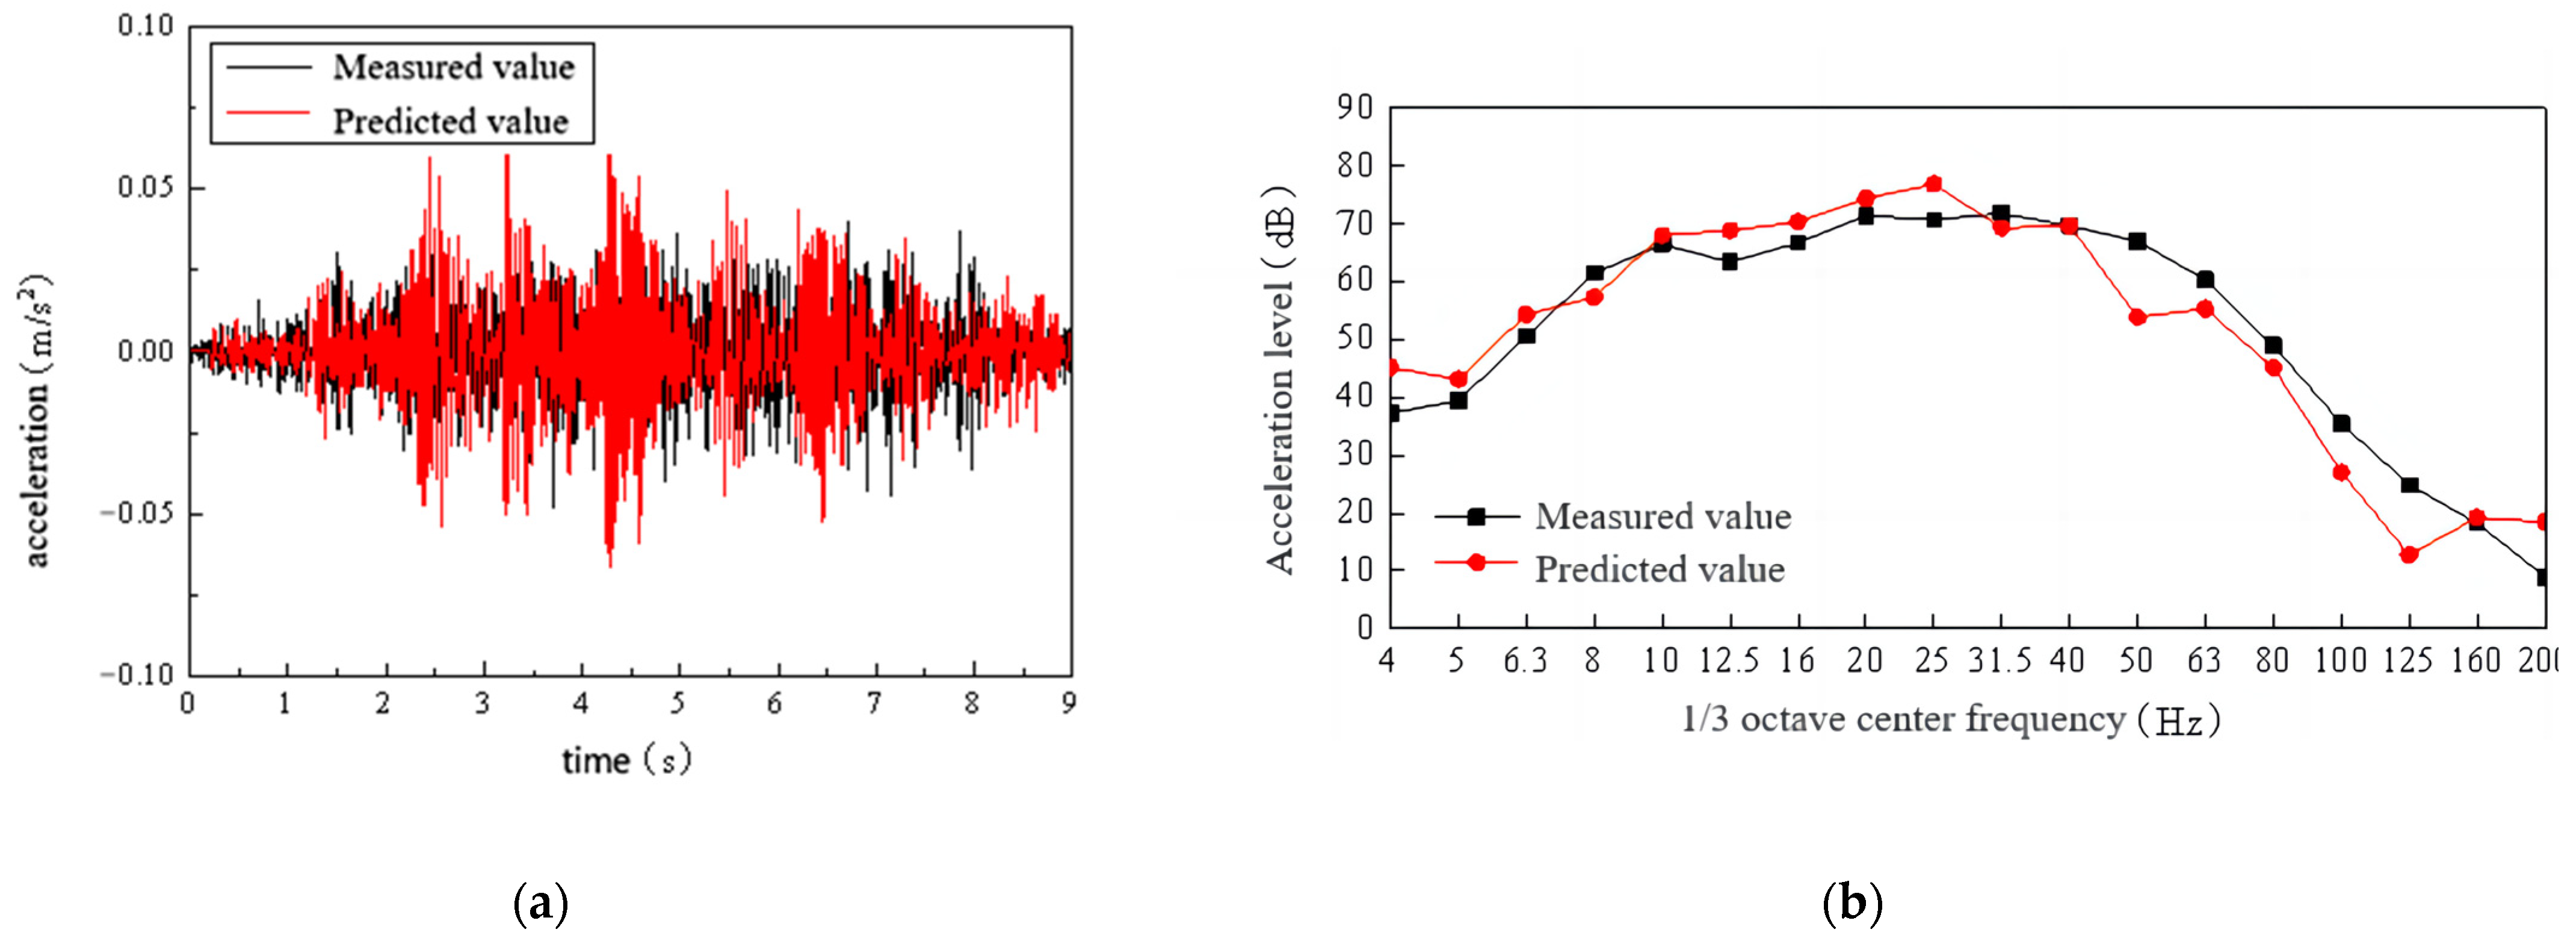
Figure 6.
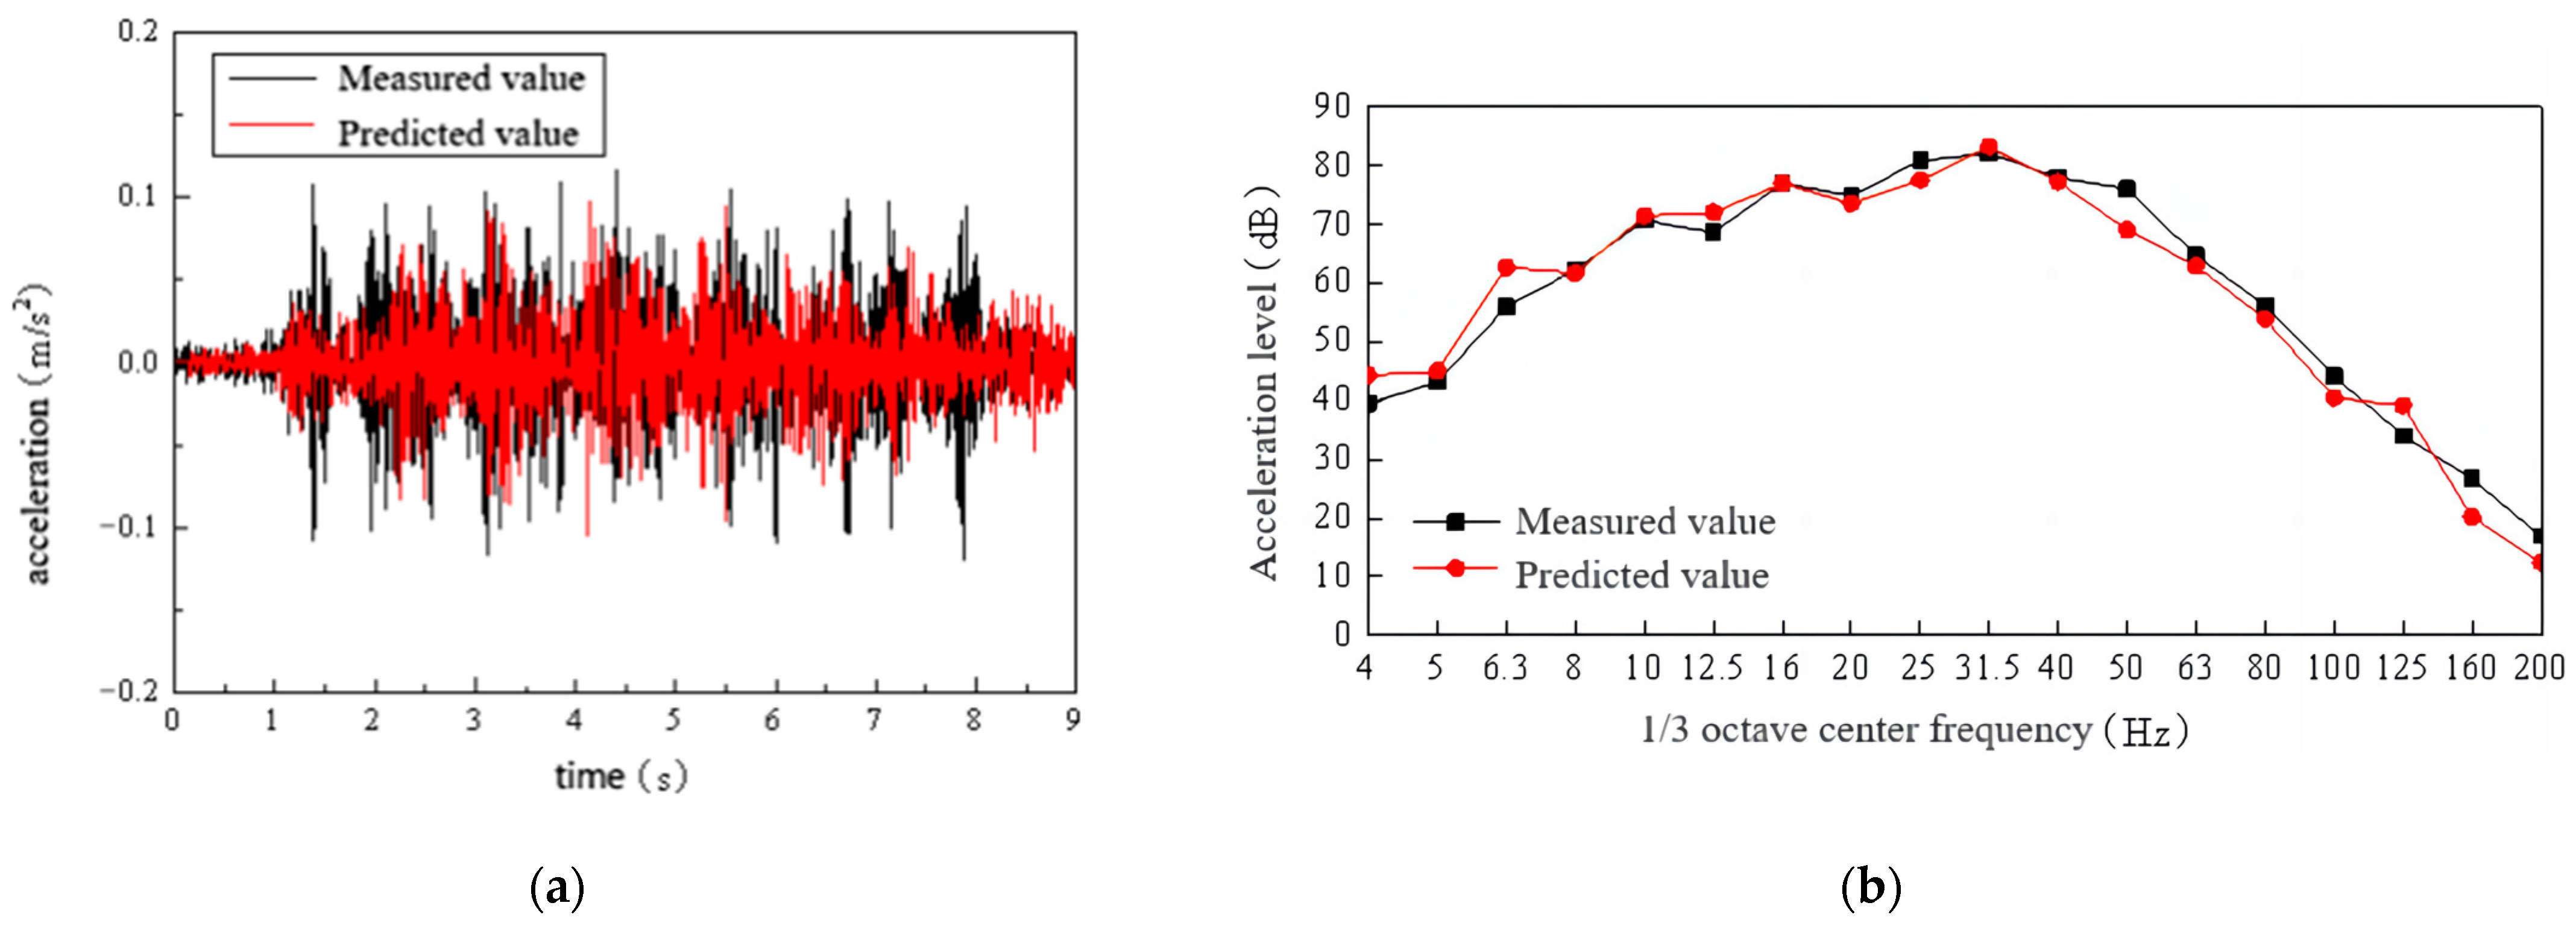
Comparison of measured and calculated acceleration values at 12 m from the track’s centerline for both time-domain and frequency-domain analyses: (a) time-domain plot of acceleration: measured vs. calculated at 12 m from the track’s centerline; (b) frequency-domain analysis of acceleration at 12 m from the track’s centerline: measured vs. predicted.

Figure 7.
Comparison of measured and calculated acceleration values at 18 m from the track’s centerline for both time-domain and frequency-domain analyses: (a) time-domain plot of acceleration: measured vs. calculated at 18 m from the track’s centerline; (b) frequency-domain analysis of acceleration at 18 m from the track’s centerline: measured vs. predicted.
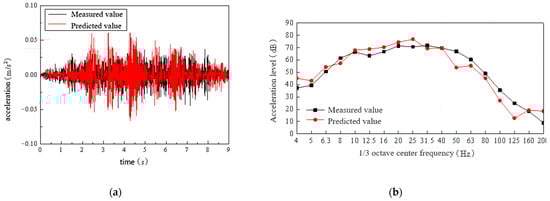
Figure 8.
Comparison of measured and calculated acceleration values at 28 m from the track’s centerline for both time-domain and frequency-domain analyses: (a) time-domain plot of acceleration: measured vs. calculated at 28 m from the track’s centerline; (b) frequency-domain analysis of acceleration at 28 m from the track’s centerline: measured vs. predicted.
Figure 5, Figure 6, Figure 7 and Figure 8 reveal that both the calculated and measured time-domain curves displayed similar waveforms and overarching trends, accurately capturing the train passing phenomenon. Minimal differences between the calculated and measured acceleration amplitudes were observed at distances of 6 m, 12 m, and 18 m from the track’s centerline. However, at a distance of 28 m from the track’s centerline, the calculated acceleration amplitudes were slightly larger than those measured. This discrepancy can be attributed to the cell grid division and simplification of soil layers; however, it does not significantly impact the overall findings. As the distance from the track’s centerline increased, both the calculated and measured acceleration decay amplitudes aligned closely, exhibiting a consistent decay pattern. The model more effectively simulated the vibration attenuation law caused by subway trains in the time domain.
Analysis of the measured results indicated that soil vibration predominantly occurred at frequencies below 50 Hz, with notable vibration peaks around 20 to 30 Hz. The calculated results demonstrated a high degree of similarity to the measured outcomes, particularly regarding the dominant distribution frequency and peak frequency.
Overall, a pronounced similarity was observed between the model-derived and measured acceleration spectra, particularly in terms of overall trend, dominant distribution frequency, and peak frequency. Generally, the acceleration spectra derived from the model closely matched the observed data, particularly in terms of overall patterns, predominant frequency distributions, and peak frequencies. It was concluded that the developed finite element model effectively replicated the propagation characteristics of ground vibrations adjacent to subway train operations. Therefore, this method can be used in practical engineering to establish a finite element model of the superstructure for accurate prediction and analysis of the vibration response caused by train operations without damping measures.
4. Refined Prediction of Structural Vibrations and Secondary Noise in Building Structures
Utilizing the previously validated model, a finite element model of the superstructure across various sensitive areas within the Ping Sheng vehicle section was developed.
The Ping Sheng vehicle section site is located on the southern side of Ping Sheng Avenue, with a length of approximately 1040 m, a width of approximately 570 m, and a total area of about 27.8 hectares. The Ping Sheng vehicle section is designed to accommodate 46 columns, spanning a length of 297.5 m, a width of 180 m, and covering an area of 49,344 square meters. The depot is equipped with three fixed repair lines, a temporary repair station, a static adjustment line, and a sweeping line. Situated at the northernmost end of the vehicle base, the test line features a gentle slope and extends 888 m to facilitate medium-speed testing.
During the analysis, the maximum vibration level from the least favorable position on each floor was used as the basis for comparison with standard vibration limit values. This helped determine the necessity for additional vibration reduction measures and assessed their effectiveness. Figure 9 presents a representative finite element model illustrating the propagation of train-induced vibrations within the building.
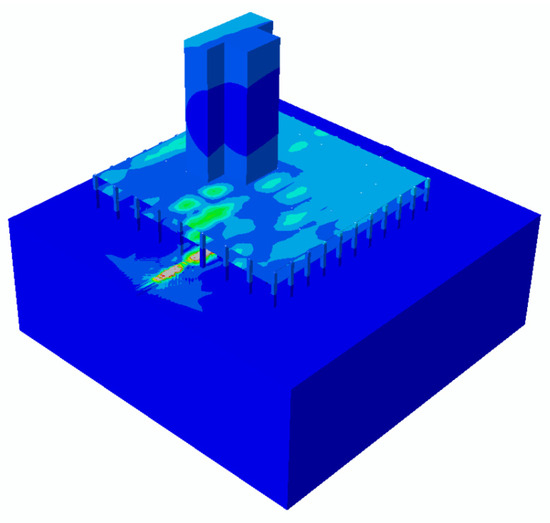
Figure 9.
Finite element visualization of train-induced vibration propagation in a building.
Substantial variations in vibration levels and spectral characteristics, as indicated by significant measured data, arose from the operation of different trains on the same line, with Z-axis vibration level differences reaching approximately 15 dB or more. Notably, environmental vibrations exceeding standard limits were not observed during the initial phase of line operation but emerged after a certain period, leading to occasional resident complaints and petitions. This suggests that train-induced vibrations were not constant, exhibiting significant changes over time with a stochastic distribution pattern. Abnormal wheel–rail abrasion, the durability of vibration reduction and isolation measures, and uneven foundation settlement can stimulate the track’s overall vertical bending resonance modes, leading to excessive vibration amplitude of the roadbed plate and increased environmental vibration levels.
In China’s rail transit environmental vibration impact assessments, the vibration source strength is determined based on the average of the maximum Z-axis vibration levels from analogous tests, in accordance with relevant national standards. However, due to factors such as vehicle type, track structure, and material durability, test results can exhibit dispersion and randomness, displaying distinct distribution characteristics. Furthermore, wheel and rail wear during the rail transportation operation and maintenance phases exhibit significant temporal effects and notable distribution characteristics. Existing research relying on fixed-value predictions often results in insufficient accuracy, overlooking the randomness in vibration source strength due to the operation and maintenance status of rail transit. This limitation affects the accuracy of vibration prediction; thus, finite element calculations incorporate the randomness associated with vibration source strength due to rail transportation’s operation and maintenance.
4.1. Influence Zone of the Pharyngeal Area’s Upper Lid
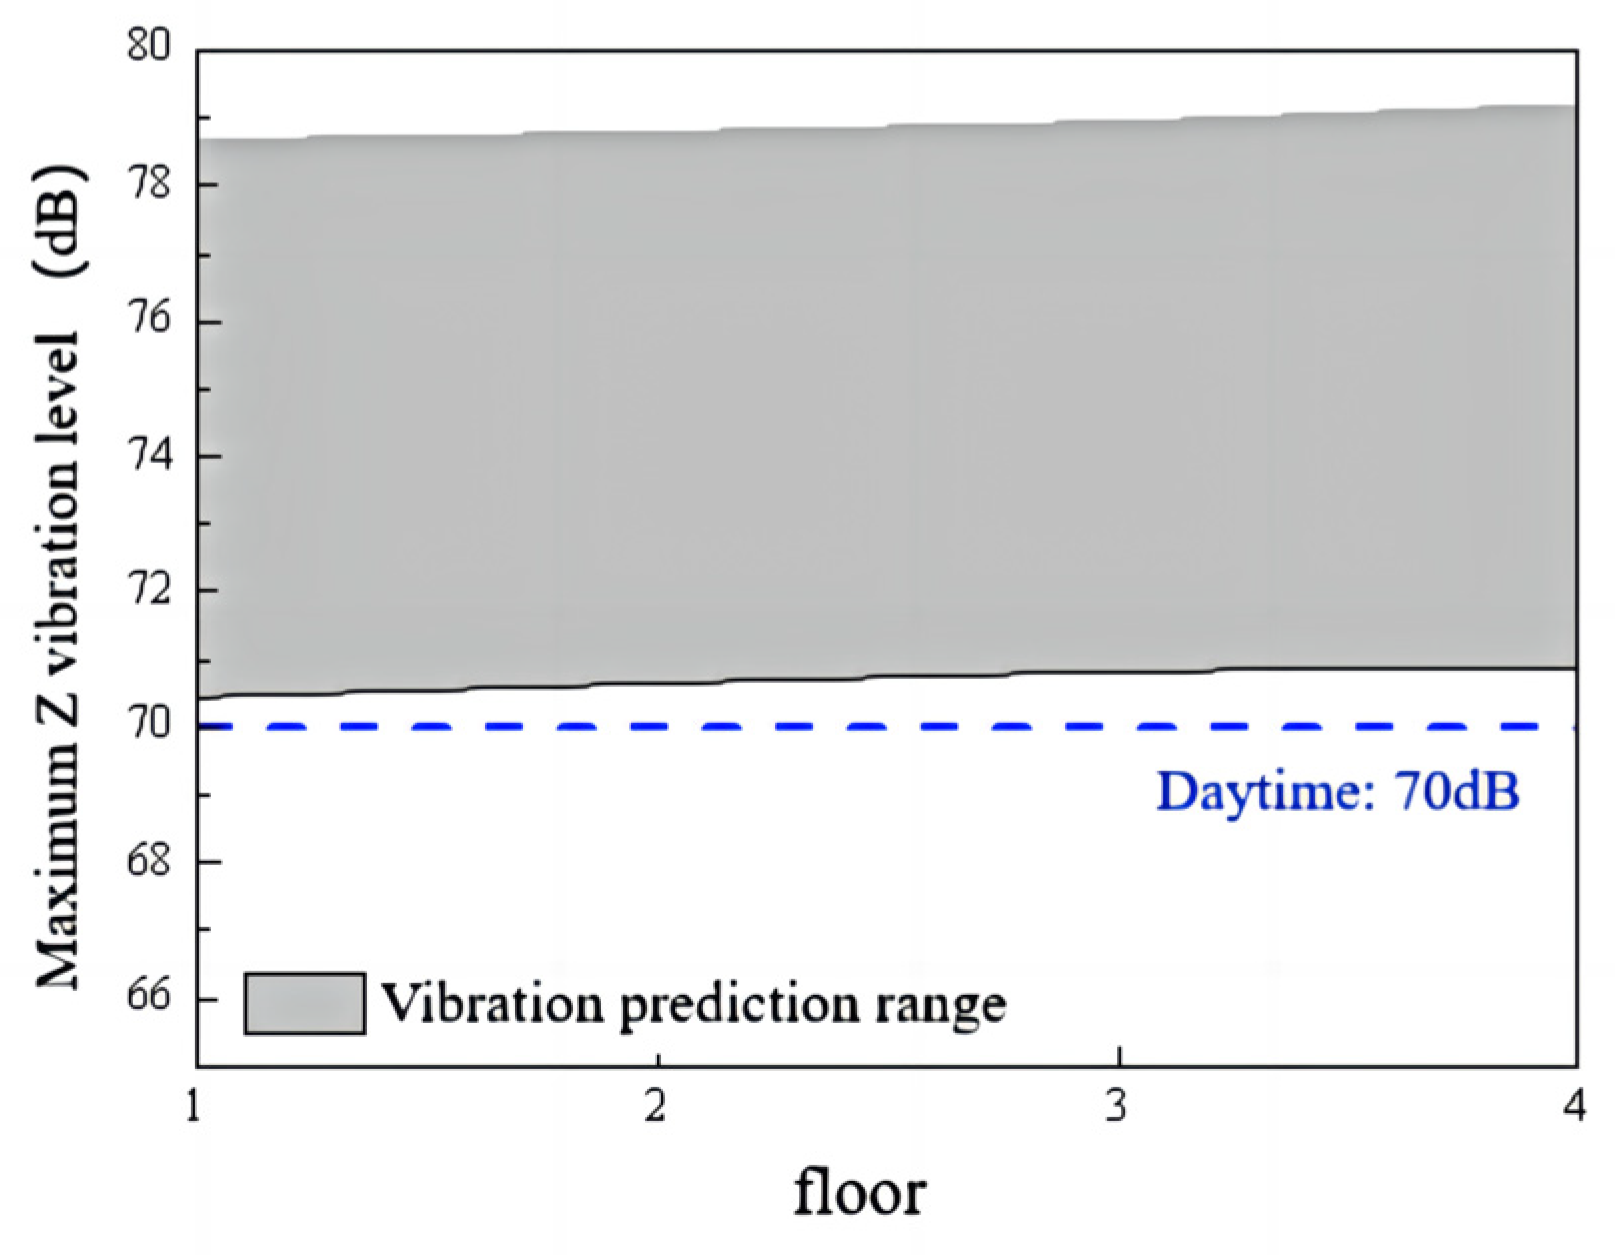
The roof of the throat area accommodates an elementary school, a kindergarten, and a commercial building, with the educational facilities consisting of two-story or three-story structures. Located directly above the throat area, this zone primarily experiences vibrations resulting from trains entering and exiting the parking, inspection, and maintenance depots. Given the numerous curves, turnouts, and track irregularities in the throat section, a train speed limit of 25 km/h has been implemented to mitigate their impact. To assess potential vibration effects, the kindergarten building, situated in the most vulnerable zone of this area, was chosen for prediction and analysis.
Figure 10 illustrates the predicted vibration levels resulting from train operations, highlighting variations across different building floors. Additionally, an incremental increase in vibration levels was observed as one ascends through the floors, though at a decelerating rate. The figure shows that each floor of the building exhibits vibration levels ranging from 70 to 79 dB, surpassing the standard daytime limit of 70 dB for vibrations.
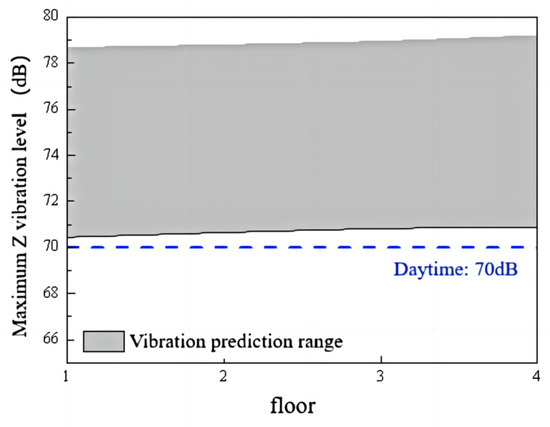
Figure 10.
Floor-level vibration variation due to train operations in the throat area.
4.2. Impact Radius of the Test Line
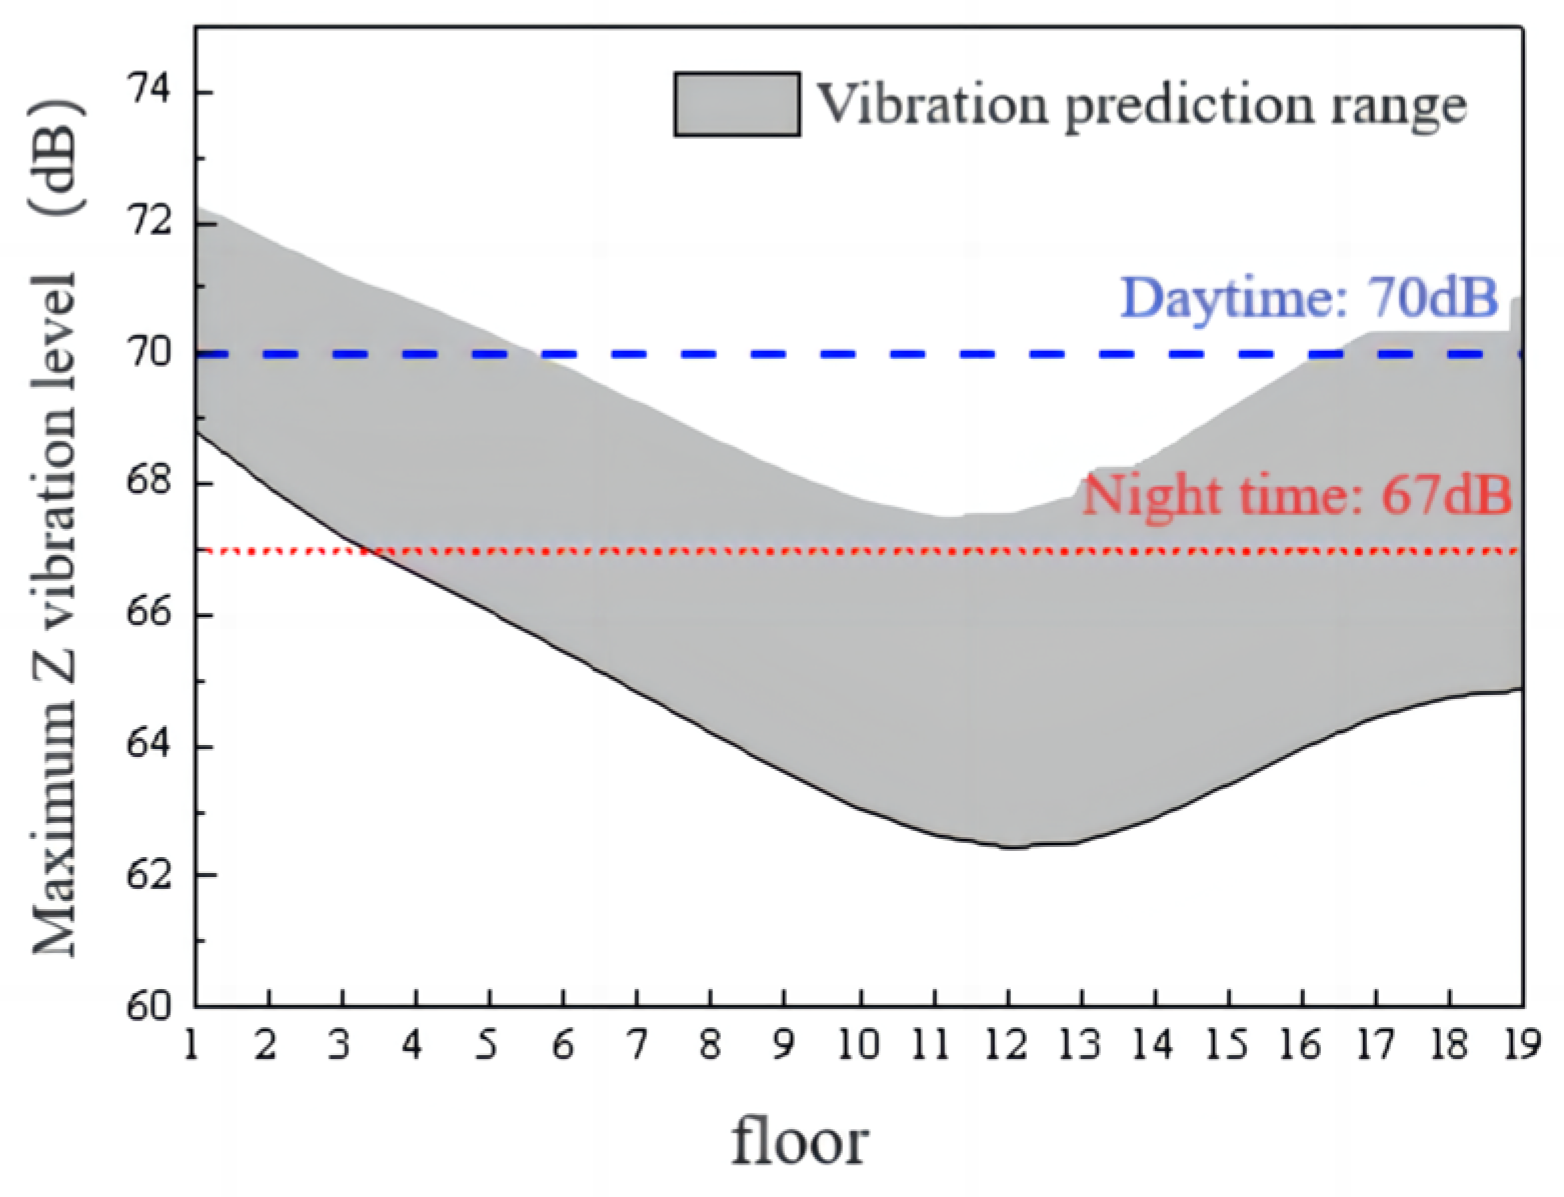
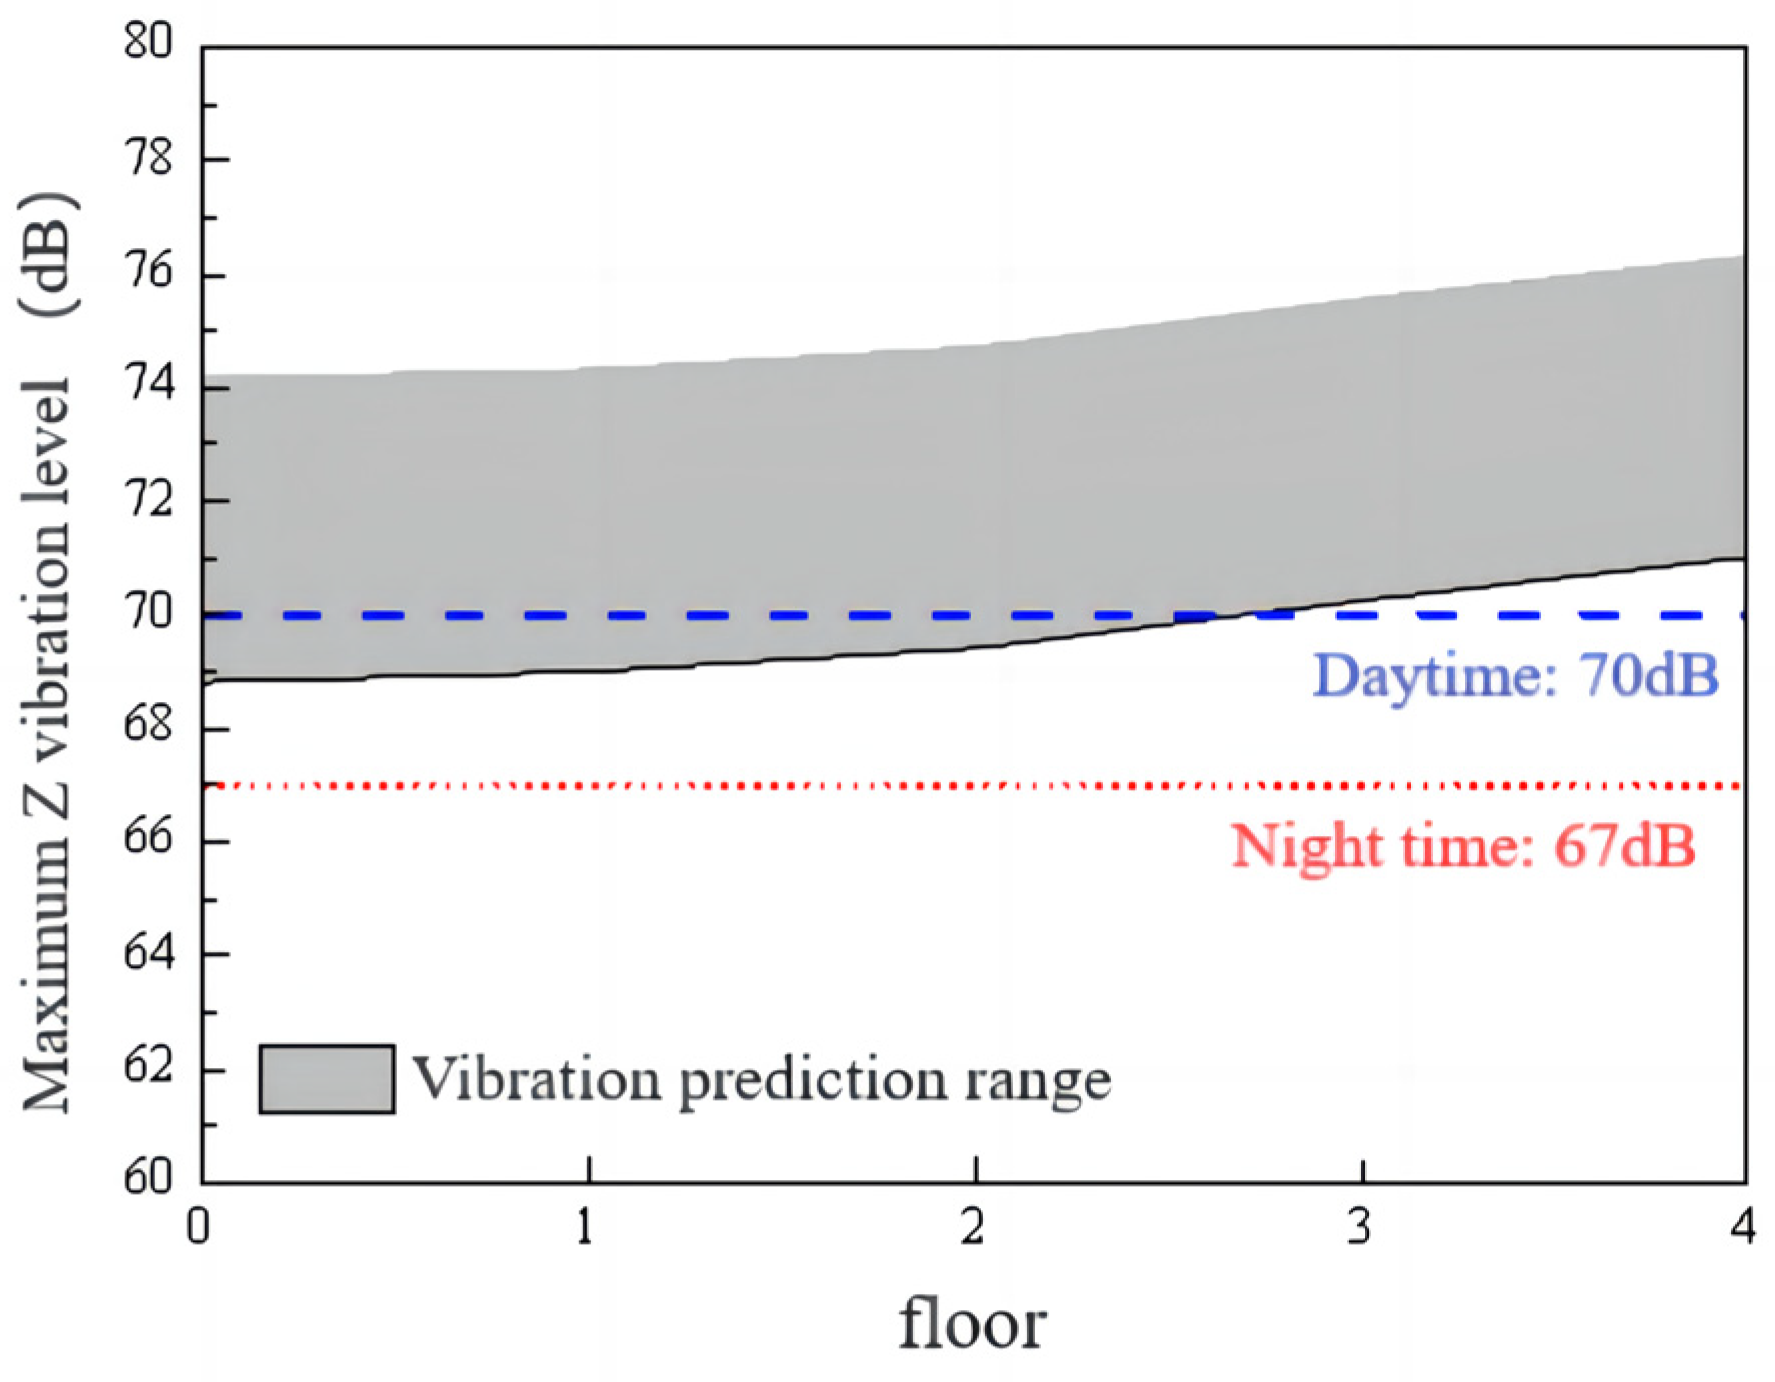
The designated influence area of the test line, accommodating speeds up to 60 km/h, includes five 17F/-2F buildings, an elementary school, a kindergarten, a commercial building, and a gymnasium. Characterized by high population density and diverse buildings, residential structures are positioned at least 30 m from the test line, whereas the school building is located over 25 m away. Consequently, for prediction and analysis, a 17-story residential building and a three-story school building closest to the test line were selected. Figure 11 illustrates the predicted vibrations across different floors of high-rise residential buildings due to train operations.
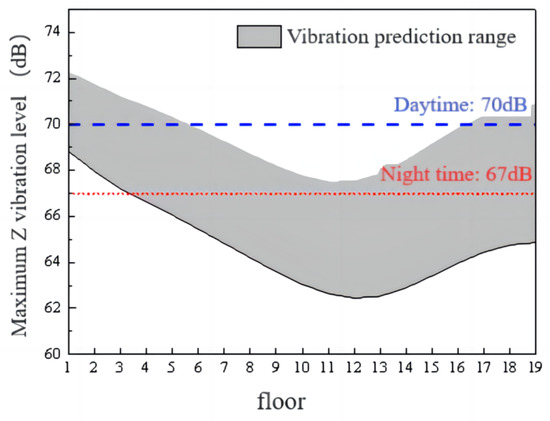
Figure 11.
Vibration variation across floors in high-rise buildings due to train operations on the test line.
The figure revealed that vibration levels on each floor ranged from 67.5 to 72.8 dB, exceeding the standard nighttime limit of 67 dB. Notably, floors below the coverage of 15 m were designated for nonresidential purposes, ensuring that the residential areas of the building had a maximum Z-axis vibration level of 71.7 dB.
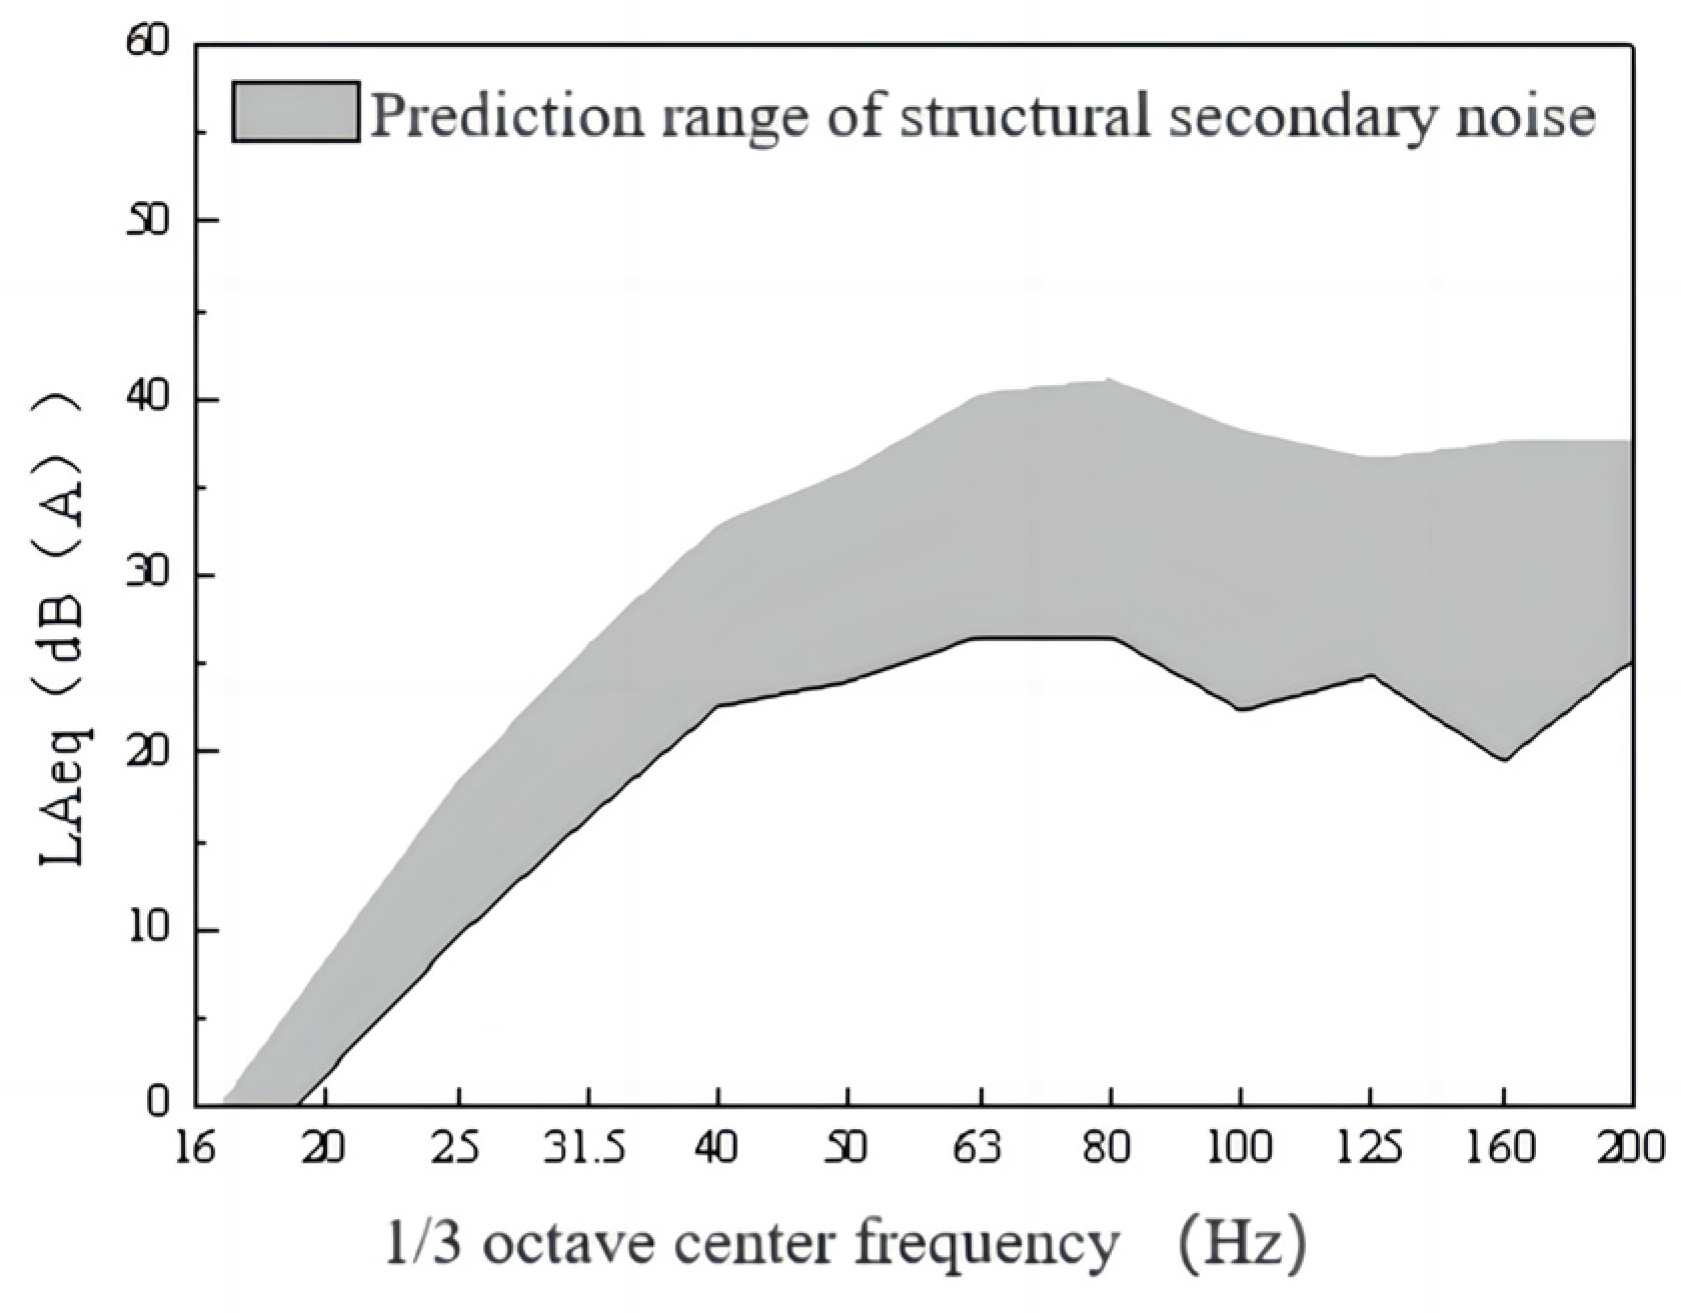
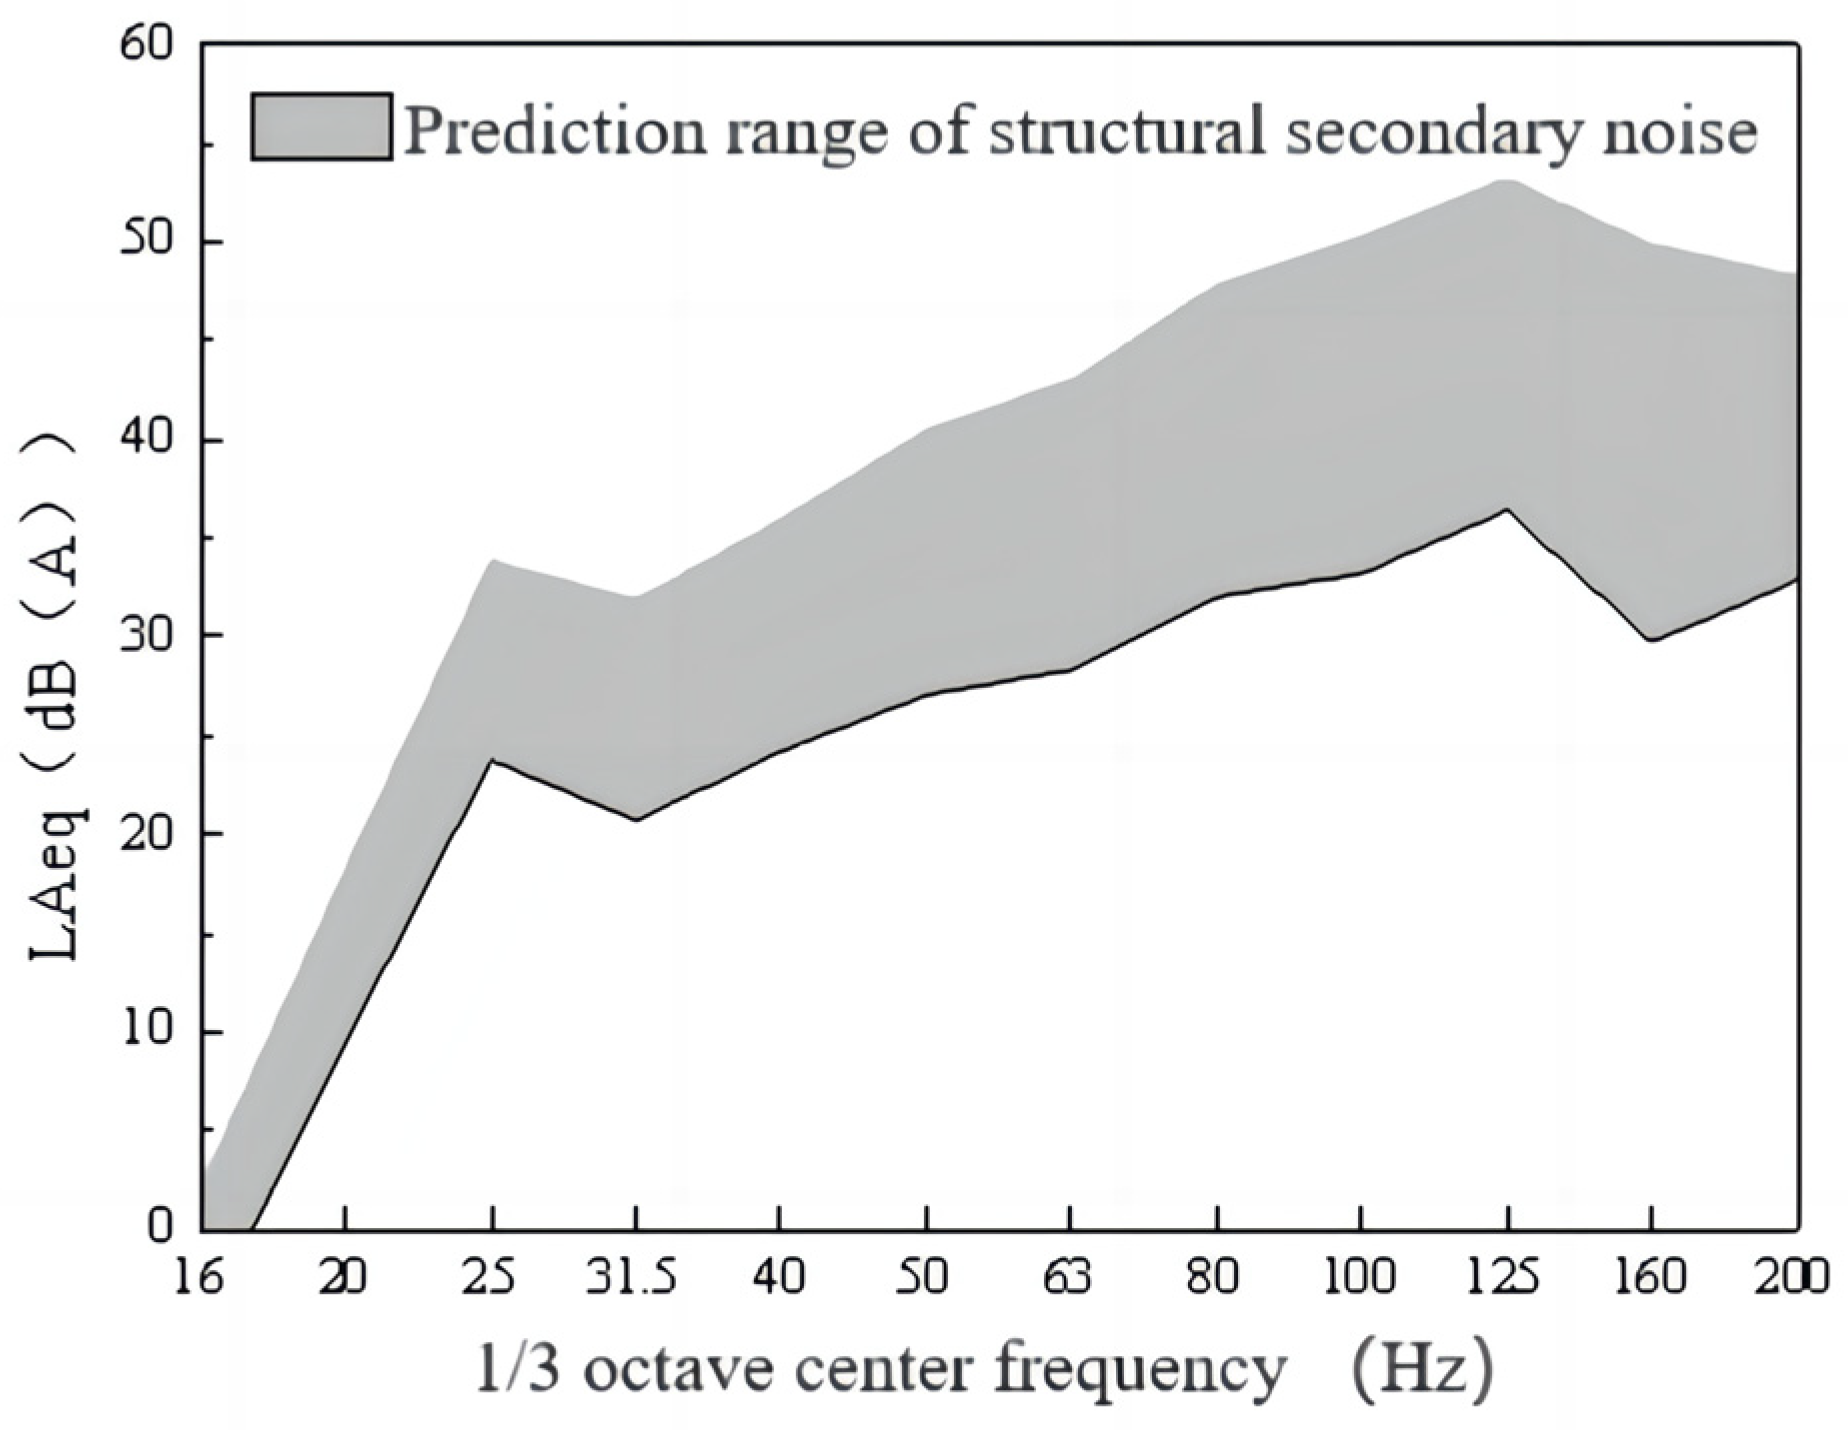
Figure 12 depicts the predicted range of structural secondary noise due to train operations on the test line. The calculated equivalent sound level revealed that structural secondary noise from train operations ranged from 26.5 to 41.0 dB(A), with the maximum sound level exceeding the standard nighttime limit by 6 dB(A).
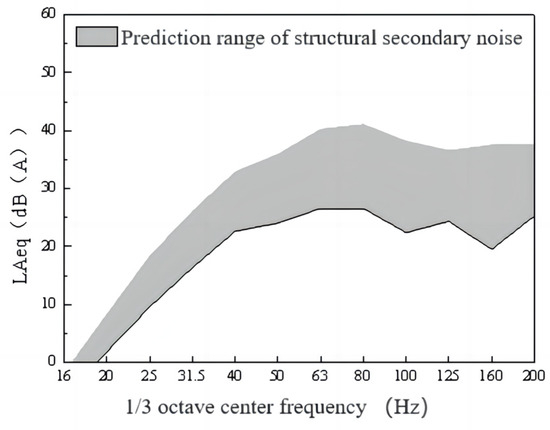
Figure 12.
Predicted secondary noise levels in high-rise residential buildings from train operations on the test line.
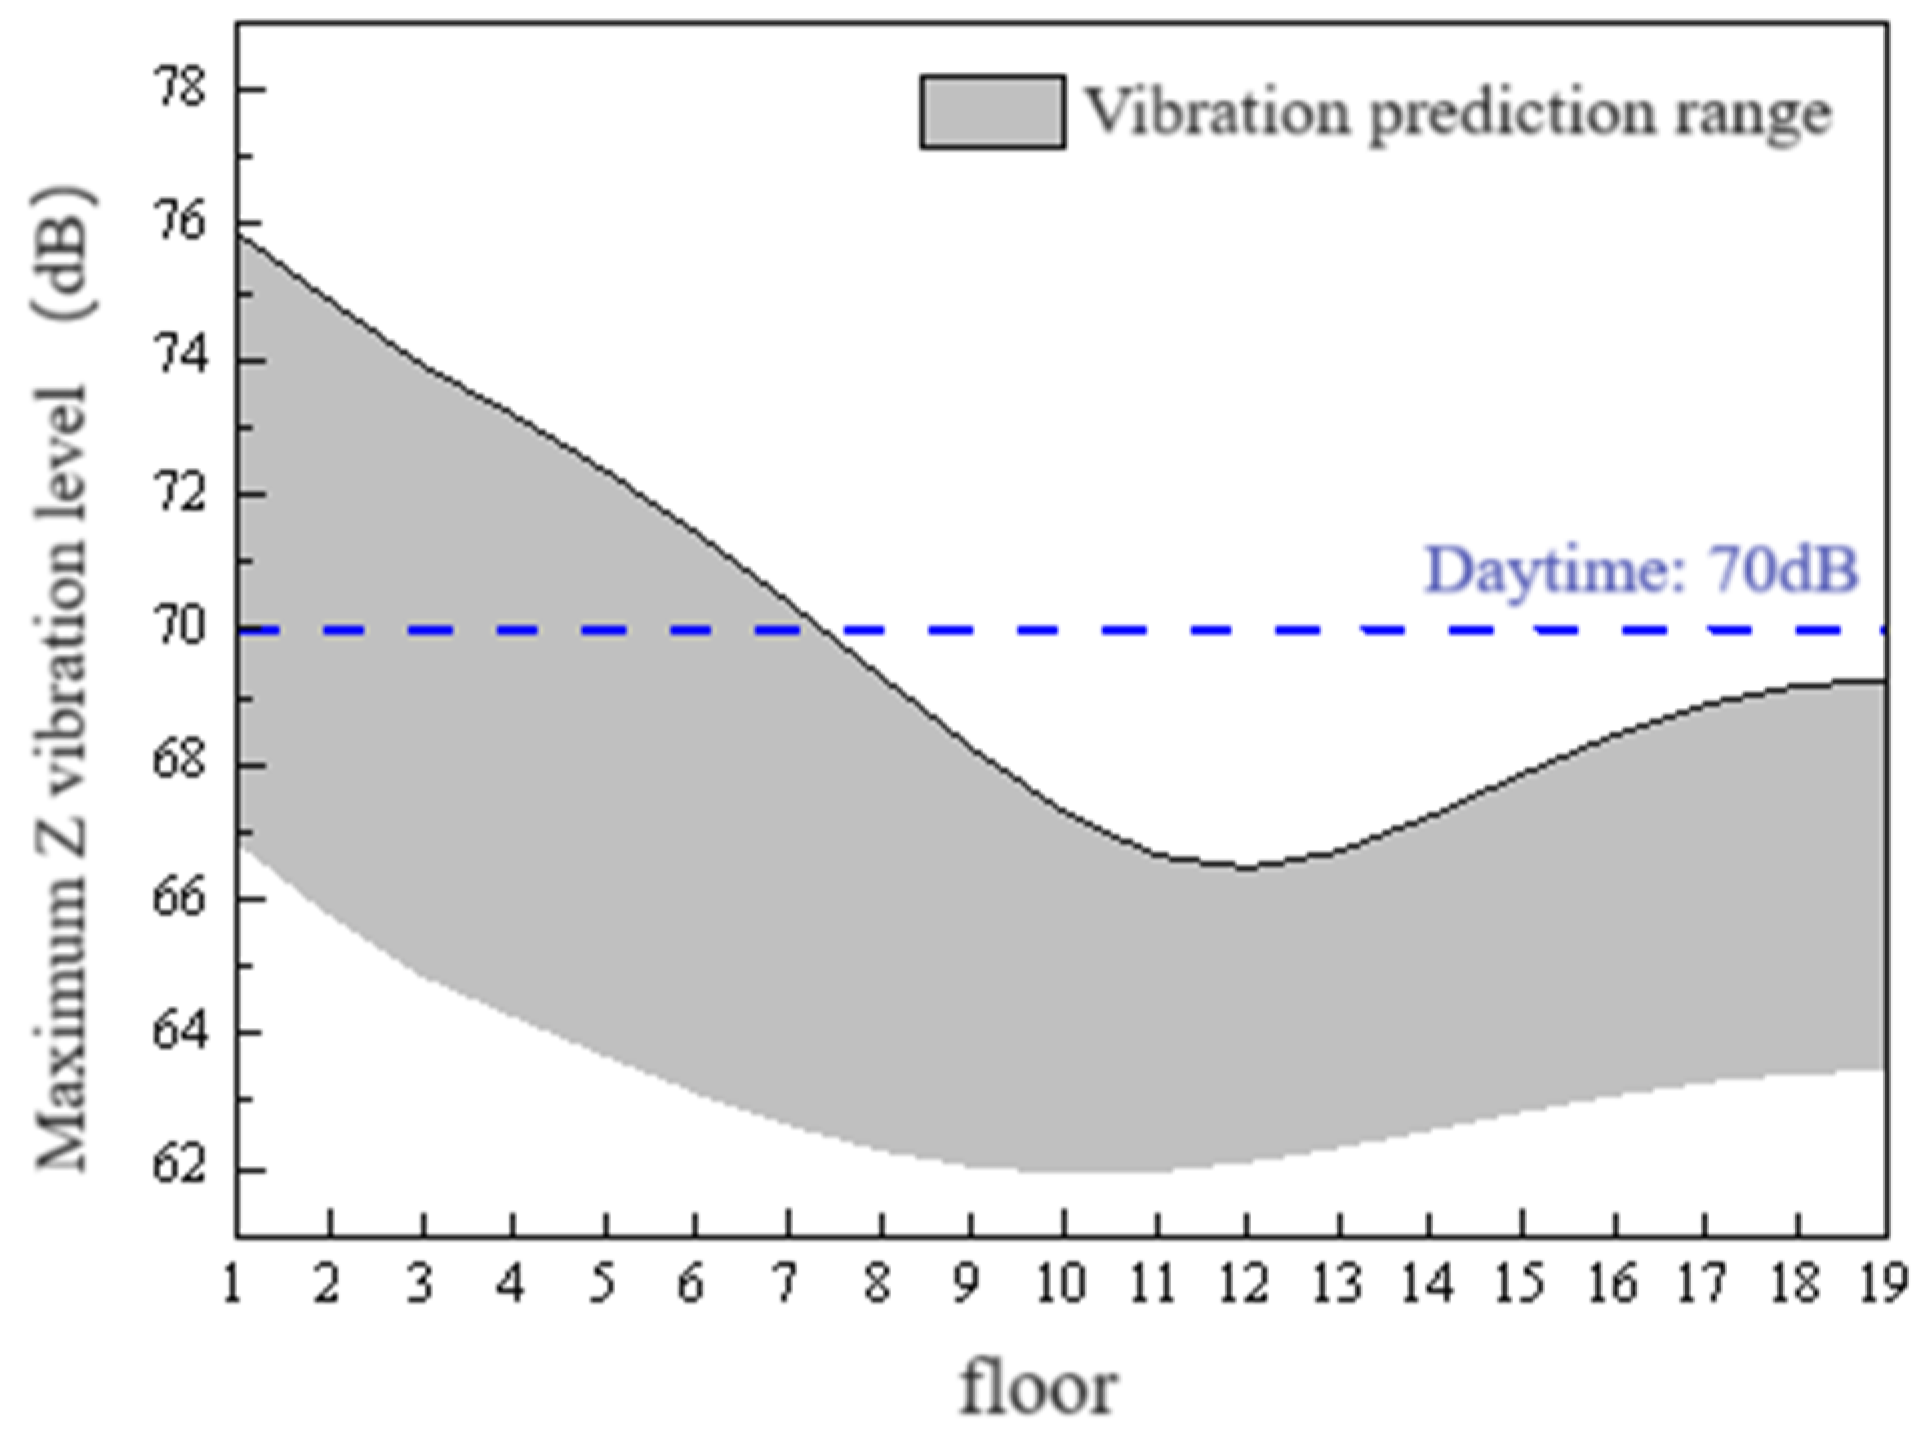
Figure 13 depicts anticipated variations in building vibrations induced by train operations across different levels of the school building.
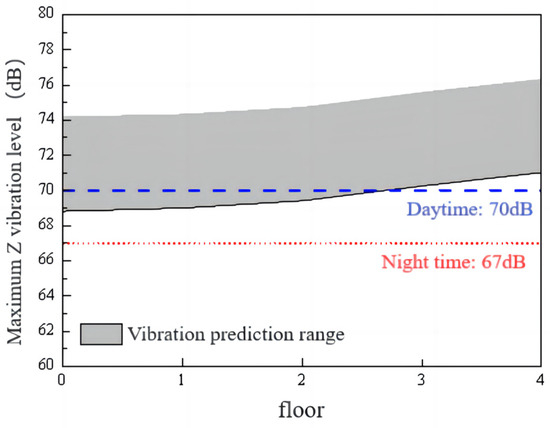
Figure 13.
Predicted secondary noise levels in building vibrations induced by train operations across different levels of the school building.
This figure shows that vibration levels on each floor ranged from 68.8 to 76.6 dB, exceeding the standard daytime vibration limit by 6.6 dB.
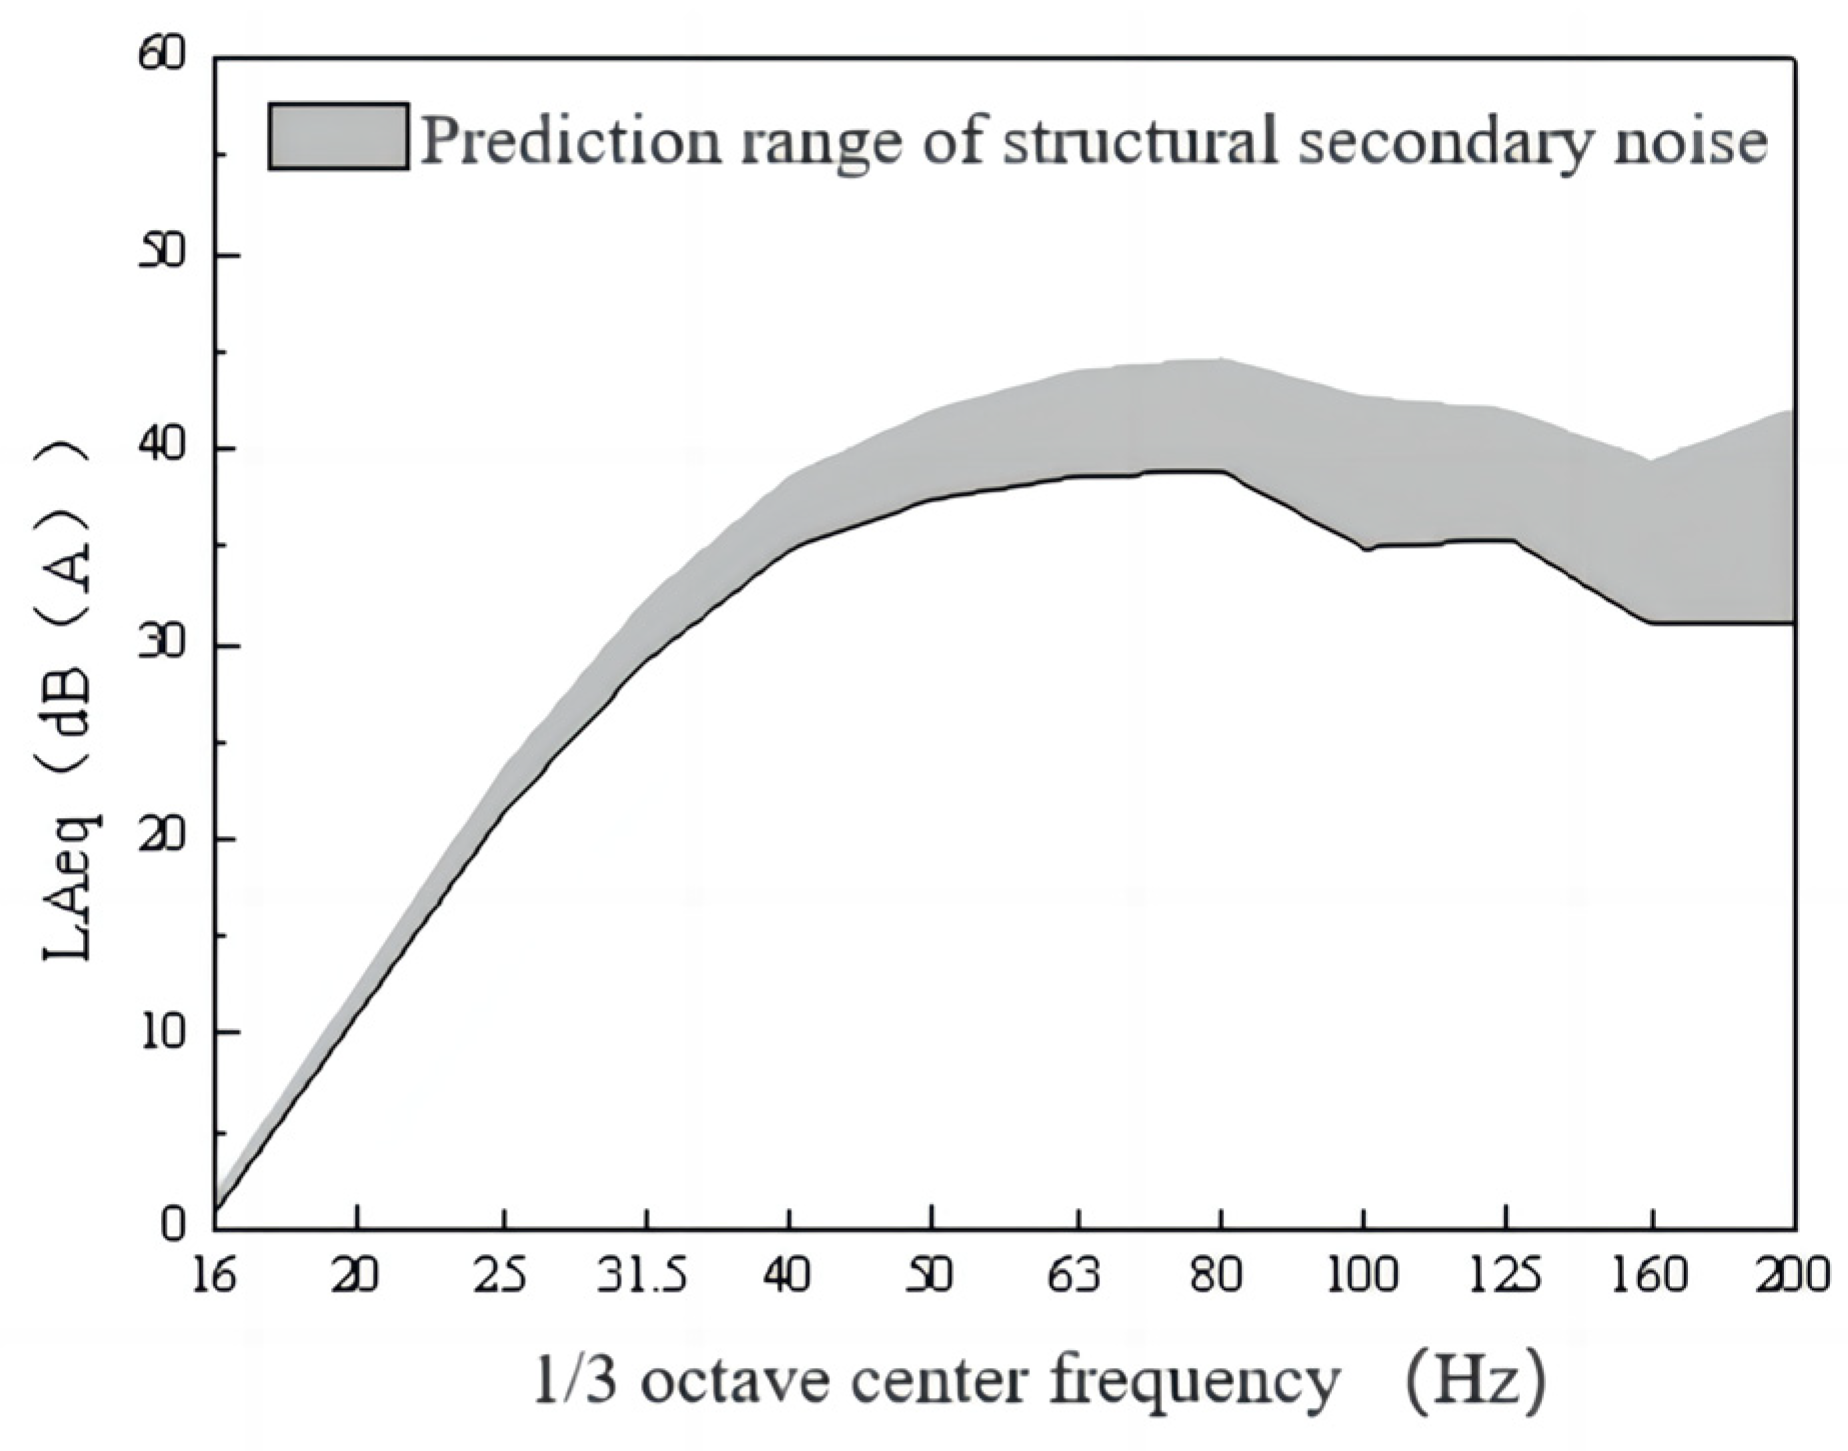
Figure 14 illustrates the predicted range of structural secondary noise due to train operations on the test line. Calculations of the equivalent sound level revealed that structural secondary noise from train operations ranged from 38.8 to 45.1 dB(A), with the maximum sound level exceeding the specified daytime limit by 7.1 dB(A).
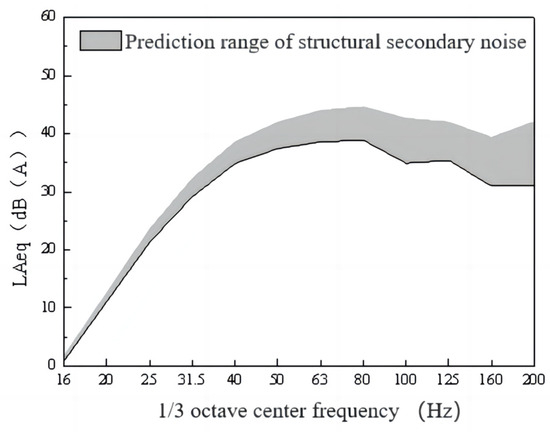
Figure 14.
Predicted secondary noise range in high-rise residential buildings due to train operations on the test line.
4.3. Impact Assessment of Maintenance and Material Depots, and Loading/Unloading Lines
The area under consideration encompasses the maintenance warehouse, material warehouse, and material loading/unloading line. It includes 12 buildings on the 17th and 2nd floors above the maintenance warehouse, as well as four buildings on the 17th and 2nd floors above the material warehouse and the material loading/unloading line. These structures are primarily subjected to vibrations resulting from crane operations. Based on preliminary predictions outlined, it has been determined that the crane’s vibration impact was more pronounced in the maintenance warehouse compared to the material warehouse and the material loading/unloading line. Consequently, one of the nineteen-story buildings directly situated above the crane (located on its southern side) was selected for finite element calculation and analysis. The results of vibration predictions are presented in Figure 15.

Figure 15.
Floor-level vibration variation due to crane operations in the inspection warehouse.
Figure 15 illustrates the structural vibration response of the 17F/-2F building located directly above the service garage on the southern side during crane operations. Vibration levels across each floor ranged from 62 to 76 dB, exceeding the standard daytime limit of 70 dB for vibrations. Given that the upper deck level is not used for residential purposes, a maximum predicted vibration level of 75.8 dB was observed in the residential areas.
Figure 16 depicts the predicted range of structural secondary noise due to crane operations in the service garage. Calculations of the equivalent sound level revealed that structural secondary noise from crane operations ranged from 37.5 to 45.4 dB(A), with the maximum sound level exceeding the daytime limit by 7.4 dB(A).
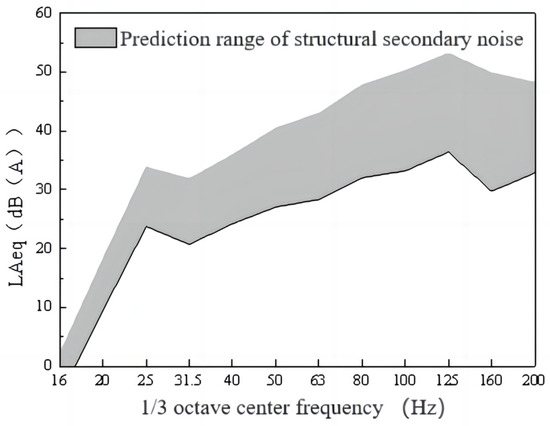
Figure 16.
Predicted secondary noise range from crane operations in the inspection depot.
The method has been validated in studies by He J [35] and Li X [40]. After applying the prediction model to a detailed analysis of vehicle-induced vibration in the vibration-sensitive area of the Ping Sheng vehicle section, a comparison was made between the preliminary and refined prediction results. Table 4 summarizes the comparison, highlighting the differences between preliminary predictions and refined finite element predictions for vehicle-induced vibration across various development zones within the Ping Sheng vehicle section. A high level of agreement between the two sets of results is evident, further validating the accuracy and reliability of the proposed model prediction method.
Table 4.
Comparative analysis of preliminary and refined finite element predictions for the Pingsheng vehicle section.
5. Conclusions
In this paper, based on the impedance analytical model and the finite element model, a numerical simulation method was proposed for simulating and predicting the vibration and structural secondary noise response of subway trains affecting multi-story buildings at different locations on the ground and within the superstructure. The accuracy of the method was verified via real measurement data. The following conclusions can be drawn from this study:
- (1)
- The study revealed that vibrations generated by subway operations do not follow a simple vertical pattern correlated with floor height, rather, vibrations at lower floors remain relatively unchanged, then gradually attenuate before increasing near the top floors.
- (2)
- Within the superstructure, the impact of vibration on floor slabs exceeds that of columns, leading to a more pronounced vibration sensation for individuals standing at the center of the floor slab.
- (3)
- Vibrations affecting neighboring buildings along the line were predominantly vertical. As the distance from the track increased, vibration attenuation occurred, with high-frequency vibrations diminishing more rapidly than low-frequency vibrations, which remained relatively constant. The impact of vibration also decreased with reduced train speed. Within 40 m of the source, high-frequency vertical vibrations decayed more rapidly than horizontal vibrations, and high-frequency components above 40 Hz diminished even more swiftly.
- (4)
- The comprehensive management of vibration and noise in the vehicle section should target both the sources and causes of vibration and noise and involve studying corresponding management programs. Measures should primarily address four aspects: rails, fasteners, sleepers, and roadbed. Structural damping design should also be implemented to achieve comprehensive management. The adverse effects of vibration can be controlled by reducing the excitation intensity of the vibration source, attenuating vibrations along the propagation path, and isolating vibrations in the foundation and interior of the building.
Author Contributions
Conceptualization: Y.L., H.X. and S.Z.; methodology and formal analysis: Y.L., H.X. and S.Z.; software, resources, and data curation: W.X. and W.C.; validation: Y.L., H.X., S.Z., W.X. and W.C.; investigation and visualization: Y.L., H.X., S.Z., W.X. and W.C.; writing—original draft preparation and writing—review and editing: Y.L., H.X. and W.X. All authors have read and agreed to the published version of the manuscript.
Funding
This research was funded by the National Natural Science Foundation of China (Project No. 52008115), the (Chinese) State Key Laboratory of Subtropical Building Science (Project: No. 2021ZB08).
Data Availability Statement
The data used to support the findings of this study are currently under embargo while the research findings are commercialized. Requests for data, [12 months] after publication of this article, will be considered by the corresponding author.
Conflicts of Interest
Author Yang Liu was employed by the company Guangzhou Metro Design & Research Institute Co., Ltd. Authors Wei Xia and Wenfeng Cai were employed by the company China Railway Guangzhou Bureau Group Co., Ltd. The remaining authors declare that the research was conducted in the absence of any commercial or financial relationships that could be construed as a potential conflict of interest.
References
- Ma, M.; Liu, W.; Qian, C.; Deng, G.; Li, Y. Study of the train-induced vibration impact on a historic Bell Tower above two spatially overlapping metro lines. Soil Dyn. Earthq. Eng. 2016, 81, 58–74. [Google Scholar] [CrossRef]
- Handy, S. Smart growth and the transportation-land use connection: What does the research tell us? Int. Reg. Sci. Rev. 2005, 28, 146–167. [Google Scholar] [CrossRef]
- Sheng, X.; Jones, C.J.C.; Thompson, D.J. A theoretical study on the influence of the track on train-induced ground vibration. J. Sound Vib. 2004, 272, 909–936. [Google Scholar] [CrossRef]
- Connolly, D.P.; Kouroussis, G.; Giannopoulos, A.; Verlinden, O.; Woodward, P.K.; Forde, M.C. Assessment of railway vibrations using an efficient scoping model. Soil Dyn. Earthq. Eng. 2014, 58, 37–47. [Google Scholar] [CrossRef]
- Lund, A.; Dahlberg, T. Dynamic train/track interaction including model for track settlement evolvement. Veh. Syst. Dynamics 2004, 66, 667–676. [Google Scholar]
- Zou, C.; Moore, J.A.; Sanayei, M.; Tao, Z.; Wang, Y. Impedance Model of Train-Induced Vibration Transmission Across a Transfer Structure into an Overtrack Building in a Metro Depot. J. Struct. Eng. 2022, 148, 1–46. [Google Scholar] [CrossRef]
- Lei, X.; Jiang, C. Analysis of vibration reduction effect of steel spring floating slab track with finite elements. J. Vib. Control 2014, 22, 1462–1471. [Google Scholar] [CrossRef]
- Federico Rossi, A.N. A simple model to predict train-induced vibration: Theoretical formulation and experimental validation. Environ. Impact Assess. Rev. 2003, 23, 305–322. [Google Scholar] [CrossRef]
- Sanayei, M.; Anish, P.K.; Moore, J.A.; Brett, C.R. Measurement and prediction of train-induced vibrations in a full-scale building. Eng. Struct. 2014, 77, 119–128. [Google Scholar] [CrossRef]
- Liu, Q.; Li, X.; Zhang, X.; Zhou, Y.; Chen, Y.F. Applying constrained layer damping to reduce vibration and noise from a steel-concrete composite bridge: An experimental and numerical investigation. J. Sandw. Struct. Mater. 2018, 22, 1743–1769. [Google Scholar] [CrossRef]
- Liu, Q.; Thompson, D.J.; Xu, P.; Feng, Q.; Li, X. Investigation of train-induced vibration and noise from a steel-concrete composite railway bridge using a hybrid finite element-statistical energy analysis method. J. Sound Vib. 2020, 471, 115197. [Google Scholar] [CrossRef]
- Liang, R.; Liu, W.; Ma, M.; Liu, W. An efficient model for predicting the train-induced ground-borne vibration and un-certainty quantification based on bayesian neural network. J. Sound Vib. 2021, 495, 115908. [Google Scholar] [CrossRef]
- Connolly, D.; Giannopoulos, A.; Forde, M.C. Numerical modelling of ground borne vibrations from high speed rail lines on embankments. Soil Dyn. Earthq. Eng. 2013, 46, 13–19. [Google Scholar] [CrossRef]
- Zhai, W.; Wang, K. Lateral hunting stability of railway vehicles running on elastic track structures. J. Comput. Nonlinear Dynamics 2010, 5, 041009-1–041009-9. [Google Scholar] [CrossRef]
- Torstensson, P.T.; Nielsen, J.C.O. Simulation of dynamic vehicle–track interaction on small radius curves. Veh. Syst. Dyn. 2011, 49, 1711–1732. [Google Scholar] [CrossRef]
- Kouroussis, G.; Gazetas, G.; Anastasopoulos, I.; Conti, C.; Verlinden, O. Discrete modelling of vertical track–soil coupling for vehicle–track dynamics. Soil Dyn. Earthq. Eng. 2011, 31, 1711–1723. [Google Scholar] [CrossRef]
- Qiu, Y.; Zou, C.; Hu, J.; Chen, J. Prediction and mitigation of building vibrations caused by train operations on concrete floors. Appl. Acoust. 2024, 219, 109941. [Google Scholar] [CrossRef]
- Kouroussis, G.; Verlinden, O.; Conti, C. A two-step time simulation of ground vibrations induced by the railway traffic. Proc. Inst. Mech. Eng. Part C J. Mech. Eng. Sci. 2011, 226, 454–472. [Google Scholar] [CrossRef]
- Pyl, L.; Degrande, G.; Lombaert, G.; Haegeman, W. Validation of a source-receiver model for road traffic-induced vibra-tions in buildings. I: Source model. J. Eng. Mech. 2004, 130, 1377–1393. [Google Scholar] [CrossRef]
- Galvín, P.; Mendoza, D.L.; Connolly, D.P.; Degrande, G.; Lombaert, G.; Romero, A. Scoping assessment of free_field vibrations due to railway traffic. Soil Dyn. Earthq. Eng. 2018, 114, 598–614. [Google Scholar] [CrossRef]
- He, L.; Tao, Z. Building vibration measurement and prediction during train operations. Buildings 2024, 14, 142. [Google Scholar] [CrossRef]
- Zou, C.; Wang, Y.; Zhang, X.; Tao, Z. Vibration isolation of over-track buildings in a metro depot by using trackside wave barriers. J. Build. Eng. 2020, 30, 101270. [Google Scholar] [CrossRef]
- Zou, C.; Wang, Y.; Moore, J.A.; Sanayei, M. Train-induced field vibration measurements of ground and over-track buildings. Sci. Total. Environ. 2017, 575, 1339–1351. [Google Scholar] [CrossRef] [PubMed]
- Costa, P.A.; Calçada, R.; Cardoso, A.S. Influence of train dynamic modelling strategy on the prediction of track–ground vibrations induced by railway traffic. Proc. Inst. Mech. Eng. Part F-J. Rail Rapid Transit 2012, 226, 434–450. [Google Scholar] [CrossRef]
- Li, H.; He, C.; Gong, Q.; Zhou, S.; Li, X.; Zou, C. Tlm-cfspml for 3d dynamic responses of a layered transversely isotropic half-space. Comput. Geotech. 2024, 168, 106131. [Google Scholar] [CrossRef]
- Ma, M.; Xu, L.; Liu, W.; Tan, X. Semi-analytical solution of a coupled tunnel-soil periodic model with a track slab under a moving train load, Applied Mathematical Modelling. Simul. Comput. Eng. Environ. Syst. 2024, 128, 588–608. [Google Scholar]
- Zhai, W.; Wang, K.; Cai, C. Fundamentals of vehicle-track coupled dynamics. Veh. Syst. Dyn. 2009, 47, 1349–1376. [Google Scholar] [CrossRef]
- Sheng, X.; Jones, C.J.C.; Thompson, D.J. A theoretical model for ground vibration from trains generated by vertical track irregularities. J. Sound Vib. 2003, 272, 937–965. [Google Scholar] [CrossRef]
- Hussein, M.F.M.; Hunt, H.E.M. A numerical model for calculating vibration from a railway tunnel embedded in a full-space. J. Sound Vib. 2007, 305, 401–431. [Google Scholar] [CrossRef]
- Auersch, L. Wave propagation in the elastic half-space due to an interior load and its application to ground vibration problems and buildings on pile foundations. Soil Dyn. Earthq. Eng. 2010, 30, 925–936. [Google Scholar] [CrossRef]
- Auersch, L. Dynamic interaction of various beams with the underlying soil–finite and infinite, half–space and Winkler models. Eur. J. Mech. A/solids 2008, 27, 933–958. [Google Scholar] [CrossRef]
- Xu, L.; Ma, M. Analytical solution of ground-borne vibration due to a spatially periodic harmonic moving load in a tunnel embedded in layered soil. J. Zhejiang Univ. A 2023, 24, 637–652. [Google Scholar] [CrossRef]
- Auersch, L. Dynamic stiffness of foundations on inhomogeneous soils for a realistic prediction of vertical building resonance. J. Geotech. Geoenviron. Eng. 2008, 134, 328–340. [Google Scholar] [CrossRef]
- François, S.; Pyl, L.; Masoumi, H.; Degrande, G. The influence of dynamic soil–structure interaction on traffic induced vibrations in buildings. Soil Dyn. Earthq. Eng. 2006, 27, 655–674. [Google Scholar] [CrossRef]
- Hu, J.; Zou, C.; Liu, Q.; Li, X.; Tao, Z. Floor vibration predictions based on train-track-building coupling model. J. Build. Eng. 2024, 89, 109340. [Google Scholar] [CrossRef]
- Ditommaso, R.; Mucciarelli, M.; Gallipoli, M.R.; Ponzo, F.C. Effect of a single vibrating building on free-field ground motion: Numerical and experimental evidences. Bull. Earthq. Eng. 2009, 8, 693–703. [Google Scholar] [CrossRef]
- Iacovino, C.; Ditommaso, R.; Ponzo, F.C.; Limongelli, M.P. The interpolation evolution method for damage localization in structures under seismic excitation. Earthq. Eng. Struct. Dyn. 2018, 47, 2117–2136. [Google Scholar] [CrossRef]
- JGJ/T 170-2009; Standard for Limits of Vibration and Secondary Radiated Noise of Buildings Caused by Urban Rail Transit and its Measurement Methods. China Architecture & Building Press: Beijing, China, 2009.
- GB 10070-88; Methods for Measurement of Ambient Vibration in Urban Areas. Standards Press of China: Beijing, China, 1988.
- Li, X.; Chen, Y.; Zo, C.; Wang, H.; Zheng, B.; Chen, J. Building structure-borne noise measurements and estimation due to train operations in tunnel. Sci. Total Environ. 2024, 926, 172080. [Google Scholar] [CrossRef]


Disclaimer/Publisher’s Note: The statements, opinions and data contained in all publications are solely those of the individual author(s) and contributor(s) and not of MDPI and/or the editor(s). MDPI and/or the editor(s) disclaim responsibility for any injury to people or property resulting from any ideas, methods, instructions or products referred to in the content. |
© 2024 by the authors. Licensee MDPI, Basel, Switzerland. This article is an open access article distributed under the terms and conditions of the Creative Commons Attribution (CC BY) license (https://creativecommons.org/licenses/by/4.0/).