Abstract
The impact of urban traffic on human health is significant. This research conducts field measurements in Guangzhou, China, focusing on a building situated near subgrade roads and viaducts to investigate the characteristics of airborne and structure-borne noise generated by these infrastructures. The analysis involves the use of both sound pressure level and overall sound pressure level, as well as an examination of the transfer function between outdoor and indoor noise levels. The findings indicate that traffic-related airborne noise demonstrates a characteristic frequency at 1000 Hz in this scenario, while viaduct- and building-generated structure-borne noise is predominantly distributed at lower frequencies. Additionally, it is worth noting that structural vibrations generate significantly less energy compared to airborne traffic noise sources. The variation in outdoor road noise across different floors over the entire frequency range demonstrates an initial increase followed by a decrease with rising floor height due to air damping effects as well as sound barriers’ attenuation properties. These results enhance engineers’ understanding of urban traffic-induced airborne or structure-borne noise while establishing foundational data for designing layouts integrating urban buildings with roads.
1. Introduction
Currently, individuals are experiencing significant levels of urban environmental pollution in daily life, including air pollution [1,2,3], light pollution [4,5], environmental vibration [6,7], noise pollution [8], and so on. These effects will impact various parts of the human body and different organs [4]. In urban development, it is almost inevitable that such pollution will occur. While efforts to control other forms of pollution are increasing, the issue of noise pollution is becoming increasingly severe [4]. Research has demonstrated that urban traffic-related activities have a substantial impact on human health [8,9]. As urban roads become increasingly intertwined with buildings in densely populated areas, attention is shifting toward addressing health concerns stemming from road-generated noise [10]. In the past and even now, substantial efforts have been directed toward understanding how road noise impacts individuals at different levels, including annoyance [11], hearing loss [12], sleep disturbance [13], cognitive performance [14], cardiovascular disease [15], etc. However, it is crucial to consider both traffic-induced sound patterns and their distribution when evaluating residents’ irritation levels; this serves as a foundation for systematically assessing community annoyance within diverse urban architectural layouts [16].
Urban thoroughfares comprise ground-level streets and elevated highways that generate distinct types of sound as vehicles pass through; these sounds subsequently penetrate nearby structures. Such noises can be categorized as airborne acoustics and structure-borne noise [1,17].
The airborne noise generated from the interaction between vehicle tires [18] and the road surface is transmitted through the air and enters the building interior. Some researchers have conducted studies on traffic road airborne noise, which is caused by multiple generation and amplification phenomena [19], including mechanisms due to tread impact [20], road roughness excitation [21], running deflection, and the acoustic resonances [20] due to pipe resonances, especially for tread pattern. Luca et al. [18] proposed a methodology for simulating tire–road noise through equivalent monopoles, with indoor tests conducted for validation. Additionally, deep-learning-based models are used to predict airborne noise resulting from the tire–road interaction [22]. However, the generation, propagation, and dissipation of sound fields near complex roads present a challenging problem when noise is produced. Various simulation tools were utilized for noise mapping such as CadnA [23], TRANEX [24], SoundPLAN [25], and so on. Hasmaden et al. [25] established noise mapping via SoundPLAN and validated it based on measurements. Nevertheless, discrepancies between the calculated and measured results indicate that analyzing sound fields from neighboring roads poses a complex challenge; conducting field experiments may be more suitable for investigating road noise characteristics.
For structure-borne noise, there are two types of sources near the subgrade road and viaduct road. One type is generated by viaduct vibrations transmitted through the air into buildings, while the other is caused by subgrade road vibrations transmitting into buildings and subsequently transforming into structure-borne noise. The numerical approach is commonly utilized for establishing the room sound field, and the boundary element method (BEM) is widely acknowledged as the most accurate technique for predicting noise from vibrations [17,26,27]. Gu et al. [28] combined the boundary element method and statistical energy analysis (SEA) to predict the full-frequency band noise of the bridge structure; their results indicate that the dominant frequency range of structural vibration and noise of composite bridges is 20~1000 Hz. Sadeghi et al. [29] established a numerical model based on finite element method–SEA theories to simulate building structure-borne noise. However, despite significant progress in acquiring secondary structural noise, there remains a lack of understanding regarding structural vibration noise caused by road traffic.
Given the critical impact of the building sound environment on human health, previous studies have predominantly focused on noise generation. However, urban sound environments are inherently complex, with intricate mechanisms of noise propagation. While previous research has traditionally focused on outdoor noise levels [30,31,32], or the urban noise map [33,34], the fact remains that a significant portion of individuals spend most of their time indoors. Even when the noise map is utilized for research, it can effectively simulate the outdoor urban noise distribution; however, in complex urban acoustic environments such as indoor spaces, accurately considering noise propagation, coupling loss, and multi-source excitation becomes challenging. In this scenario, conducting field tests proves to be an exceptionally effective method for capturing the intricate acoustic landscape of an actual urban environment. Thus, it is crucial and innovative to conduct a comprehensive investigation of indoor noise levels in urban settings impacted by traffic-induced noise. Therefore, it is important and innovative to conduct a comprehensive study of indoor noise levels in urban environments affected by traffic-induced noise. The authors have previously conducted studies on indoor noise environments [35,36], including measurements taken near a traffic road with open windows and near a construction site with both open and closed windows. In an extension of these earlier studies, this current research also examines indoor and outdoor noise levels with closed windows, along with additional comparative tests. The aim is to investigate the propagation and distribution patterns of indoor sound environments within buildings under the influence of urban traffic noise.
The novelty of this study can be summarized in three main aspects: (1) The primary innovation lies in conducting a comprehensive parametric study on the building noise environment, encompassing traffic-induced airborne noise from subgrade and viaduct roads, as well as structure-borne noise from bridge and building vibrations; (2) In previous research, road noise has primarily been assessed based on the overall sound pressure level. However, in this study, the author conducted a frequency domain analysis of road noise to investigate the distribution and impact of airborne and structural noise within each frequency band; (3) The third innovation involves the investigation of acoustic propagation characteristics in composite road traffic systems (viaducts and ground road). Both elements are considered simultaneously, leading to more complex conditions for noise transmission.
The structures of this study are shown in Figure 1. This study conducts on-site measurements to investigate the propagation characteristics of air and structural noise generated by road traffic. A series of comparisons has been conducted to examine the characteristics of traffic-induced air noise and structure-borne noise from both the viaduct road and subgrade road. The findings of this study can contribute to engineers’ understanding of traffic-induced air and structure-borne noise, while also providing a foundational dataset for urban building and road layout design.
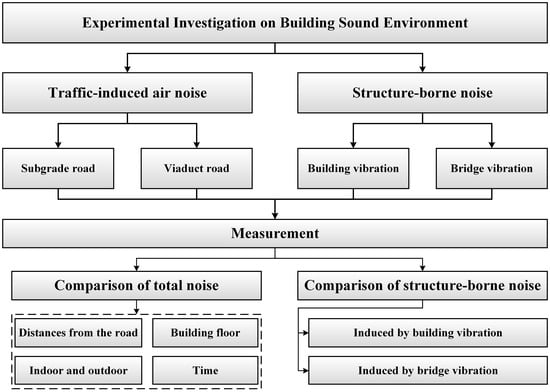
Figure 1.
Structures of the study.
2. Measurement
2.1. Measured Site Descriptions
A residential building is chosen for the traffic-induced noise and vibration measurement in Guangzhou, China, which is constructed nearby the subgrade and viaduct roads with a distance of 20 m. The subgrade is a six-lane dual carriageway where trees have been planted on both sides of the road to act as a noise reduction measure. The viaduct road is a four-lane dual carriageway where the sound barrier has been set up on both sides of the road to reduce the noise pollution, which is level with the third floor of the building. The photographs of the buildings during measurement are shown in Figure 2.
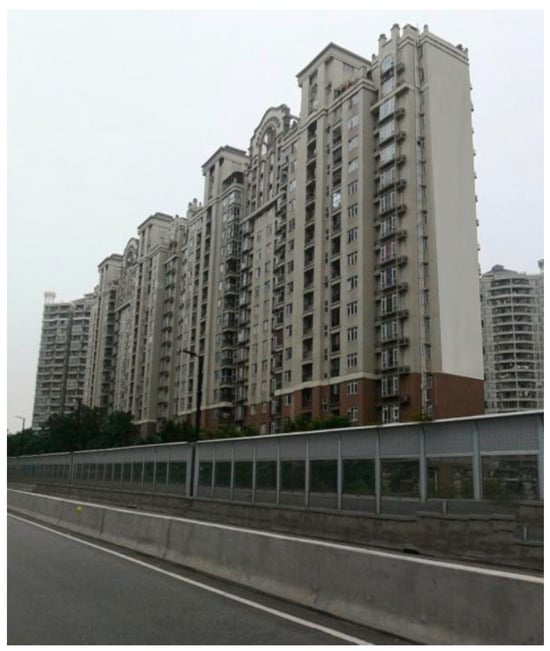
Figure 2.
Photographs of buildings.
As shown in Figure 3, in the enclosed public corridors of the building, there is a ledge directly facing the road traffic, and no furniture is present due to the nature of it being a public corridor, providing optimal conditions for measurement. The size of the public corridor is 8 m in length, 2 m in width, and 3 m in height, with a volume of 48 m3. During the measurement period, the door to the public corridor is closed at all times, ensuring that indoor measurements are conducted without potential interference. According to Sabine’s formula, the T60 can be expressed empirically as
where and are the sound absorption area and average sound absorption coefficient, respectively. By considering the empirical value of the corresponding coefficient, the T60 can be subsequently calculated. The general principle postulates a positive correlation between room size and reverberation time, indicating that larger rooms tend to exhibit longer reverberation times. However, given that each room shares the same volume and nearly identical interior configuration, the analysis does not include the measurement and assessment of the room’s reverberation time.
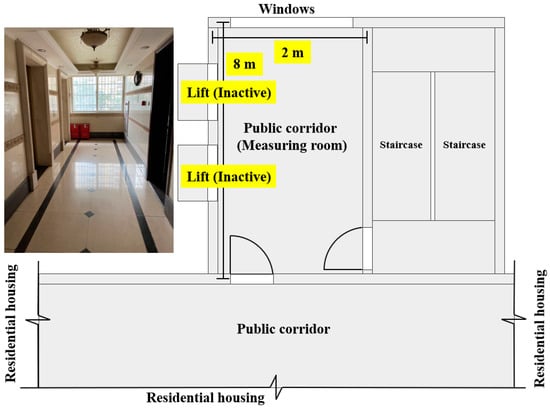
Figure 3.
Photograph and spatial layout of the measurement room.
The window is the sliding double-glazed window with an aluminum window frame. The size of the window of each floor is 2 m in width and 1.5 m in height. The window is 14 mm thick double glass with a configuration and thickness of windows 4-6-4 mm and glass-laminated settling with the distance filled by air. Spacers are small pieces of aluminum that separate and support the two panes of glass that comprise the double-glazed window. The Rw value of the window can be estimated in the value of 30 dB(A) according to some precious studies [37,38,39,40].
2.2. Measurement Program
2.2.1. Setup
The assessment of indoor noise resulting from road traffic is a multifaceted issue, with the indoor noise being comprised of several components under test conditions, as shown in Figure 4. The yellow triangle serves as the observation point. Firstly, the indoor noise originates from the airborne noise (blue wave) generated by the interaction between vehicle tires and the road surface, which is then propagated through the air and infiltrates the interior of buildings. Secondly, when vehicles traverse viaducts, the resulting vibrations produce bridge structure-borne noise (yellow wave), which also penetrates buildings via the air. Lastly, as vehicles travel along roads, their vibrations are transmitted through foundations into buildings, leading to building structure-borne noise (red wave) within them. Collectively, these three components constitute indoor noise caused by road traffic.
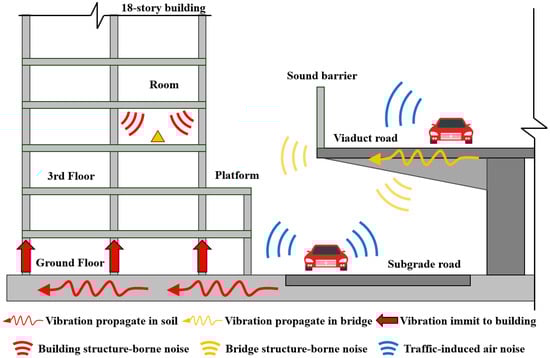
Figure 4.
Schematic representation of indoor noise generated by road traffic.
The rooms on the third floor of the building are presently closed and devoid of windows; meanwhile, rooms on upper floors have windows oriented perpendicular to the road. Based on the current test conditions, three sets of control tests were established:
- (1)
- Comparative analysis of road noise levels at different times is conducted at one test point in order to assess changes in the acoustic environment over time and potential impacts on other tests;
- (2)
- Sensors are positioned on the ground floor at varying distances from roads to investigate the attenuation characteristics of road traffic noise within a complex urban acoustic environment;
- (3)
- Indoor and outdoor sensors are installed on the same floor to examine both indoor sound environment characteristics and building sound insulation properties under completely enclosed conditions;
- (4)
- Detection points are established indoors and outdoors at different heights within the building to explore traffic-induced indoor and outdoor noise attenuation characteristics across various floors;
- (5)
- Sensors are deployed at positions closest to both viaduct roads and ground level roads for studying structural noise characteristics specific to viaducts;
- (6)
- Sensors are deployed in the indoor room without windows and corresponding outdoor position for investigating structural noise caused by traffic-induced vibration.
All experiments were carried out within the same facility in order to minimize potential variables that could impact the outcomes. Precision microphones were positioned at various locations inside and outside of the building. This setup and photos taken during measurement are visually depicted in Figure 5. The measurements were carried out on sunny days to minimize the impact of adverse weather conditions, ensuring minimal interference from rain and strong wind. During the building measurements, all doors and windows were kept closed to eliminate potential external factors that could introduce interference.
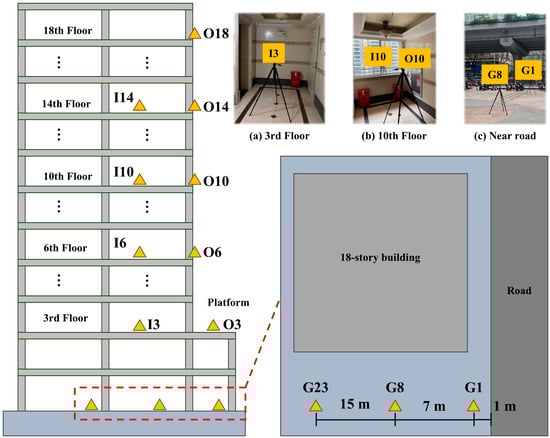
Figure 5.
Instrumentation setup and the photos in different positions during measuring.
2.2.2. Instrumentation and Signal Processing
The instrumentation utilized for measurement encompasses a Rion UC-59 microphone and a tripod [8]. The microphone is installed on the preamplifier to obtain a clear noise signal, and the windshield is connected with the head of the microphone to effectively mitigate wind noise interference during the recording process and enhance the clarity and purity of recorded audio, thereby improving the overall recording quality. For the height of the measuring instrumentations, all the assembly instrumentations would be installed on the tripod, ensuring the strict requirement of being 1.5 m away from the floor surface.
Before conducting in situ measurements, a thorough synchronization of the devices was carried out. This involved using a laptop connected to an acquisition instrument. The sampling frequency for each device was set at 10 kHz, chosen to facilitate noise analysis up to 5 kHz, despite such high frequencies not being typically necessary for noise analysis but sufficient for the common frequency of interest at 1~1.5 kHz for traffic noise [41,42,43]. Some civil engineering machines induce noise and vibrations below 20 Hz, e.g., CAT cars with hammers at 8 and 16 Hz [6]. The frequency band in question should be avoided to prevent potential interference with the analysis. Therefore, in the subsequent discussion, the analysis frequency is set within the range of 20–2000 Hz to facilitate a more precise examination of the propagation and distribution patterns of road noise inside the building.
The acquired raw data were subsequently processed analytically using a custom script developed in MATLAB [44]. This script was specifically tailored to calculate the power spectral density of the signals, focusing on stable intervals coinciding with traffic transit. The data collection was configured for 20 min measurement samples as road noise represents a relatively consistent sound source.
3. Results and Discussion
3.1. Total Noise Due to Traffic Road
3.1.1. Comparison of SPLs at Different Times
Figure 6 shows the A-weight level of the platform on the third floor at different times. The equivalent continuous A sound level in different time periods, as depicted in Figure 6a, demonstrates a consistent trend across the entire frequency spectrum. Additionally, the average total sound pressure level of road noise illustrated in Figure 6b indicates that variations between different time periods do not exceed 2 dB. Based on the average total sound pressure level data, it is evident that road noise remains consistently close to 70 dB throughout the day. This underscores the significant impact of road noise on the community and emphasizes the necessity of implementing noise reduction measures to enhance residents’ living environment. On the contrary, it also demonstrates that road noise serves as a relatively consistent source of noise within the building, thus facilitating favorable conditions for comparative analysis and research.
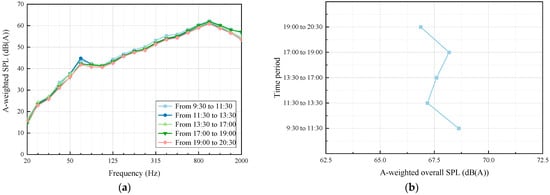
Figure 6.
Comparison of sound pressure level at different times. (a) A-weighted SPL; (b) A-weighted overall SPL.
3.1.2. Comparison of the Noise of Different Distances from the Traffic Road
The comparison of sound pressure levels (SPLs) at varying distances from the traffic road is depicted in Figure 7. The measurements were conducted continuously for one hour under these conditions. To facilitate a clearer comparison, the average SPL in the frequency domain was calculated. For overall SPLs, road noise samples were taken at 20 min intervals to comply with the Chinese code HJ 640-2012 [45]. Figure 7a illustrates that the equivalent continuous A-weighted sound level of road noise initially increases and then decreases with frequency. The peak SPL occurs at 1000 Hz, which is characteristic of air noise. Road noise demonstrates a consistent trend across all frequency bands, decreasing in intensity as the distance from the road increases. The overall SPL of the noise samples in Figure 7b indicate a noticeable decrease in road noise as the distance from the road increases. In the process of sound propagation, as the distance increases, its energy will disperse according to the radiation damping, resulting in a gradual reduction of the sound pressure level. This attenuation is one of the fundamental characteristics of sound propagation.
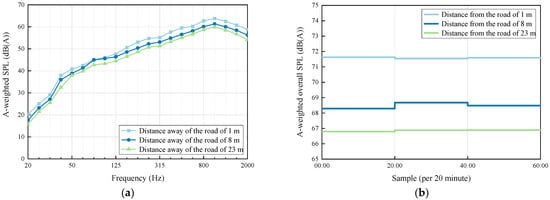
Figure 7.
Comparison of the sound pressure levels with different distances from the traffic road. (a) A-weighted SPL; (b) A-weighted overall SPL.
An interesting phenomenon is observed: SPL decreases non-linearly with increasing distance, possibly due to complex urban noise fields where road noise has a significant impact in close proximity but diminishes during propagation. In contrast, multiple sources contribute to non-linear decreases in noise levels with distance from the road within far-field conditions, which contrasts with the findings of previous studies’ noise maps [33,34].
3.1.3. Comparison of SPLs of Indoors and Outdoors
The transmission of road traffic noise from outdoors to indoors primarily involves three main transmission paths: (a) Direct transmission: Sound waves travel directly through air mediums toward exterior walls, windows, and other openings before entering indoor spaces via walls or glass; (b) Penetrate transmission: The sound penetrates through the windows and walls, filling the room; (c) Structural conduction: traffic-induced vibration waves transmission through structures like walls and floors to generate the structure-borne noise. The three transmission paths result in a complex sound environment of the indoor room. Therefore, in the measurement, the sealing of the measurement room should be ensured as far as possible to reduce the influence of direct propagation on the experiment. In the analysis, the indoor sound characteristics are regarded as the acoustic environment containing both structural noise and penetrating noise. The comparison of sound pressure levels (SPLs) between indoor and outdoor environments is illustrated in Figure 8. As depicted in Figure 8a,c,e, the SPLs on the sixth, tenth, and fourteenth floors are higher outdoors than indoors across all frequency bands. This disparity can be attributed to the attenuation effect of window glass soundproofing on road noise propagation from outdoors to indoors, resulting in reduced indoor sound levels. Comparing the total noise pressure level of the samples within the same time period as shown in Figure 8b,d,f, it can be inferred that outdoor noise on the sixth floor exceeds indoor noise by approximately 15 dB, while outdoor noise on the tenth floor surpasses indoor noise by about 18 dB, and outdoor noise on the fourteenth floor exceeds indoor noise by roughly 17 dB. These findings clearly demonstrate that windows play a significant role in reducing indoor noise levels. The findings also indicate that indoor noise exhibits relatively consistent levels, while outdoor noise varies noticeably across different floors. However, once it transmits into the building, the sound pressure level tends to stabilize at around 55–57 dB.
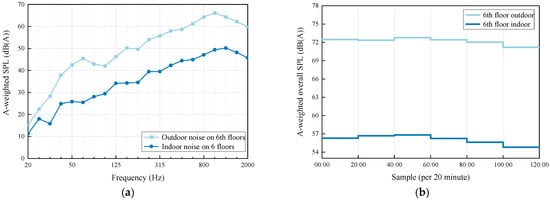
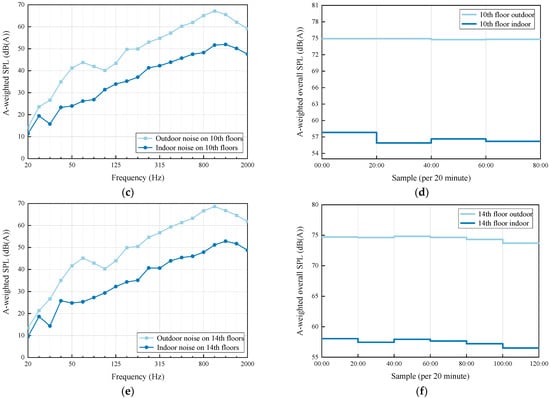
Figure 8.
Comparison of the SPLs of indoors and outdoors. A-weighted SPL (a) on 6th floor; (c) on 10th floor; (e) on 14th floor. A-weighted overall SPL (b) on 6th floor; (d) on 10th floor; (f) on 14th floor.
3.1.4. Comparison of SPLs on Different Building Floors
The comparison of sound pressure levels (SPLs) at different floor heights within a building is depicted in Figure 9. As illustrated in Figure 9a, when comparing outdoor noise levels on the third and sixth floors, while maintaining identical distances from the noise receiving points to the noise source on both floors, there is a consistent similarity observed in the low-frequency bands. However, there is a notable reduction in high-frequency noise. This can be attributed to the effectiveness of sound barriers in attenuating mid-to-high-frequency noise due to their susceptibility to physical obstruction and absorption, whereas their insulation effect on low-frequency noise is generally less pronounced owing to longer wavelengths that make them more prone to bypassing the barrier [46]. With increasing floor height, there is an initial increase followed by a decrease in outdoor road noise across the entire frequency range. Similarly, the analysis of average total sound pressure level data depicted in Figure 9b shows a similar propagation pattern with the highest noise occurring on the middle floors.
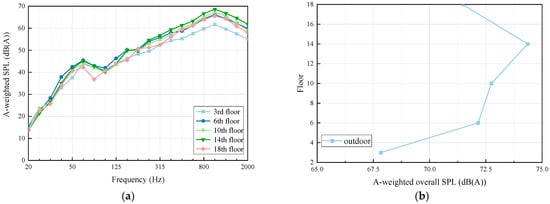
Figure 9.
Comparison of the outdoor noise with the different building floor heights; (a) A-weighted SPL; (b) Overall A-weighted SPL.
The variation in the reduction effect of the sound barrier with building floor height is attributed to the attenuation of noise generated on viaducts, as illustrated in Figure 10. The noise undergoes attenuation through two mechanisms during propagation: firstly, a portion of the noise is blocked by the sound barrier to reduce its level within the building; secondly, air damping contributes to noise attenuation. However, as the building floor height increases, the impact of the sound barrier diminishes because road noise on viaducts can directly reach observation points in buildings without passing through the sound barrier. Consequently, within a specific range, outdoor sound pressure levels inside buildings increase with rising floor heights. Nevertheless, once a certain threshold is reached, the effectiveness of the sound barrier decreases and noise is mainly attenuated via air transmission. Owing to these combined effects of attenuation modes, outdoor noise initially rises and subsequently falls with increasing floor height.
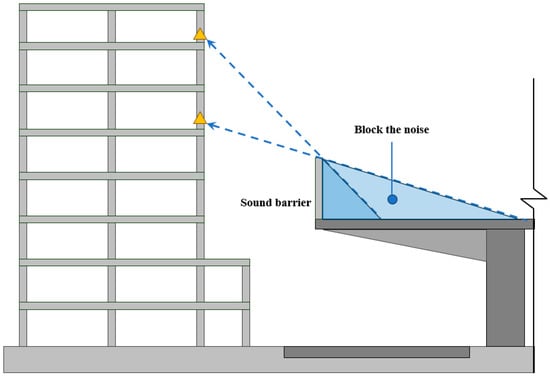
Figure 10.
Schematic representation of the reduction effect of the sound barrier.
It is evident from Figure 11a that indoor road noise increases across different floors throughout the entire frequency range as floor height rises. This can be attributed to the consistent propagation pattern of outdoor road noise, with indoor detection points not exceeding a certain area above ground level, thus only reflecting an upward trend in noise levels. Furthermore, upon analyzing the average total sound pressure level data in Figure 11b, it becomes apparent that the rate of increase in noise levels gradually diminishes with ascending floor height. As higher floors are more susceptible to distant noise sources, these noises have a relatively minor impact due to their distance, resulting in a slowdown in the growth rate of indoor noise. Furthermore, the attenuation effect of soundproof windows exhibits frequency-dependent characteristics [47], with a tendency to become more pronounced as the frequency increases. The traffic-induced air noise is concentrated in the high-frequency band of interest, while indoor noise experiences significant attenuation when passing through the window glass within that frequency range, resulting that the SPL of indoor noise tends to be consistent.
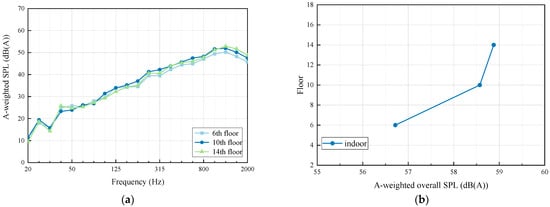
Figure 11.
Comparison of indoor noise with different building floor heights; (a) A-weighted SPL; (b) Overall A-weighted SPL.
3.2. Structure-Borne Noise Due to Traffic Road
3.2.1. Structure-Borne Noise Generated by Bridge
The comparison of sound pressure levels (SPLs) from different types of roads is illustrated in Figure 12. The noise level at the 3-level platform is lower than that at the roadside, exhibiting a similar trend in the frequency domain. However, there is a significant peak at 63 Hz, which may be attributed to structure-borne noise generated by viaduct vibration [17]. Nevertheless, the structure-borne noise resulting from bridge vibration is considerably less than airborne noise caused by traffic operations and can be disregarded.
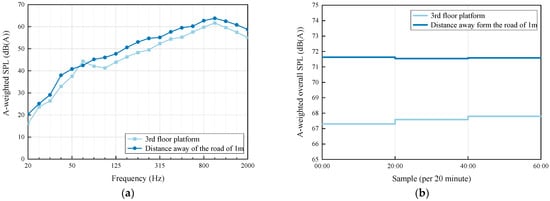
Figure 12.
Comparison of the SPLs from different types of road; (a) A-weighted SPL; (b) Overall A-weighted SPL.
3.2.2. Structure-Borne Noise Generated by Building
A transfer function TF from outdoor to indoor is defined to describe the relationship between outdoor and indoor noise, and the following equation is expressed as
where and represent indoor and outdoor noise, respectively, while ω represents the angular frequency. The A-weighted sound pressure levels of indoor and outdoor noise, as well as their transfer function on the third floor, are illustrated in Figure 13. As depicted in Figure 13a, outdoor noise exceeds indoor noise significantly due to concrete effectively blocking noise energy across all frequencies. Figure 13b displays the transfer function from outdoor noise to indoor noise, revealing two peaks at 25 and 100 Hz possibly attributed to structure-borne noise generated by the building. The vibration induced by traffic transmits into the building and transforms into structure-borne noise, resulting in these two peaks in the transfer function. However, the structure-borne noise generated by building vibration is much less than air traffic-induced noise. The sound energy generated by structures is minimal, which can be disregarded in the analysis or prediction.
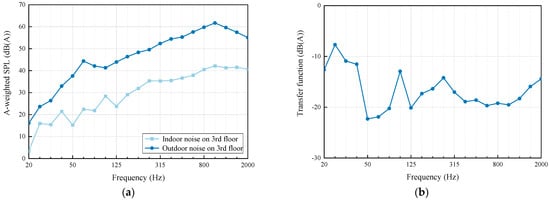
Figure 13.
Comparison of indoor and outdoor noise and their transfer function on the third floor; (a) A-weighted SPL; (b) Transfer function.
4. Conclusions
This paper focus on a building located near both subgrade roads and viaducts to conduct a comprehensive parametric study on the building noise environment, encompassing traffic-induced airborne noise from subgrade and viaduct roads, as well as structure-borne noise from bridge and building vibrations. Road noise has been assessed based on the overall sound pressure level as well as in the frequency domain analysis. The following conclusions are as follows:
(1) Noise from the viaduct road undergoes attenuation through two mechanisms during propagation: firstly, a portion of the noise is blocked by the sound barrier to reduce its level within the building; secondly, air damping contributes to noise attenuation. As the building floor height increases, the impact of the sound barrier diminishes because road noise on viaducts can directly reach observation points in buildings without passing through the sound barrier. Once a certain height is reached, the effectiveness of the sound barrier decreases and noise is mainly attenuated via air transmission. Due to these combined effects of attenuation modes, outdoor noise initially rises and subsequently falls with increasing floor height;
(2) Due to the frequency-dependent characteristics of soundproof windows, the attenuation effect exhibits a tendency to become more pronounced as frequency increases. The traffic-induced air noise is concentrated in the high-frequency band of interest, while indoor noise experiences significant attenuation when passing through the window glass within that frequency range. As a result, the SPL of indoor noise tends to remain consistent;
(3) The non-linear decrease in sound pressure level (SPL) with increasing distance can be attributed to the complex urban noise environment. In close proximity, road noise has a significant impact but diminishes over propagation. However, in the far field, noise from multiple sources leads to a non-linear reduction in noise levels as distance from the road increases;
(4) In comparison to airborne noise, the sound energy generated by bridge and building structures is minimal, and can be disregarded in the analysis or prediction;
(5) The findings of this study can enhance engineers’ understanding of traffic-induced air and structure-borne noise, as well as provide a fundamental dataset for urban road layout design. In future research, the model will be developed based on acoustic environment data from the site of measurement, with the aim of establishing an indoor acoustic environment model under the influence of complex sound sources generated by urban road traffic.
Author Contributions
Conceptualization, J.C., X.L. and C.Z.; data curation, X.L. and B.Z.; formal analysis, T.W., D.W. and L.H.; funding acquisition, J.C.; investigation, J.C., X.L. and B.Z.; methodology, C.Z. and L.H.; project administration, J.C.; software, B.Z., T.W. and L.H.; supervision, X.L. and C.Z.; validation, T.W. and D.W.; writing—original draft, J.C., X.L., B.Z. and L.H.; writing—review and editing T.W., D.W. and C.Z. All authors have read and agreed to the published version of the manuscript.
Funding
This research was funded by the project of the Ministry of Housing and Urban-Rural Development of the People’s Republic of China, grant number 2022-K-153.
Data Availability Statement
The original contributions presented in the study are included in the article material; further inquiries can be directed to the corresponding author.
Conflicts of Interest
Authors Jialiang Chen, Teng Wang and Dongyang Wang were employed by the company Beijing Oriental Yuhong Waterproof Technology Co., Ltd. Author Jialiang Chen was employed by the company Beiijao Zane Rail Technology (Beijing) Co., Ltd. Author Lingshan He was employed by the company Guangzhou Urban Planning & Design Survey Research Institute Co., Ltd. The remaining authors declare that the research was conducted in the absence of any commercial or financial relationships that could be construed as a potential conflict of interest.
References
- Szczepanik-Scislo, N.; Scislo, L. Dynamic real-time measurements and a comparison of gas and wood furnaces in a dual-fuel heating system in order to evaluate the occupants’ safety and indoor air quality. Buildings 2023, 13, 2125. [Google Scholar] [CrossRef]
- Liang, L.; Gong, P. Urban and air pollution: A multi-city study of long-term effects of urban landscape patterns on air quality trends. Sci. Rep. 2020, 10, 18618. [Google Scholar] [CrossRef] [PubMed]
- Scislo, L.; Szczepanik-Scislo, N. Near Real-Time Access Monitoring Based on IoT Dynamic Measurements of Indoor Air Pollutant. In Proceedings of the 2023 IEEE 12th International Conference on Intelligent Data Acquisition and Advanced Computing Systems: Technology and Applications (IDAACS), Dortmund, Germany, 7–9 September 2023; Volume 1, pp. 729–734. [Google Scholar]
- Miller, M.R.; Landrigan, P.J.; Arora, M.; Newby, D.E.; Münzel, T.; Kovacic, J.C. Water, Soil, Noise, and Light Pollution: JACC Focus Seminar, Part 2. J. Am. Coll. Cardiol. 2024, 83, 2308–2323. [Google Scholar] [CrossRef] [PubMed]
- Serdar, O.; Erol, N.D.; Aydin, A.N. Effect of light and noise pollution on oxidative stress and proximate composition in Dreissena polymorpha. Ecohydrol. Hydrobiol. 2024. Available online: https://www.sciencedirect.com/science/article/pii/S1642359324000399 (accessed on 10 July 2024). [CrossRef]
- Scislo, L.; Szczepanik-Scislo, N. Influence of mechanical ventilation and cooling systems on vibrations of high precision machines. In E3S Web of Conferences; EDP Sciences: Les Ulis, France, 2019; Volume 100, p. 00080. [Google Scholar]
- Hu, J.; Zou, C.; Liu, Q.; Li, X.; Tao, Z. Floor vibration predictions based on train-track-building coupling model. J. Buil. 2024, 89, 109340. [Google Scholar] [CrossRef]
- Li, X.; Chen, Y.; Zou, C.; Wang, H.; Zheng, B.; Chen, J. Building structure-borne noise measurements and estimation due to train operations in tunnel. Sci. Total Environ. 2024, 926, 172080. [Google Scholar] [CrossRef] [PubMed]
- Ma, M.; Xu, L.; Liu, W.; Tan, X. Semi-analytical solution of a coupled tunnel-soil periodic model with a track slab under a moving train load. Appl. Math. Model. 2024, 128, 588–608. [Google Scholar] [CrossRef]
- Das, C.P.; Swain, B.K.; Goswami, S.; Das, M. Prediction of traffic noise induced annoyance: A two-staged SEM-Artificial Neural Network approach. Transp. Res. Part D Transp. Environ. 2021, 100, 103055. [Google Scholar]
- Öhrström, E.; Skånberg, A.; Svensson, H.; Gidlöf-Gunnarsson, A. Effects of road traffic noise and the benefit of access to quietness. J. Sound Vib. 2006, 295, 40–59. [Google Scholar] [CrossRef]
- Karpa, M.J.; Gopinath, B.; Beath, K.; Rochtchina, E.; Cumming, R.G.; Wang, J.J.; Mitchell, P. Associations between hearing impairment and mortality risk in older persons: The Blue Mountains Hearing Study. Ann. Epidemiol. 2010, 20, 452–459. [Google Scholar] [CrossRef] [PubMed]
- Muzet, A. Environmental noise, sleep and health. Sleep Med. Rev. 2007, 11, 135–142. [Google Scholar] [CrossRef] [PubMed]
- World Health Organization. Burden of Disease from Environmental Noise: Quantification of Healthy Life Years Lost in Europe; World Health Organization: Geneva, Switzerland; Regional Office for Europe: Copenhagen, Denmark, 2011. [Google Scholar]
- Babisch, W. Cardiovascular effects of noise. Noise Health 2011, 13, 201–204. [Google Scholar] [CrossRef] [PubMed]
- Wang, H.; Wu, Z.; Wu, Z.; Hou, Q. Urban network noise control based on road grade optimization considering comprehensive traffic environment benefit. J. Environ. Manag. 2024, 364, 121451. [Google Scholar] [CrossRef] [PubMed]
- Song, L.; Gao, K.; Liu, Q.; Liu, L.; Feng, Q. Study on the structure-borne noise of U-shaped girder bridges with fully-enclosed sound barriers. Appl. Acoust. 2023, 211, 109497. [Google Scholar] [CrossRef]
- Rapino, L.; Ripamonti, F.; Dallasta, S.; Baro, S.; Corradi, R. Synthesis of equivalent sources for tyre/road noise simulation and analysis of the vehicle influence on sound propagation. Appl. Acoust. 2024, 216, 109751. [Google Scholar] [CrossRef]
- Hoever, C.; Tsotras, A.; Pallas, M.A.; Cesbron, J. Factors influencing tyre/road noise under torque. In INTER-NOISE and NOISE-CON Congress and Conference Proceedings; Institute of Noise Control Engineering: Wakefield, MA, USA, 2023; Volume 265, pp. 3683–3690. [Google Scholar]
- Wang, X. (Ed.) Automotive Tire Noise and Vibrations: Analysis, Measurement and Simulation; Butterworth-Heinemann: Oxford, UK, 2020. [Google Scholar]
- Yi, J.; Liu, X.; Shan, Y.; Dong, H. Characteristics of sound pressure in the tire cavity arising from acoustic cavity resonance excited by road roughness. Appl. Acoust. 2019, 146, 218–226. [Google Scholar] [CrossRef]
- Huang, H.; Lim, T.C.; Wu, J.; Ding, W.; Pang, J. Multitarget prediction and optimization of pure electric vehicle tire/road airborne noise sound quality based on a knowledge-and data-driven method. Mech. Syst. Signal Process. 2023, 197, 110361. [Google Scholar] [CrossRef]
- Puckeridge, H.; Braunstein, T.; Weber, C. Comparison of rail noise modelling with CadnaA & SoundPLAN. In Proceedings of the ACOUSTICS 2019, Cape Schanck, VIC, Australia, 10–13 November 2019; Volume 10. [Google Scholar]
- Khan, J.; Ketzel, M.; Jensen, S.S.; Gulliver, J.; Thysell, E.; Hertel, O. Comparison of Road Traffic Noise prediction models: CNOSSOS-EU, Nord2000 and TRANEX. Environ. Pollut. 2021, 270, 116240. [Google Scholar] [CrossRef] [PubMed]
- Hasmaden, F.; Zorer Gedik, G.; Yüğrük Akdağ, N. An approach to the design of photovoltaic noise barriers and a case study from Istanbul, Turkey. Environ. Sci. Pollut. Res. 2022, 29, 33609–33626. [Google Scholar] [CrossRef] [PubMed]
- Ochmann, M. Boundary Element Acoustics Fundamentals and Computer Codes. J. Acoust. Soc. Am. 2002, 111, 1507–1508. [Google Scholar]
- Li, Q.; Xu, Y.L.; Wu, D.J. Concrete bridge-borne low-frequency noise simulation based on train–track–bridge dynamic interaction. J. Sound Vib. 2012, 331, 2457–2470. [Google Scholar] [CrossRef]
- Gu, Y.W.; Nie, X.; Yan, A.G.; Zeng, J.H.; Liu, Y.F.; Jiang, Y.X. Experimental and numerical study on vibration and structure-borne noise of high-speed railway composite bridge. Appl. Acoust. 2022, 192, 108757. [Google Scholar] [CrossRef]
- Sadeghi, J.; Vasheghani, M. Improvement of current codes in design of concrete frame buildings: Incorporating train-induced structure borne noise. J. Build. Eng. 2022, 58, 104955. [Google Scholar] [CrossRef]
- Chouksey, A.K.; Kumar, B.; Parida, M.; Pandey, A.D.; Verma, G. Measurement and prediction of road traffic noise at different floor levels of buildings in a mid-sized Indian city. J. Build. Eng. 2024, 92, 109711. [Google Scholar] [CrossRef]
- Huang, B.; Pan, Z.; Liu, Z.; Hou, G.; Yang, H. Acoustic amenity analysis for high-rise building along urban expressway: Modeling traffic noise vertical propagation using neural networks. Transp. Res. Part D Transp. Environ. 2017, 53, 63–77. [Google Scholar] [CrossRef]
- Caldwell, N.J. Study of Traffic Noise bevels at Various Heights of a 39-Story Building. Available online: https://www.nrs.fs.usda.gov/pubs/gtr/gtr_ne25/gtr_ne25_195.pdf (accessed on 10 July 2024).
- Yang, W.; He, J.; He, C.; Cai, M. Evaluation of urban traffic noise pollution based on noise maps. Transp. Res. Part D Transp. Environ. 2020, 87, 102516. [Google Scholar] [CrossRef]
- Campello-Vicente, H.; Peral-Orts, R.; Campillo-Davo, N.; Velasco-Sanchez, E. The effect of electric vehicles on urban noise maps. Appl. Acoust. 2017, 116, 59–64. [Google Scholar] [CrossRef]
- Wu, J.; Zou, C.; He, S.; Sun, X.; Wang, X.; Yan, Q. Traffic noise exposure of high-rise residential buildings in urban area. Environ. Sci. Pollut. Res. 2019, 26, 8502–8515. [Google Scholar] [CrossRef] [PubMed]
- Zou, C.; Zhu, R.; Tao, Z.; Ouyang, D.; Chen, Y. Evaluation of building construction-induced noise and vibration impact on residents. Sustainability 2020, 12, 1579. [Google Scholar] [CrossRef]
- Balasbaneh, A.T.; Yeoh, D.; Abidin, A.R.Z. Life cycle sustainability assessment of window renovations in schools against noise pollution in tropical climates. J. Build. Eng. 2020, 32, 101784. [Google Scholar] [CrossRef]
- Yang, H.S.; Cho, H.M.; Kim, M.J. On-site measurements for noise reduction through open windows of classrooms with different building dispositions. Appl. Acoust. 2018, 139, 165–173. [Google Scholar] [CrossRef]
- Li, X.; Tang, S.K.; Yim, S.Y.; Lee, R.Y.; Hung, T. Noise reduction of plenum windows on the façade of a high-rise residential building next to heavy road traffic. Build. Environ. 2020, 186, 107353. [Google Scholar] [CrossRef]
- Tan, J.K.A.; Lau, S.K. Experimental study of active noise control for a full-scale plenum window in a domestic apartment. Appl. Acoust. 2024, 224, 110120. [Google Scholar] [CrossRef]
- Lou, K.; Xiao, P.; Kang, A.; Wu, Z.; Dong, X. Effects of asphalt pavement characteristics on traffic noise reduction in different frequencies. Transp. Res. Part D Transp. Environ. 2022, 106, 103259. [Google Scholar] [CrossRef]
- Xu, X.; Cai, J.; Yu, N.; Yang, Y.; Li, X. Effect of loudness and spectral centroid on the music masking of low frequency noise from road traffic. Appl. Acoust. 2020, 166, 107343. [Google Scholar] [CrossRef]
- Chang, T.Y.; Liang, C.H.; Wu, C.F.; Chang, L.T. Application of land-use regression models to estimate sound pressure levels and frequency components of road traffic noise in Taichung, Taiwan. Environ. Int. 2019, 131, 104959. [Google Scholar] [CrossRef]
- Higham, D.J.; Higham, N.J. MATLAB Guide; Society for Industrial and Applied Mathematics: Philadelphia, PA, USA, 2016. [Google Scholar]
- HJ 640-2012; Technical Specifications for Environmental Noise Monitoring Routine Monitoring for Urban Environmental Noise. Chinese code of Ecology Environment: Beijing, China, 2018. (In Chinese)
- Nieves, J.G.; Picó, R.; Del Rey, R.; Alba, J.; Redondo, J. Assessment of the sound reduction index provided by noise barriers with low sound insulation. Appl. Acoust. 2024, 220, 109967. [Google Scholar] [CrossRef]
- Du, L.; Lau, S.K.; Lee, S.E.; Danzer, M.K. Experimental study on noise reduction and ventilation performances of sound-proofed ventilation window. Build. Environ. 2020, 181, 107105. [Google Scholar] [CrossRef]
Disclaimer/Publisher’s Note: The statements, opinions and data contained in all publications are solely those of the individual author(s) and contributor(s) and not of MDPI and/or the editor(s). MDPI and/or the editor(s) disclaim responsibility for any injury to people or property resulting from any ideas, methods, instructions or products referred to in the content. |
© 2024 by the authors. Licensee MDPI, Basel, Switzerland. This article is an open access article distributed under the terms and conditions of the Creative Commons Attribution (CC BY) license (https://creativecommons.org/licenses/by/4.0/).