Article

Assessing the Impact of Climate Comfort on Labor Productivity in Hydropower Engineering Construction in Southwest China

1
Hubei Key Laboratory of Construction and Management in Hydropower Engineering, China Three Gorges University, Yichang 443002, China
2
Engineering Research Center of Eco-Environment in Three Gorges Reservoir Region, Ministry of Education, Yichang 443002, China
3
Post Doctoral Research Station of Hydraulic Engineering, Three Gorges University, Yichang 443002, China
*
Author to whom correspondence should be addressed.
Buildings 2024, 14(8), 2398; https://doi.org/10.3390/buildings14082398 (registering DOI)
Submission received: 30 April 2024 / Revised: 25 June 2024 / Accepted: 1 August 2024 / Published: 3 August 2024
(This article belongs to the Section Construction Management, and Computers & Digitization)

Abstract

:
Labor productivity exerts a significant influence on the construction cycle and investment in hydropower projects. Consequently, it is a crucial factor in the estimation of the cost of hydropower project construction. The mechanisms that are modulated by subjective factors have been extensively studied. However, the assessment of labor productivity in objective environments with regular changes is usually considered using a single factor, especially in special environments where the influence of environmental factors is of greater concern. As the most extensive region of China’s water-energy resources, the Southwest region has a lengthy tradition of using altitude or oxygen as an inherent criterion for the assessment of labor productivity. However, the applicability of inherent standards is limited. Therefore, we tried to assess the spatial and temporal changes in labor productivity based on the changes in meteorological conditions in Southwest China, employing climate comfort indicators in this study. The result identified five distinct regions of climate change in Southwest China (R-I to R-V). In particular, there is minimal variation in labor productivity as assessed by climate comfort indicators and the elevation between R-I and R-II. R-III and R-IV are influenced by oxygen, temperature, and humidity, while R-V is affected by a multitude of factors. Our findings indicate that temporal and spatial variations in meteorological conditions can result in up to a threefold difference in productivity at the same altitude in different regions. Importantly, our study provides valuable theoretical insights for engineering project management. In particular, it can be concluded that altitude is not a reliable indicator for evaluating labor productivity in high-altitude construction.

1. Introduction

Hydropower, as an environmentally friendly and renewable energy source, has the potential to meet the growing global energy demand while mitigating the adverse environmental impacts associated with fossil fuel-based energy generation. Hydropower is widely recognized as a leading sustainable energy solution [1]. Many countries are investing in hydropower to achieve climate change-related environmental goals, including carbon neutrality and carbon peak [2,3,4]. However, this investment presents a challenge in accurately estimating costs, which is heavily dependent on the level of construction labor, particularly in projects with extended construction cycles and substantial investments. Consequently, a comprehensive investigation of labor productivity in the field of hydroelectric engineering construction is of paramount importance.
Labor productivity represents a fundamental metric that influences numerous critical aspects of construction endeavors, including financial aspects such as budgeting, estimation, and scheduling. Consequently, labor productivity exerts a substantial influence over the ultimate financial viability of construction projects [5]. The topic of labor productivity in the construction industry has been a subject of considerable interest over the past two decades [6], particularly in the context of identifying the factors that influence labor productivity. Some studies have indicated that the composition of the workforce itself is a crucial factor in determining labor productivity [7]. Subjectively, labor productivity also varies depending on individual differences. In general, experienced and skilled employees or healthier individuals typically complete tasks more efficiently. Moreover, some studies have concentrated on psychological factors, such as management and motivation. For instance, effective organizational structures and appropriate incentives can reduce confusion and enhance work motivation and efficiency [8]. In addition, the role of equipment technology in influencing labor productivity is of great significance. The use of advanced tools and equipment can result in a notable increase in productivity [9]. Moreover, numerous scholars have also focused on the environmental impact on labor productivity. For instance, Li et al. [10] have demonstrated that high-temperature environments impose heat stress on the human body and decrease labor productivity in the construction industry. Larsson et al. [11] demonstrated that precipitation and wind speed also increase the risk of worker accidents, with precipitation potentially reducing labor productivity by up to 40%. In comparison to other factors influencing labor productivity, environmental factors are objectively present and may require further investigation. This is because the impact of environmental factors is relatively consistent, particularly in specialized environments where the impact of environmental factors is more pronounced.
In China, there are the most extensive hydropower resources, with more than half of the hydropower potential remaining untapped. A significant portion of this potential is concentrated in the southwestern region. These regions are characterized by high altitudes and complex climatic environments, which present significant challenges to the detailed assessment of labor productivity. In previous studies, altitude, or oxygen content, has been the predominant index for assessing labor productivity. For example, the regulations established by the Chinese Hydropower Construction Quota (CHCQ) stipulate that for every 1000 m increase in elevation, the estimated labor productivity for hydropower projects should decrease by 10%. Guo and Wu et al. [12,13] employed an air density or equivalent partial pressure of inspiratory oxygen (PIO2) as a reference point, with the aim of elucidating the critical altitudinal thresholds that exert a discernible influence on labor productivity or health in high-altitude terrains. Their studies tried to establish the intricate relationship between oxygen concentration and altitude. It is important to note that the oxygen content, both relative and absolute, within high-altitude regions is subject to a multitude of complex influences that extend beyond mere altitude considerations. A number of variables, including atmospheric temperature and vegetative cover, contribute to the complex dynamics of oxygen content [14]. Furthermore, some researchers have attempted to apply machine learning techniques to model labor productivity in specific high-altitude regions, which primarily involved identifying the factors affecting labor productivity in particular regions or exploring trends in productivity variations [15,16]. These insights underscore the inherent limitations of considering altitude or oxygen levels as singular determinants. Therefore, it is crucial to acknowledge that these studies offer limited applicability as references for investment management strategies in hydropower projects located in diverse river basins or under varying climatic conditions. Moreover, historical research has unequivocally demonstrated a direct correlation between labor productivity and environmental parameters [17,18,19]. It is widely acknowledged that environmental comfort plays a pivotal role in influencing labor productivity. In environments that are conducive to comfort, employees experience heightened levels of contentment and exhibit enhanced work efficiency. Conversely, employees in uncomfortable environments are compelled to exert additional effort to cope with the discomfort, which diverts their attention and consequently leads to a decline in labor productivity [20,21].
In order to gain a more comprehensive understanding of the impact of meteorological changes on labor productivity in high-altitude hydropower projects in Southwest China, it is necessary to undertake further research. This study employs the Climate Comfort Index (CCI) to holistically assess the impact of climate variations on labor productivity. The CCI integrates numerous pertinent variables, including temperature, relative humidity, and wind speed, to comprehensively evaluate their influence on human perception and experience [22,23]. By analyzing the climate comfort of high-altitude areas in southwestern China, we can gain a deeper understanding of the key determinants of productivity in different regions and help clarify the differences in labor productivity in different regions. A more detailed and scientific perspective on the impact of labor productivity in high-altitude areas ultimately facilitates the improvement of engineering management decisions in these areas.

2. Research Area and Methods

2.1. Research Area and Data Source

2.1.1. Research Area

The present study selected Yunnan Province, Sichuan Province, and Tibet in southwestern China as research areas due to their substantial untapped water resources (Figure 1). To ensure the relevance of our data, we established specific criteria for station selection. Firstly, the selected stations are located at altitudes exceeding 1500 m, in accordance with international altitude standards. Secondly, in alignment with the hydropower projects, all stations are situated in proximity to the rivers. Consequently, a total of 55 stations were selected and distributed as follows: 22 stations were located in Sichuan, 12 in Yunnan, and 21 in Tibet.

2.1.2. Data Source

The meteorological data set utilized in this study was sourced from the National Meteorological Information Center of China (accessed on 18 December 2021, http://data.cma.cn) [24]. The data set was primarily utilized in monthly form, spanning from January 2000 to December 2020. Variables included in the data set were average temperature, average relative humidity, 2 min average wind speed, sunshine duration, average air pressure, and average vapor water pressure, among others. To ensure data consistency and completeness, interpolation techniques were employed to estimate missing data points.

2.2. Methods

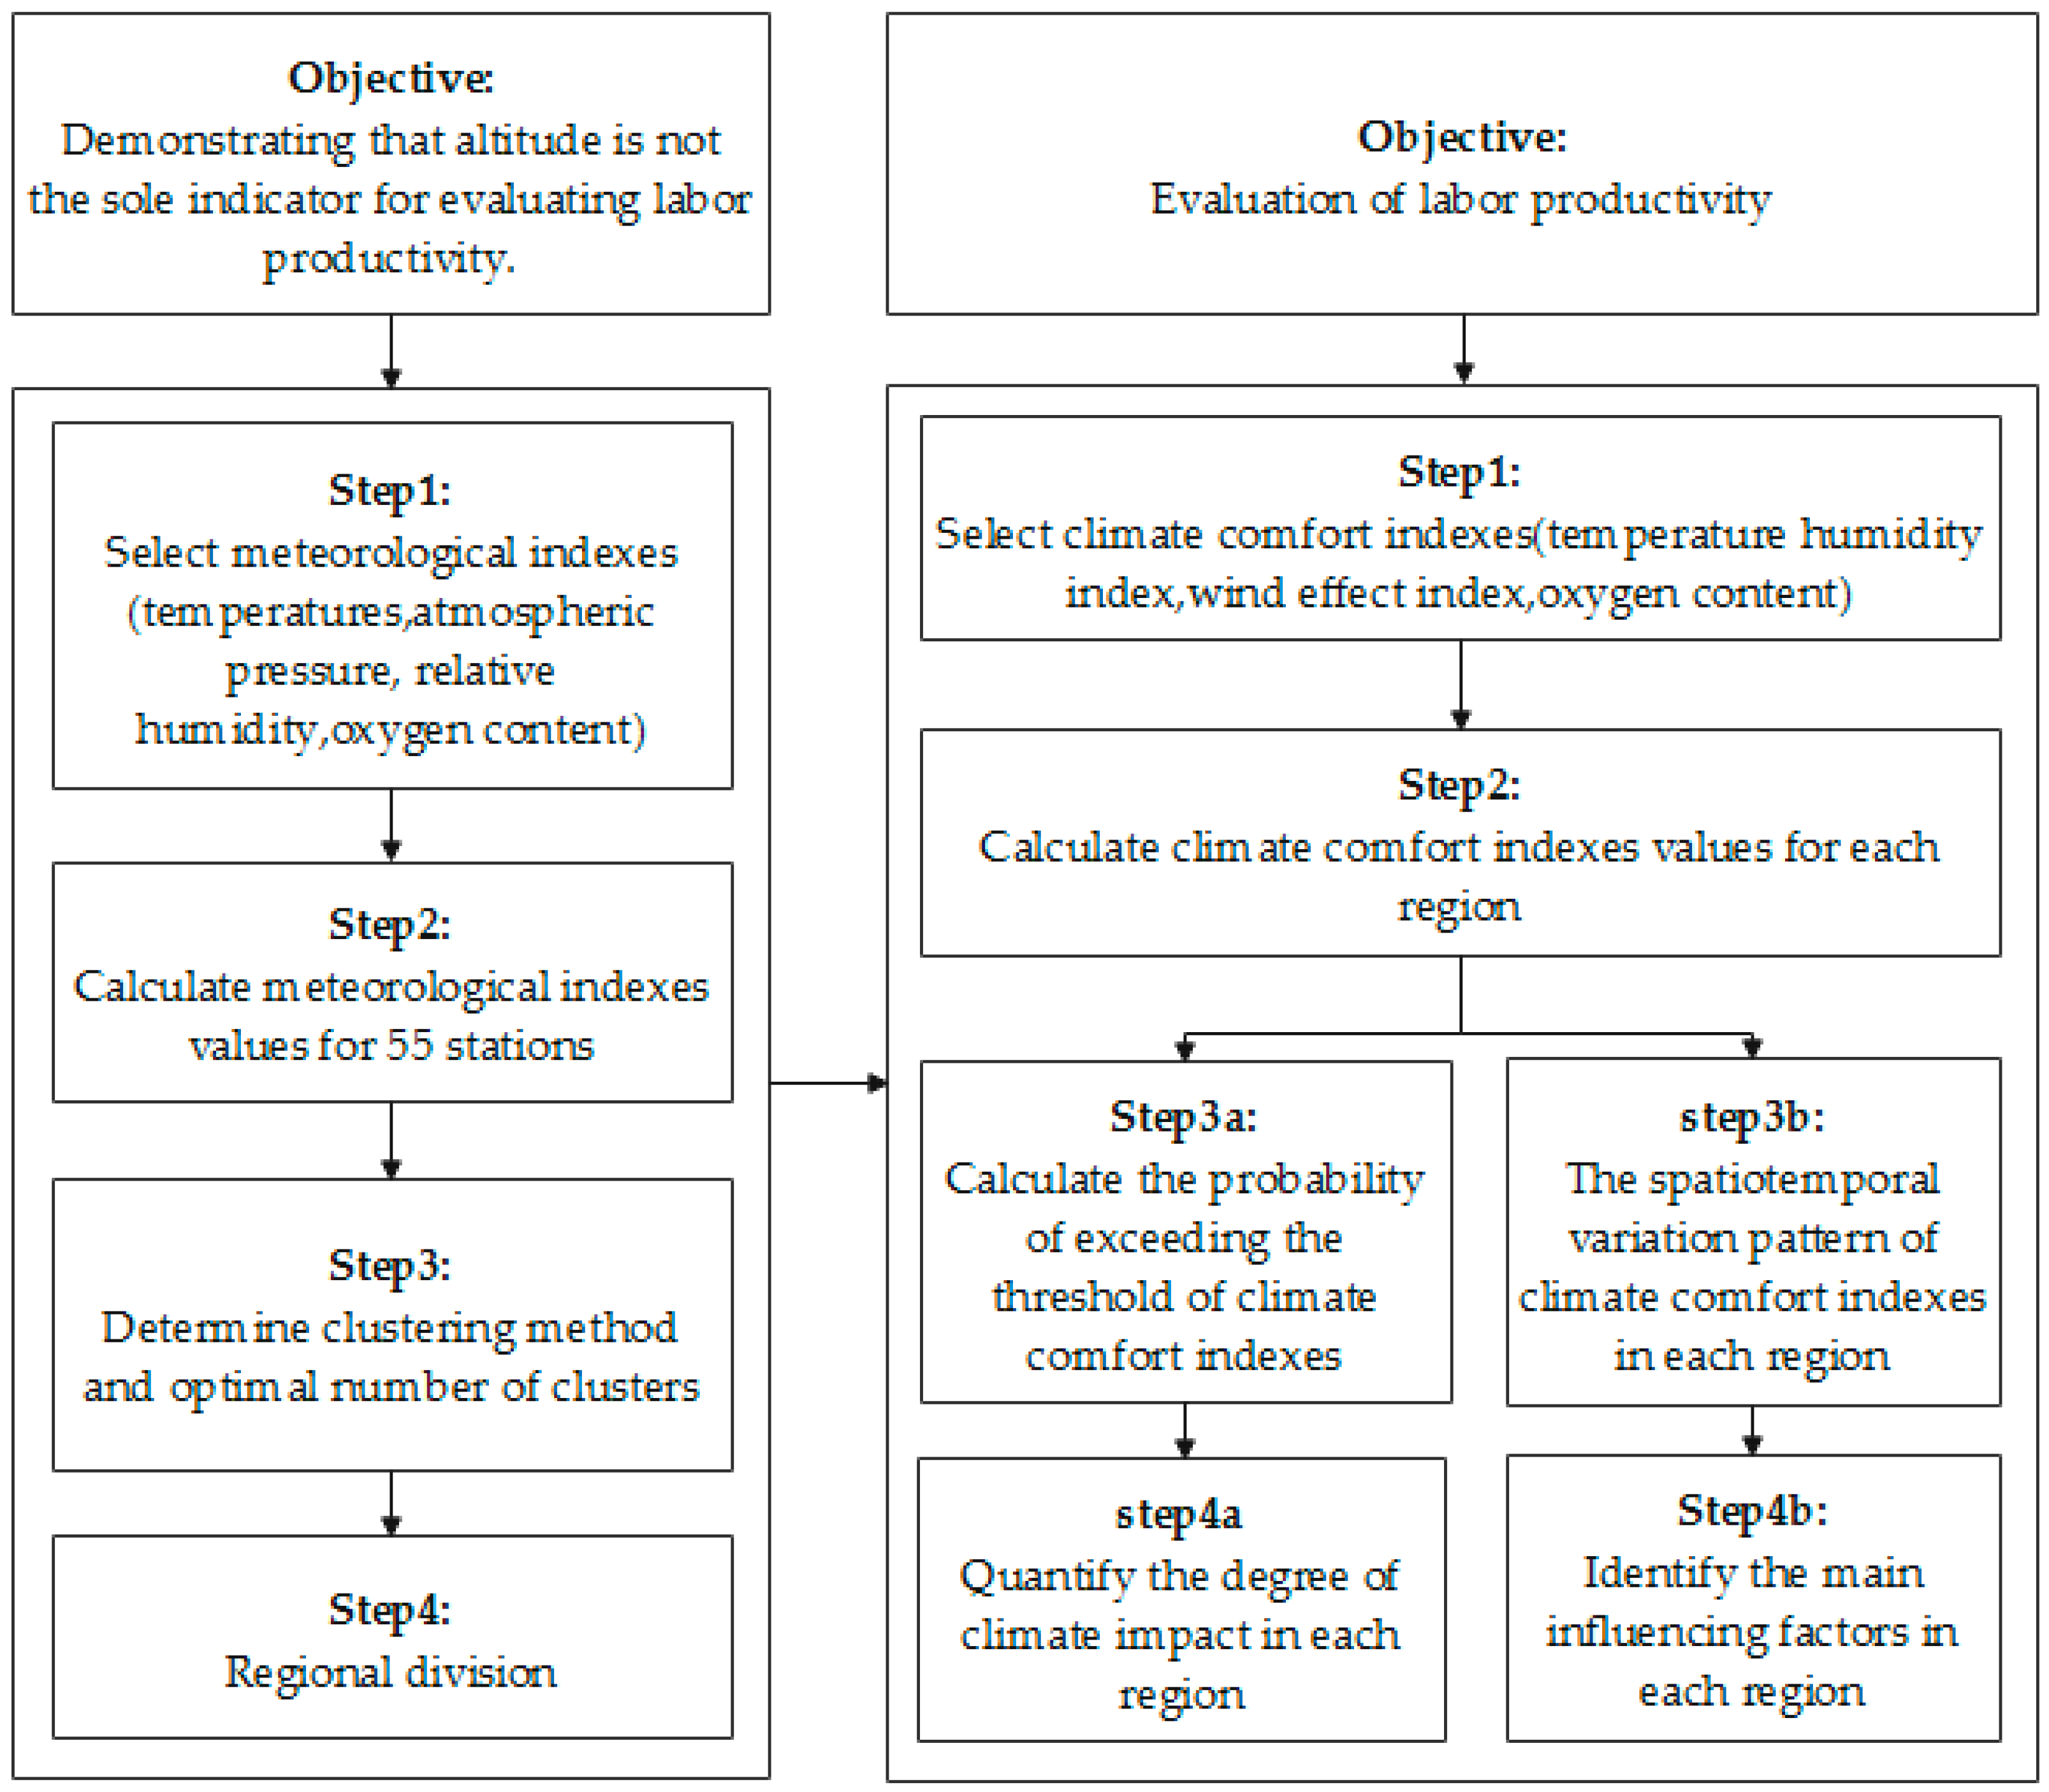
The method encompasses several key aspects, which are as follows: Firstly, the K-means clustering method was employed to categorize meteorological stations situated in high-altitude regions into similar climate clusters. Secondly, we conducted a spatiotemporal analysis of the variations in labor productivity in high-altitude areas based on the CCI. Finally, we proceeded to examine the impact in greater detail across different regions by quantifying the probability of the CCI. A flowchart illustrating the methodology for evaluating the impact of labor productivity in different regions through the CCI assessment is presented in Figure 2.

2.2.1. Cluster Analysis of Stations

K-Means Cluster

Cluster analysis is a formal method used to group unlabeled patterns based on inherent similarities among them. Clustering algorithms can be broadly categorized into two types: hierarchical and partitioning. In contrast to hierarchical algorithms, partitioning algorithms allocate data to any hierarchical K-class structure by optimizing some criterion functions, which is more suitable for use in pattern recognition [25]. In recent years, partition clustering algorithms have gained traction in climate partitioning studies, with the objective of assigning regions with similar climate characteristics to the same cluster [26,27]. Among these methods, the K-means algorithm stands out as the most popular partition clustering technique due to its efficiency and empirical success [28]. In the present study, the K-means algorithm was employed to cluster high-altitude stations within the research area.
The station clustering methodology employed in this study was based on the primary drivers of meteorological change in high-altitude regions. Numerous studies have demonstrated that atmospheric pressure declines with increasing altitude, and the resulting oxygen deficiency due to low atmospheric pressure is a significant contributing factor to mountain sickness [12,13]. Consequently, atmospheric pressure was selected as the initial clustering index. Furthermore, temperature, which has a significant impact on human function, especially in high-altitude regions with lower temperatures than plain areas, served as our second clustering index [15]. In addition, relative humidity, which has been identified as a crucial consideration in prior research on work efficiency in high-altitude areas, was utilized as our third important clustering indicator [16]. Finally, the most critical index is oxygen content (OC), as hypoxia is the fundamental factor affecting human function in high-altitude areas and can pose severe risks to human safety [13]. Consequently, we elected to utilize air oxygen content as a distinct clustering index. The OC was calculated based on data from Lhasa City, a renowned plateau city in China [29]:
O C = 80.67 273 + t ( P e )
where t is Celsius temperature (°C), P is atmospheric pressure (hPa), and e is vapor pressure (hPa).
The K-means clustering algorithm utilized in this research operates as follows:
Calculate the annual average values of atmospheric pressure, temperature, relative humidity, and air oxygen content of 55 stations as the input values for clustering, and make any station i a point xi in the four-dimensional space. Then, all stations will be divided into K groups with similar climates, where mk denotes the center of group csj and j denotes the index of groups. The squared error formula of the points in group csj and the center of group csj is defined as Equation (2):
S E c s j = s t a t i o n i c s j x i m j 2
The goal of K-means is to minimize the sum of squared errors for all groups. The calculation is as follows:
S E = j = 1 K s t a t i o n i c s j x i m j 2
In order to achieve the aforementioned objectives, the following algorithmic steps are iterated: Step 1: Randomly select K points as the central point of K groups. Step 2: Calculate the Euclidean distance from each point to all cluster centers, and assign the cluster center that is closest to the Euclidean distance until all points have been assigned. Step 3: Calculate the mean of all points in each class and use this value as the new center of the group. Step 4: Repeat Steps 2 and 3 until the members and centers of each group have stabilized. Finally, all stations are divided into K groups.

The Optimal Number of Clusters

As all the stations to be grouped are unlabeled prior to clustering, determining the appropriate number of clusters (K) is of paramount importance [30]. To assess the quality of the resulting partitions, two common validation criteria are employed: external clustering validation and internal clustering validation [31]. As external validation measures are based on the assumption of the “true” cluster number, they are primarily employed for selecting an optimal clustering algorithm on a specific data set. In contrast, internal validation measures rely solely on the information present in the data [32]. The silhouette coefficient (SC) is a well-known internal validation index for evaluating cluster validity [31]. To assess the suitability of the selected K for clustering, the SC is introduced as a means of enhancing the accuracy and stability of the K-means algorithm [33]. The calculation method for SC is as follows [27]:
S i = b i a i m a x a i , b i
where si represents the SC of sample point xi, ai indicates the average dissimilarity distance between the i-th sample point and its assigned cluster, and bi represents the lowest dissimilarity distance between the i-th sample point and any other cluster except for its assigned cluster.
For a given clustering of a data set, the SC Sk is defined as follows:
S k = 1 n i = 1 n s i
where n is the number of samples in the data set, and k is the number of clusters. The range of values for the average SC Sk is 1 S k 1 .
The larger the value, the greater the degree of cluster separation. In order to determine the optimal number of clusters (K), the SC is calculated for different values of K, and the K that corresponds to the maximum mean silhouette coefficient is selected, indicating the best cluster separation. We employed analysis of variance (ANOVA) to conduct a significance test on the altitude distribution across different regions.

2.2.2. Evaluation of Labor Productivity

Selecting the Climate Comfort Index

In order to ascertain the impact of environmental changes on labor productivity in high-altitude areas, it was necessary to select the most appropriate CCI. CCI is classified as either “empirical” or “rational” [34] and has been a prominent topic in the literature for the past century. The category of “empirical indexes” encompasses subjective assessments and considerations of physiological reactions, including metrics such as Effective Temperature (ET), Temperature Humidity Index (THI), and Wind Effect Index (WEI) [35]. On the other hand, “rational indexes/models” encompass measures such as Predicted Mean Vote-Predicted Percent Dissatisfied (PMV-PPD) [36], Physiological Equivalent Temperature (PET) [37], and Universal Thermal Climate Index (UTCI) [38]. The selection of these indexes is primarily driven by considerations of the sensory experience of tourists and the availability of data. In this study, we selected the Temperature Humidity Index (THI), Wind Efficiency Index (WEI), and Oxygen Content (OC) as the most appropriate indices to represent the specific climatic conditions prevalent in high-altitude areas. The OC is calculated according to Formula (1). Among these indexes, the THI is the primary index for human perception of climate, which reflects the heat exchange between the human body and the surrounding environment, considering both temperature and humidity. Thus, the THI is calculated as follows [39]:
T H I = 1.8 t + 32 0.55 1 f 1.8 t 26
where t is the Celsius temperature (°C) and f is the relative humidity (%).
WEI evolved from the wind cold index (WCI), which is defined as:
W C I = 33 t 9.0 + 10.9 V V
WCI indicates the impact of wind speed and air temperature on the bare human body in different environments. The physical meaning refers to the heat dissipation per unit area of the body surface when the temperature is 33 °C. However, the WEI considers both the heat dissipation of the body surface and the heat gain of the body after solar radiation, which is the heat exchange rate of the body surface area [40] and might be more suitable for climate characteristics in high-altitude areas. The WEI is calculated as follows [41]:
W E I = ( 10 V + 10.45 V ) ( 33 t ) + 8.55 s
where t is the Celsius temperature (°C), V is the wind speed (m/s), and s is the number of sunshine hours (h/d) in both formulas above.

Process for Evaluating Labor Productivity

In this study, the probability of exceeding the comfort threshold was introduced as a means of evaluating the decline in labor productivity caused by meteorological change while working in high-altitude areas throughout the year. It was notable that the quantitative correlation between labor productivity and CCI was not considered. We hypothesized that the reduction in labor productivity was primarily linked to whether the CCI surpassed specific thresholds or physiological limitations. When these thresholds were exceeded, labor productivity decreased as individuals’ work capacity diminished [42]. However, the extent of the decline in labor productivity remained consistent regardless of the magnitude of the threshold exceedance. Given the considerable variability in the level of discomfort experienced by individuals, which is influenced by gender, age, and the nature of the tasks performed [43,44], it is important to consider the potential impact of these factors on the relationship between comfort and labor productivity. To date, no relevant research has provided a quantitative relationship between comfort and labor productivity. Accordingly, the process for evaluating labor productivity was as follows:
Firstly, we calculated the corresponding CCI (THI, WEI, and OC) based on the monthly average data of various meteorological parameters at 55 stations spanning from 2000 to 2020.
Subsequently, the comfort probability of each region associated with a specific indicator was determined by dividing the number of months within the comfort range by the total number of months as follows:
P l a b o r i , j = W i j Z i j × 100 %
where i represents the i-th region, j represents the j-th climate index (i.e., THI, WEI, and OC), Plabor(i, j) represents the ratio of the number of months in the i-th region where the j-th index exceeds the threshold to the total number of months, Wij represents the number of months in the i-th region where the j-th index exceeds the threshold, and Zij denotes the total number of months in the i-th region where the j-th index surpasses the threshold over a 20-year period. Specifically, we define these threshold exceedances as follows: THI < 45, WEI > −800, and OC > 206.5 (based on physiological considerations, where a 12% oxygen concentration is the critical threshold for occupational health, as shown in Table 1). Based on these assumptions, Plabor(i, j) represents the probability of discomfort within a specific area throughout the year and can also serve as an indicator of the degree to which labor productivity is affected. However, it is important to acknowledge that our approach does not provide a quantitative relationship between comfort and labor productivity. Therefore, we recommend caution when attempting to calculate labor productivity without considering this quantitative relationship.

3. Results and Discussion

3.1. Cluster Stations and Altitude Analysis

The silhouette coefficient evaluation was employed to identify the optimal number of clusters, which was found to be five. The k-means algorithm was then utilized to divide the stations into these five groups according to their meteorological indexes. The clustering results revealed that there were 10, 11, 12, 14, and 8 stations from Region I to Region V (R-I to R-V), respectively (Table 2). A further analysis revealed that 80% of the stations in R-I and R-II were located in Yunnan, while over 85% of the stations in R-IV and R-V were situated in Tibet. The stations in Sichuan were distributed across all regions, from R-I to R-V. Furthermore, notable discrepancies were observed in the altitude ranges across these regions (p < 0.001). Specifically, the altitude range in R-I was 1500–2200 m, 2100–2700 m in R-II, and 4000–4600 m in R-V, respectively. The altitude ranges in R-III and R-IV were notably wider, spanning from 2600 m to 3600 m and 2800 m to 3900 m, respectively.
Moreover, there was a clear upward trend in the altitude of the stations from R-I to R-V. It was noteworthy that some stations have similar elevations in different regions. For instance, the altitudes of Zhaojue (R-I, h = 2134 m) and Huize (R-II, h = 2190 m) were similar, despite their respective categorization into R-I and R-II. Similar examples can be observed between Jiulong (R-III, h = 2931 m) and Milin (R-IV, h = 2951 m), Ganzi (R-III, h = 3395 m), and Zedang (R-IV, h = 3562 m). This phenomenon was observed to be quite common between R-III and R-IV, although the mean altitude of R-IV was higher. In fact, more than 70% of the stations in R-III have higher elevations than that of the Milin in R-IV.

3.2. The Spatiotemporal Variations in Climate Comfort

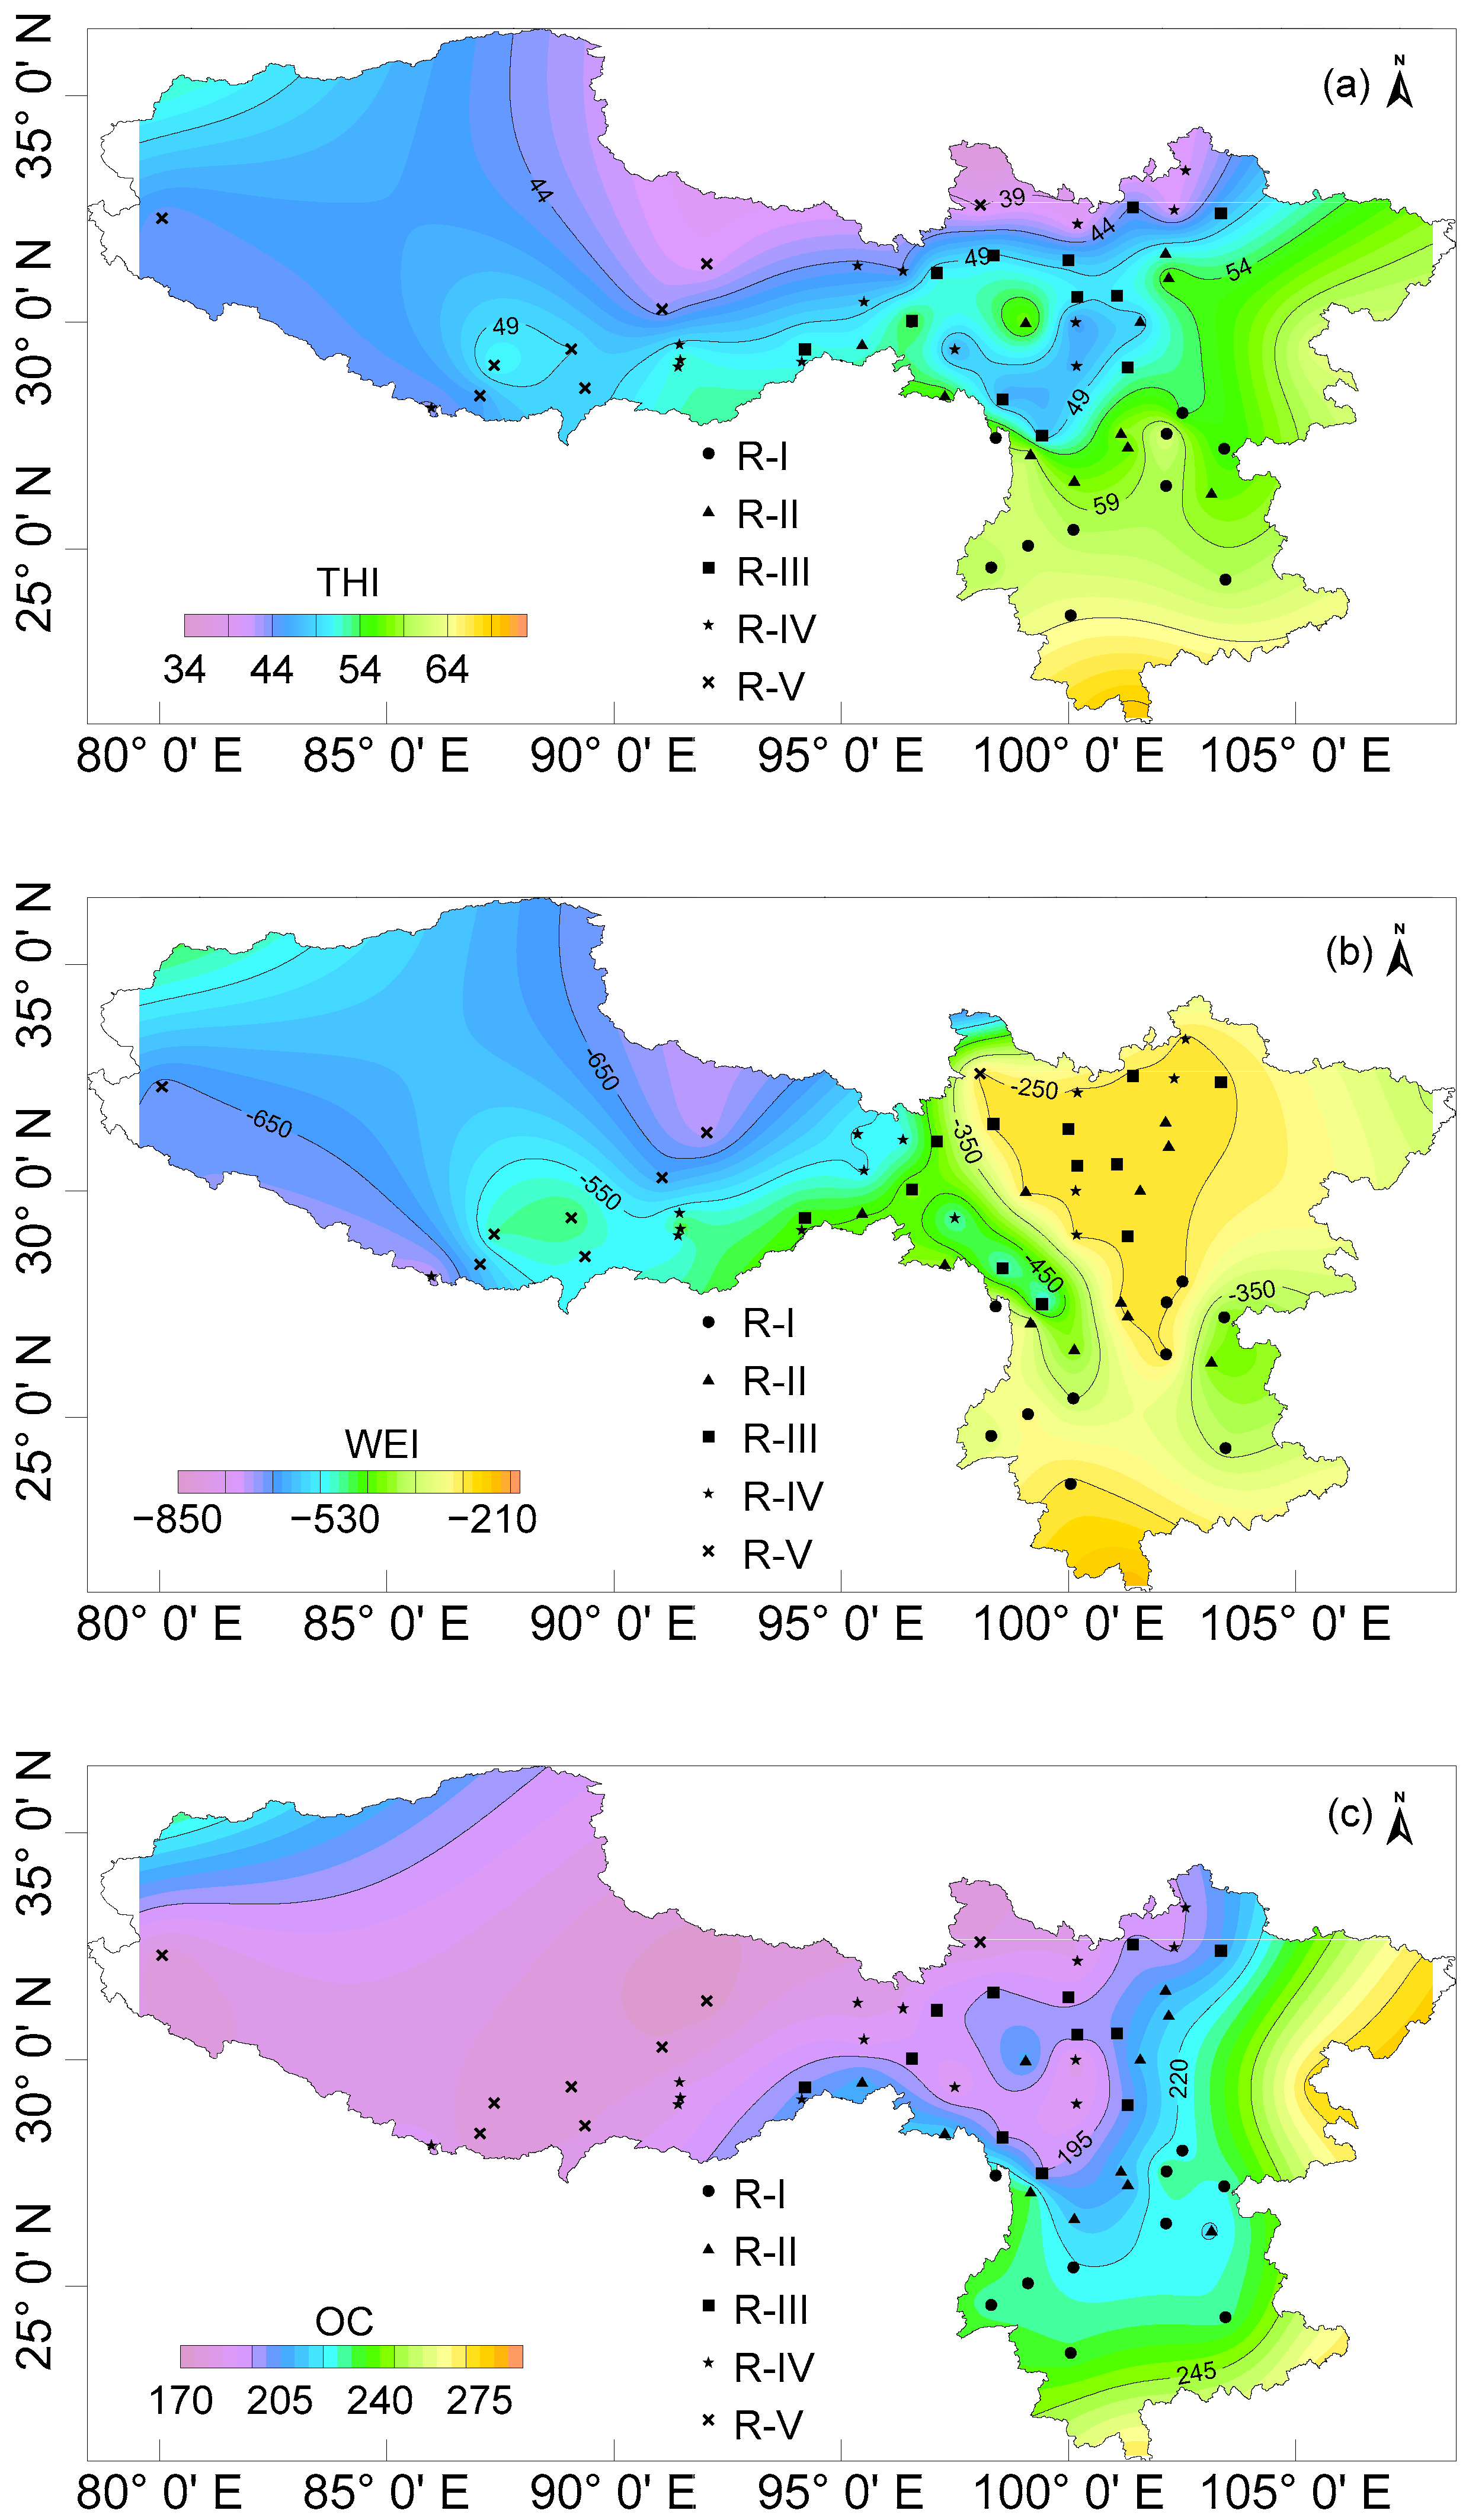
This study calculated the monthly CCI for 55 stations from 2000 to 2020 and employed Kriging interpolation to calculate the spatial distribution of various CCIs (Figure 3). The results indicated the presence of pronounced spatial clustering patterns of climate comfort within the research area, with a gradual decrease in these patterns from southeast to northwest. This trend was consistent with numerous studies on the spatial distribution of climate comfort in China [23,40,46]. Specifically, the THI was generally higher in the southwestern regions of Yunnan and Sichuan (Figure 3a), almost within the comfortable range. Conversely, the THI was noted to be lower in the Tibetan region and the border areas of the three provinces, approaching the lower limit of the uncomfortable range. The WEI was observed to be higher in the southern region of Yunnan and the central and western regions of Sichuan. A gradual decrease in the WEI was observed from west to east in Tibet, especially in the northwest and southeast (Figure 3b). However, it was evident that there were fewer areas with low oxygen levels (i.e., uncomfortable areas) by WEI, with the majority of these areas located within the Tibetan region. The oxygen content of the air exhibited notable disparities, with higher oxygen content observed in the southern region of Yunnan and the eastern portion of Sichuan, approaching the upper limits of comfort (Figure 3c). In contrast, Tibet exhibited clearly lower oxygen content and a pronounced hypoxic state.
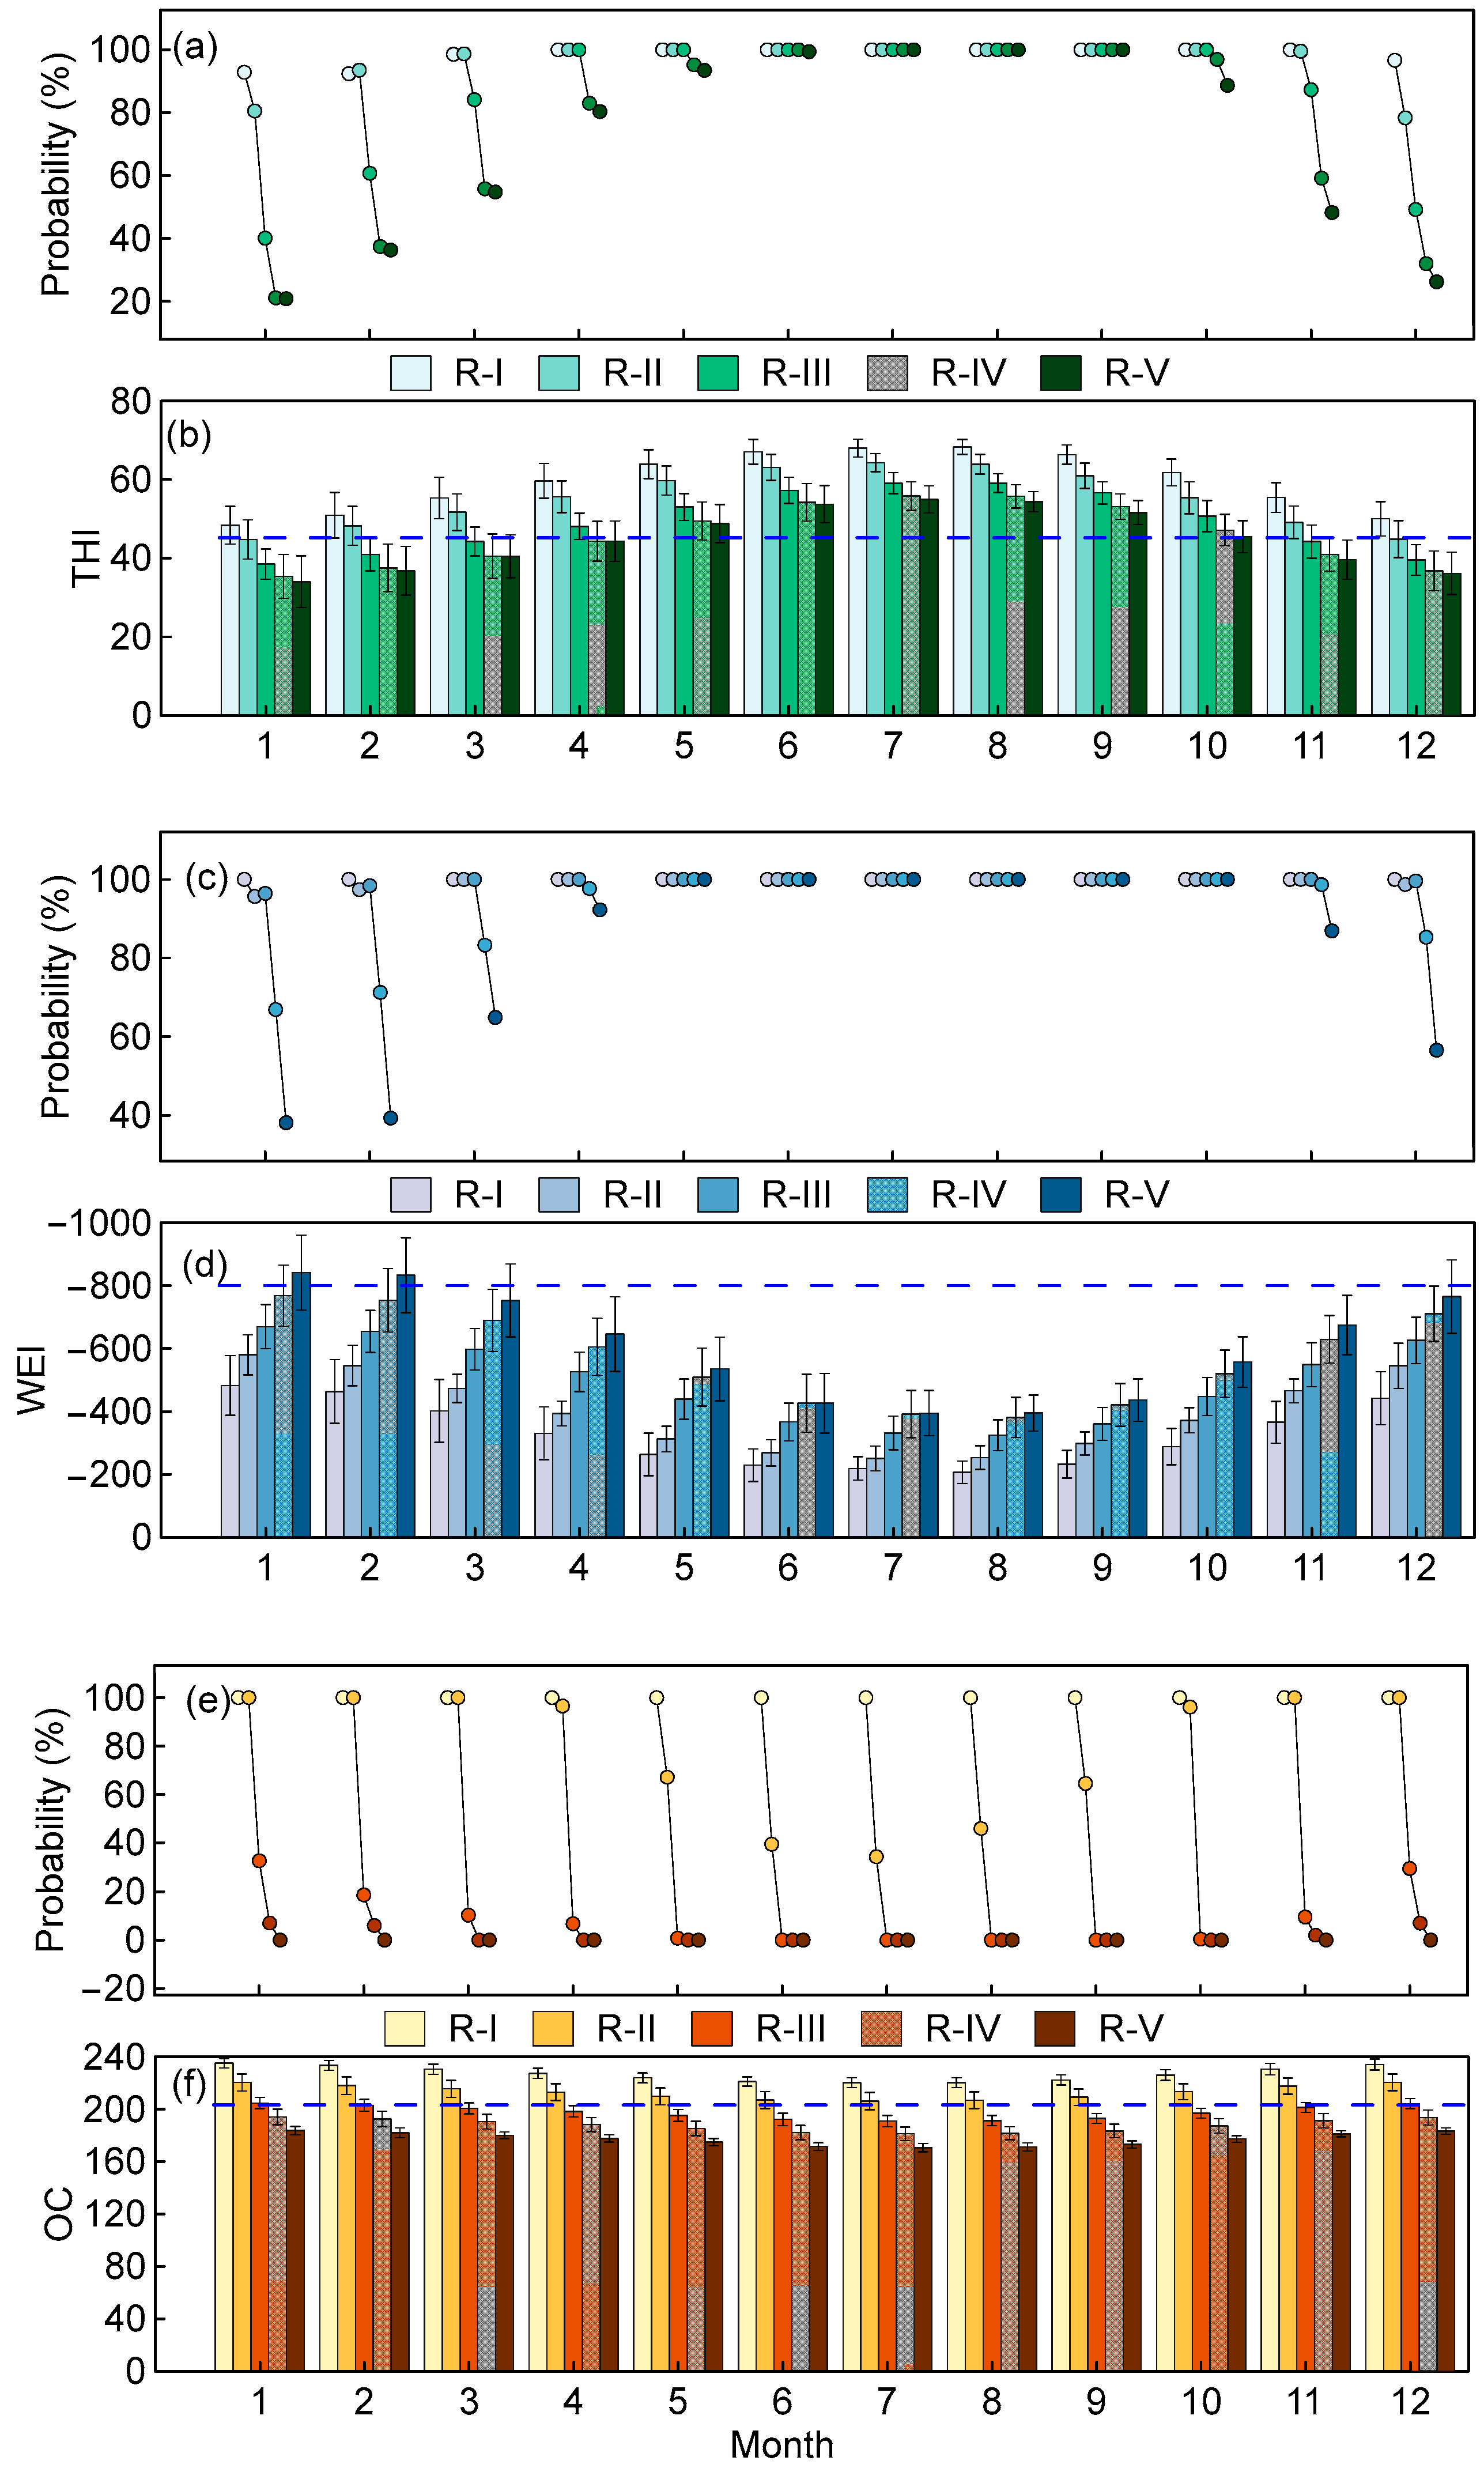
The THI, WEI, and OC data exhibited clear temporal variations in the five regions (Figure 4). The OC showed a clear U-shaped monthly trend, with a decline from January to May, an increase from September to December, and a nadir from June to August. Conversely, the THI and WEI exhibited analogous patterns, both displaying an inverted U-shaped trend. This trend was characterized by a gradual increase from January to July and a subsequent decrease after reaching its peak in July. Considering the comfort threshold, the THI in all five regions remained within the comfortable range throughout the summer months (June to September). In the other months, only R-I and R-II were within the comfort range. Similarly, the WEI was within the comfort range, with the exception of winter (December to March of the following year) in R-IV and R-V. The OC revealed that R-I exhibited relatively favorable oxygen environmental comfort throughout the entire year. The R-II region exhibited comfortable oxygen conditions from November to April of the following year, while other regions remained in suboptimal low-oxygen environments throughout the year.

3.3. The Impact of CCI on Labor Productivity in Different Regions

The descriptive statistics of CCI in the five regions demonstrated that nearly all indexes in R-I achieved complete comfort, with only a 1.6% probability that THI fell below the threshold (Table 3). In R-II, the probability of hypoxia was 21.4% throughout the entire year. In contrast, R-III, R-IV, and R-V exhibited more pronounced probabilities of hypoxia, reaching 91.0%, 98.2%, and 100%, respectively. With regard to THI, the probability of discomfort in R-II is only 4.1%, while there is a clear decrease in R-III to R-V, with the probability of discomfort reaching 26.6% and 29.3% in R-IV and R-V, respectively. The probability of discomfort in WEI did not exhibit a clear decline from R-I to R-III, except for R-IV and R-V, where a reduction of approximately 10% was observed.
The OC exerted the most influential factor on labor productivity in these regions, as evidenced by the fact that over 80% of stations experienced hypoxia. As previously emphasized in studies, the impact of oxygen on labor productivity is crucial [12,13,47]. However, the human body’s inherent adaptability enabled the mitigation of hypoxia through physiological compensatory responses [47], thereby ameliorating the decline in work capacity experienced, such as in the R-II. In contrast, due to the impact of severe hypoxia on blood oxygen saturation, workers in R-III to R-V may experience prolonged reaction times, increased energy consumption, and work fatigue, as well as potential effects on vision, hearing, and attention [13,48]. These differences cannot be compensated for through physiological compensation, which leads to a more pronounced impact on labor productivity in these regions.
The THI index clearly demonstrated that fluctuations in temperature and humidity had a negative impact on the workforce. For instance, low temperatures can lead to a decline in physical and cognitive functions, which in turn can result in a decrease in labor productivity. In terms of physical effects, low temperatures manifested as joint stiffness and a reduction in muscle activity. In terms of cognitive effects, low temperatures resulted in distraction, an increase in task response times, and a decrease in accuracy [48,49]. While appropriate attire can mitigate the impact of low temperatures on the body and maintain normal work ability [50], heavy clothing can increase operational burden, limit motion range, and reduce operational flexibility [51,52]. In addition, an imbalance in humidity could disrupt the body’s evaporative cooling mechanism [53], leading to increased water loss [54]. In the event that the body’s water intake is unable to compensate for this loss, cognitive ability and health will be directly impaired, thereby affecting work ability [55]. In this study, the R-V, with the majority of its stations situated in Tibet, particularly in the Ngari area, which is characterized by low surface vegetation coverage, relatively dry air, high wind speeds, and excessive solar radiation, was found to be greatly affected by WEI. These harsh conditions have been demonstrated to have a deleterious impact on human comfort, potentially causing skin and eye discomfort and immune system disruption, which ultimately affects labor productivity [40,56].
As evident in Figure 4a,c,e, there were clear temporal differences in discomfort across different regions. For example, the probability of discomfort due to THI in Region IV decreased by approximately 40% from January to March compared to Region III and decreased by approximately 35% from November to December. Concomitantly, the probability of discomfort due to WEI decreased by approximately 30% in January and February and by approximately 15% in March and December. The observed change in OC over the course of the following year was approximately 70% from November to February of the following year. The probability of discomfort associated with THI in Region V decreases by approximately 20% to 30% compared to Region IV from February to April and from November to December. In the case of WEI, a decline of approximately 40% was observed in January, February, and December, while a reduction of approximately 2% was noted in March.
It is evident that the spatiotemporal changes in climate comfort have a considerable impact on labor productivity in high-altitude areas. The R-I and R-II were less affected by OC and may, therefore, have been more conducive to work. Conversely, for R-III and R-V, in addition to hypoxia, other climatic factors must be considered. With regard to the provinces, the impact on labor productivity was more pronounced in Tibet, while the influence in Yunnan and northern Sichuan was relatively modest. In terms of temporality, the OC in winter was demonstrably higher than in other seasons, while THI and WEI were clearly reduced, indicating that other measures could be taken to compensate for the differences between seasons. Similarly, in summer, OC showed a downward trend, while THI and WEI exhibited higher values than in other seasons. Consequently, it is evident that further attention is required to assess the impact of the OC decline on labor productivity.

3.4. Altitude and Climate Comfort in Altitude in Assessing Labor Productivity

Previous studies have primarily focused on altitude as the key determinant of labor productivity differences in high-altitude areas [57]. For example, research on labor productivity in such regions has shown that the critical altitude threshold is 2500 m [12]. The clustering results indicated that R-I and R-II, which exhibited minimal influence from climate comfort, had more than 80% of their stations situated at altitudes below 2100 m. This finding aligned with previous research on critical altitudes, but when it came to labor productivity in higher-altitude regions (from R-III to R-IV), altitude variations were not the only consideration. This was mainly due to the fact that OC variations differed in different altitude regions. Although it was generally accepted that OC decreased with increasing altitude [12,46], altitude was not the absolute dominant factor for OC in high-altitude areas. For instance, temperature and vegetation coverage contributed up to 35% to OC, which was not clearly different from the contribution of altitude (47%) [14]. Among these factors, the contribution of vegetation coverage was particularly evident due to its influence on oxygen production, driven by variations in vegetation types and spatial distribution [58]. Sichuan Province, which is mainly covered by forests and has a subtropical climate with abundant water and heat resources, had higher oxygen production than Tibet, which is primarily composed of grasslands and alpine vegetation [59]. Furthermore, the Chinese government report indicated that the forest coverage rate in Ganzi Prefecture (Sichuan Province) was 35.26%, while the comprehensive vegetation coverage rate of grasslands was 85.13%. In contrast, Zedang (Tibet) had a forest coverage rate of only 14.01%. This report could explain the differences between Ganzi (R-III, 3395 m) and Zedang (R-IV, 3562 m) and why they had similar altitudes but were located in different regions. Another important factor leading to this result could be the latitude [46,60]. At higher latitudes, the duration of direct sunlight is shorter, and the ground absorbs less heat, leading to lower temperatures. Therefore, meteorological conditions may be more favorable at lower latitudes, particularly in terms of higher temperatures.
This study further compared the differences in labor productivity evaluation, considering meteorological changes, with traditional assessment methods. According to existing Chinese traditional standards, it was estimated that labor productivity would decrease by 10% when the altitude exceeded 2500 m, and for every 500 m increase in altitude, labor productivity would further decrease by 5%. However, it is important to note that assessing labor productivity based solely on altitude is not sufficient, as stations with similar altitudes may experience different climatic environments. For instance, Zedang in R-VI and Ganzi in R-III are two stations with similar altitudes but distinct climatic environments. However, estimating the spatial differences in labor productivity based on CCI indicates that the difference in OC between R-III and R-VI could be as high as 79.6%, while the difference in WEI reached 7.65%, which implied that the difference between Zedang and Ganzi could be as much as 80%. Furthermore, when temporal variation is taken into account, the difference in labor productivity between individuals working in Ganzi and Zedang in February could be as high as 70% due to the influence of OC. In other words, for stations with the same altitude, considering altitude alone as a criterion for assessing efficiency was far from sufficient. If the spatial (80%) and temporal (70%) heterogeneity of meteorological changes are comprehensively considered, the productivity difference can be up to three times greater (1.8*1.7 = 3.06) at the same altitude in different regions. The assessment results for labor productivity using the two methods exhibited notable differences, indicating that an assessment approach that integrates environmental factors may be more comprehensive and effective. Consequently, we strongly recommend that variations in environmental factors be taken into account when assessing labor productivity in high-altitude areas.

4. Limitations and Implications

It is noteworthy that there are limitations in the meteorological data set in this study. Although a 20-year period of monthly data was used, temporal accuracy may be constrained, for instance, on a daily scale. Additionally, the spatial data were processed using interpolation methods, which may result in similarly constrained generalizability and applicability in certain regions. Furthermore, this study assumes that labor productivity declines only when the CCI exceeds a certain threshold and that the extent of the decline is independent of the degree to which the threshold is exceeded. This assumption may not fully reflect the actual situation, as the level of discomfort experienced by an individual may vary depending on factors such as gender, age, and the nature of the tasks performed. Moreover, we have also considered only the qualitative effects of changes in meteorological factors on labor productivity. The quantitative expression of this relationship has not yet been explored, especially the extent to which environmental variables affect labor productivity at high altitudes. Accurately evaluating labor productivity at high altitudes, therefore, calls for higher spatiotemporal resolution data and substantial in situ measurements.
Nevertheless, as the first time in the region that climate comfort is used to evaluate labor productivity, this study reveals the impact of meteorological factors on the spatial and temporal variation in labor productivity at high altitudes and the extent of their potential influence. This highlights the necessity of adopting meteorological conditions in evaluating labor productivity at high altitudes to accurately achieve investment prognosis.

5. Conclusions

This study employs the climate comfort index to holistically assess the impact of climate variation on labor productivity in the high-altitude regions of southwest China and identifies the main factors affecting labor productivity in different regions. The results show pronounced spatial clustering patterns of climate comfort. Meteorological change has a greater impact on labor productivity in Tibet than in Yunnan and northern Sichuan. In R-I and R-II, OC is the dominant factor influencing labor efficiency, while in R-III and R-IV, the effect of temperature and humidity on labor productivity should not be ignored. As for R-V, oxygen, wind speed, sunshine duration, and solar radiation, all should be fully considered. Temporally, THI and WEI have a greater impact in the winter, while OC is higher in the summer. Thus, when considering the temporal and spatial differences in the impact of meteorological changes on labor productivity in higher-altitude regions compared with traditional methods, the productivity difference can be up to three times greater. This highlights that an assessment of labor productivity in high-altitude regions based solely on altitude may not be sufficiently accurate.

Author Contributions

Conceptualization, F.J., J.L. and Q.G.; methodology, F.J.; formal analysis, Q.G.; resources, F.J.; data curation, Q.L.; writing—original draft preparation, F.J. and J.L.; writing—review and editing, F.J., J.L. and Q.G.; visualization, J.L. and Q.G.; supervision, Q.G., Q.L. and C.F. All authors have read and agreed to the published version of the manuscript.

Funding

This research was supported by the Research Fund for Excellent Dissertation of the China Three Gorges University.

Data Availability Statement

The data presented in this study are available in the National Meteorological Information Center of China at http://data.cma.cn.

Acknowledgments

The authors would like to thank Ziyue Gao who helped with collecting data. We also would like to thank the three anonymous reviewers for their constructive comments, which greatly improved the manuscript.

Conflicts of Interest

The authors declare no conflicts of interest.

Abbreviations

PIO2Partial pressure of inspiratory oxygen
CGCQChinese Hydropower Construction Quota
CCIClimate Comfort Index
ETEffective Temperature
PETPhysiological Equivalent Temperature
THITemperature Humidity Index
WEIWind Effect Index
OCOxygen Content
UTCIUniversal Thermal Climate Index
PMV-PPDPredicted Mean Vote-Predicted Percent Dissatisfied
WCIwind cold index

References

  1. Zheng, T.; Qiang, M.; Chen, W.; Xia, B.; Wang, J. An externality evaluation model for hydropower projects: A case study of the Three Gorges Project. Energy 2016, 108, 74–85. [Google Scholar] [CrossRef]
  2. Cheng, G.; Zhao, C.; Iqbal, N.; Gülmez, Ö.; Işik, H.; Kirikkaleli, D. Does energy productivity and public-private investment in energy achieve carbon neutrality target of China? J. Environ. Manag. 2021, 298, 113464. [Google Scholar] [CrossRef] [PubMed]
  3. Li, X.-Z.; Chen, Z.-J.; Fan, X.-C.; Cheng, Z.-J. Hydropower development situation and prospects in China. Renew. Sustain. Energy Rev. 2018, 82, 232–239. [Google Scholar] [CrossRef]
  4. Ni, H.; Zhao, J.; Peng, X.; Chen, G. Estimating the economic impact of large hydropower projects: A dynamic multi-regional computable general equilibrium analysis. Water Policy 2022, 24, 1343–1365. [Google Scholar] [CrossRef]
  5. Heravi, G.; Eslamdoost, E. Applying artificial neural networks for measuring and predicting construction-labor productivity. J. Constr. Eng. Manag. 2015, 141, 04015032. [Google Scholar] [CrossRef]
  6. Nasirzadeh, F.; Kabir, H.M.D.; Akbari, M.; Khosravi, A.; Nahavandi, S.; Carmichael, D.G. ANN-based prediction intervals to forecast labour productivity. Eng. Constr. Archit. Manag. 2020, 27, 2335–2351. [Google Scholar] [CrossRef]
  7. Yi, W.; Chan, A.P.C. Effects of Heat Stress on Construction Labor Productivity in Hong Kong: A Case Study of Rebar Workers. Int. J. Environ. Res. Public Health 2017, 14, 1055. [Google Scholar] [CrossRef] [PubMed]
  8. Hashiguchi, N.; Sengoku, S.; Kubota, Y.; Kitahara, S.; Lim, Y.; Kodama, K. Age-Dependent Influence of Intrinsic and Extrinsic Motivations on Construction Worker Performance. Int. J. Environ. Res. Public Health 2021, 18, 111. [Google Scholar] [CrossRef] [PubMed]
  9. Rathnayake, A.; Middleton, C. Systematic Review of the Literature on Construction Productivity. J. Constr. Eng. Manag. 2023, 149, 03123005. [Google Scholar] [CrossRef]
  10. Li, X.; Chow, K.H.; Zhu, Y.; Lin, Y. Evaluating the impacts of high-temperature outdoor working environments on construction labor productivity in China: A case study of rebar workers. Build. Environ. 2016, 95, 42–52. [Google Scholar] [CrossRef]
  11. Larsson, R.; Rudberg, M. Impact of Weather Conditions on In Situ Concrete Wall Operations Using a Simulation-Based Approach. J. Constr. Eng. Manag. 2019, 145, 05019009. [Google Scholar] [CrossRef]
  12. Guo, C.; Xu, J.; Wang, M.; Yan, T.; Yang, L.; Sun, Z. Study on oxygen supply standard for physical health of construction personnel of high-altitude tunnels. Int. J. Environ. Res. Public Health 2016, 13, 64. [Google Scholar] [CrossRef] [PubMed]
  13. Wu, P.; Yang, F.; Zheng, J.; Wei, Y. Evaluating the highway tunnel construction in western sichuan plateau considering vocational health and environment. Int. J. Environ. Res. Public Health 2019, 16, 4671. [Google Scholar] [CrossRef] [PubMed]
  14. Shi, P.; Chen, Y.; Zhang, A.; He, Y.; Gao, M.; Yang, J.; Mao, R.; Wu, J.; Ye, T.; Xiao, C.; et al. Factors contribution to oxygen concentration in Qinghai-Tibetan Plateau. Chin. Sci. Bull. 2019, 64, 715–724. [Google Scholar] [CrossRef]
  15. Guo, D.; Li, G.; Hu, N.; Hou, J. System dynamics analysis of man-machine efficacy in plateau mines. IEEE Access 2021, 9, 18072–18084. [Google Scholar] [CrossRef]
  16. Hua, N.; Huang, H.; Zhang, X. Investigating the working efficiency of typical work in high-altitude alpine metal mining areas based on a SeqGAN-GABP mixed algorithm. Adv. Civ. Eng. 2021, 2021, 9941415. [Google Scholar] [CrossRef]
  17. Pigliautile, I.; Casaccia, S.; Morresi, N.; Arnesano, M.; Pisello, A.L.; Revel, G.M. Assessing occupants’ personal attributes in relation to human perception of environmental comfort: Measurement procedure and data analysis. Build. Environ. 2020, 177, 106901. [Google Scholar] [CrossRef]
  18. Ortiz, M.A.; Kurvers, S.R.; Bluyssen, P.M. A review of comfort, health, and energy use: Understanding daily energy use and wellbeing for the development of a new approach to study comfort. Energy Build. 2017, 152, 323–335. [Google Scholar] [CrossRef]
  19. Zhao, M.; Zhu, M.; Chen, Y.; Zhang, C.; Cai, W. The uneven impacts of climate change on China’s labor productivity and economy. J. Environ. Manag. 2024, 351, 119707. [Google Scholar] [CrossRef]
  20. Bueno, A.M.; de Paula Xavier, A.A.; Broday, E.E. Evaluating the connection between thermal comfort and productivity in buildings: A systematic literature review. Buildings 2021, 11, 244. [Google Scholar] [CrossRef]
  21. Cui, W.; Cao, G.; Park, J.H.; Ouyang, Q.; Zhu, Y. Influence of indoor air temperature on human thermal comfort, motivation and performance. Build. Environ. 2013, 68, 114–122. [Google Scholar] [CrossRef]
  22. Zare, S.; Hasheminejad, N.; Shirvan, H.E.; Hemmatjo, R.; Sarebanzadeh, K.; Ahmadi, S. Comparing Universal Thermal Climate Index (UTCI) with selected thermal indices/environmental parameters during 12 months of the year. Weather. Clim. Extrem. 2018, 19, 49–57. [Google Scholar] [CrossRef]
  23. Wu, F.; Yang, X.; Shen, Z.; Yi, Z. Long-term trends and spatiotemporal variations of climate comfort in China during 1966–2016. Therm. Sci. 2020, 24, 2445–2453. [Google Scholar] [CrossRef]
  24. National Meteorological Information Center of China. Available online: http://data.cma.cn (accessed on 18 December 2021).
  25. Jain, A.K. Data clustering: 50 years beyond K-means. Pattern Recognit. Lett. 2010, 31, 651–666. [Google Scholar] [CrossRef]
  26. Mahlstein, I.; Knutti, R. Regional climate change patterns identified by cluster analysis. Clim. Dyn. 2010, 35, 587–600. [Google Scholar] [CrossRef]
  27. Wang, Z.; Chen, Y.; Zhou, M.; Wu, J.; Zhang, M. A clustering method with target supervision for the thermal climate division of residential buildings in the Hot Summer and Cold Winter Area of China. J. Build. Eng. 2021, 43, 103156. [Google Scholar] [CrossRef]
  28. Zhou, K.; Yang, S. Effect of cluster size distribution on clustering: A comparative study of k-means and fuzzy c-means clustering. Pattern Anal. Appl. 2020, 23, 455–466. [Google Scholar] [CrossRef]
  29. Chen, T.; Wang, W.; La, B. Study on oxygen content change Lhasa. Plateau Mt. Meteorol. Res. 2010, 30, 65–67. [Google Scholar] [CrossRef]
  30. Maulik, U.; Bandyopadhyay, S. Performance evaluation of some clustering algorithms and validity Iindices. IEEE Trans. Pattern Anal. Mach. Intell. 2002, 24, 1650–1654. [Google Scholar] [CrossRef]
  31. Liu, Y.; Li, Z.; Xiong, H.; Gao, X.; Wu, J. Understanding of internal clustering validation measures. In Proceedings of the 2010 IEEE International Conference on Data Mining, Sydney, Australia, 13–17 December 2010; pp. 911–916. [Google Scholar] [CrossRef]
  32. Durugkar, S.R.; Raja, R.; Nagwanshi, K.K.; Kumar, S. Introduction to data mining. In Data Mining and Machine Learning Applications; Raja, R., Nagwanshi, K.K., Kumar, S., Laxmi, K.R., Eds.; Wiley: Hoboken, NJ, USA, 2022; pp. 1–19. [Google Scholar] [CrossRef]
  33. Yuan, R. An improved K-means clustering algorithm for global earthquake catalogs and earthquake magnitude prediction. J. Seismol. 2021, 25, 1005–1020. [Google Scholar] [CrossRef]
  34. Brake, R.; Bates, G. A Valid Method for Comparing Rational and Empirical Heat Stress Indices. Ann. Occup. Hyg. 2002, 46, 165–174. [Google Scholar] [CrossRef] [PubMed]
  35. Yu, D.-D.; Li, S.; Guo, Z.-Y. Evaluating the Tourist Climate Comfortable Period of China in a Changing Climate. Adv. Meteorol. 2020, 2020, 8886316. [Google Scholar] [CrossRef]
  36. Cheung, T.; Schiavon, S.; Parkinson, T.; Li, P.; Brager, G. Analysis of the accuracy on PMV—PPD model using the ASHRAE Global Thermal Comfort Database. Build. Environ. 2019, 153, 205–217. [Google Scholar] [CrossRef]
  37. Höppe, P. The physiological equivalent temperature—A universal index for the biometeorological assessment of the thermal environment. Int. J. Biometeorol. 1999, 43, 71–75. [Google Scholar] [CrossRef]
  38. Jendritzky, G.; de Dear, R.; Havenith, G. UTCI—Why another thermal index? Int. J. Biometeorol. 2012, 56, 421–428. [Google Scholar] [CrossRef]
  39. Zhong, L.; Yu, H.; Zeng, Y. Impact of climate change on Tibet tourism based on tourism climate index. J. Geogr. Sci. 2019, 29, 2085–2100. [Google Scholar] [CrossRef]
  40. Liu, Q.; Wang, Z.; Xu, S. Climate suitability index for city tourism in China. Resour. Sci. 2007, 1, 133–141. [Google Scholar] [CrossRef]
  41. Terjung, W.H. Physiologic climates of the conterminous united states: A bioclimatic classification based on man. Ann. Assoc. Am. Geogr. 1966, 56, 141–179. [Google Scholar] [CrossRef]
  42. Liang, C.; Zheng, G.; Zhu, N.; Tian, Z.; Lu, S.; Chen, Y. A new environmental heat stress index for indoor hot and humid environments based on Cox regression. Build. Environ. 2011, 46, 2472–2479. [Google Scholar] [CrossRef]
  43. Andargie, M.S.; Azar, E. An applied framework to evaluate the impact of indoor office environmental factors on occupants’ comfort and working conditions. Sustain. Cities Soc. 2019, 46, 101447. [Google Scholar] [CrossRef]
  44. Asadi, I.; Mahyuddin, N.; Shafigh, P. A review on indoor environmental quality (IEQ) and energy consumption in building based on occupant behavior. Facilities 2017, 35, 684–695. [Google Scholar] [CrossRef]
  45. Ma, L.; Sun, G.; Xie, Y.; Long, M. A Study on Variations of the Tourism Climate Comfort Degree in Five Typical Cities in Eastern China during the Last 50 Years. Resour. Sci. 2010, 32, 1955–1962. [Google Scholar]
  46. Cheng, Q.-p.; Zhong, F.-l. Evaluation of tourism climate comfort in the Grand Shangri-La region. J. Mt. Sci. 2019, 16, 1452–1469. [Google Scholar] [CrossRef]
  47. Liu, Y.; Huang, L.; Song, C.; Wang, D.; Suolang, B.; Duan, G. Effect of hypoxia on human cognitive ability and indoor oxygen environment demand for sojourners at high altitude. Build. Environ. 2021, 194, 107678. [Google Scholar] [CrossRef]
  48. Coleshaw, S.; Van Someren, R.; Wolff, A.; Davis, H.; Keatinge, W. Impaired memory registration and speed of reasoning caused by low body temperature. Surv. Anesthesiol. 1984, 55, 27–31. [Google Scholar] [CrossRef]
  49. Parsons, K.C. Environmental ergonomics: A review of principles, methods and models. Appl. Ergon. 2000, 31, 581–594. [Google Scholar] [CrossRef] [PubMed]
  50. Faerevik, H.; Hansen, J.H.; Wiggen, O.; Sandsund, M. Cognitive performance during night work in the cold. Front. Physiol. 2021, 12, 768517. [Google Scholar] [CrossRef] [PubMed]
  51. Coca, A.; Williams, W.J.; Roberge, R.J.; Powell, J.B. Effects of fire fighter protective ensembles on mobility and performance. Appl. Ergon. 2010, 41, 636–641. [Google Scholar] [CrossRef] [PubMed]
  52. Taylor, N.A.S.; Peoples, G.E.; Petersen, S.R. Load carriage, human performance, and employment standards. Appl. Physiol. Nutr. Metab. 2016, 41, S131–S147. [Google Scholar] [CrossRef]
  53. Sirangelo, B.; Caloiero, T.; Coscarelli, R.; Ferrari, E.; Fusto, F. Combining stochastic models of air temperature and vapour pressure for the analysis of the bioclimatic comfort through the Humidex. Sci. Rep. 2020, 10, 11395. [Google Scholar] [CrossRef]
  54. Wolkoff, P.; Azuma, K.; Carrer, P. Health, work performance, and risk of infection in office-like environments: The role of indoor temperature, air humidity, and ventilation. Int. J. Hyg. Environ. Health 2021, 233, 113709. [Google Scholar] [CrossRef] [PubMed]
  55. Benton, D.; Jenkins, K.T.; Watkins, H.T.; Young, H.A. Minor degree of hypohydration adversely influences cognition: A mediator analysis. Am. J. Clin. Nutr. 2016, 104, 603–612. [Google Scholar] [CrossRef] [PubMed]
  56. Liu, J.; Xin, Z.; Huang, Y.; Yu, J. Climate suitability assessment on the Qinghai-Tibet Plateau. Sci. Total Environ. 2022, 816, 151653. [Google Scholar] [CrossRef] [PubMed]
  57. Shen, W.; Tian, J.; Zhang, T.; Zhang, H.; Zhang, H. Research on the efficiency reduction of manual labor in Tibet power grid engineering. Electr. Power Technol. 2010, 19, 16–19. [Google Scholar]
  58. Shi, P.; Chen, Y.; Ma, H.; Ye, T.; Tang, H.; Wang, J.a. Further research on the factors contributing to oxygen concentration over the Qinghai-Tibet Plateau. Chin. Sci. Bull. 2021, 66, 4028–4035. [Google Scholar] [CrossRef]
  59. Liu, R.; Shi, P.; Tang, H.; Wang, J.a.; Zhao, C.; Zhu, W. Vegetation oxygen production and its contribution rate to near-Surface atmospheric oxygen concentration on the Qinghai-Tibet Plateau. Acta Geogr. Sin. 2023, 78, 1136–1152. [Google Scholar]
  60. Yu, Z.; Sun, G.; Feng, Q.; Luo, Z. Tourism climate comfort and risk for Qinghai-Tibet Plateau. Resour. Sci. 2014, 36, 2327–2336. [Google Scholar]
Figure 1. The research area encompasses 55 stations distributed throughout southwestern China. The blue lines represent the rivers in Yunnan, Sichuan Province, and Tibet, respectively. Geographic elevation data were obtained from GSCloud (accessed on 8 December 2021, http://www.gscloud.cn).
Buildings 14 02398 g001
Figure 2. The flowchart of the methodology.
Buildings 14 02398 g002
Figure 3. The spatial distribution of THI (a), WEI (b), and OC (c).
Buildings 14 02398 g003
Figure 4. Monthly distribution and discomfort probability of THI (a,b), WEI (c,d), and OC (e,f) in five regions.
Buildings 14 02398 g004
Table 1. Classification criteria and assignment of THI, WEI, and OC [39,45].
Temperature–Humidity Index (THI)Wind-Efficiency Index (WEI)Oxygen Content (OC)
ClassificationBody SensationClassificationBody SensationClassificationBody Sensation
Relative Oxygen ContentAbsolute Oxygen Content
<40Extremely cold and uncomfortable<−1200Extremely cold wind21%271
40–45Cold and uncomfortable−1000–−1200Cold wind
45–55Slightly cold and uncomfortable−800–−1000Slightly cold wind<19.5%<252Tired and weak
55–60Cool and comfortable−600–−800Cool wind
60–65Cool and very comfortable−300–−600Comfortable wind<12%<206Difficulty in breathing
65–70Warm and comfortable−200–−300Warm wind
70–75Rather warm and comfortable−50–−200No sensible wind<10%<155Incapacitated
75–80Sultry and uncomfortable80–−50Hot wind
80Extremely sultry and uncomfortable>80Uncomfortable wind
Table 2. Clustered station information and corresponding average altitude.
RegionsProvinceStations (Altitude)Mean Altitude
R-IYunnanBaoshan (1651 m), Gongshan (1587 m), Licang (1503 m), Luxi (1706 m), Tengchong (1697 m), Zhaotong (1950 m), Dali (1992 m)1760 m
SichuanHuli (1789 m), Xichang (1593 m), Zhaojue (2134 m)
R-IIYunnanWeixi (2326 m), Huize (2190 m), Lijiang (2382 m)2440 m
SichuanBatang (2590 m), Kangding (2616 m), Muli (2425 m), Xiaojin (2439 m), Yanyuan (2545 m), Maerkang (2666 m)
TibetChayu (2329 m), Bomi (2337 m)
R-IIIYunnanDeqin (3321 m), Xianggelila (3278 m)3146 m
SichuanAba (3276 m), Daofu (2959 m), Dege (3185 m), Ganzi (3395 m), Jiulong (2931 m), Songpan (2883 m), Xinlong (2999 m)
TibetBasu (3562 m), Changdu (3316 m), Linzhi (2993 m)
R-IVTibetDingqing (3874 m), Leiwuqi (3811 m), Luolong (3641 m), Milin (2951 m), Mozhugongka (3805 m), Qiongjie (3741 m), Zuogong (3781 m), Nielamu (3811 m), Zedang (3562 m)3677 m
SichuanDaocheng (3729 m), Hongyuan (3493 m), Litang (3941 m), Ruoergai (3443 m), Seda (3896 m)
R-VSichuanShiqu (4201 m)4192 m
TibetDangxiong (4201 m), Naqu (4508 m), Dingri (4301 m), Jiangzi (4041 m), Lazi (4001 m), Nanmulin (4001 m), Shihequan (4208 m)
Table 3. Descriptive statistics of comfort indexes for five regions (mean ± standard deviation).
RegionsTHIWEIOC
MeanComfort Probability (100%)MeanComfort Probability (100%)MeanComfort Probability (100%)
R-I59.61 ± 8.1098.4%−326.80 ± 121.30100%226.98 ± 6.60100%
R-II55.15 ± 8.0695.9%−411.13 ± 135.8899.3%213.01 ± 8.1878.6%
R-III49.29 ± 8.2085.1%−490.84 ± 138.6599.5%197.54 ± 6.419.0%
R-VI45.92 ± 8.7373.4%−567.04 ± 162.7791.9%187.55 ± 7.171.8%
R-V45.03 ± 8.7670.7%−604.65 ± 190.4581.5%177.09 ± 5.480%
Disclaimer/Publisher’s Note: The statements, opinions and data contained in all publications are solely those of the individual author(s) and contributor(s) and not of MDPI and/or the editor(s). MDPI and/or the editor(s) disclaim responsibility for any injury to people or property resulting from any ideas, methods, instructions or products referred to in the content.