Article

Study on the Hydration Heat Effect and Pipe Cooling System of a Mass Concrete Pile Cap

by
Bo Wang
1,2,* and
Yifan Song
2
1
Faculty of Infrastructure Engineering, Dalian University of Technology, Dalian 116024, China
2
Institute of Bridge Engineering, School of Highway, Chang’an University, Xi’an 710064, China
*
Author to whom correspondence should be addressed.
Buildings 2024, 14(8), 2413; https://doi.org/10.3390/buildings14082413
Submission received: 6 July 2024 / Revised: 25 July 2024 / Accepted: 1 August 2024 / Published: 5 August 2024
(This article belongs to the Section Building Energy, Physics, Environment, and Systems)

Abstract

:
Under the action of cement hydration heat, the construction environment, thermal insulation measures, and pipe cooling systems, a mass concrete pile cap is subject to a complex internal temperature field, which makes it difficult to control its internal surface temperature difference (TISTD), the internal adiabatic temperature rise (TIATR), and the surface temperature (TST). In this study, a mass concrete pile cap of a very large bridge (the length, width, and height were 26.40 m, 20.90 m, and 5.00 m, respectively, and the central-pier pile cap was constructed with C40 concrete) was taken as the research object. The control factors affecting the temperature field of the pile cap were determined by comparing the field temperature measurements with the values calculated with finite element software simulation analysis. By using Midas Civil (2022 v1.2) and Midas FEA (NX 2022) finite element software, these factors (the concrete mold temperature, the concrete surface convection coefficient, the ambient temperature, the pipe cooling system parameters, etc.) were numerically analyzed, and their influence laws and degrees were determined.

1. Introduction

The quantity of long-span bridges that are being planned or constructed is increasing due to the rapid growth of the economy [1]. Mass concrete structures are commonly employed as foundational infrastructure construction projects due to their simple fabrication and noteworthy capacity to carry heavy loads [2,3]. Although countries worldwide have yet to make uniform provisions on the specific geometric size or dosage of mass concrete, many scholars believe that a large amount of heat is generated inside mass concrete structures during construction and is not easily dissipated [4,5,6,7].
There are some problems associated with the utilization of mass concrete structures, as they undergo intricate temperature variations due to cement hydration heat, construction site conditions, thermal insulation methods, and pipe cooling systems, which create difficulties in regulating the surface temperature (TST), the internal adiabatic temperature rise (TIATR), and the internal surface temperature difference (TISTD). Thermal cracks in mass concrete structures are caused by significant TISTD and affect the structure’s durability, reliability, and safety [8,9,10,11]. Hence, it is imperative to regulate the TISTD of mass concrete with appropriate temperature control measures [12,13,14,15,16,17,18].
The Soviet Hydraulic Research Institute, the United States Bureau of Reclamation, and other research institutions systematically analyzed and studied the early temperature cracks of mass concrete in the mid-20th century, and a series of calculation methods and control measures based on mass concrete design and temperature control during construction were proposed [19,20]. Nikolay Aniskin proposed replacing the water in the concrete mixture with ice. Based on the principle of energy balance in the heat transfer process, a formula for calculating the amount of ice required was established to control the initial temperature of the concrete mixture. The results show that the maximum temperature and the temperature difference in mass concrete depend primarily on the initial temperature of the concrete mixture [21]. Nguyen, T.C., et al. believed that using a 7 cm sand layer could prevent and limit cracks in the early stages of mass concrete blocks and reduce the temperature difference of mass concrete [16]. Trong Chuc Nguyen et al. drew a temperature-time history diagram by using a numerical method and determined the maximum temperatures of concrete structures presenting differences in size, initial concrete mixture temperature, cement content, and other parameters. The obtained temperature nomogram was compared with the results obtained with the finite element method; the two sets of results were found to be in agreement, indicating that the proposed method can predict the maximum temperature in a mass concrete structure and prevent the formation of temperature cracks [22].
Abdel-Raheem et al. used additional cementitious materials, such as silica fume, fly ash, slag, metakaolin, and milky white rock, in concrete mixtures to reduce the hydration heat of cement [12]. Madi et al. replaced conventional materials with a steel slag aggregate to improve concrete’s thermal and mechanical properties [14]. Several researchers have proposed that including liquid nitrogen in the concrete mixing process can improve the efficiency of concrete [23,24]. Bamforth et al. proposed that the adiabatic temperature of mass concrete can be reduced by spraying water to cool the concrete aggregate or storing it in a low-temperature environment [25]. Air conditioning systems are also often used to cool concrete aggregates [26], but most refrigeration systems use harmful refrigerants such as chlorofluorocarbons (CFCs) and hydrofluorocarbons (HFCs), including R11, R12, R22, and R113 [27,28]. Although some researchers have proposed alternate solutions to traditional refrigerants to reduce their negative influence on the environment [29,30], the bulk of refrigerants still exert harmful effects. The eco-friendly cooling of mass concrete can be achieved by installing a pipe cooling system. This method employs environmentally friendly refrigerants, and the low-temperature fluid used in the pipe cooling system is recyclable. As a result, this approach is being increasingly adopted by experts.
Alamayreh et al. focused on cooling system design, the initial investment, and the influence of different refrigerants on cooling system performance, aiming to produce higher-quality mass concrete [17]. Seo Tae-Seok et al. proposed a vertical pipe cooling method suitable for slender mass concrete structures such as retaining walls and bridge towers [31]. Lawrence, A.M., et al. used the finite element method to calculate early strength development and crack formation in concrete. They then experimentally measured concrete samples mixed with different cementitious materials. Finally, the numerical simulation was combined with experiments to verify the accuracy of the calculation results [32]. T.C. Nguyen studied the temperature field and stress of mass concrete under the action of a cooling water pipe system. Additionally, the temperature field and cracking index of mass concrete with a cooling water pipe system temperature of 15 °C were measured [33]. Zhang et al. studied the influence of various parameters of pipe cooling systems and sunshine on the hydration heat of mass concrete. Their results indicate that pipe cooling systems effectively controlled the hydration heat effect of mass concrete [34]. Huang et al. proposed an effective pipe cooling system to reduce the adiabatic temperature rise in mass concrete and conducted a thermal stress complex analysis. The results show that the pipe cooling system effectively reduced the hydration temperature and thermal stress [35]. Adek Tasri et al. studied the influence of three kinds of post-cooling pipes with different materials on mass concrete temperature stress and gradient. It was found that the concrete temperature obtained by using steel cooling pipes was 70% and 36% lower than those obtained by using PVC and PEX cooling pipes, respectively, which could reduce the cracking risk caused by core area expansion and concrete surface shrinkage. However, the tensile stress generated by the steel tubes was 25.3% and 12.7% higher than that generated by the PVC and PEX tubes, respectively [36]. Joo-Kyoung Yang studied the relationship between the thermal conductivity values of the pipe wall and concrete during the cooling stage and established their thermal convection coefficient functions based on the flow velocity, the pipe diameter, and the pipe thickness [37]. Based on actual bridge engineering, Gao et al. established a theoretical model of the rise in concrete hydration heat by using theoretical calculations, numerical simulation, and field measurements and optimized the layout of a pipe cooling system [38].
Altering the concrete composition or incorporating inhibitors efficiently mitigates the increase in adiabatic temperature and minimizes TISTD. Nevertheless, it is challenging to adapt various mix ratios and construction circumstances to mass concrete, and most inhibitors have a far-reaching impact on the environment. Implementing a pipe cooling system within the mass concrete structure allows cold water or cold air to cool the internal concrete. This method is commonly employed in the construction of mass concrete and is environmentally sustainable. Nevertheless, the primary emphasis of research on pipe cooling systems is on the water temperature, with limited investigations being conducted on the pipe diameter and the flow rate. Therefore, in this study, we first designed the layout model of the pipe cooling system of the main pier cap of a very large bridge and compared it with the field measurement data. Then, the effects of the concrete mold temperature, the surface convection coefficient, and the ambient temperature on the mass concrete TIATR, TST, and TISTD were systematically analyzed. Finally, the quantitative analysis of the influence of various parameters (flow rate, water temperature, and effective pipe diameter) of a mass concrete–pipe cooling system on the cooling effect provides a benchmark for testing the mathematical model of the mass concrete–pipe cooling system and the design of pipe cooling systems in further research.

2. Concrete Parameters and Numerical Modeling

2.1. Physical Thermal Parameters of Concrete

This study was based on the actual project of a large continuous steel bridge. The cross-border distribution of the main bridge was 92.75 + 6 × 170 + 92.75 m. The length, width, and height of the mass concrete caps of the bridge were 26.40 m × 20.90 m × 5.00 m, respectively. Considering the significant size of the bridge caps, the construction team opted for a concrete mixture with a high proportion of fly ash to minimize TIATR. The concrete mix ratio is shown in Table 1.
The thermal conductivity of concrete is the heat conductivity of the unit volume of concrete in unit time, and the medium on both sides determines the unit temperature difference. The thermal conductivity of concrete can be calculated according to Formula (1) [39].
λ = 1 p ( p 1 λ 1 + p 2 λ 2 + p 3 λ 3 + p 4 λ 4 + p 5 λ 5 )   Unit : λ , λ 1 , λ 2 , λ 3 , λ 4 , λ 5 ( W / ( m K ) ) ; p , p 1 , p 2 , p 3 , p 4 , p 5 ( % )
where p , p 1 , p 2 , p 3 , p 4 and p 5 represent the percentages per cubic meter of concrete, cement, sand, gravel, water, and fly ash, respectively, and λ , λ 1 , λ 2 , λ 3 , λ 4 and λ 5 represent the thermal conductivity values of concrete, cement, sand, stone, and water, respectively, which can be found in Table 1.
The specific heat capacity of concrete is the heat required for the temperature of concrete per unit mass to increase by 1 °C and can be calculated according to Formula (2) [39].
C = 1 p ( p 1 C 1 + p 2 C 2 + p 3 C 3 + p 4 C 4 + p 5 C 5 )   Unit : λ , λ 1 , λ 2 , λ 3 , λ 4 , λ 5 ( kJ / ( kg K ) ) ;   p , p 1 , p 2 , p 3 , p 4 , p 5 ( % )
where p , p 1 , p 2 , p 3 , p 4 and p 5 represent the percentages per cubic meter of concrete, cement, sand, gravel, water, and fly ash, respectively, and C , C 1 , C 2 , C 3 , C 4 and C 5 represent the specific heat capacity values of concrete, cement, sand, stone, water, and fly ash, respectively, which can be found in Table 1.
In concrete, adiabatic temperature rise occurs when the boundary is under heat insulation conditions and the concrete temperature resulting from the cement hardening process increases. It can be calculated according to Formula (3) [39].
Q C O = k Q 0 W   Unit : Q C O ( kJ / m 3 ) ; k ( % ) ; Q 0 ( kJ / kg ) ; W ( kg / m 3 )
where Q co is the total calorific value of concrete, Q o is the hydration heat of cement, W is the amount of concrete cementitious material, and k is the adjustment coefficient, whose values are shown in Table 2.
In this study, the thermal conductivity of concrete was 2.573 W / ( m K ) , its specific heat capacity was 0.926 k J / ( k g K ) , and its adiabatic temperature rise was 67.92 °C.

2.2. Numerical Modeling

2.2.1. Fundamental Assumptions

The plane size of the cap was 26.4 m × 20.9 m, and the height was 5 m. The cap was poured and formed simultaneously, and Midas Civil (2022 v1.2) finite element software was used for modeling. The following assumptions underlie the modeling process:
(1) The pile cap was a homogeneous body, and the heating rate of each node in the model was the same.
(2) The initial temperature of the pile cap was the same.
(3) The surface convection coefficient of each side of the pile cap was the same, considering the foundation’s influence on concrete heat dissipation.
(4) The influence of the steel bars and other materials inside the cap was ignored, but the influence of heat preservation and moisture retention during construction was considered.
(5) The concrete mold temperature and ambient temperature were obtained with field measurements. Considering the thermal insulation measures (steel formwork and thermal insulation materials) obtained during the construction process, the surface convection coefficient of the pile cap surface was calculated as 3.275 kW/(m2∙K), and without considering the thermal insulation measures, it was calculated as 21.279 kW/(m2∙K).
(6) The foundation size was larger than the cap size. Based on experience, the foundation size was considered to be 30.9 m × 36.4 m × 3 m. The foundation’s specific heat capacity and thermal conductivity were 0.2 and 1.7, respectively. All the nodes around the foundation were consolidated; that is, all rotations and translations were restrained.

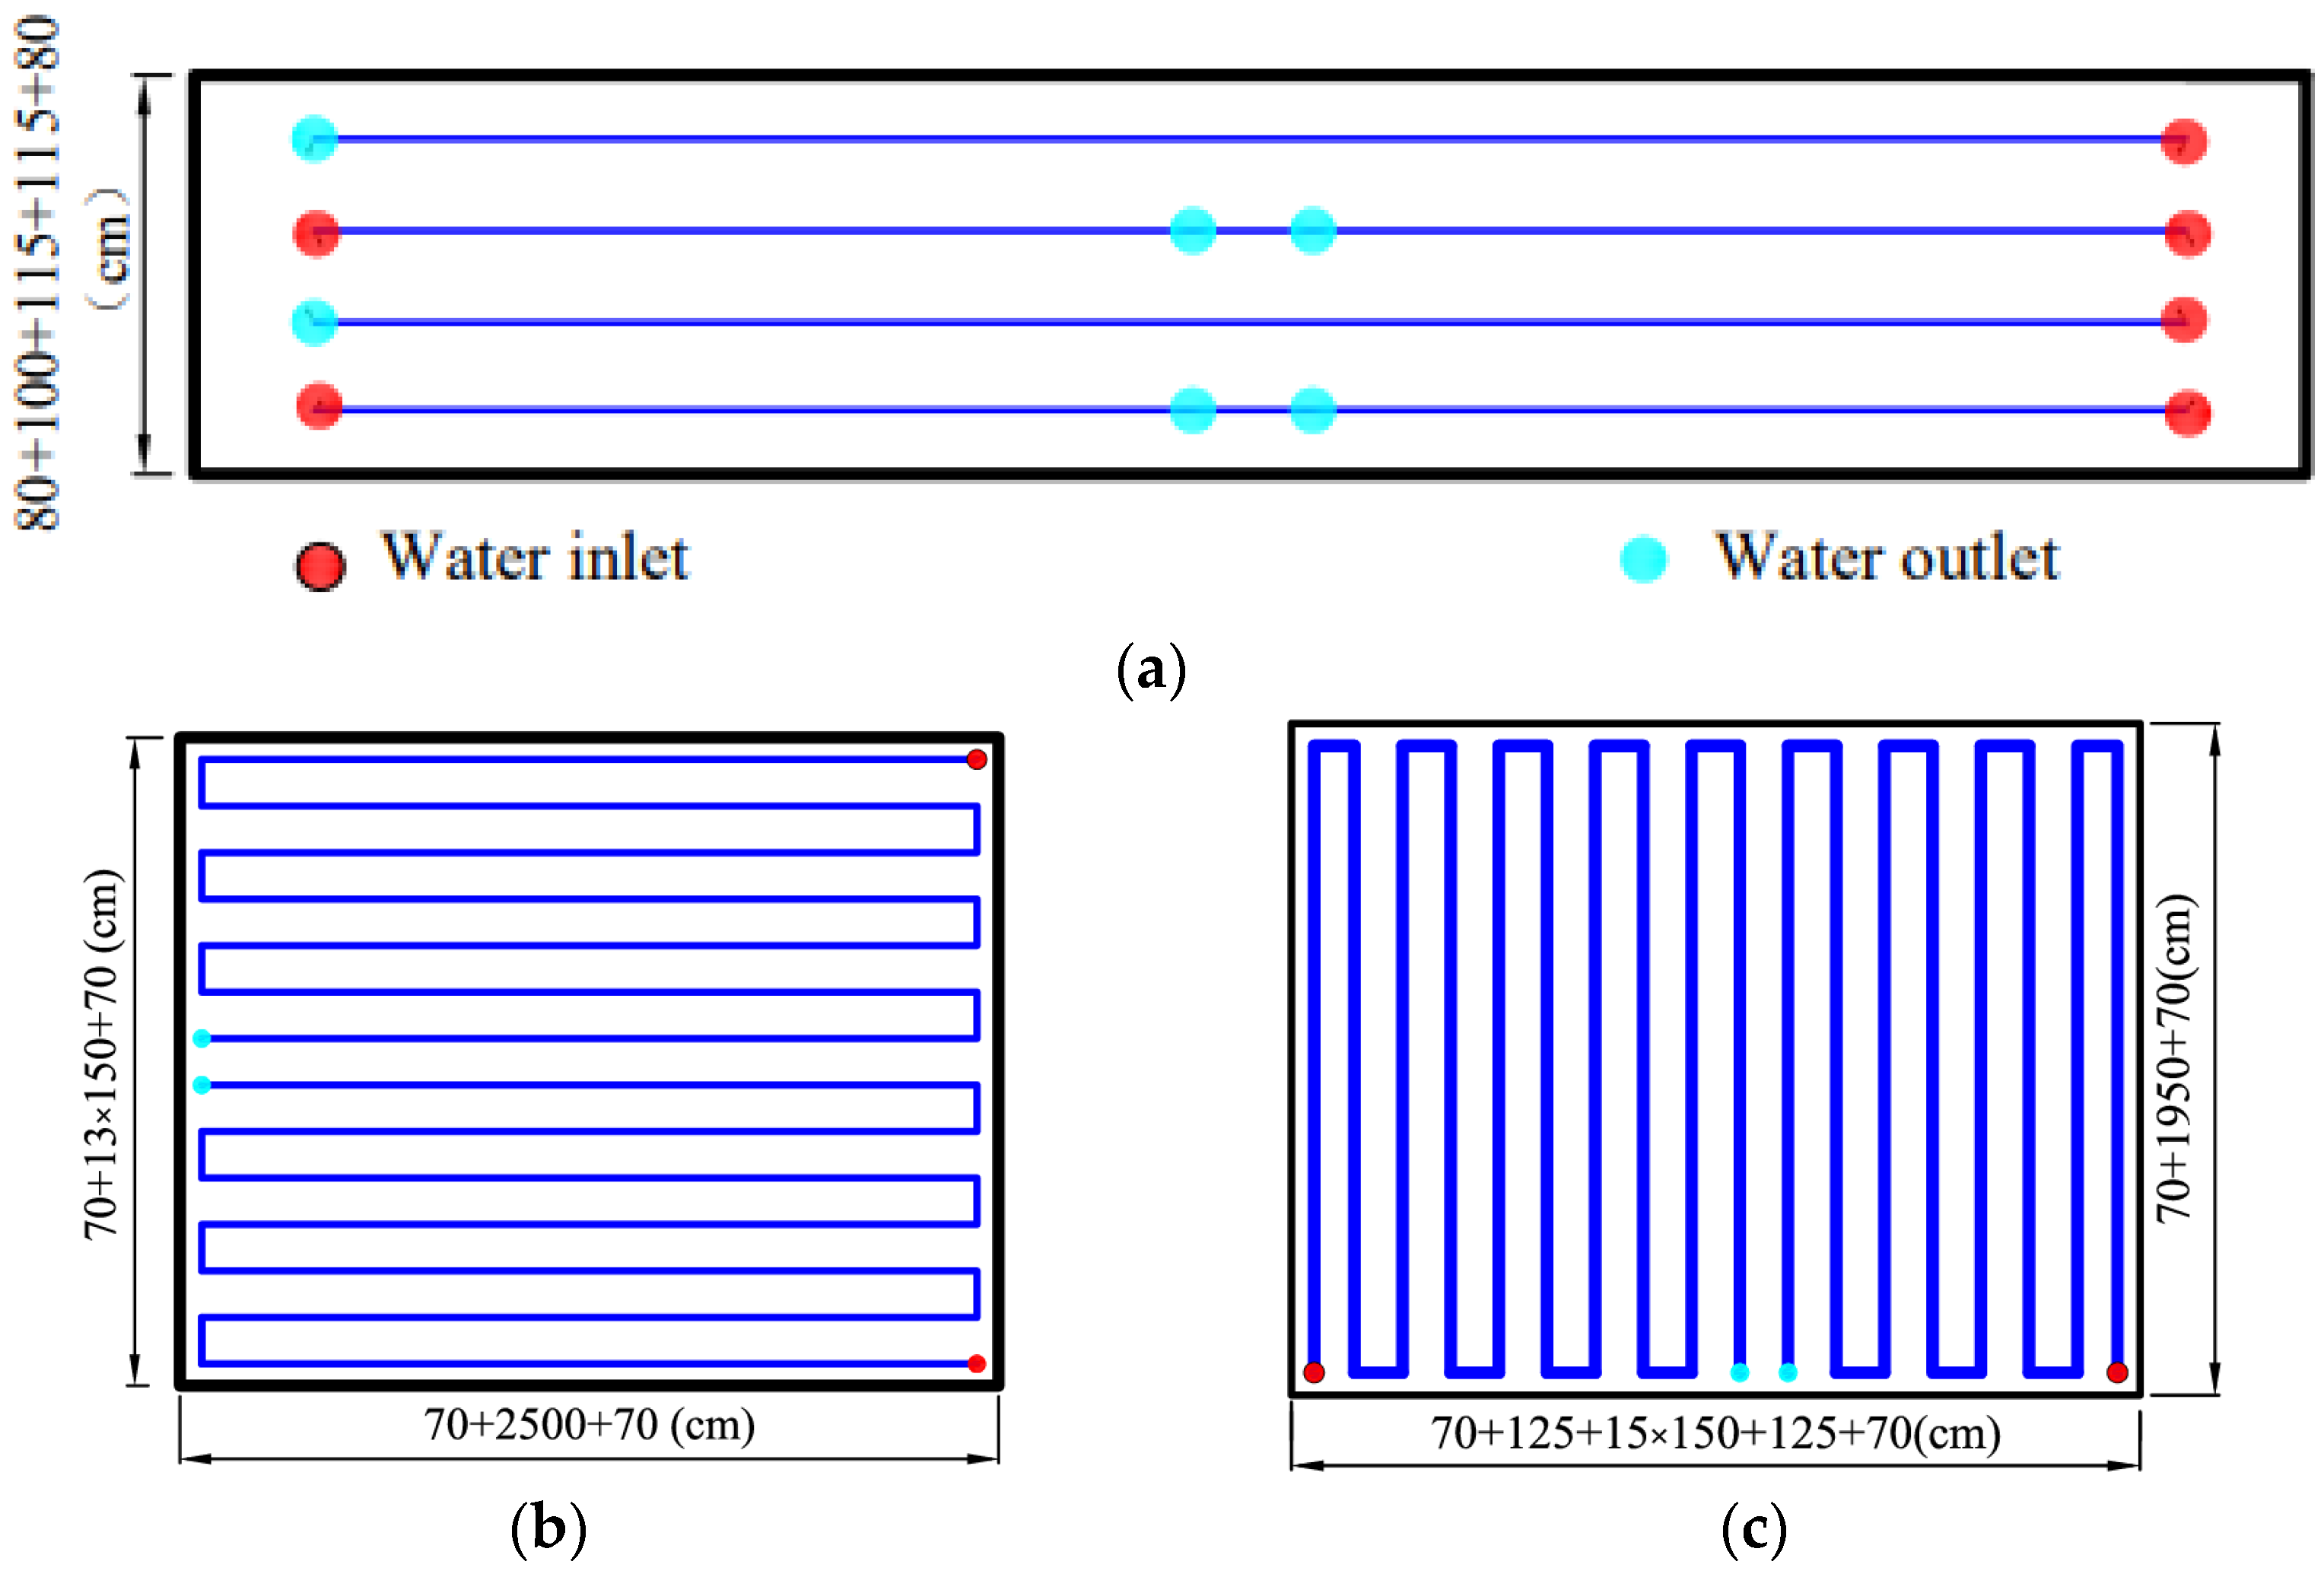
2.2.2. Layout of the Pipe Cooling System

A pipe cooling system was used for internal cooling during cap construction. The water pipe of the pipe cooling system was a thin-walled iron pipe (wall thickness of 2.5 mm and internal effective diameter of 40 mm), and the water inlet rate of the cooling pipe was 6 m3/h per pipe. The cooling water used was well water, and its temperature at the inlet was relatively constant (determined according to the temperature measured on site). However, the water temperature inside a tube cooling system is different at each point considered; generally, the maximum TIATR decreases with the decrease in the inlet water temperature. Here, the thermal conductivity of concrete was 1.28 W/mK, and the specific heat capacity was 0.92 kJ/(kgK). Four layers of independent inlet and outlet pipe cooling systems were arranged in the pile cap. The layout of the pipe cooling system is shown in Figure 1.

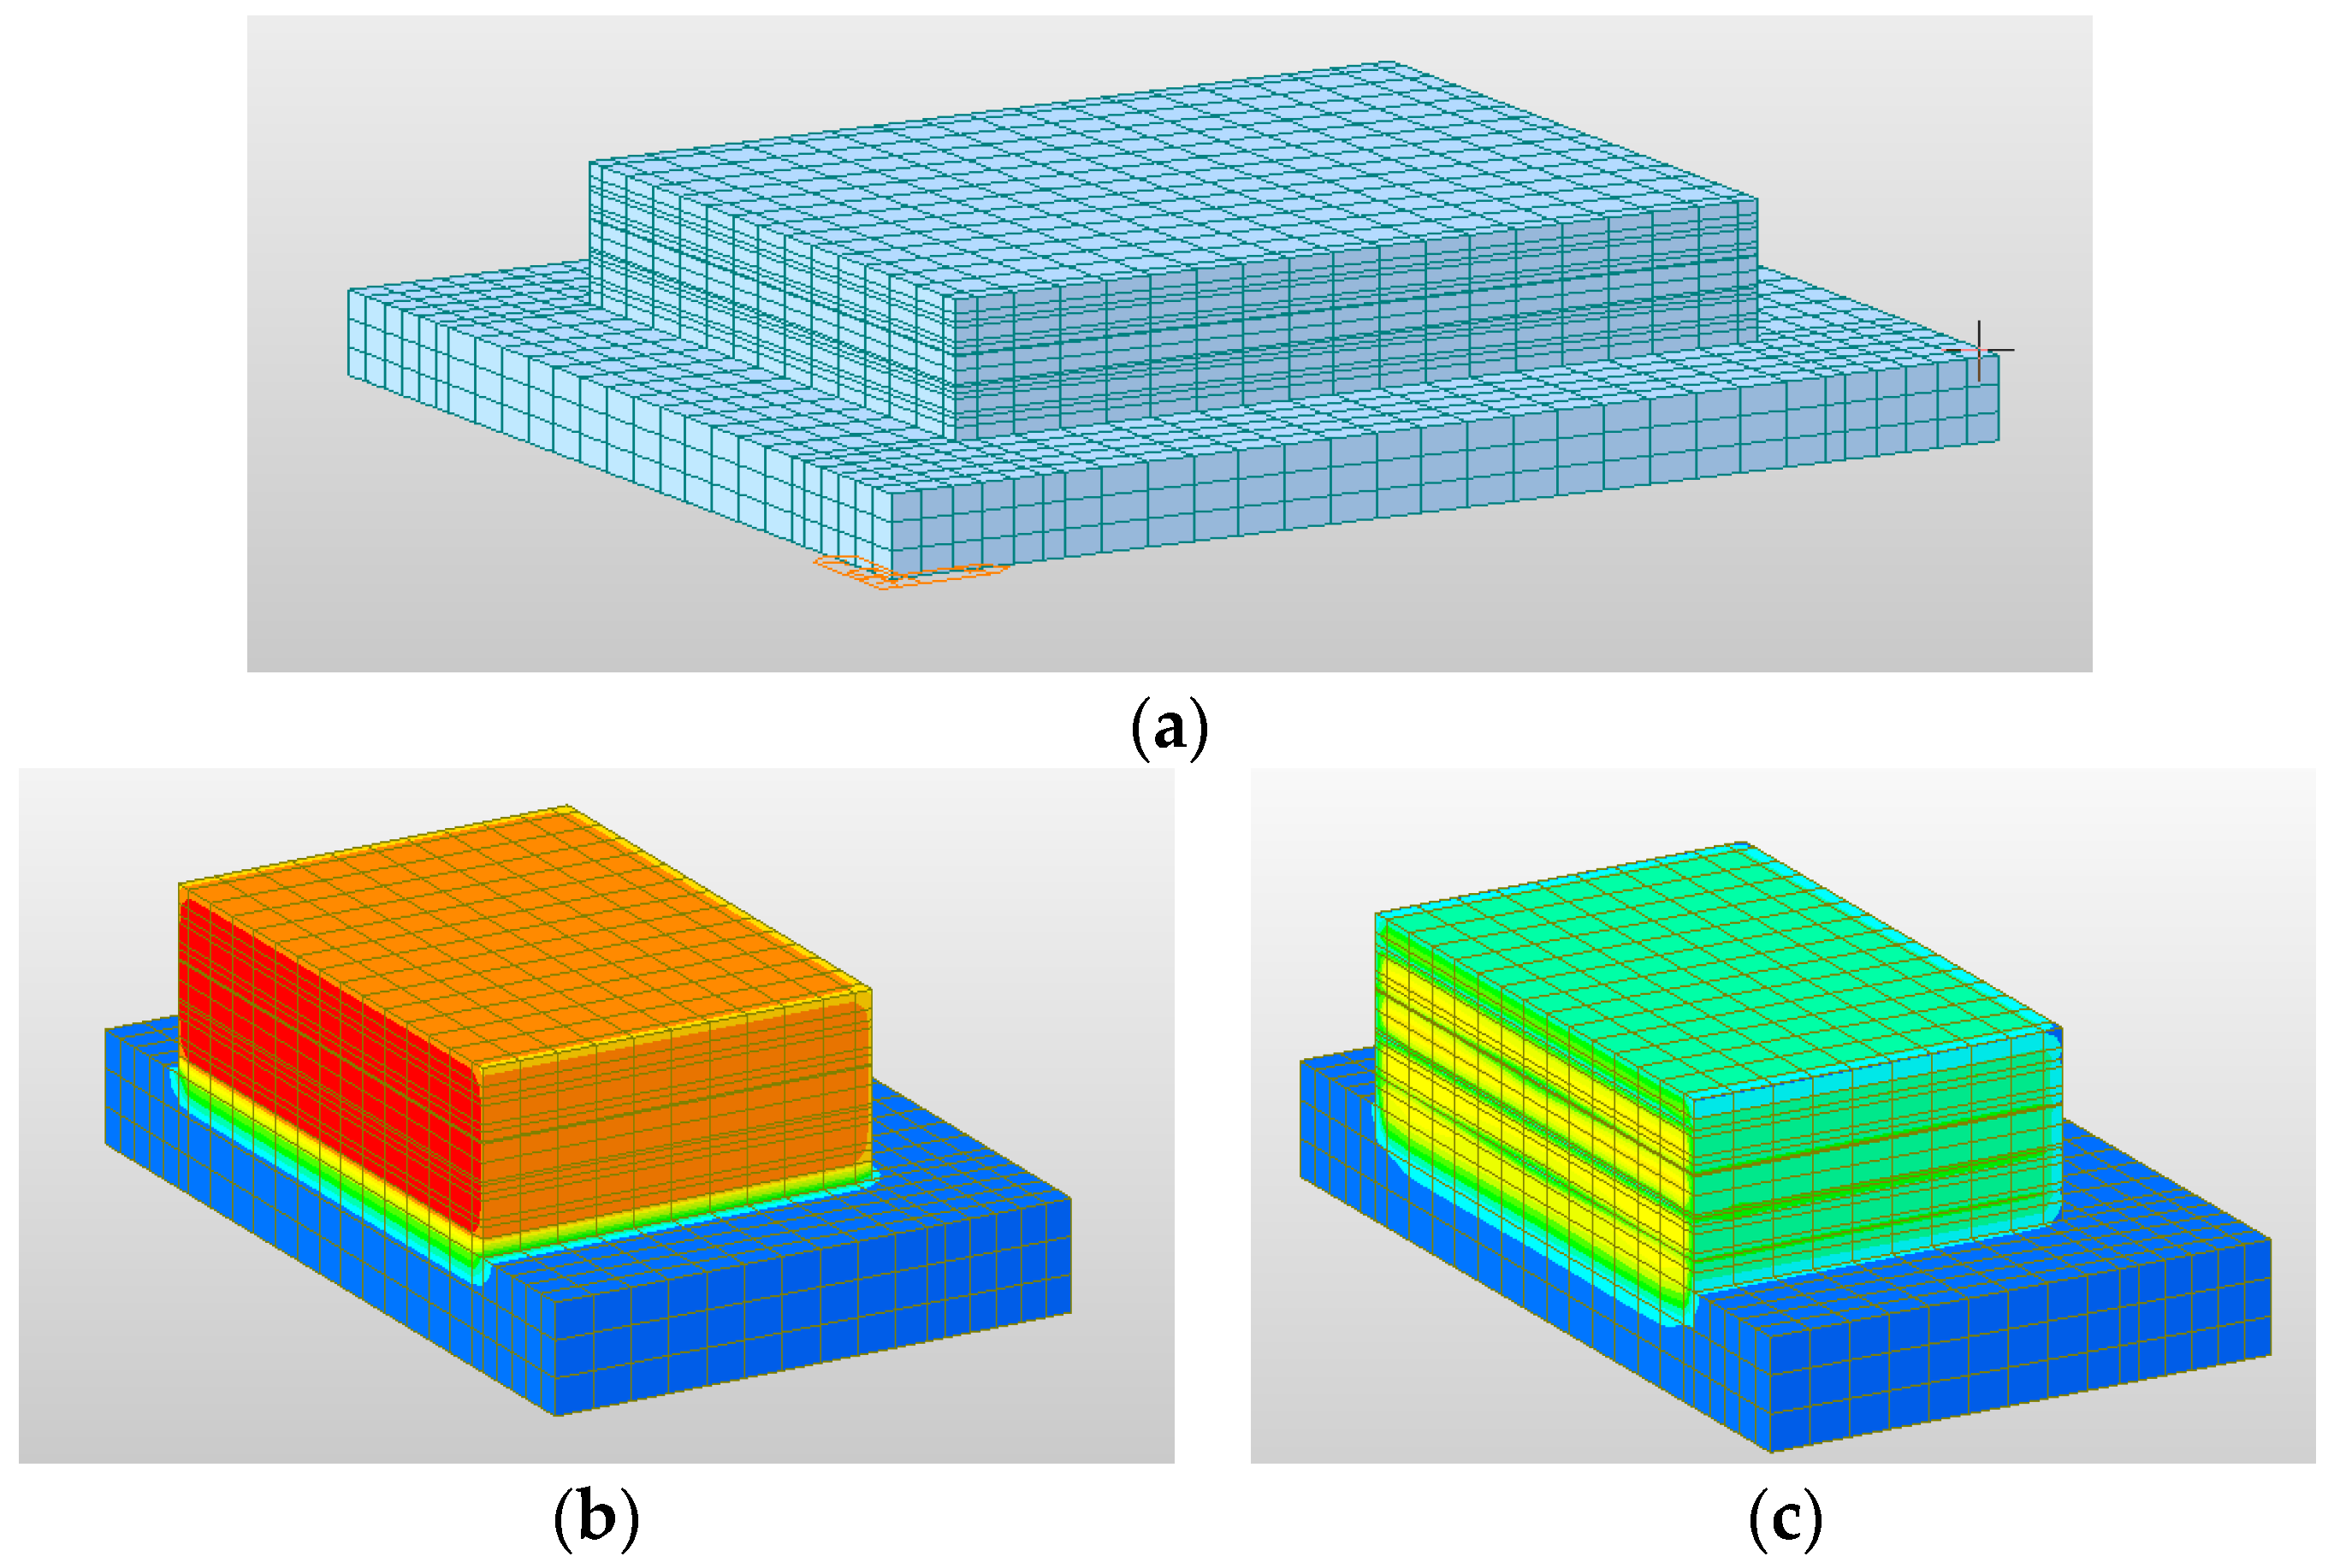
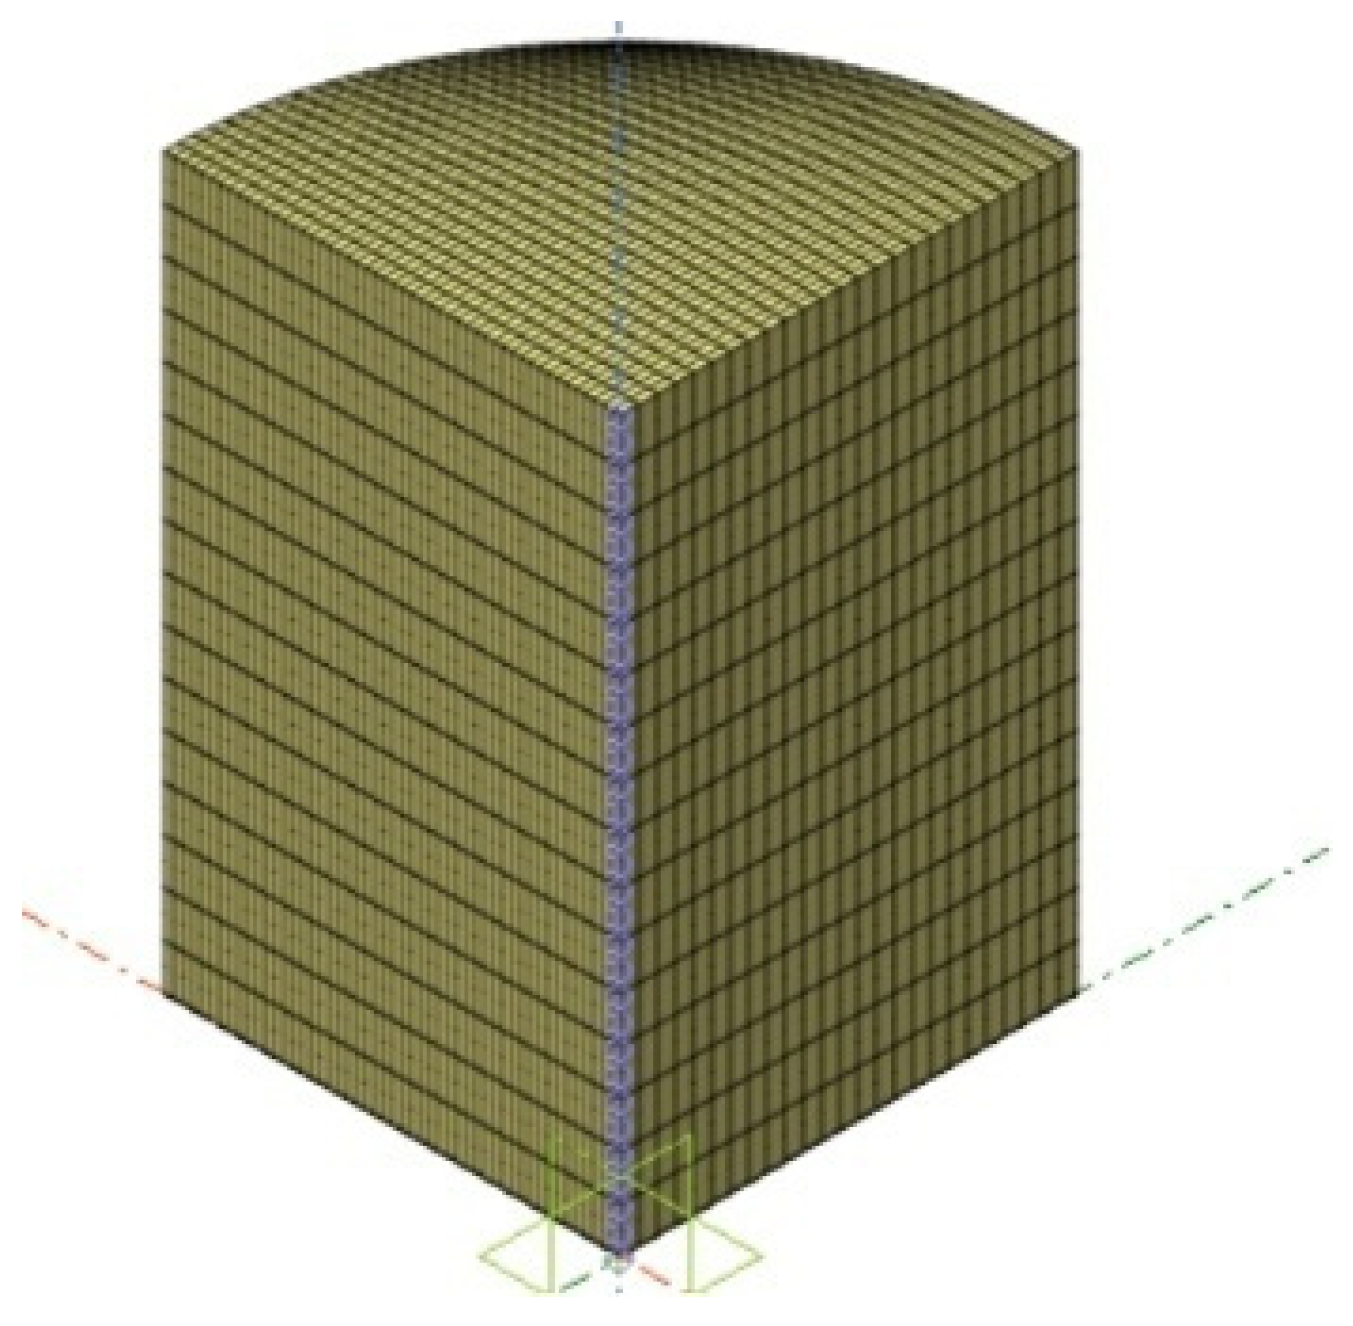
2.2.3. Numerical Model of Cap

The pile cap’s hydration heat state was analyzed using Midas Civil (2022 v1.2) finite element software. In the model, the internal pipe cooling system of the main pier cap was simulated as the connection between the nodes, and the low-temperature fluid in the pipe cooling system was considered according to the load. Figure 2 shows the temperature field distribution inside the pile cap and foundation model and that in the pile cap with or without a pipe cooling system (the mold temperature was tentatively set to 20 °C, the water temperature to 20 °C, and the ambient temperature to 20 °C; the other parameters are shown in Section 2.1).
As shown in Figure 2, when the pipe cooling system is not considered, a large amount of heat is generated inside the cap due to cement hydration, and the ability of concrete to transfer heat is poor. The internal temperature of the cap is high, and the surface of the mass concrete cap exchanges heat with the air, resulting in a more significant reduction rate for TST than for TIATR. If TISTD is too high, the resulting temperature stress leads to temperature cracks in the central pier cap. When the pipe cooling system is considered, the internal temperature field of the pile cap is redistributed, and TIATR is significantly reduced, which can significantly improve TISTD and reduce the risk of temperature cracks. For mass concrete, it is generally required that TIATR be less than 75 °C and TISTD be less than 25 °C. Therefore, in subsequent analysis, we considered the maximum TIATR and TISTD.

3. Field Test Data and Parameter Sensitivity Analysis

3.1. Test Instrument and Measuring Point Layout for Field Test

The center of the pile cap was symmetrical, so the temperature sensors were only arranged in one-quarter of the pile cap, and an automatic temperature acquisition module was used for data collection. According to the temperature field distribution law, during cap construction, the temperature sensors were placed at the center of the section on the central axis perpendicular to the top surface of the cap and 5 cm from the top surface of the cap. In the horizontal direction, the temperature monitoring points were set from the center to 5 cm from the surface, and they were densely arranged near the surface. Five layers were set in the vertical direction of the main pier cap, with nine measuring points in each layer. Further, five temperature sensors and two ambient temperature sensors were placed at the inlet and outlet of the pipe cooling system. Thus, a total of 52 temperature sensors were used. Their specific layout positions are shown in Figure 3.
The temperature was monitored every 2 h during the pouring and heating stages of the pile cap, every 4 h after the pile cap entered the cooling stage, and every 12 h after the cooling rate stabilized. When the difference between the TST of the cap and the ambient temperature was less than 20 °C, the temperature measurement was stopped. The mold temperature of concrete was measured not less than twice per shift, and the ambient temperature and the pipe cooling system’s inlet and outlet water temperatures were measured synchronously with the concrete temperature.

3.2. Analysis of Field Measurement Data

The internal surface temperature difference of a mass concrete cap should be less than 25 °C, the cut-off value after which temperature stress occurs in concrete. Therefore, the cap’s TIATR, TST, and TISTD were analyzed based on the field measurement data. In the construction process of the A# and B# pile caps, the average temperatures of the field environment were 1 °C and 18 °C, the average mold temperatures were 13 °C and 16 °C, and the inlet temperatures of the pipe cooling system were 8 °C and 20 °C, respectively. The surface convection coefficient was 3.275 kW/(m2∙K) during cap construction, and the model without heat preservation was established for comparison. The TIATR, TST, and TISTD curves for the A# and B# caps are shown in Figure 4.
As shown in Figure 4, for the A# cap, the maximum measured TIATR was 46.2 °C (160 h). In the finite element calculation, it was 46.2 °C (97 h) when considering the heat preservation measures and 46 °C (97 h) when these were not considered. For the B# cap, the maximum measured TIATR was 54.1 °C (61 h). In the finite element calculation, it was 58 °C (83 h) when the heat preservation measures were considered and 57.6 °C (83 h) when these were not considered. It can be seen that, for mass concrete with the same mix ratio and mold temperature, after fully considering the pipe cooling system and ambient temperature, the presence or absence of heat preservation measures has little effect on the maximum TIATR in the finite element model. The measured value is was lower than the theoretical value in the initial stage of concrete pouring. Because the cooling water temperature is low in the initial pouring stage; the heat exchange between the internal concrete and the pipe cooling system is sufficient; the cooling water temperature rises rapidly in the later stage; and the cooling effect is significantly reduced. The use of finite element software allows for a more accurate calculation of the maximum TIATR, but the occurrence time calculation accuracy needs to be improved.
Figure 4 shows that the measured value of the TST of the pile caps was greatly affected by the ambient temperature and fluctuated significantly. However, it was consistent with the calculated TST value of the finite element model, considering the heat preservation measures. Therefore, reasonable heat preservation measures can significantly improve the TST of pile caps. Affected by the fluctuation in the TST of the pile caps, TISTD also fluctuated, and it was consistent with the calculated value of the finite element model considering the thermal insulation measures. In the later monitoring stage, the calculated TISTD value of the model considering the heat preservation measures began to decrease. However, the measured data still fluctuated around the maximum TISTD and showed a slight increase. The main reason is that the peak value of the measured data for the highest core concrete temperature appeared late and lasted for a long time. In their research studies, Alamayreh et al. [17] and Huang et al. [35] observed that the TST and the TISTD of mass concrete varied in response to changes in the ambient temperature. Hence, during the construction of mass concrete, it is essential to give utmost importance to surface insulation to prevent temperature cracks resulting from significant TISTD.

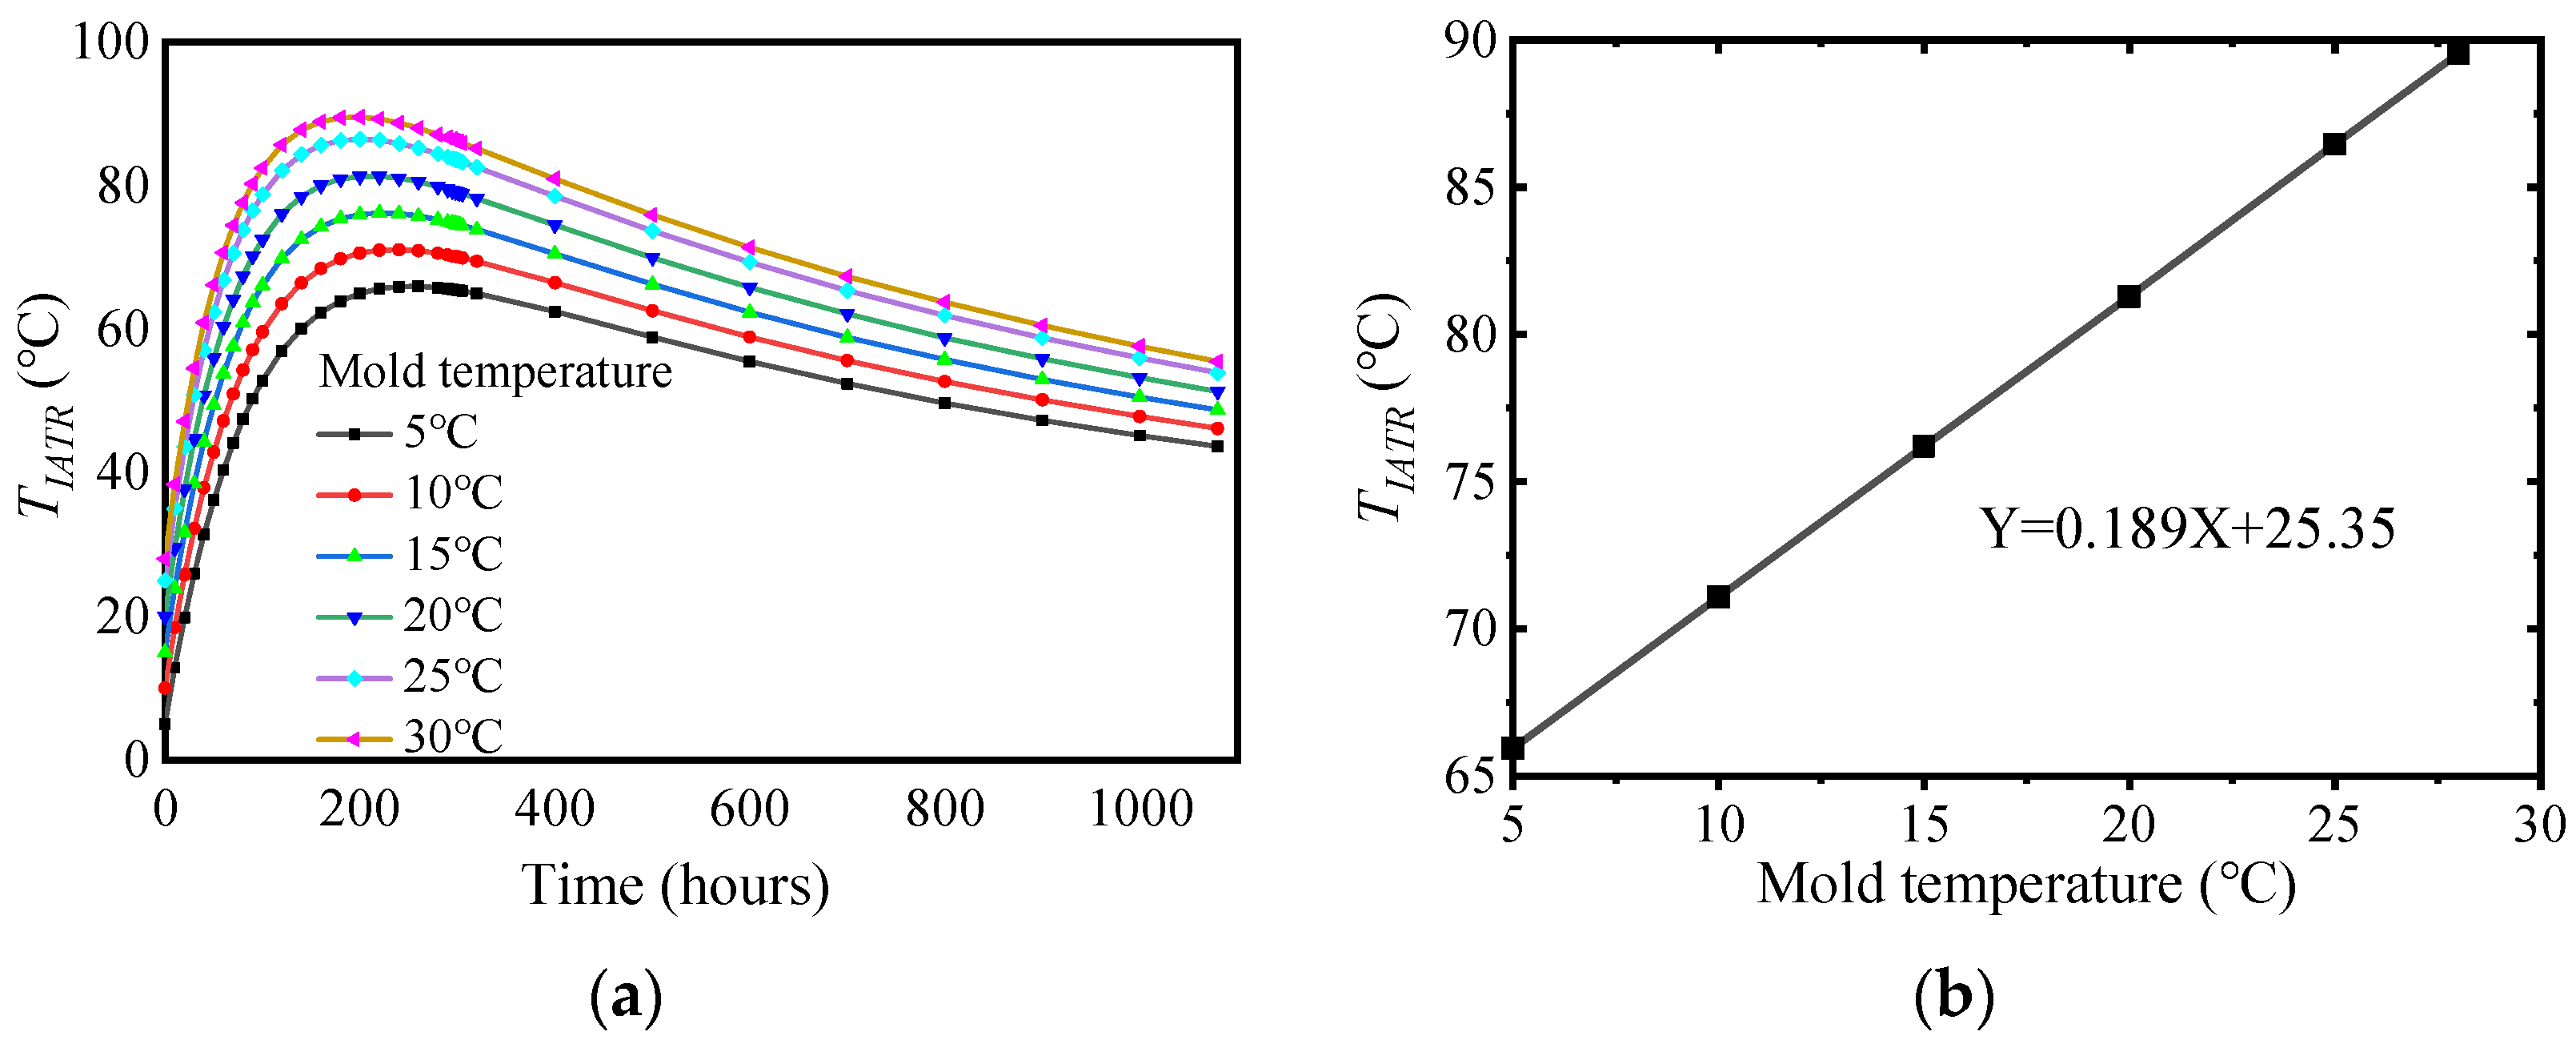
3.3. Influence of Concrete Mold Temperature

The standard values of concrete mold temperature considered in analysis are within 5~28 °C (with values of 5, 10, 15, 20, 25, and 28 °C). In the next phase of our study, which focused on mold temperature, we considered the following: the size of the cap was consistent with the above-described experiments; the surface of the cap was naturally cooled, and no pipe cooling system was used. The influence of different mold temperatures on the TIATR, TST, and TISTD of the mass concrete cap was analyzed by setting the construction environment temperature to 20 °C. Figure 5, Figure 6 and Figure 7 show TIATR, TST, and TISTD for different concrete mold temperatures.
Figure 5 shows the maximum TIATR with the increase in concrete mold temperature. The theoretical concrete adiabatic temperature rise was 67.92 °C, and the relationship between the mold temperature and TIATR is Y = 1.026X + 60.80. Due to the heat dissipation from the surface and the heat exchange between the foundation and the cap, the maximum TIATR was lower than its theoretical value plus the concrete mold temperature. The TIATR increased by approximately 1 °C for every 1 °C increase in the mold temperature.
As shown in Figure 6, the maximum TST increased with an increase in the mold temperature, and their relationship is Y = 0.189X + 25.35. Due to the influence of ambient temperature and surface convection, the maximum TST under natural heat dissipation conditions was much smaller than TIATR. The maximum TST increased by approximately 0.2 °C for every 1 °C increase in the mold temperature.
As shown in Figure 7, the maximum TISTD increased with an increase in the concrete mold temperature, and their relationship is Y = 0.931X + 36.43. The maximum TISTD increased by approximately 0.95 °C for every 1 °C increase in the mold temperature. Therefore, with an increase in the concrete mold temperature, TISTD, TST, and TIATR show an increasing trend [22].

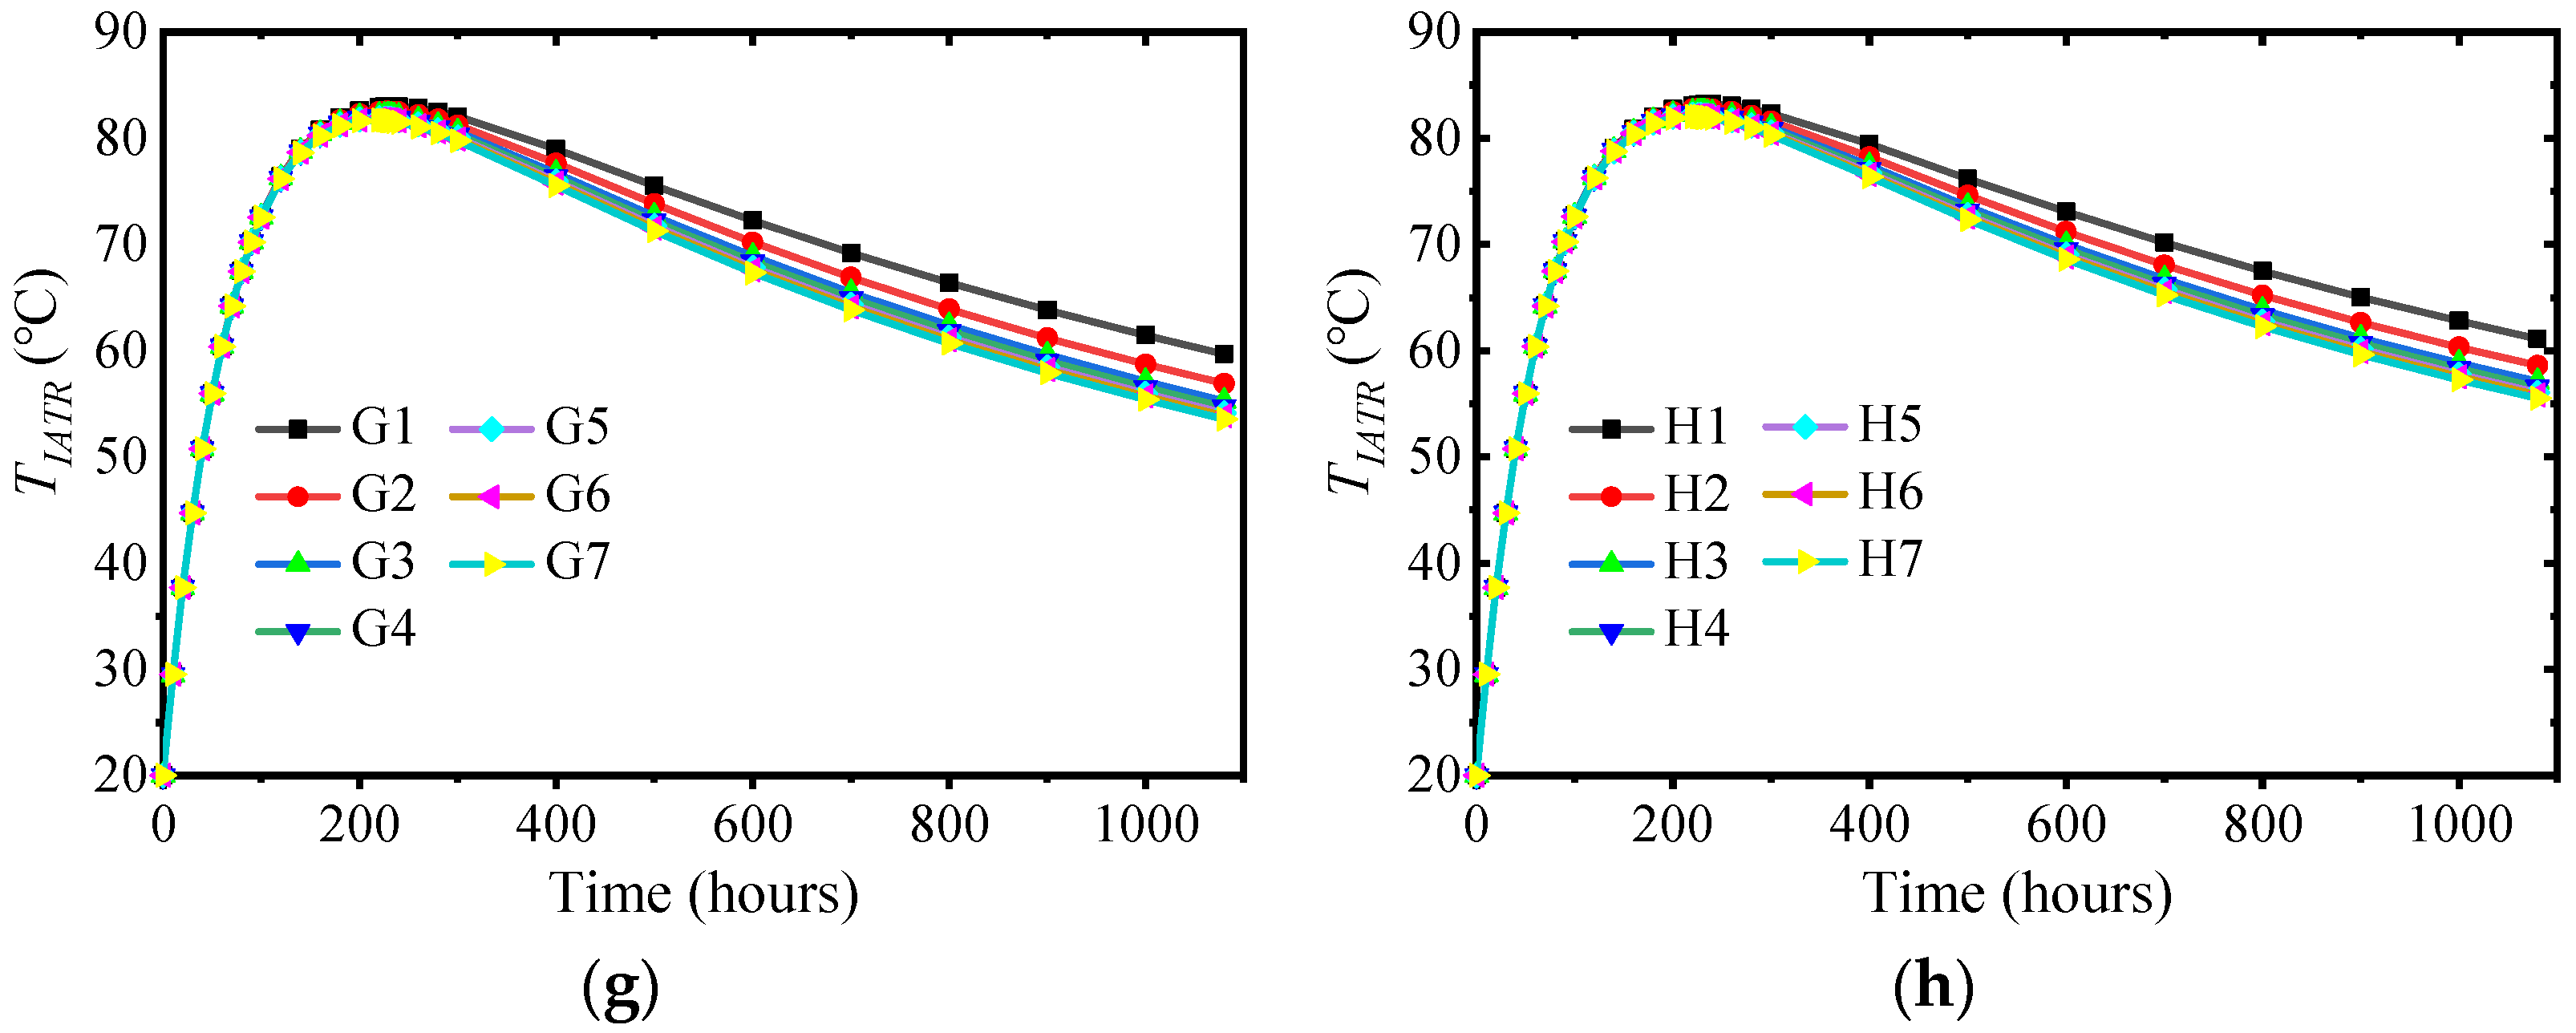
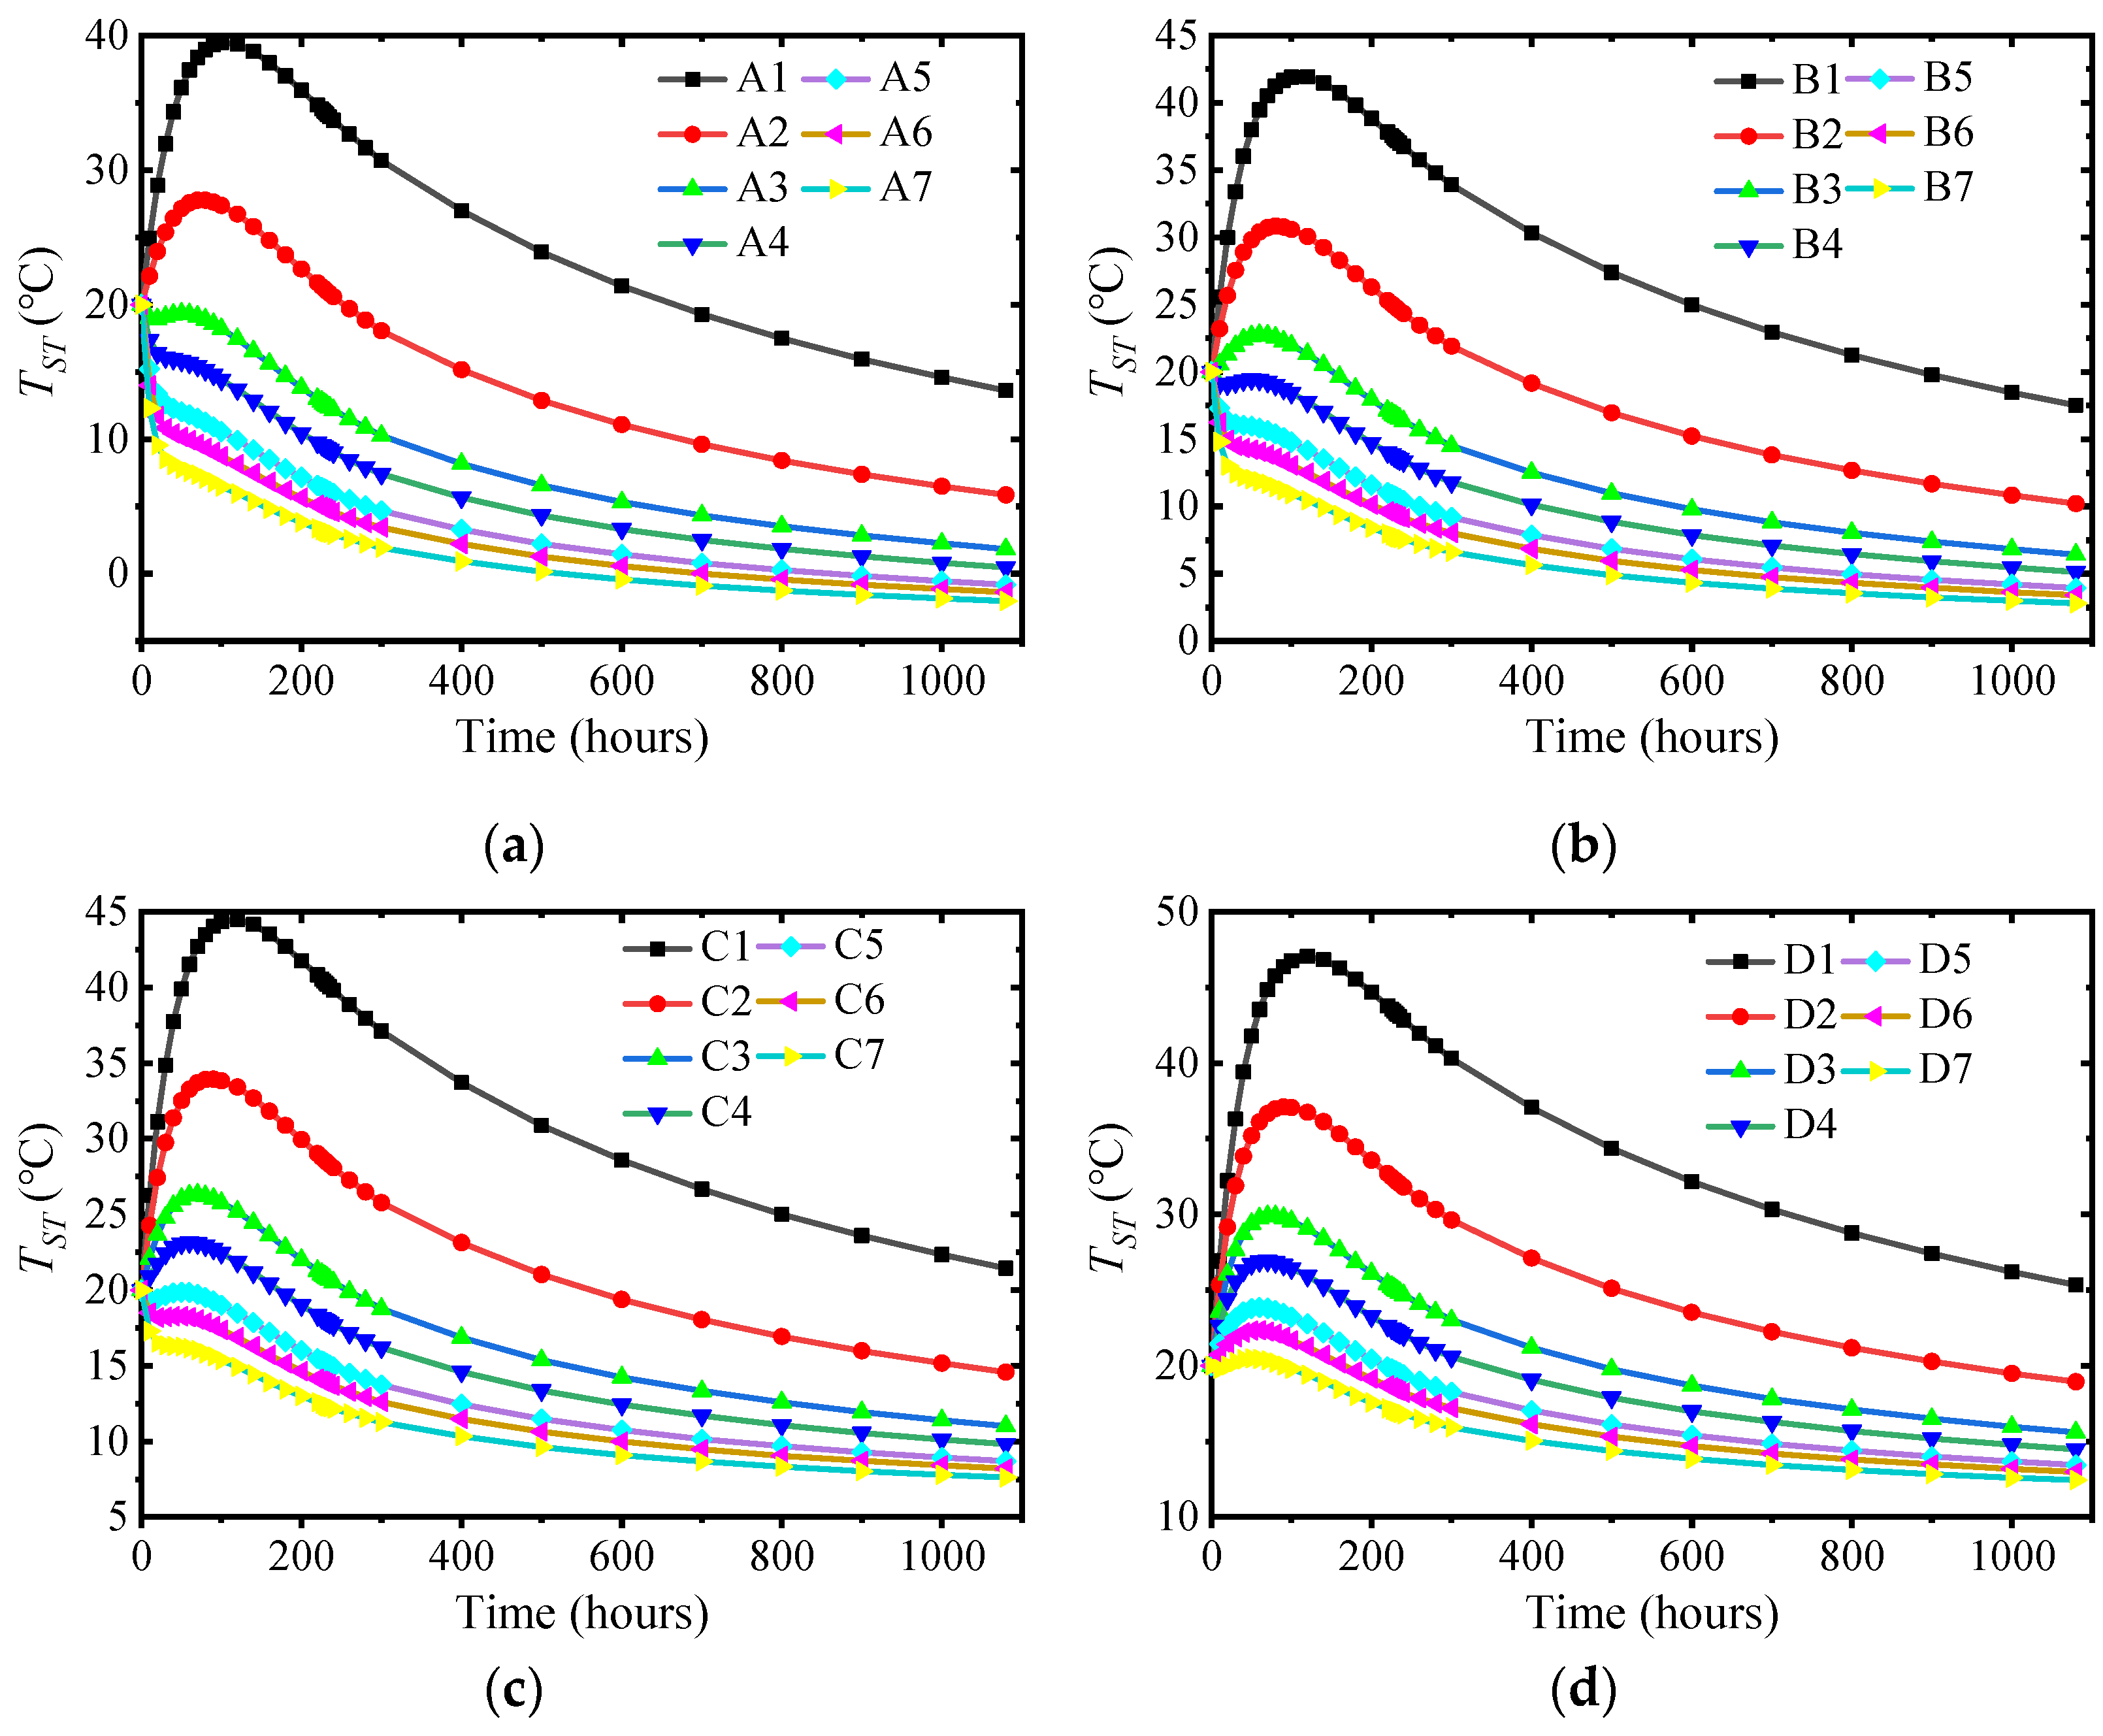
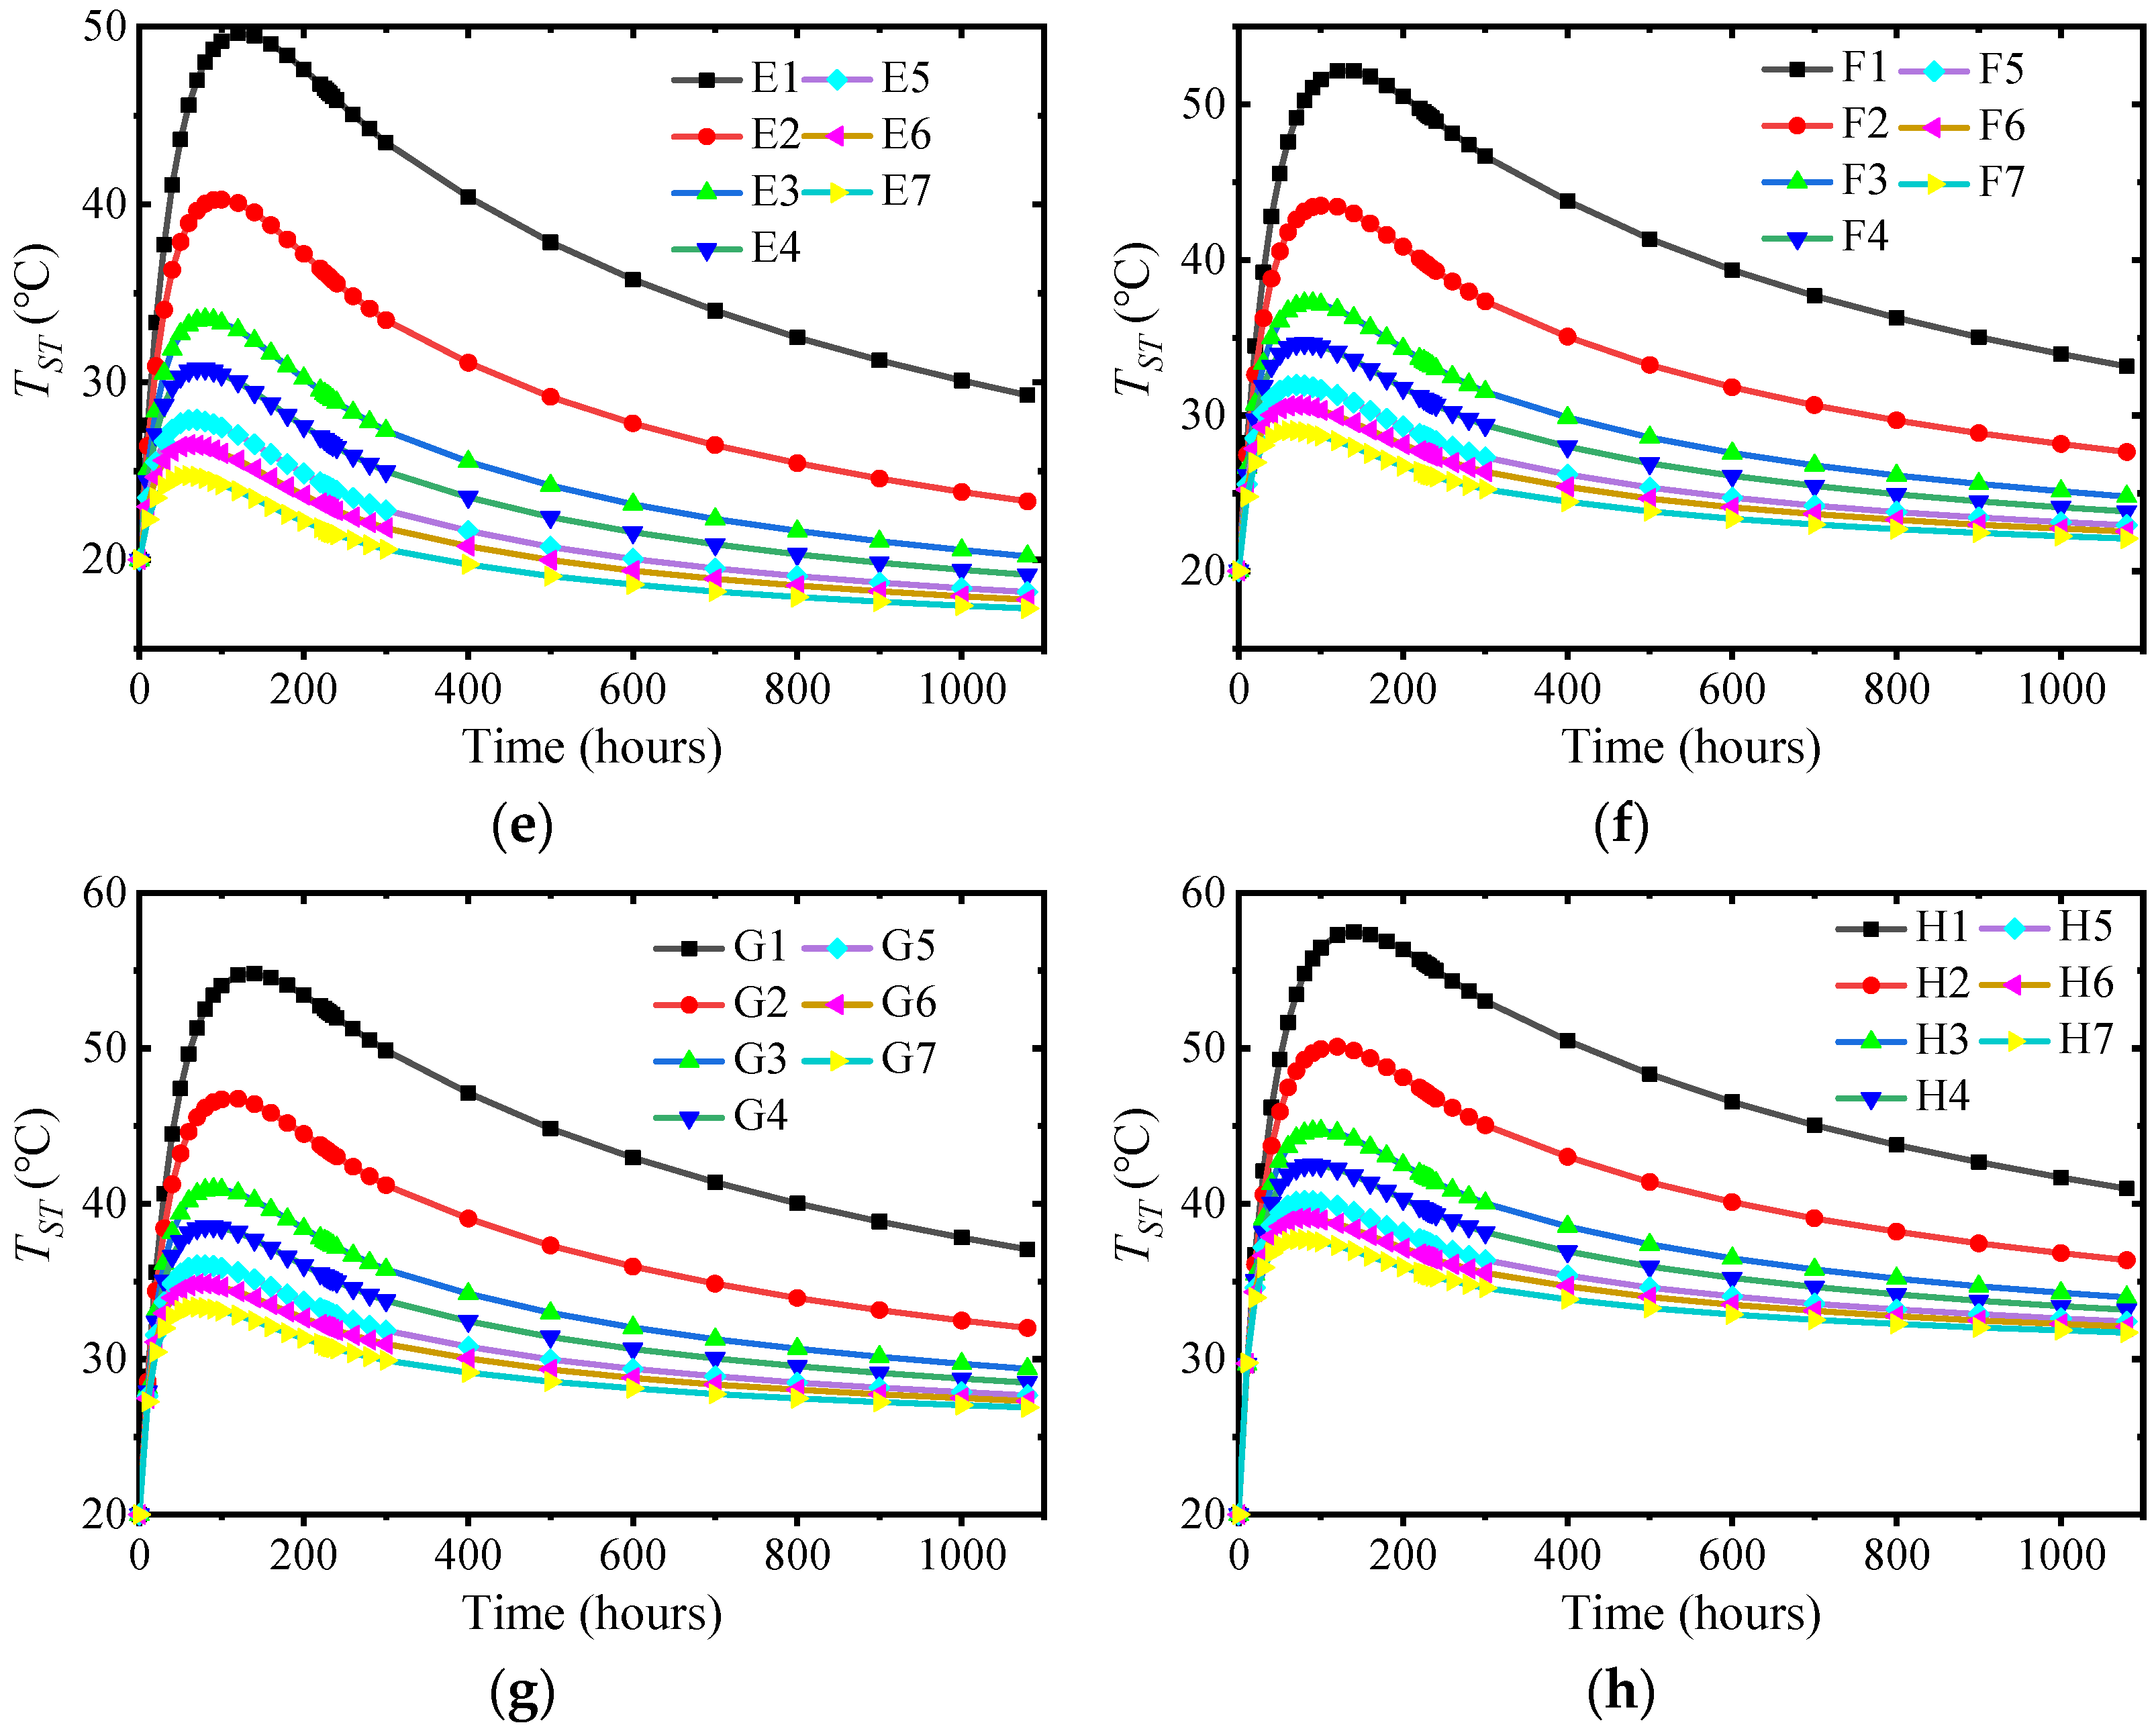
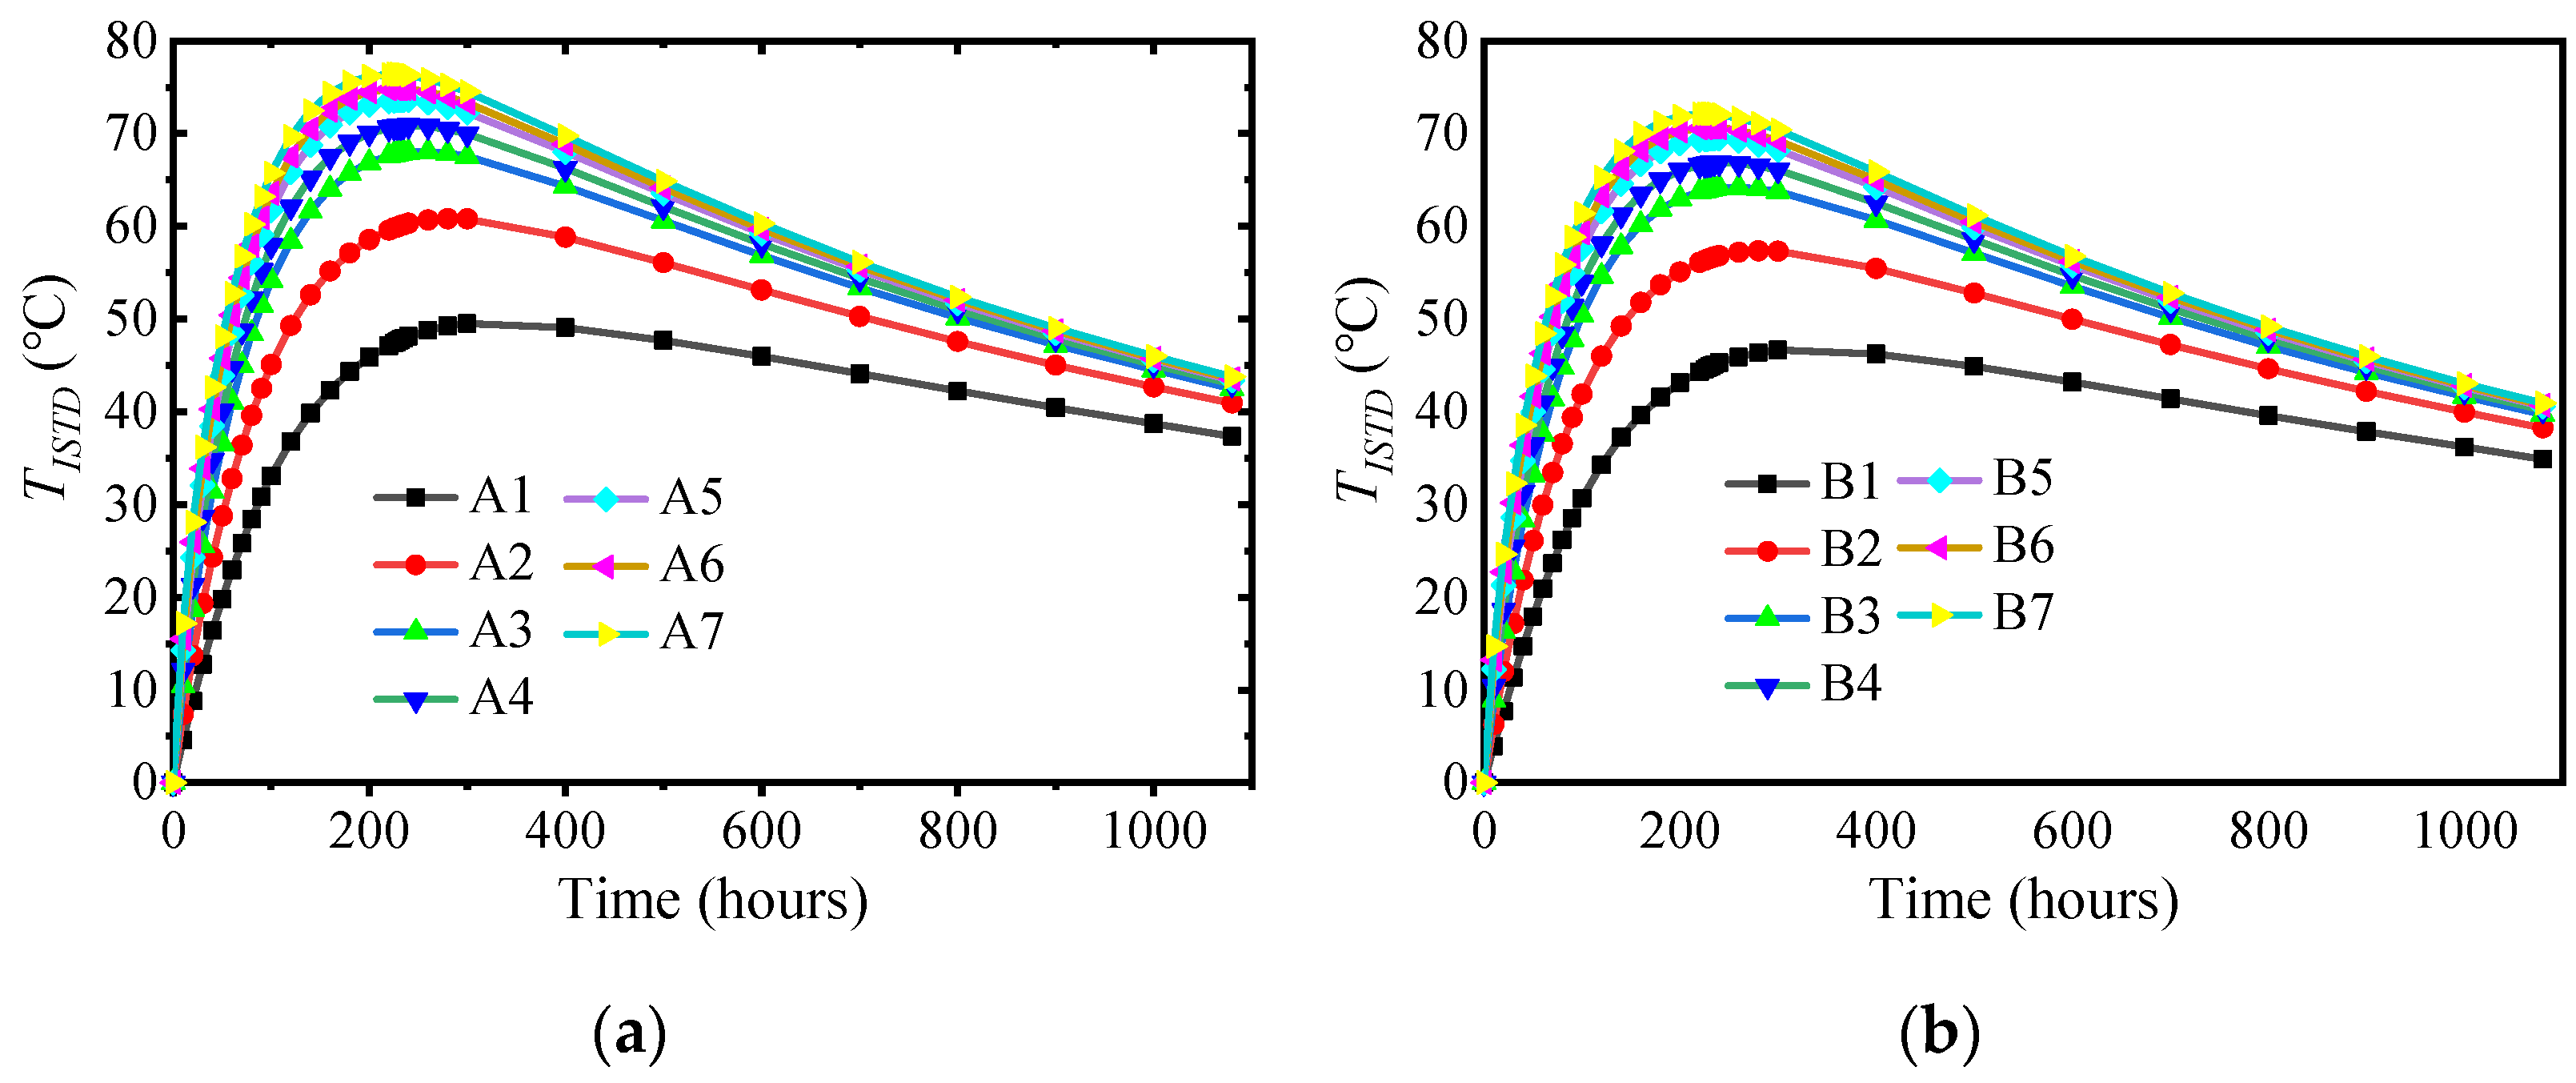
3.4. Influence of Ambient Temperature and Surface Convection Coefficient

Next, the mold temperature was set to 20 °C without considering the pipe cooling system, and the ambient temperature range was −5~30 °C. According to the previous study, the range of the surface convection coefficient was 3.275~21.279 kW/(m2∙K). The analysis scheme is shown in Table 3. The TIATR, TST, and TISTD curves under different working conditions are shown in Figure 8, Figure 9 and Figure 10.
As shown in Figure 8, the change in the surface convection coefficient had little effect on TIATR when the ambient temperature was constant. However, after TIATR reached its peak and the cap entered the cooling stage, the more significant the surface convection coefficient was, the greater the internal cooling rate was. When the surface convection coefficient was constant, the ambient temperature change had little effect on TIATR.
As shown in Figure 9, the maximum TST increased with the decrease in the surface convection coefficient when the ambient temperature was constant. However, TST decreased faster after the cap entered the cooling stage. When the ambient temperature was low and the surface convection coefficient was significant, TST indicated no obvious heating process. When the surface convection coefficient was constant, the maximum TST increased with the increase in ambient temperature. The greater the surface convection coefficient, the greater the influence of the temperature of the construction environment on TST.
When the ambient temperature was constant, TISTD decreased with the decrease in the surface convection coefficient. When the surface convection coefficient was constant, TISTD decreased with the increase in ambient temperature.

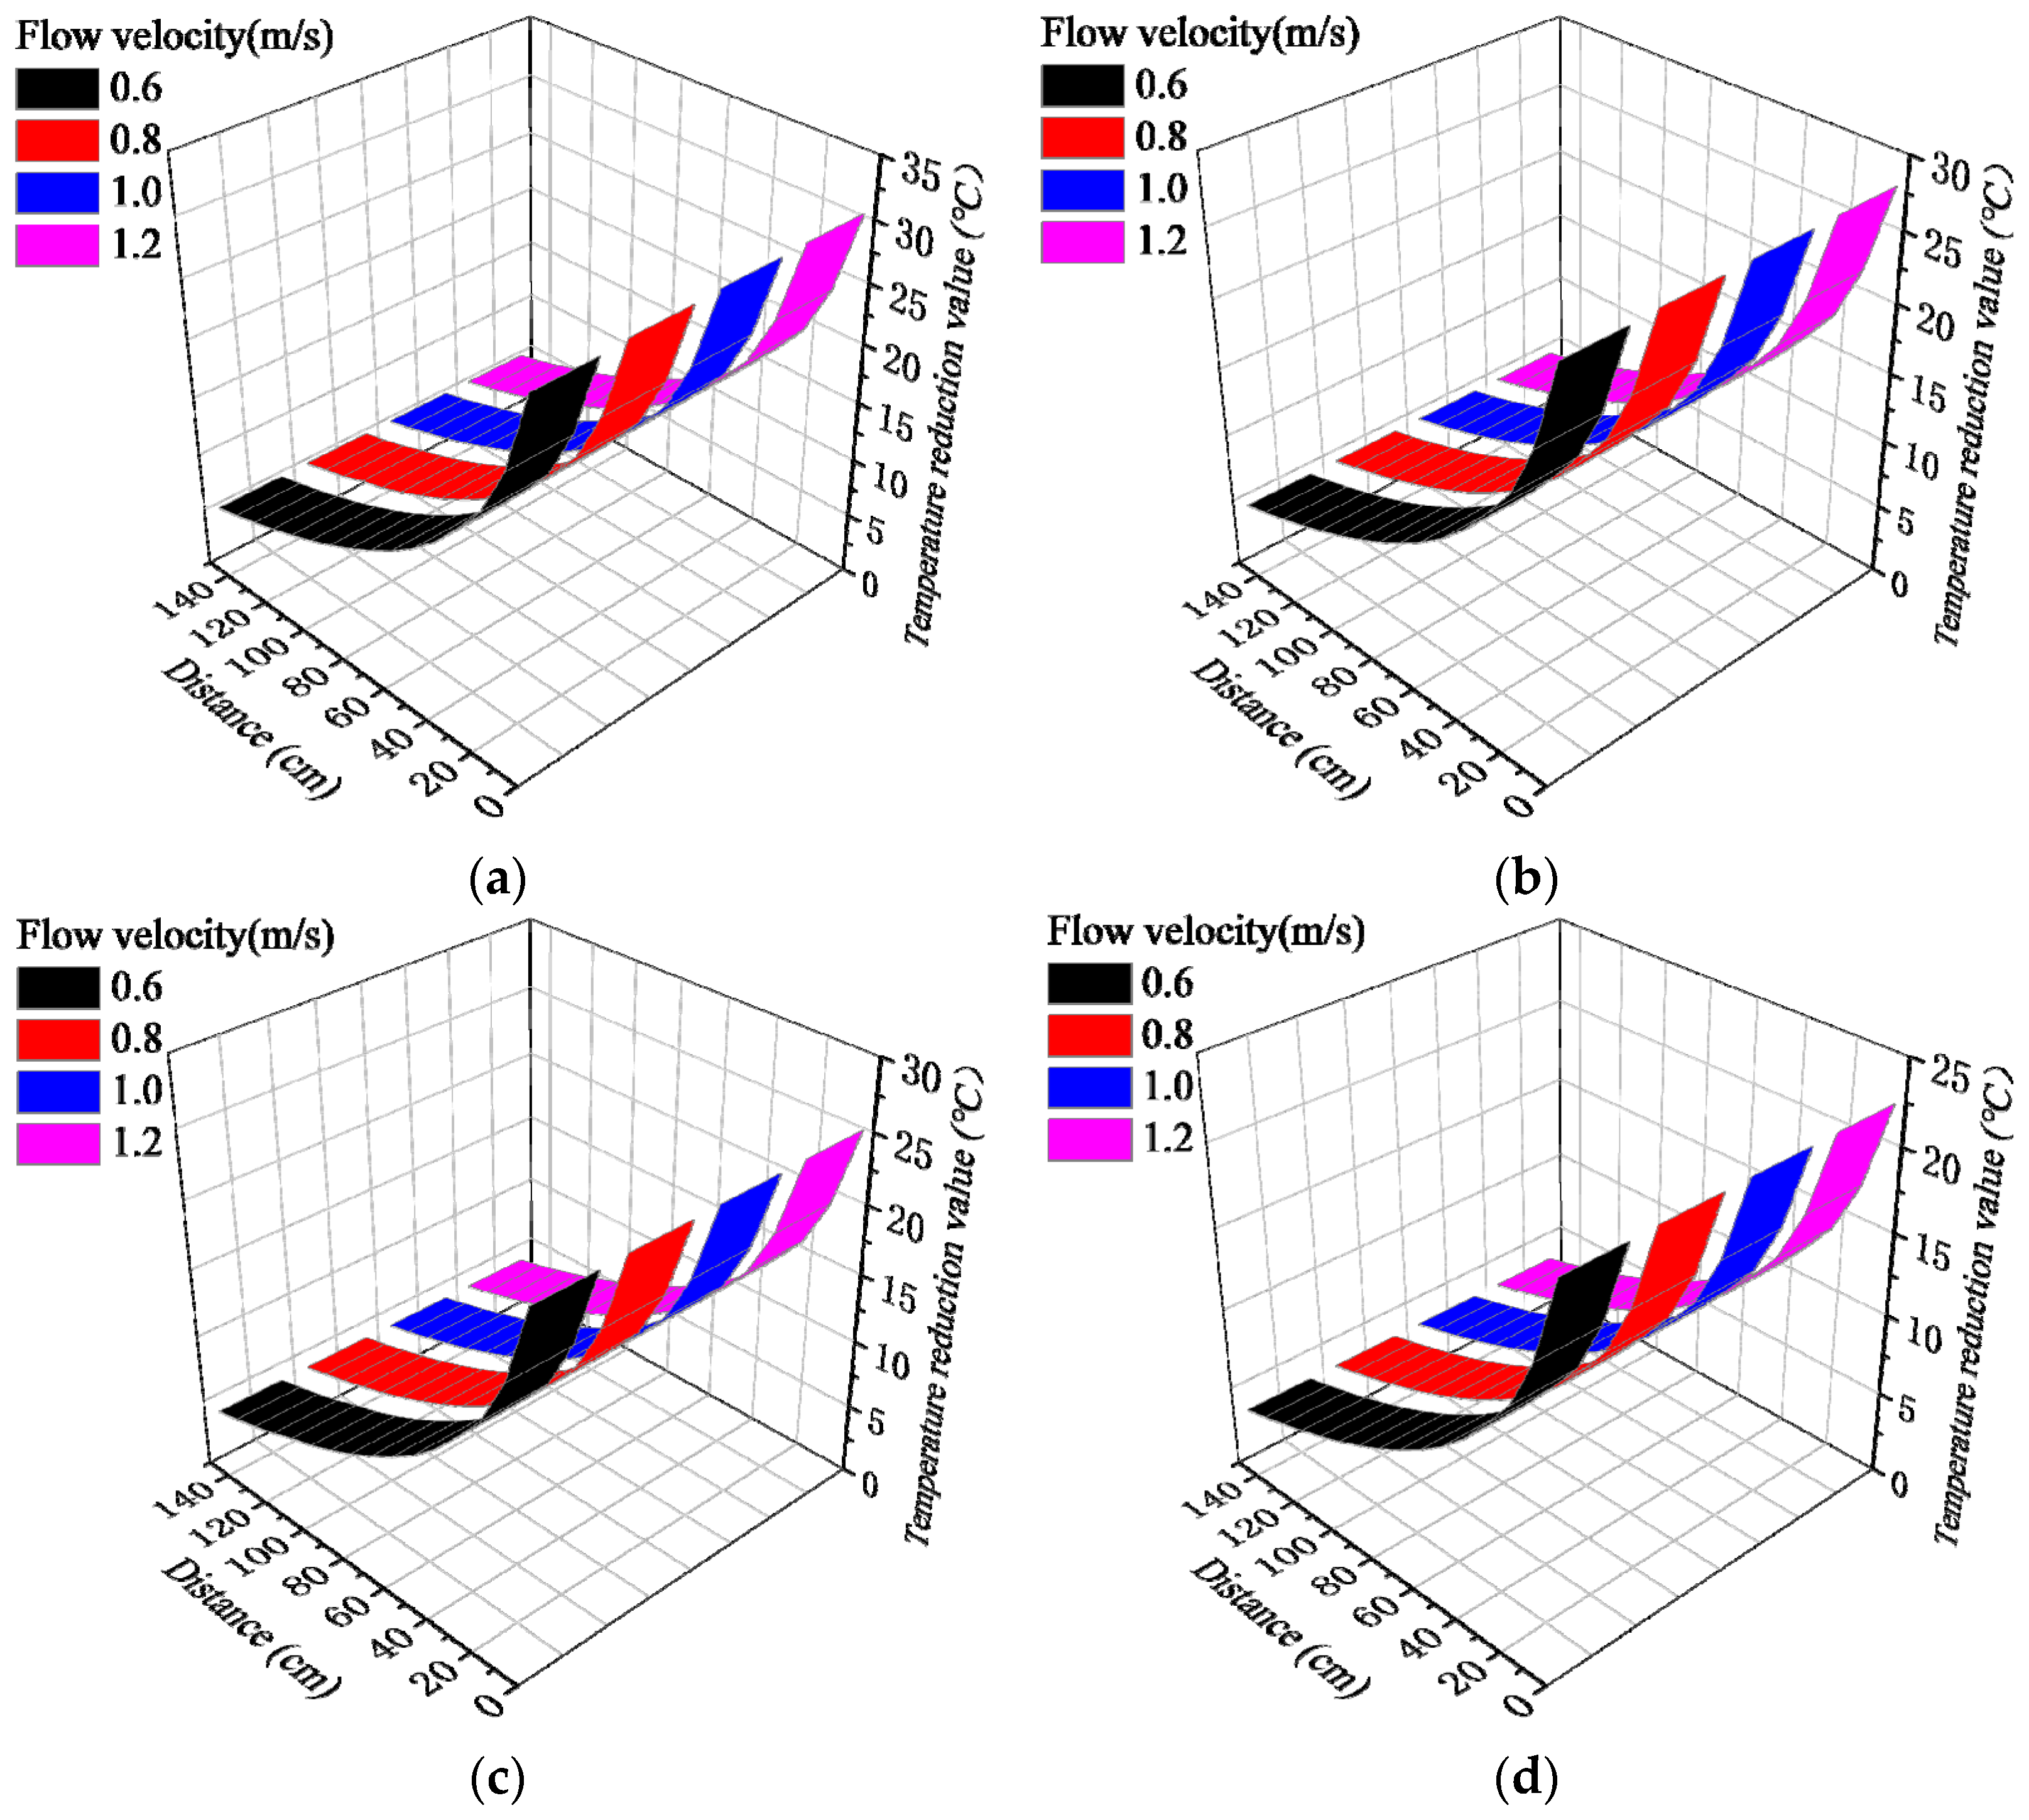
3.5. Influence of Pipe Cooling System Parameters

Pipe cooling systems have strong controllability, and the temperature gradient of mass concrete can be regulated by varying the pipe diameter, the water temperature, the water flow, and other conditions, with noticeable effects. Midas FEA (NX 2022) software was used to establish the concrete model of a quarter of a cylinder to study the effect of various parameters of the pipe cooling system on the temperature reduction in concrete around the tube cooling system. The diameter of the cylinder model was 5 m, the height was 8 m, the length of the X-axis unit was 10 cm, the length of the Y-axis unit was 20 cm, and the length of the Z-axis unit was 50 cm. The Midas FEA (NX 2022) analysis model is shown in Figure 11.
The pipe cooling system was placed inside the mass concrete cylinder, and low-temperature cold water was introduced to reduce the temperature rise caused by the concrete hydration heat through the heat exchange between the concrete and the low-temperature fluid. The concrete parameters were the same as above: the mold temperature was 20 °C, and the ambient temperature was 20 °C. The heat preservation measures for mass concrete structures were not considered, and natural surface heat dissipation was assumed instead. In the pipe cooling system, the effective diameter of the cooling pipe was set to 20~50 mm (step length of 10 mm), the water flow rate in the pipe was set to 0.6~1.2 m/s (step length of 0.2 m/s), and the water temperature in the pipe was set to 10~25 °C (step length of 5 °C). The above parameters were cross-analyzed for 64 working conditions, and a concrete temperature reduction of 5 °C was defined as the effective influence range of the pipe cooling system. The influence range and temperature results under different conditions are shown in Table 4, and some results are shown in Figure 12, Figure 13 and Figure 14.
Table 4 and Figure 12 show that the effective range of the tube cooling system and the decrease in the concrete temperature increased with a decrease in the water temperature. When the inlet water temperature was set to 10 °C, 15 °C, 20 °C, and 25 °C, the effective ranges for different pipe diameters and flow rates were 150 cm, 140 cm, 120 cm, and 110 cm around the cooling water pipe, respectively, and the maximum temperature reduction values were 30.5~31.3 °C, 27.7~28.4 °C, 24.9~25.6 °C, and 22.2~22.7 °C, respectively.
Table 4 and Figure 13 show that when the water temperature and the flow rate in the pipe cooling system were constant, increasing the diameter of the cooling water pipe had little effect on the effective range of reducing the concrete temperature. When the effective diameter was set to 20 mm, 30 mm, 40 mm, and 50 mm, the maximum temperature reduction ranges in the model for different water temperatures and flow rates were 30.5~22.2 °C, 30.8~22.4 °C, 31.0~22.5 °C, and 31.1~22.6 °C, respectively. The effective range was 150~110 mm around the cooling water pipe.
Table 4 and Figure 14 show that when the water temperature and the effective diameter in the pipe cooling system were constant, the temperature reduction value increased slightly when the flow rate increased from 0.6 m/s to 1.0 m/s. However, when the water flow rate increased from 1.0 m/s to 1.2 m/s, it did not affect the temperature reduction value, and the increase in the cooling water pipe flow rate had little effect on the influence range. When the flow rate was set to 0.6 m/s, 0.8 m/s, 1.0 m/s, and 1.2 m/s, the maximum temperature reduction ranges in the model for different water temperatures and flow rates were 30.5~22.2 °C, 30.8~22.4 °C, 31.0~22.5 °C, and 31.1~22.6 °C, respectively. The effective range was 150~110 mm around the cooling water pipe. Joo-Kyoung Yang et al. [37] and Adek Tasri et al. [36] also studied the influence of the parameters of the pipe cooling system on the temperature field of mass concrete; although the influence of each parameter was not quantified, the laws were found to be the same.

4. Conclusions

In this study, we combined field measurements and numerical methods to investigate the impact of hydration heat on mass concrete and water pipe cooling systems. The discrepancy between measurements and numerical results was analyzed, and the major factors affecting the temperature distribution in mass concrete were identified. The influence of concrete and pipe cooling system parameters on the temperature field of mass concrete was analyzed. The following conclusions were drawn from this study:
1.
The maximum TIATR of the field measurements was consistent with the numerical results. However, the timing of its occurrence needs to be corrected. The disparity mostly resulted from non-standard insulation, significant fluctuations in the ambient temperature, and the operational stability of the pipe cooling system. The ambient temperature had a significant impact on the observed results of TST and TISTD.
2.
When the mass concrete was naturally cooled without a pipe cooling system, the mold temperature was linearly related to the maximum TIATR, TST, and TISTD. For every 1 °C increase in the mold temperature, the maximum TIATR, TST, and TISTD were increased by approximately 1 °C, 0.2 °C, and 0.94 °C, respectively.
3.
The surface convection coefficient and ambient temperature had minimal impacts on TIATR but significantly influenced TST. Once the structure entered the cooling stage, a higher surface convection coefficient led to a more rapid decrease in the internal temperature. TST decreased at a higher rate when the convection coefficient was smaller and the ambient temperature was larger.
4.
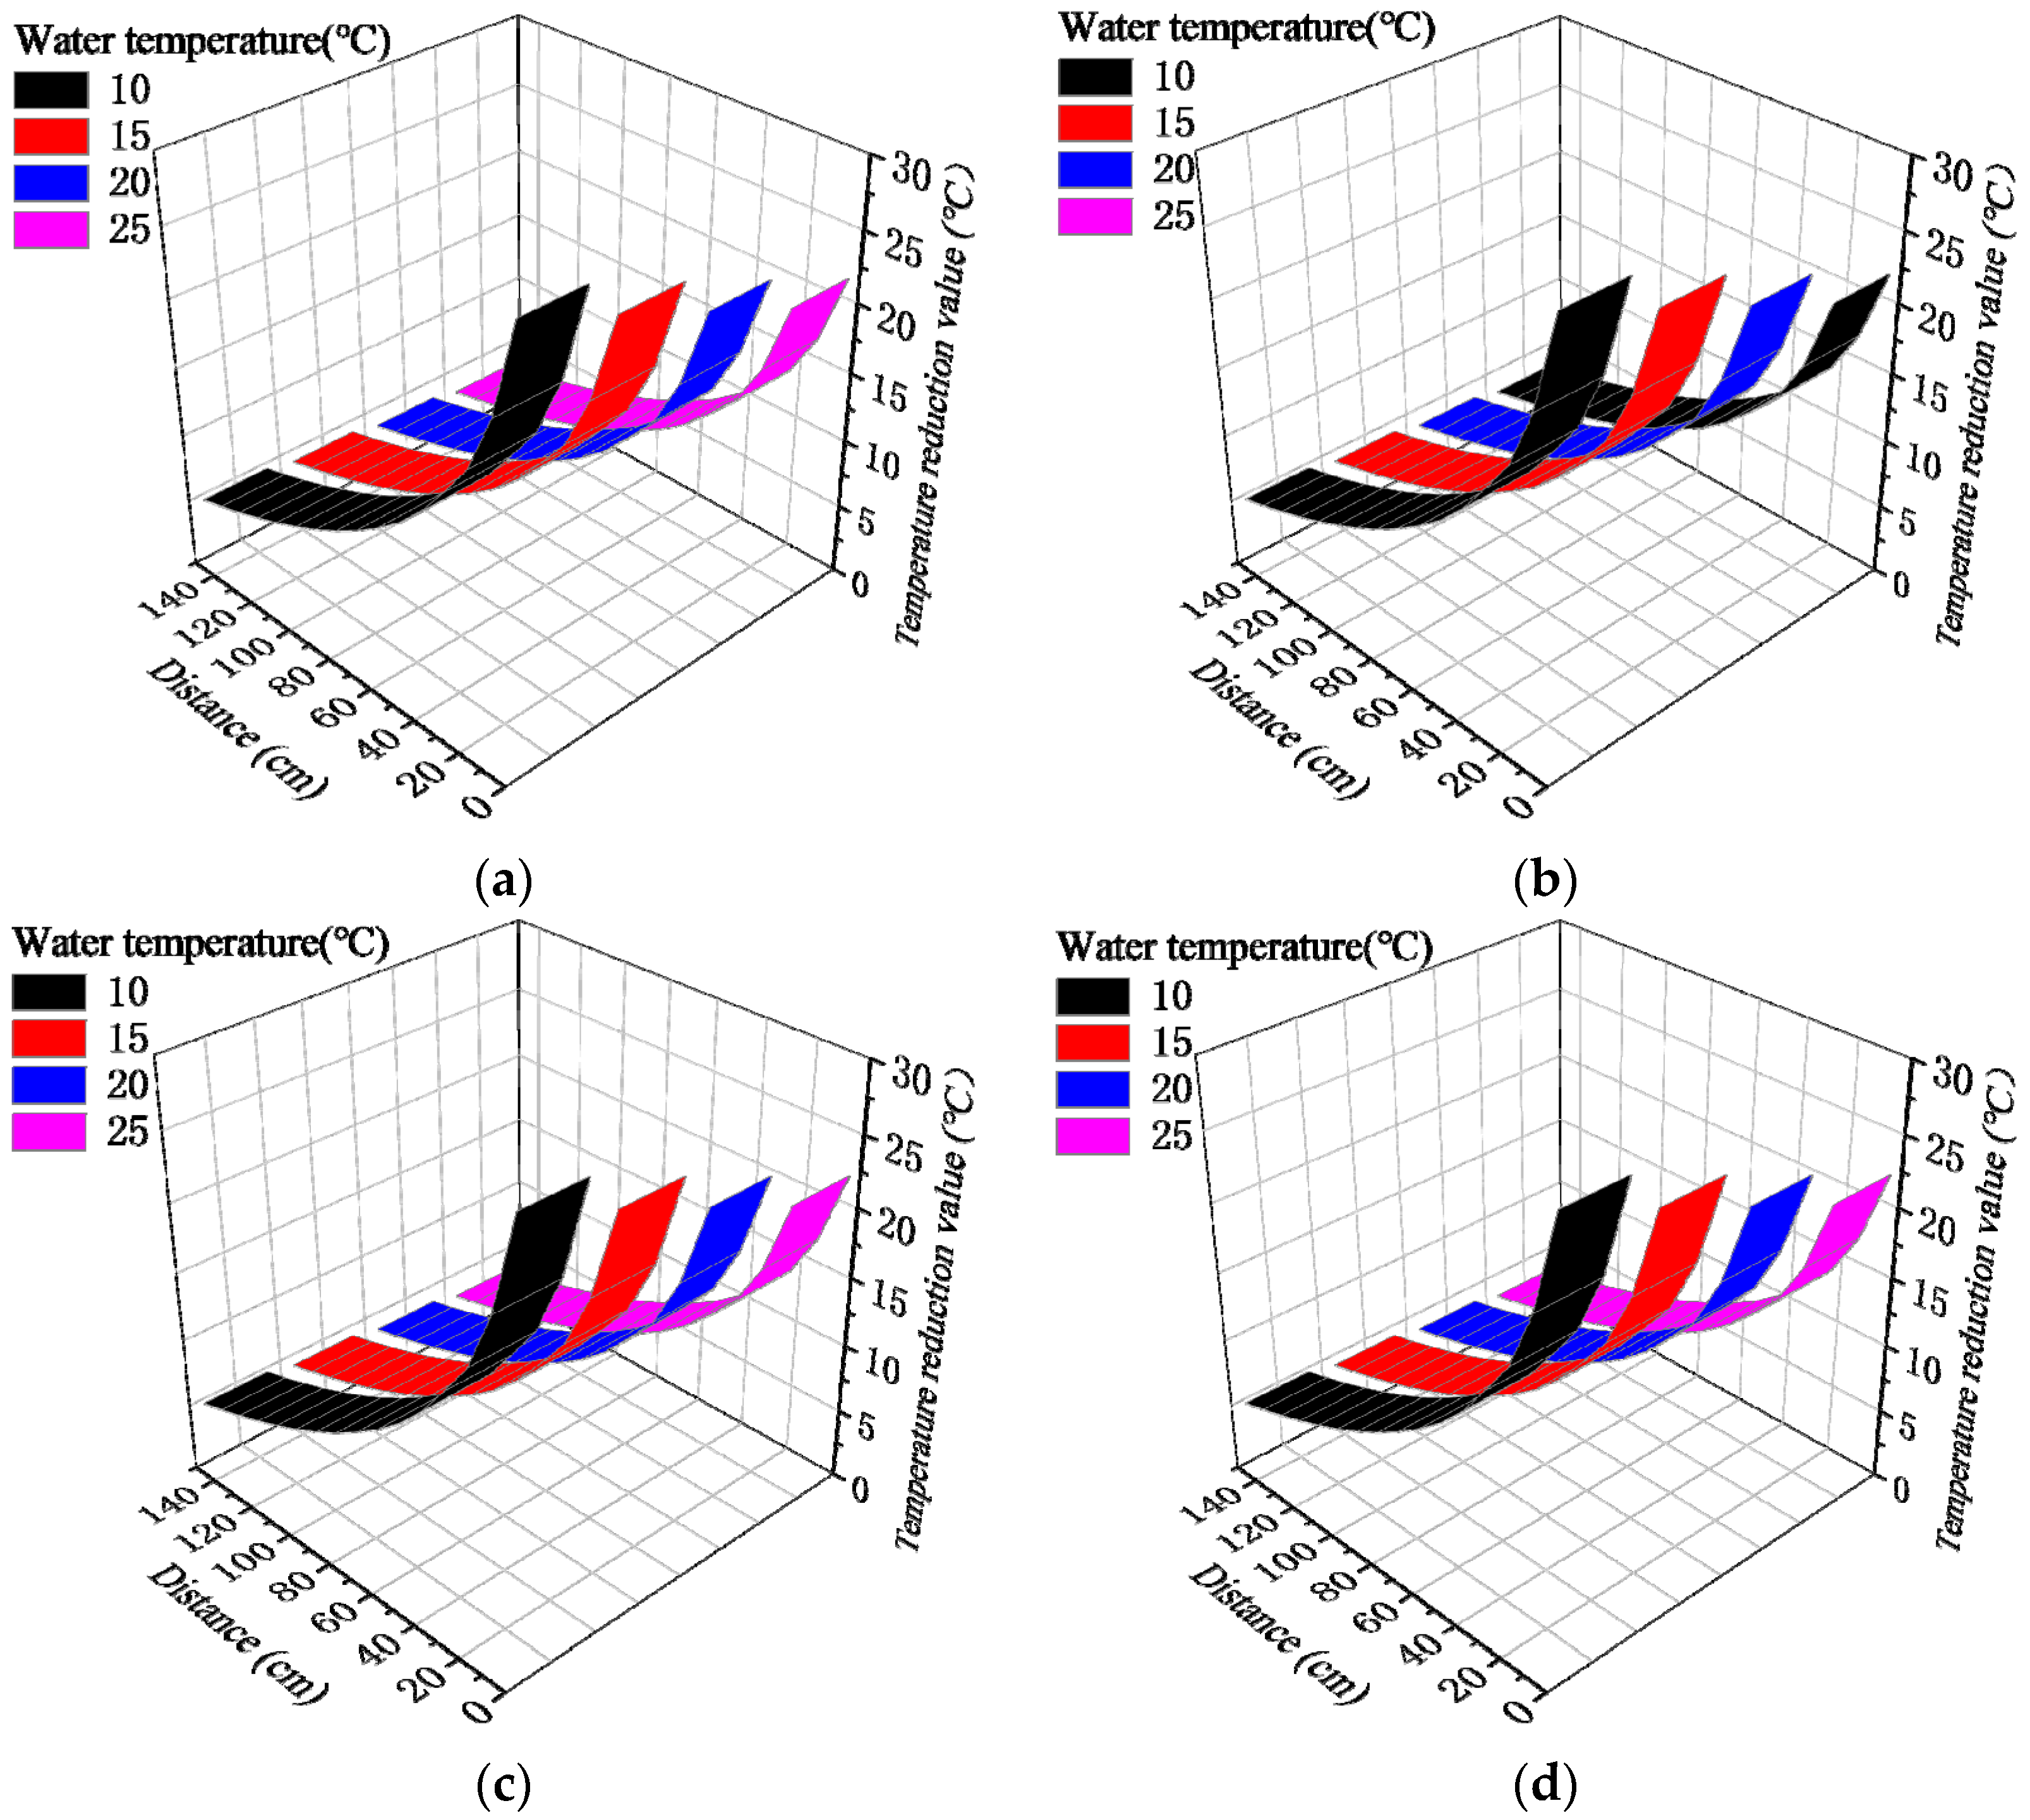
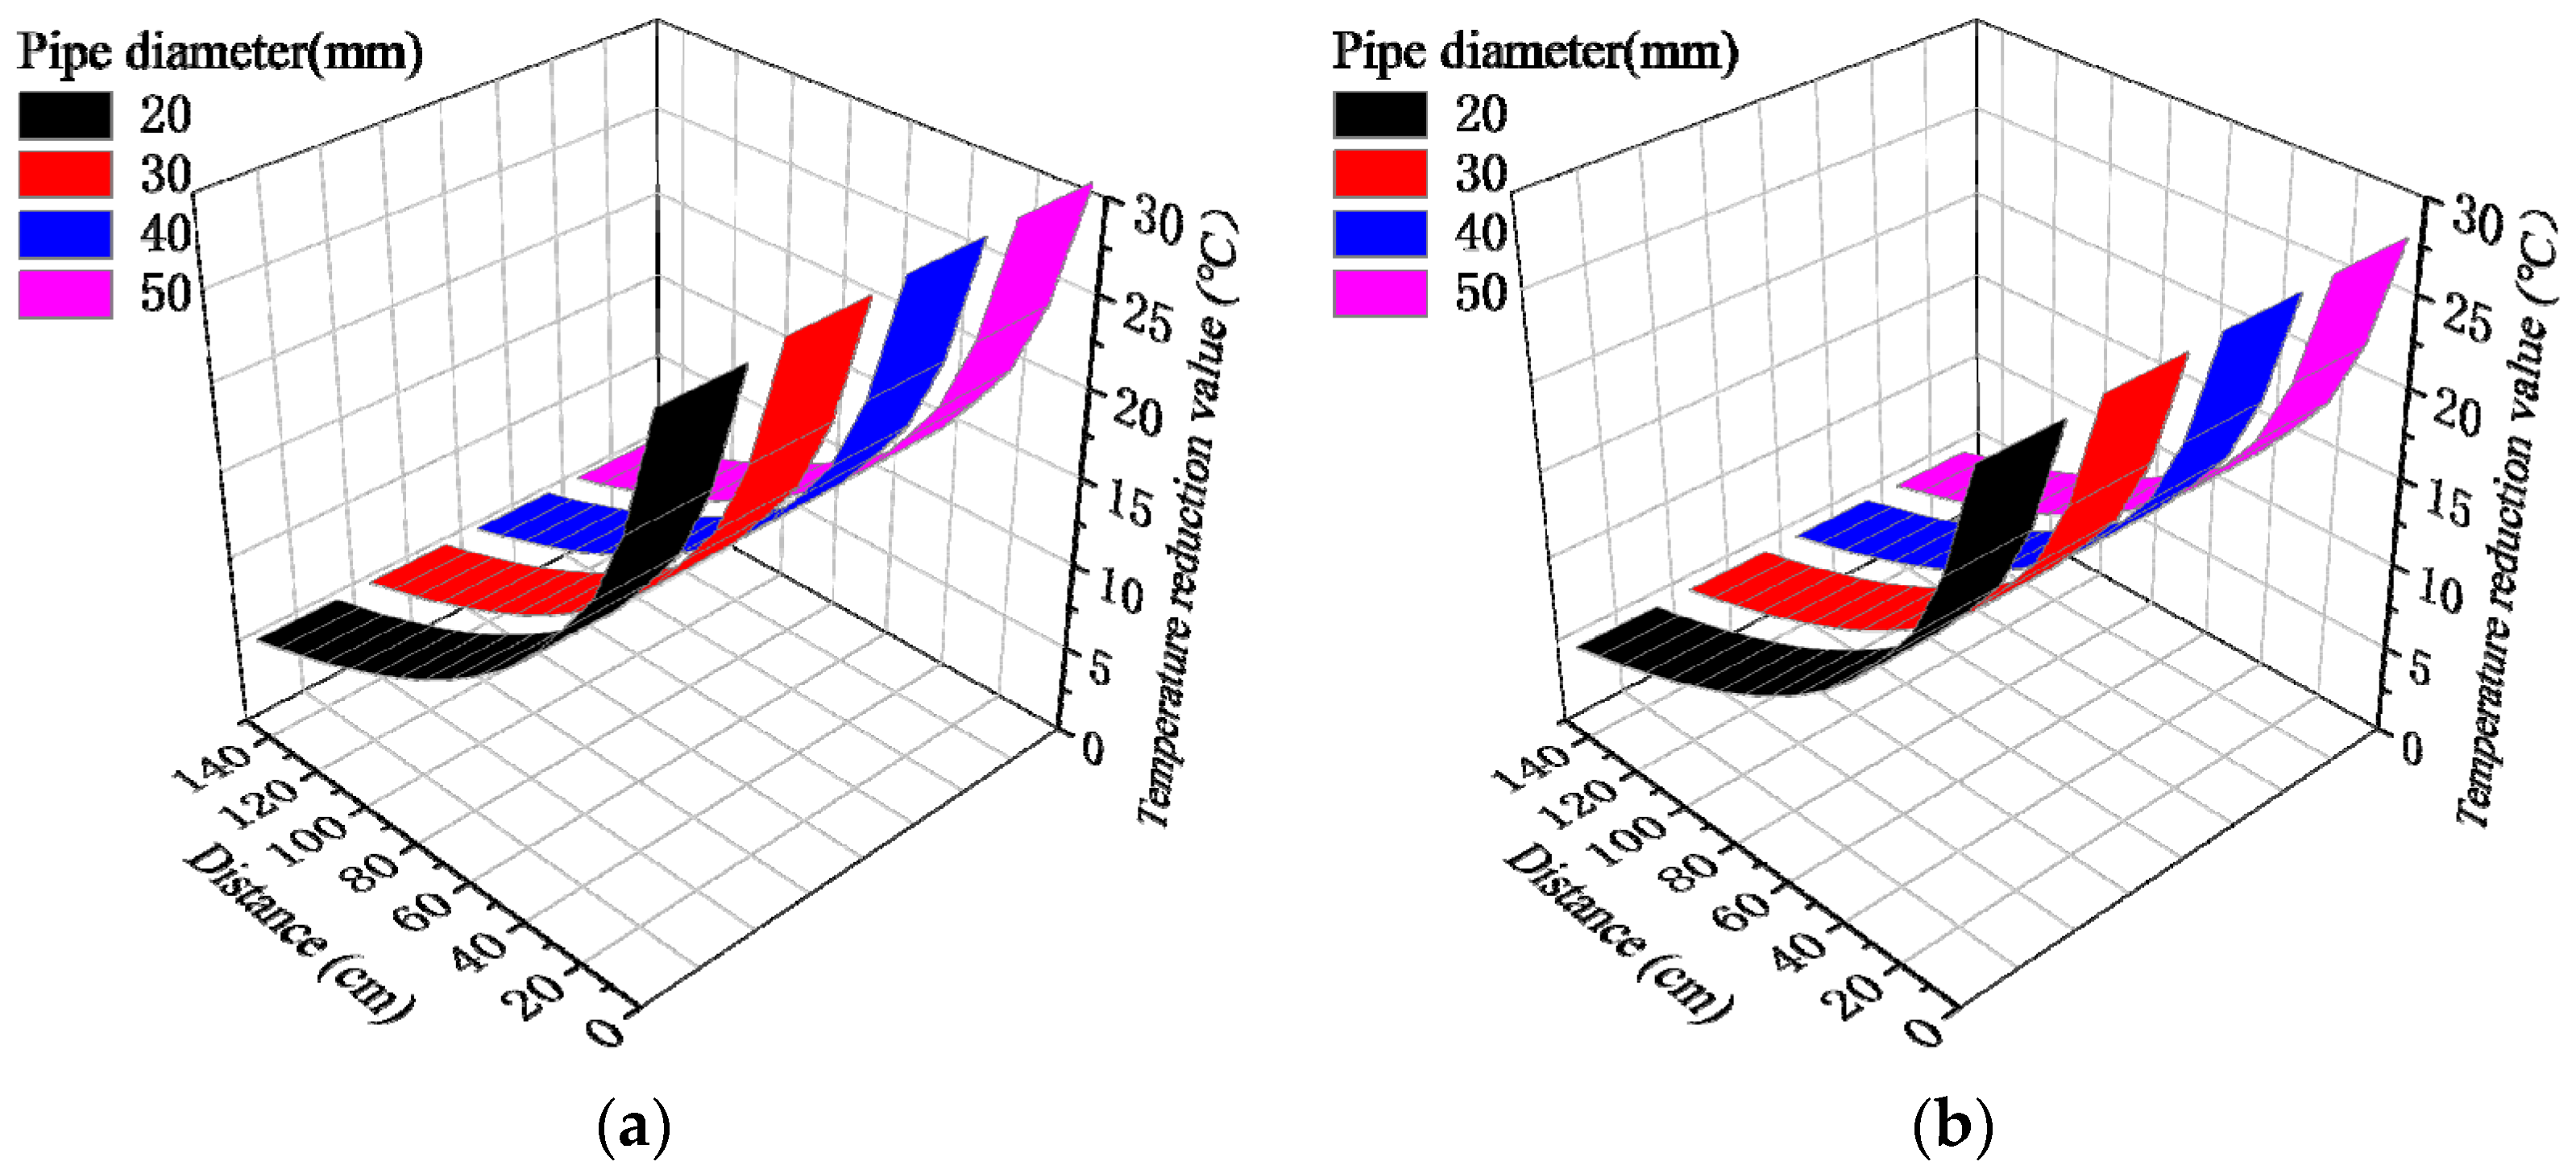
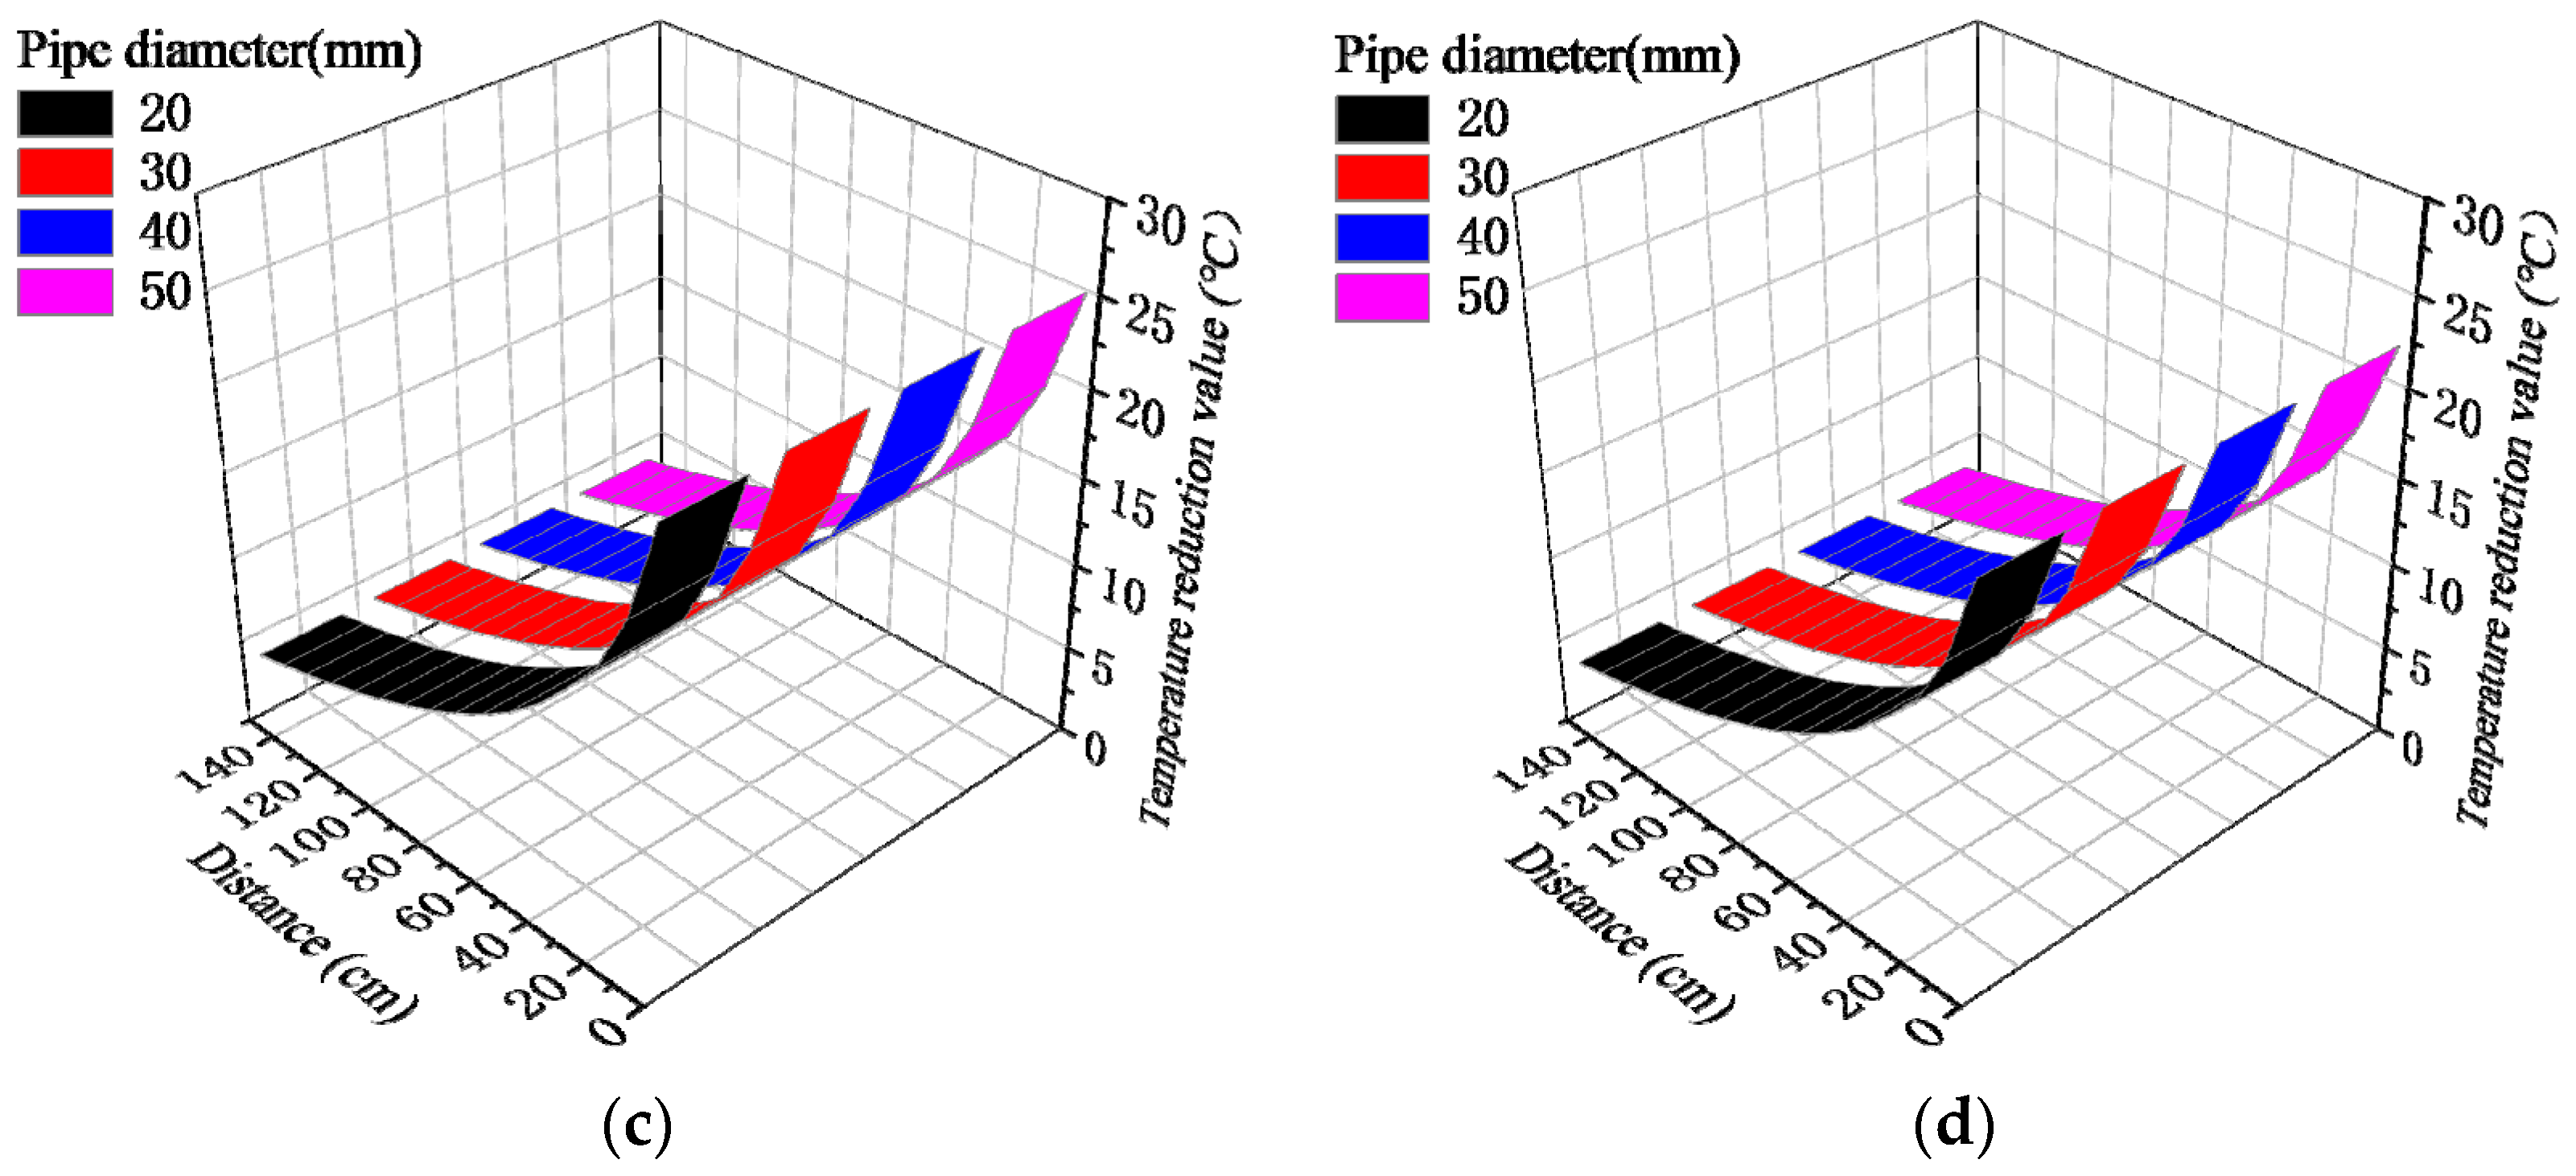
The pipe diameter and water flow velocity of the pipe cooling system had little effect on its effective range and temperature change value. However, reducing the water temperature significantly increased the effective range and the temperature change value. The effective range of the pipe cooling system (where the concrete temperature reduction value exceeds 5 °C) for pipe diameters of 20~50 mm, flow rates of 0.6~1.2 m/s, and water temperatures of 10~25 °C was about 1.2~1.5 m.

5. Further Development

In this study, we mainly investigated the hydration heat effect and pipe cooling system for a mass concrete cap based on field measurements and numerical methods. However, the pipe cooling system needs to be further studied with field testing.

Author Contributions

B.W.: Conceptualization, Methodology, Formal analysis, and Writing—original draft. Y.S.: Supervision, Funding acquisition, Investigation, Software, and Writing—review and editing. All authors have read and agreed to the published version of the manuscript.

Funding

This research received no external funding.

Data Availability Statement

Some or all data, models, or code that support the findings of this study are available from the corresponding author upon reasonable request.

Conflicts of Interest

The authors declare no conflicts of interest.

References

  1. Deng, N.C.; Yu, M.S.; Yao, X.Y. Intelligent Active Correction Technology and Application of Tower Displacement in Arch Bridge Cable Lifting Construction. Appl. Sci. 2021, 11, 9808. [Google Scholar] [CrossRef]
  2. Sun, J.P.; Li, J.B.; Jiang, Y.B.; Ma, X.G.; Tan, Z.H.; Zhufu, G.L. Key Construction Technology and Monitoring of Long-Span Steel Box Tied Arch Bridge. Int. J. Steel Struct. 2023, 23, 191–207. [Google Scholar] [CrossRef]
  3. Bobko, C.P.; Edwards, A.J.; Seracino, R.; Zia, P. Thermal Cracking of Mass Concrete Bridge Footings in Coastal Environments. J. Perform. Constr. Fac. 2015, 29, 04014171. [Google Scholar] [CrossRef]
  4. ACI Committee 207. Mass Concrete for Dams and Other Massive Structures. J. Proc. 1970, 67, 191–207. [Google Scholar]
  5. De Schutter, G.; Taerwe, L. Specific heat and thermal diffusivity of hardening concrete. Mag. Concr. Res. 1995, 47, 203–208. [Google Scholar] [CrossRef]
  6. Liu, B. Concrete Technology; People’s Transportation Publishing House: Beijing, China, 1995; pp. 123–125. (In Chinese) [Google Scholar]
  7. Code for Construction of Mass Concrete GB5049-2018; China Building Industry Press: Beijing, China, 2018. (In Chinese)
  8. Hamid, H.; Chorzepa, M.G.; Sullivan, M.; Durham, S.; Kim, S.S. Novelties in Material Development for Massive Concrete Structures: Reduction in Heat of Hydration Observed in Ternary Replacement Mixtures. Infrastructures 2018, 3, 8. [Google Scholar] [CrossRef]
  9. Pepe, M.; Lima, C.; Martinelli, E. Early-Age Properties of Concrete Based on Numerical Hydration Modelling: A Parametric Analysis. Materials 2020, 13, 2112. [Google Scholar] [CrossRef] [PubMed]
  10. Cha, S.L.; Jin, S.S. Prediction of thermal stresses in mass concrete structures with experimental and analytical results. Constr. Build. Mater. 2020, 258, 120367. [Google Scholar] [CrossRef]
  11. Fan, J.S.; Li, B.L.; Liu, C.; Liu, Y.F. An efficient model for simulation of temperature field of steel-concrete composite beam bridges. Structures 2022, 43, 1868–1880. [Google Scholar] [CrossRef]
  12. Abdel-Raheem, M.; Quintana, O.; Morales, M.; Marroquin-Villa, Y.; Ramos, D.; Hernandez, S. Construction methods used for controlling temperature in mass concrete structure. In Creative Construction Conference 2018, Proceedings of the Creative Construction Conference, Ljubljana, Slovenia, 30 June–3 July 2018; Budapest University of Technology and Economics: Budapest, Hungary, 2018; pp. 139–146. [Google Scholar]
  13. Abendeh, R.M.; Bani Baker, M. Using steel slag aggregate to strengthen self-compacting concrete durability. Proc. Inst. Civ. Eng. Struct. Build. 2022, 175, 925–939. [Google Scholar] [CrossRef]
  14. Madi, M.; Refaat, N.; Negm El Din, A.; Ziada, F.; Mazen, M.; Ahmed, S.; Hamza, A.S.; El Nahas, E.; Fathy, A.; Fahmy, E.H.; et al. The impact of mixing water temperature on portland cement concrete quality. In Proceedings of the CSCE Annual Conference, Vancouver, BC, Canada, 31 May–3 June 2017. [Google Scholar]
  15. Alamayreh, M.I.; Barham, T.; Shaban, N.A.; Olimat, A.N. Design of High Efficiency Aggregate Air Cooling System. In Proceedings of the Second Thermal and Fluids Engineering Conference, Las Vegas, NV, USA, 2–5 April 2017; pp. 2369–2375. [Google Scholar]
  16. Nguyen, T.C.; Luu, X.B. Reducing temperature difference in mass concrete by surface insulation. Mag. Civ. Eng. 2019, 88, 70–79. [Google Scholar]
  17. Alamayreh, M.I.; Alahmer, A.; Younes, M.B.; Bazlamit, S.M. Pre-Cooling Concrete System in Massive Concrete Production: Energy Analysis and Refrigerant Replacement. Energies 2022, 15, 1129. [Google Scholar] [CrossRef]
  18. Xue, S.; Geng, Y.; Li, X.; Li, J.; Song, Y. Song. Stress Development and Crack Monitoring of Massive Concrete Walls with Embedded Air-cooling Pipes. J. Adv. Concr. Technol. 2021, 19, 999–1015. [Google Scholar] [CrossRef]
  19. Deppo, L.L.; Dates, C.; Fiortto, V. Optimizing the Choice of Quarries for Large Dam Construction. J. Water Power Dam Constr. 1985, 37, 40–44. [Google Scholar]
  20. Adebar, P.; Zhou, Z. Bearing Strength of Compressive Struts Confined by Plain Concrete. ACI Struct. J. 1993, 90, 534–541. [Google Scholar]
  21. Aniskin, N.; Nguyen, T.C.; Bui, A.K. The use of ice to cool the concrete mix in the construction of massive structures. In Proceedings of the E3S Web of Conferences, Khabarovsk, Russia, 7–9 September 2021; Volume 264. [Google Scholar]
  22. Nguyen, T.C.; Nguyen, V.Q.; Aniskin, N.; Phung, B.T.; Hoang, Q.L. Building a nomogram to predict maximum temperature in mass concrete at an early age. In Proceedings of the E3S Web of Conferences, Khabarovsk, Russia, 7–9 September 2021; Volume 263. [Google Scholar]
  23. Nakane, S.; Saito, H.; Ohike, T. Strength development and microstructure of cement and concrete precooled with liquid nitrogen. In Proceedings of the International Conference on Concrete in Hot Climates, Concrete in Hot Climates, Torquay, UK, 21–25 September 1992. [Google Scholar]
  24. Harith, I.K.; Hassan, M.S.; Hasan, S.S. Liquid nitrogen effect on the fresh concrete properties in hot weathering concrete. Innov. Infrastruct. Solut. 2022, 7, 127. [Google Scholar] [CrossRef]
  25. Bamforth, P.B. Early-Age Thermal Crack Control in Concrete; CIRIA Report C660; Construction, Built Environment, Civil Engineering: London, UK, 2007. [Google Scholar]
  26. Wang, Y.; Liu, F.; Xu, L.; Zhao, H. Effect of elevated temperatures and cooling methods on strength of concrete made with coarse and fine recycled concrete aggregates. Constr. Build. Mater. 2019, 210, 540–547. [Google Scholar] [CrossRef]
  27. Tasri, A.; Susilawati, A. Effect of cooling water temperature and space between cooling pipes of post-cooling system on temperature and thermal stress in mass concrete. J. Build. Eng. 2019, 24, 100731. [Google Scholar] [CrossRef]
  28. Ben Jemaa, R.; Mansouri, R.; Boukholda, I.; Bellagi, A. Energy and exergy investigation of R1234ze as R134a replacement in vapor compression chillers. Int. J. Hydrogen Energy 2017, 42, 12877–12887. [Google Scholar] [CrossRef]
  29. Alabdulkarem, A.; Eldeeb, R.; Hwang, Y.; Aute, V.; Radermacher, R. Testing, simulation and soft-optimization of R410A low-GWP alternatives in heat pump system. Int. J. Refrig. 2015, 60, 106–117. [Google Scholar] [CrossRef]
  30. Vali, S.S.; Setty, T.P.; Babu, A. Analytical computation of thermodynamic performance parameters of actual vapour compression refrigeration system with R22, R32, R134a, R152a, R290 and R1270. MATEC Web Conf. EDP Sci. 2018, 144, 4009. [Google Scholar] [CrossRef]
  31. Seo, T.S.; Kim, S.S.; Lim, C.K. Experimental study on hydration heat control of mass concrete by vertical pipe cooling method. J. Asian Archit. Build. Eng. 2015, 14, 657–662. [Google Scholar] [CrossRef]
  32. Lawrence, A.M.; Tia, M.; Ferraro, C.C.; Bergin, M. Effect of early age strength on cracking in mass concrete containing different supplementary cementations materials: Experimental and finite-element investigation. J. Mater. Civ. Eng. 2014, 24, 362–372. [Google Scholar] [CrossRef]
  33. Huynh, T.P.; Tang, V.L. Prevention of crack formation in massive concrete at an early age by cooling pipe system. Asian J. Civ. Eng. 2019, 20, 1101–1107. [Google Scholar]
  34. Zhang, T.; Wang, H.; Luo, Y.; Yuan, Y.; Wang, W. Hydration heat control of mass concrete by pipe cooling method and on-site monitoring-based influence analysis of temperature for a steel box arch bridge construction. Materials 2023, 16, 2925. [Google Scholar] [CrossRef]
  35. Huang, Y.; Liu, G.; Huang, S.; Rao, R.; Hu, C. Experimental and finite element investigations on the temperature field of a massive bridge pier caused by the hydration heat of concrete. Constr. Build. Mater. 2018, 192, 240–252. [Google Scholar] [CrossRef]
  36. Tasri, A.; Susilawati, A. Effect of material of post-cooling pipes on temperature and thermal stress in mass concrete. Structures 2019, 20, 204–212. [Google Scholar] [CrossRef]
  37. Yang, J.K.; Lee, Y.; Kim, J.K. Heat Transfer Coefficient in Floe Convention of Pipe-Cooling System in Massive Concrete. J. Adv. Concr. Technol. 2011, 9, 103–114. [Google Scholar] [CrossRef]
  38. Xiaolong, G.; Chunguang, L.; Yunhong, Q. Study on On-site Monitoring of Hydration Heat of Mass Concrete for Bridge Slab Based on Measured Data. Intell. Autom. Soft Comput. 2019, 25, 775–783. [Google Scholar]
  39. Zhao, Z. Handbook of High—Rise Building Construction; China Construction Industry Press: Beijing, China, 1997. (In Chinese) [Google Scholar]
Figure 1. Pipe cooling system layout: (a) elevation diagram of the tube cooling system; (b) first- and third-floor plans of the tube cooling system; (c) second- and fourth-floor plans of the tube cooling system.
Buildings 14 02413 g001
Figure 2. Numerical model diagram: (a) overall numerical model of pile cap; temperature field distributions (b) with and (c) without pipe cooling system.
Buildings 14 02413 g002
Figure 3. Pile cap temperature measuring point layout diagram: (a) facade layout; (b) plane layout.
Buildings 14 02413 g003
Figure 4. The curves of the internal adiabatic temperature rise (TIATR), the surface temperature (TST), and the internal surface temperature difference (TISTD) are: (a) A# cap; (b) B# cap.
Buildings 14 02413 g004
Figure 5. Internal adiabatic temperature rise (TIATR) for different mold temperatures: (a) TIATR; (b) maximum TIATR.
Buildings 14 02413 g005
Figure 6. Surface temperature (TST) for different mold temperatures: (a) TST; (b) maximum TST.
Buildings 14 02413 g006
Figure 7. Internal surface temperature difference (TISTD) for different mold temperatures: (a) TISTD; (b) maximum TISTD.
Buildings 14 02413 g007
Figure 8. Internal adiabatic temperature rise (TIATR) for different ambient temperatures: (a) −5 °C; (b) 0 °C; (c) 5 °C; (d) 10 °C; (e) 15 °C; (f) 20 °C; (g) 25 °C; (h) 30 °C.
Buildings 14 02413 g008aBuildings 14 02413 g008b
Figure 9. Surface temperature (TST) for different ambient temperatures: (a) −5 °C; (b) 0 °C; (c) 5 °C; (d) 10 °C; (e) 15 °C; (f) 20 °C; (g) 25 °C; (h) 30 °C.
Buildings 14 02413 g009aBuildings 14 02413 g009b
Figure 10. Internal surface temperature difference (TISTD) for different ambient temperatures: (a) −5 °C; (b) 0 °C; (c) 5 °C; (d) 10 °C; (e) 15 °C; (f) 20 °C; (g) 25 °C; (h) 30 °C.
Buildings 14 02413 g010aBuildings 14 02413 g010b
Figure 11. The Midas FEA (NX 2022) analysis model.
Buildings 14 02413 g011
Figure 12. Influence ranges and temperature change values for different effective diameters and water flow rates: (a) 20 mm and 0.6 m/s; (b) 30 mm and 0.8 m/s; (c) 40 mm and 1.0 m/s; (d) 50 mm and 1.2 m/s.
Buildings 14 02413 g012
Figure 13. Influence ranges and temperature change values for different water temperatures and water flow rates: (a) 10 °C and 0.6 m/s; (b) 15 °C and 0.8 m/s; (c) 20 °C and 1.0 m/s; (d) 25 °C and 1.2 m/s.
Buildings 14 02413 g013aBuildings 14 02413 g013b
Figure 14. Influence ranges and temperature change values for different effective diameters and water temperatures: (a) 10 °C and 20 mm; (b) 15 °C and 30 mm; (c) 20 °C and 40 mm; (d) 25 °C and 50 mm.
Buildings 14 02413 g014
Table 1. Concrete mix ratios, thermal conductivity, and specific heat capacity values of concrete materials.
Concrete MaterialsCementSandGravelWaterFly AshWater Reducer
Mix ratio (kg/m3)24016077910761454
Thermal conductivity ( W / ( m K ) )2.2183.0822.9080.6000.23/
Specific heat capacity ( k J / ( k g K ) )0.5360.7450.7084.1870.92/
Table 2. Hydration heat parameter adjustment coefficient values.
Parameter010%20%30%40%
Fly ash10.960.950.930.82
Slag powder 110.930.920.84
Table 3. Analysis scheme.
Ambient Temperature−5 °C0 °C5 °C10 °C15 °C20 °C25 °C30 °C
Surface Convection Coefficient
3.275A1B1C1D1E1F1G1H1
5.56A2B2C2D2E2F2G2H2
8.33A3B3C3D3E3F3G3H3
11.11A4B4C4D4E4F4G4H4
13.89A5B5C5D5E5F5G5H5
16.67A6B6C6D6E6F6G6H6
21.279A7B7C7D7E7F7G7H7
A1~H7 represent the working conditions, and the unit of the surface convection coefficient is kW/(m2∙K).
Table 4. Analysis scheme of influence of ambient temperature and surface convection coefficient.
Effective Influence Range (cm)/
Temperature Reduction Value (°C)
Water Temperature (°C)
10152025
Effective diameter (mm)/Water flow rate (m/s)20/0.6150/30.5–5.0130/27.7–5.4120/24.9–5.3110/22.2–5.2
20/0.8150/30.7–5.0130/27.9–5.5120/25.1–5.4110/22.3–5.2
20/1.0150/30.9–5.0140/28.1–5.0120/25.2–5.4110/22.4–5.2
20/1.2150/31.0–5.0140/28.1–5.0120/25.3–5.4110/22.5–5.3
30/0.6150/30.8–5.0140/28.0–5.0120/25.2–5.4110/22.4–5.2
30/0.8150/31.0–5.0140/28.2–5.0120/25.3–5.4110/22.5–5.3
30/1.0150/31.1–5.0140/28.2–5.0120/25.4–5.4110/22.6–5.3
30/1.2150/31.1–5.0140/28.3–5.0120/25.5–5.5110/22.6–5.3
40/0.6150/31.0–5.0140/28.2–5.0120/25.4–5.5110/22.5–5.3
40/0.8150/31.1–5.0140/28.3–5.0120/25.4–5.5110/22.6–5.3
40/1.0150/31.2–5.0140/28.3–5.0120/25.5–5.5110/22.7–5.3
40/1.2150/31.2–5.0140/28.4–5.0120/25.5–5.5110/22.7–5.3
50/0.6150/31.1–5.0140/28.3–5.0120/25.4–5.4110/22.6–5.3
50/0.8150/31.2–5.0140/28.4–5.0120/25.5–5.5110/22.7–5.3
50/1.0150/31.3–5.0140/28.4–5.0120/25.6–5.5110/22.7–5.3
50/1.2150/31.3–5.0140/28.4–5.0120/25.6–5.5110/22.7–5.3
Disclaimer/Publisher’s Note: The statements, opinions and data contained in all publications are solely those of the individual author(s) and contributor(s) and not of MDPI and/or the editor(s). MDPI and/or the editor(s) disclaim responsibility for any injury to people or property resulting from any ideas, methods, instructions or products referred to in the content.

