Abstract
Precast concrete (PC) shear wall members are essential components of the precast concrete shear wall structural system. Therefore, it is crucial to research their materials, and seismic performance is an important and vital indicator to promote the development of prefabricated buildings. This study introduced a new type of precast concrete sandwich shear wall, the precast high-titanium heavy slag concrete sandwich panel wall (PHCSPW), by replacing ordinary concrete coarse and fine aggregates with high-titanium heavy slag and adding insulation boards. This study constructed a cast-in-place high-titanium heavy slag concrete wall (CHCW) for comparative pseudo-static tests to validate its seismic performance. Finite element simulation analysis was conducted to compare and validate the reliability of the test. Considering the limitations of the test conditions, it also researched the seismic performance of PHCSPW by simulating different parameters such as reinforcement ratio, concrete strength, and axial compression ratio. It concludes the following: (1) The failure mode, stress-strain distribution, and ultimate bearing capacity values of PHCSPW and CHCW were consistent with theoretical and experimental analysis results. (2) PHCSPW exhibited high stiffness before cracking but experienced a rapid stiffness degradation rate after cracking. (3) The development trend of the PHCSPW and CHCW hysteresis curve is the same as the skeleton curve. There is little difference between the bearing capacity and deformation capacity after cracking. Comparing the hysteresis loops of CHCW and PHCSPW, it is found that PHCSPW has a larger hysteresis loop area, which indicates that PHCSPW has better energy dissipation capacity. The value of the yield load of the specimen compared with the peak load is between 0.636 and 0.888; that is, the difference inthe early-stage stiffness of the specimen is small. The yield load of PHCSPW is slightly larger than that of CHCW. The maximum carrying capacity of CHCW is about 68.31% of that of PHCSPW. (4) The simulation of different parameters revealed that the energy dissipation capacity of the members increased within a specific range with an increasing reinforcement ratio. PHCSPW demonstrated superior energy dissipation capacity. The influence of concrete strength on the energy dissipation capacity of the members was relatively small. The energy dissipation capacity of the members decreased with increasing axial compression ratio.
1. Introduction
The construction industry’s industrialisation has fast development [1], and the advancement of prefabricated buildings is a significant manifestation of this trend. In prefabricated buildings, PC shear wall members are crucial constituents, and numerous scholars have conducted extensive experimental studies on them, providing a solid theoretical foundation, including studies on the mechanical performance of joints and structural measures [2]. Moreover, with the global trend towards zero-carbon and low-carbon development concepts, the construction industry adopts more eco-friendly materials for PC members, such as shear walls, reflecting the industry’s transition towards sustainable development. Ultimately, achieving industrialisation in the construction industry, energy conservation, emission reduction, and low-carbon environmental protection aligns with the global consensus on sustainable development and represents the development trend of the construction industry [3]. This study developed a new type of precast concrete sandwich shear wall by replacing ordinary concrete coarse and fine aggregates with high-titanium heavy slag and adding insulation boards. This innovative wall structure possesses advantages such as environmental and energy efficiency. Its widespread adoption in the construction industry is expected to generate significant economic, social, and ecological benefits, thereby promoting the advancement of the construction industry.
In research on precast concrete sandwich shear walls, addressing the traditional problem of external insulation for shear walls has been challenging. Typically, solutions involve retrofitting insulation boards onto the exterior of the shear walls. However, sandwich walls offer a more effective resolution to this issue [4]. European countries adopted sandwich wall technology early in the construction industry. In response, various countries have developed comprehensive design schemes and issued a series of construction process specifications to regulate its implementation. For instance, detailed provisions exist regarding crack control in sandwich concrete wall panels in the Uniform Building Code and reinforcement placement within the concrete slab panels. The sandwich wall technology in Japan has been in development for a relatively long time and is reasonably well-established. In 1985, the Japanese Architectural Standard Specification JASS 14 Curtain Wall was promulgated and implemented [5], stipulating the design, fabrication, construction, and acceptance criteria for sandwich walls. The Japanese Architectural Standard Specification JASS 10 [6] Precast Concrete Work [6] was also issued specifically for residential construction. Bush and Stain [7] fabricated precast sandwich insulation panels with truss reinforcement and researched their flexural performance. Their results indicate that when the connectors are parallel to the wall, the wall exhibits good bearing capacity and flexural performance.
Kang [8] proposed a design model for sandwich wall panels (SWPs) with an insulating core supported by glass-reinforced polymer (GRP) grids. In this model, the ultimate limit state capacity and serviceability limit state capacity are unified into a single capacity factor, meeting the requirements for the ultimate limit state and the serviceability requirements. Choi [9] studied the composite performance of insulated sandwich concrete wall panels (ISCWPs) under monotonic and wind loads. Their findings suggest that rough surfaces and good adhesive properties of insulation materials enhance resistance to monotonic and cyclic loads. Studying the life cycle energy consumption of sandwich wall panels with different connectors, Dong [10] concluded that reducing the thermal conductivity of the structural layers can improve the impact of connectors on the lifecycle of the wall. Through a feasibility study on lightweight concrete sandwich wall structures incorporating expanded polystyrene (EPS), Fernando [11] found that converting non-biodegradable waste materials into high-quality building materials results in foam concrete. Combined with cement fibre boards, it produces lightweight wall panels suitable for load-bearing walls in single-story buildings and non-load-bearing walls in multi-story buildings.
Kumar [12] investigated the structural performance of polymer concrete sandwich wall panels reinforced with basalt fibre-reinforced polymer (BFRP) grids under concentric axial loads. Their results indicated that the slenderness ratio significantly affects the ultimate axial load of the sandwich wall. At the same time, the longitudinal spacing of connectors does not significantly impact the ultimate load. The theoretical axial load capacity closely matches the experimental axial load capacity. Rosenthal [13] conducted axial compression tests on composite walls made of lightweight insulation aggregate, finding that the specimens did not fail due to compressive buckling but rather due to vertical cracks in the overlap sections of the supports. Therefore, it is suggested that transverse steel bars be installed at the supports of the panels to mitigate this issue. Mohamad [14] conducted eccentric compression tests on double-symmetric and single-symmetric truss sandwich walls. Double-symmetric truss sandwich walls exhibit higher bearing capacity and smaller deflection than single-symmetric ones.
Pavese [15] conducted seismic tests on precast sandwich walls, simulating full-scale shear walls with and without openings. From the performance and failure mode of the wall, it can be inferred that there is a strong coupling effect between bending and shear. During the experiment, both strength and stiffness exhibited slow degradation. Gara [16] conducted eccentric compression tests, axial compression tests, and diagonal compression tests on precast sandwich walls, showing that the bearing capacity under axial compression is higher, the results for ultimate load buckling and linear buckling are similar, and the ultimate load is lower under eccentric compression. In diagonal compression tests, mesh reinforcement within the concrete leads to a higher cracking load. Amran [17] conducted axial compression tests on foam concrete sandwich walls and derived a formula for calculating their bearing capacity through finite element analysis. Choi [18] studied the shear resistance performance of walls with sandwich layers using different insulation materials.
Benayoune [19] conducted full-scale experiments to study the vertical bearing capacity of sandwich wall panels. Benayoune [20,21] studied fabricated sandwich walls with FRP (fibre-reinforced polymer) connectors and their flexural performance. Woltman [22] researched the design and construction methods of sandwich insulation wall enclosures, which primarily included the design of connectors and the selection and application of reinforcement, concrete, and insulation materials. Li [23] researched the fire resistance performance of precast concrete connected with FRP connectors and concrete with outer and inner reinforcement. Zhong [24] conducted experiments on shear walls with different numbers of stirrups in edge members and found that plastic hinges concentrated at the horizontal joints of the specimens. The specimens exhibited sufficient strength and stable hysteretic characteristics. In the later stages of testing, the failure of tensile reinforcement resulted in insufficient utilisation of the concrete’s inherent strength, reducing the ductility of the specimens.
Zhu [25] conducted out-of-plane static tests on sandwich insulation walls, showing that the walls exhibited high bearing capacity and crack resistance, with significant safety margin and flexural stiffness. Zhong [26] researched the out-of-plane flexural performance of sandwich insulation walls utilising glass fibre composite connectors. The study revealed that the sandwich insulation walls exhibit a certain degree of composite behaviour, with the degree of composite behaviour decreasing gradually as the insulation board and concrete slab fail. Additionally, Zhong’s [27] research indicated that using equal-strength lap splices for horizontal connections primarily results in swaying deformation under seismic action. By increasing the area of the lap-spliced steel bars, the connection becomes stronger, thus enhancing the bearing capacity of the wall. He [28] conducted finite element analysis on sandwich insulation walls using different insulation materials and thicknesses, showing the effectiveness of foam concrete as an insulation layer in reducing wall deformation and stress.
In the research on the material application for precast concrete shear walls, using industrial waste to replace natural aggregates such as crushed stone, sand, and other admixtures in ordinary concrete is a crucial aspect of promoting green and low-carbon development in the construction industry. The ICC regulations enacted in the United States [29] prohibit the classification of blast furnace slag as waste for disposal. Before 1980, Japan and the United States [29,30] primarily used blast furnace slag as a material for subgrade. After reaching saturation, blast furnace slag gradually began to be used as a concrete additive, cement admixture and mix in concrete aggregate. In the Netherlands [30], concrete structures commonly incorporate slag cement, with a slag content ranging from 65% to 70%. The sales volume of Portland blast furnace slag cement is exceptionally high. It is important to note that slag cement can enhance the quality of structures, with a particularly noticeable improvement in the durability of concrete structures. A research study by Kumar [31] on various properties of alkali-activated slag concrete and slag cement concrete under high-temperature conditions indicated that under high-temperature conditions, alkali-activated slag concrete exhibits superior properties compared to slag cement concrete in various aspects.
Acıkök’s [32] study on the impact of fly ash and slag on pavement suggests that pavement concrete incorporating slag performs better than other alternatives. Li [33] used the phenolphthalein method to study the specific carbonation depth of high-titanium slag concrete. In India, steel production is approximately 50 million tons, and engineers are increasingly focusing their research on blast furnace slag. Replacing fine aggregate with ground granulated blast furnace slag and blast furnace slag powder has shown significant progress in various strength properties [34,35,36], as indicated by experimental studies.
In China, the Pangang Iron and Steel Group has been utilising high-titanium heavy slag during the smelting of vanadium-titanium magnetite as an industrial waste. This is seen as a practical approach to environmental management. High-titanium heavy slag concrete is prepared by transforming it into coarse and fine aggregates and finely ground admixtures. This innovation addresses the waste disposal issue and drives advancements in slag concrete application. Further utilisation of this concrete to create high-titanium heavy slag concrete members marks a new stage in developing slag concrete applications. Through this series of innovative practices, new vitality is injected into environmental protection and the sustainable development of the construction industry. Sun [37,38,39], have extensively researched using high-titanium heavy slag in concrete for construction purposes, resulting in many achievements. Die [40] studied the durability of high-titanium slag concrete by incorporating basalt fibres and plastic steel fibres. The research showed that fibres enhance high-titanium slag concrete’s durability and mechanical properties. Zhou [41] studied the influence of fly ash and cement dosage on the heat resistance of high-titanium slag concrete. The results indicate that high-titanium slag concrete can withstand temperatures up to 500 °C by including an appropriate amount of fly ash.
Mu [42] developed C50 high-titanium slag concrete using 11 bridges, including the Zhonghuashan Bridge and Sanjingtang Bridge, as engineering backgrounds. The main beam of the Jinshajiang Bridge on the Lipan Expressway is constructed using C65 high-titanium slag concrete. Li [43] used high-titanium slag as a coarse aggregate to produce high-titanium slag columns and studied their seismic performance. The results showed that the seismic performance of high-titanium slag columns is essentially the same as that of ordinary concrete columns. Pang [44] studied the properties of ultra-high-strength concrete-filled steel tubes prepared using high-titanium slag sand. The research indicates that the workability is enhanced after two hours, and the mechanical properties improve as the water-reducing rate increases. The specimens all exhibited shear failure, and the peak bearing capacity increased.
Wang [45] conducted uniaxial compression tests and numerical simulations on high-titanium slag concrete. The experimental results showed that its compressive strength is slightly higher than that of ordinary crushed stone concrete. Huang [46] conducted axial compression tests on high-titanium slag concrete columns. The results indicated that the member has a high ultimate compressive bearing capacity. Gong [47] studied the influence of varying amounts of high-titanium slag on concrete properties. The results indicated that as the content of high-titanium slag sand and macadam increases, the slump value of the concrete increases. The compressive strength of the concrete initially increases and then decreases. The water-to-binder ratio has a significant impact, while the influence of high-titanium slag sand, high-titanium slag macadam, and fly ash is relatively tiny.
In Liang’s [48] study, factors such as water-to-binder ratio and concentration of composite salt solution were investigated regarding the durability of high-titanium slag concrete. The results indicate that the concentration of composite salt solution has the most significant impact, and an increase in the number of freeze-thaw cycles leads to a decrease in the dynamic modulus of elasticity of the specimens. Guo [49] investigated the resistance to chloride ion penetration and high-titanium slag concrete frost resistance. The results revealed that the resistance to chloride ion penetration and frost resistance of high-titanium slag concrete meet the durability specifications for concrete. However, most existing research on high-titanium slag is based on its fundamental properties when used in concrete. Very little research is on using high-titanium slag as concrete aggregate for preparing precast concrete members. Furthermore, no study has been conducted on using high-titanium slag industrial solid waste material to prepare concrete for fabricating sandwich shear walls. This article aims to fill the academic voids.
The research objective of this project is to develop a novel type of precast concrete sandwich shear wall by replacing the coarse and fine aggregates of ordinary concrete with high-titanium heavy slag and incorporating insulation boards. Additionally, it aims to investigate the seismic performance of the shear wall. Through theoretical and experimental research, this study examines the new material’s influence on the seismic performance of sandwich composite shear walls. The goal is to validate that the physical and mechanical properties of the high-titanium heavy slag concrete sandwich composite shear wall are equal to, and may even exceed, those of ordinary concrete composite shear walls. This research will provide theoretical and experimental evidence to advocate for this type of wall’s widespread adoption in construction projects of prefabricated buildings.
The novelty of this research is to study the seismic performance of sandwich shear walls made of high titanium slag concrete. Comparative studies will be conducted through pseudo-static tests and finite element analysis. It contributes to developing a novel composite shear wall that meets specification standards and lays a foundation for its deployment in precast concrete construction projects. Unlike other similar research endeavours, the distinctiveness of the testing protocol in this experimental study lies in the evaluation of various mechanical performance indicators post experiment. These include analysing the wall’s load-bearing process and failure characteristics, studying hysteresis and skeleton curves, assessing bearing capacity and deformation capacity, analysing stiffness degradation curves, and examining the cage of reinforcement curves. Utilising the ABAQUS 2022 finite element software, a finite element analysis was conducted on the precast high-titanium heavy slag concrete composite shear wall. Subsequently, the ABAQUS analysis data were then compared with the results of pseudo-static tests to validate the feasibility and applicability of the finite element model of the precast high-titanium heavy slag concrete sandwich composite shear wall.
2. Seismic Performance Test of High-Titanium Heavy Slag Concrete Sandwich Composite Shear Wall
2.1. Objective
The objective of the test is to examine the seismic resistance of the specimens under both vertical and horizontal loads. A pseudo-static test was conducted by producing one PHCSPW and one CHCW specimen. Measurements and analysis were performed on the bearing capacity, failure mode, deformation characteristics under load, stiffness, and other parameters of the specimens. A comparative study was conducted to identify the differences between CHCW and PHCSPW.
2.2. Test Materials
The test used Pangang industrial solid waste high-titanium heavy slag macadam and ordinary macadam as coarse aggregates and high-titanium heavy slag sand and ordinary river sand as fine aggregates. PC42.5 composite Portland cement from Yunnan of ChinaYimen Dachun tree cement Co., Ltd. (Yuxi, China), was used. In contrast, Class II fly ash produced by Gongyi of China Hengnuo Filter Material Co., Ltd. (Gongyi, China), was used as the fly ash. After studying the effect of high-titanium slag content on concrete properties [47], the optimal mix ratio was determined to be cement: sand: macadam: water at 1:1.23:3.01:0.41, with high-titanium slag content accounting for 40% of the coarse and fine aggregates. The average compressive strength of the high-titanium slag concrete is 45.872 MPa, indicating good workability and meeting the strength requirements.
2.3. Dimension and Reinforcement of Specimens
According to the specifications [50,51,52], the experiment was designed to test two reduced-scale shear walls: one cast-in-place high-titanium heavy slag concrete wall (CHCW) and one precast high-titanium heavy slag concrete sandwich panel wall (PHCSPW). Both consist of loading beams, walls, and ground beams. The detailed dimensions and specific reinforcement for CHCW are shown in Figure 1, while the detailed dimensions and specific reinforcement for PHCSPW are shown in Figure 2.
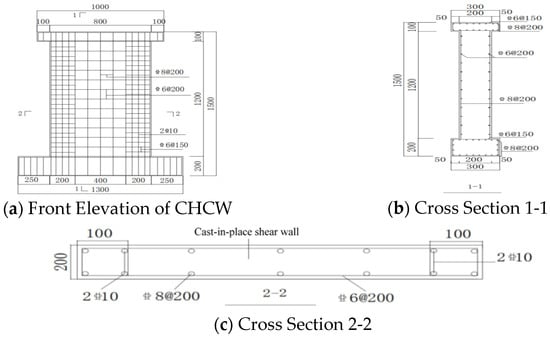
Figure 1.
Dimensions and Reinforcement of CHCW Specimen.
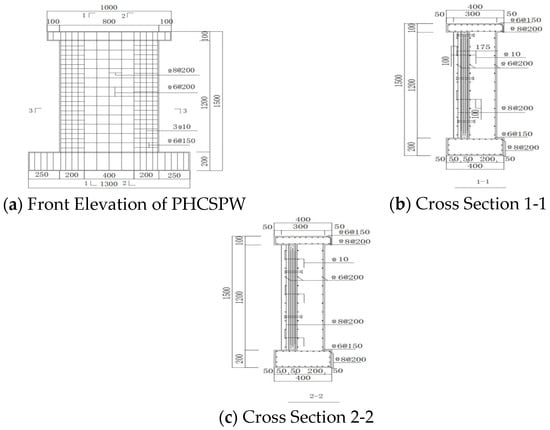
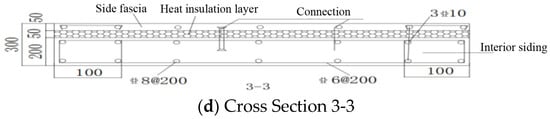
Figure 2.
Dimensions and Reinforcement of PHCSPW Specimen.
The test was conducted on two specimens under horizontal and constant vertical loads combined. The main variable parameters of PHCSPW include (1) the arrangement of connectors, as shown in Figure 3, with a spacing of 300 mm between connectors, using FRP and Z-shaped metal connectors to effectively alleviate the thermal bridge effect at the connection of sandwich walls, and (2) the insulation layer setup is shown in Figure 4. The insulation layer is installed to achieve energy efficiency while ensuring the wall’s bearing capacity.
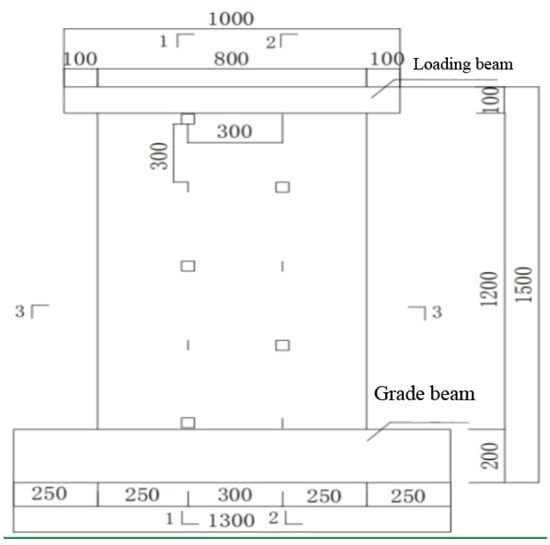
Figure 3.
Arrangement of Connectors for PHCSPW.
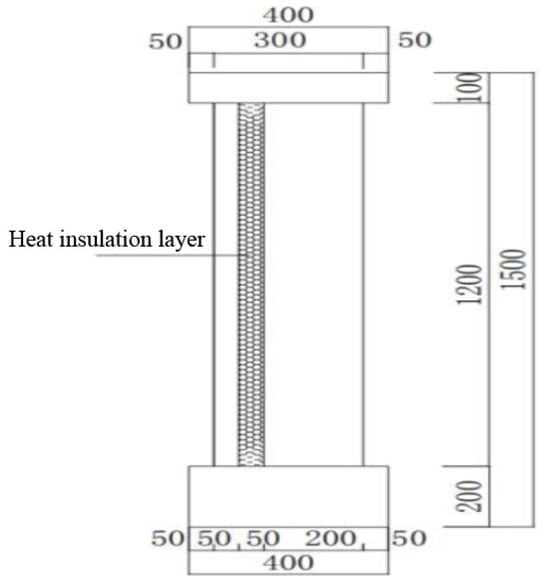
Figure 4.
Arrangement of Insulation Layer for PHCSPW.
The members are designed according to the strong shear and weak bending principle, with differences compared to CHCW. For the edge members, longitudinal reinforcement and vertical distribution reinforcement are used for seismic anchoring. According to the specifications [52], the length of longitudinal reinforcement seismic anchorage is calculated according to Formula (1):
In the formula, ζaE represents the anchorage length seismic coefficient, which is taken as 1.05 for a seismic grade of three.
la represents the basic anchorage length of longitudinal reinforcement.
The basic anchorage length of longitudinal reinforcement is explicitly calculated using Formula (2):
In the formula, ζa represents the correction coefficient for anchorage length.
a represents the reinforcement shape factor: for ribbed bars, it is typically 0.14.
fy represents the design tensile strength of reinforcement: for HRB400, it is 360 MPa.
ft represents the design compressive strength of concrete: for C40, it is taken as 1.71 Mpa.
d represents the diameter of the anchorage reinforcement.
2.4. Specimen Fabrication
Fabricating the specimens involves the following steps: formwork, application of strain gauges, reinforcement binding, installation of connectors and insulation boards, concrete pouring, and curing. The fabrication process and the final formed wall specimens are depicted in Figure 5a–j.

Figure 5.
PHCSPW Fabrication.
CHCW adopts horizontal casting. The fabrication process and the final formed wall specimens are shown in Figure 6a–f.
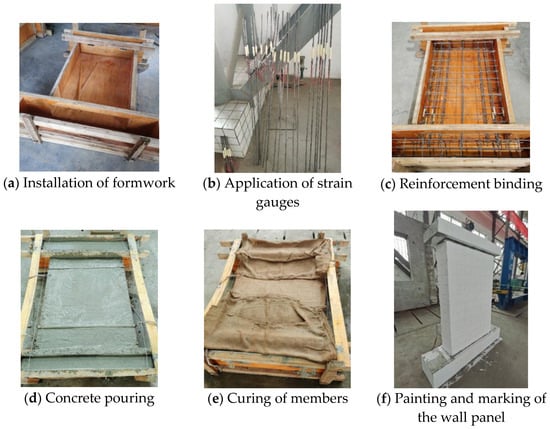
Figure 6.
CHCW Fabrication.
2.5. Test Point Arrangement
The strain gauges were attached at the edges of the specimens. The specific arrangement of strain gauges on the PHCSPW is shown in Figure 7, and the arrangement of strain gauges on the CHCW is shown in Figure 8.
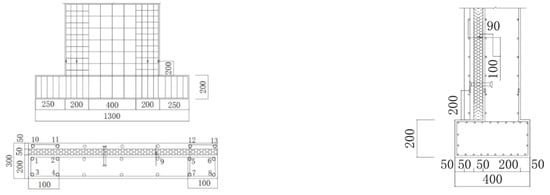
Figure 7.
PHCSPW Reinforcement Strain Gauge Arrangement.
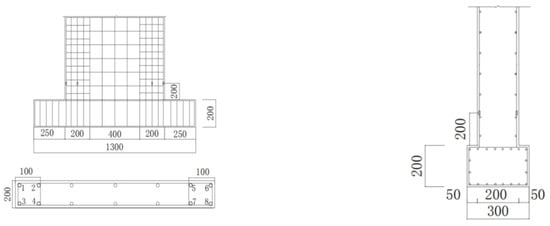
Figure 8.
CHCW Reinforcement Strain Gauge Arrangement.
Figure 9 shows a schematic diagram of the displacement meter arrangement. Figure 10 depicts the physical layout of displacement meters.
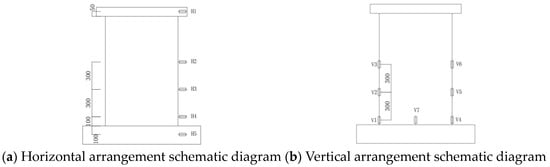
Figure 9.
Displacement meter arrangement schematic diagram.
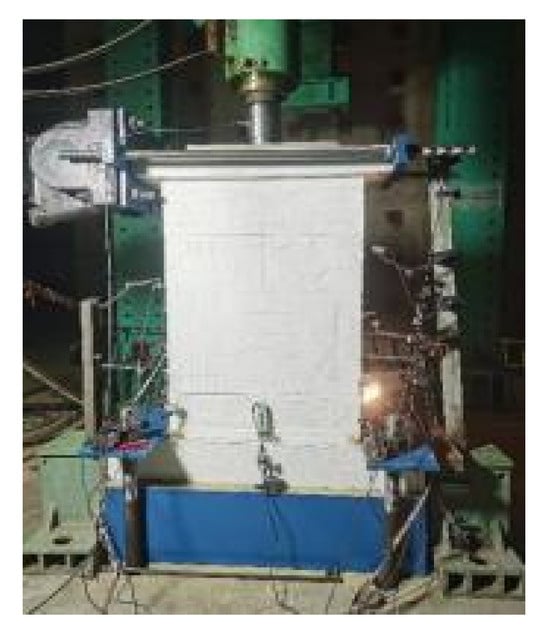
Figure 10.
Displacement meter arrangement physical diagram.
2.6. Data Collection
Additional temperature compensation pieces were set for the reinforcement. Before the test, the wall was painted white and divided into squares with a surface size of 50 mm × 50 mm. The test process evidenced and recorded the distribution of cracks. The static stress-strain meter collected various test values during loading, as shown in Figure 11. The recording was performed as shown in Figure 12.

Figure 11.
Static stress-strain meter.
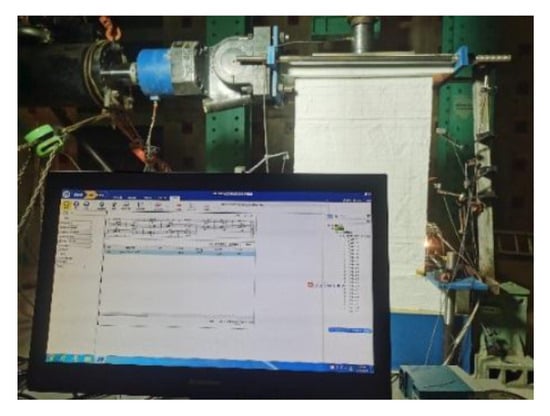
Figure 12.
Data recording.
2.7. Loading Device
The girder, loading beam, and a 100-ton jack transmitted the vertical force of the reaction. The horizontal force of the response was composed of a reaction wall, force transmission steel beams, tie rods, and a 50-ton actuator. During the test, to avoid eccentricity caused by vertical load, the jack’s centre should be aligned with the centre of the distributing beam and the centreline of the distributing beam with the centreline of the concrete. The loading device is shown in Figure 13.
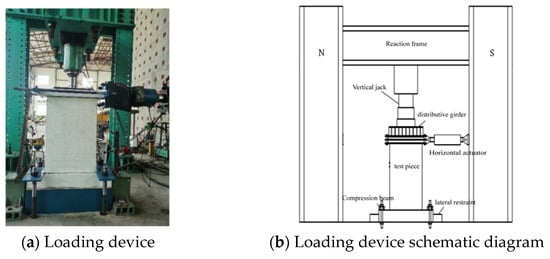
Figure 13.
Test Loading Device.
2.8. Loading Scheme
The test adopted a load-displacement mixed control. According to the specifications [53], preloading should be performed twice reciprocally before formal loading while ensuring the normal functioning of instruments and meters. The load value of the preload should be maintained below 30% of the theoretical cracking load. Since the specimen has yet to yield during load control, each load level only required one cycle. The vertical load N to be applied by the jack was calculated according to Formula (3), and the values of N are shown in Table 1.
In the formula, nd is the −design axial compression ratio.
A is the −cross-sectional area of the wall.
fc is the −design compressive strength of concrete, calculated based on parameters related to C40.
The axial load is graded, followed by low-cycle repeated loading conducted at the top of the member, with the line of action of the horizontal force coinciding with the centerline of the loading beam. When displacement control is applied, each displacement level necessitates three cycles as the specimen enters yielding. When the horizontal bearing capacity drops below 85% of the peak bearing capacity during the test, it is considered that the member has failed, and the test is stopped [54]. The schematic diagram of the loading protocol for the test is shown in Figure 14.

Figure 14.
Schematic Diagram of Loading Protocol.
The horizontal displacement Δ is the displacement of the vertex at the height of the loading line and the angle of the vertex displacement. Loading to the north (N) is considered positive while loading to the south (S) is harmful. Loading once to the north and once to the south constitutes one cycle.

Table 1.
Experimental axial load capacities (KN).
Table 1.
Experimental axial load capacities (KN).
| Test Item | A (Width × Thickness)/mm × mm | |||
|---|---|---|---|---|
| PHCSPW | 0.15 | 19.1 | 800 × 250 | 478 |
| CHCW | 0.15 | 19.1 | 800 × 200 | 382 |
2.9. Loading Process and Failure Characteristics
The test revealed that most cracks in the wall occurred at the base of the wall. Vertical loads of 382 kN and 478 kN were applied on CHCW and PHCSPW, respectively, which remained constant throughout the test. During load control, the applied loads were set to 80 kN, 100 kN, 120 kN, 140 kN, 160 kN, and 180 kN, with each level undergoing one positive-negative cycle. During displacement control, the loading displacement is multiplied by the yield displacement and was set at 16.70 mm, 25.05 mm, 33.40 mm, 41.75 mm, and 50.10 mm, with each level undergoing three cycles and the final level undergoing one cycle, after which the test was stopped. The failure characteristics of the specimens were generally similar, with cracks appearing first at the base of the wall under the repeated action of horizontal forces. As the load increased, the cracks in the wall extended, and the width of the cracks at the base increased.
2.9.1. Failure of CHCW Specimen
When the horizontal load increased to 80 kN, the first crack appeared at the base of the CHCW. When the loading increased and horizontal displacement reached 16.70 mm, multiple cracks gradually appeared below 500 mm of the wall height. At this point, the cracks at the base began to propagate horizontally. As the loading continued, new cracks appeared intermittently along the wall, and the cracks at the base continued to extend and develop into primary cracks. The development trend of the wall cracks was mainly horizontal, and the crack propagation pattern was relatively curved. The development trend of concrete cracks on both sides of the wall was consistent. The length of the main crack on one side of the specimen at the time of failure was 308 mm, while on the other side, it was 302 mm, indicating a fundamental similarity in length. At the time of failure, the distribution of cracks is depicted in Figure 15. The member’s height is 1.2 m, and the Figure−only illustrates approximately 0.5 m of the wall height. It is observed that the concrete cracks on the left and right sides essentially correspond to each other.
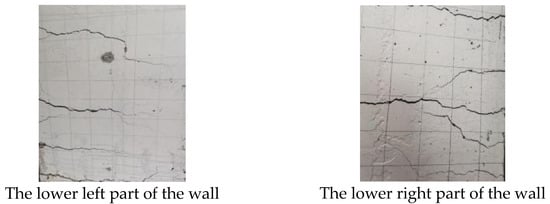
Figure 15.
Distribution of concrete cracks at failure.
2.9.2. Failure of PHCSPW Specimen
When the horizontal load reached 160 kN, the PHCSPW specimen exhibited the first crack at its base. Upon reaching a horizontal displacement of 16.70 mm, new cracks gradually appeared around the height of 100 mm along the wall. At this point, the cracks at the base started to propagate horizontally. New cracks continued to appear on the wall, while base cracks kept extending and developing into the main crack. Crack development exhibited a curved pattern in the wall, with essentially consistent development trends on both sides. The length of the main crack on one side of the specimen at the time of failure was 347 mm, while on the other side, it was 340 mm, indicating a fundamental similarity in length. At the time of failure, the distribution of cracks in the member is depicted in Figure 16. The member’s height is 1.2 m, and the Figure−only illustrates approximately 0.5 m of the wall height. It was observed that the concrete cracks on the left and right sides are relatively symmetrical and essentially correspond to each other.
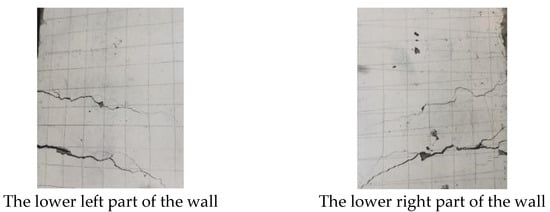
Figure 16.
Distribution of concrete cracks at failure.
The specimen’s early appearance of base cracks was attributed to the maximum stress concentration at the base. Cracks concentrated in the lower portion, mainly below 500 mm from the base. Following the tensile failure of the base concrete, reinforcement bore the base bending moment. The reinforcement yielded as the load gradually increased, leading to increased deformation and crack widening.
2.10. Analysis of Hysteresis Curve and Skeleton Curve
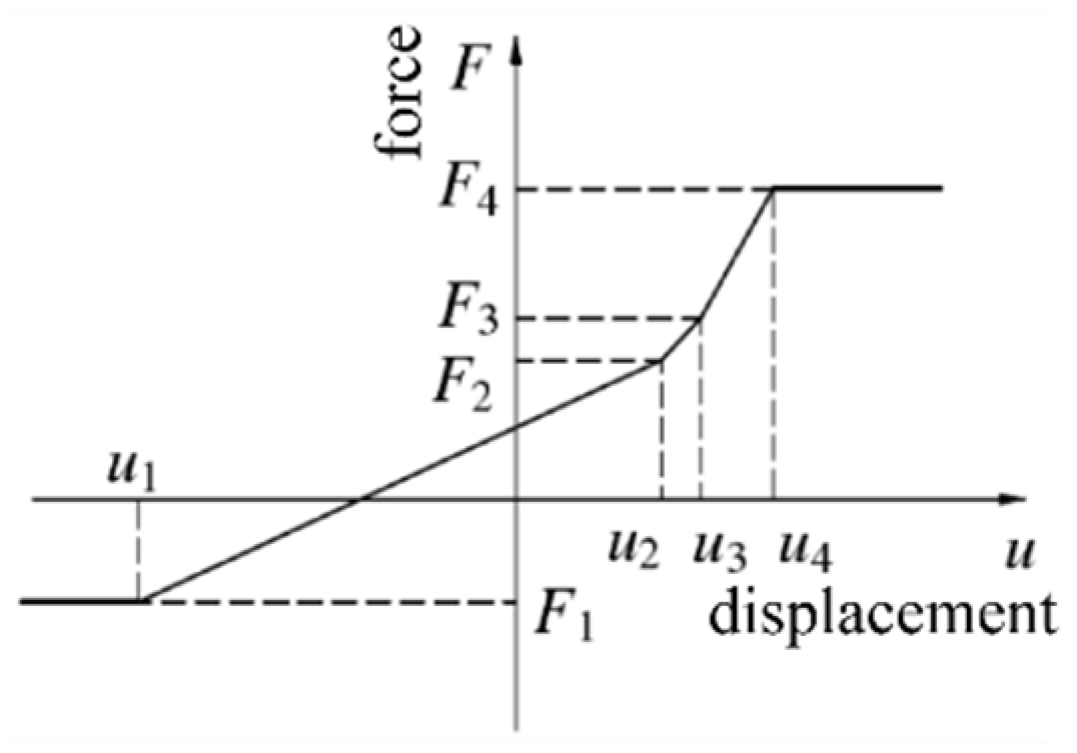
Reinforced concrete materials exhibit nonlinear behaviour under significant loads, displaying residual strains after unloading. In pseudo-static tests, the load-displacement curve is the hysteresis curve. After removing the influence of ground beam sliding and rotation on the test, the relationship between the horizontal force F of the member and the vertex displacement Δ is obtained. Its hysteresis curve, shown in Figure 17, commonly exhibits four different shapes. The shuttle shape is fuller and indicates better seismic performance. Due to the influence of slippage, the reverse S-shape is incomplete, indicating poorer seismic performance. The bow shape is also relatively full. However, due to the influence of slippage, the appearance of the pinch effect diminishes its fullness compared to the shuttle shape. Nonetheless, it still exhibits good seismic performance. Due to significant slippage, the Z-shape appears less complete, indicating poor seismic performance of the specimen.

Figure 17.
Hysteresis Curves.
CHCW concrete remained crack-free in the elastic stage, resulting in a minor hysteresis loop area. After unloading, its residual strain was relatively small, showing a shuttle-shaped hysteresis loop. After cracking, vertex displacement increased, enlarging the hysteresis loop area. Despite increased residual strain during uploading, the shuttle shape persisted. After yielding, the hysteresis loop area expanded rapidly as cracks continued to extend, accompanied by a slight bond-slip of the steel bars. At this point, the hysteresis loop exhibited noticeable pinching. The PHCSPW concrete remained crack-free in the elastic stage, resulting in a minor hysteresis loop area. After unloading, its residual strain was relatively minor, and the hysteresis loop exhibited a shuttle shape.
After cracking, as the displacement increased, the hysteresis loop assumed a bow shape, indicating a slight degree of bond-slip in the connectors. With increased displacement and the number of cycles, shear slip increased. At this point, the hysteresis loop exhibited a reverse S shape. Neither specimen exhibited a Z-shaped hysteresis loop, indicating that no significant shear slip occurred in either specimen. During displacement-controlled loading, stiffness and bearing capacity during the third and second cycles of each loading level were lower than during the first cycle, indicating a degradation of stiffness of the shear walls during the test. After reaching the peak bearing capacity, the degradation of stiffness intensified. Comparing the hysteresis loops of CHCW and PHCSPW, PHCSPW exhibited a larger area, indicating superior energy dissipation capacity.
The skeleton curves, shown in Figure 18, determined the yield point using the equivalent energy method. Point A, obtained by intersecting a horizontal line passing through the peak point and a line passing through the origin, ensured equal areas on both sides. A perpendicular line is drawn through point A, intersecting the curve at point B. This point represents the yield point, where the load equals yield load, and the displacement equals yield displacement.
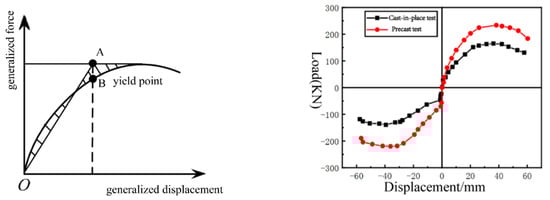
Figure 18.
Skeleton Curves.
Figure 18 shows that the trends of the two skeleton curves are similar, with the skeleton curves of the specimens in both directions being roughly symmetrical. They both undergo four stages, from elasticity to failure. Before member cracking, the skeleton curve is linear. After cracking, a clear inflexion point emerges due to decreased member stiffness. As the member gradually yields, its curve slope decreases. In the later stages of the test, the curve becomes smoother, indicating a gradual reduction of bearing capacity, suggesting good ductility. In the initial stage, PHCSPW exhibited a higher initial stiffness, which was attributed to the presence of the outer leaf wall, resulting in a higher initial stiffness for PHCSPW. After cracking, the outermost vertical reinforcement of the specimen began to yield, indicating that the specimen had entered the yield stage with a significant decrease in stiffness. Under low-cycle repeated horizontal loading, the cracks at the base of the shear wall widened progressively. Initial concrete crushing occurred in the outer leaf wall, while in CHCW, concrete crushing was almost simultaneous, resulting in lower bearing capacity for CHCW. Peak bearing capacity under reverse loading was slightly lower than under forward loading, indicating stiffness degradation during reverse loading.
2.11. Analysis of Bearing Capacity and Deformation Capacity
The measured bearing capacities are listed in Table 2. The characteristic values of the bearing capacity of the specimens under cyclic loading include yield load, cracking load, peak load, and ultimate load, each corresponding to specific displacements. The determination of the cracking load is based on the following conditions: If the first crack appears during the load application, the cracking load is taken as the average of the previous and current load levels. If the first crack appears at the end of the load application, the cracking load is taken as the current load level. The first sudden change in the slope of the skeleton curve indicates the cracking load, at which point the displacement corresponds to the cracking displacement. The apparent inflection point of the skeleton curve determines the yield load. At this point, the load is the yield load, and the displacement corresponds to the yield displacement. If there is no obvious inflection point, approximation methods such as graphical, energy, or double straight-line methods can be used. The load and displacement at yield are determined using the energy method. The peak load is determined by finding the maximum value on the skeleton curve, with the corresponding displacement being the peak displacement. The ultimate load is determined when 85% of the peak load equals the maximum load applied during the test. The corresponding displacement at this load level is considered the ultimate displacement. If the maximum load applied at the end of the test still exceeds 85% of the peak load, end-test displacement is considered.
Table 2.
Measured Bearing Capacity of the Test Specimen.
Table 2 displays each specimen’s peak load Fp, yield load Fy, yield-to-peak load ratio, and ultimate load Fu. Comparative analysis of the bearing capacity of the two specimens provides a clear understanding of the differences between PHCSPW and CHCW in bearing capacity. It can be observed that the yield load of PHCSPW is slightly greater than that of CHCW because the inner and outer leaf walls of PHCSPW are jointly subjected to force through connectors. The yield load ratio to the specimens’ peak load ranges from 0.636 to 0.888, indicating no significant difference in the initial stiffness of the specimens. The peak bearing capacity of CHCW under forward loading is approximately 68.02% of PHCSPW, with an average peak bearing capacity of around 68.31% of PHCSPW. During the loading process, the shear walls did not reach the ultimate load in the negative direction, while the walls had already reached the ultimate load in the positive direction.
A structure must meet bearing capacity and stiffness requirements during its expected service life. In seismic design, structures are typically assessed against frequent and rare earthquakes, accounting for elastic and elastic-plastic deformations. Ductility serves as a safety margin under significant loads. The ductility coefficient is obtained by dividing the ultimate displacement by yield displacement, comprehensively reflecting a member’s performance under various conditions, indicating its deformation capacity during the inelastic phase. The characteristic point displacement, ultimate displacement angle, and ductility coefficient of the specimens are shown in Table 3. The yield displacement angles of the specimens are close, ranging from 1/120 to 1/50 [51], indicating that the influence of the sandwich layer and the outer leaf wall on the yield displacement angle is insignificant. The peak displacement angles are close between 1/41 to 1/32. The peak displacement of PHCSPW is 1.125 times that of CHCW, with a slight difference in ultimate displacement, meeting the Chinese specification requirements. A ductility coefficient of the specimen greater than 3 indicates good deformation capacity, and brittle failure will not occur under seismic action. CHCW’s favourable ductility coefficient indicates that its bearing capacity decreases slowly after yielding.
Table 3.
Specimen Deformation and Ductility Ratio.
2.12. Stiffness Degradation Curve Analysis
Under cyclic loading with the same applied load, stiffness degradation manifests as increasing displacement with increasing cycles. Stiffness degradation is the cumulative damage experienced by the member under repeated loading, and it is also a concentrated reflection of material plasticity development and member cracking. The secant stiffness of the member is calculated according to Formula (4) [54].
In the formula, Ki represents the second stiffness of the member for the i-th cycle.
Fi, − Fi represents the positive or negative horizontal load corresponding to the i-th loading cycle.
Δi, − Δi represents the positive or negative horizontal displacement corresponding to the i-th loading cycle.
As displacement increases, the stiffness of the specimens decreases. The faster the rate of stiffness degradation, the poorer the deformation capacity of the member. During the test process, the degradation rate varies at different stages. The stiffness variation of each specimen is shown in Table 4. The change in the stiffness degradation curve with displacement angle is illustrated in Figure 19.
Table 4.
Secant Stiffness of the Specimen (K) (kN·mm−1).
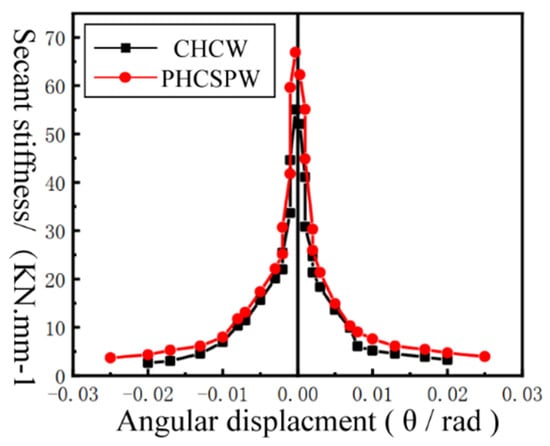
Figure 19.
Stiffness Degradation Curves of Specimens.
Figure 19 shows that PHCSPW exhibits greater stiffness before cracking than CHCW due to outer leaf walls influencing its stiffness. After cracking, the stiffness of both specimens becomes equivalent. The stiffness degradation of the members occurs in three stages: first, before cracking, the stiffness of the specimen decreases rapidly; second, after cracking but before yielding, the decrease in stiffness slows down slightly; and third, after yielding, the stiffness degradation of the member is relatively slow. Upon reaching the ultimate load, the main crack of the specimen is formed, and its stiffness tends to stabilise. Initially, the stiffness degradation curves of both members roughly overlap. However, as the outer leaf wall cracks, PHCSPW experiences accelerated stiffness degradation.
2.13. Analysis of Cage of Reinforcement Curves
To analyse the stress performance of the vertical reinforcement, strain analysis of the reinforcement at the bottom of the specimens is conducted, as shown in Figure 20. Figure 20 shows the strain skeleton curve of the reinforcement at a distance of 200 mm from the top surface of the ground beam for both CHCW and PHCSPW specimens.
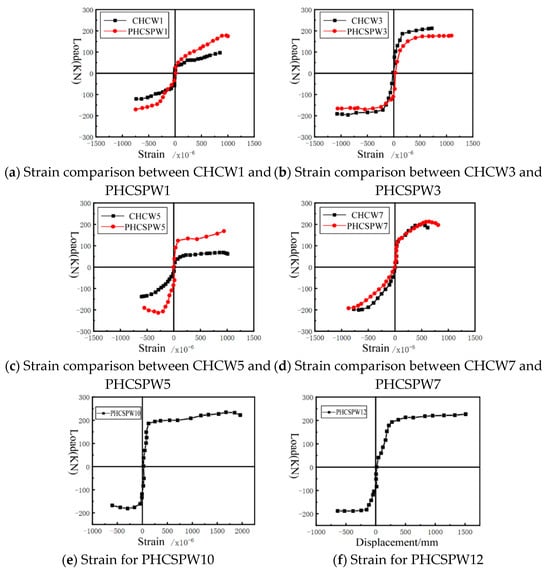
Figure 20.
Reinforcement Strain Skeleton Curve.
The variation patterns of the reinforcement strain skeleton curves of PHCSPW and CHCW are similar. The reinforcement remains elastic in the initial loading stage, displaying a linear strain curve. The strain increases rapidly after entering the elastic-plastic stage, indicating significant plastic deformation. When horizontal cracks appear, there is a sudden increase in the reinforcement strain, while strain variation during continuous cyclic loading remains relatively small. The curves show that the vertical reinforcement PHCSPW3 and PHCSPW7 strain values surpass the CHCW specimens’ corresponding values at the corresponding points.
In contrast, the vertical reinforcement PHCSPW1 and PHCSPW5 values are similar to the CHCW values at the corresponding points. Additionally, the strain value of the vertical reinforcement PHCSPW10 exceeds that of PHCSPW12. The connectors’ connection performance meets the requirements, effectively meeting the shared load bearing of the inner and outer walls.
3. Finite Element Analysis of Sandwich Composite Shear Wall
The research and experimentation involving PHCSPW entail higher costs and longer preparation time for fabrication and testing. Moreover, the challenge of producing many specimens for parameter studies further complicates the process. In this experiment, finite element simulation methods were employed to further investigate the seismic performance of PHCSPW. The reliability of the member test was validated, and subsequently, based on this model, the impact of variations in concrete strength, different reinforcement configurations in walls, and changes in axial compression ratios on the seismic performance were analysed.
3.1. Element Types and Mesh Division
Finite element models were built for reinforcement and concrete separately [55], using T3D2 truss elements to simulate the steel reinforcement in the specimens. The embedded constraint method was employed for the reinforced concrete, neglecting the slip and bond between the reinforced concrete. In the model, solid element types commonly used for concrete include C3D8, C3D8I, and second-order elements. During the simulation process, the C3D8 element often exhibits shear locking. The actual bending deformation of the material is shown in Figure 21, while the simulated deformation using C3D8 is depicted in Figure 22. The Figure−indicates that solid linear elements cannot handle bending, leading to significant errors in structural calculations. Second-order elements can generally avoid shear locking but require more computational resources. C3D8I is incompatible, meaning they have one additional degree of freedom compared to first-order linear elements. The enhanced deformation gradient of the element is shown in Figure 23. This simulation opts for the incompatible element C3D8I.

Figure 21.
Actual deformation of the material.
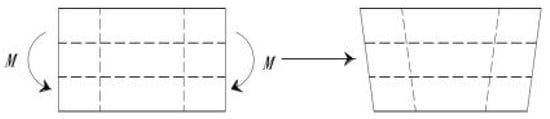
Figure 22.
Deformation of linear elements.
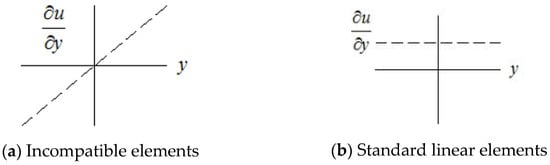
Figure 23.
Linear Variation of Deformation Gradient.
The mesh size for the wall is set at 100 mm × 20 mm, while for the loading beam and the ground beam of the member, which are not the primary focus of the simulation, it is adjusted to 100 mm × 100 mm to enhance computational speed. For the reinforcement, the mesh size is set to 20 mm. The member model and mesh division are illustrated in Figure 24.
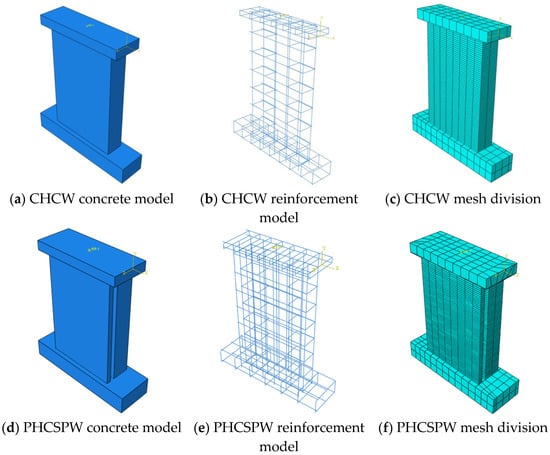
Figure 24.
Member Model and Mesh Division.
3.2. Boundary Conditions
The ends of the test specimen’s ground beams are fixed with steel beams, which are anchored to the ground with ground anchor bolts. The ground beams are fully anchored to the ground. First, the axial force is applied, and the displacement is initiated after the preset axial force is reached. The calculation analysis is concluded when the displacement reaches the set maximum displacement. For the boundary conditions of the CHCW finite element model, refer to Figure 25. For the boundary conditions of the PHCSPW finite element model, refer to Figure 26.

Figure 25.
CHCW Boundary Conditions.

Figure 26.
PHCSPW Boundary Conditions.
3.3. Concrete Interface Simulation
The concrete layers on both sides of PHCSPW, the loading beam and the ground beam, are made of concrete poured from different batches. There are interfaces between the members’ loading beam and the ground beam. The coefficient of friction is determined by the treatment of the contact surfaces, with a roughened surface of 1.0 and a naturally vibrated surface of 0.6. The connectors are modelled separately, and the model is built according to the materials and dimensions used in the test. Connectors connect the inner and outer leaf concrete walls. When dividing the mesh, the size of the elements embedded in the concrete for connectors remains consistent with that of the concrete. As the shear force increases, the bond stress at the contact surface approaches the critical stress. The contact surface is in a state of plastic friction and exhibits sliding displacement, as shown in Figure 27. The cohesive zone model is illustrated in Figure 28, with a curve representing the elastic ascending segment and the damaged descending segment. The cohesive zone model can neglect the thickness of the interface and can allow for the definition of the stress-displacement relationship between regular and tangential directions. The respective constitutive model exhibits a linear relationship in the elastic ascending segment when the interface properties are independent in different directions. When the interface stress reaches its peak value, stiffness degradation occurs, and damage appears in the interface. Subsequently, the interface bond fails, rendering the cohesive zone model ineffective. The cohesive zone model requires setting the elastic stiffness in each direction, with the stiffness set to 0 when the bonding direction is undefined. Then, the peak stress is defined for each direction in the damage model. Damage is usually determined using the maximum stress damage criterion, calculated by Formulas (5) and (6) [56].
In the formula, tk-represents the cohesive bond stress in each interface direction.
−represents the cohesive bond stress in each direction of the undamaged interface.
D−represents the damage factor.
δm0−represents the peak relative displacement.
δmf−represents the relative displacement at bond failure.
δmmax−represents the maximum relative displacement during loading.
The cohesive Coulomb friction model for interface tangential behaviour has three stages [56]. Initially, the elastic shear stiffness in the cohesive zone model works, while the Coulomb friction model remains inactive. Subsequently, both models work, indicating the degradation of shear stiffness. The cohesive zone model exhibits damage while the Coulomb friction model operates. Finally, the coherent zone model fails, leaving only the Coulomb friction model operating. The spring model sets up spring elements in three directions to simulate forces and displacements in each interface direction. The constitutive relationship of the model needs to be separately set up, and the nonlinear spring constitutive relationship is illustrated in Figure 29. The chapter employs the cohesive force friction model to simulate the interface.
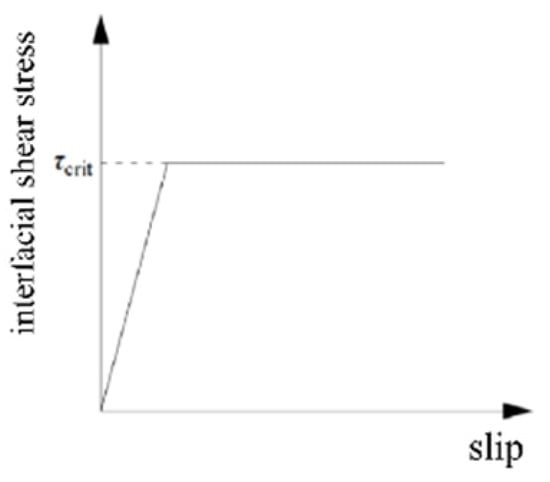
Figure 27.
Coulomb Friction Model.
Figure 27.
Coulomb Friction Model.
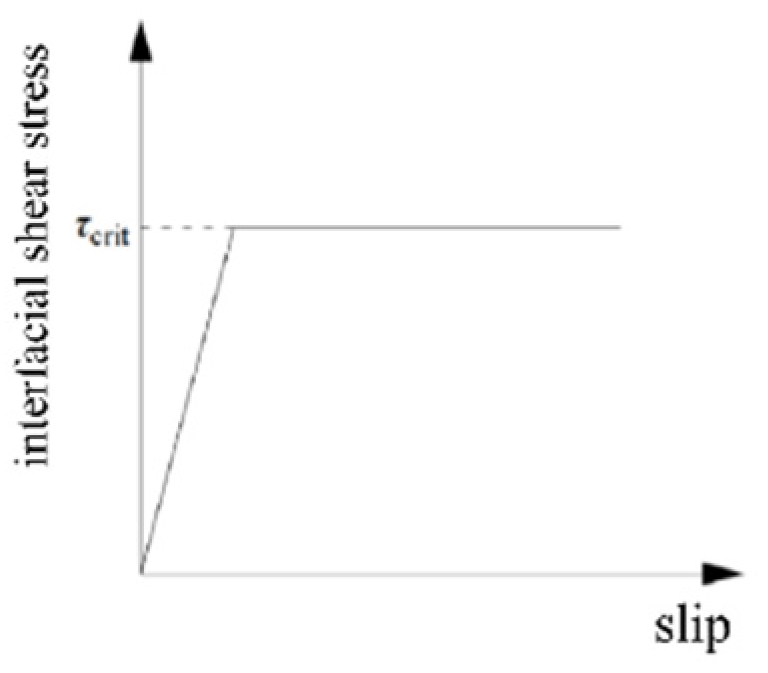
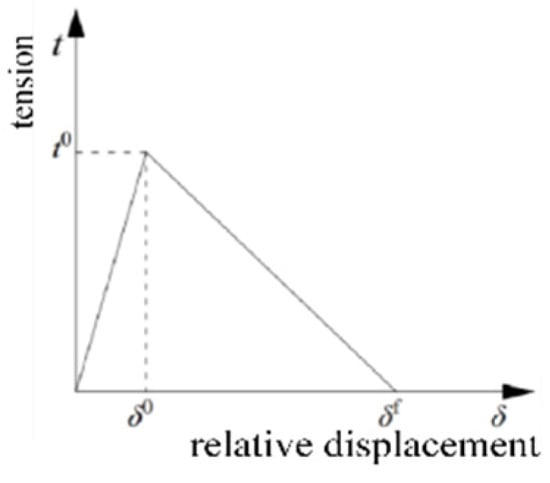
Figure 28.
Cohesive Zone Model.
Figure 28.
Cohesive Zone Model.
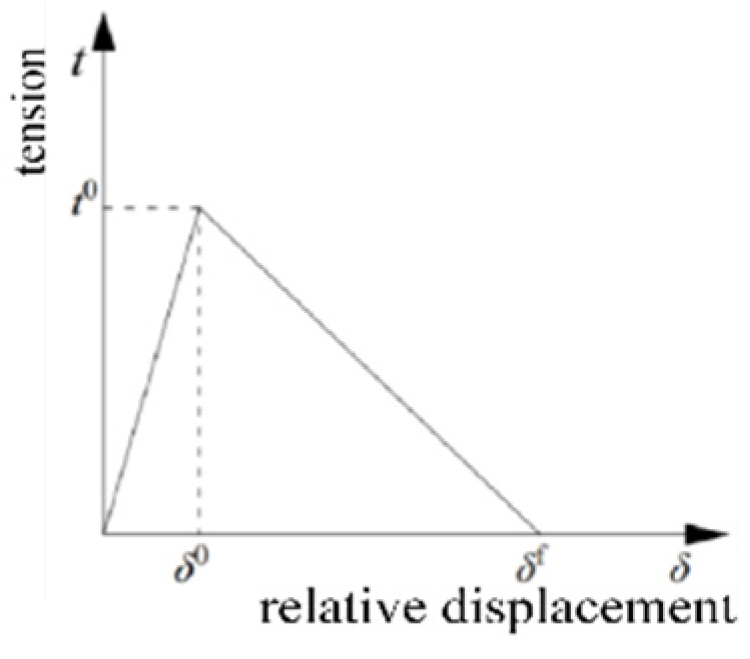

Figure 29.
Nonlinear Spring Constitutive Relationship.
Figure 29.
Nonlinear Spring Constitutive Relationship.
3.4. Analysis Step Settings
Finite element loading protocol: the vertical direction is loaded with a constant axial force, while the horizontal direction is packed with a reciprocating load. Displacement control is utilised for loading. The loading protocol is illustrated in Figure 30.
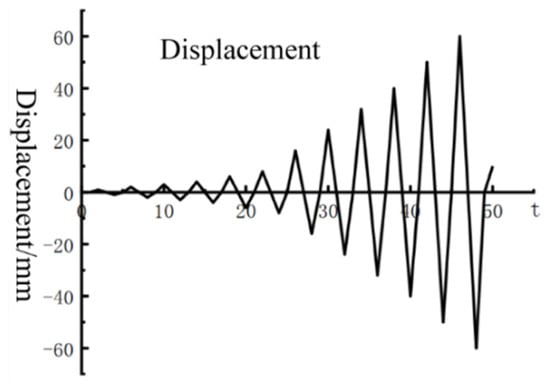
Figure 30.
Loading Protocol.
3.5. Finite Element Model Validation
A finite element model of the shear wall based on member dimensions, reinforcements, materials, etc., is established. Coupled actions are applied to the load using displacement at the centre of the loading beam. The specific failure mode of the model is illustrated in Figure 31. Its manifestation corresponds to the experimental phenomenon. The comparison of the finite element simulated bearing capacity and experimental bearing capacity results is illustrated in Table 5. The comparison between the skeleton curves of the simulation and experiment is illustrated in Figure 32.

Figure 31.
Finite Element Model Failure Mode of Specimen.
Table 5.
Comparison between Finite Element Bearing Capacity and Measured Bearing Capacity.
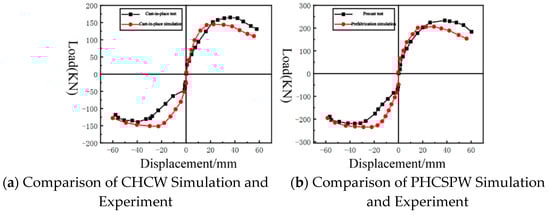
Figure 32.
Comparison of Skeleton Curves.
A comparison between the finite element analysis results and experimental failure results revealed that concrete cracking mainly occurred at the base of the specimens and on both sides of the wall. The simulation analysis results were consistent with the experimental results, indicating that the finite element modelling method and model employed can reasonably simulate the specimen’s failure behaviour.
The comparative analysis of the experimental and finite element results in Table 5 showed that the bearing capacities calculated by the finite element model align well with the experimental bearing capacities overall, with a maximum error of 16% in bearing capacity. This indicated that the established model was reliable and capable of simulating the seismic performance of shear walls under different parameters.
As can be seen from Figure 32, it is evident that there is good agreement between the experimental and simulated curves of the test. It can be observed that the variation patterns in the skeleton curves of the test for both the experiment and simulation are similar, with good agreement, particularly in the plastic phase. However, the finite element skeleton curves are more idealised due to the need for more consideration for reinforcement yielding in the model. In the elastic phase, the finite element’s initial stiffness is slightly more significant than the experimental results. In contrast, the finite element simulation results in the plastic phase were generally similar to the experimental results, with the ultimate bearing capacity being slightly higher than the test results.
3.6. Finite Element Simulation with Varying Parameters
Considering the limitations of the experiment conditions, further investigation was conducted through simulation. Different parameter designs were implemented based on the dimensions of the shear wall during the test. The plan view is illustrated in Figure 33. The specimens were modelled and analysed according to the constitutive model, modelling method, and analysis method provided in Section 3. The parameters for analysis included axial compression ratios of 0.25 and 0.35, concrete strength grades of 30 Mpa and 50 Mpa, and reinforcement configurations in walls with vertical bars of diameter 10 mm and horizontal bars of diameter 8 mm (abbreviated as h8z10), as well as vertical bars of diameter 10 mm and horizontal bars of diameter 10 mm (abbreviated as h10z10). The analysis involved applying axial pressure until reaching the preset value and then applying displacement until reaching the maximum displacement. At this point, the calculation analysis concluded.
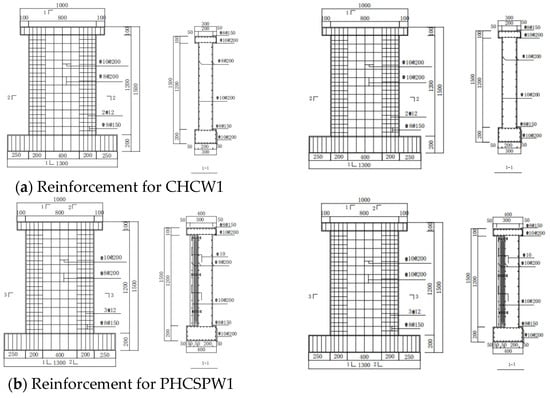
Figure 33.
Model Dimensions and Reinforcement.
3.7. Different Stress Reinforcement
Figure 33a illustrates horizontal bars with diameters of 8 mm, vertical bars with diameters of 10 mm (abbreviated as CHCWh8z10), horizontal bars with diameters of 10 mm, and vertical bars with diameters of 10 mm (abbreviated as CHCWh10z10) for CHCW. Figure 33b illustrates horizontal bars with diameters of 8 mm, vertical bars with diameters of 10 mm (abbreviated as PHCSPWh8z10), horizontal bars with diameters of 10 mm and vertical bars with diameters of 10 mm (abbreviated as PHCSPWh10z10) for PHCSPW.
To study the seismic performance of PHCSPW and CHCW under different reinforcement conditions, four subdivided specimens of PHCSPW1 and CHCW1 were designed, namely CHCWh8z10, CHCWh10z10, PHCSPWh8z10, and PHCSPWh10z10, respectively. Concrete strength grades of C40 and an axial compression ratio at 0.15 were maintained and the calculation and analysis of the stress performance under different reinforcement conditions were completed. The influence of the insulation layer on the simulation analysis was ignored when modelling PHCSPW. The finite element model failure mode of the specimen is illustrated in Figure 34, and the corresponding simulated hysteresis curves are illustrated in Figure 35. The impact of different reinforcements on bearing capacity and displacement are illustrated in Table 6.
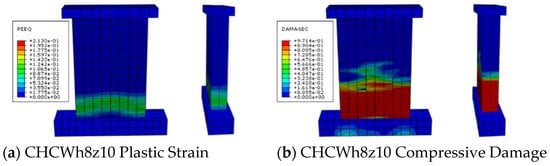
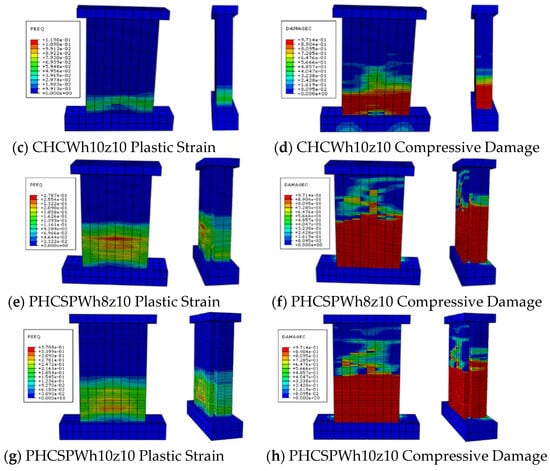
Figure 34.
Finite Element Model Failure Mode.

Figure 35.
Simulated Hysteresis Curves.
Table 6.
The Impact of Different Reinforcement Configurations on Bearing Capacity and Displacement.
Figure 34 shows the contour plots of compressive damage and plastic strain for member models with different reinforcement conditions. It can be observed that under different reinforcement conditions, the distribution range of plastic strain and compressive damage of PHCSPW is more extensive than that of CHCW. The damage locations for each are gradually extended from the base upwards. The CHCWh10z10 model exhibits the smallest area of compressive damage and plastic strain, while the PHCSPWh8z10 model experiences severe compressive damage, with the largest area of plastic strain. As the reinforcement strength increased, the area of compressive damage in concrete decreased. This was because the reinforcement bears more load during the specimen loading. The occurrence of compressive damage in CHCW ground beams was because the ground beams were designed based on the reinforcement of horizontal bars with diameters of 6 mm and vertical bars with diameters of 8 mm for the walls without undergoing redesign. However, this had little impact on the overall simulation analysis and needed to be addressed. No damage was observed in the PHCSPW due to the larger dimensions of the ground beams.
From Figure 35, it can be observed that the force-displacement curves of PHCSPW and CHCW were generally similar overall, but the energy dissipation capacity of PHCSPW was significantly greater than that of CHCW. This indicated that the bearing capacity of PHCSPW was higher than that of CHCW, which indicated that PHCSPW had better ductility and deformation capacity compared to CHCW. The energy dissipation capacity of PHCSPWh8z10 was lower than that of PHCSPWh10z10. Within a certain range, increasing the reinforcement ratio led to an increase in the energy dissipation capacity.
Table 6 shows the model’s calculation results, indicating that the members’ deformation capacity is exemplary. The ultimate displacement angles for CHCW were greater than 1/41, while for PHCSPW, they were all better than 1/26. The results indicated that increasing the reinforcement based on h6z8 ensured that the shear wall structure meets the specified deformation requirements. Therefore, PHCSPW, which is easier to construct, can be adopted in practical engineering applications.
3.8. Different Concrete Strengths
The seismic performance of PHCSPW and CHCW under different concrete strengths was studied. Four specimens were designed: CHCW with concrete strength grade 30 Mpa So (abbreviated as CHCWC30), CHCW with concrete strength grade 50 Mpa (abbreviated as CHCWC50), PHCSPW with concrete strength grade 30 Mpa (abbreviated as PHCSPWC30), and PHCSPW with concrete strength grade 50 Mpa (abbreviated as PHCSPWC50). The model neglects the influence of changes in concrete strength on the bond of the steel reinforcement. Additionally, when modelling PHCSPW, the effect of the insulation layer on the simulation analysis needs to be addressed [55]. The calculation and analysis of the stress performance under different concrete strength grades while keeping the reinforcement and axial compression ratios unchanged were completed. The specimens’ finite element model failure mode is illustrated in Figure 36, the influence of concrete strength grade on bearing capacity is illustrated in Table 7, and the simulated hysteresis curves are illustrated in Figure 37.
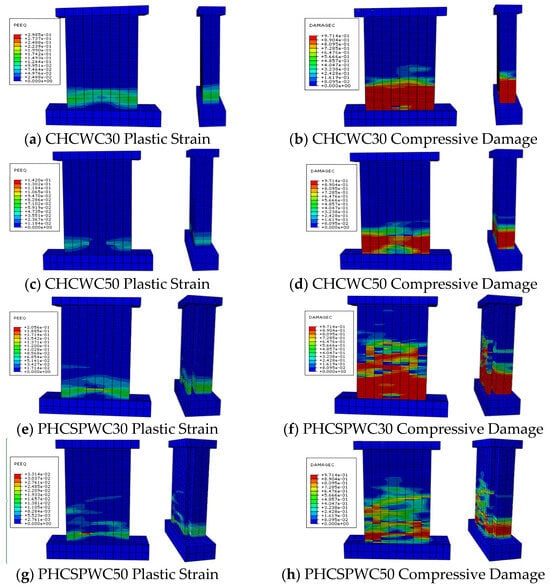
Figure 36.
Finite Element Model Failure Mode of Specimen.
Table 7.
The Impact of Concrete Strength Grade on Bearing Capacity.
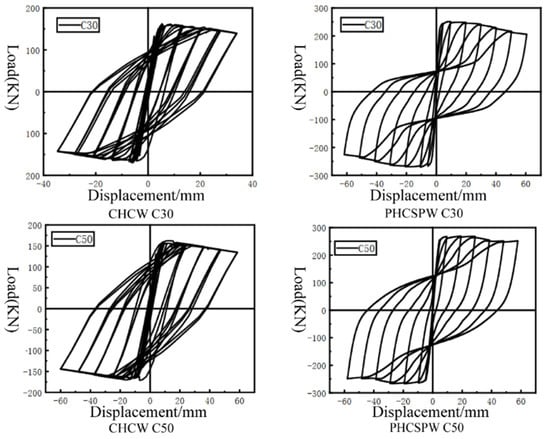
Figure 37.
Simulated Hysteresis Curves.
Figure 36 shows the compressive damage and plastic strain contour plots for member models with different concrete strength grades. It can be observed that under different concrete strength grades, the distribution range of plastic strain and compressive damage for PHCSPW is smaller than that of CHCW. The damage locations for each are gradually extended from the base upwards. The area of compressive damage and plastic strain is the smallest for CHCWC50, while the area of plastic strain is the largest for CHCWC30. PHCSPWC30 experiences the most severe compressive damage. As the concrete strength increases, the area of compressive damage in concrete decreases. This is because higher concrete grades have higher compressive strength.
Figure 37 shows that the force-displacement curves of PHCSPW and CHCW were generally similar overall. Still, the energy dissipation capacity of PHCSPW was significantly greater than CHCW’s. The fact that the bearing capacity of PHCSPW was higher than that of CHCWs indicated that PHCSPW has better ductility and deformation capacity than CHCWs. The energy dissipation capacity of PHCSPWC30 and PHCSPWC50 exhibited relatively tiny fluctuations. The results suggested that changes in concrete strength had a relatively small impact on energy dissipation capacity.
From Table 7, it can be observed that the bearing capacity of CHCW was 3.9% higher than that of CHCWC30, while the bearing capacity of CHCWC50 was 3.1% higher than that of CHCW. The bearing capacity of PHCSPW was 0.5% higher than that of PHCSPWC30, and the bearing capacity of PHCSPWC50 was 1.6% higher than that of PHCSPW. PHCSPWC30 had a bearing capacity 34.9% higher than CHCWC30, PHCSPW had a bearing capacity 32.6% higher than CHCW, and PHCSPWC50 had a bearing capacity 31.6% higher than CHCWC50. This indicated that the bearing capacity of PHCSPW was superior to CHCW’s.
3.9. Different Axial Compression Ratios
The seismic performance of PHCSPW and CHCW under different axial compression ratios was studied. Four specimens were designed: CHCW with an axial compression ratio of 0.25 (abbreviated as CHCW0.25), CHCW with an axial compression ratio of 0.35 (abbreviated as CHCW0.35), PHCSPW with an axial compression ratio of 0.25 (abbreviated as PHCSPW0.25), and PHCSPW with an axial compression ratio of 0.35 (abbreviated as PHCSPW0.35). Insulation layer effects should be addressed in the simulation analysis when modelling PHCSPW. The stress performance was calculated and analysed under different axial compression ratios while maintaining the reinforcement ratio and keeping the concrete strength unchanged. The finite element model failure mode of the specimens is illustrated in Figure 38. The corresponding simulated hysteresis curves are illustrated in Figure 39. The displacement and displacement angles under different axial compression ratios are described in Table 8.
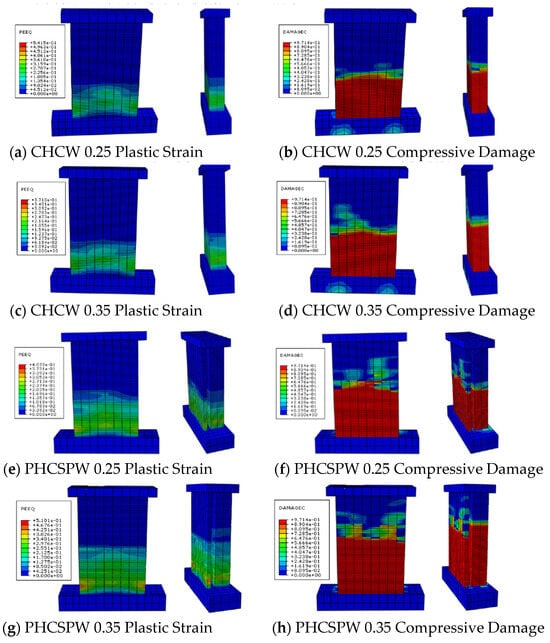
Figure 38.
Finite Element Model Failure Mode of Specimen.
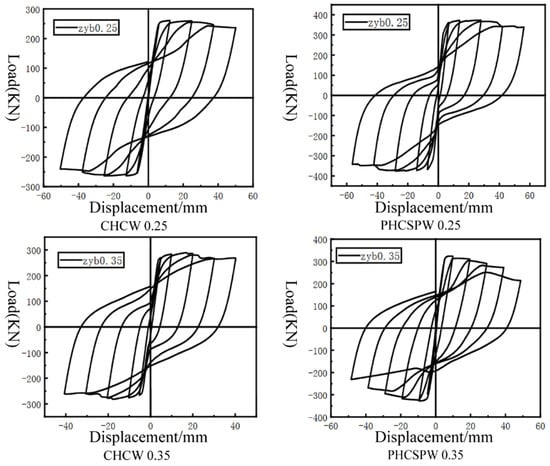
Figure 39.
Simulated Hysteresis Curves.
Table 8.
Displacement and Displacement Angle under Different Axial Compression Ratios.
Figure 38 shows the contour plots of compressive damage and plastic strain for member models under different axial compression ratios. Under different axial compression ratios, it can be observed that the distribution range of plastic strain and compressive damage for PHCSPW is more extensive than that of CHCW. The damage locations for each are gradually extended from the base upwards. The area of compressive damage and plastic strain is the smallest for CHCW0.25, while the extent of compressive damage is severe for PHCSPW0.35, with the largest area of plastic strain. As the axial compression ratio increases, the area of compressive damage in concrete increases. This is due to the steel reinforcement yielding later or not. As the axial compression ratio increases, significant compressive damage occurs in the ground beam section. This is because the ground beam was designed with an axial compression ratio of 0.15 without undergoing redesign. However, this has a minor impact on the overall simulation analysis and needs to be addressed.
From Figure 39, it can be observed that the force-displacement curves of PHCSPW and CHCW were generally similar. Still, the energy dissipation capacity of PHCSPW was significantly greater than CHCW’s. The fact that the bearing capacity of PHCSPW was higher than that of CHCWs indicates that PHCSPW had better ductility and deformation capacity than CHCWs. PHCSPW0.25 had a higher energy dissipation capacity than PHCSPW0.35, indicating that the energy dissipation capacity decreased as the axial compression ratio increased.
Table 8 shows the model’s calculation results, listing the members’ peak load displacement, ultimate displacement, and ultimate displacement angle. It can be observed that the deformation capacity of the specimens was good. It was evident that when the axial compression ratio was 0.15, the ultimate displacement angles were all greater than 1/22. When the axial compression ratio was 0.25, the ultimate displacement angles were all greater than 1/26. Finally, when the axial compression ratio was 0.35, all the ultimate displacement angles were more significant than 1/32. This indicated that by increasing the axial compression ratio from 0.15, the shear wall structure still satisfied the specified deformation requirements. Expanding the design axial compression ratio led to a decrease in the ultimate displacement angle and a reduction in deformation capacity. To ensure that the shear wall possesses good ductility, it is advisable to impose restrictions on the maximum design axial compression ratio in practical engineering applications. For specimens with design axial compression ratios of 0.15 and 0.25, where the axial load is relatively small, the deformation capacity of the shear wall is primarily determined by the tensile reinforcement on the tension side.
The technical flow chart of this experiment is shown in Figure 40.
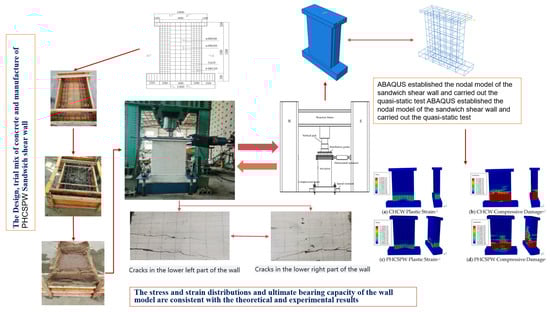
Figure 40.
Technique flow chart.
4. Conclusions
The hysteresis and skeleton curves of PHCSPW and CHCW exhibited similar trends in development. After cracking, there was minimal difference between the bearing and deformation capacities. Comparing the hysteresis loops of CHCW and PHCSPW, it was evident that the hysteresis loop area of PHCSPW was more extensive, indicating that PHCSPW had better energy dissipation capacity. The ratio of yield load over peak load for the specimens ranged from 0.636 to 0.888, indicating that the initial stiffness difference of the specimens was relatively tiny. The yield load of PHCSPW was slightly greater than that of CHCW. The maximum bearing capacity of CHCW was approximately 68.31% of PHCSPW’s.
By comparison with the experiment in reference [18], the failure mode and crack development of sandwich shear walls are similar to those of cast-in-place shear walls, and the cracks are concentrated below 0.5 m and distributed evenly along the wall height. Prefabricated reinforced concrete sandwich panels (RCSPs) under simulated seismic loading were assessed through a large experimental campaign. Tests were carried out on single full-scale panels with or without openings, simulating the behaviour of lateral resisting cantilever and fixed-end walls. Tests were also carried out on a two-story full-scale H-shaped structure constructed by individual panels that were properly joined together. The performance and failure mode of all panels tested revealed strong coupling between flexure and shear due to the squat-type geometry of the panels. However, due to their well-detailed reinforcement, all panels exhibited only a relatively gradual strength and stiffness degradation, and in no case did any panel suffer from sudden shear failure.
The ductility coefficient of CHCW was 3.211, while PHCSPW’s was 3.004, indicating that the ductility of PHCSPW was slightly lower than CHCW’s. The displacement angles corresponding to each load for PHCSPW were somewhat more significant than those of CHCW. The peak displacement of PHCSPW was 1.125 times that of CHCW, with a relatively small difference in ultimate displacement. Both CHCW and PHCSPW exhibited flexural-shear failure, indicating that the connections could effectively transmit forces under cyclic loading, and their connection performance met the requirements.
The ABAQUS simulations of PHCSPW and CHCW, followed by seismic performance testing, resulted in consistent findings with theoretical and experimental analyses regarding the model’s failure mode, stress-strain distribution, and ultimate bearing capacity. Before cracking, PHCSPW exhibited greater stiffness, while after cracking, PHCSPW experienced a faster rate of stiffness degradation. The hysteresis and skeleton curves of the specimens exhibited similar development trends, with the hysteresis loop area of PHCSPW being larger, indicating better energy dissipation capability. Both PHCSPW and CHCW experienced flexural-shear failure, indicating that the connection performance of PHCSPW connectors satisfies the requirements.
Through ABAQUS simulation with different parameters, it was determined that the strength of concrete has little influence on the energy dissipation capacity of the component, while the reinforcement ratio and axial compression ratio of the specimen have greater energy dissipation capacity.
Author Contributions
Conceptualisation, H.G. and J.S.; methodology, J.S.; software, H.G. and X.Z.; validation, J.S., R.Y.M.L. and D.S.; formal analysis, J.S.; investigation, J.S. and H.G.; resources, J.S. and R.Y.M.L.; data curation, X.Z.; writing—original draft preparation, H.G. and J.S.; writing—review and editing, J.S., R.Y.M.L., X.Z. and D.S.; visualisation, J.S. and X.Z.; supervision, J.S.; project administration, J.S.; funding acquisition, J.S. All authors have read and agreed to the published version of the manuscript.
Funding
This research was funded by the [Collaborative Innovation Platform Technology Research and Development Project of Steel City Group and Panzhihua University, Project 7-Sub-project 1: Research on fabricated concrete PC components prepared from high titanium blast furnace slag] grant number [HX2022096]. The APC was funded by [HX2022096].
Data Availability Statement
Data are contained within the article.
Conflicts of Interest
Author Dagang Su is employed by the company Panzhihua Steel City Group Co. The remaining authors declare that the research was conducted in the absence of any commercial or financial relationships that could be construed as a potential conflict of interest. The authors declare no conflicts of interest.
References
- Shen, Z.Y.; Li, Y.Q. Essence and Connotation for Construction in Building Industrialization in China. Prog. Steel Build. Struct. 2015, 17, 1–4. (In Chinese) [Google Scholar]
- Li, X.M.; Gao, R.D.; Xu, Q.F. Experimental study on high ductile joints for precast RC frame. J. Cent. South Univ. (Sci. Technol.) 2013, 44, 3453–3463. (In Chinese) [Google Scholar]
- Yee, A.A.; Hon, D. Structural and Economic Benefits of Precast/Prestressed Concrete Construction. PCI J. 2001, 46, 34–42. [Google Scholar] [CrossRef]
- Song, X.R.; Niu, W.; Wang, G.Y. Sandwich composite shear wall with thermal insulation function. J. Hebei Univ. Technol. 2014, 43, 101–104+116. (In Chinese) [Google Scholar]
- Chen, S. Construction Engineering Green Construction Management Research—Construction Waste Management; Southeast University: Nanjing, China, 2019. (In Chinese) [Google Scholar]
- Luo, M. Approach to Choose Proper Passive Design Strategies for Resi Dential Buildings; Springer: Berlin/Heidelberg, Germany, 2014. [Google Scholar]
- Bush, T.D.; Stine, G.L. Flexural Behavior of Composite Precast Concrete Sandwich Panels with Continuous Truss Connectors. PCI J. 1994, 39, 112–121. [Google Scholar] [CrossRef]
- Kang, W.-H.; Kim, J. Reliability-Based Flexural Design Models for Concrete Sandwich Wall Panels with Continuous GFRP Shear Connectors. Compos. Part B Eng. 2016, 89, 340–351. [Google Scholar] [CrossRef]
- Choi, I.; Kim, J.; You, Y.-C. Effect of Cyclic Loading on Composite Behavior of Insulated Concrete Sandwich Wall Panels with GFRP Shear Connectors. Compos. Part B Eng. 2016, 96, 7–19. [Google Scholar] [CrossRef]
- Dong, X.; Lu, Y.; Xiao, H.; Liao, J. Effects of Various Connectors on the Whole-Life-Cycle Energy Consumption of Sandwich Wall Panels in Five Thermal Zones of China. Energy Build. 2023, 280, 112733. [Google Scholar] [CrossRef]
- Fernando, P.L.N.; Jayasinghe, M.T.R.; Jayasinghe, C. Structural Feasibility of Expanded Polystyrene (EPS) Based Lightweight Concrete Sandwich Wall Panels. Constr. Build. Mater. 2017, 139, 45–51. [Google Scholar] [CrossRef]
- Kumar, S.; Chen, B.; Xu, Y.; Dai, J.-G. Structural Behavior of FRP Grid Reinforced Geopolymer Concrete Sandwich Wall Panels Subjected to Concentric Axial Loading. Compos. Struct. 2021, 270, 114117. [Google Scholar] [CrossRef]
- Rosenthal, I. Structural Behaviour of Loaded Multilayer Wall Panels. Struct. Behav. Loaded Multilayer Wall Panels 1984, 17, 329–332. [Google Scholar] [CrossRef]
- Mohamad, N.; Muhammad, H.M. Testing of Precast Lightweight Foamed Concrete Sandwich Panel with Single and Double Symmetrical Shear Truss Connectors under Eccentric Loading. Adv. Mat. Res. 2011, 335–336, 1107–1116. [Google Scholar] [CrossRef]
- Pavese, A.; Bournas, D.A. Experimental Assessment of the Seismic Performance of a Prefabricated Concrete Structural Wall System. Eng. Struct. 2011, 33, 2049–2062. [Google Scholar] [CrossRef]
- Gara, F.; Ragni, L.; Roia, D.; Dezi, L. Experimental Tests and Numerical Modelling of Wall Sandwich Panels. Eng. Struct. 2012, 37, 193–204. [Google Scholar] [CrossRef]
- Mugahed Amran, Y.H.; Abang Ali, A.A.; Rashid, R.S.M.; Hejazi, F.; Safiee, N.A. Structural Behavior of Axially Loaded Precast Foamed Concrete Sandwich Panels. Constr. Build. Mater. 2016, 107, 307–320. [Google Scholar] [CrossRef]
- Choi, K.-B.; Choi, W.-C.; Feo, L.; Jang, S.-J.; Yun, H.-D. In-Plane Shear Behavior of Insulated Precast Concrete Sandwich Panels Reinforced with Corrugated GFRP Shear Connectors. Compos. Part B Eng. 2015, 79, 419–429. [Google Scholar] [CrossRef]
- Benayoune, A.; Samad, A.A.A.; Abang Ali, A.A.; Trikha, D.N. Response of Pre-Cast Reinforced Composite Sandwich Panels to Axial Loading. Constr. Build. Mater. 2007, 21, 677–685. [Google Scholar] [CrossRef]
- Benayoune, A.; Samad, A.A.A.; Trikha, D.N.; Ali, A.A.A.; Ellinna, S.H.M. Flexural Behaviour of Pre-Cast Concrete Sandwich Composite Panel—Experimental and Theoretical Investigations. Constr. Build. Mater. 2008, 22, 580–592. [Google Scholar] [CrossRef]
- Fam, A.; Sharaf, T. Flexural Performance of Sandwich Panels Comprising Polyurethane Core and GFRP Skins and Ribs of Various Configurations. Compos. Struct. 2010, 92, 2927–2935. [Google Scholar] [CrossRef]
- Woltman, G.; Tomlinson, D.; Fam, A. Investigation of Various GFRP Shear Connectors for Insulated Precast Concrete Sandwich Wall Panels. J. Compos. Constr. 2013, 17, 711–721. [Google Scholar] [CrossRef]
- Li, Z.J.; Xue, W.C. Experimental study on fire resistance of precast concrete inorganic insulation sandwich walls. J. Build. Struct. 2015, 36, 59–67. (In Chinese) [Google Scholar]
- Zhong, X.; Ye, X.G.; Xu, Q. Shear slip mechanism and numerical analysis of I-shaped sectionsuperimposed walls under low-cycle reversed load. China Civ. Eng. J. 2013, 46, 111–116. (In Chinese) [Google Scholar]
- Zhu, Y.M.; Yang, J.L.; Xue, W.C. Experimental study on static properties of four-sided simply supported precast concrete inorganic insulation sandwich wall. China Concr. Cem. Prod. 2013, 58–61. (In Chinese) [Google Scholar] [CrossRef]
- Zhong, X.; Wang, Z.Y.; Jiang, Q. Research on flexural behavior of precast concretesandwich panels with gfrp connectors. Ind. Constr. 2017, 47, 40–45. (In Chinese) [Google Scholar]
- Zhong, X.; Ye, X.G.; Jiang, Q. Seismie performance study of the superimposed shear wall with strong connectionin horizontal connection. Build. Struct. 2015, 45, 43–48. (In Chinese) [Google Scholar]
- He, Y.H.; Li, Q.Q.; Xu, J.C. Finite element Analysis of Force on Prefabricated reinforced concrete sandwich Wall. Sci. Technol. Innov. 2019, 2019, 143–144. (In Chinese) [Google Scholar]
- Rose, D.; Polysius, A.G. Granulated Blast Furnace Slag Grinding. World Cem. 2000, 31, 49–66. [Google Scholar]
- Seggiani, M.; Vitolo, S. Recovery of Silica Gel from Blast Furnace Slag. Resour. Conserv. Recycl. 2003, 40, 71–80. [Google Scholar] [CrossRef]
- Kumar, V.; Kumar, A.; Prasad, B. Influence of Elevated Temperature on Alkali-Activated Ground Granulated Blast Furnace Slag Concrete. J. Struct. Fire Eng. 2020, 11, 247–260. [Google Scholar] [CrossRef]
- Canpolat, O.; Uysal, M.; Aygörmez, Y.; Şahin, F.; Acıkök, F. Effect of Fly Ash and Ground Granulated Blast Furnace Slag on The Strength of Concrete Pavement. J. Sustain. Constr. Mater. Technol. 2018, 3, 278–285. [Google Scholar] [CrossRef]
- Li, L.-Z.; Chen, W.; Yao, Q.-B. Actual Measurement and Analysis on the Carbonization Depth of the High Titanium Slag Concrete; Atlantis Press: Dordrecht, The Netherlands, 2014; pp. 796–799. [Google Scholar]
- Reddy, K.C.; Subramaniam, K.V.L. Blast Furnace Slag Hydration in an Alkaline Medium: Influence of Sodium Content and Sodium Hydroxide Molarity. J. Mater. Civ. Eng. 2020, 32, 04020371. [Google Scholar] [CrossRef]
- Srinivasarao, C.; Vijaya Bhaskar Reddy, S. Study of Standard Grade Concrete Consisting of Granulated Blast Furnace Slag as a Fine Aggregate. Mater. Today Proc. 2020, 27, 859–865. [Google Scholar] [CrossRef]
- Endawati, J. Permeability and Porosity of Pervious Concrete Containing Blast Furnace Slag as a Part of Binder Materials and Aggregate. Sol. St. Phen. 2017, 266, 272–277. [Google Scholar] [CrossRef]
- Sun, J.; Li, R.Y.M.; Jiao, T.; Wang, S.; Deng, C.; Zeng, L. Research on the Development and Joint Improvement of Ceramsite Lightweight High-Titanium Heavy Slag Concrete Precast Composite Slab. Buildings 2023, 13, 3. [Google Scholar] [CrossRef]
- Sun, J.; Yi Man Li, R.; Jotikasthira, N.; Li, K.; Zeng, L. Experimental Study on Lightweight Precast Composite Slab of High-Titanium Heavy-Slag Concrete. Adv. Civ. Eng. 2021, 2021, e6665388. [Google Scholar] [CrossRef]
- Sun, J.; Li, R.Y.M.; Li, L.; Deng, C.; Ma, S.; Zeng, L.; Yan, Z. Develop a Sustainable Wet Shotcrete for Tunnel Lining Using Industrial Waste: A Field Experiment and Simulation Approach. Adv. Concr. Constr. 2023, 15, 333–348. [Google Scholar] [CrossRef]
- Di, J. Study on Durability of Road Fiber Concrete Prepared by High Titanium Heavy Slag; Xihua University: Chengdu, China, 2019. (In Chinese) [Google Scholar]
- Zhou, C.L. Experimental Study on High-titanium Blast Furnace SlagHeat-resistant Concrete. Bull. Chin. Ceram. Soc. 2018, 37, 3119–3123. (In Chinese) [Google Scholar]
- Mou, T.M.; Kong, D.D.; Cao, P.P. Preparation and application of high performance pumping concrete using heavy titanium slag sand. Concrete 2014, 59, 101–104. (In Chinese) [Google Scholar]
- Li, X.W.; Chen, W.; LI, X.W. Experimental study on seismic performance of high strength concrete columns with high titanium heavy slag as coarse and fine aggregates. Build. Struct. 2013, 43, 96–100. (In Chinese) [Google Scholar]
- Pang, S. Study on Preparation and Performance ofSuper High Strength Concrete Filled SteelTubes with High Titanium Heavy Slag Sand; Xihua University: Chengdu, China, 2021. (In Chinese) [Google Scholar]
- Wang, J.; Liu, Y.; Li, X.W. Uniaxial compression test and numerical simulation analysis of PFC 2D remodeling of high titanium heavy slag concrete. Sichuan Archit. 2022, 42, 275–278. (In Chinese) [Google Scholar]
- Huang, H.; Long, J.W.; Yuan, F. Experimental study on axial compressive behaviors of steel reinforced concrele columns with high titanium heavy slag. Concrete 2015, 2015, 5–9. (In Chinese) [Google Scholar]
- Gong, H.S.; Sun, J.K.; Wang, X.P. Study on effect of high titanium slag content change on concrete performance. Sichuan Cem. 2023, 17–19+22. (In Chinese) [Google Scholar]
- Liang, H.Z.; Chen, W.; Yang, H. Experimental Study on Durability of High Titanium Heavy slag concrete under salt freezing. Iron Steelvanadium Titan. 2022, 43, 100–106. (In Chinese) [Google Scholar]
- Gou, Y.F.; Wang, W. Experimental study on chloride ion permeability resistance of high titanium heavy slag concrete. Shanxi Archit. 2019. (In Chinese) [Google Scholar] [CrossRef]
- GB 50011-2010; Code for Seismic Design of Buildings. China Architecture Publishing: Beijing, China, 2010. (In Chinese)
- JGJ 3-2010; Technical Specification for Concrete Structures of Tall Buildings. Standards Press of China: Beijing, China, 2010. (In Chinese)
- GB 50010-2010; Code for Design of Concrete Structure. China Architecture Publishing: Beijing, China, 2010. (In Chinese)
- GB/T 50152-2012; Standard for Test Method of Concrete Structures. China Architecture Publishing: Beijing, China, 2012. (In Chinese)
- JGJ 101-1996; Specification of Test Methods for Earthquake Resistant Building. China Architecture Publishing: Beijing, China, 1996. (In Chinese)
- Xu, K. ABAQUS Building Structure Analysis and Application. China Construction. 2014, 4, 65. (In Chinese) [Google Scholar]
- Nie, J.G.; Wang, Y.H. Comparison study of constitutive model of concrete inabaous for static analysis of structures. Eng. Mech. 2013, 30, 59–67+82. (In Chinese) [Google Scholar]
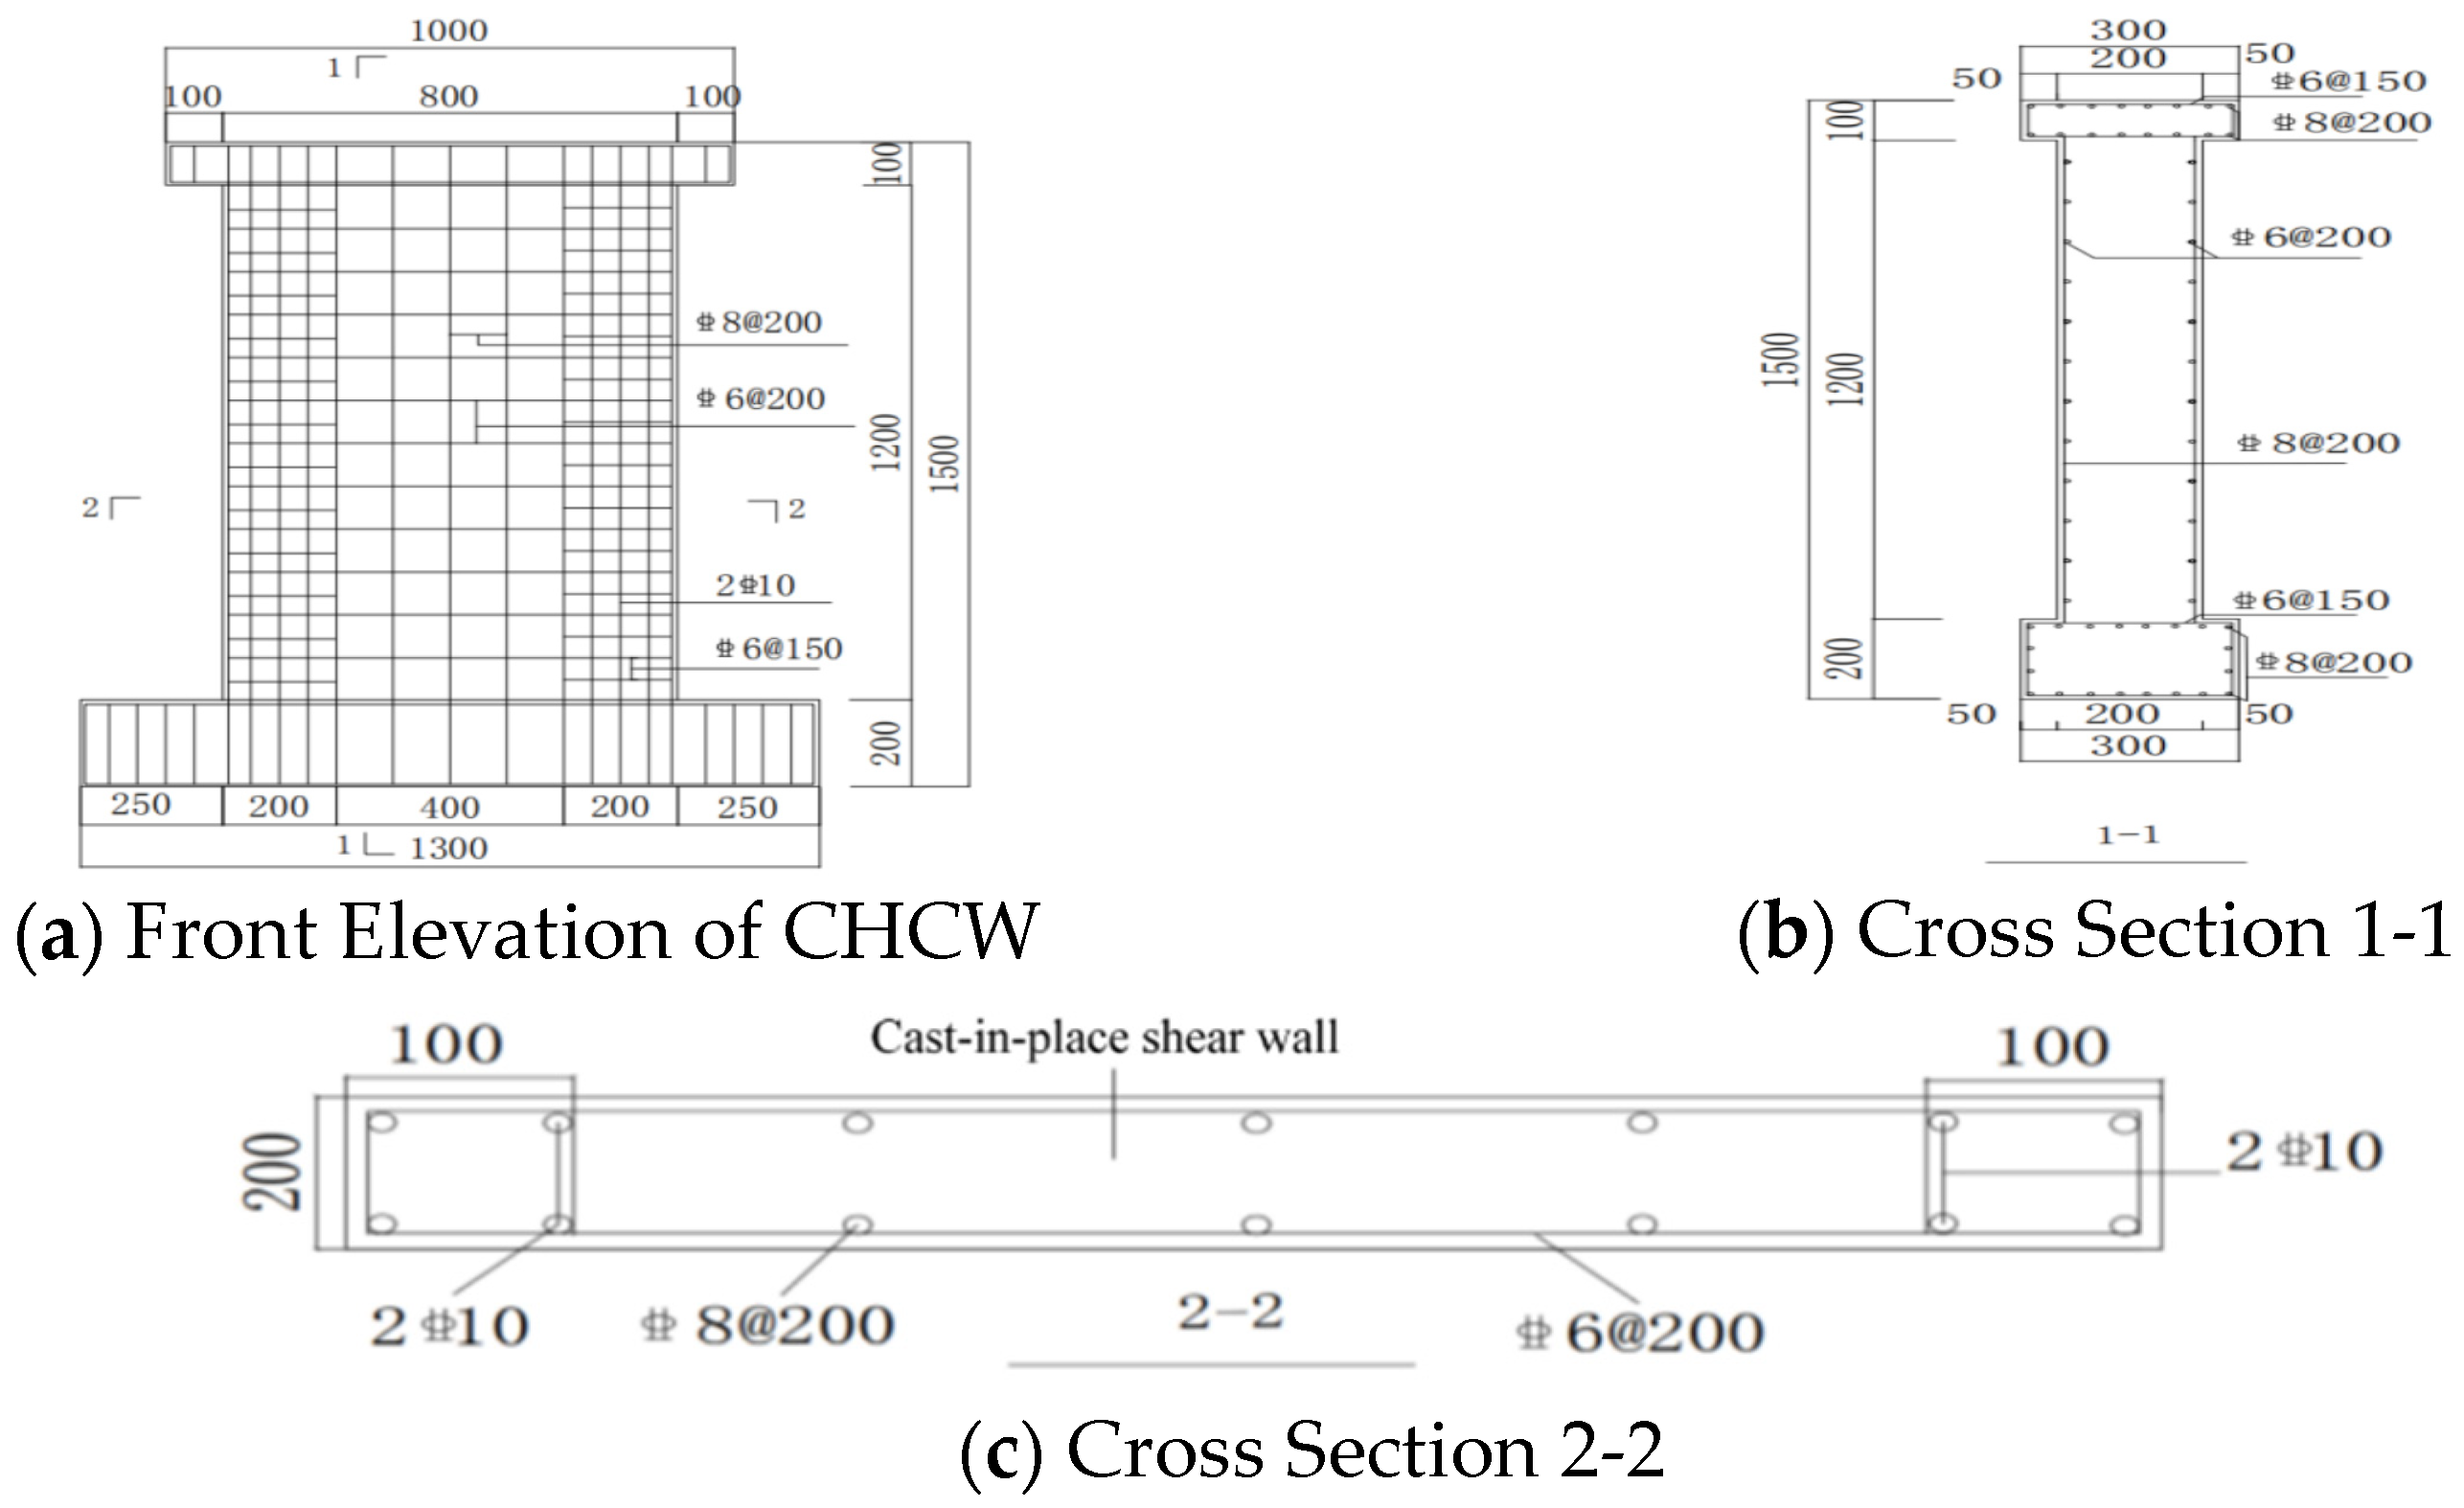
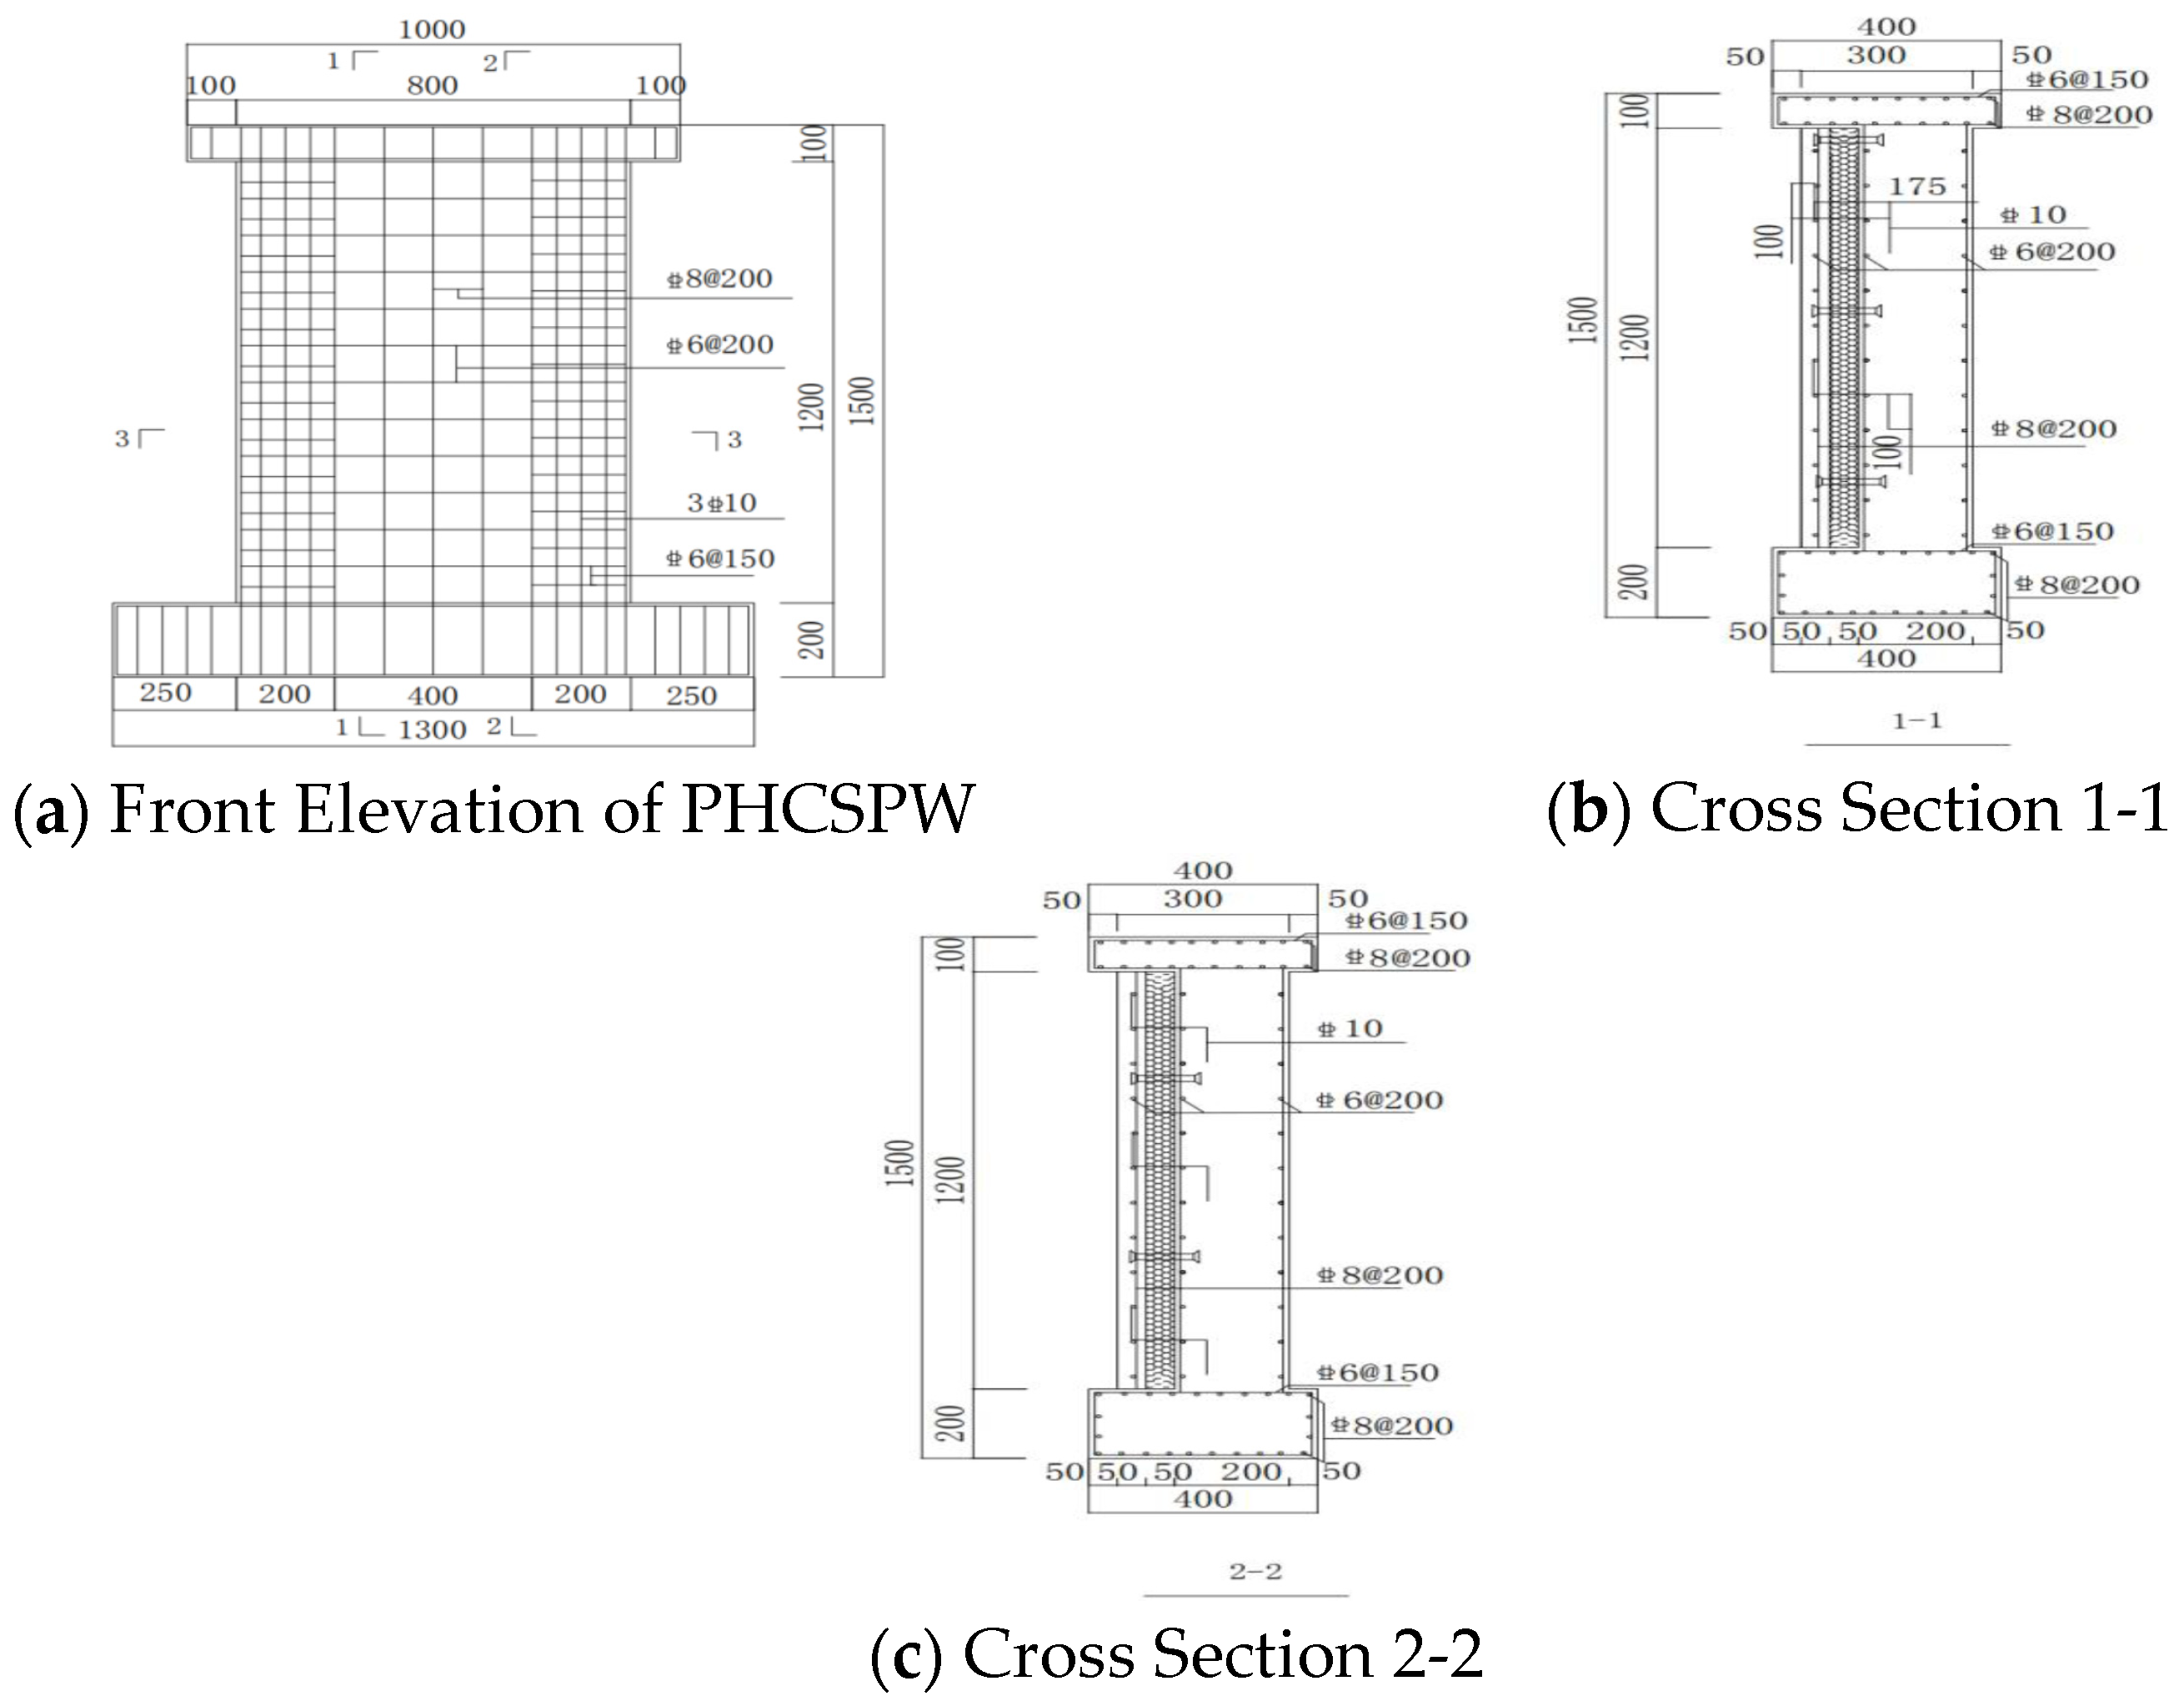
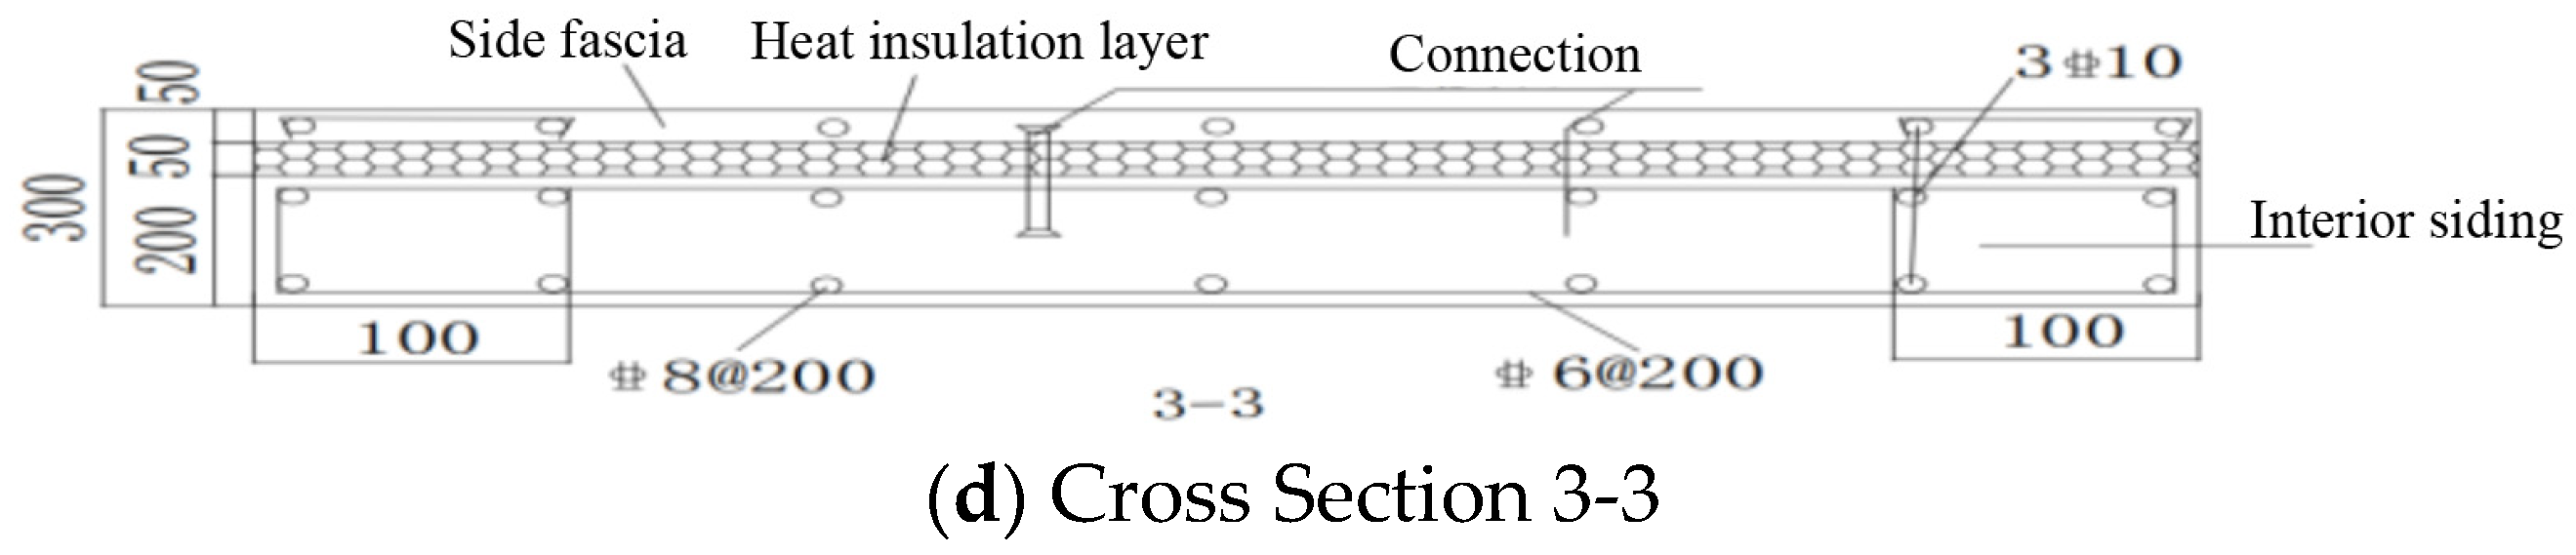
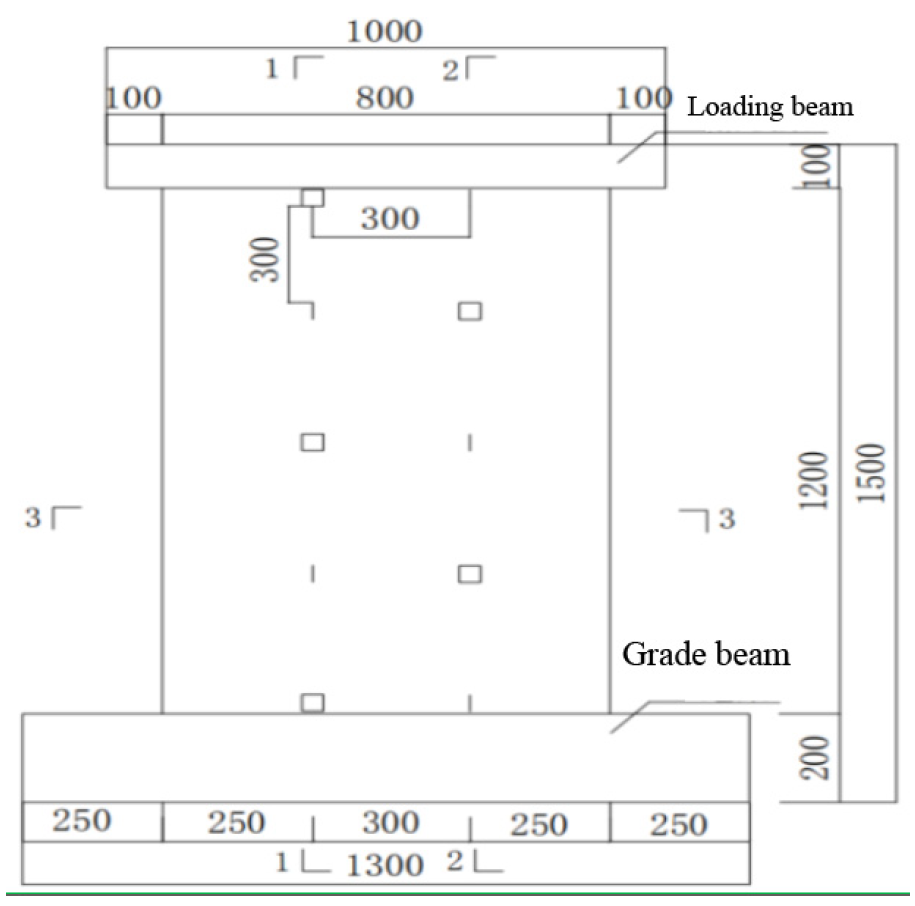
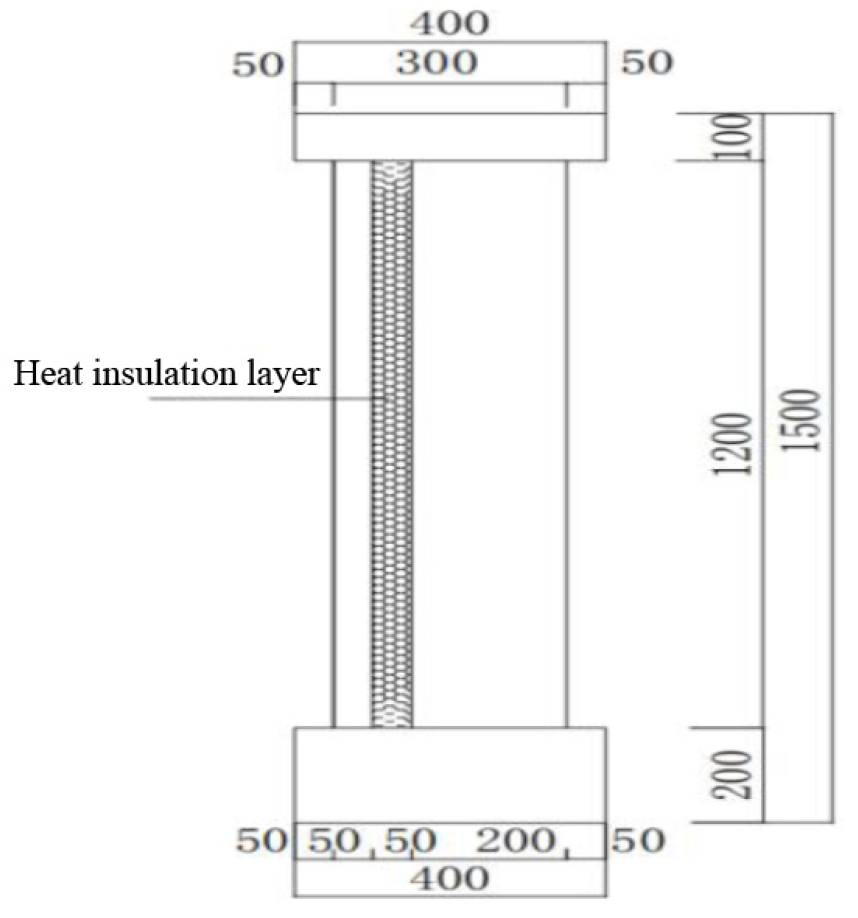
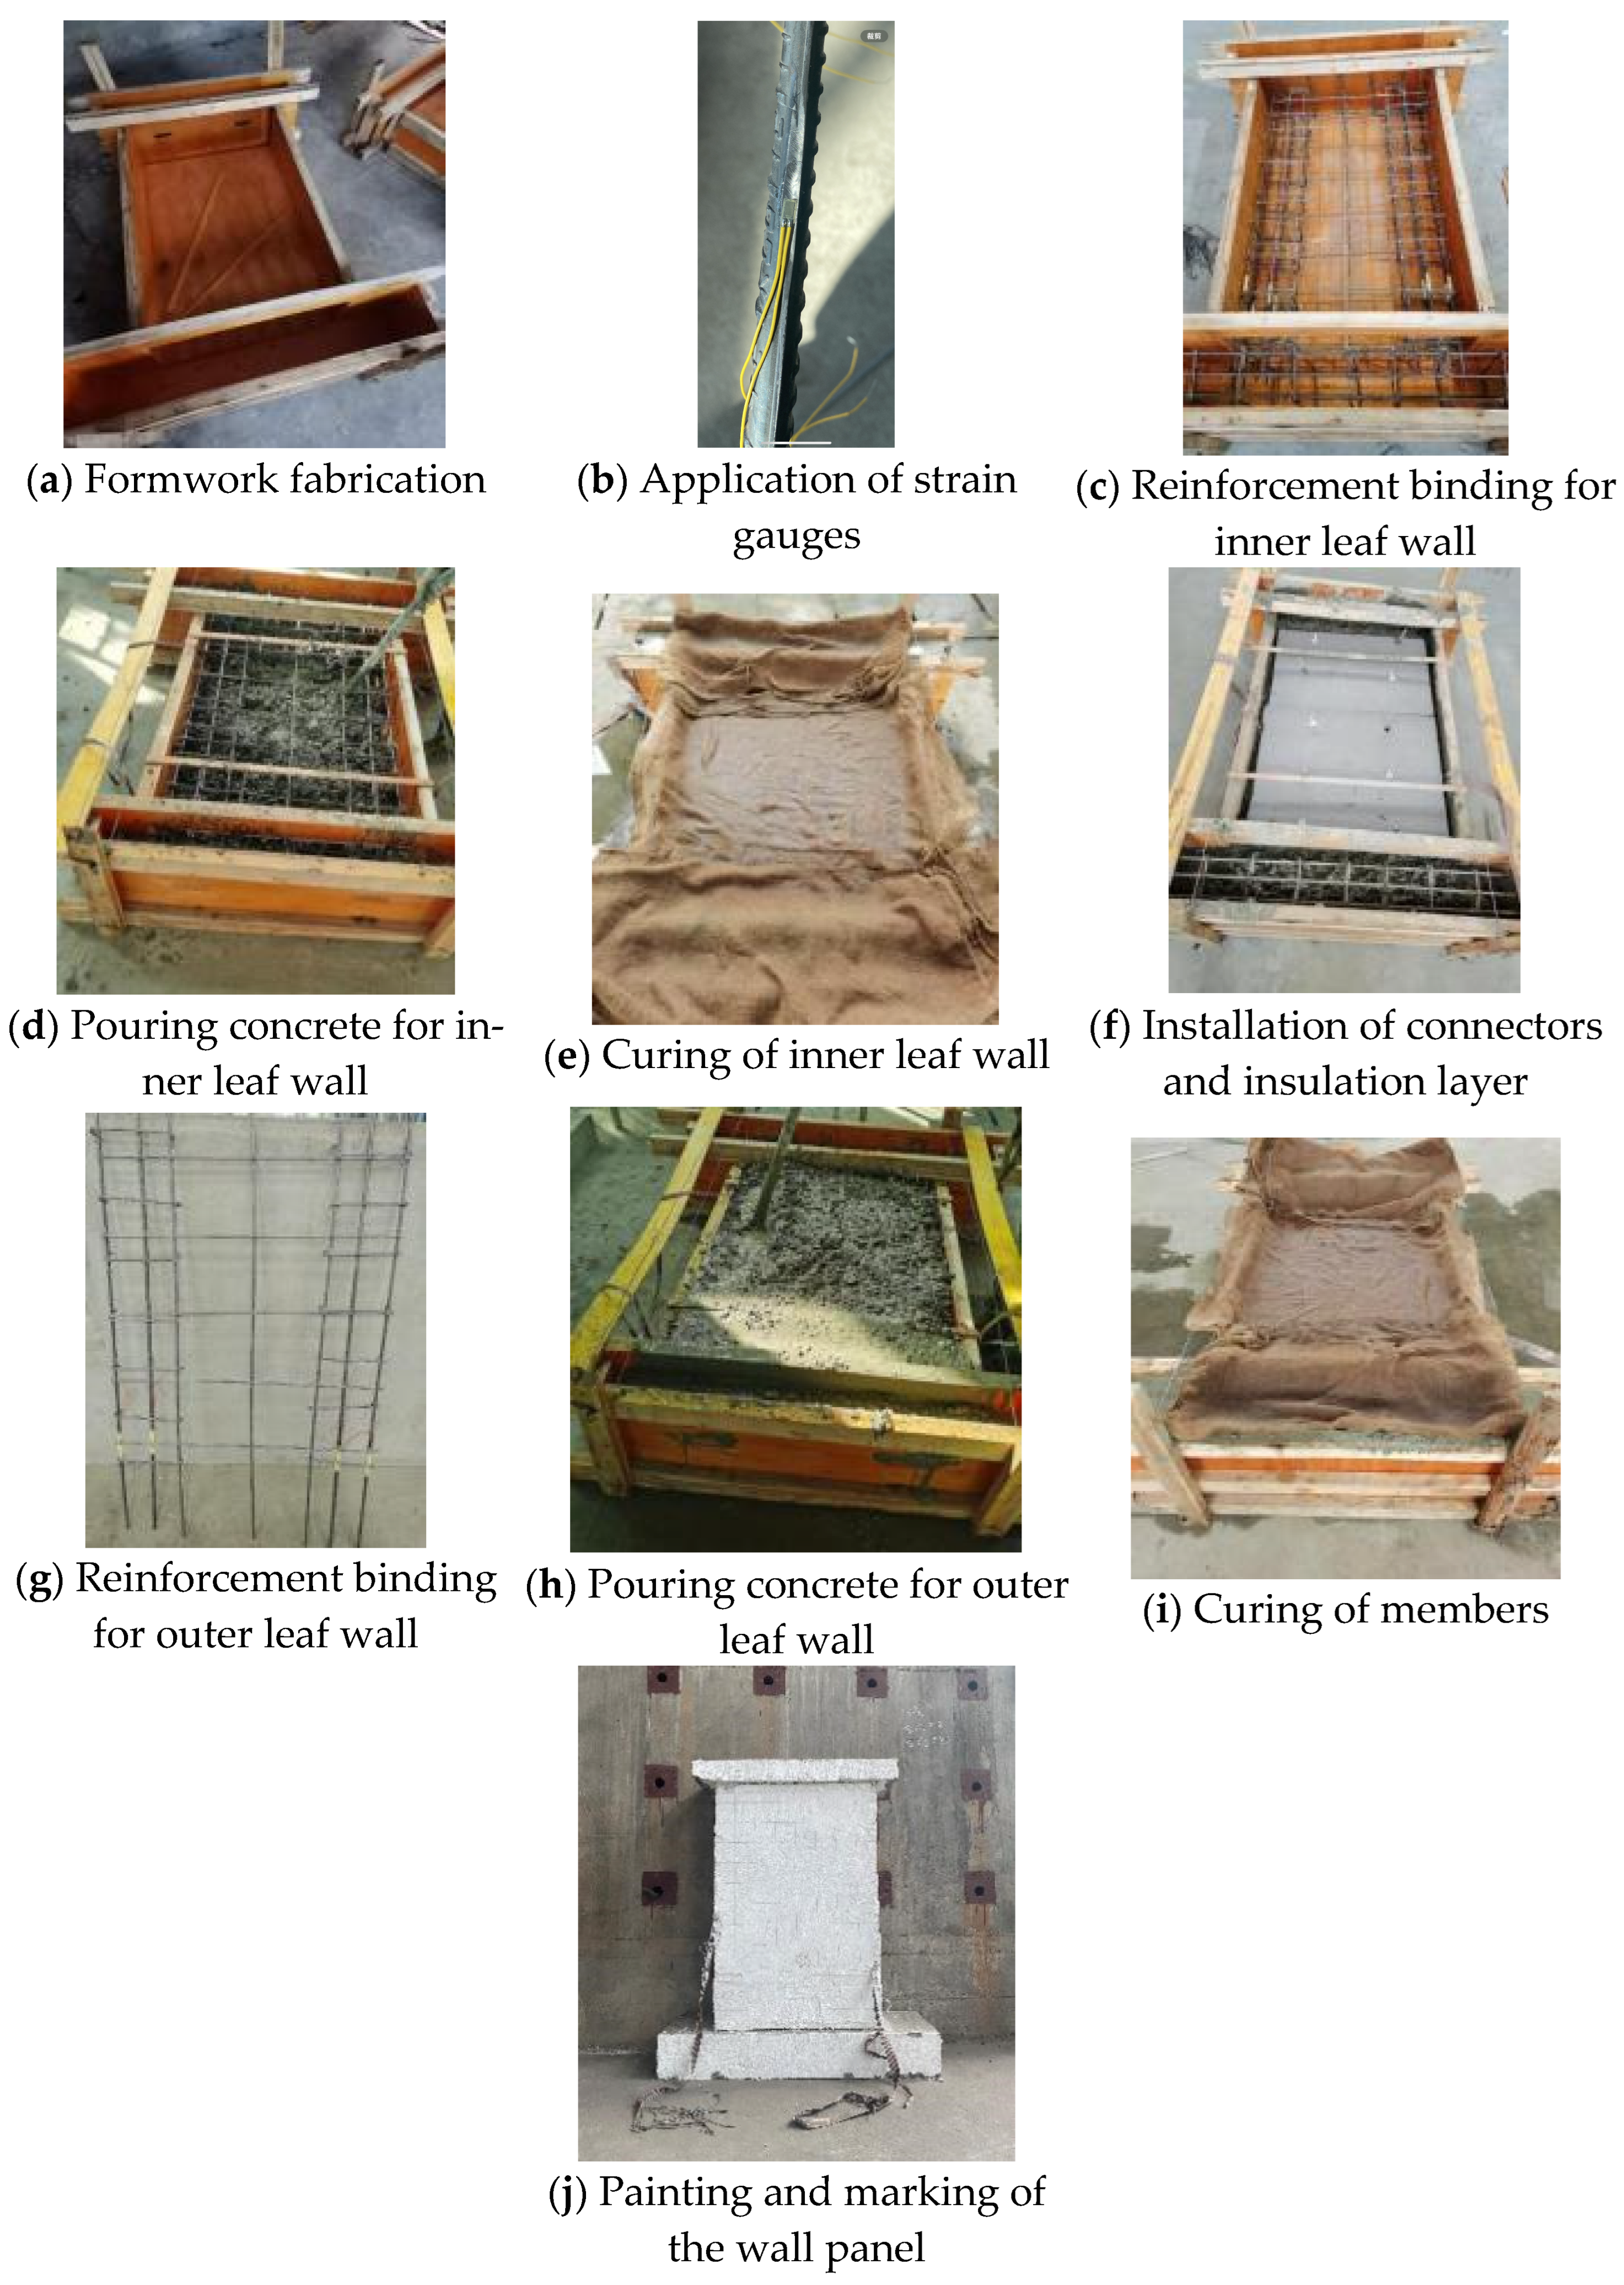
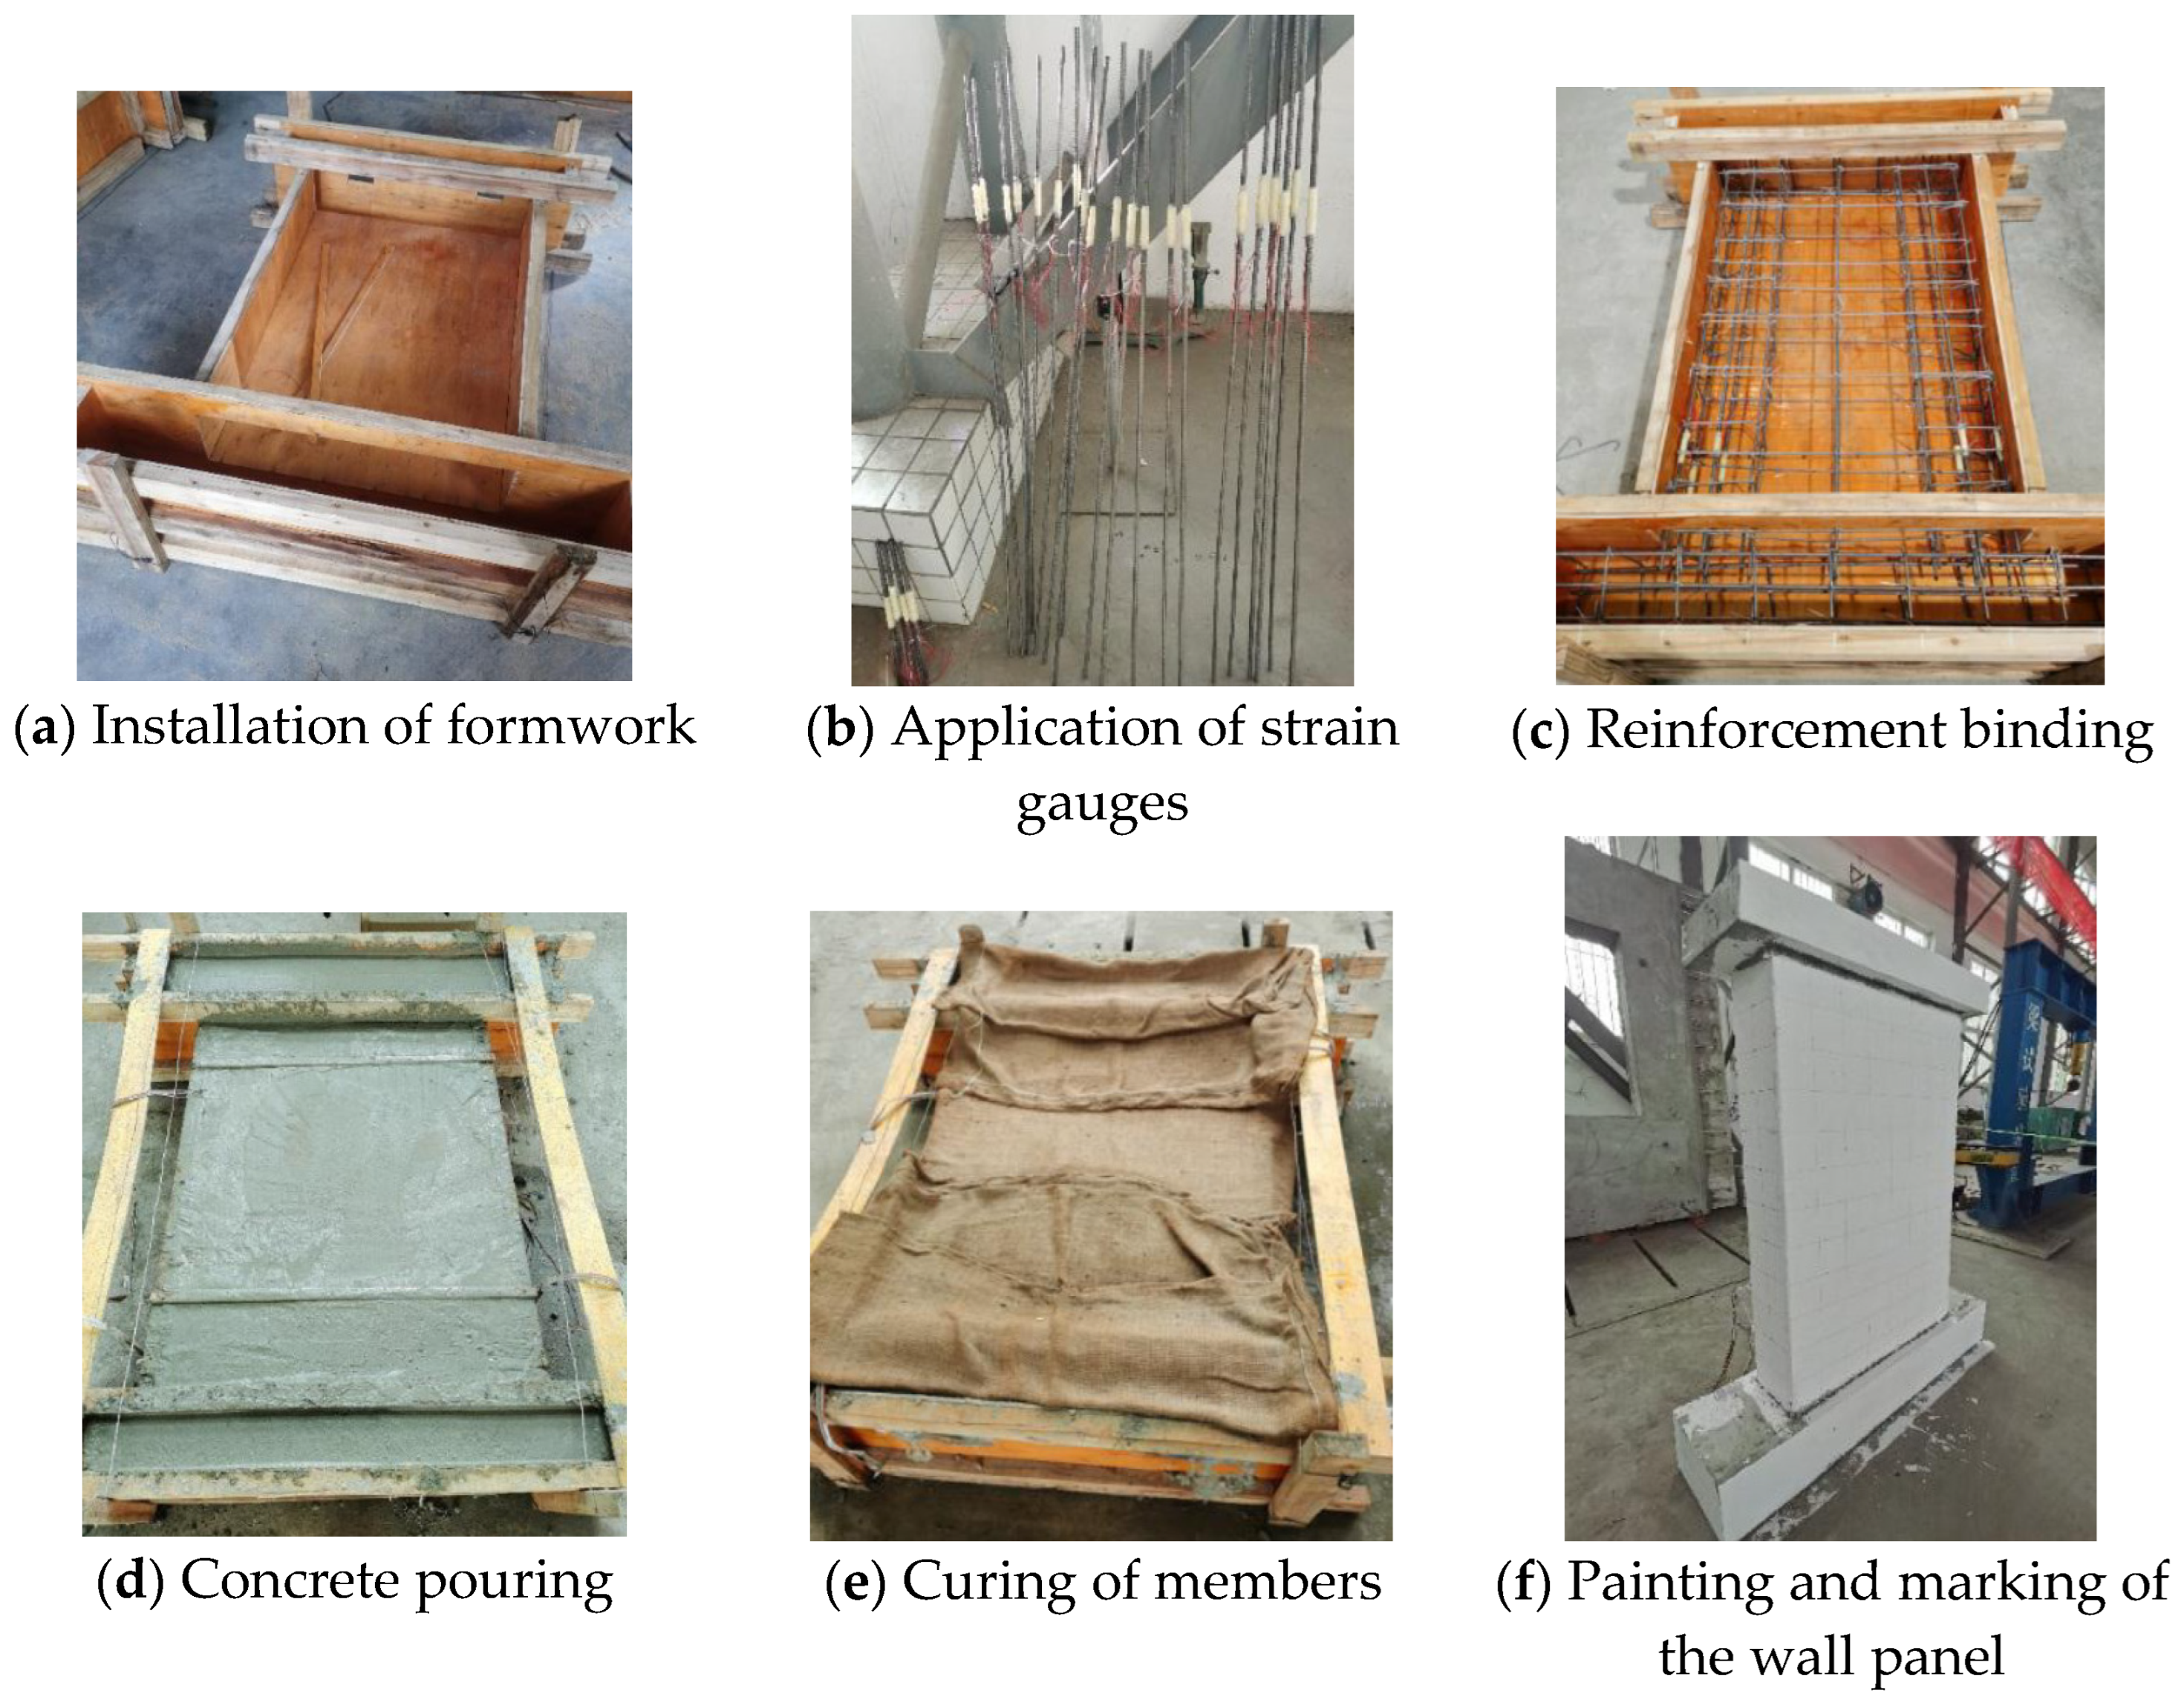
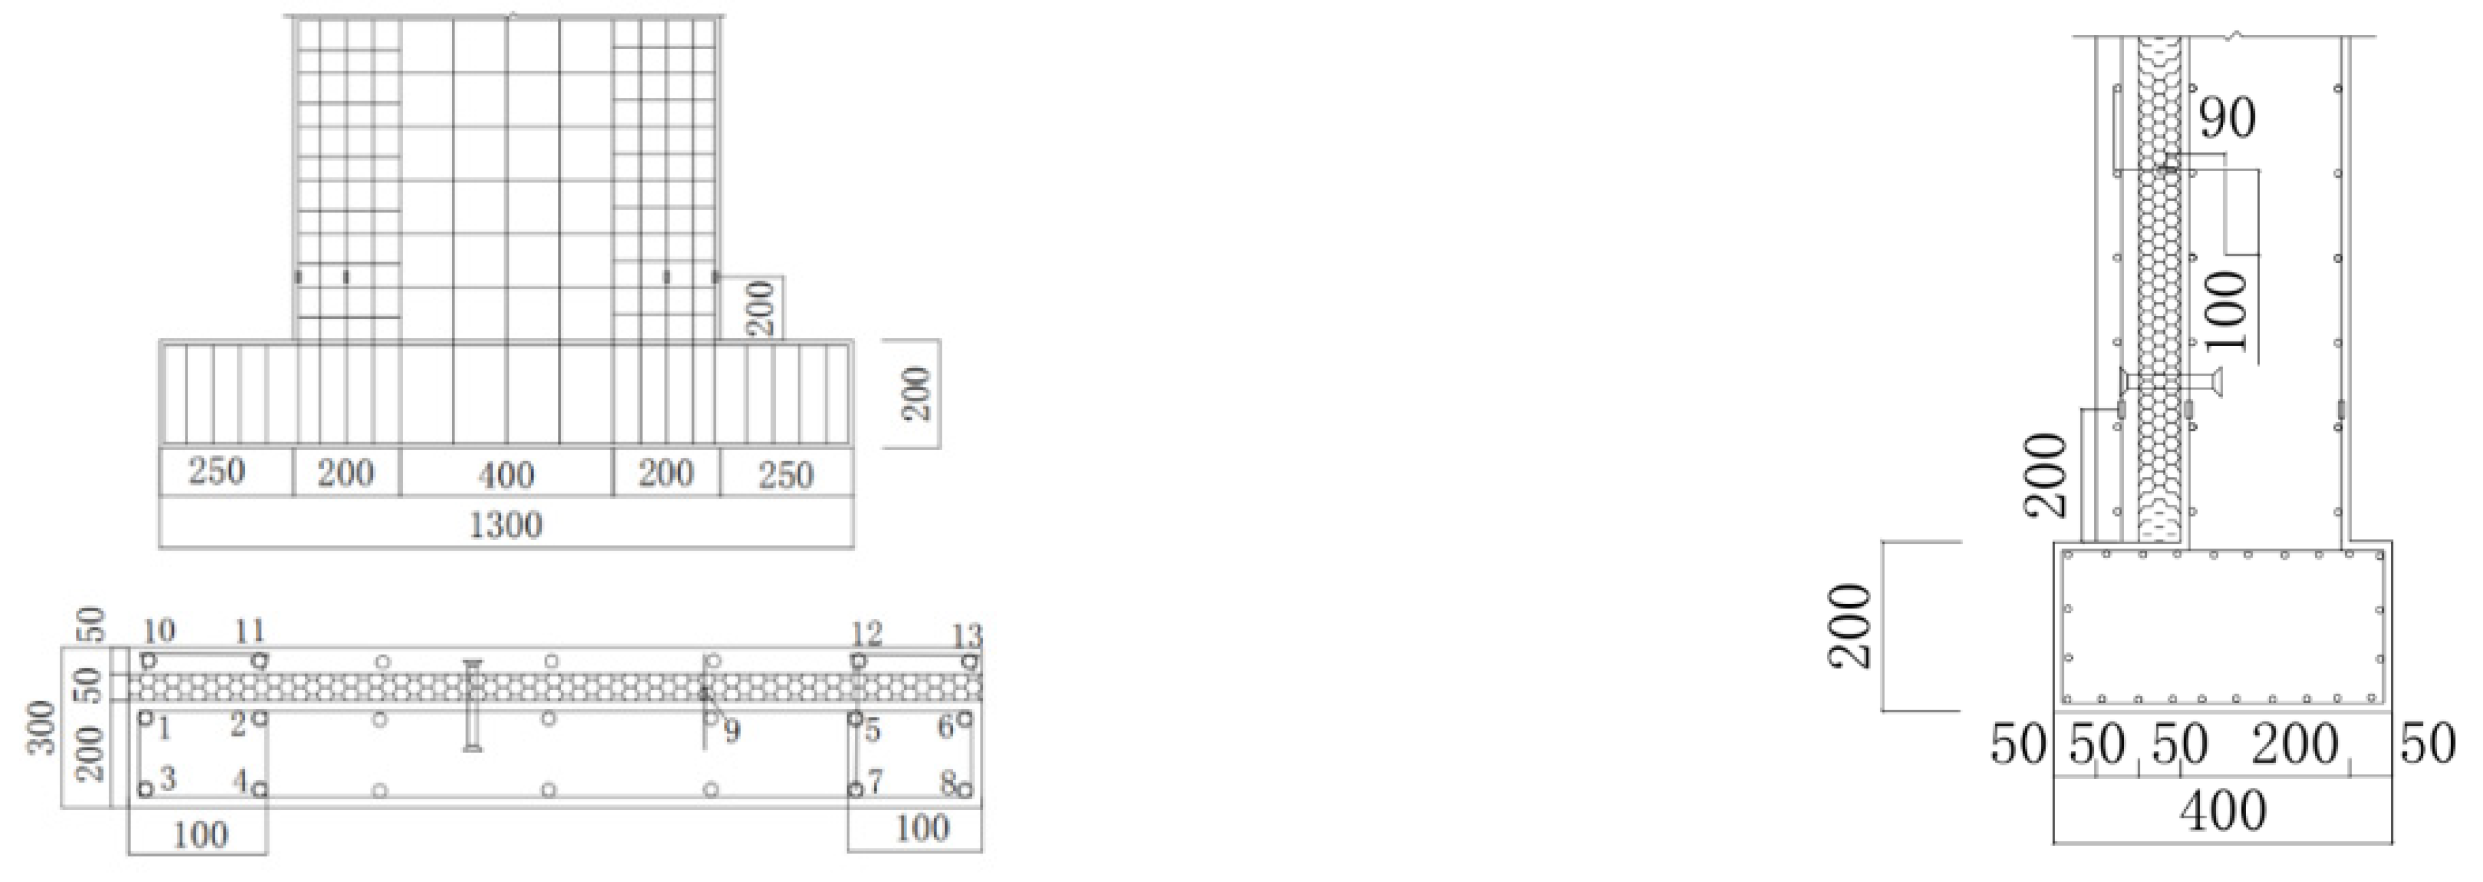
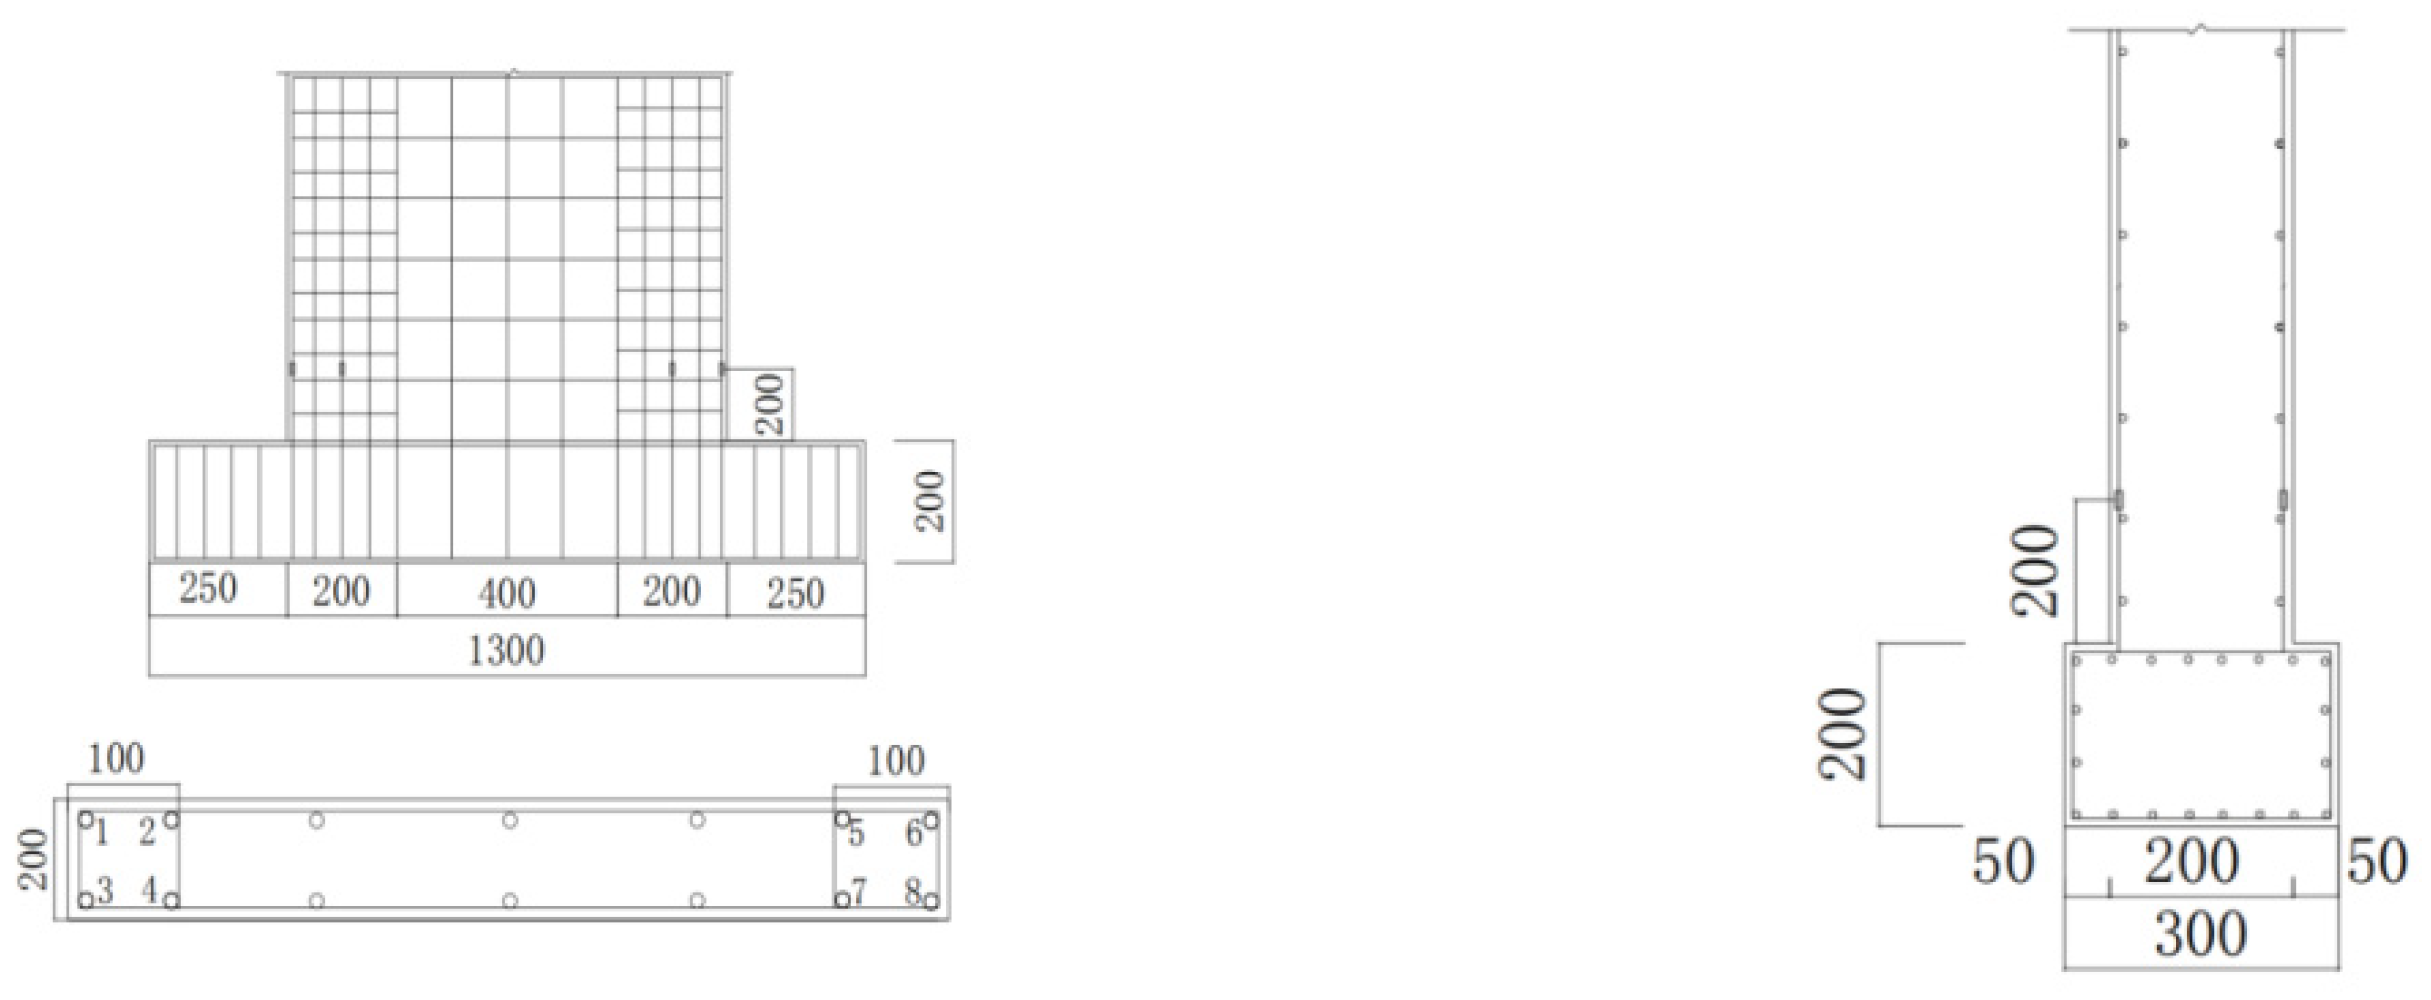
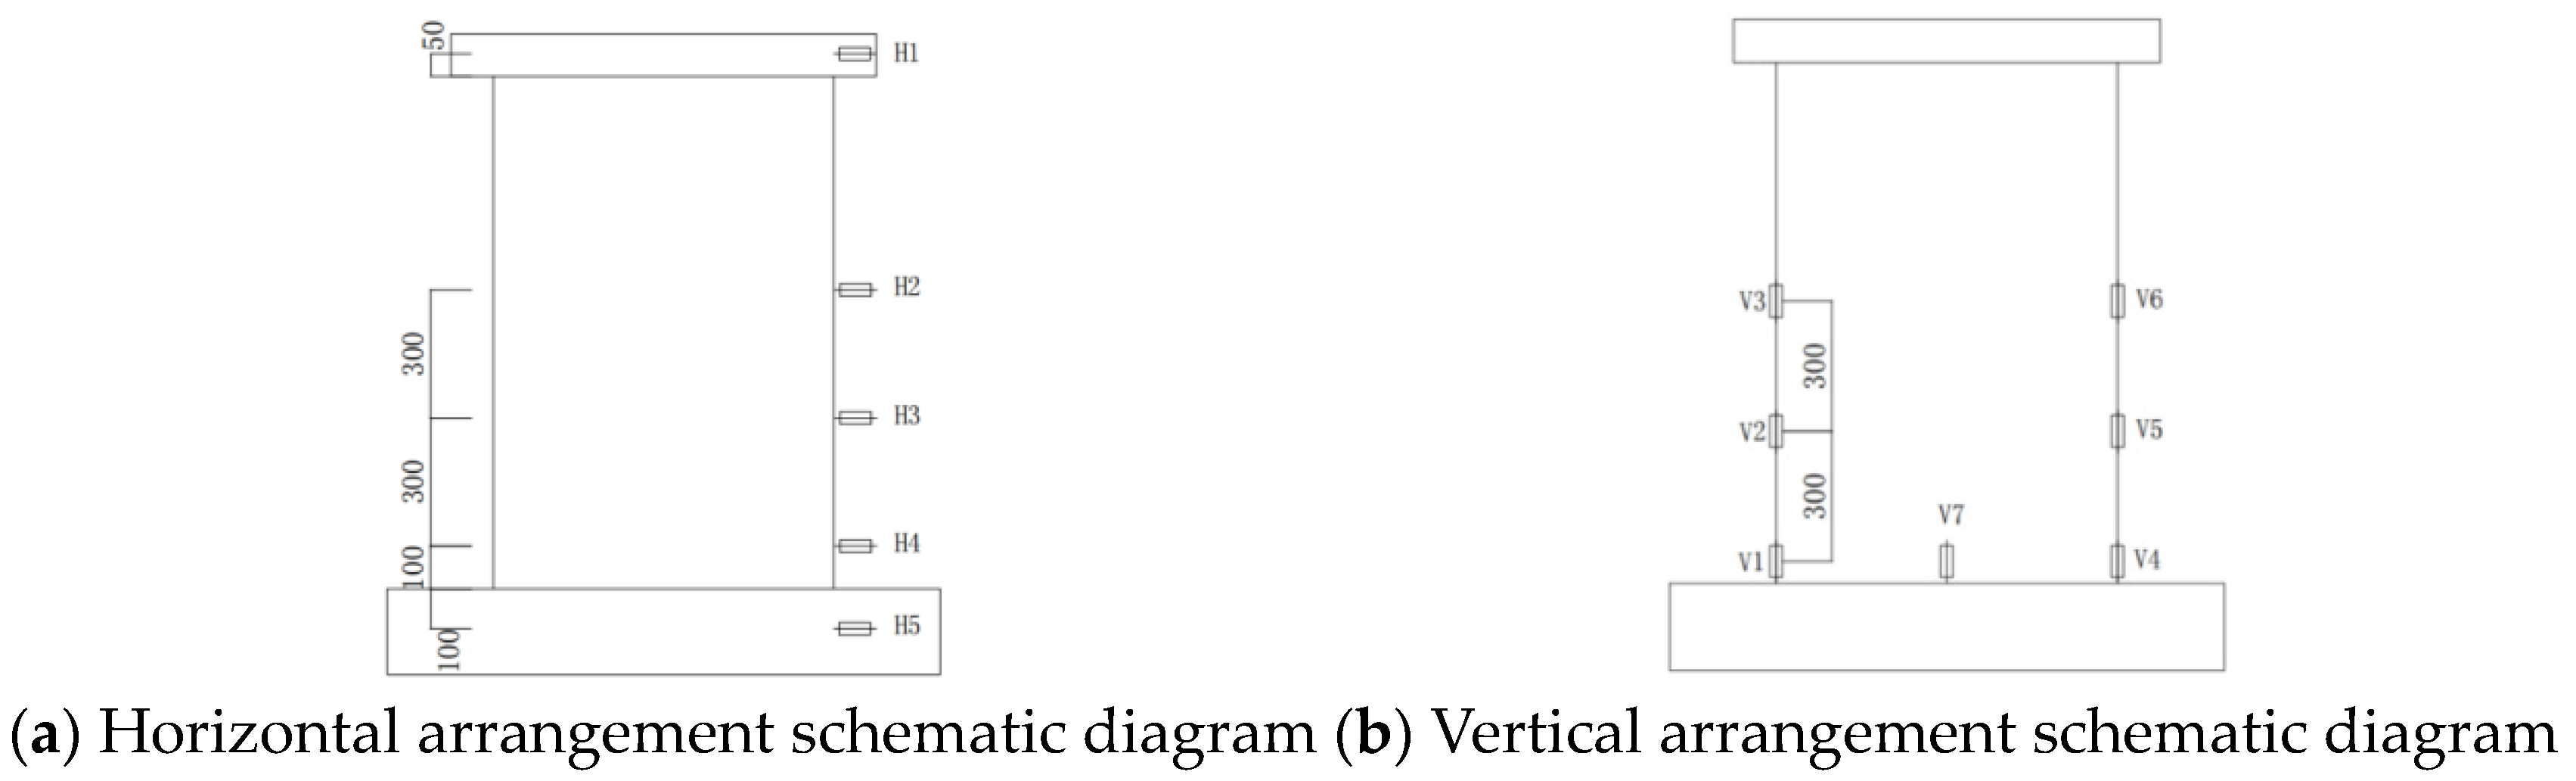
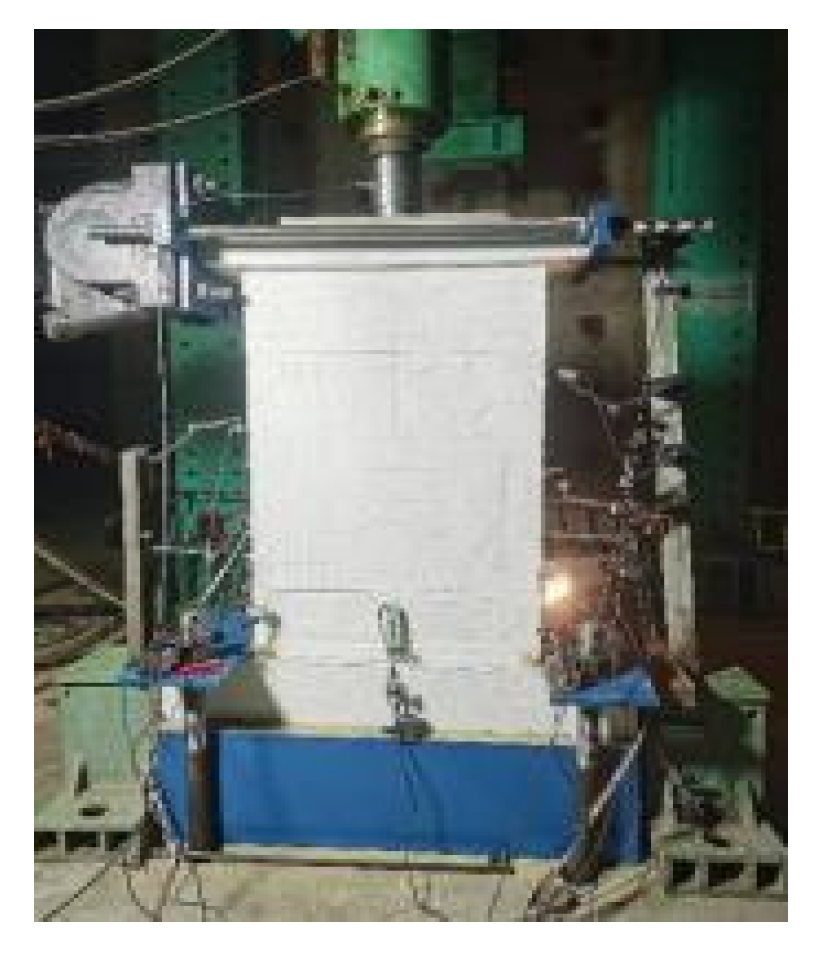
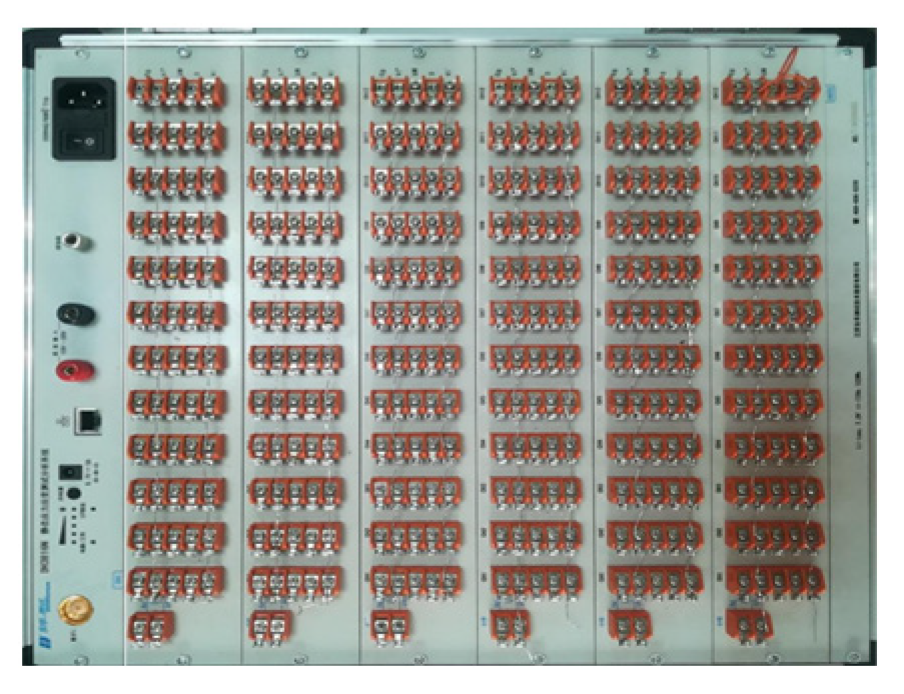
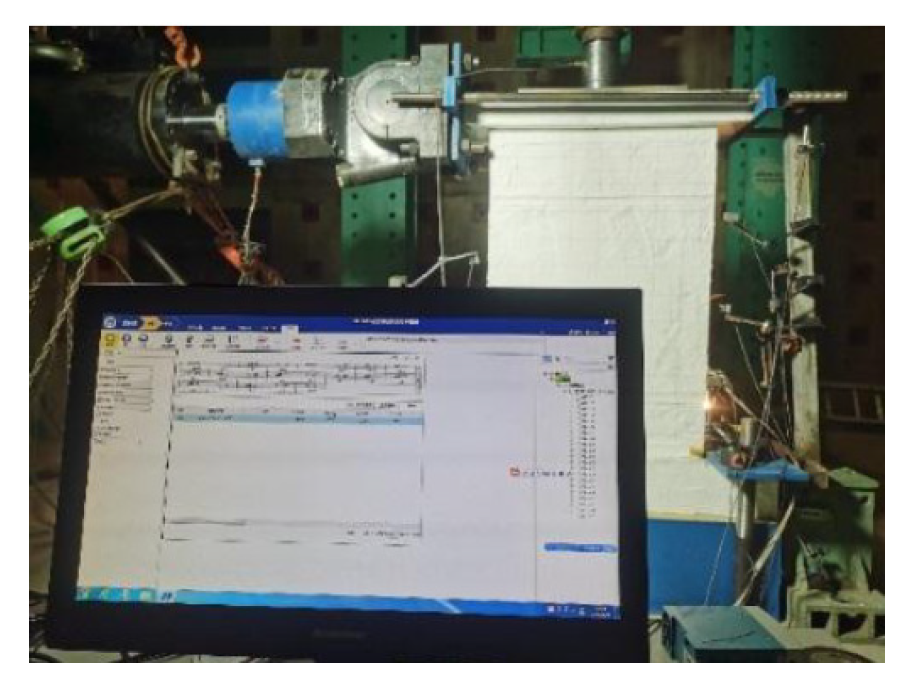
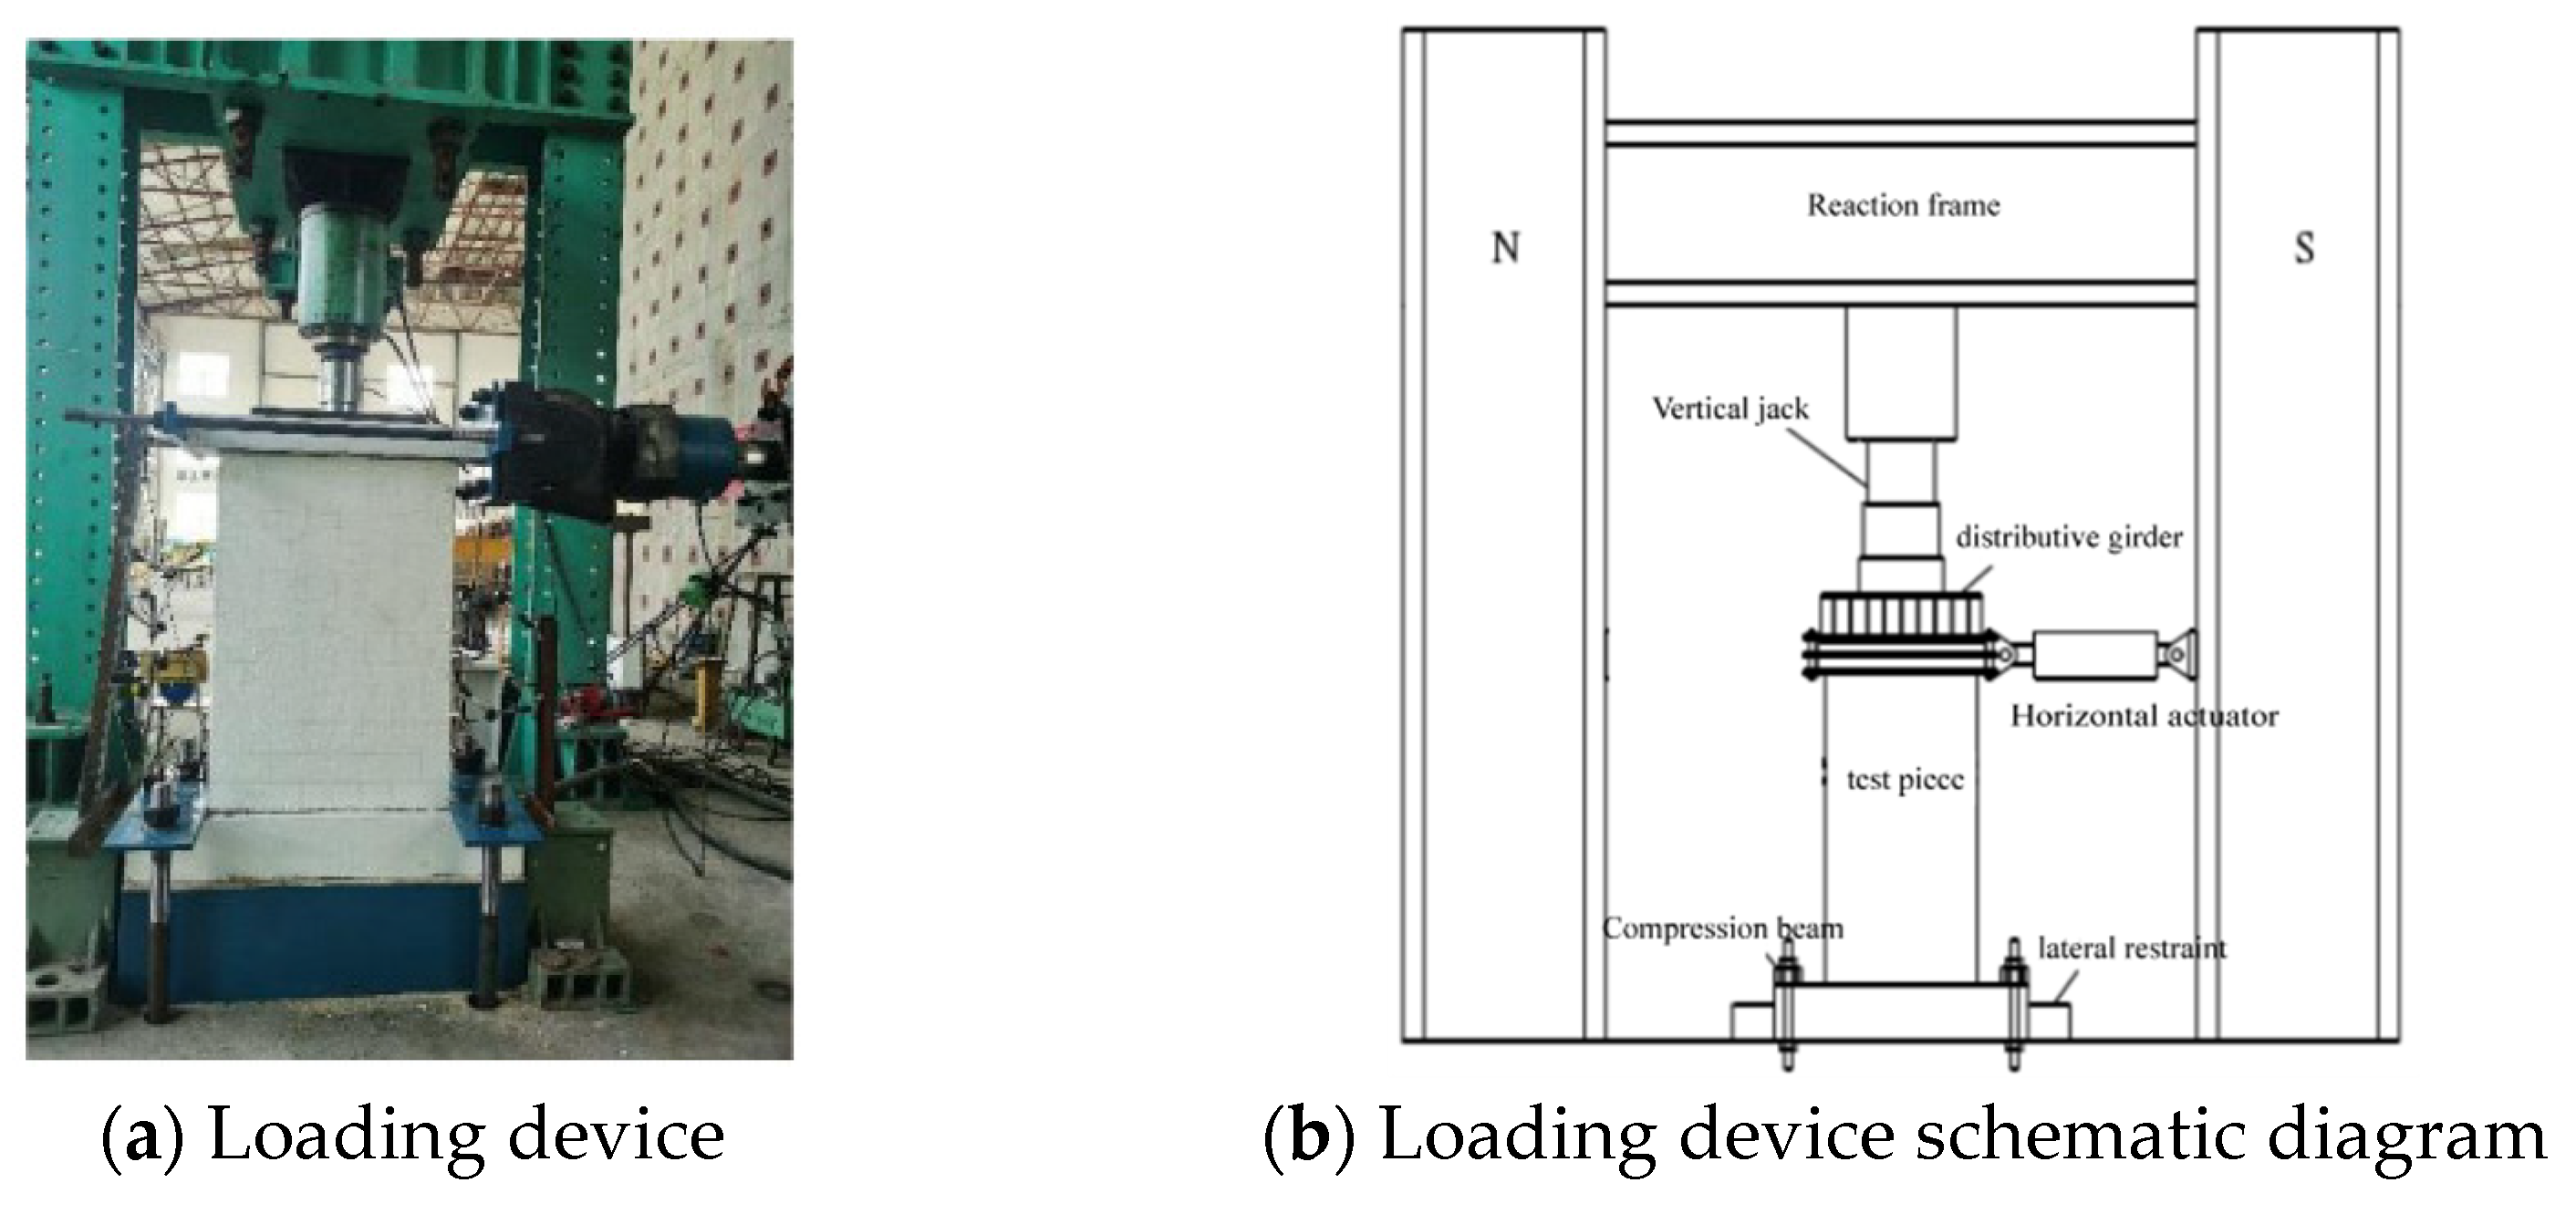
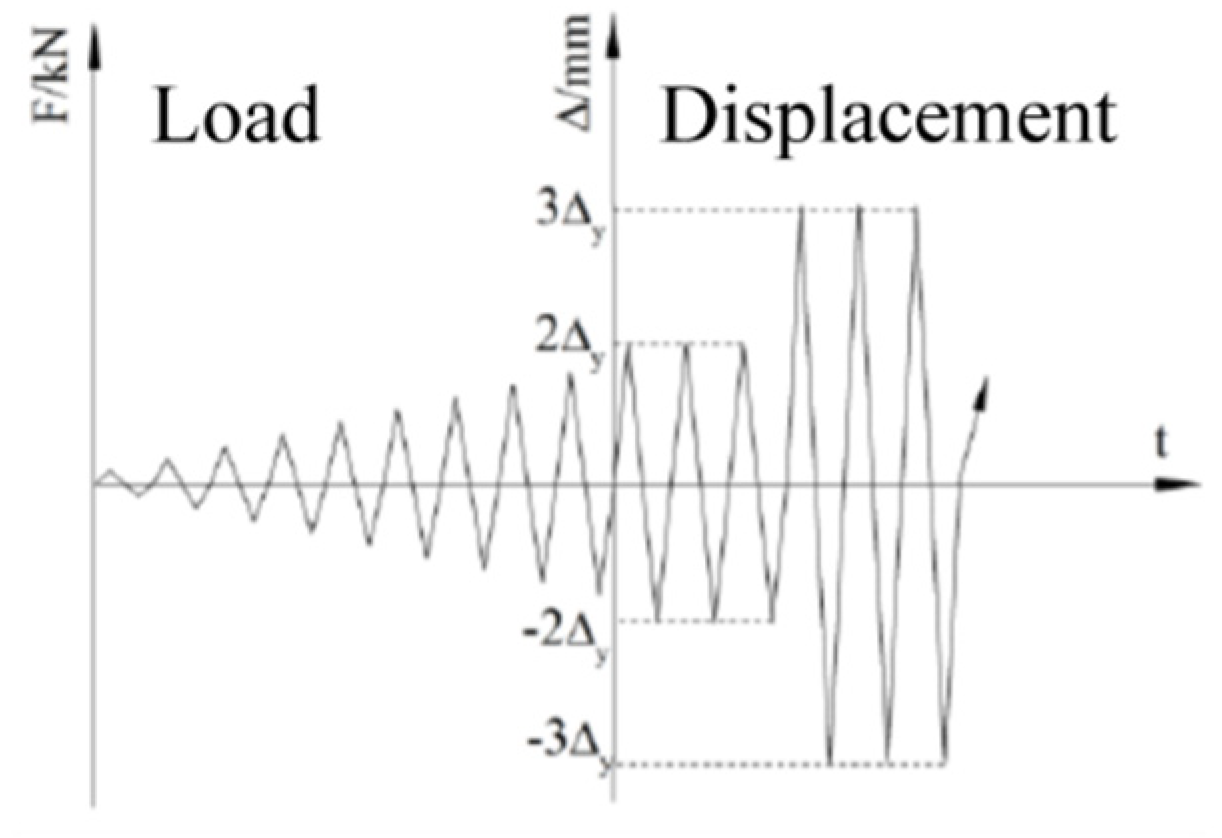
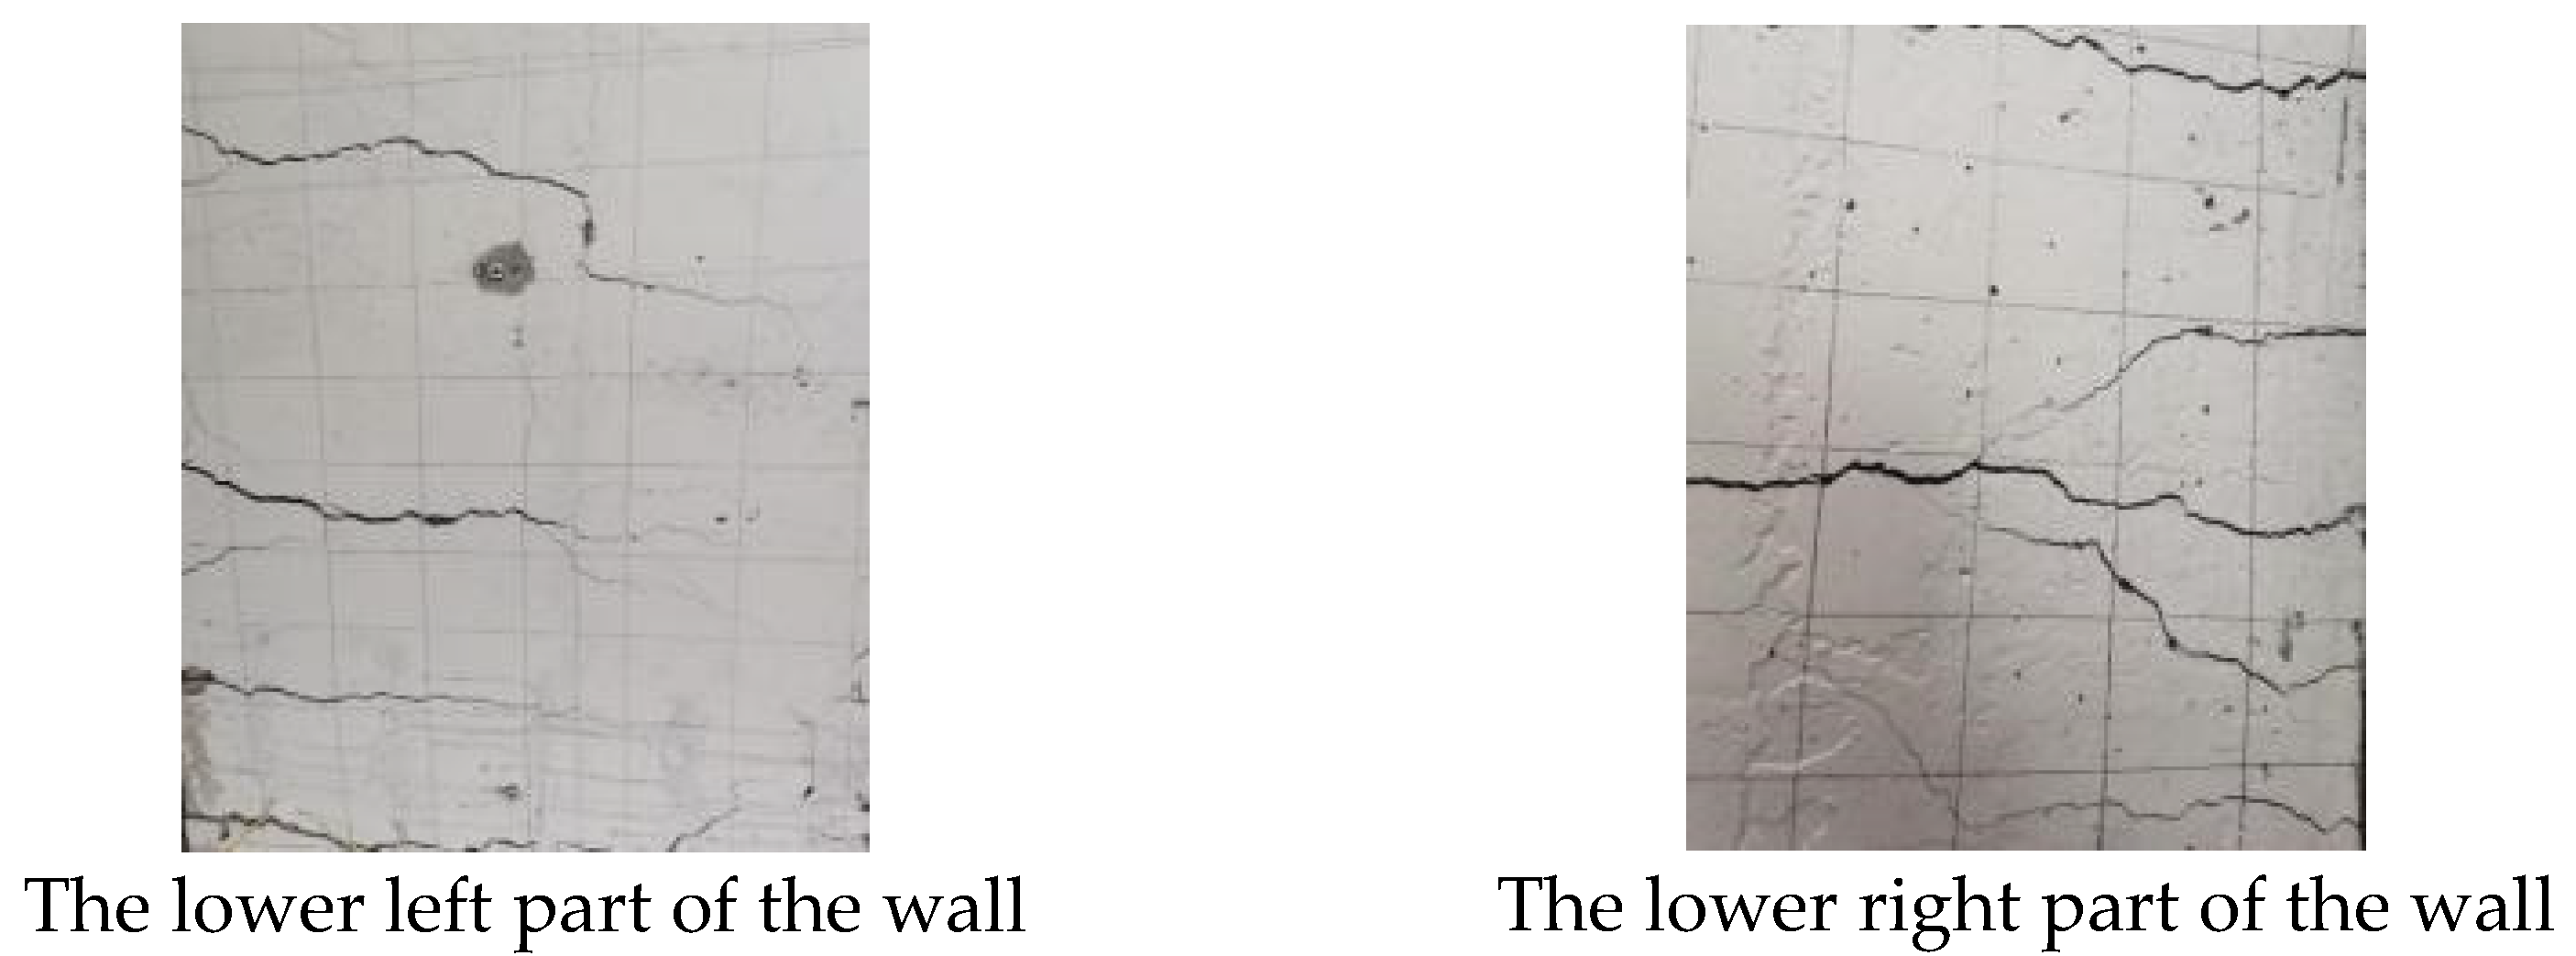
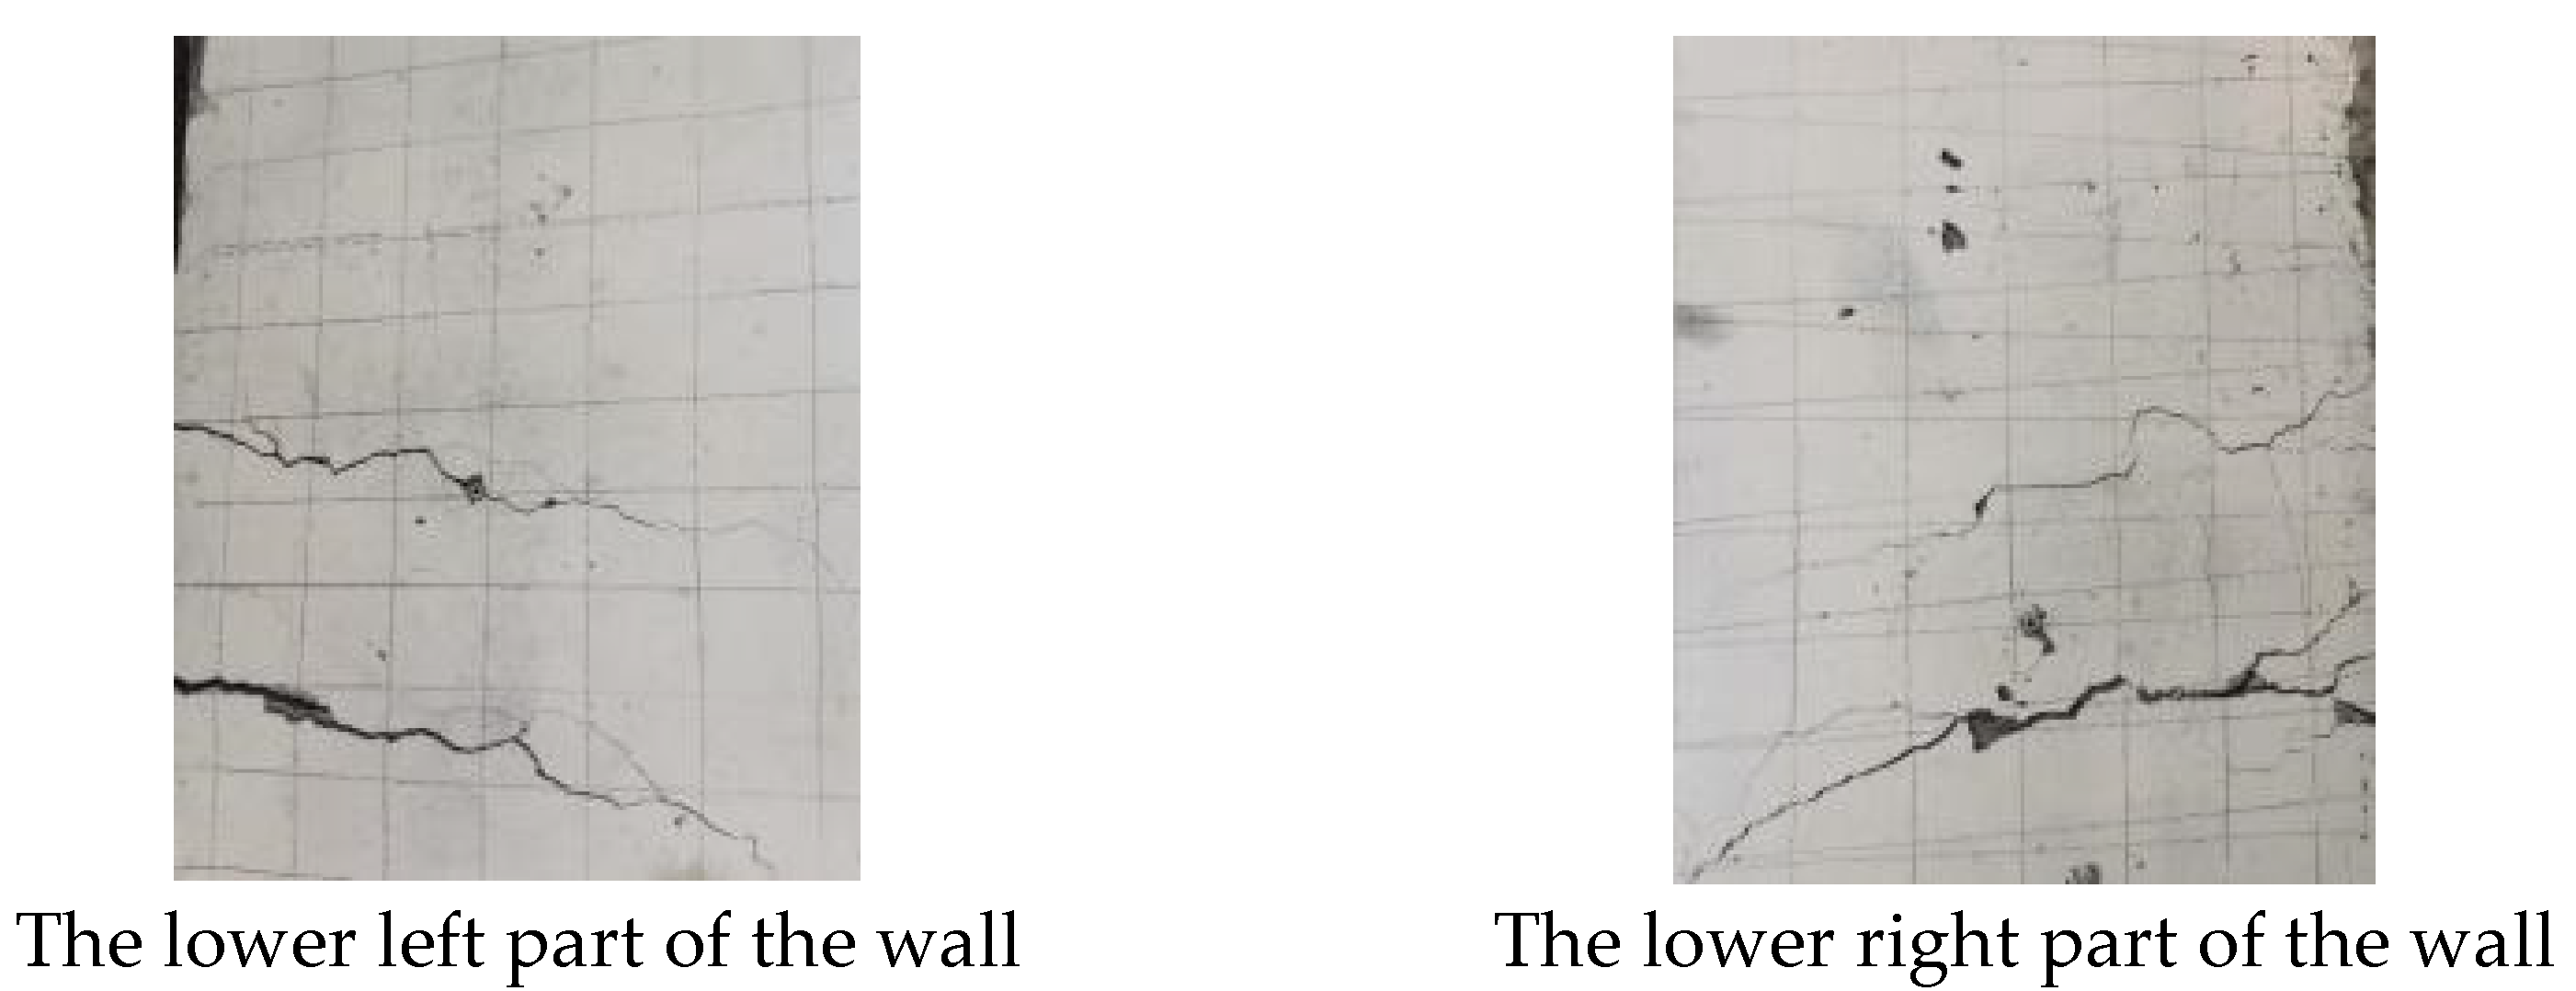
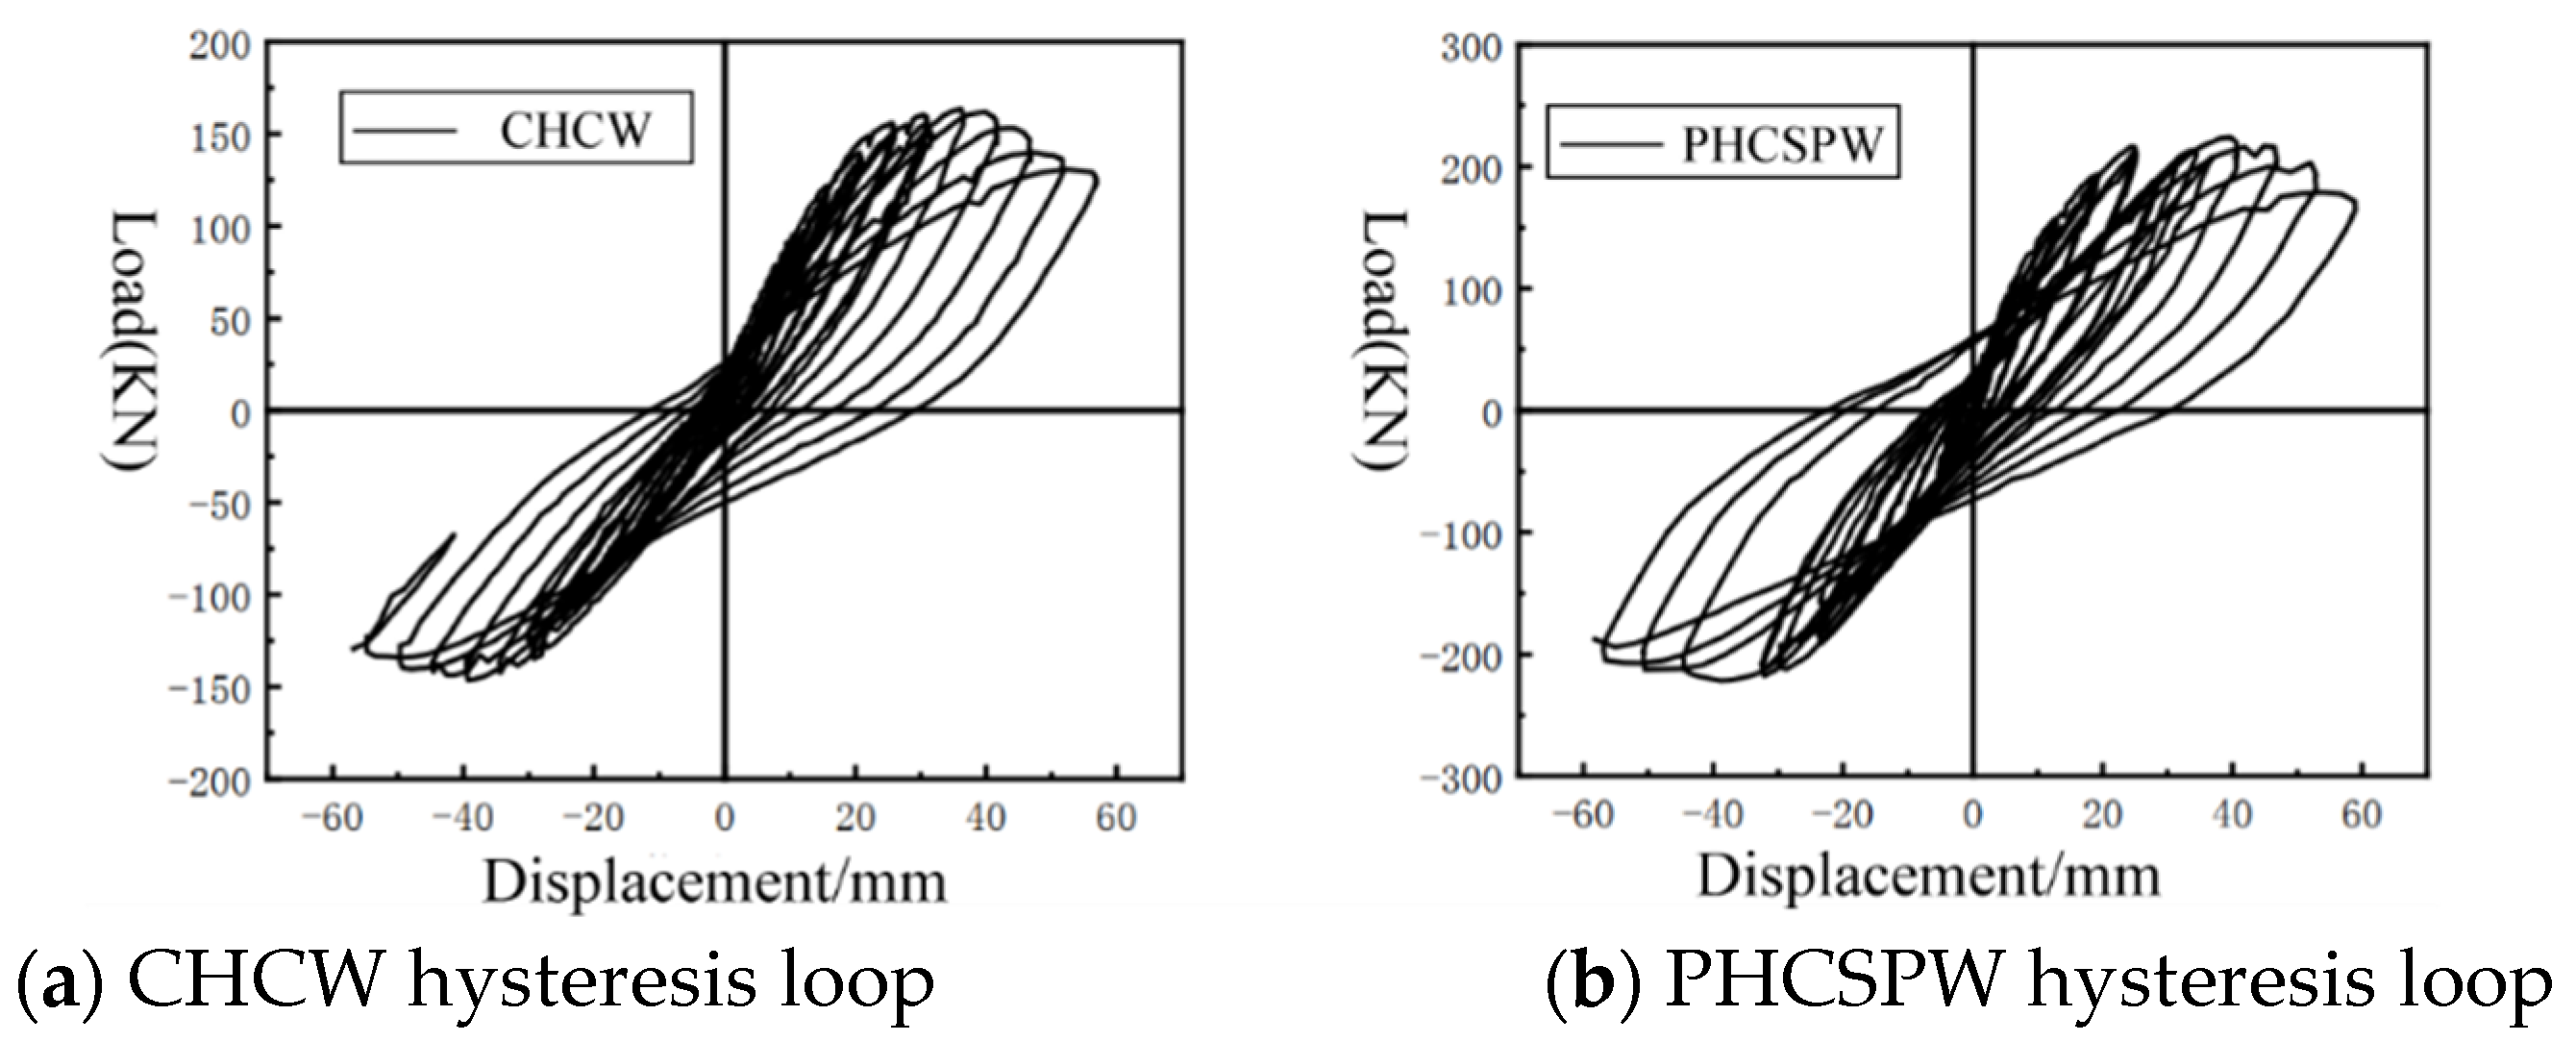


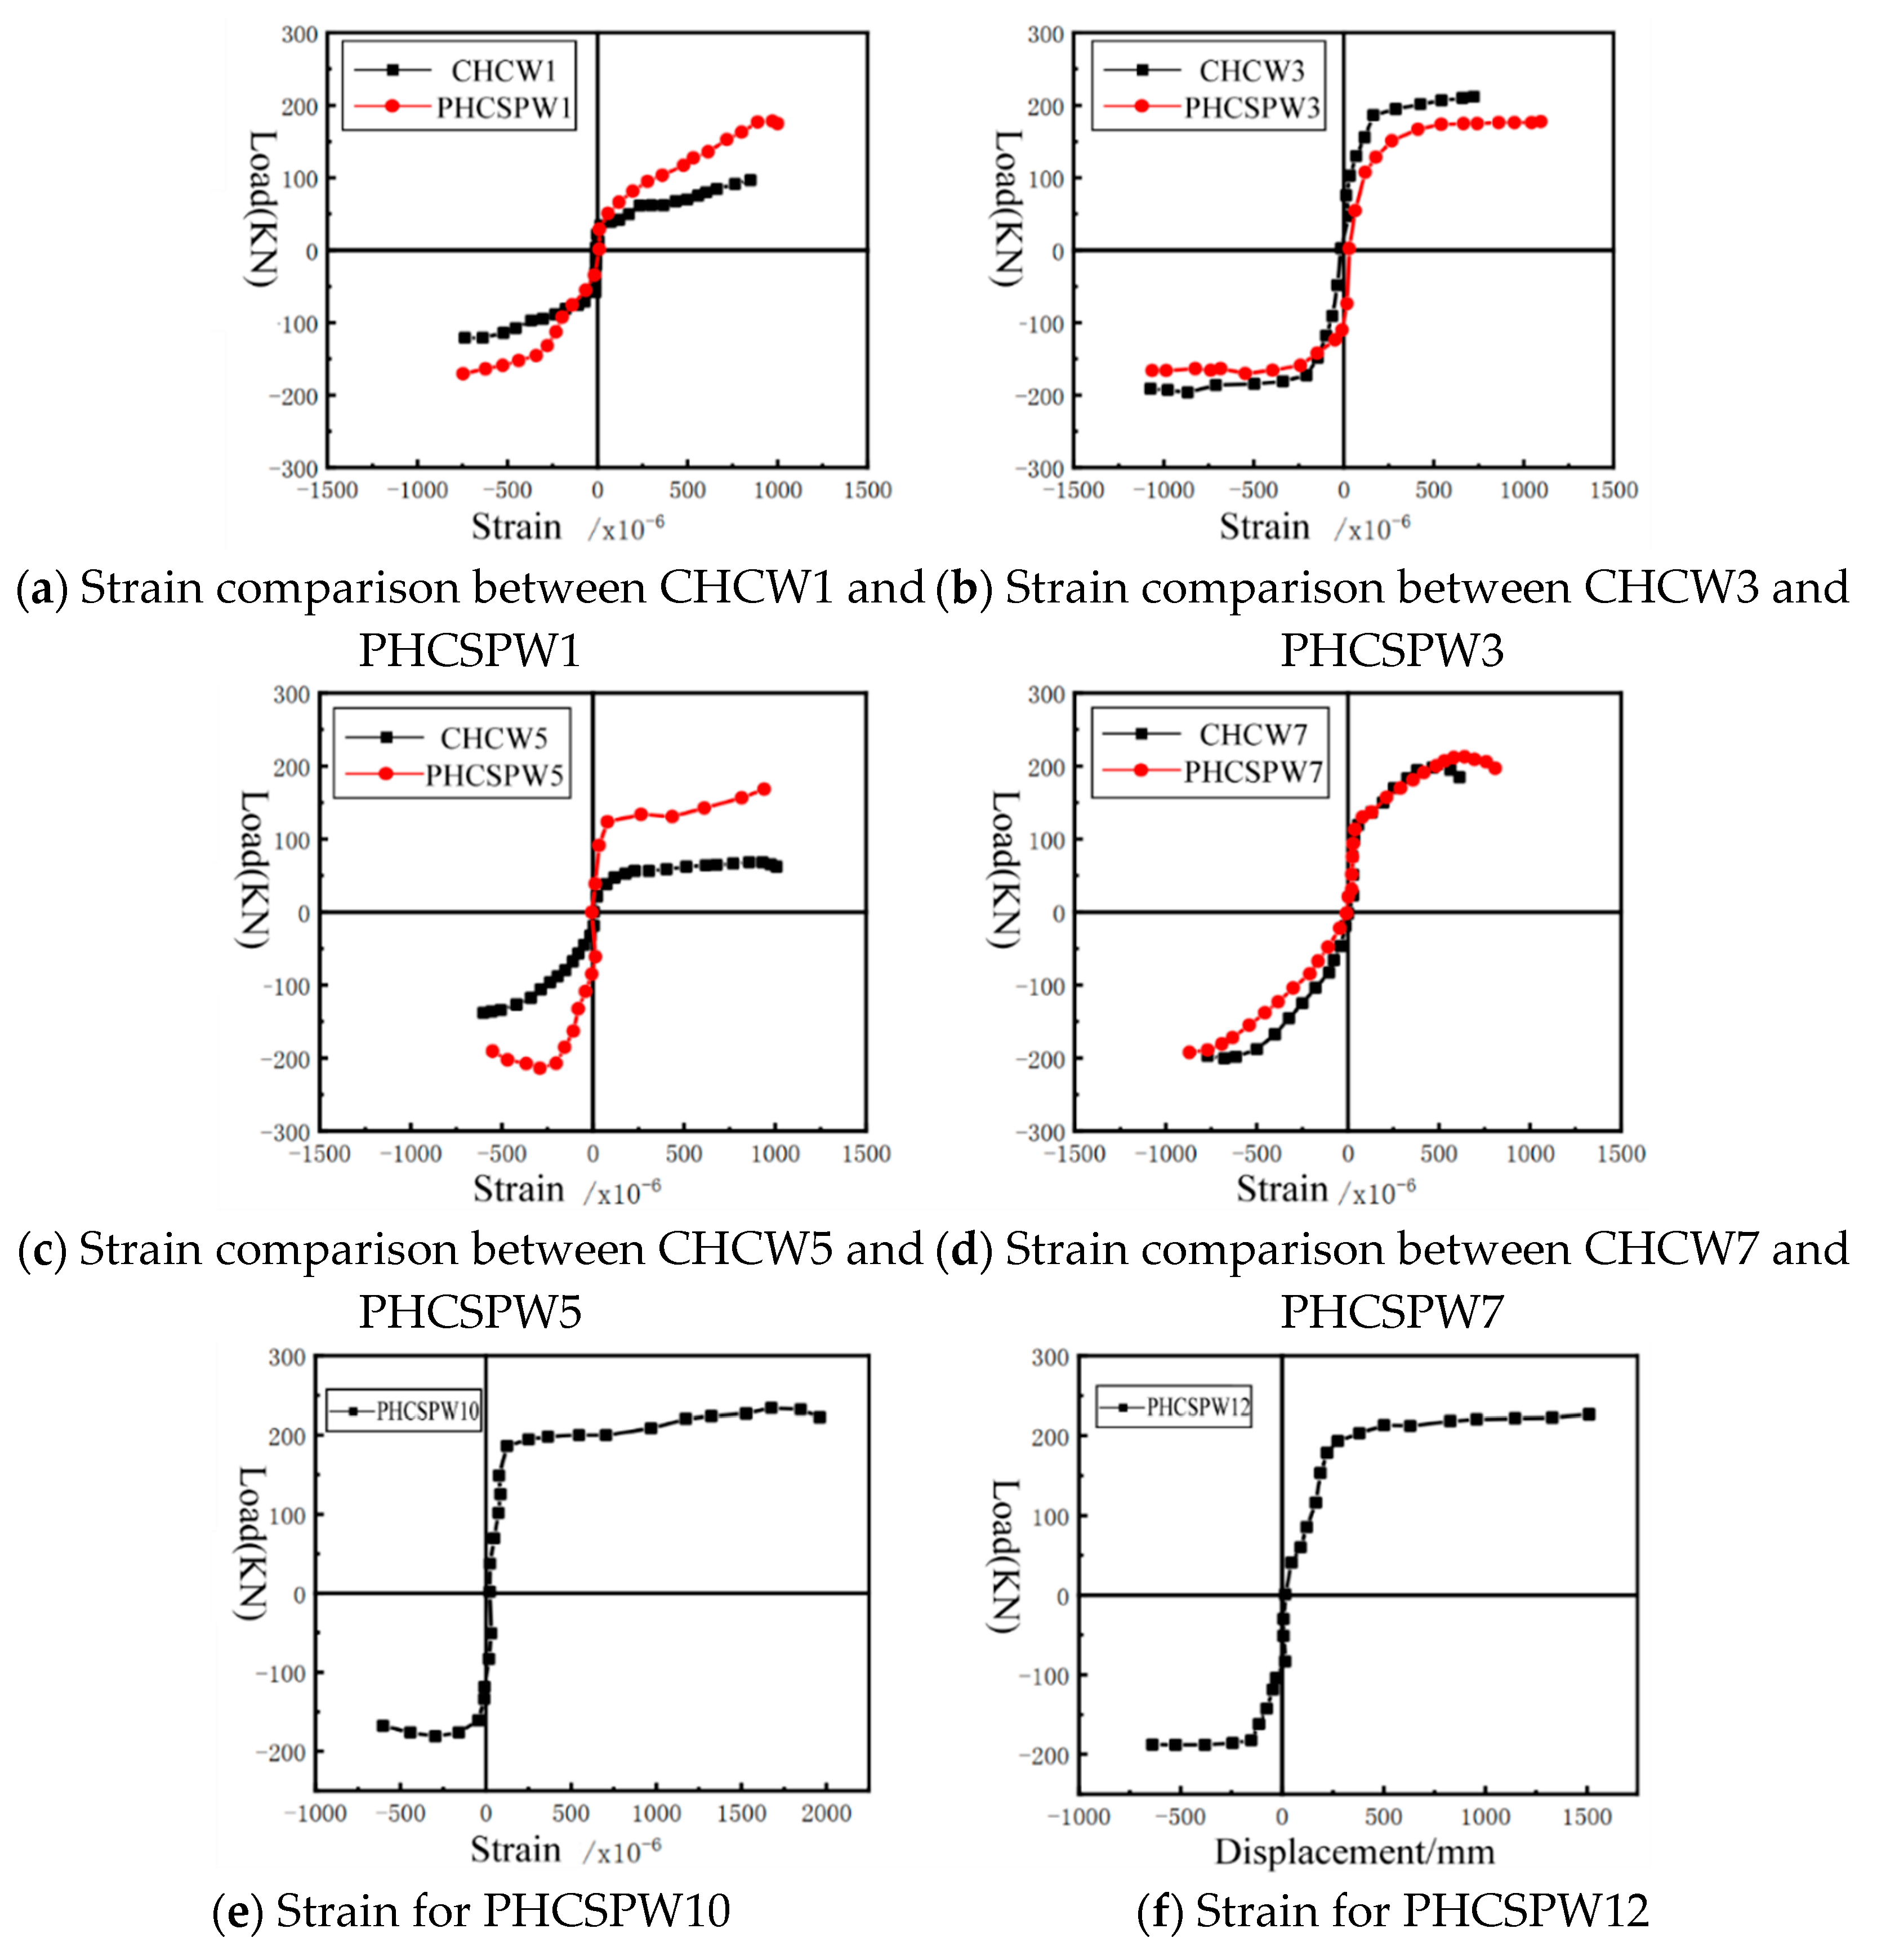
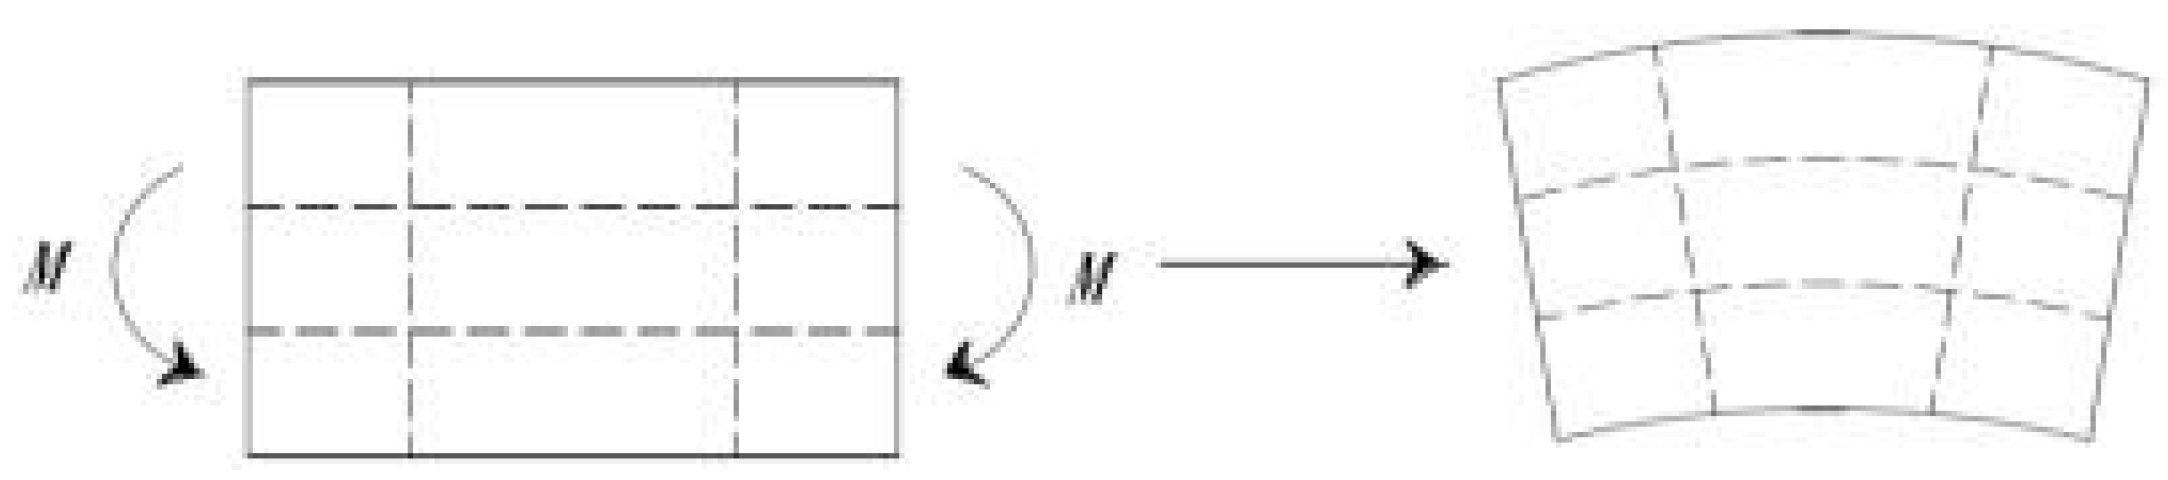

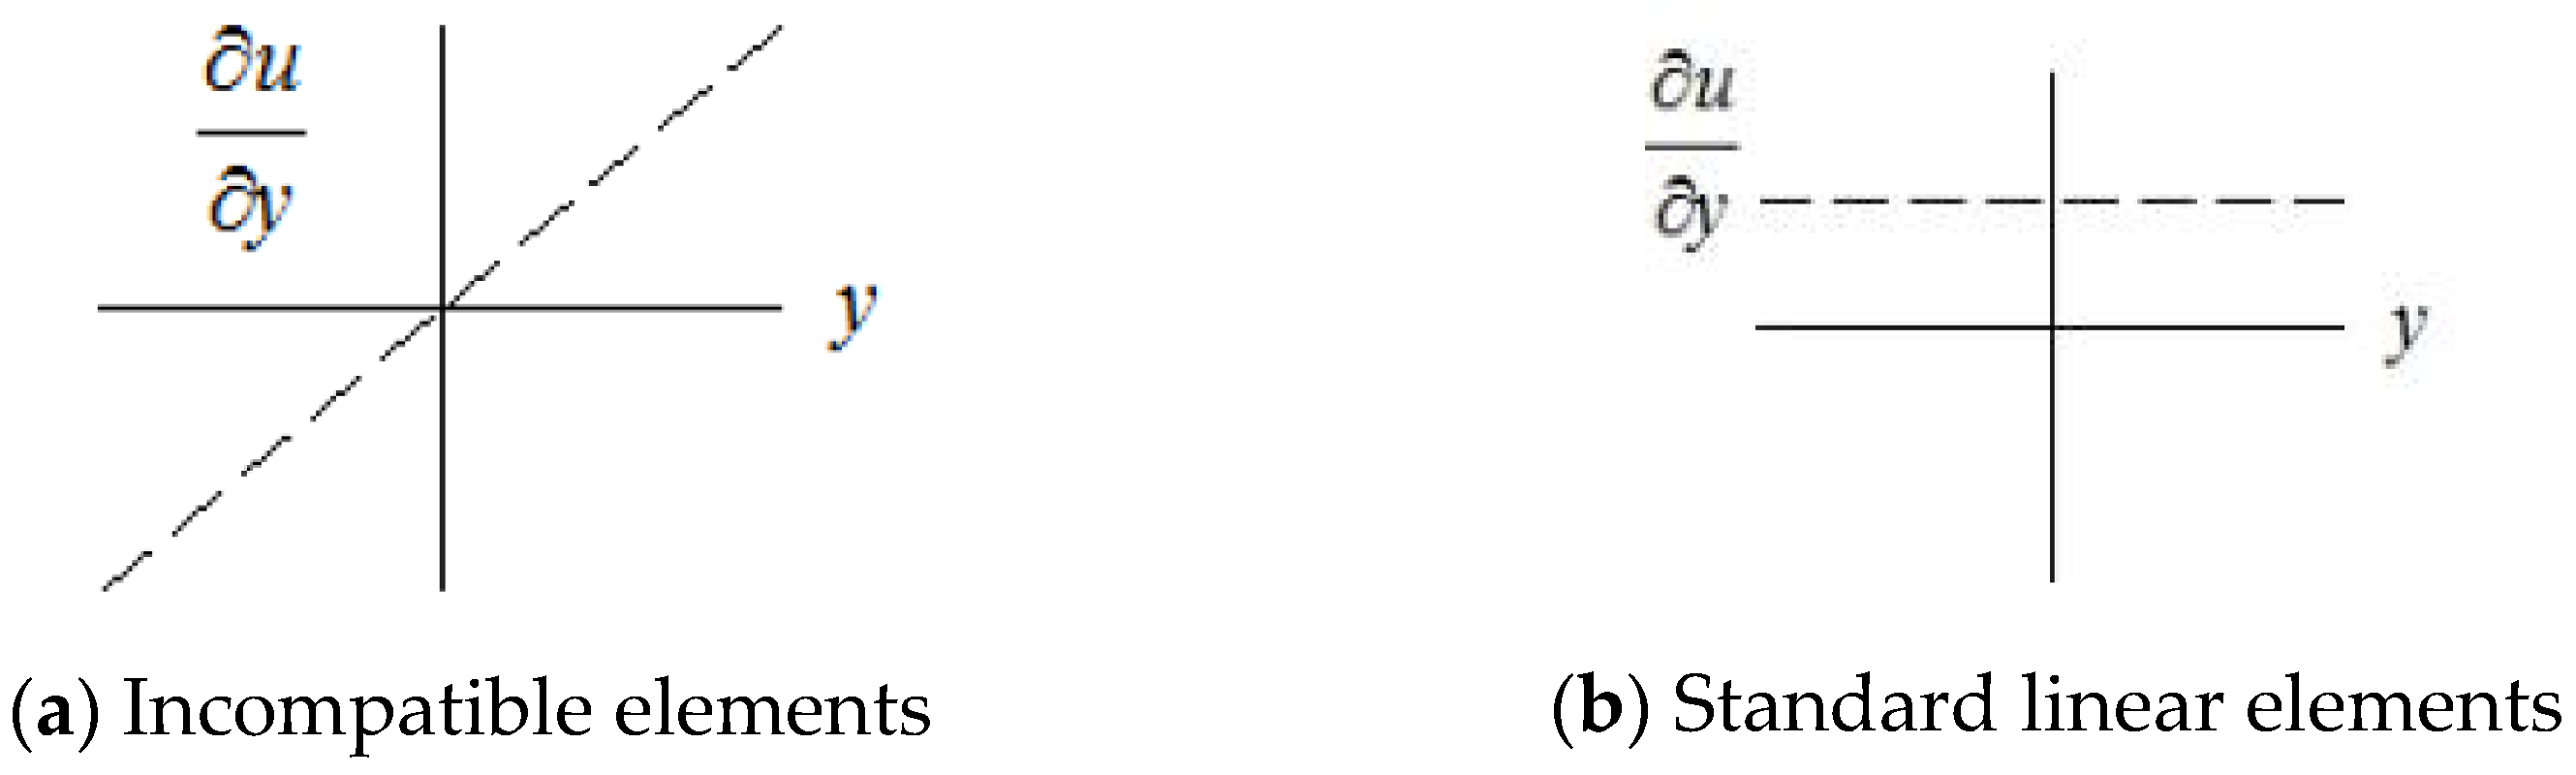
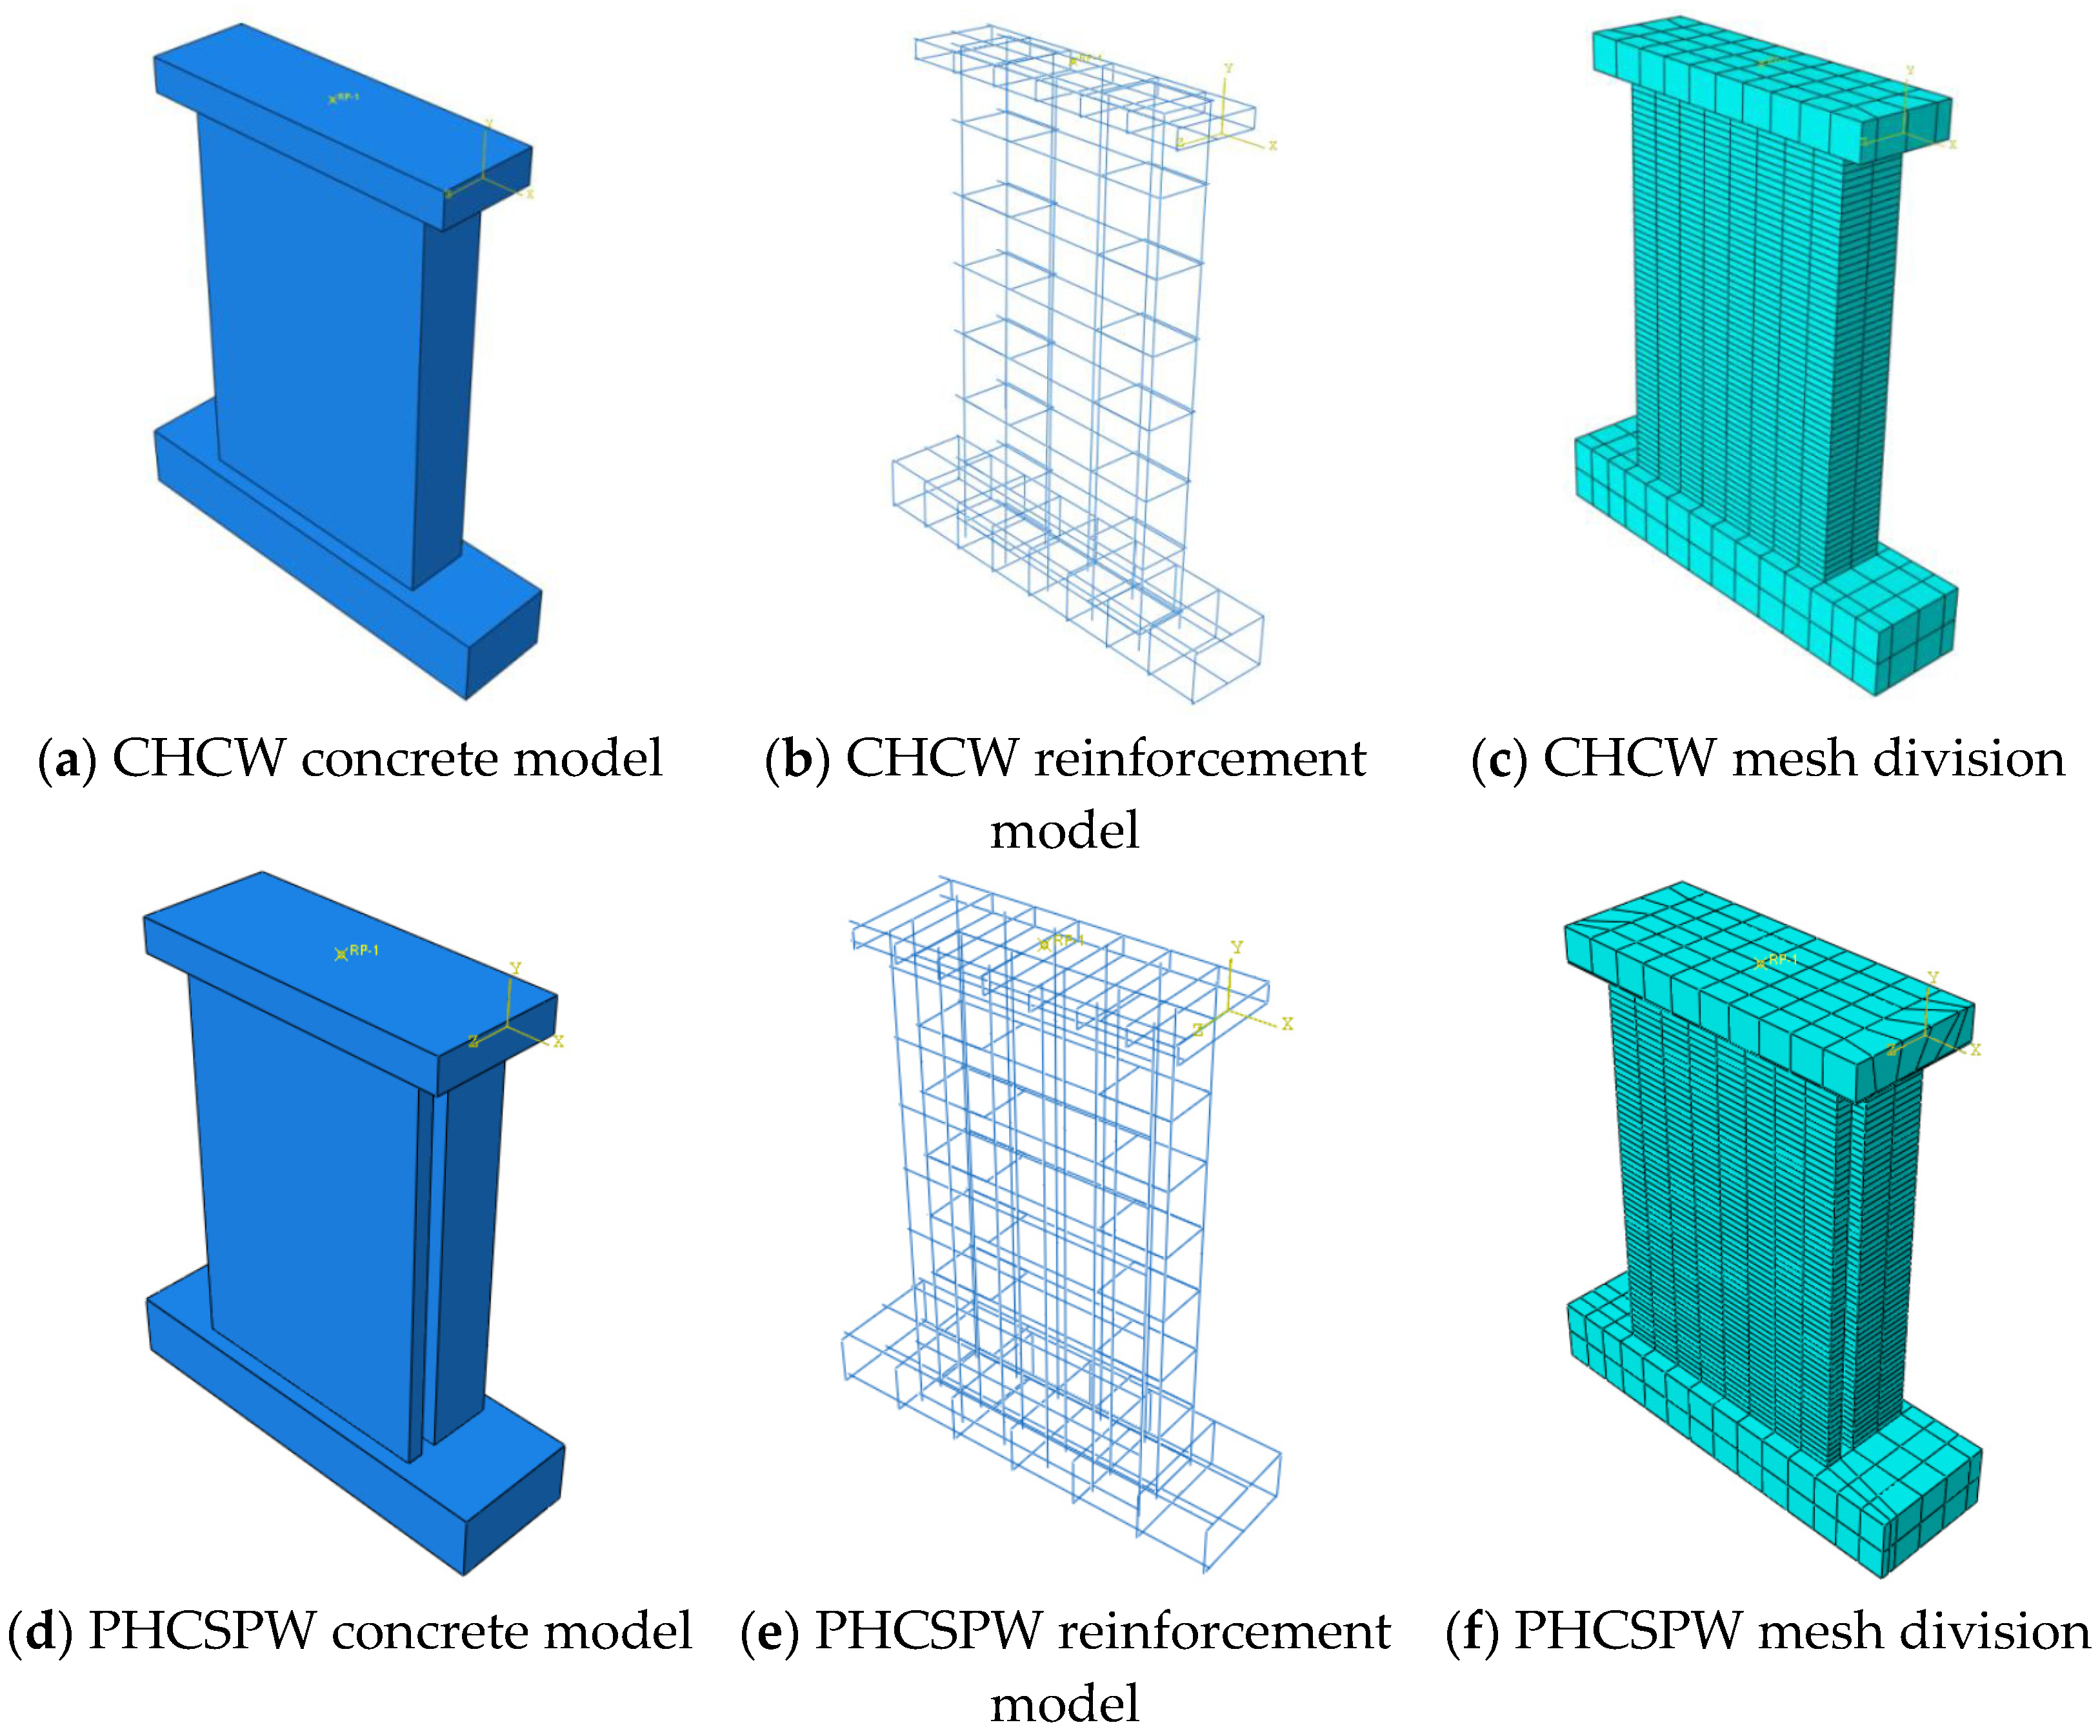
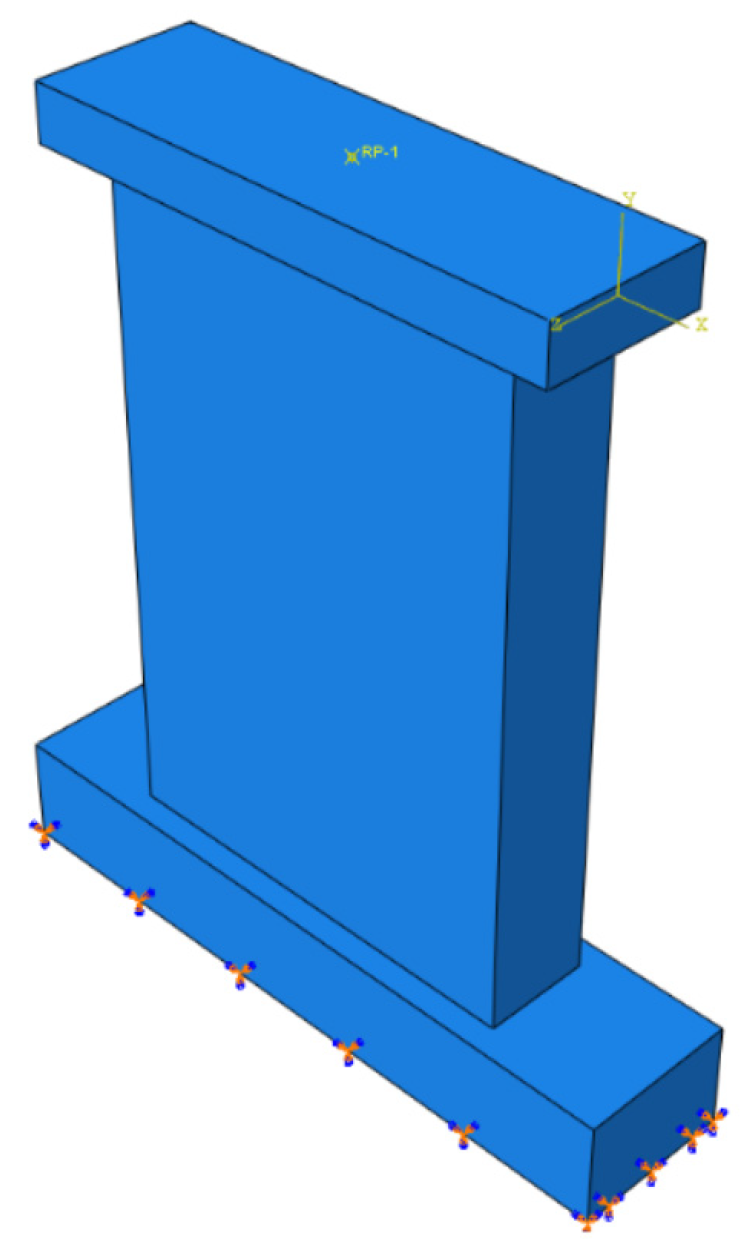
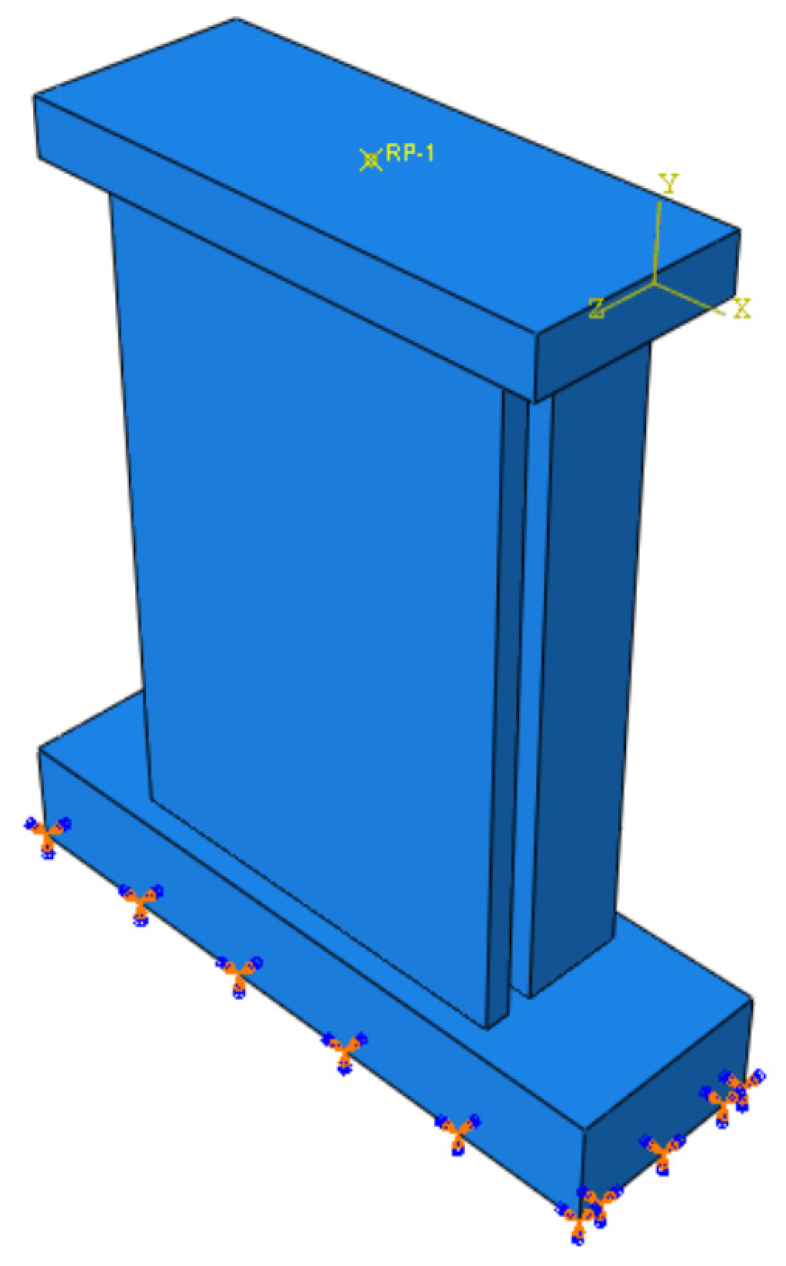
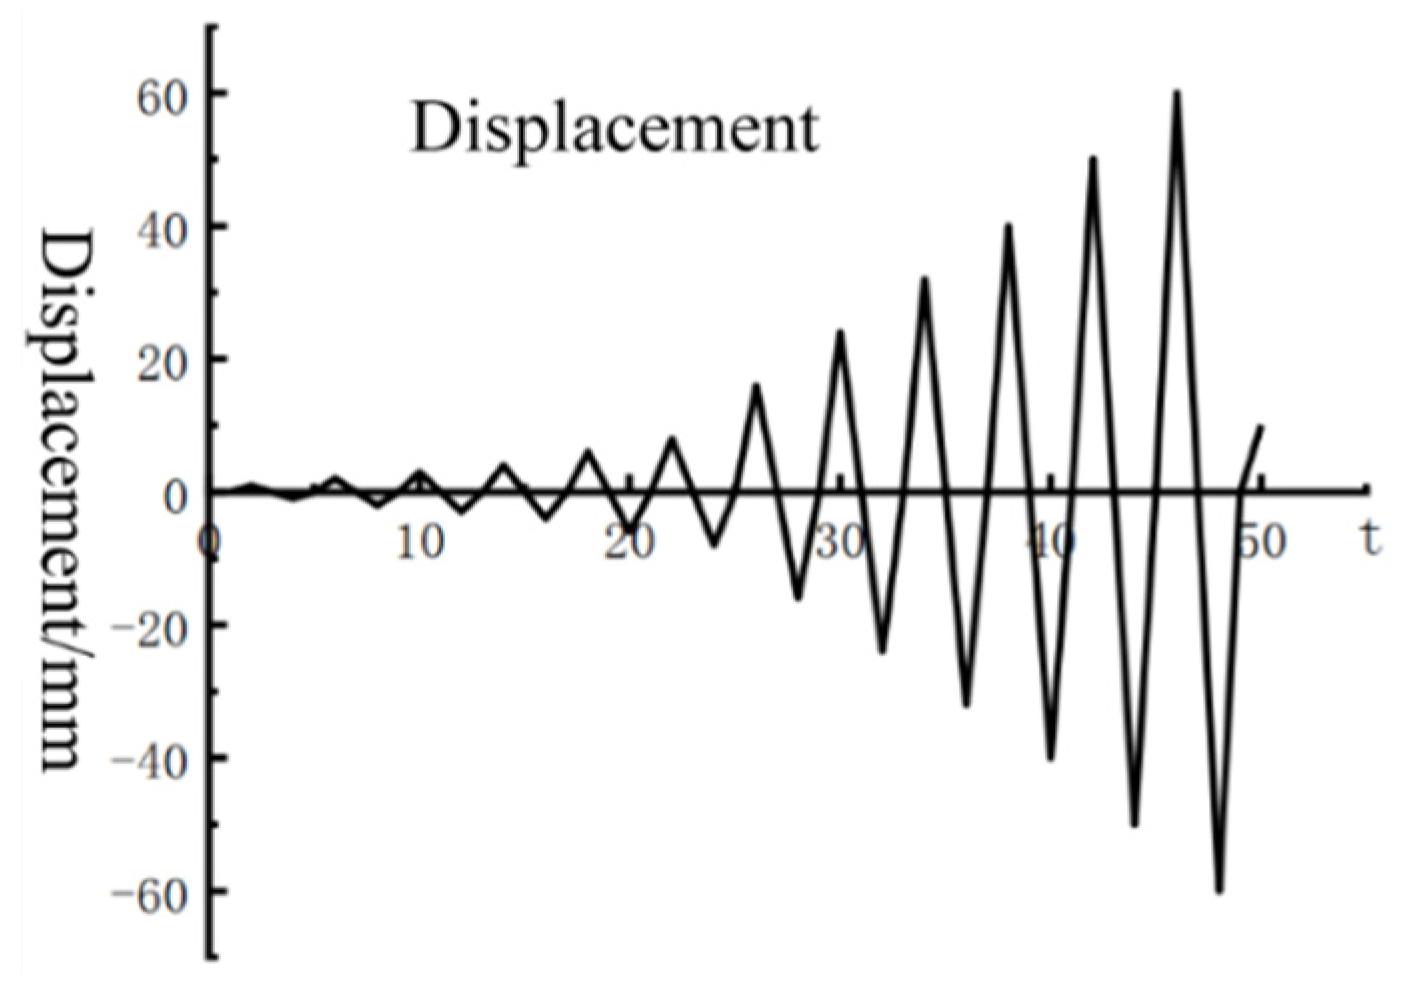

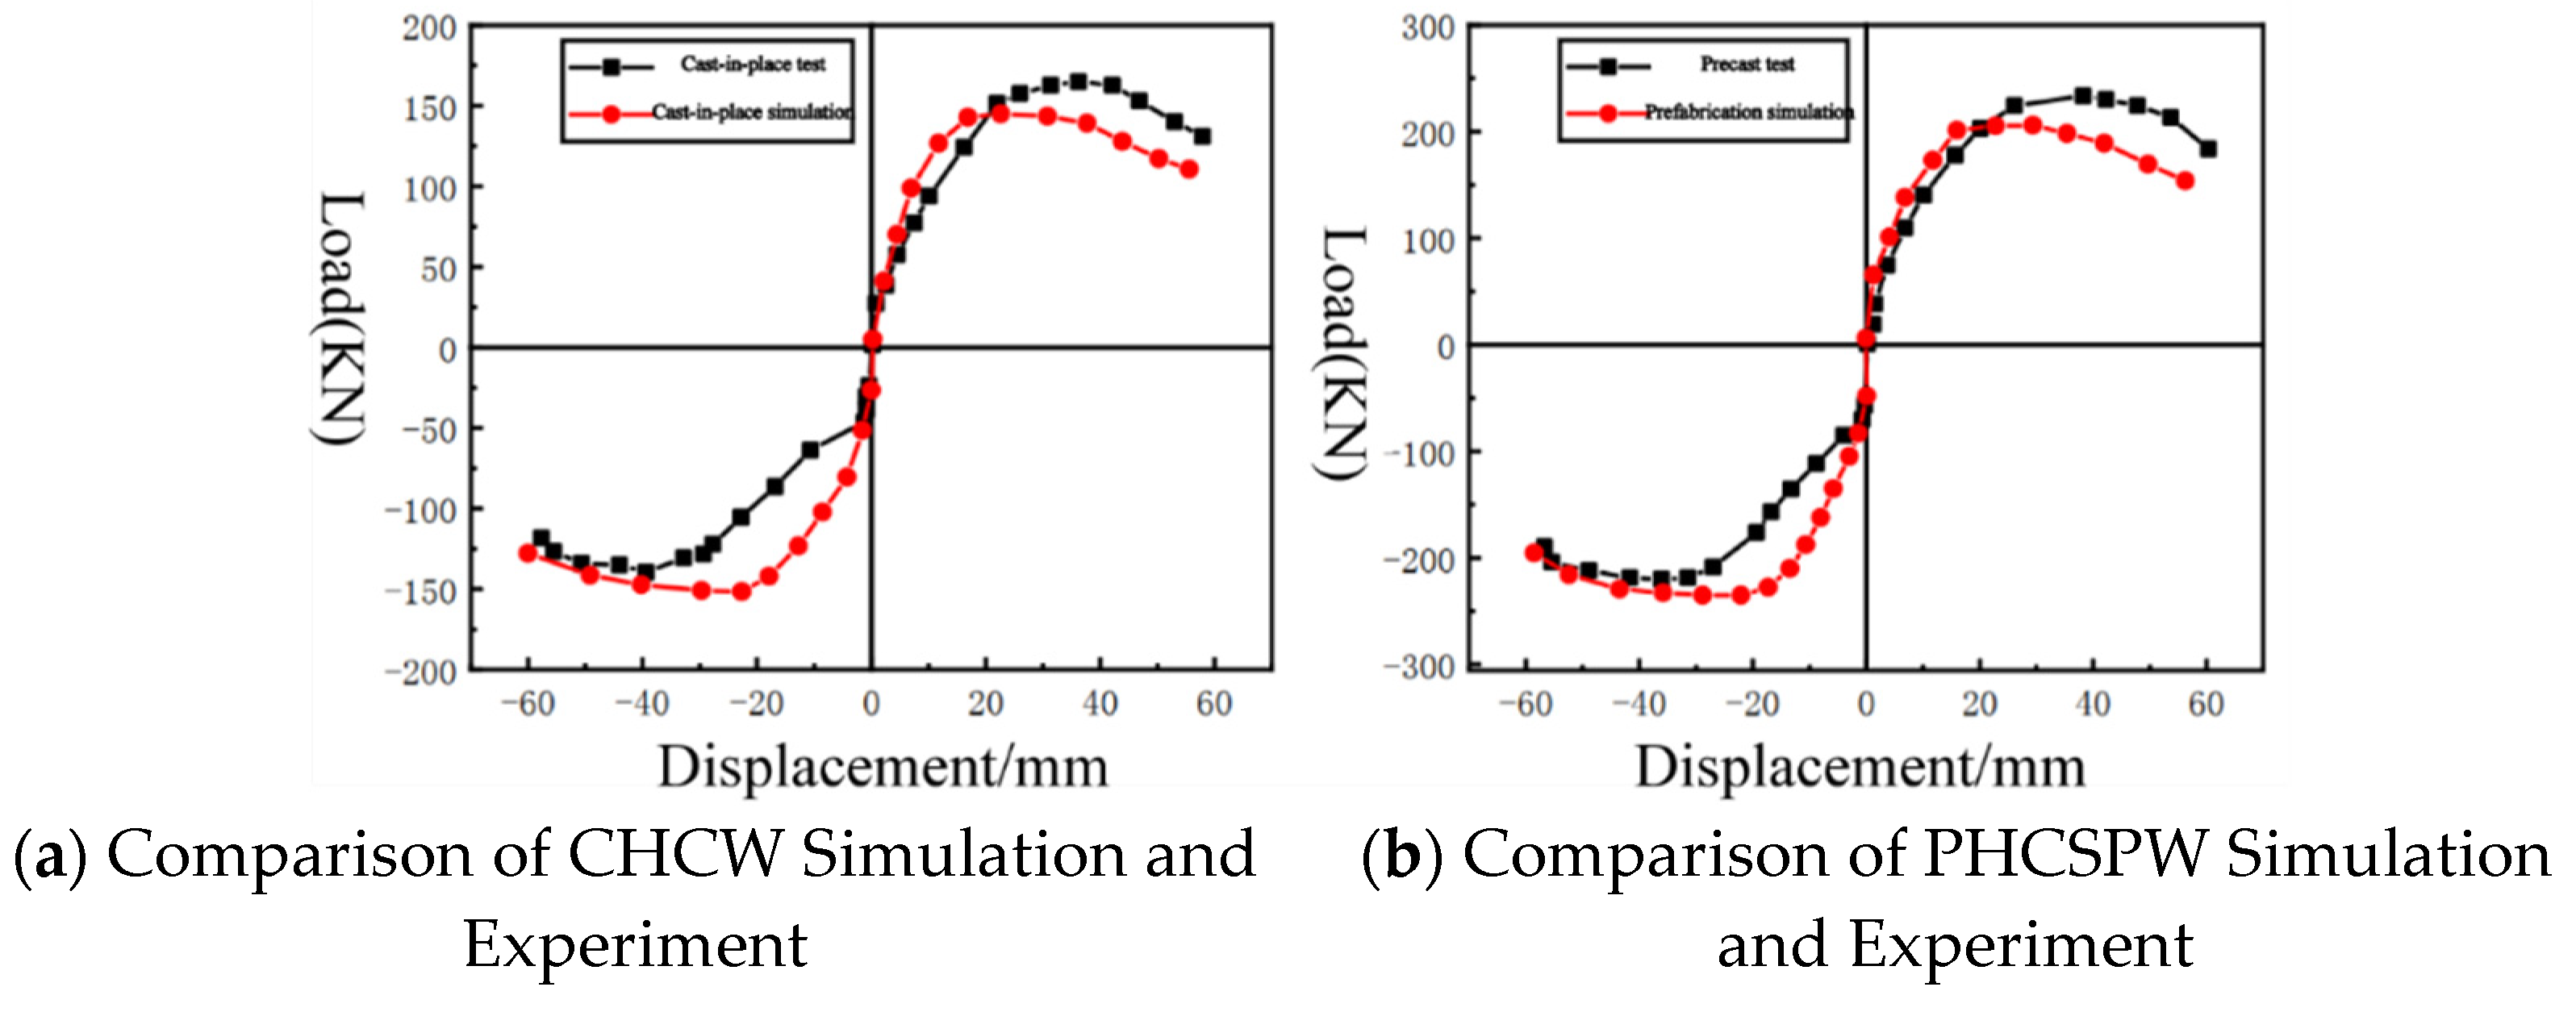
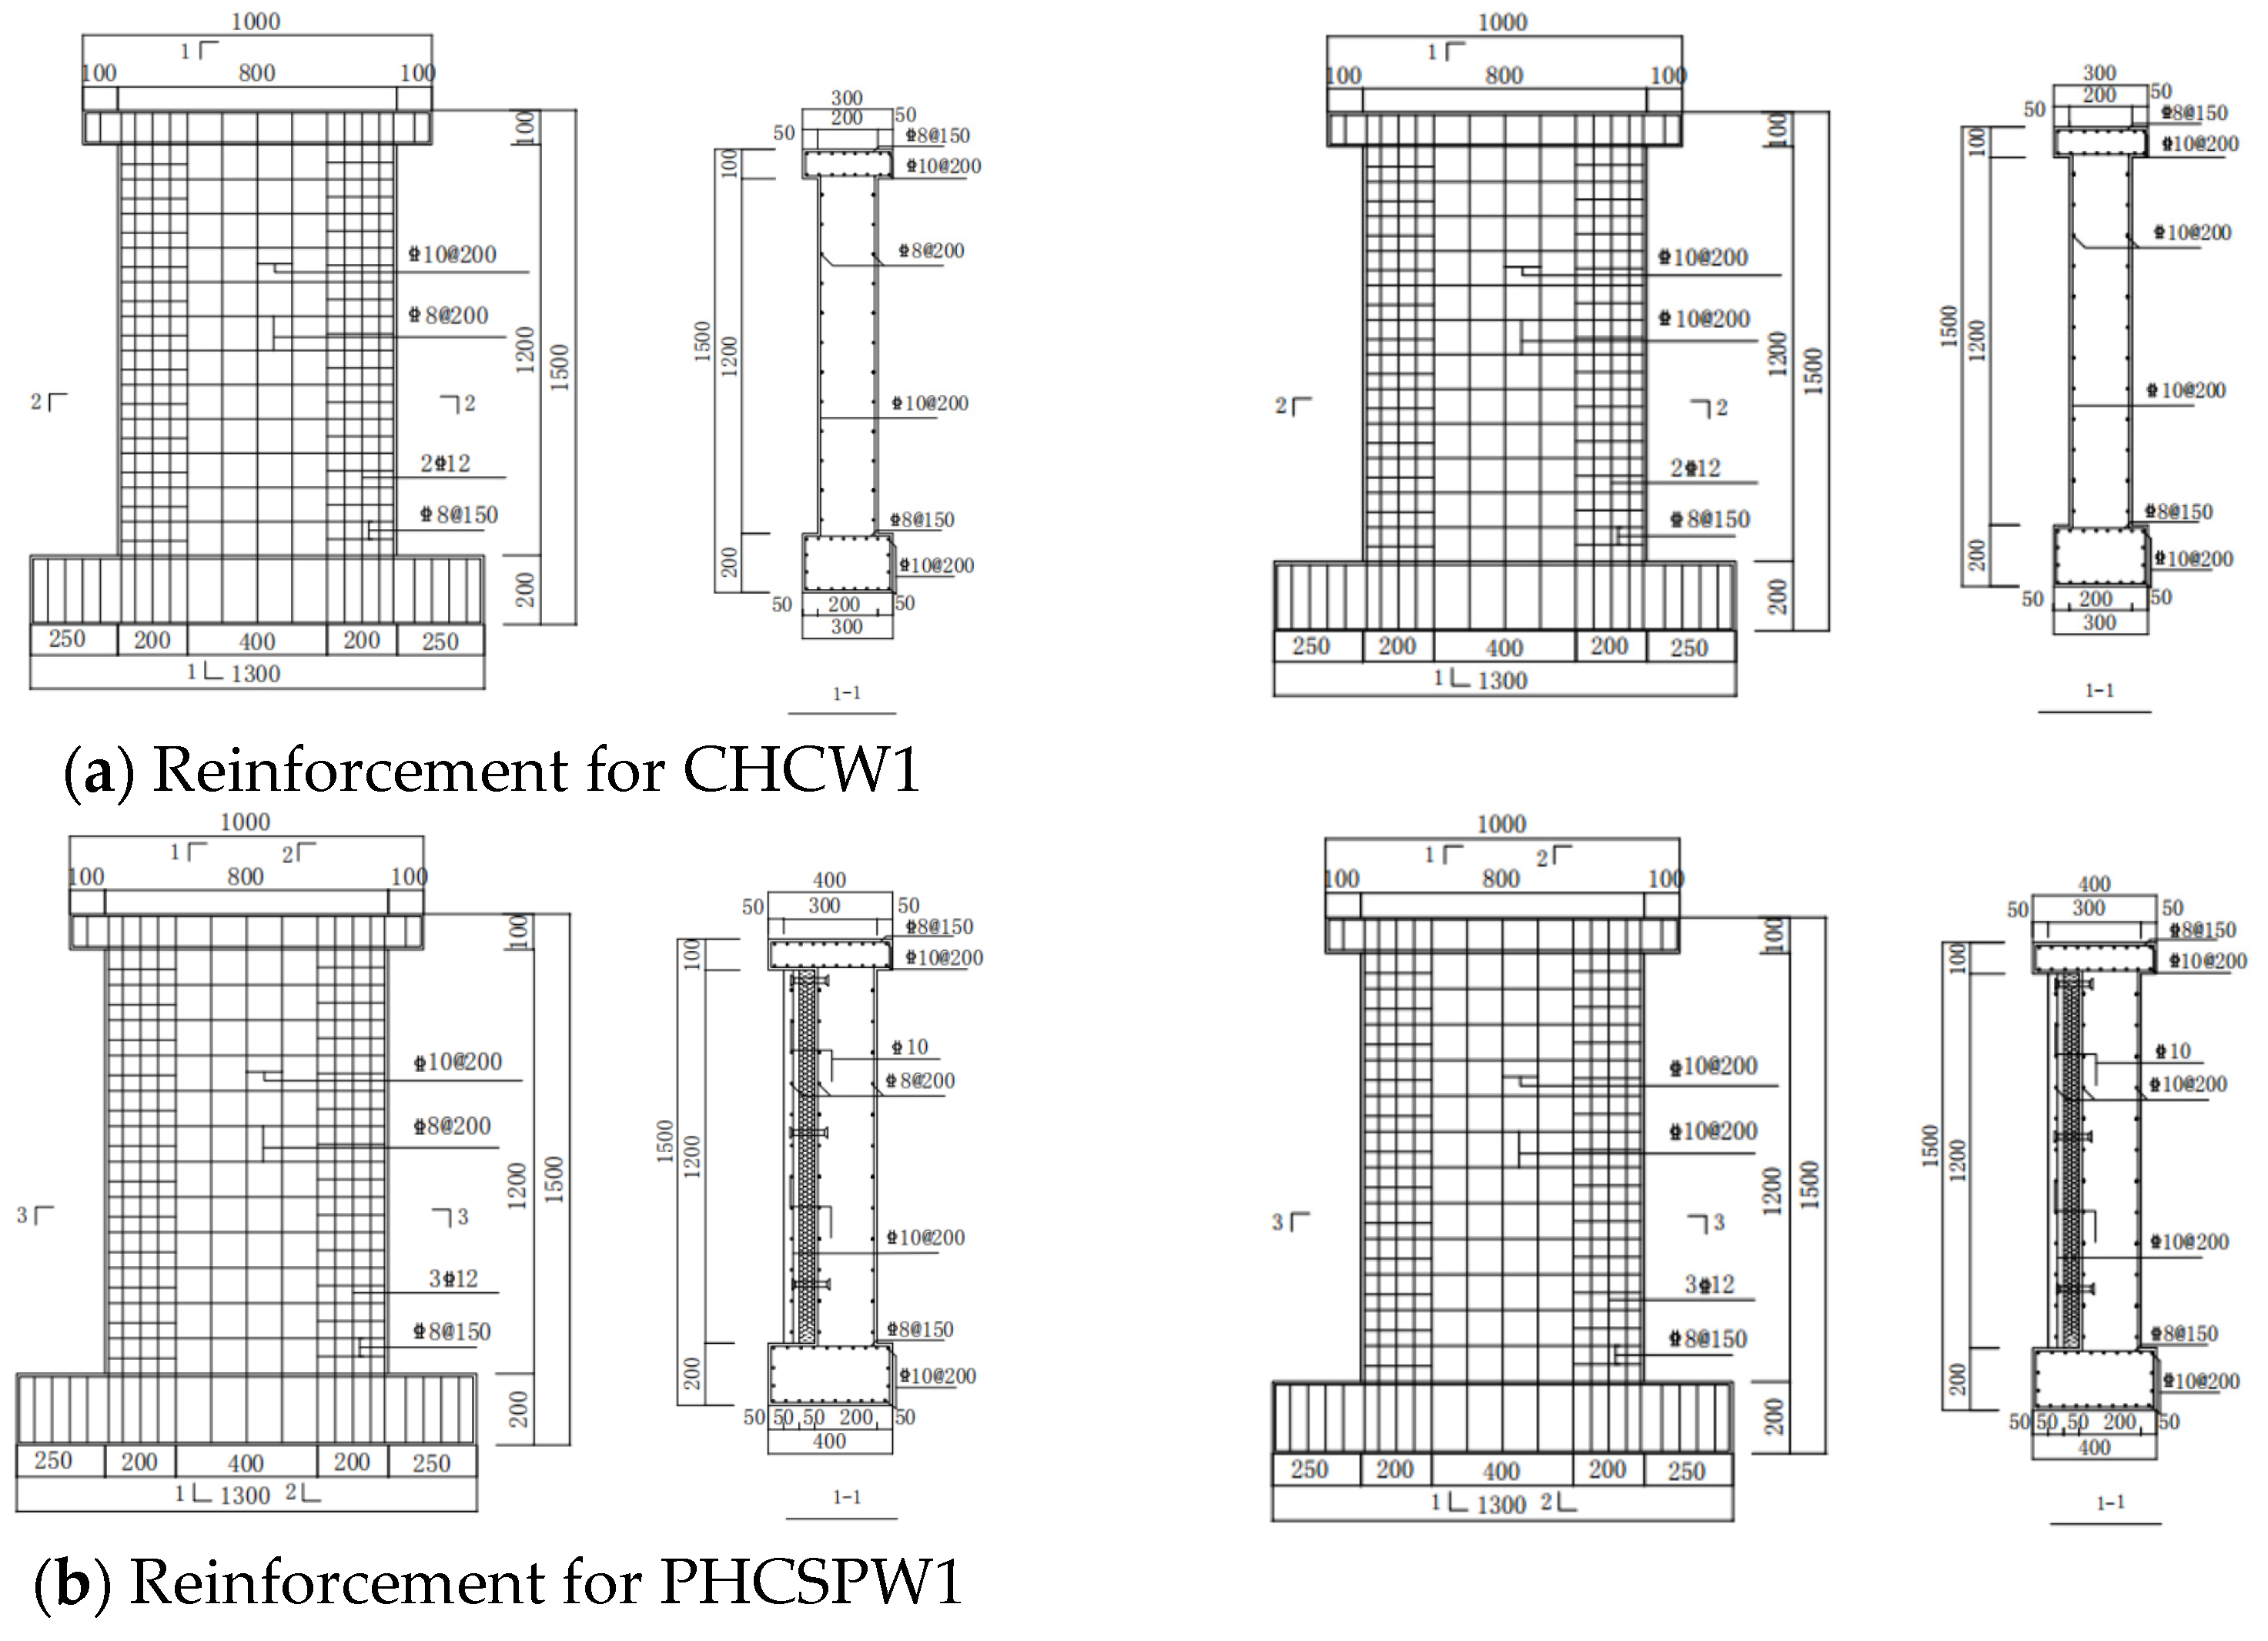

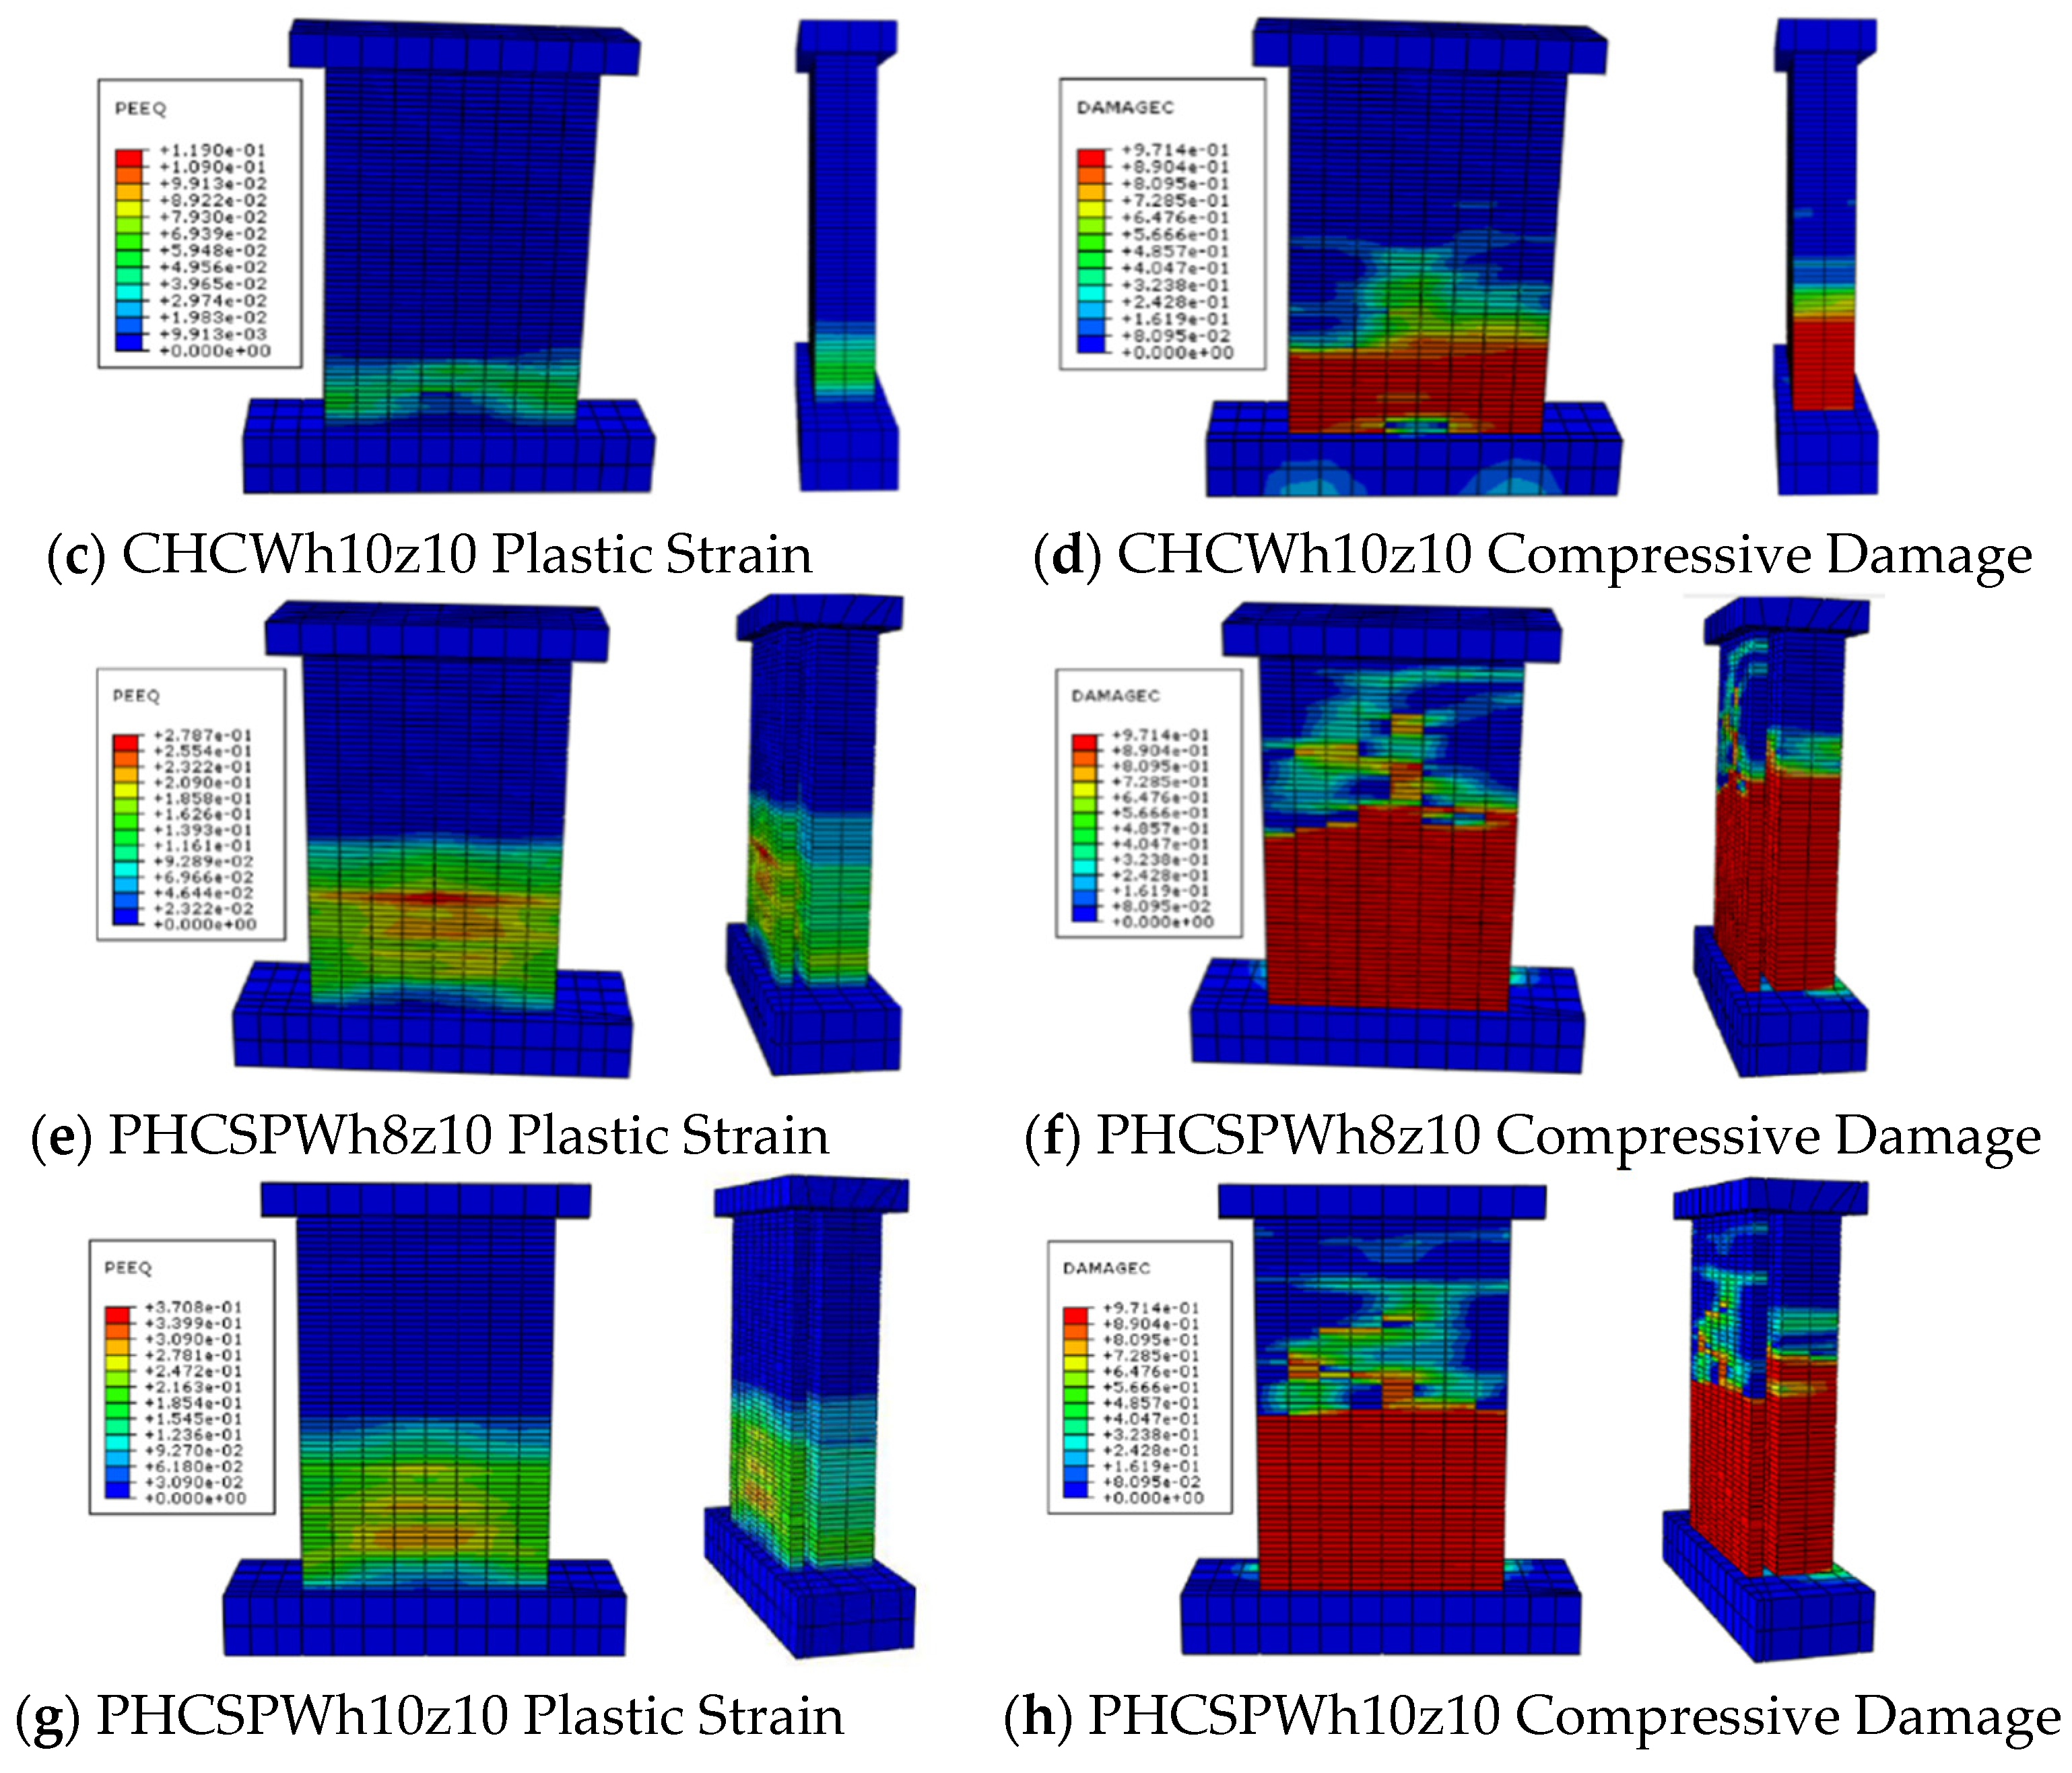
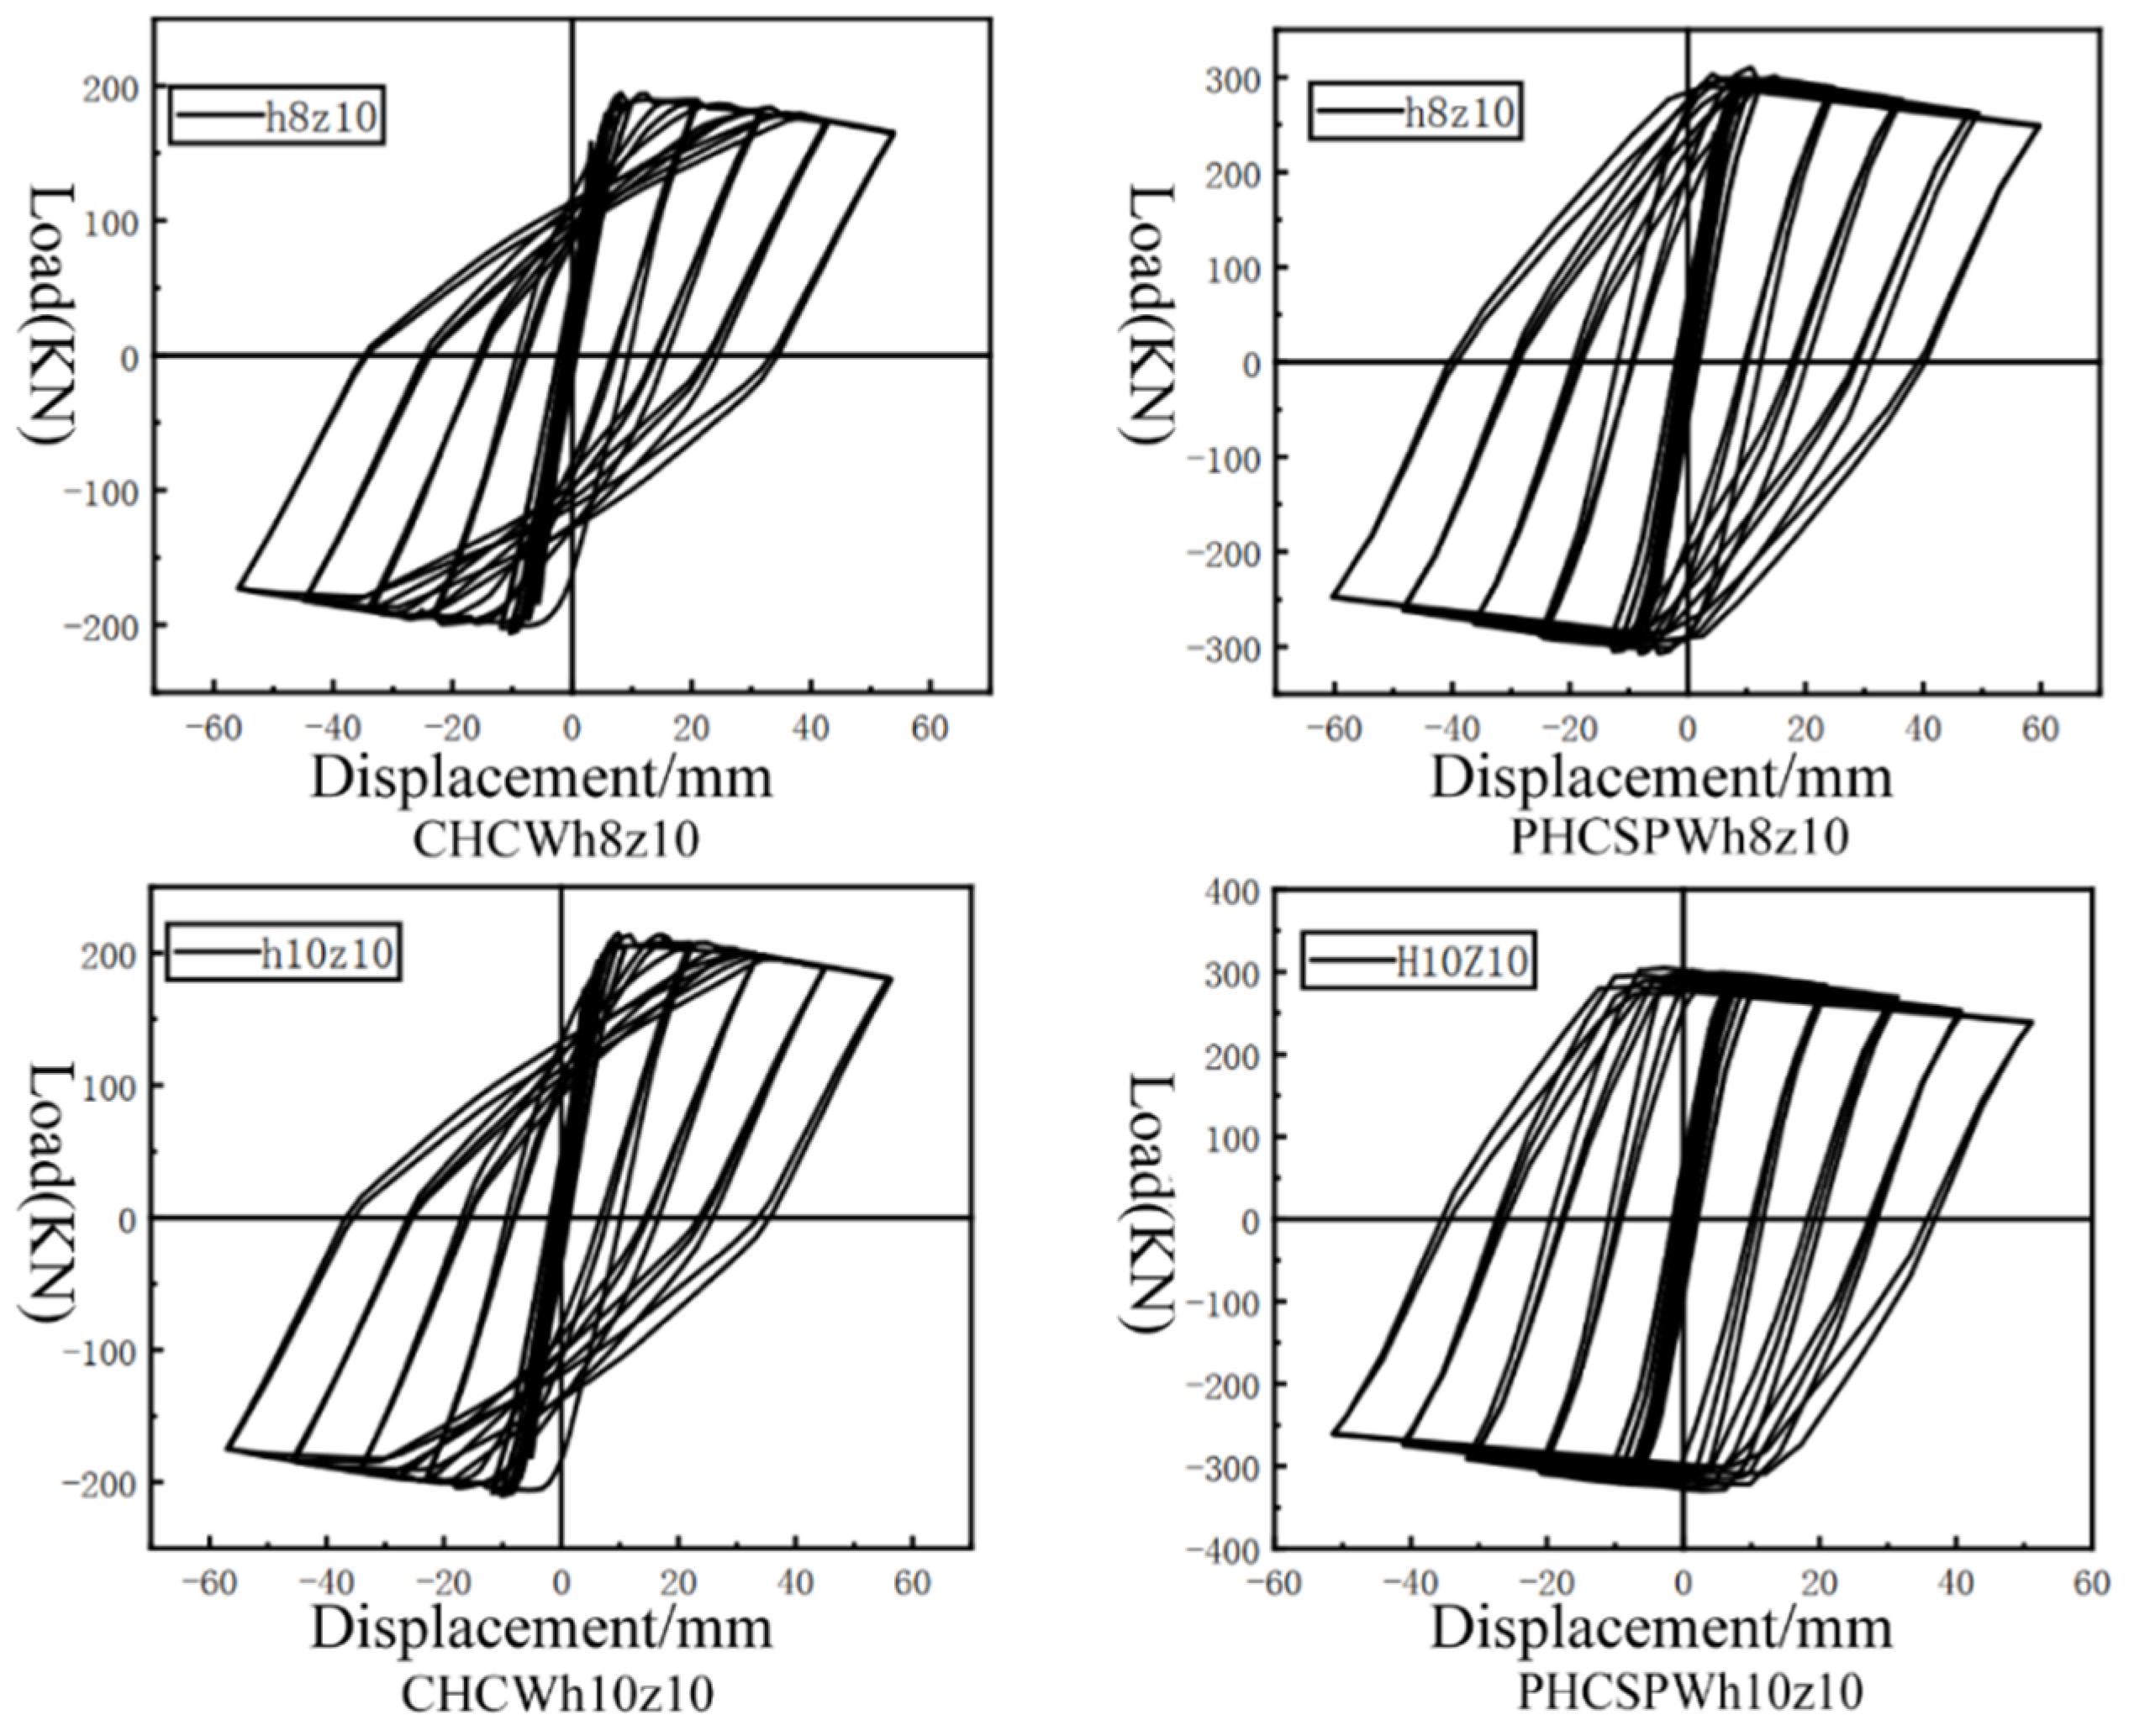
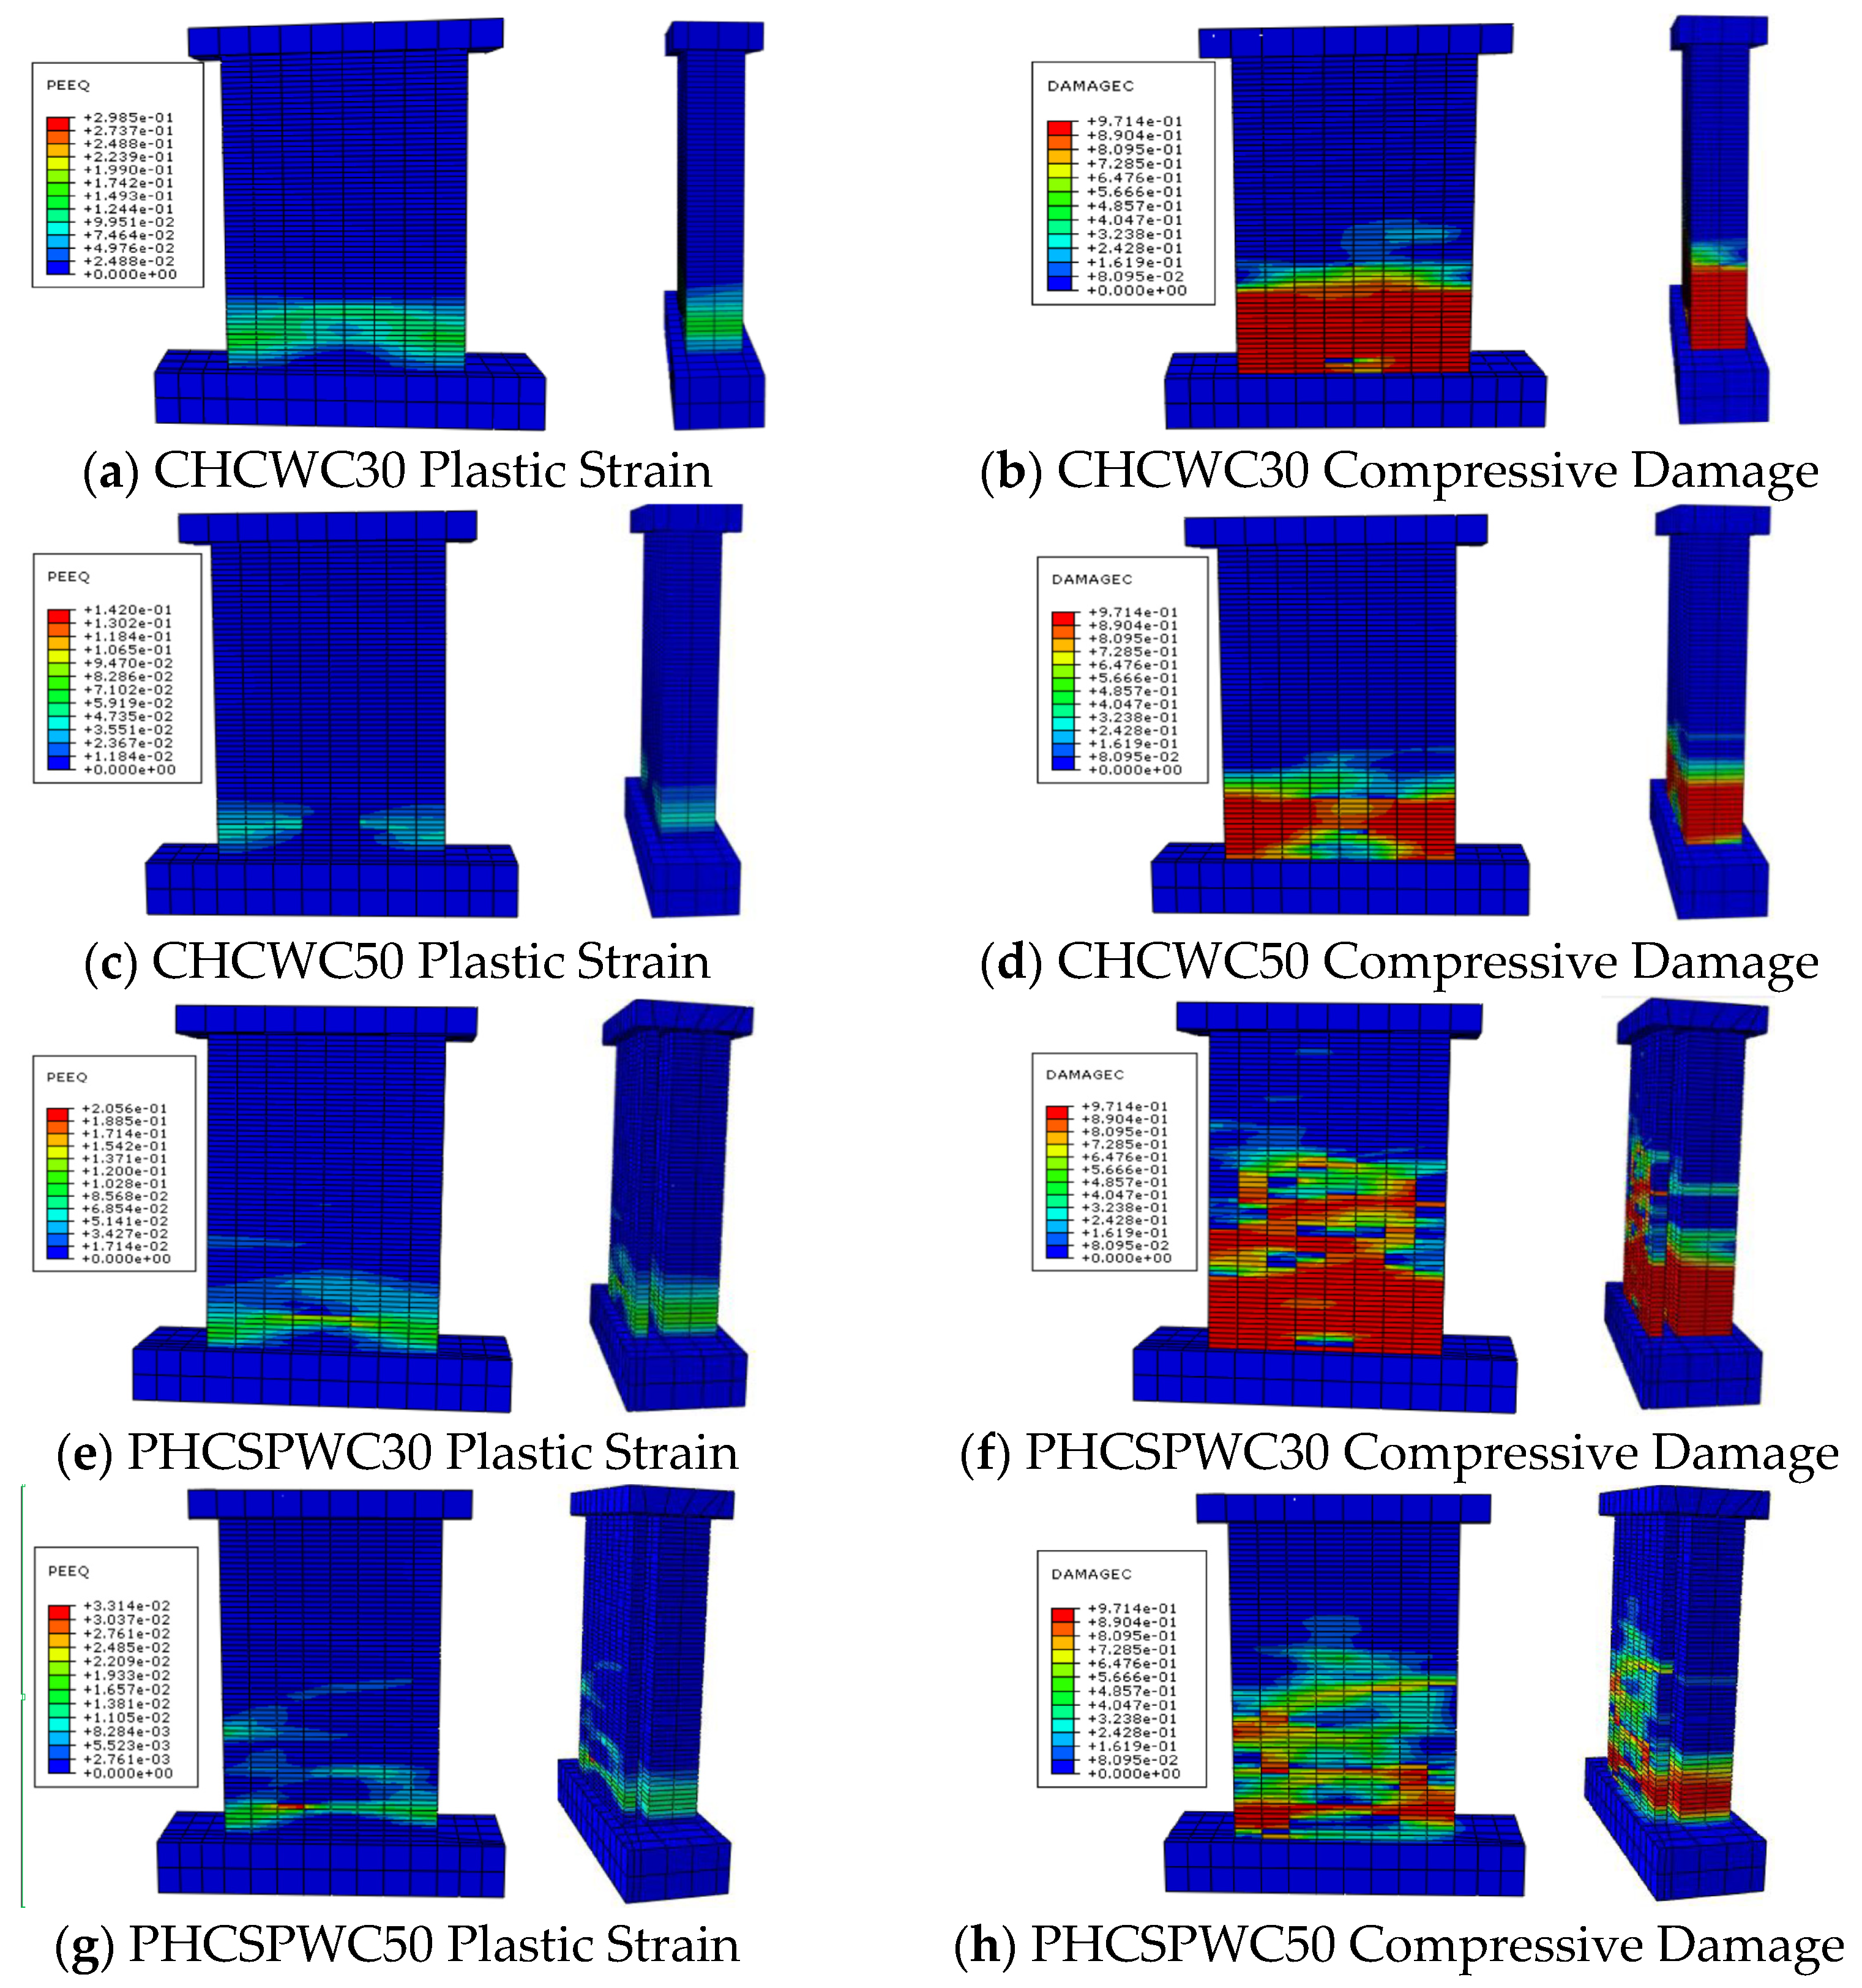
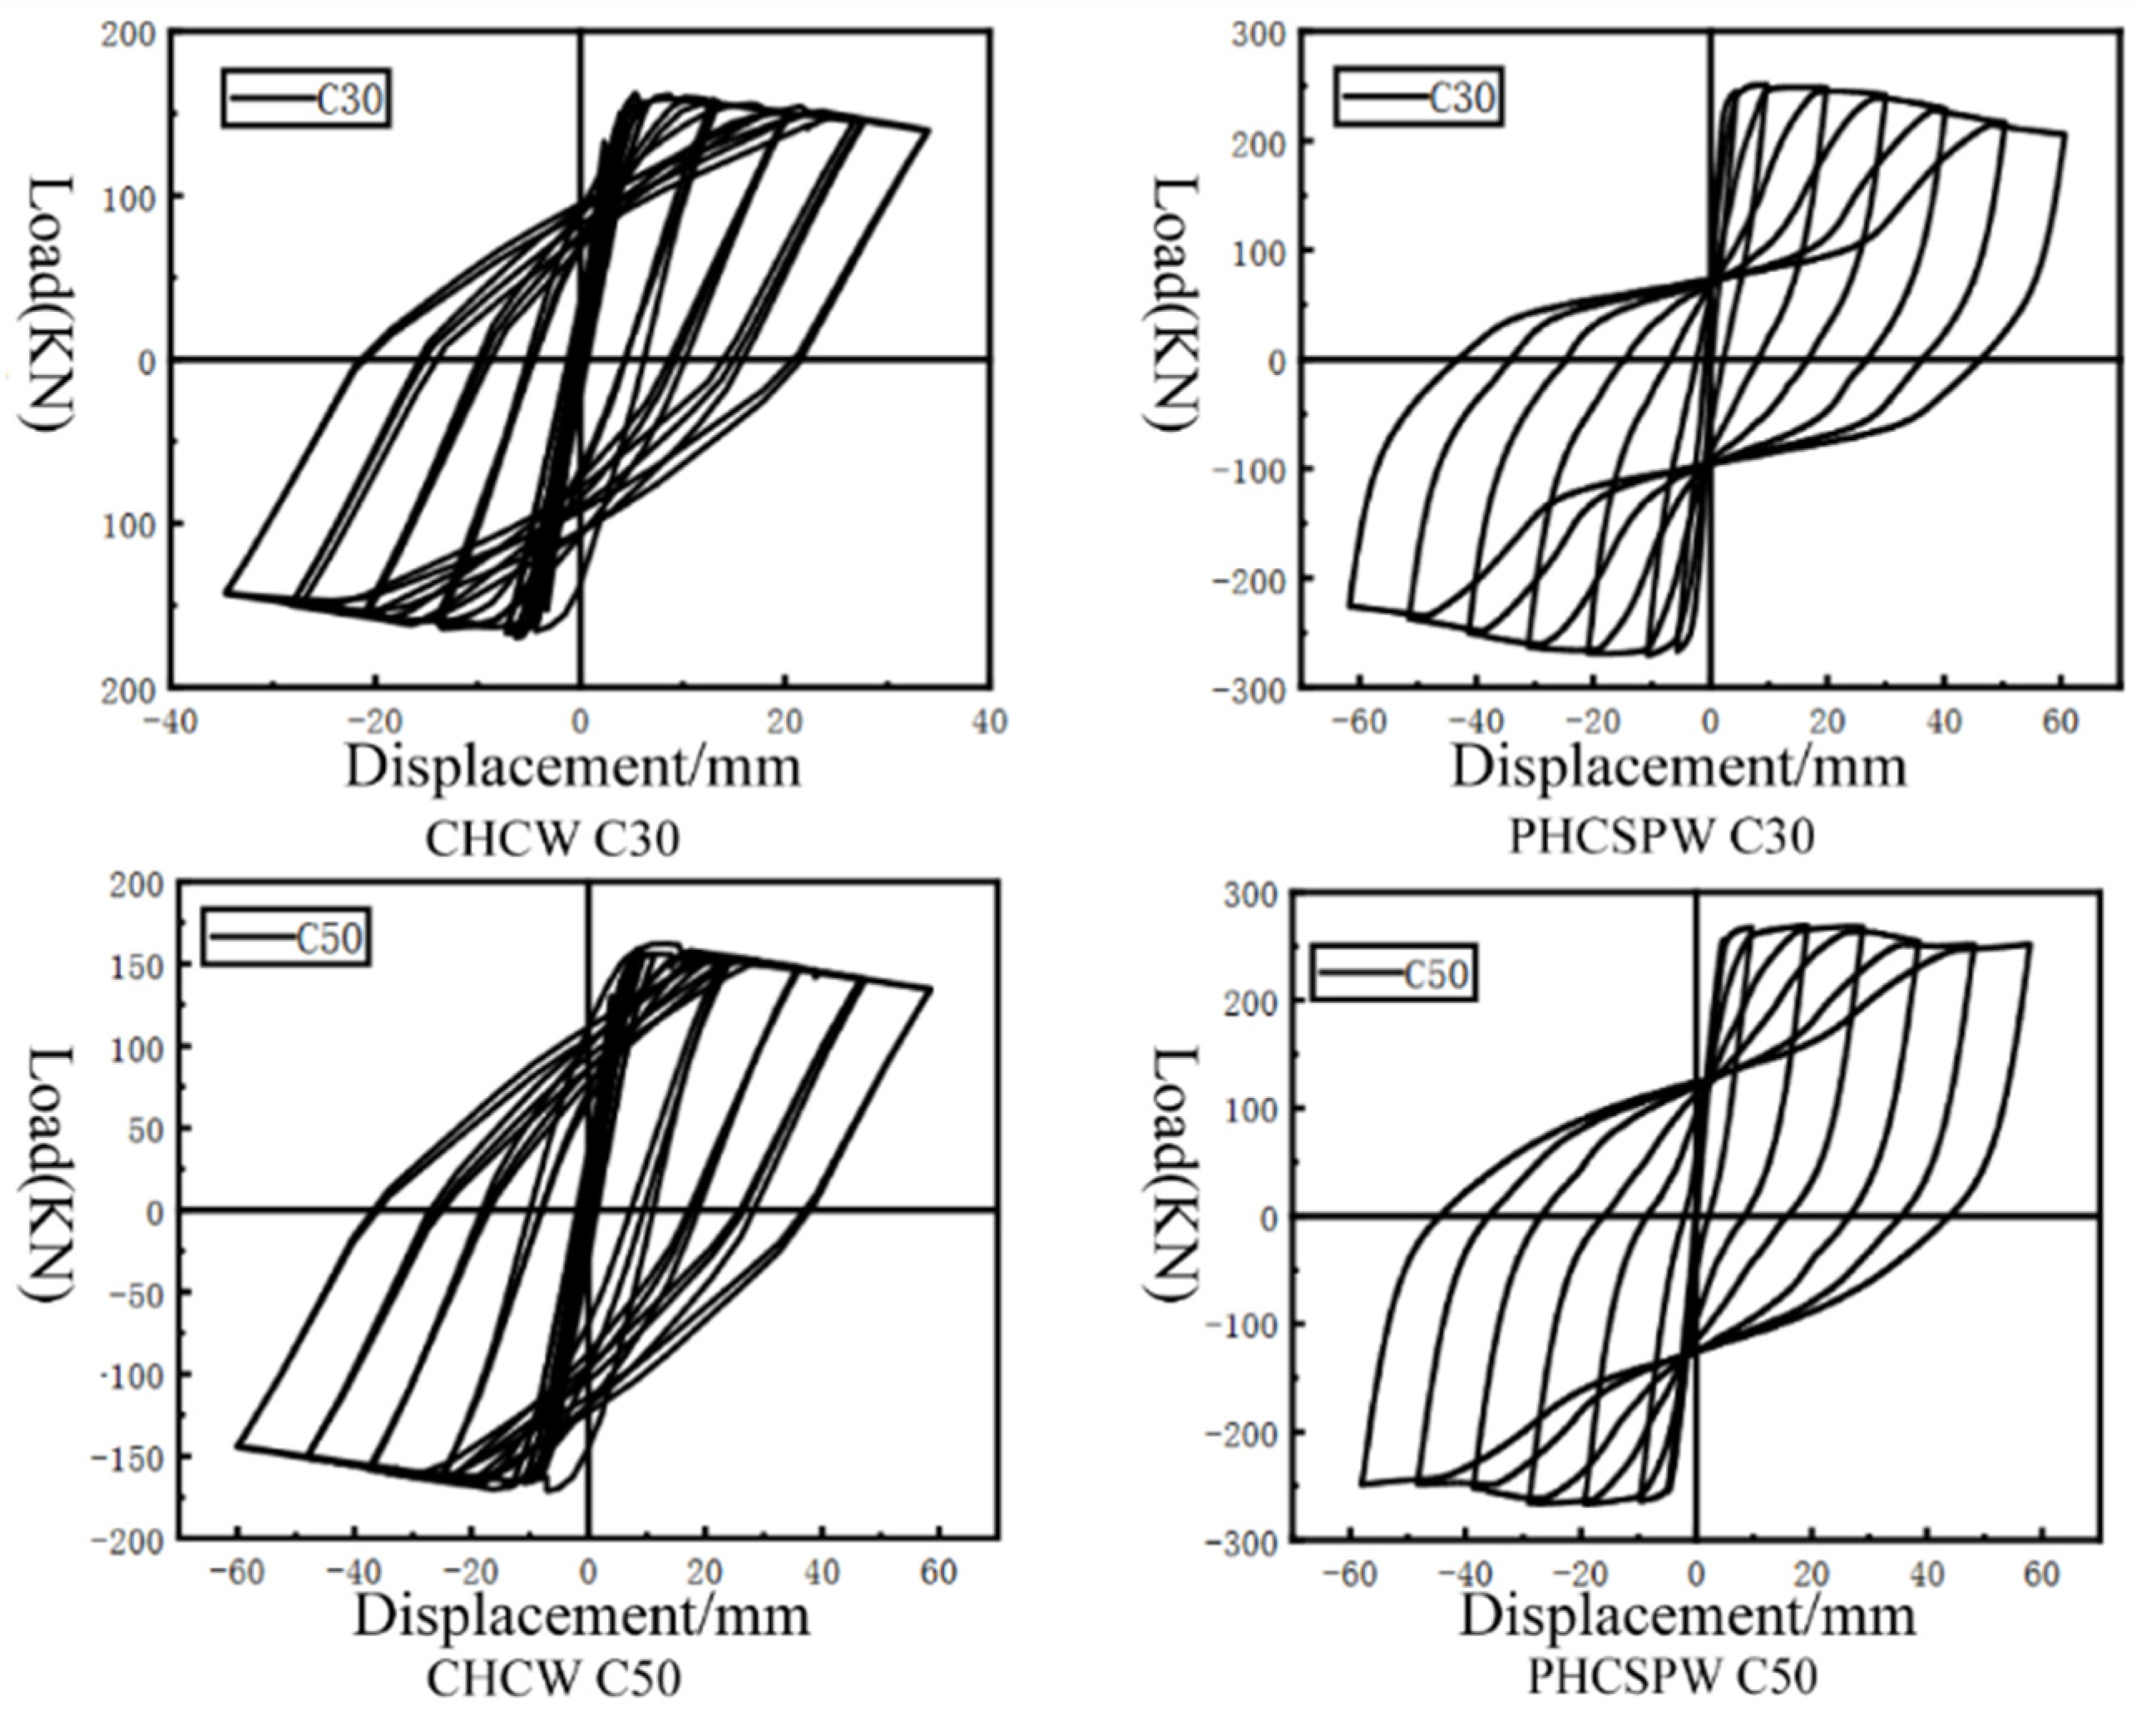

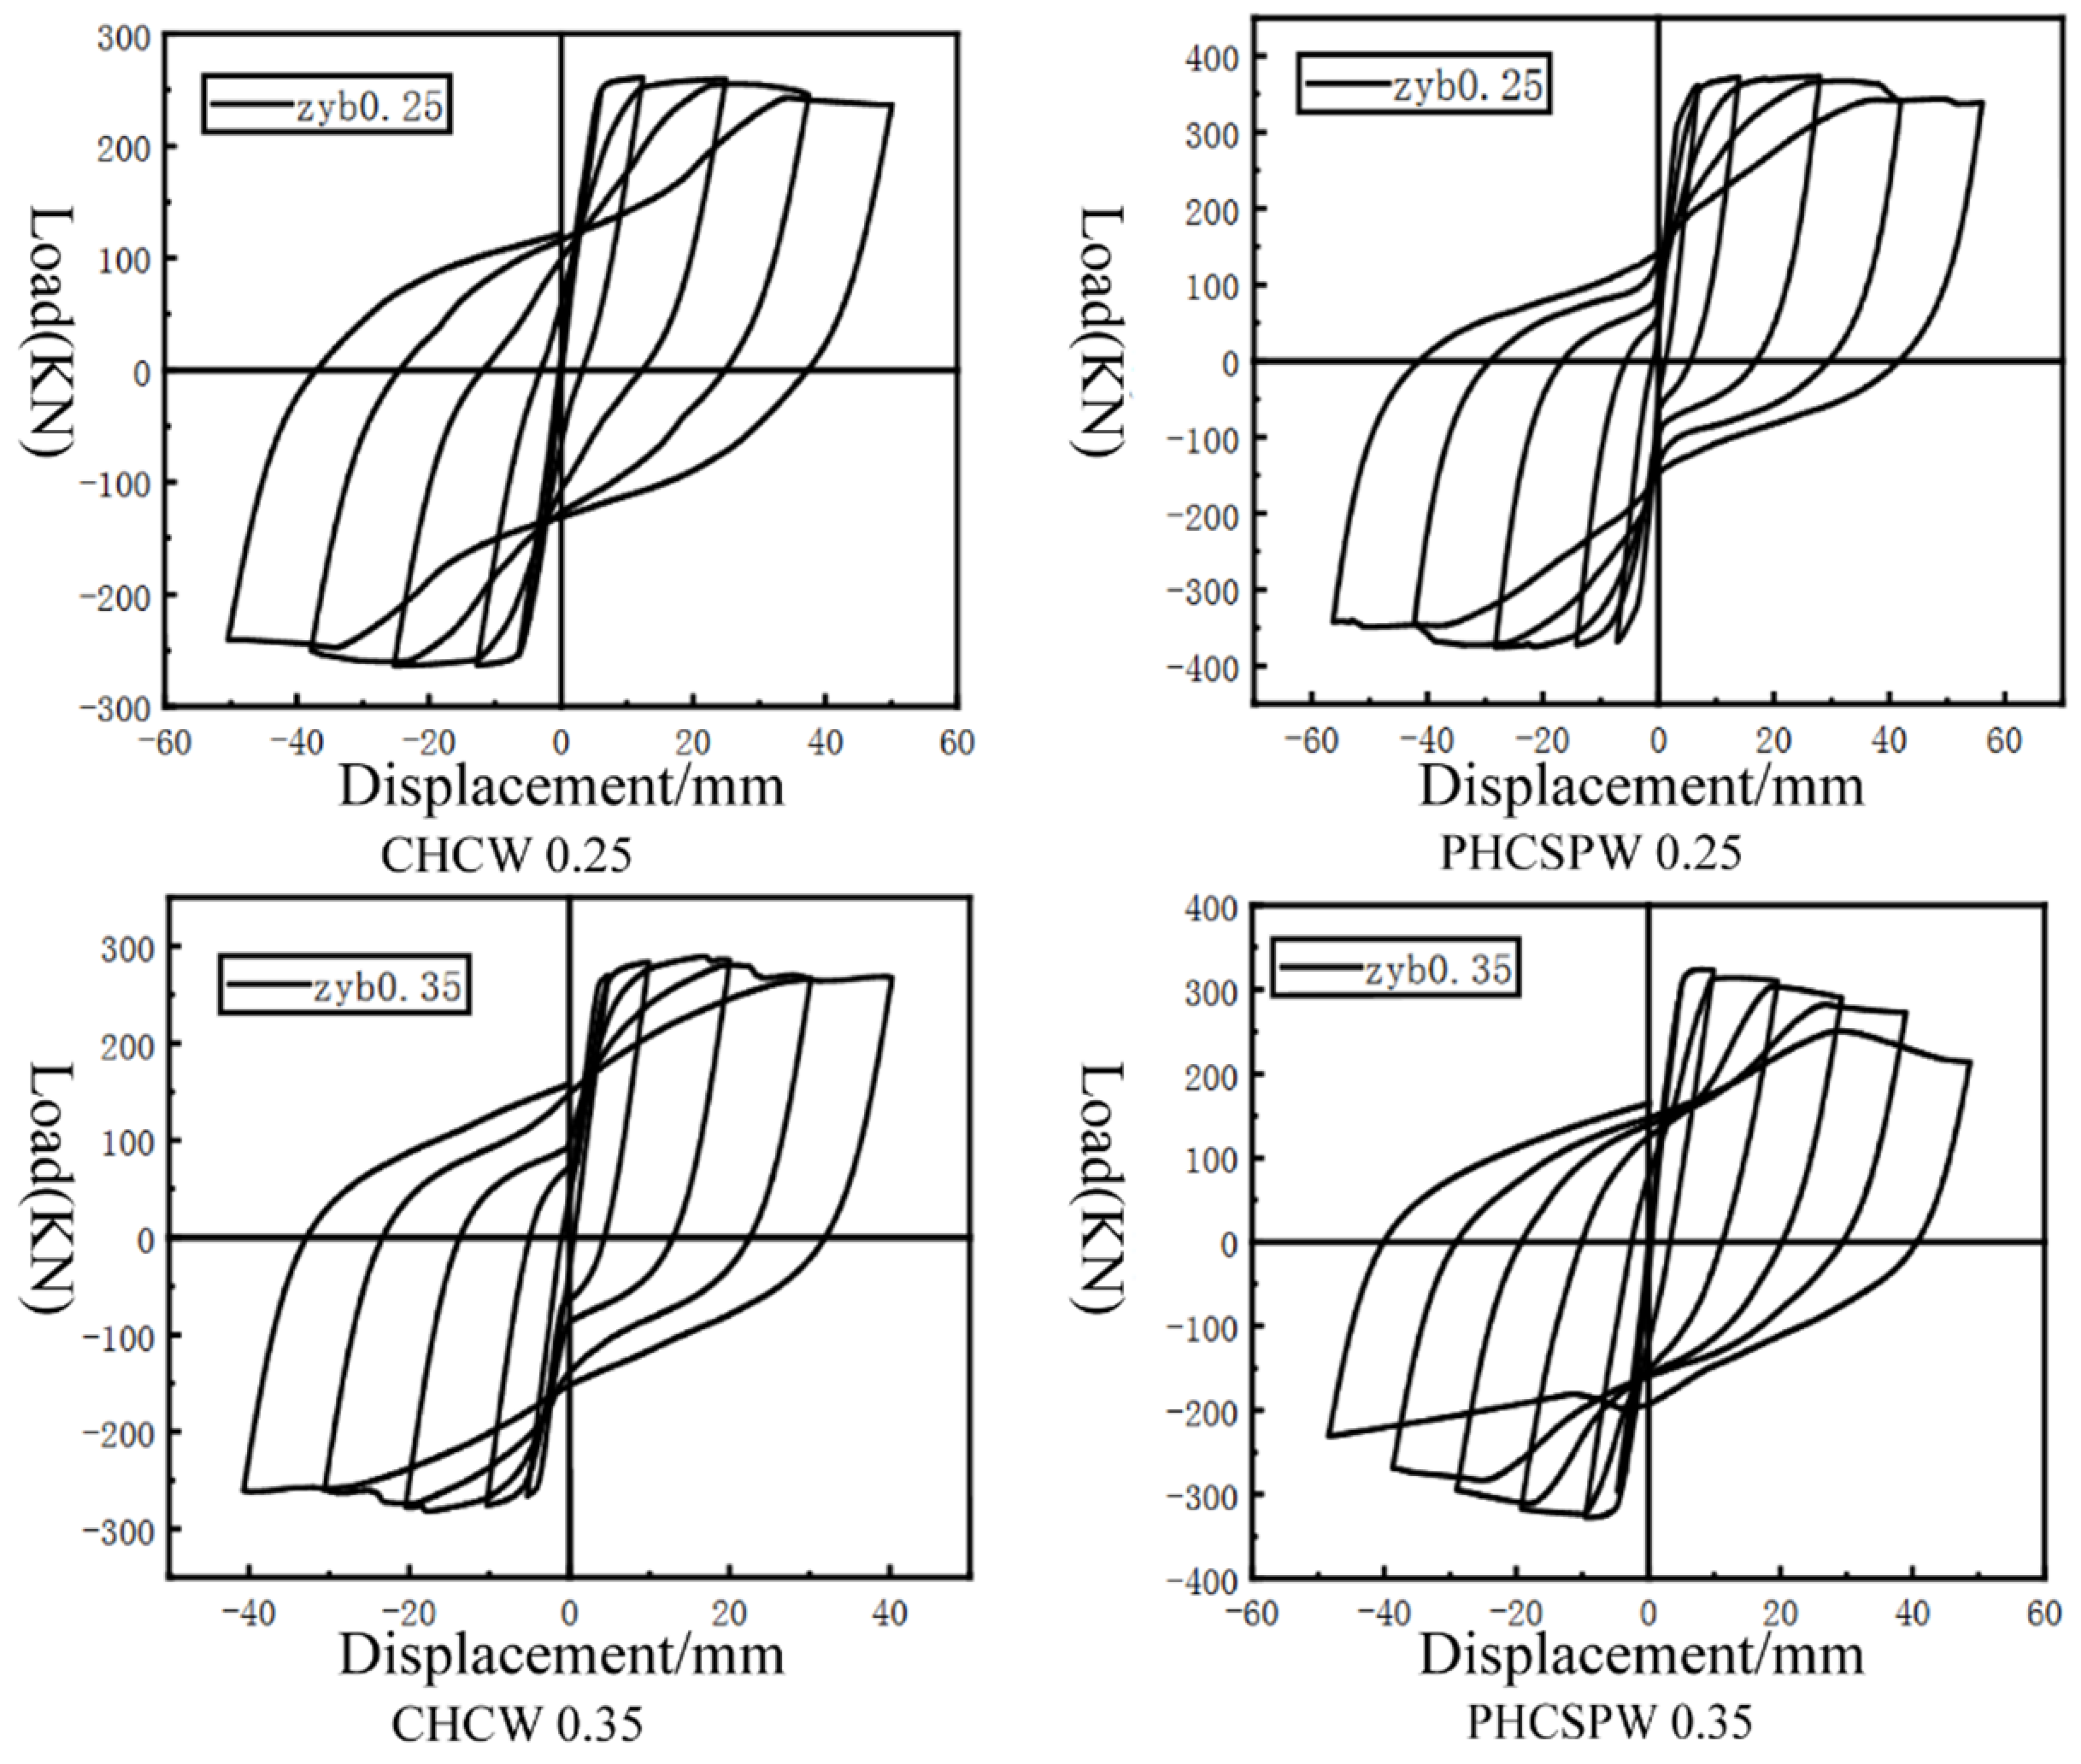
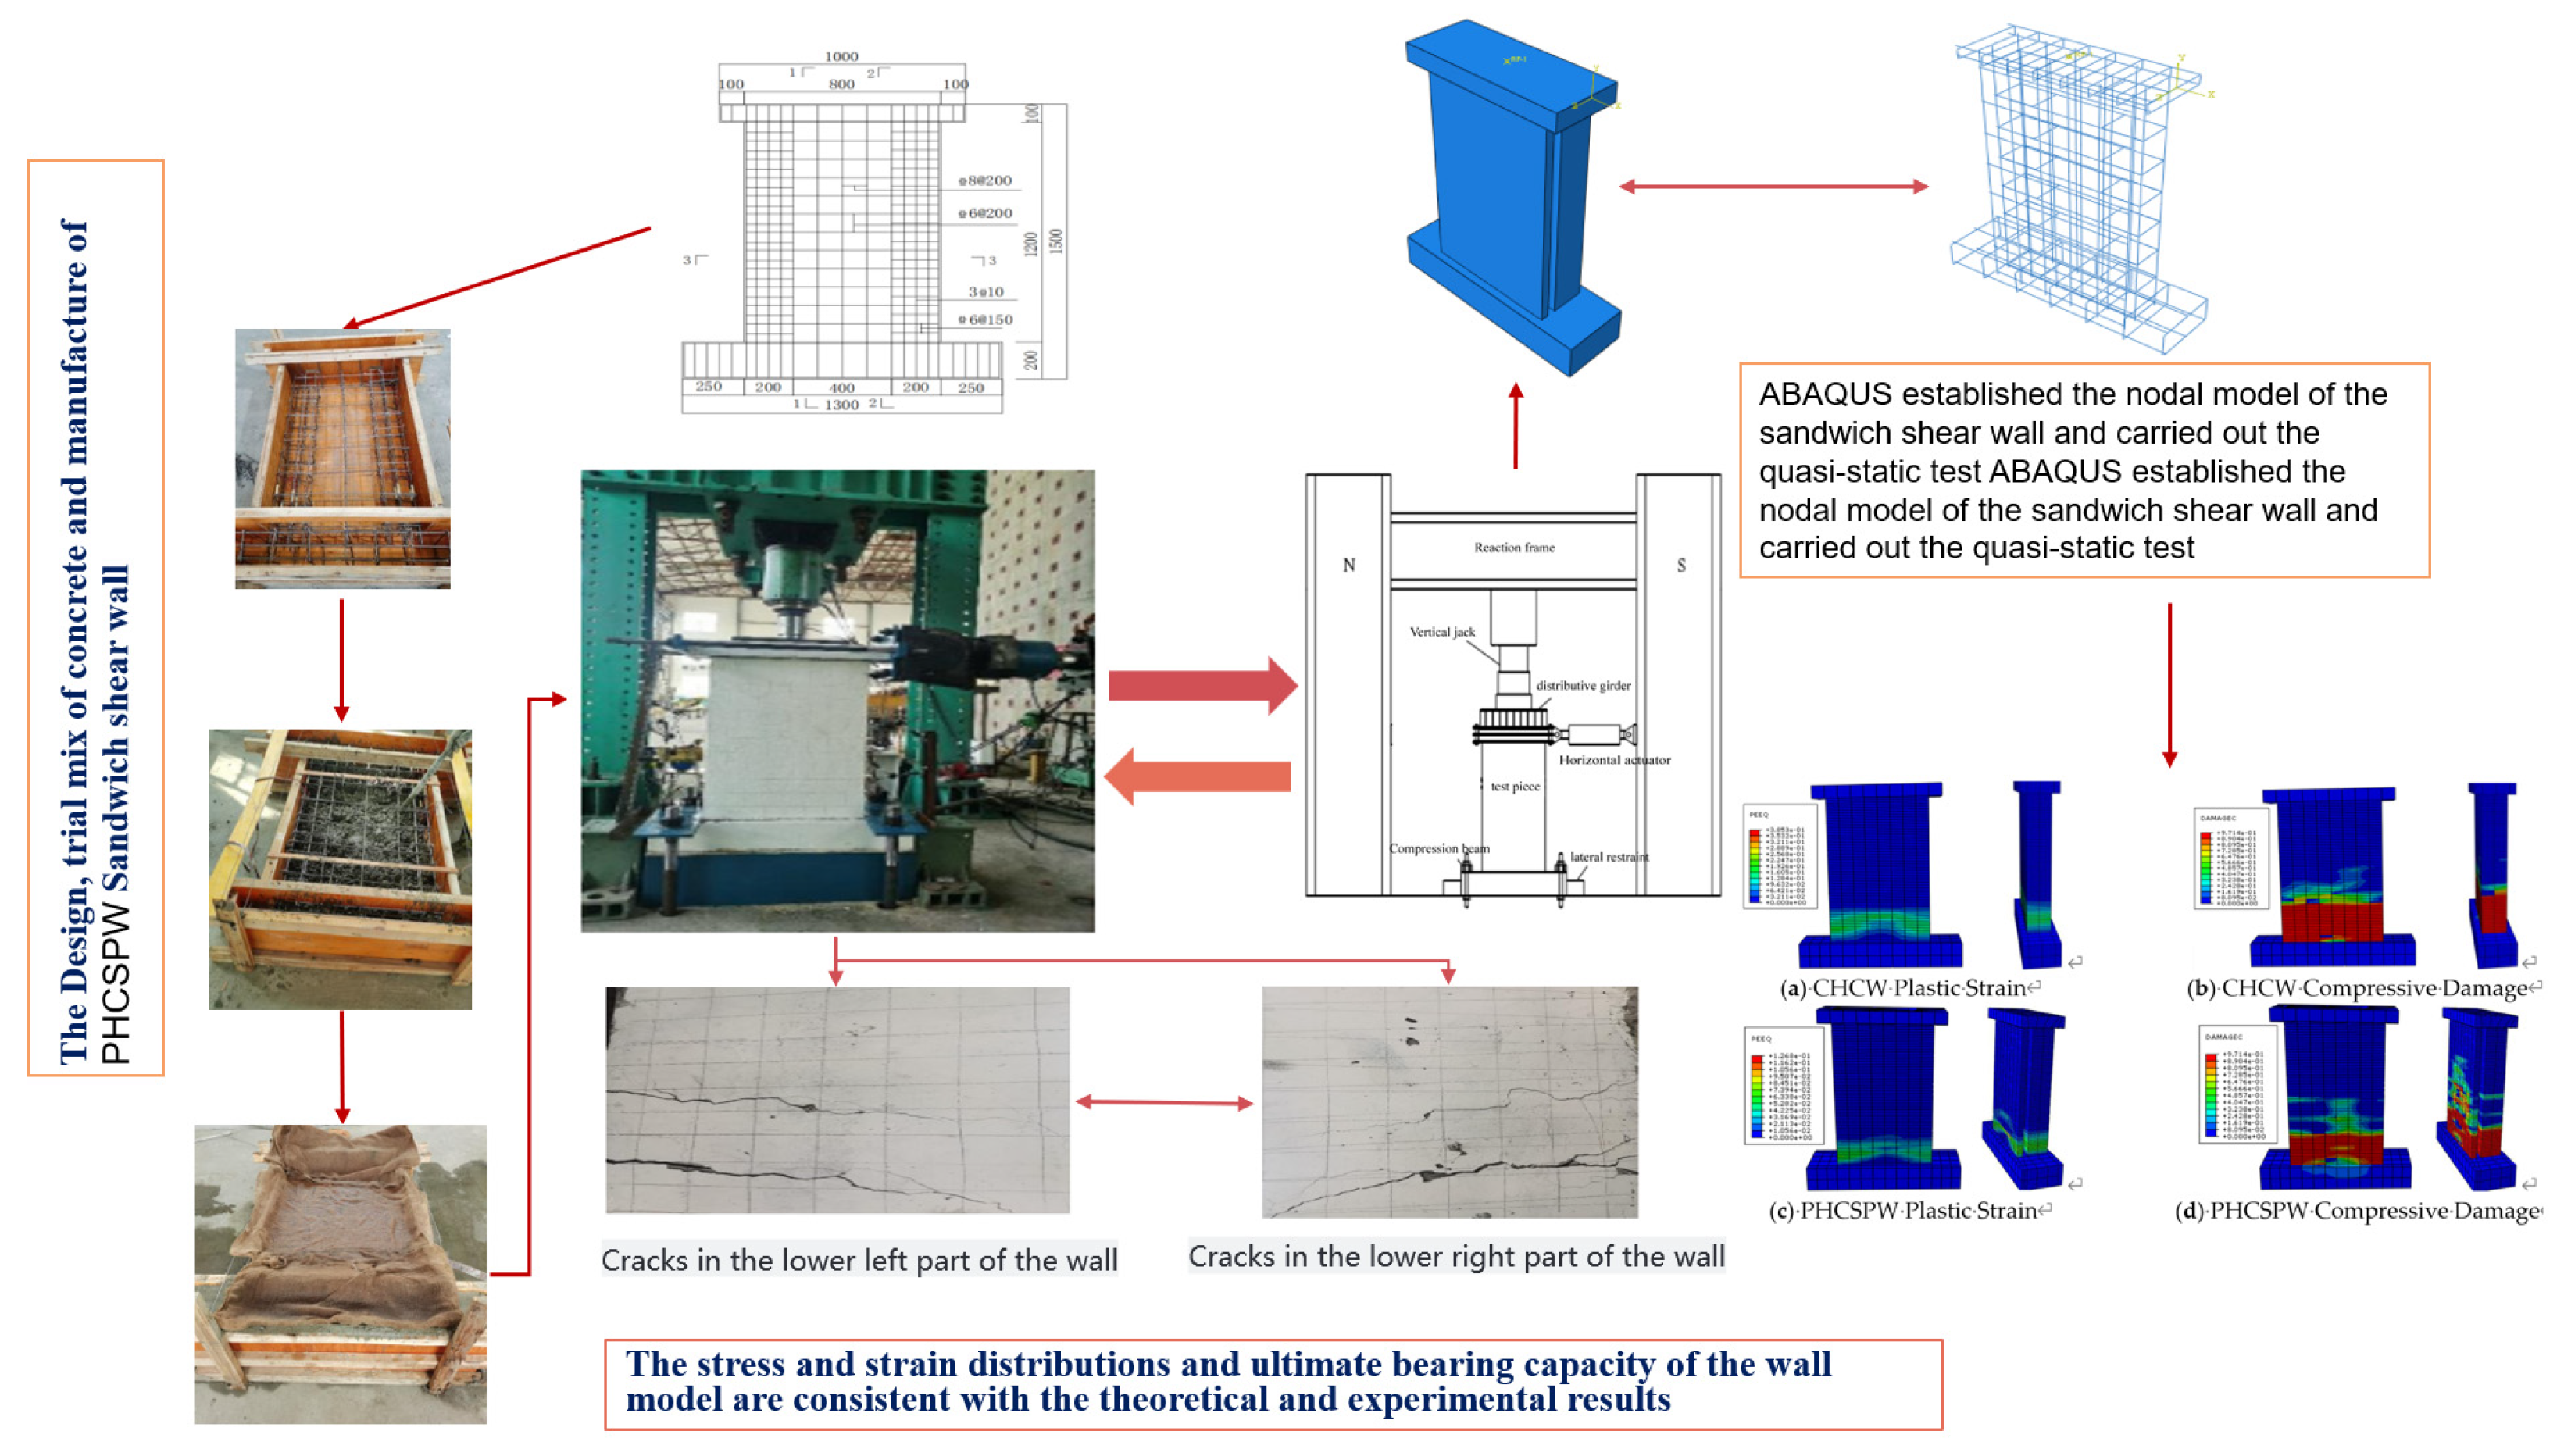
Disclaimer/Publisher’s Note: The statements, opinions and data contained in all publications are solely those of the individual author(s) and contributor(s) and not of MDPI and/or the editor(s). MDPI and/or the editor(s) disclaim responsibility for any injury to people or property resulting from any ideas, methods, instructions or products referred to in the content. |
© 2024 by the authors. Licensee MDPI, Basel, Switzerland. This article is an open access article distributed under the terms and conditions of the Creative Commons Attribution (CC BY) license (https://creativecommons.org/licenses/by/4.0/).