
Spatial Syntactic Analysis and Revitalization Strategies for Rural Settlements in Ethnic Minority Areas: A Case Study of Shuanglang Town, China

Abstract
:1. Introduction
2. Materials and Methods
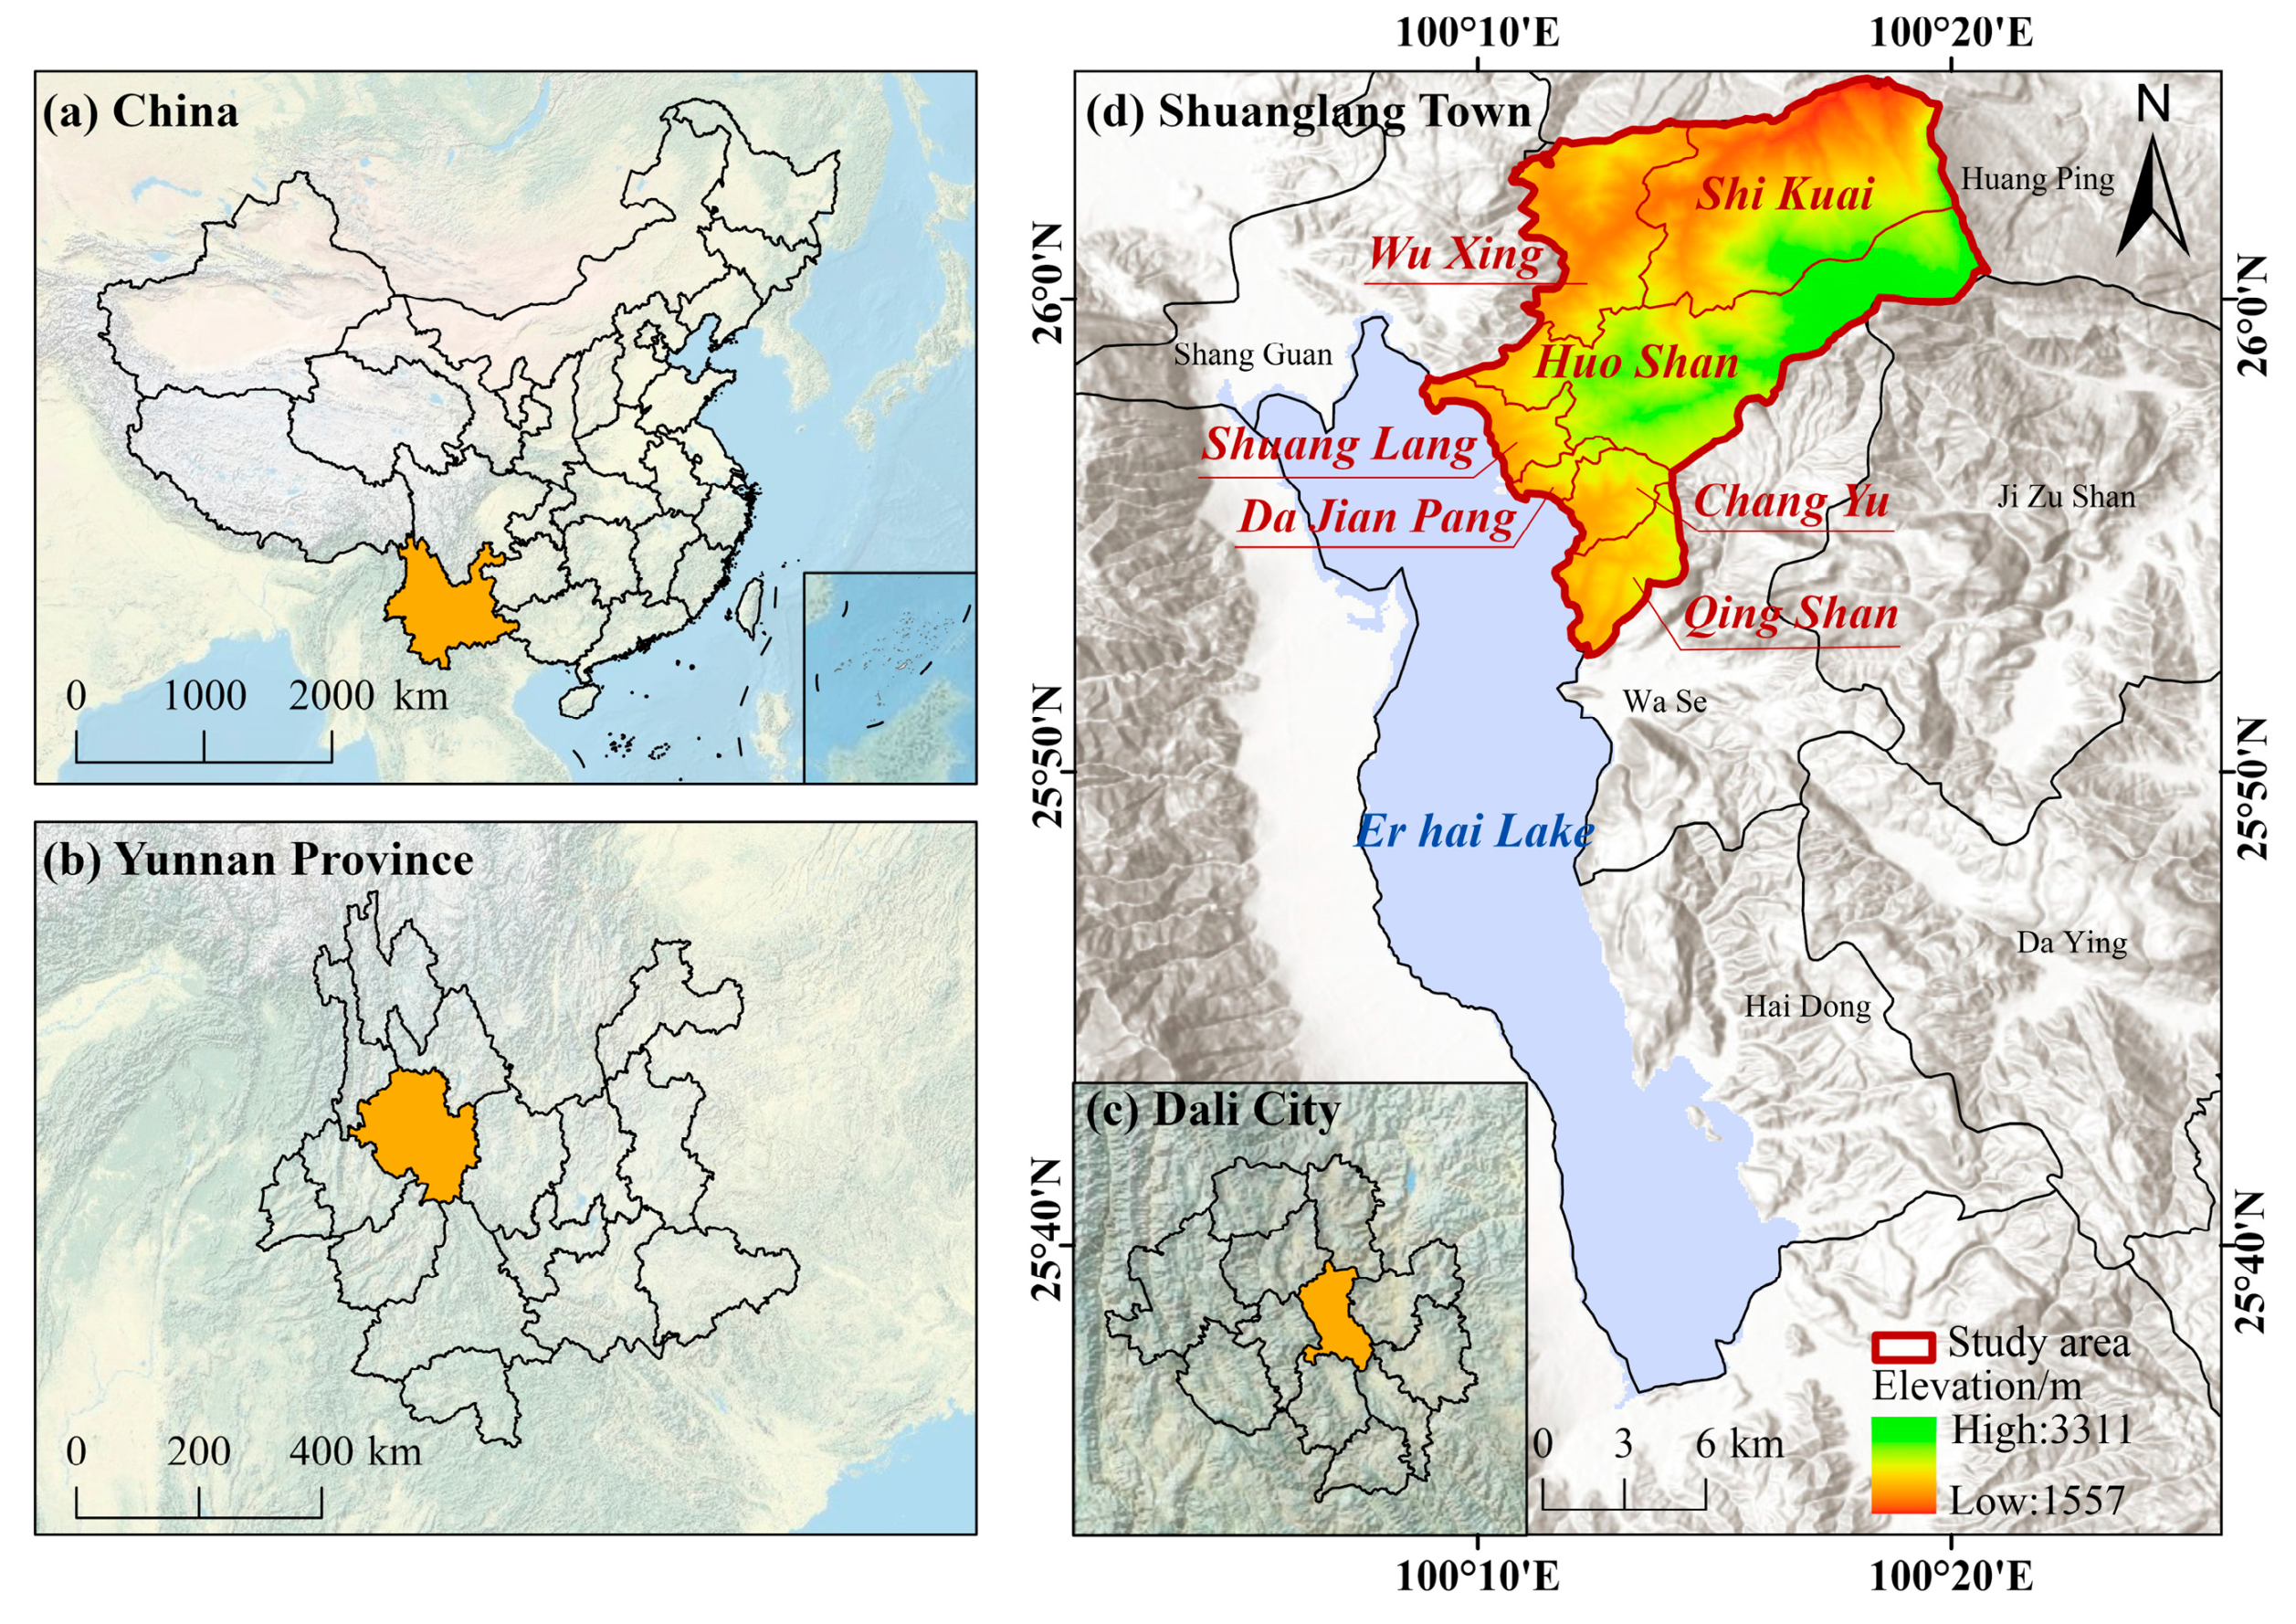
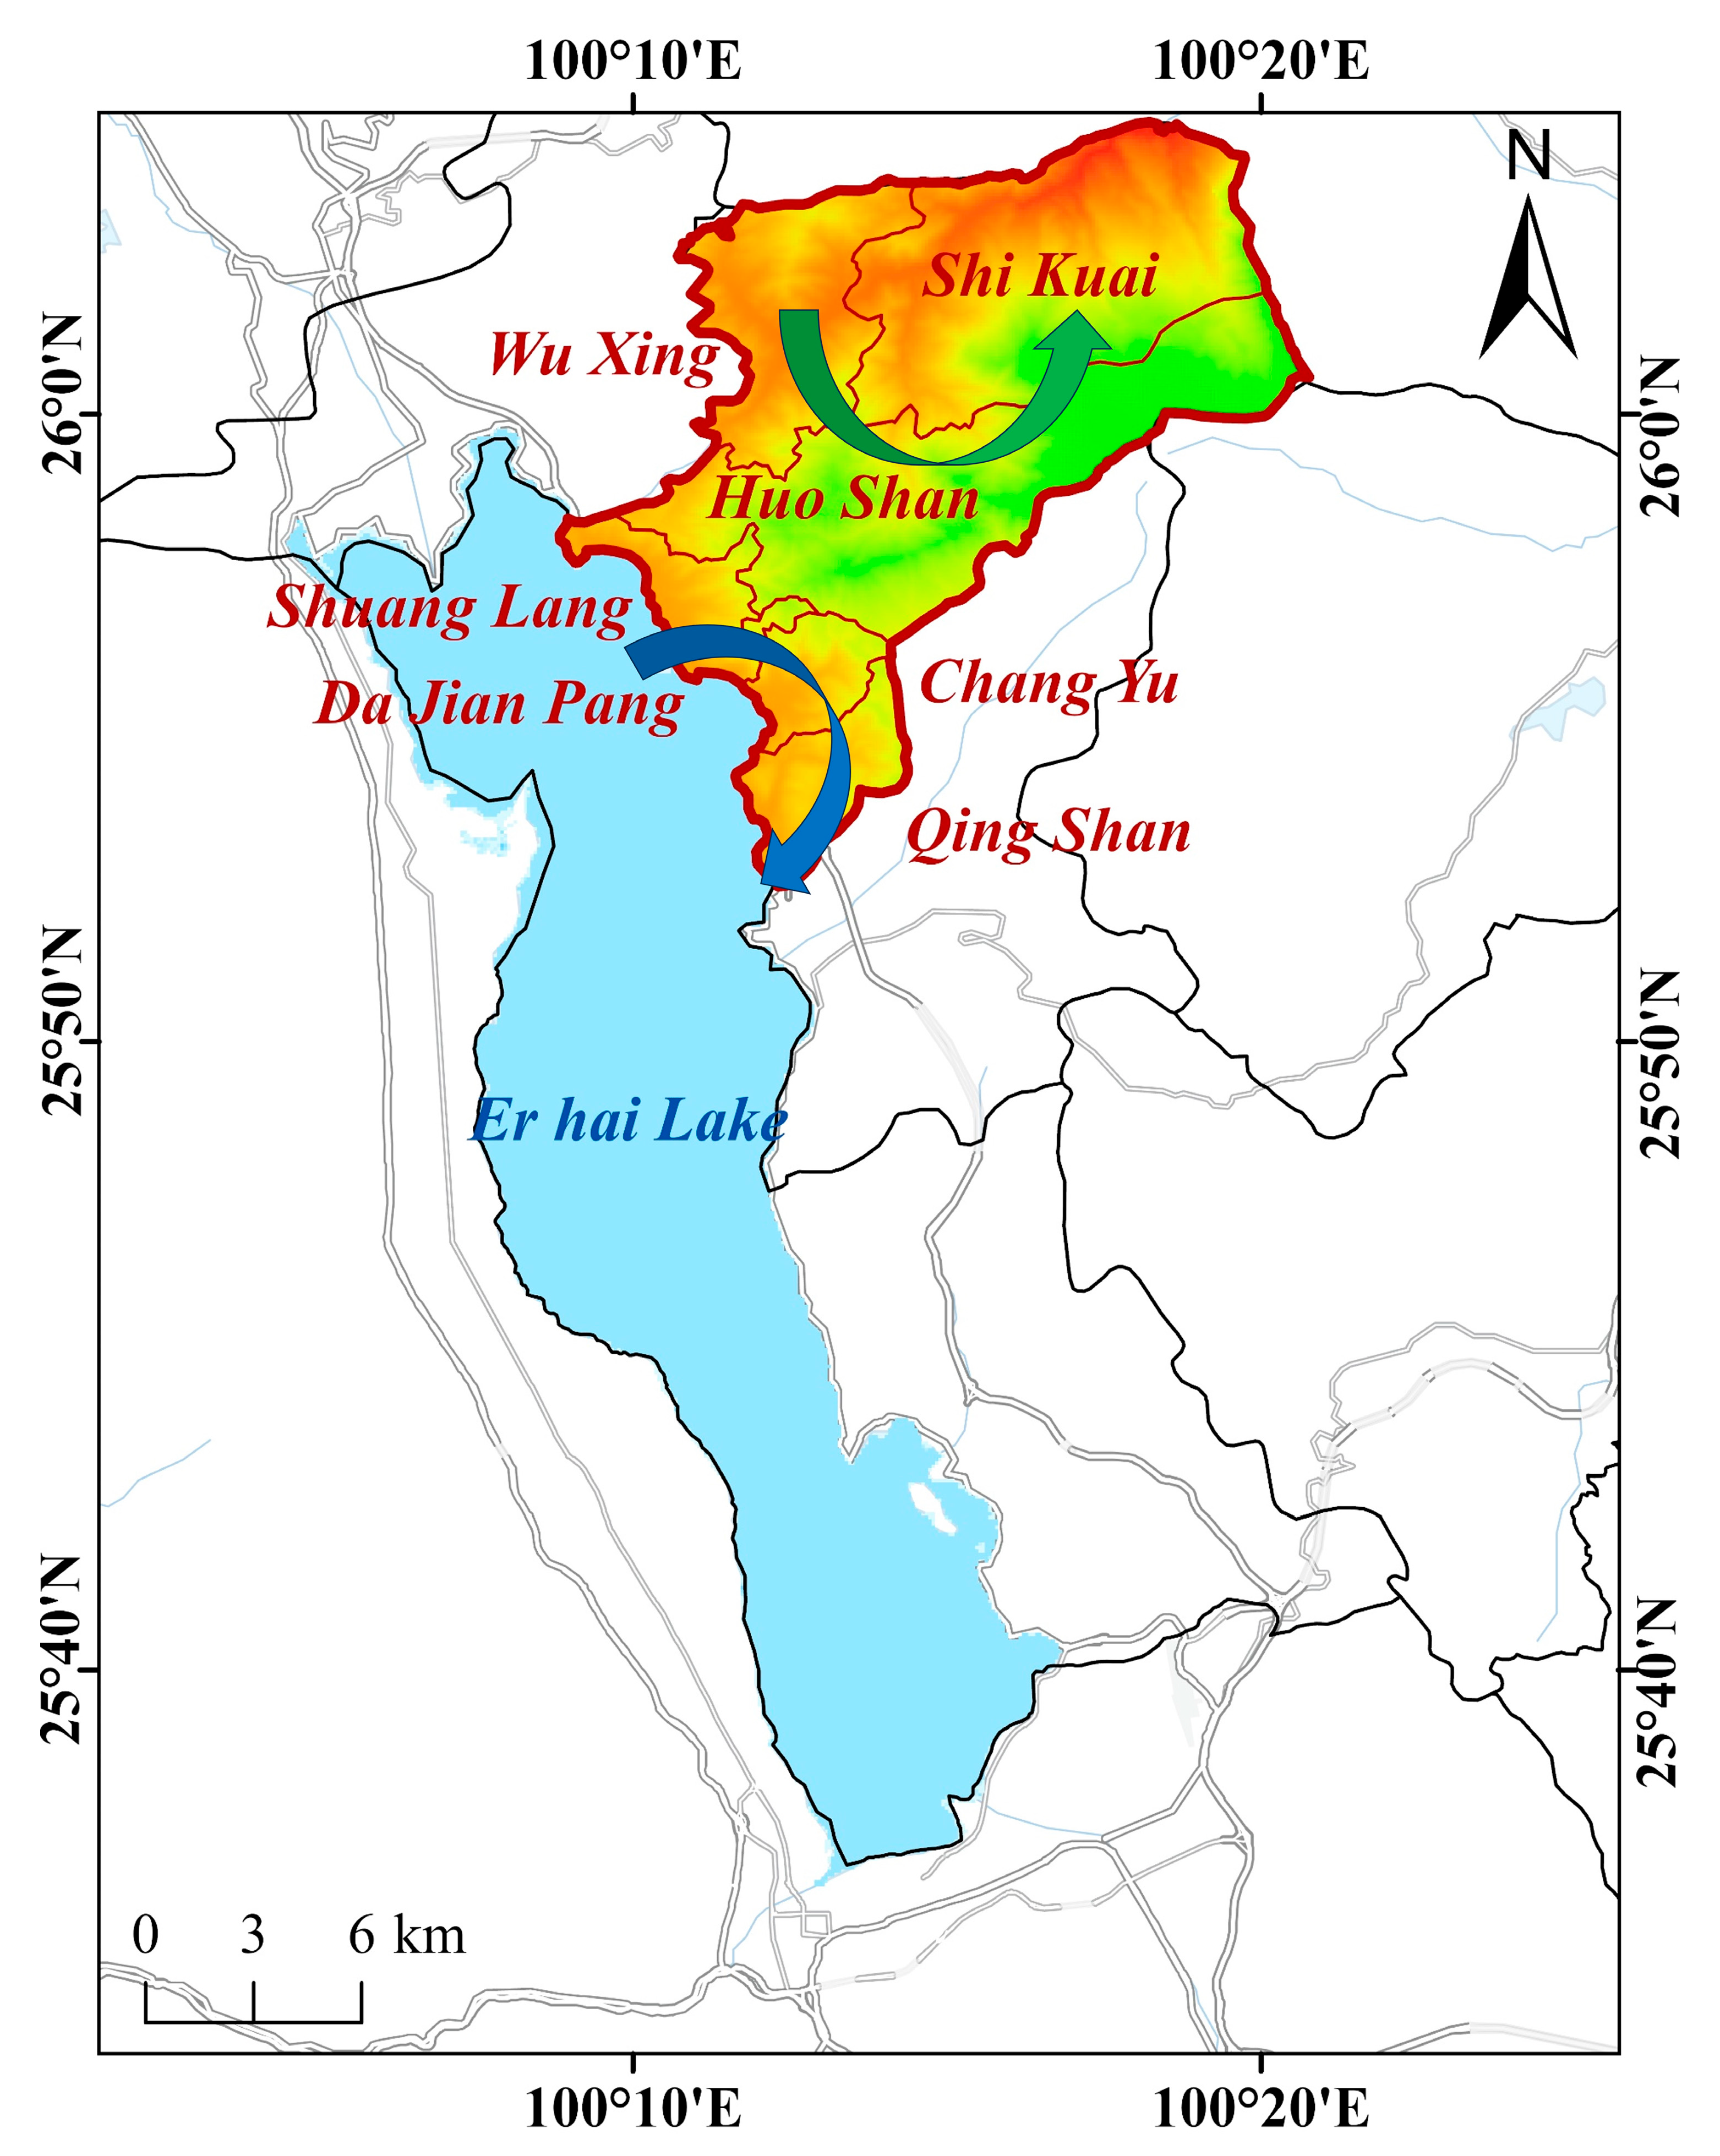
2.1. Study Area
2.2. Methods
2.2.1. Space Syntax
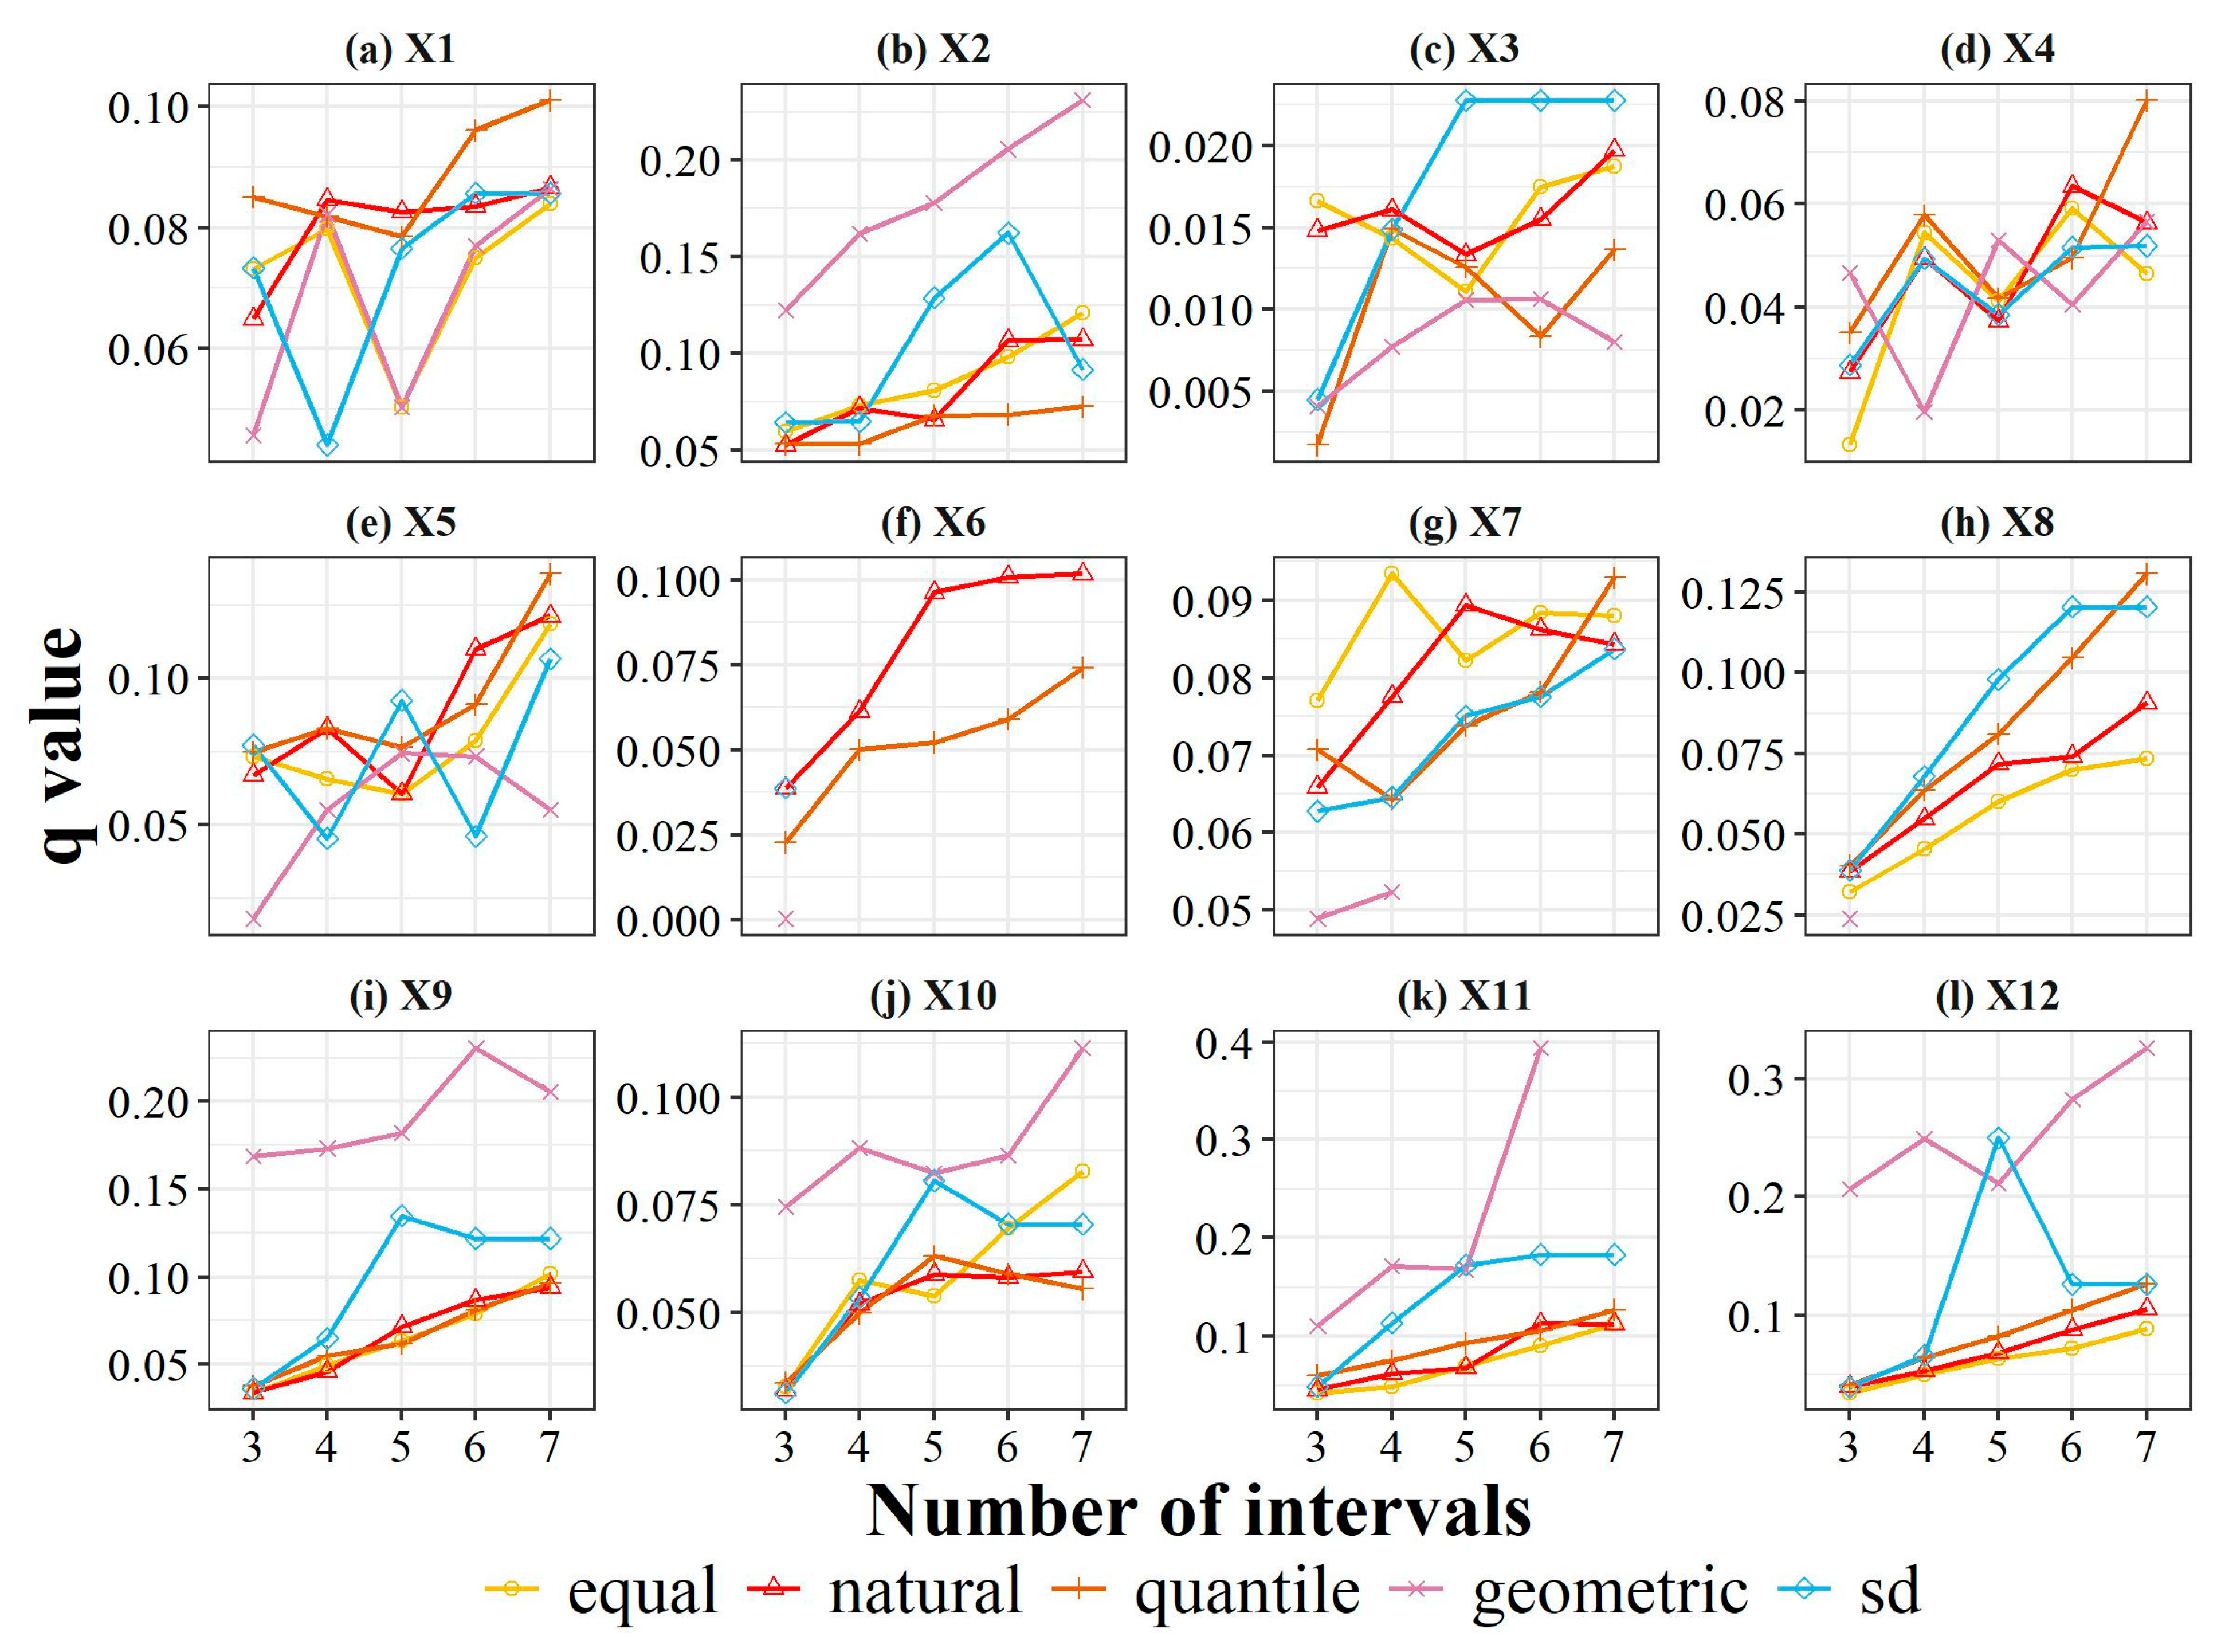
2.2.2. Optimal Parameters-Based Geographical Detector
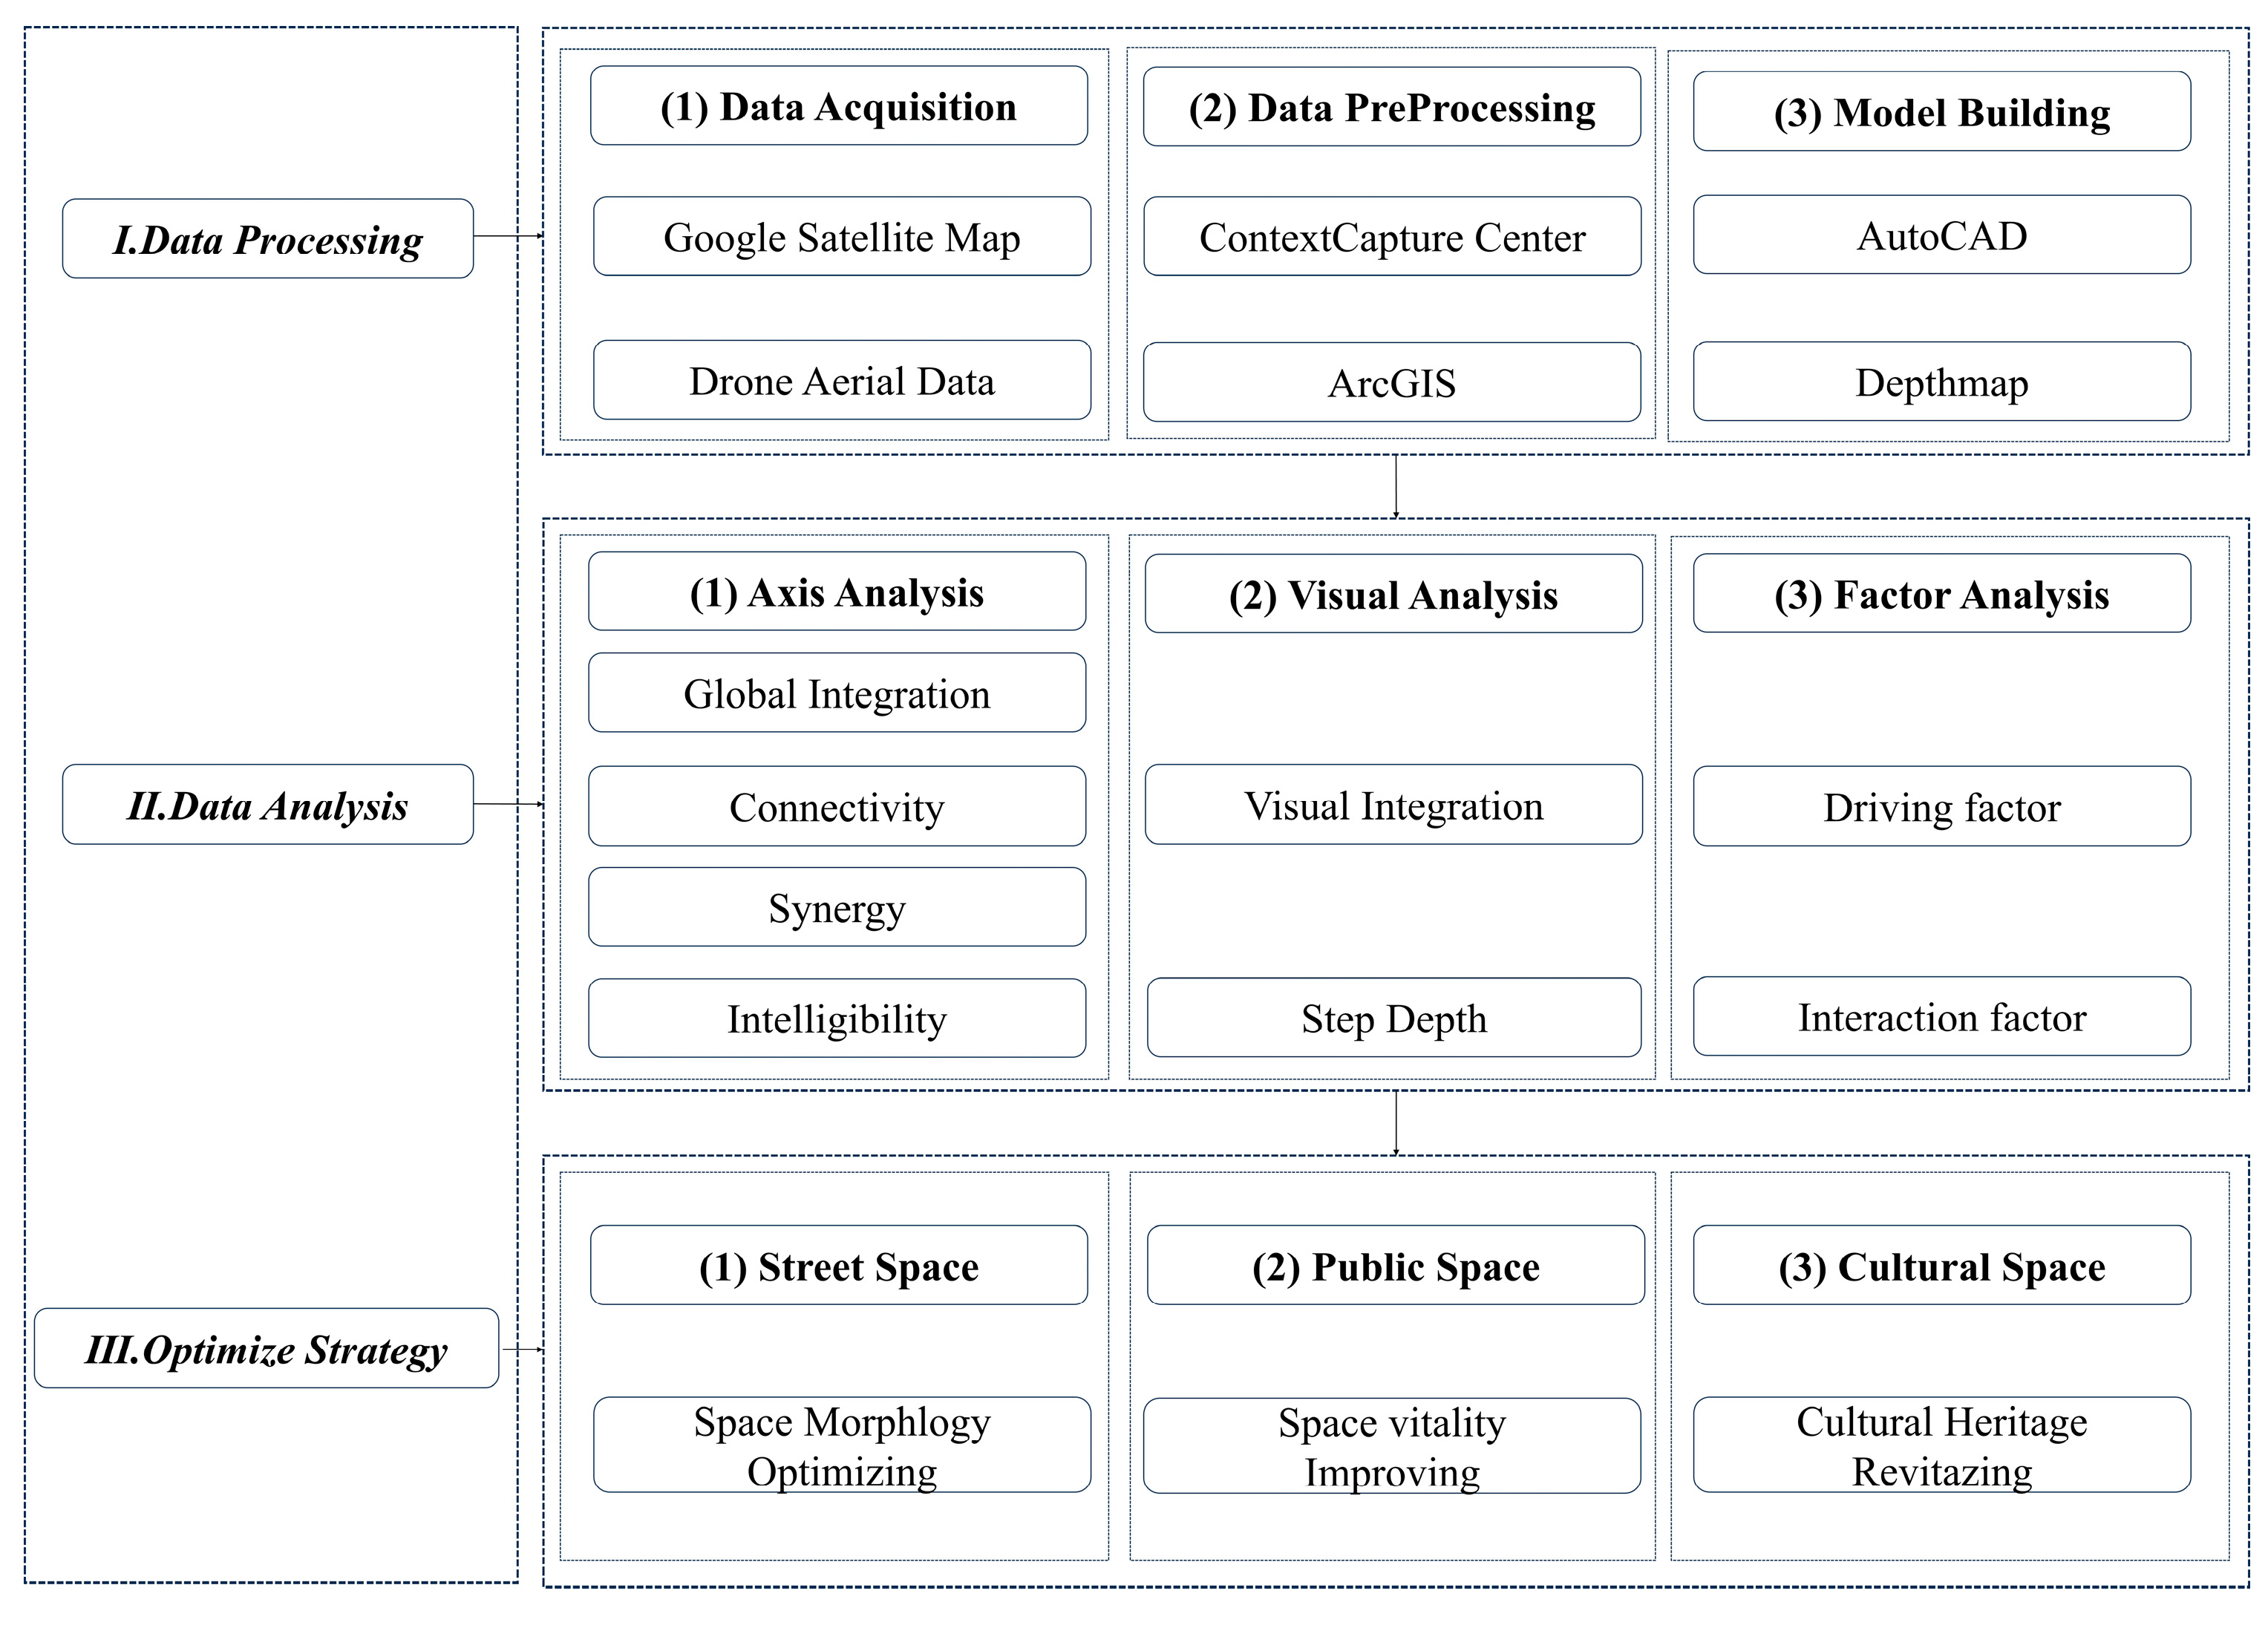
2.3. Research Framework
3. Results
3.1. Axial Analysis of Space Morphology Characteristics
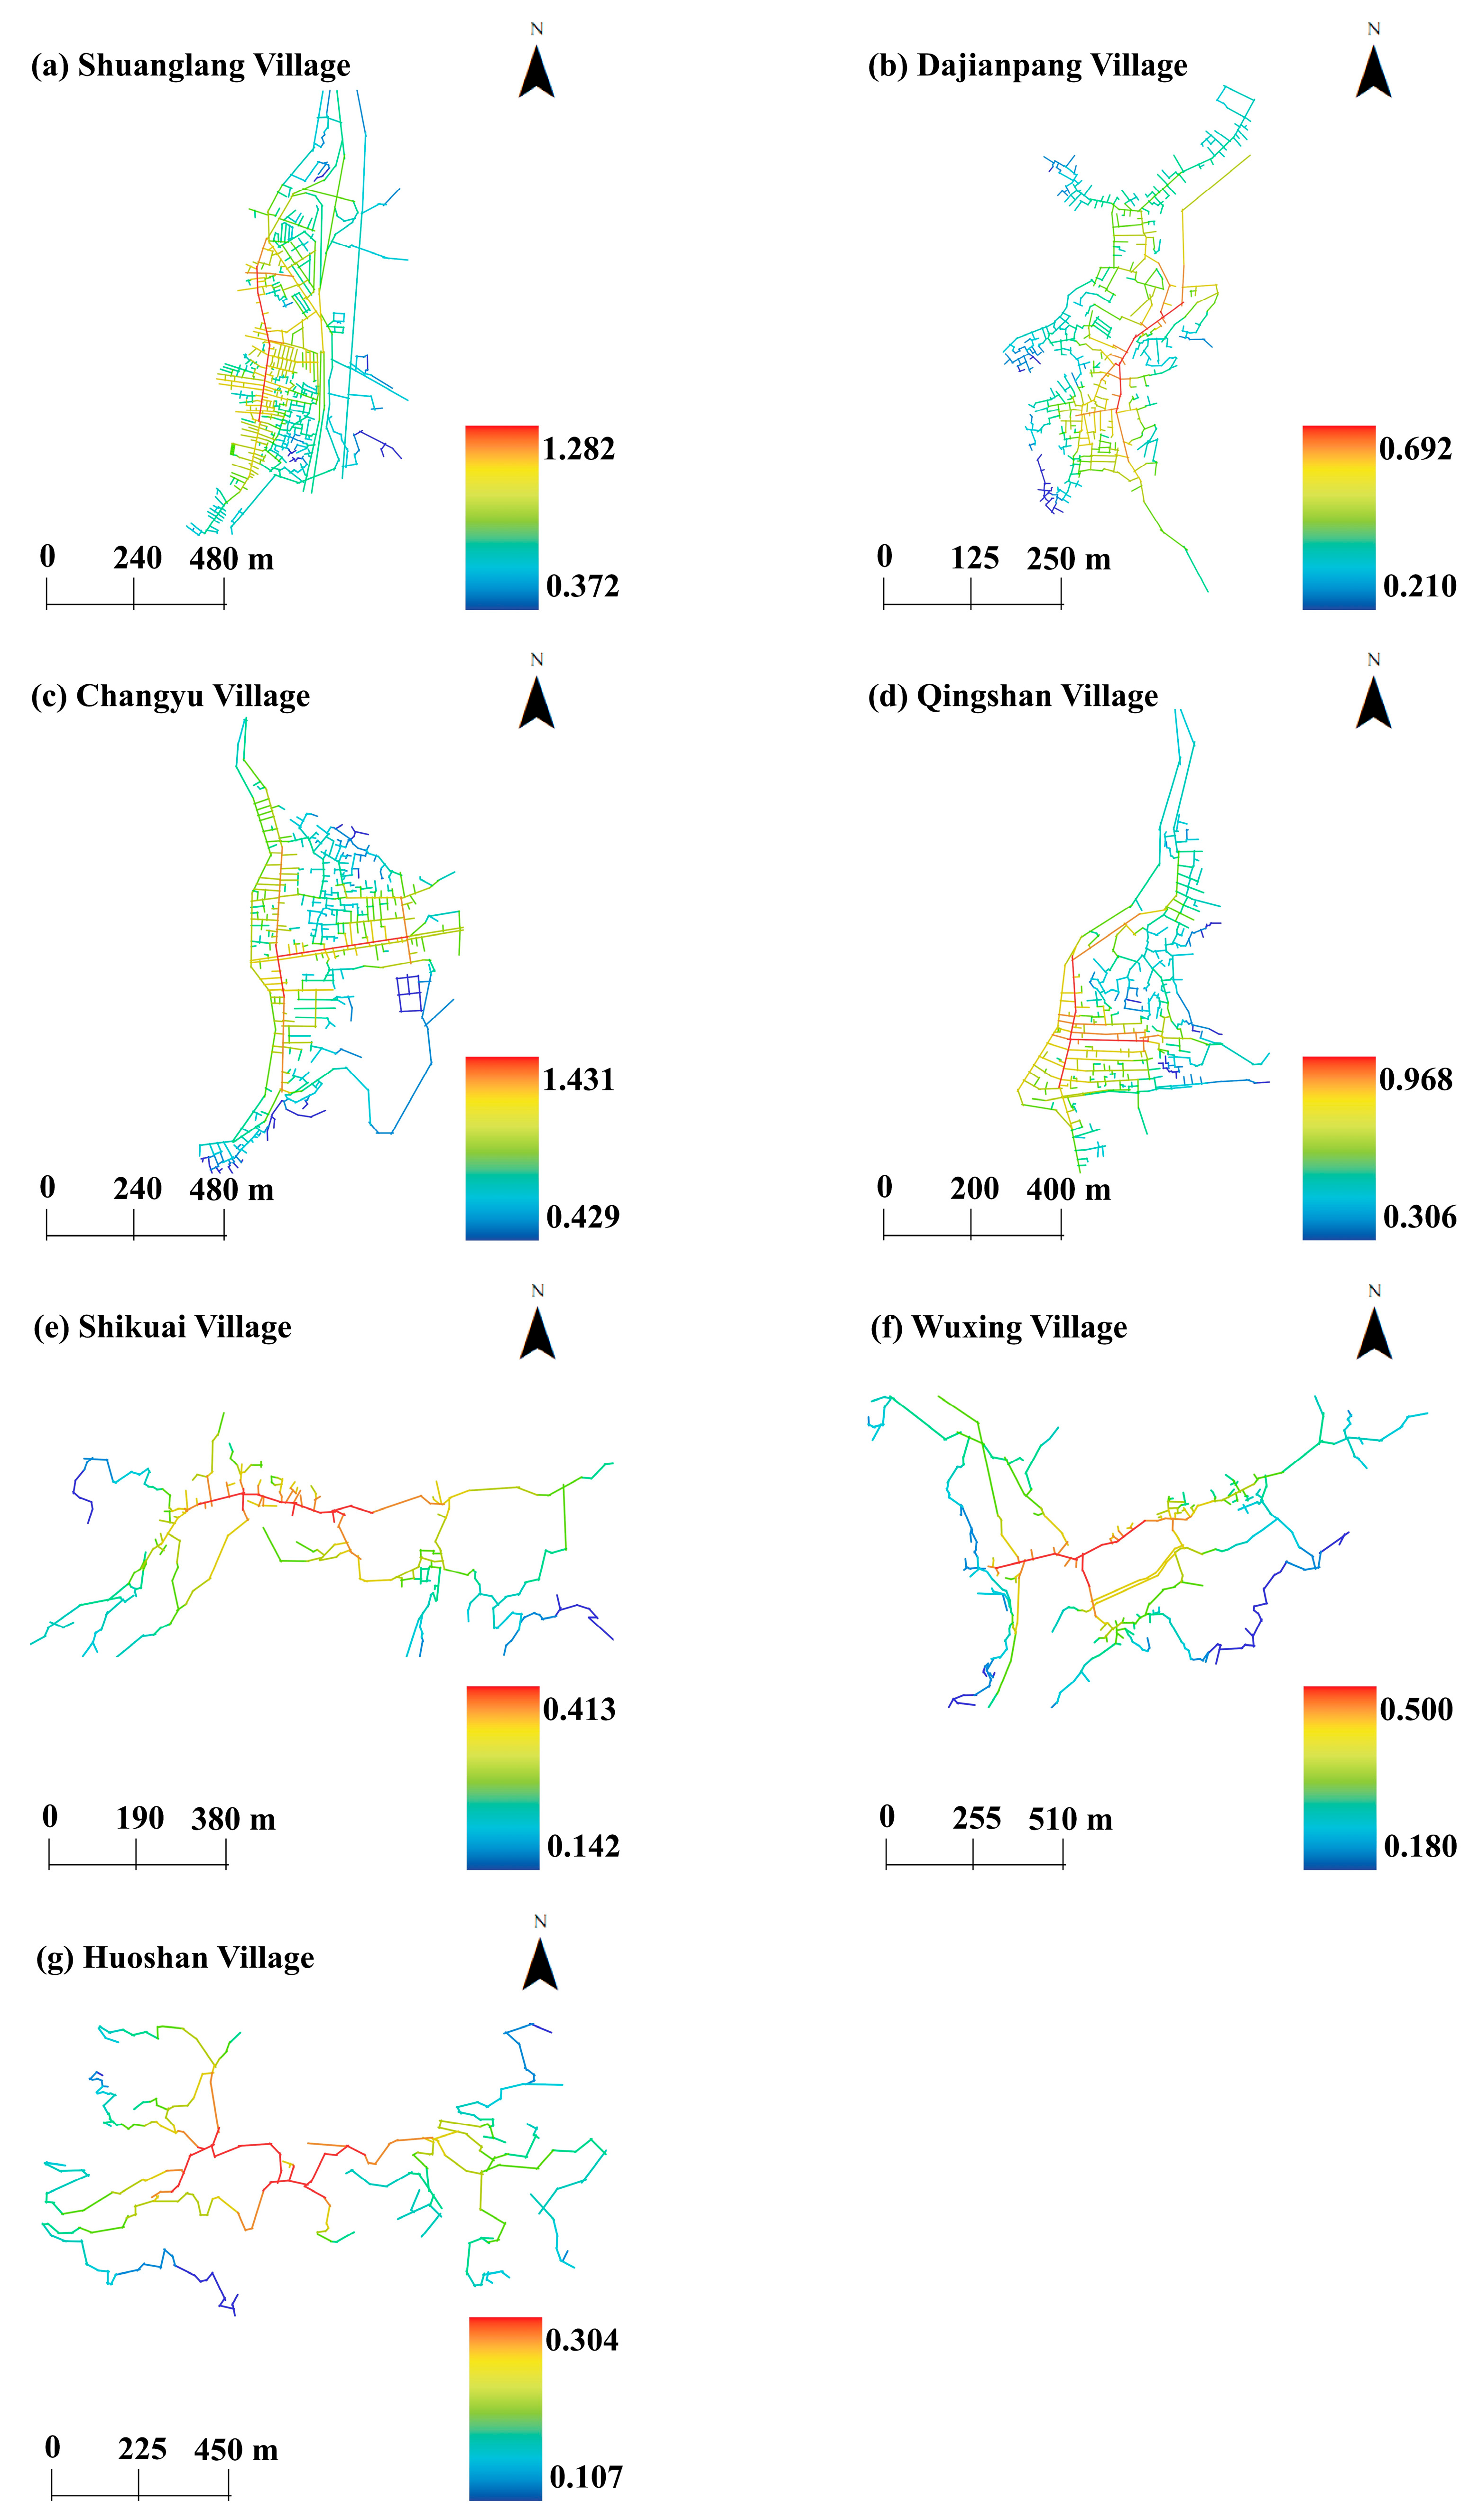
3.1.1. Global Integration Analysis
3.1.2. Connectivity Analysis
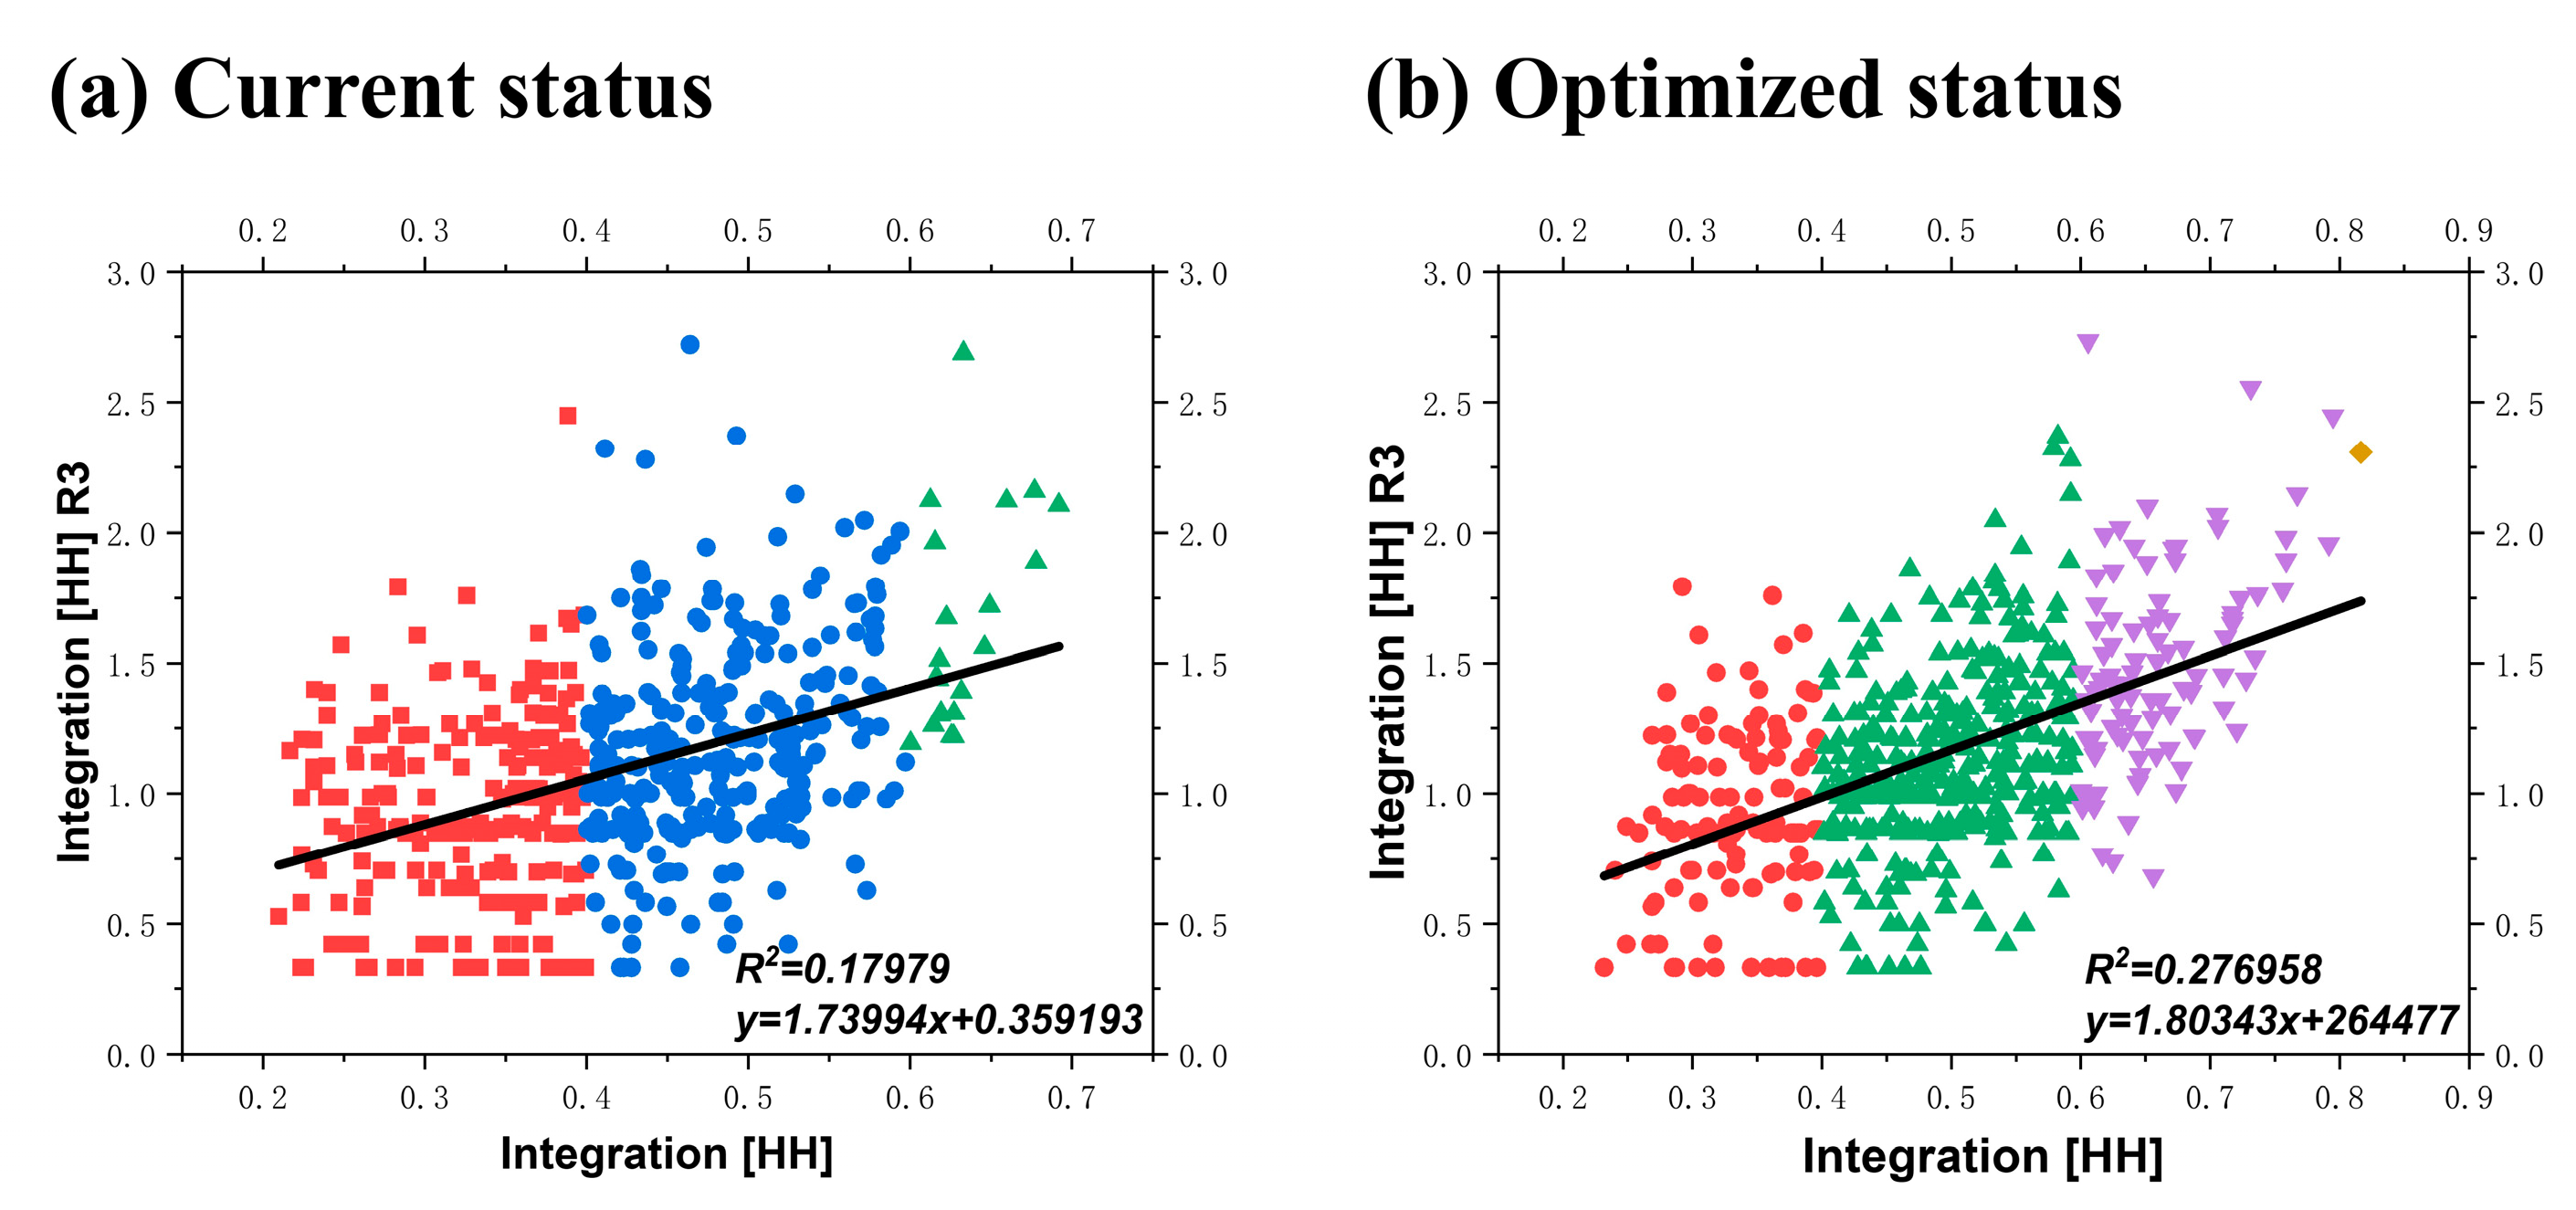
3.1.3. Synergy Analysis
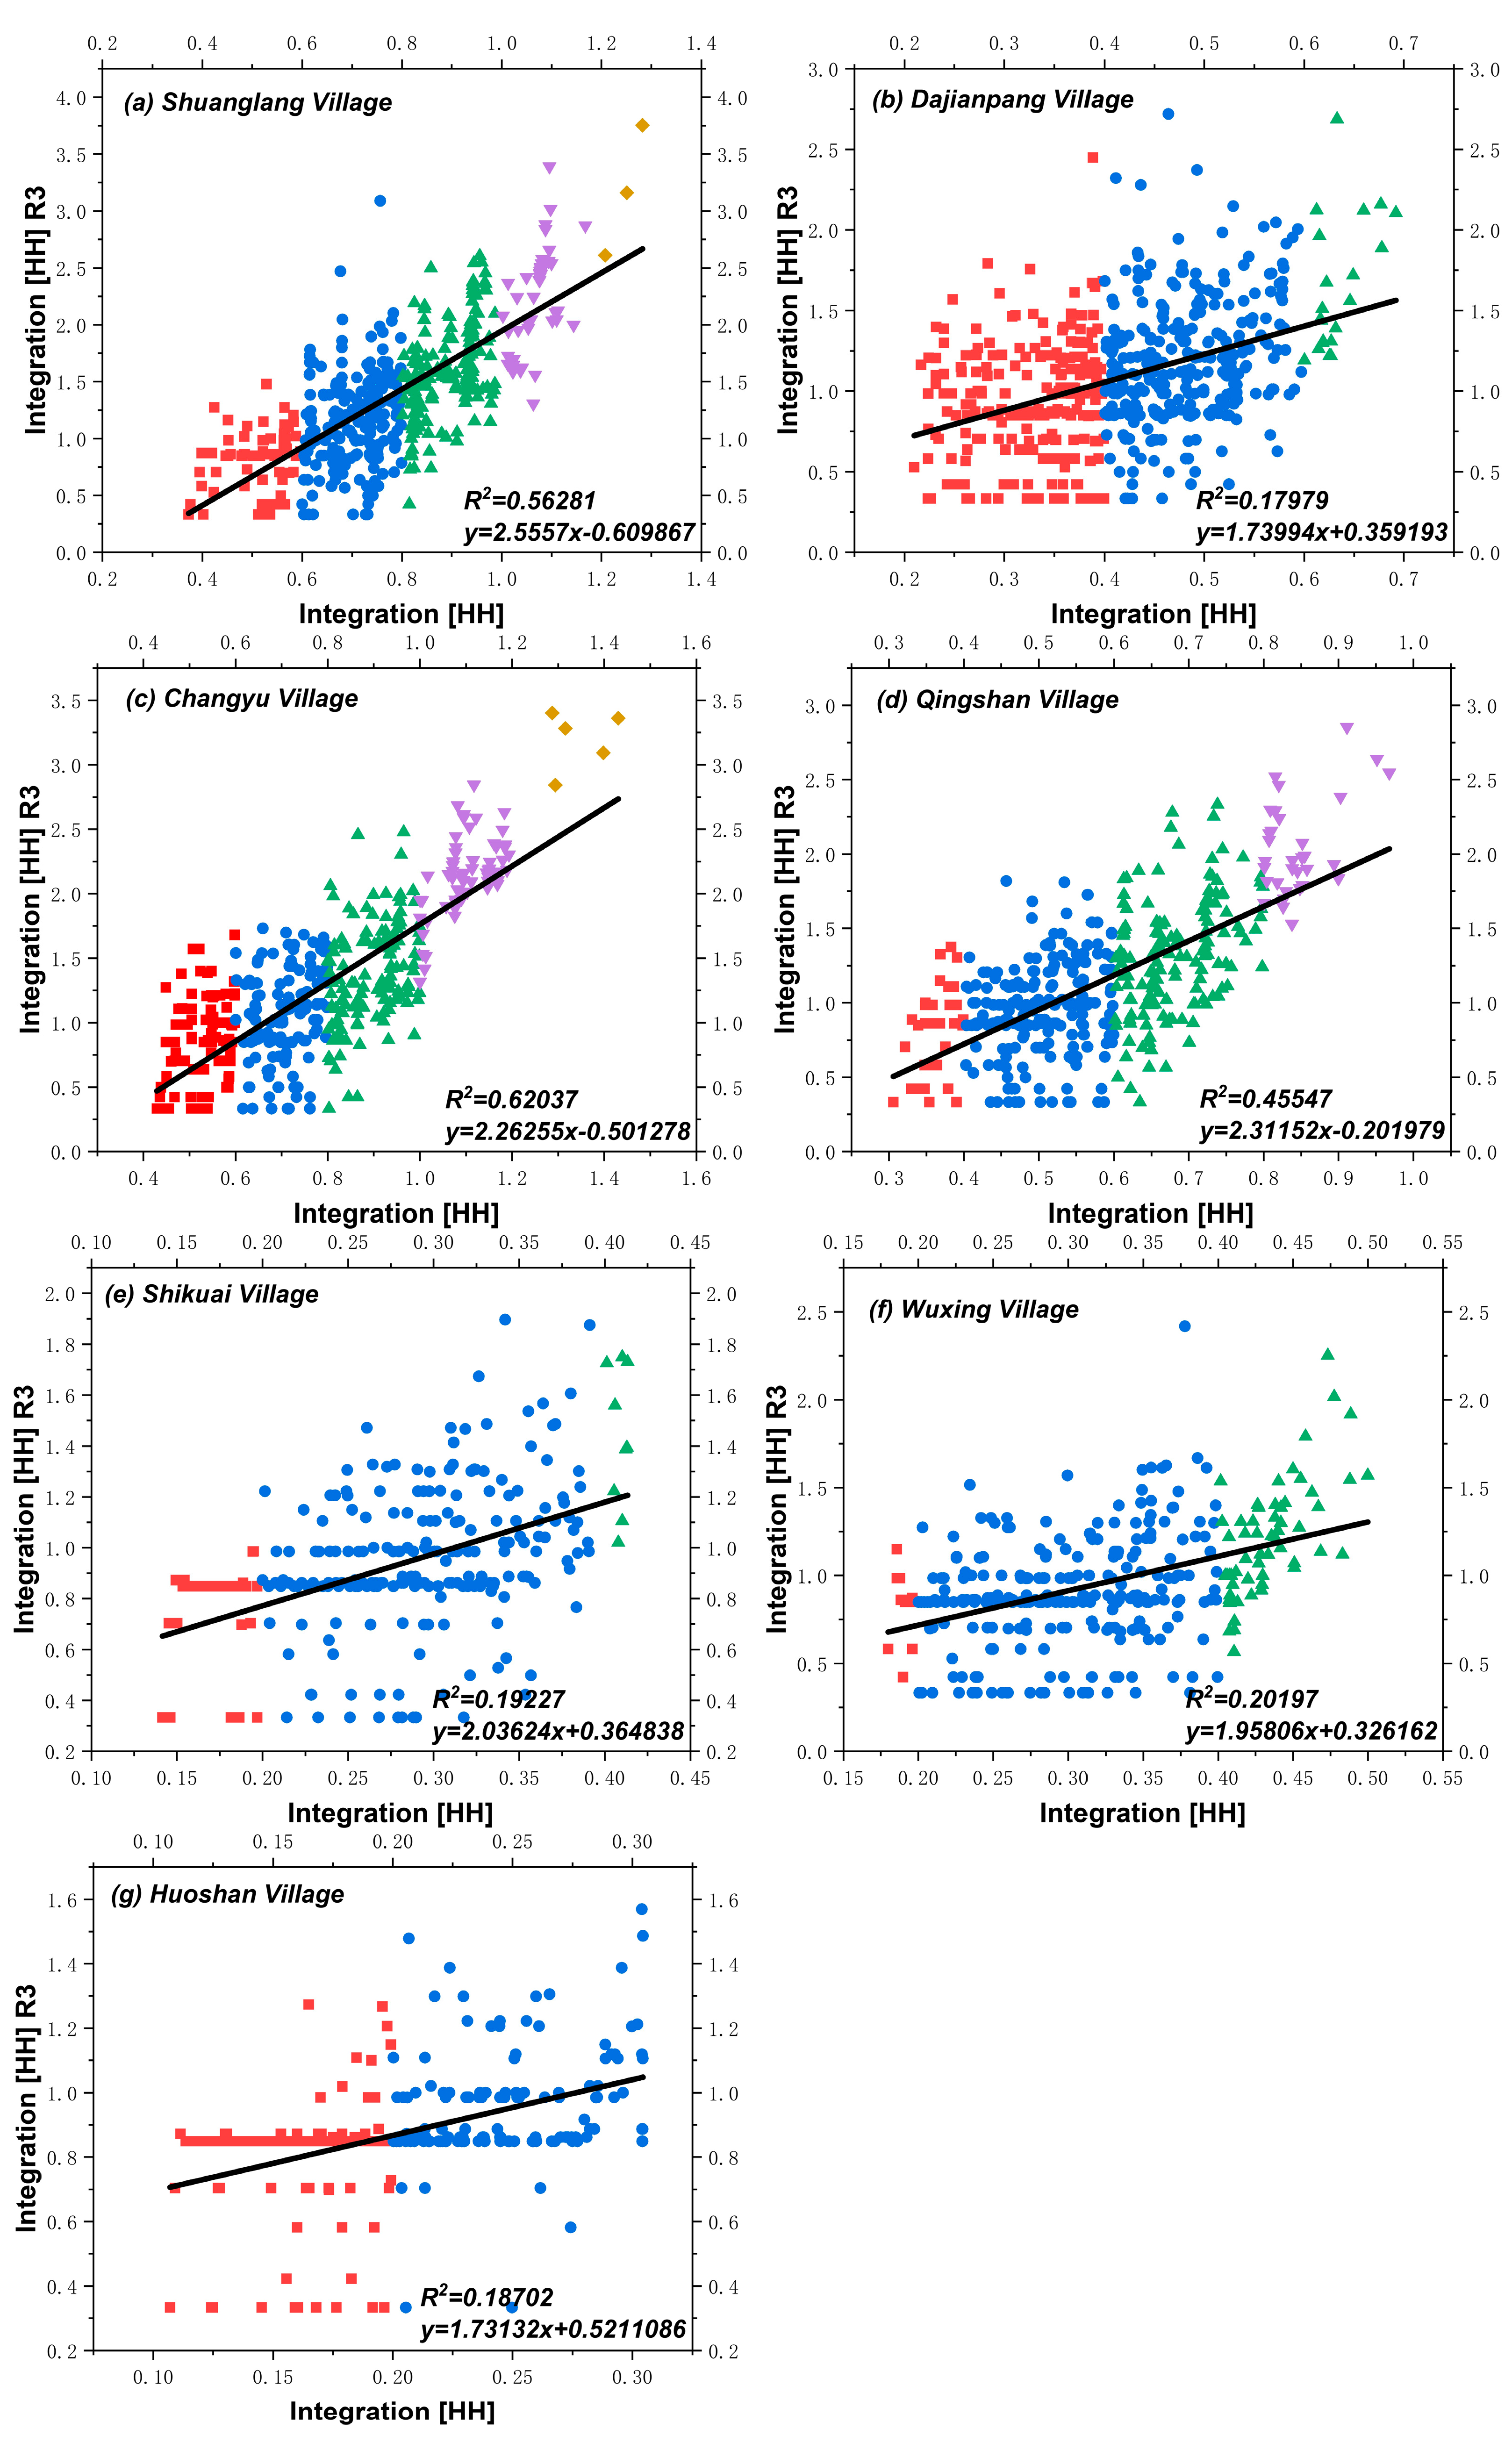
3.1.4. Intelligibility Analysis
3.2. Visual Analysis of Space Morphology Characteristics
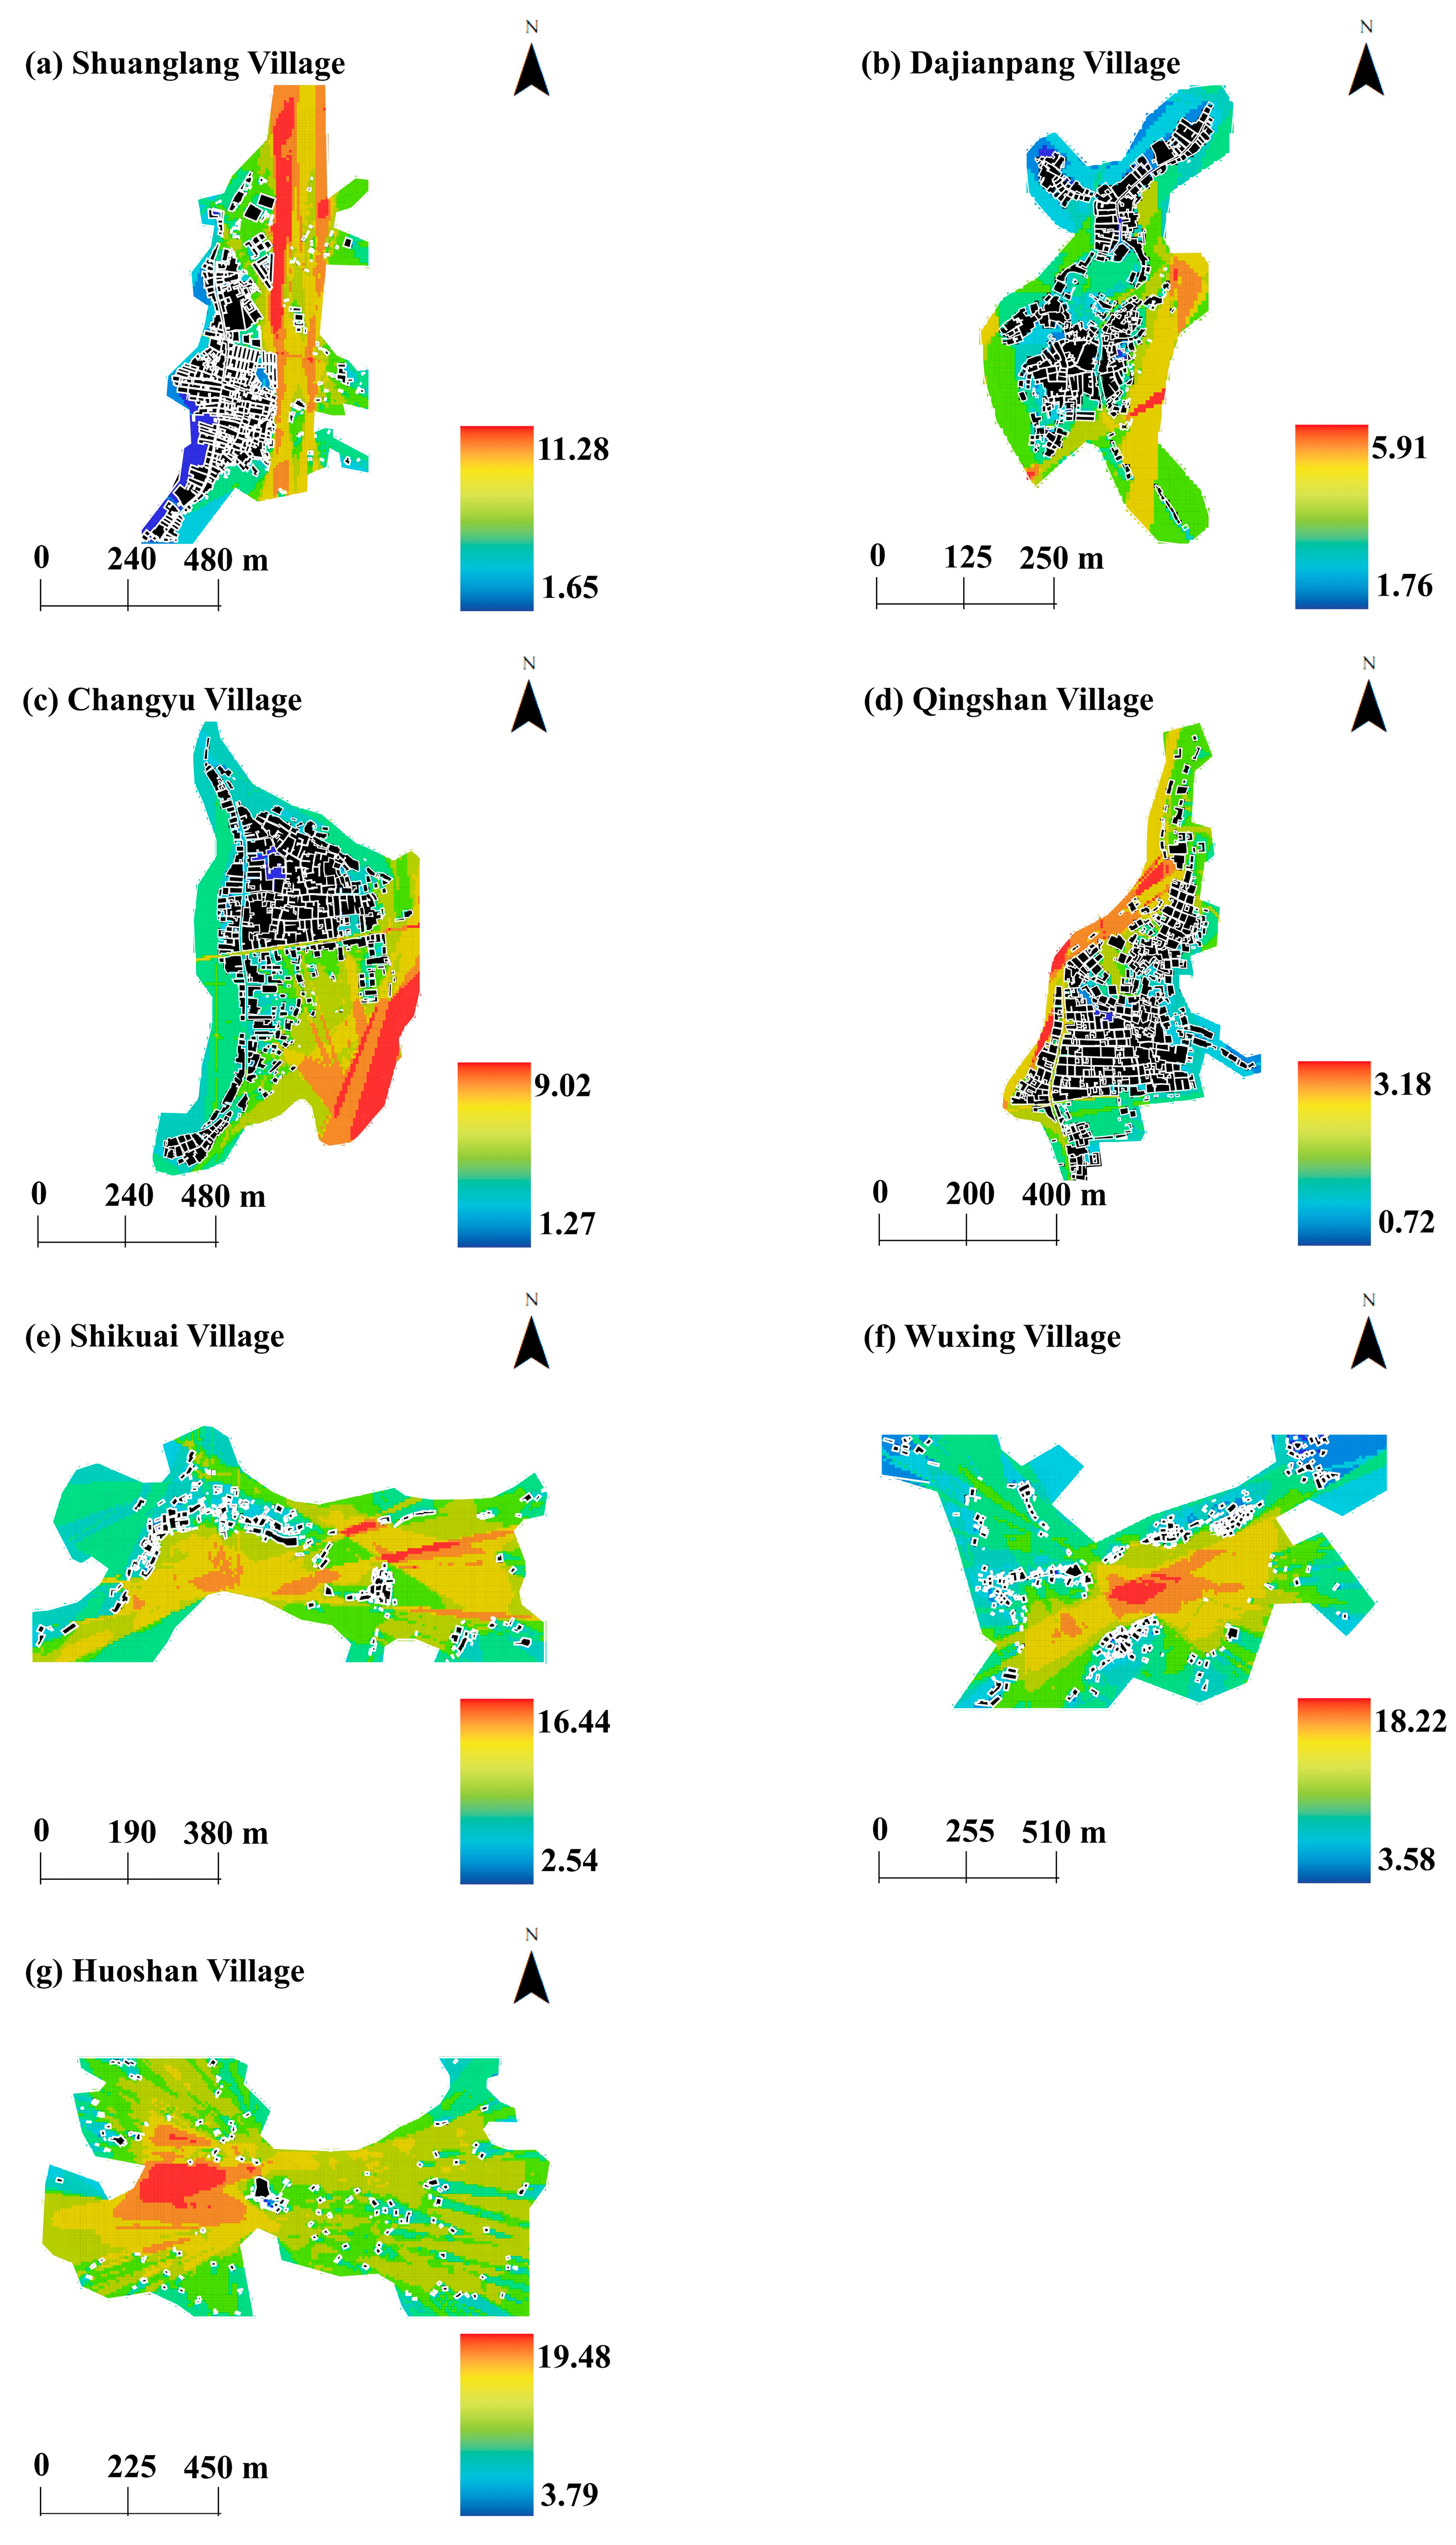
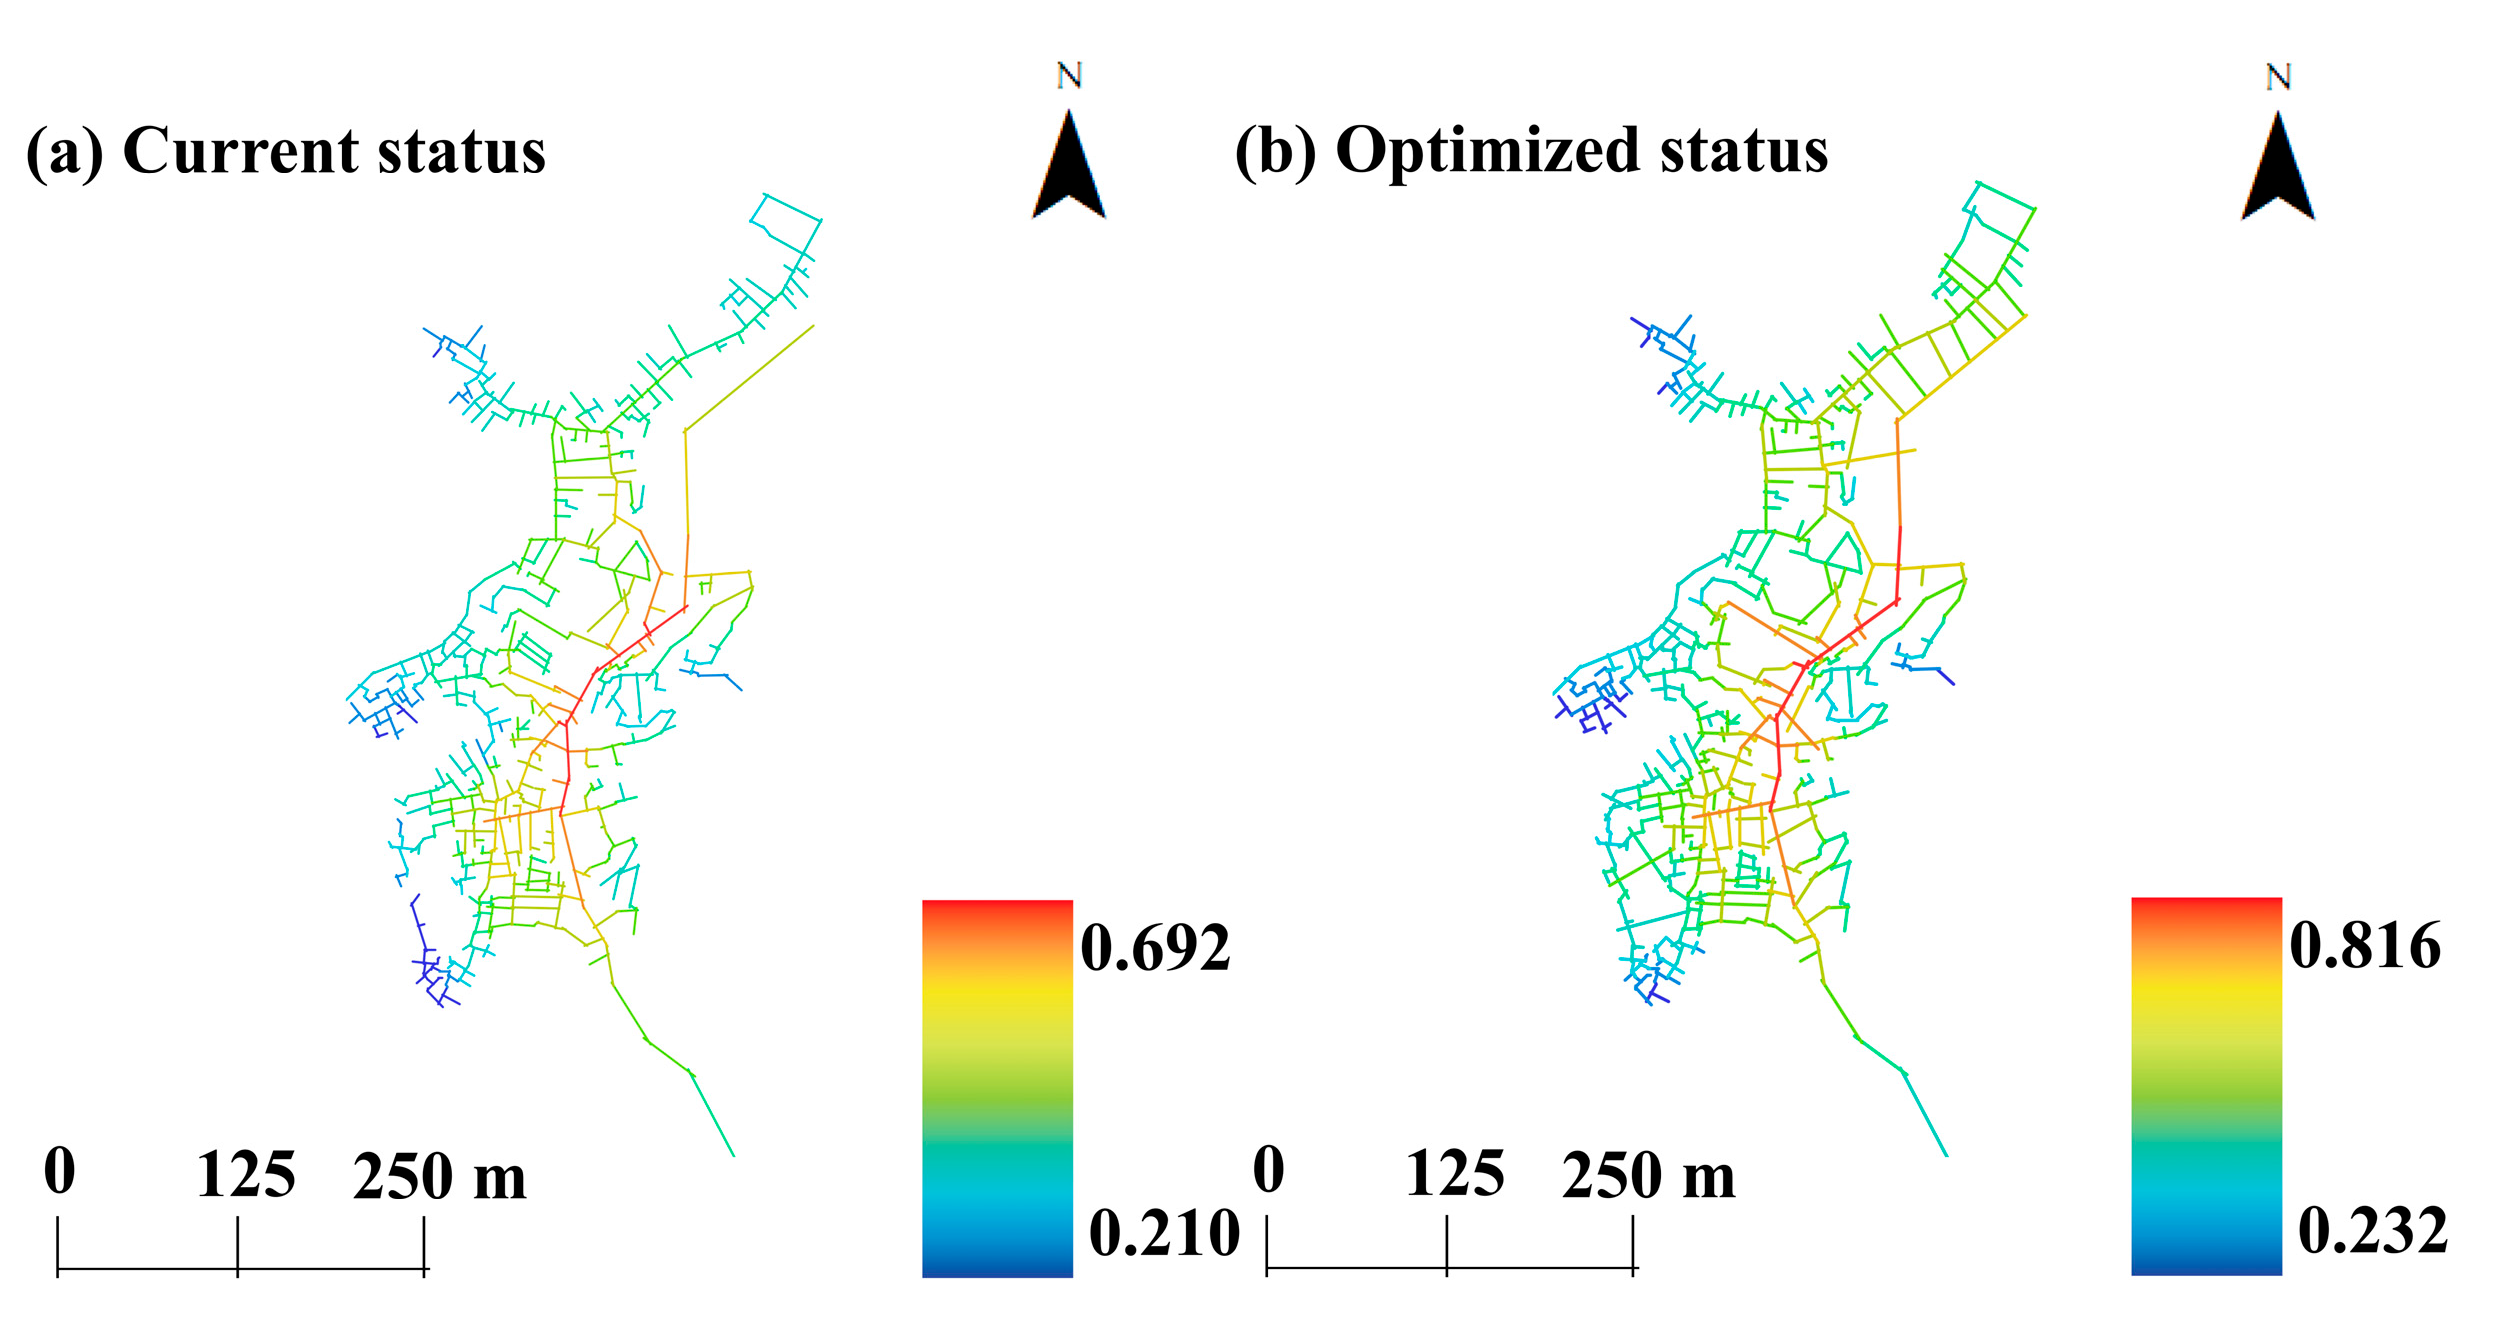
3.2.1. Visual Integration Analysis
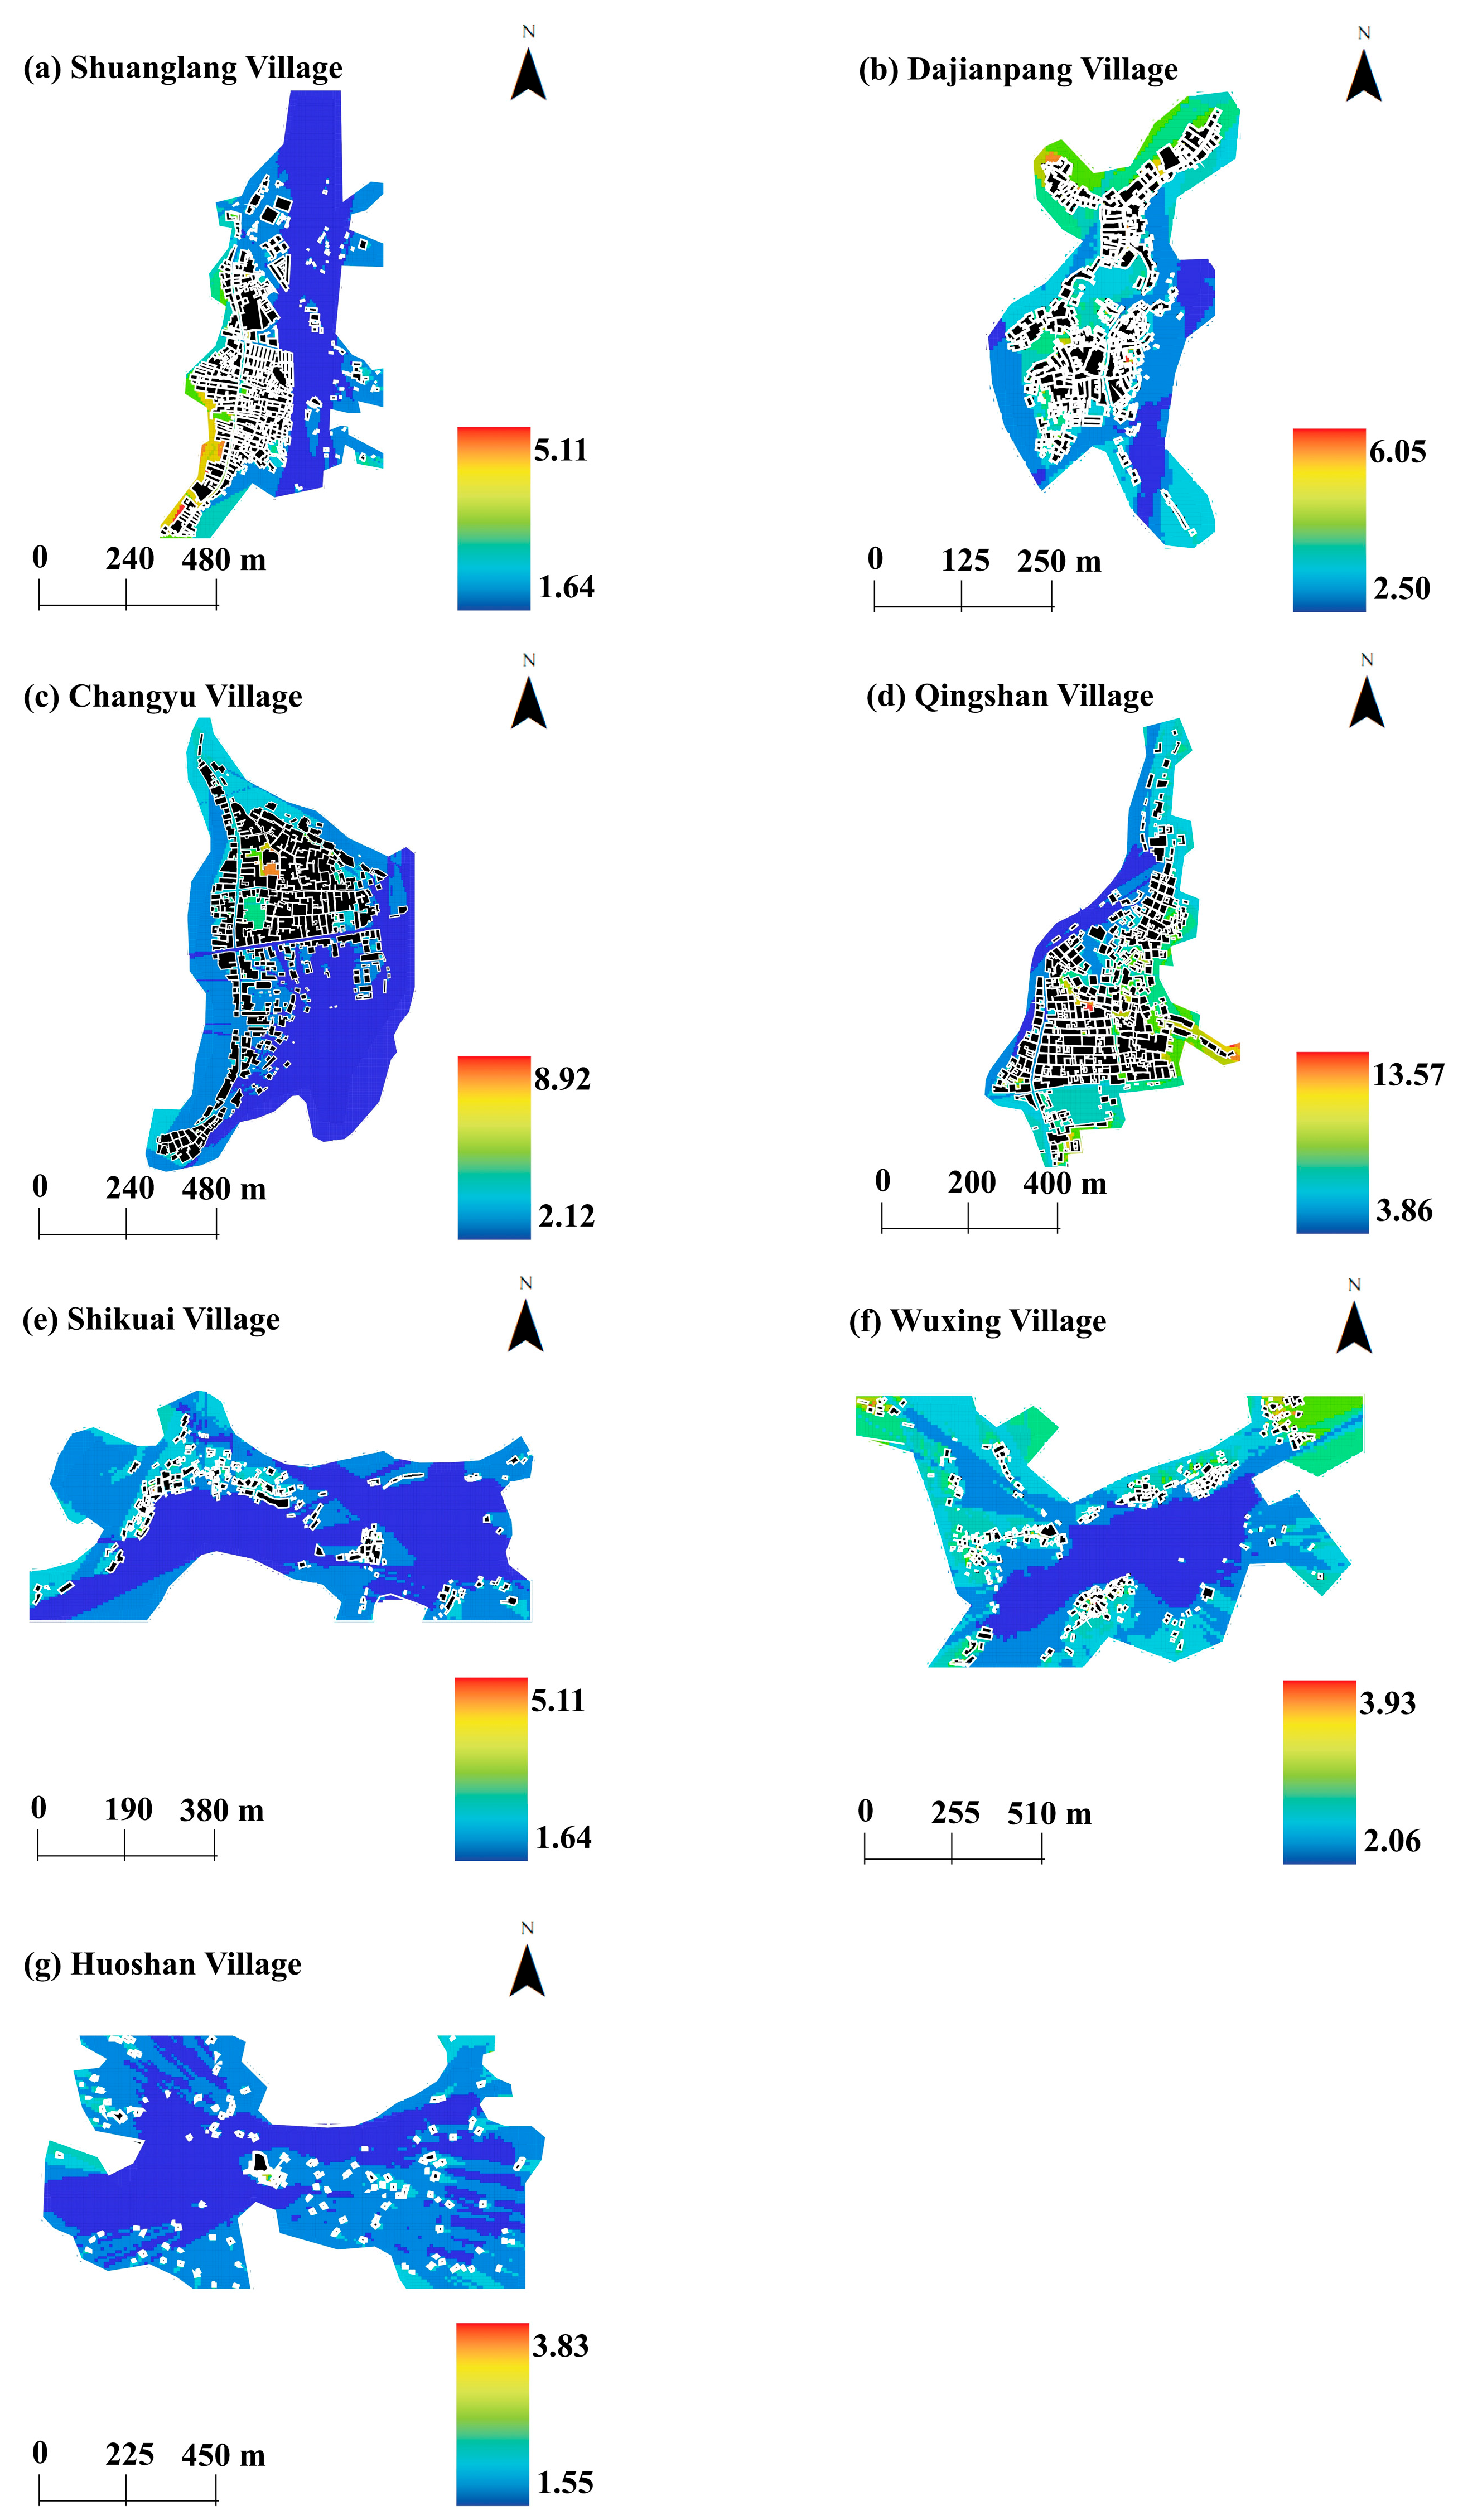
3.2.2. Visual Mean Depth Analysis
3.3. Comparative Analysis of Space Morphology Characteristic Indicators
3.3.1. Common Space Morphology Characteristics of Ethnic Minority Villages
3.3.2. Different Space Morphology Characteristics of Ethnic Minority Villages
3.4. Factor Analysis of Spatial Population Vitality
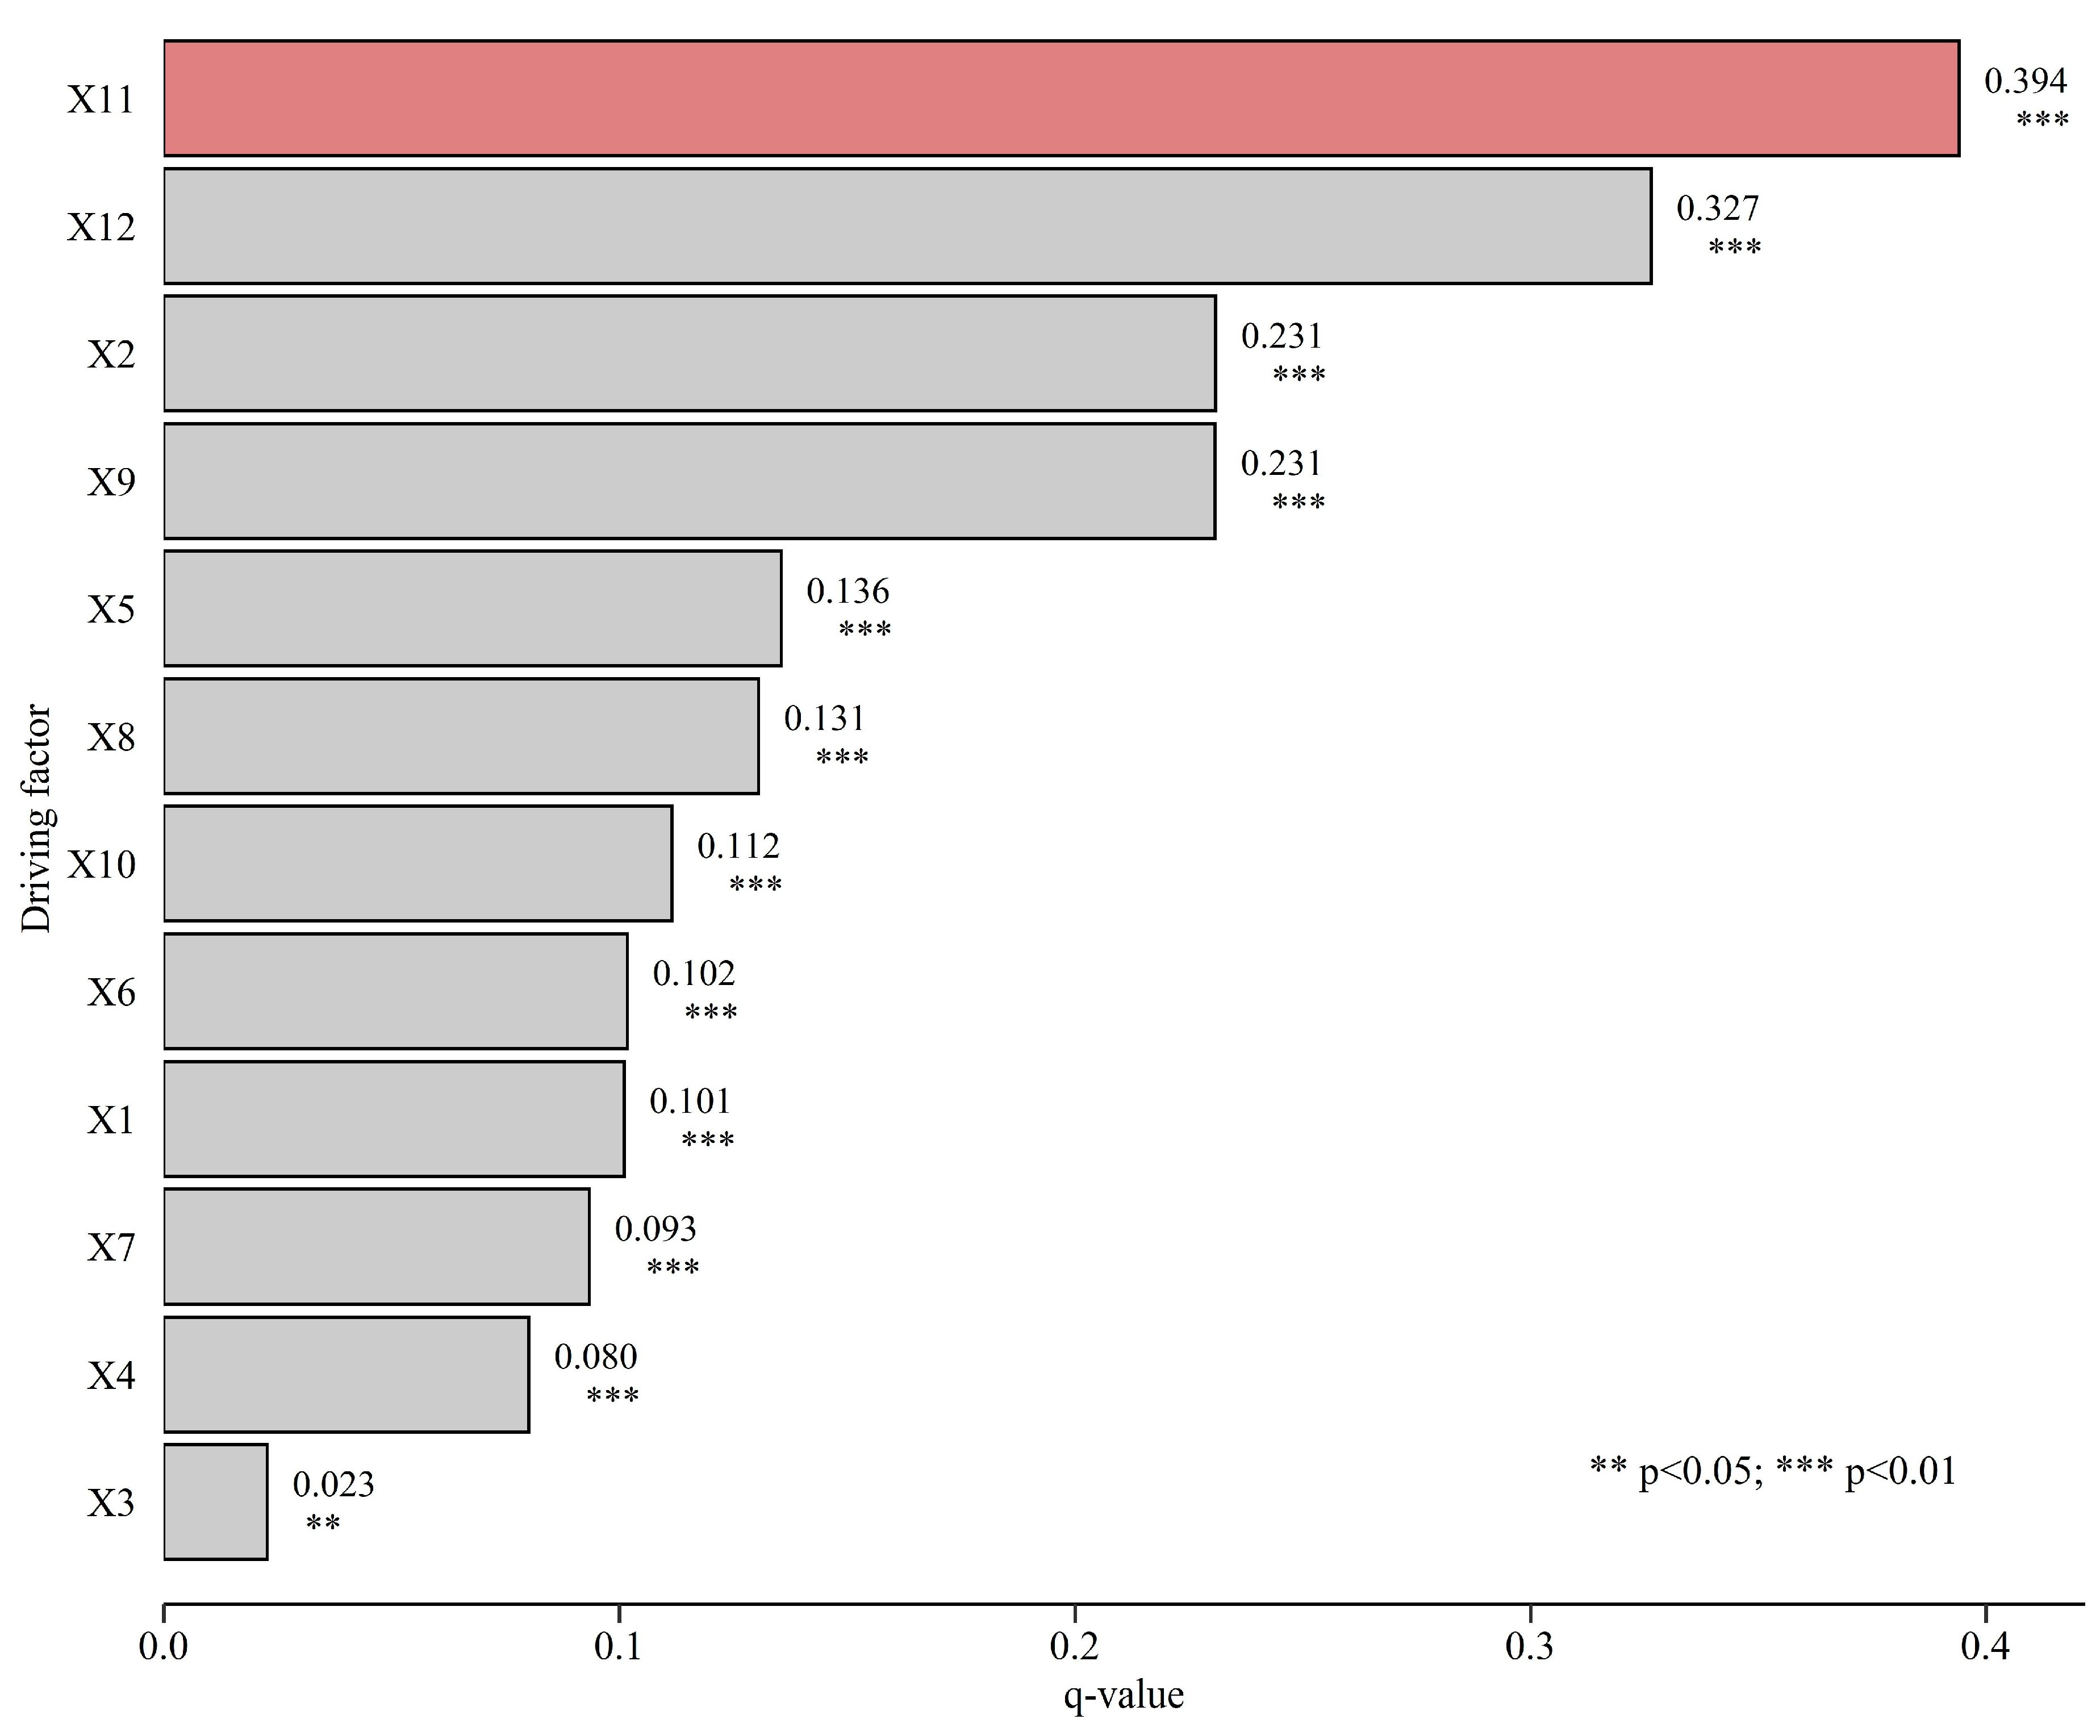
3.4.1. Driving Factors of Spatial Population Vitality
3.4.2. Interaction Factors of Spatial Population Vitality
4. Discussion
4.1. Space Morphology Optimizing Strategies
4.2. Space Vitality Improving Strategies
4.3. Cultural Heritage Revitalizing Strategies
5. Conclusions
- (1)
- The rural spatial pattern in this multi-ethnic settlement area, dominated by the Bai people, is deeply influenced by natural and human factors such as topography, water system distribution, agricultural production methods, and ethnic cultural traditions, presenting unique heterogeneous characteristics. This enriches the research content of rural geography.
- (2)
- Space syntax analysis reveals significant differences among the villages in indicators like global integration, local integration, and connectivity, reflecting the differentiation characteristics of spatial centrality, connectivity, and synergy. The spatial structures of ancient villages are relatively compact, while the layouts of newer villages are relatively loose.
- (3)
- The optimal parameters-based geographical detector analysis further identifies the key influencing factors and their interactive mechanisms affecting the spatial perception of rural settlements. Factors like topographic conditions, road accessibility, land use patterns, and tourism resource endowments have significant shaping effects, with certain nonlinear enhancement effects between them.
- (4)
- Based on the research findings, this paper proposes targeted rural spatial optimization strategies, including optimizing village spatial structure, improving tourism service facilities, promoting integrated industrial development, and inheriting ethnic cultural characteristics. These suggestions have reference value for regional rural revitalization and the integrated development of culture and tourism.
Author Contributions
Funding
Data Availability Statement
Acknowledgments
Conflicts of Interest
References
- Hudson, J.C. A Location Theory for Rural Settlement. Ann. Assoc. Am. Geogr. 1969, 59, 365–381. [Google Scholar] [CrossRef]
- Graham-Campbell, J.; Valor, M. The Archaeology of Medieval Europe 1: The Eighth to Twelfth Centuries AD; Aarhus Universitetsforlag: Aarhus, Denmark, 2007; ISBN 978-87-7124-427-4. [Google Scholar]
- Zhou, G.; He, Y.; Tang, C.; Yu, T.; Xiao, G.; Zhong, T. Dynamic Mechanism and Present Situation of Rural Settlement Evolution in China. J. Geog. Sci. 2013, 23, 513–524. [Google Scholar] [CrossRef]
- Chisholm, M. Rural Settlement and Land Use; Transaction Publishers: Piscataway, NJ, USA, 1979; ISBN 978-0-202-36867-2. [Google Scholar]
- Hamerow, H.; Hinton, D.A.; Crawford, S. The Oxford Handbook of Anglo-Saxon Archaeology; OUP: Oxford, UK, 2011; ISBN 978-0-19-921214-9. [Google Scholar]
- Pedak, M. The Effect of Tourism on GDP. Bachelor Thesis, Jönköping University, Jönköping, Sweden, 2018. [Google Scholar]
- Castro-Nuño, M.; Molina-Toucedo, J.A.; Pablo-Romero, M.P. Tourism and GDP: A Meta-Analysis of Panel Data Studies. J. Travel Res. 2013, 52, 745–758. [Google Scholar] [CrossRef]
- Gao, S.; Huang, S.; Huang, Y. Rural Tourism Development in China. Int. J. Tour. Res. 2009, 11, 439–450. [Google Scholar] [CrossRef]
- Wilson, S.; Fesenmaier, D.R.; Fesenmaier, J.; Van Es, J.C. Factors for Success in Rural Tourism Development. J. Travel Res. 2001, 40, 132–138. [Google Scholar] [CrossRef]
- Popkin, S. The Rational Peasant. Theor Soc. 1980, 9, 411–471. [Google Scholar] [CrossRef]
- Li, Z.; Yang, M.; Zhou, X.; Li, Z.; Li, H.; Zhai, F.; Zhang, Y.; Zhang, Y. Research on the Spatial Correlation and Formation Mechanism between Traditional Villages and Rural Tourism. Sci. Rep. 2023, 13, 8210. [Google Scholar] [CrossRef] [PubMed]
- Woods, M. Rural Geography III: Rural Futures and the Future of Rural Geography. Prog. Hum. Geog. 2012, 36, 125–134. [Google Scholar] [CrossRef]
- Woods, M. Rural Geography: Blurring Boundaries and Making Connections. Prog. Hum. Geog. 2009, 33, 849–858. [Google Scholar] [CrossRef]
- McCarthy, J. Rural Geography: Globalizing the Countryside. Prog. Hum. Geog. 2008, 32, 129–137. [Google Scholar] [CrossRef]
- Wang, J.; Zhang, Y. Analysis on the Evolution of Rural Settlement Pattern and Its Influencing Factors in China from 1995 to 2015. Land 2021, 10, 1137. [Google Scholar] [CrossRef]
- Chen, S.; Mehmood, M.S.; Liu, S.; Gao, Y. Spatial Pattern and Influencing Factors of Rural Settlements in Qinba Mountains, Shaanxi Province, China. Sustainability 2022, 14, 10095. [Google Scholar] [CrossRef]
- Li, X.; Li, H.; Zhang, Y.; Yang, L. Spatial Patterns and the Regional Differences of Rural Settlements in Jilin Province, China. Sustainability 2017, 9, 2170. [Google Scholar] [CrossRef]
- Tian, G.; Qiao, Z.; Gao, X. Rural Settlement Land Dynamic Modes and Policy Implications in Beijing Metropolitan Region, China. Habitat Int. 2014, 44, 237–246. [Google Scholar] [CrossRef]
- Oberai, A.S. Land Settlement Policies and Population Redistribution in Developing Countries: Performance, Problems and Prospects. Int. Lab. Rev. 1986, 125, 141. [Google Scholar]
- Li, Y. Urban–Rural Interaction Patterns and Dynamic Land Use: Implications for Urban–Rural Integration in China. Reg. Environ. Chang. 2012, 12, 803–812. [Google Scholar] [CrossRef]
- He, J.; Li, C.; Huang, J.; Liu, D.; Yu, Y. Modeling Urban Spatial Expansion Considering Population Migration Interaction in Ezhou, Central China. J. Urban Plann. Dev. 2019, 145, 05019003. [Google Scholar] [CrossRef]
- Zhong, J.; Liu, S.; Huang, M.; Cao, S.; Yu, H. Driving Forces for the Spatial Reconstruction of Rural Settlements in Mountainous Areas Based on Structural Equation Models: A Case Study in Western China. Land 2021, 10, 913. [Google Scholar] [CrossRef]
- Bi, G.; Yang, Q. Spatial Reconstruction of Rural Settlements Based on Multidimensional Suitability: A Case Study of Pingba Village, China. Land 2022, 11, 1299. [Google Scholar] [CrossRef]
- Yang, R.; Xu, Q.; Long, H. Spatial Distribution Characteristics and Optimized Reconstruction Analysis of China’s Rural Settlements during the Process of Rapid Urbanization. J. Rural. Stud. 2016, 47, 413–424. [Google Scholar] [CrossRef]
- Batty, M. A New Theory of Space Syntax; Centre for Advanced Spatial Analysis (UCL): London, UK, 2004. [Google Scholar]
- Penn, A. Space Syntax and Spatial Cognition: Or Why the Axial Line? Environ. Behav. 2003, 35, 30–65. [Google Scholar] [CrossRef]
- Atakara, C.; Allahmoradi, M. Investigating the Urban Spatial Growth by Using Space Syntax and GIS—A Case Study of Famagusta City. ISPRS Int. J. Geo-Inf. 2021, 10, 638. [Google Scholar] [CrossRef]
- Pafka, E.; Dovey, K.; Aschwanden, G.D. Limits of Space Syntax for Urban Design: Axiality, Scale and Sinuosity. Environ. Plan. B Urban Anal. City Sci. 2020, 47, 508–522. [Google Scholar] [CrossRef]
- Read, S. Space Syntax and the Dutch City. Environ. Plan. B Plan. Des. 1999, 26, 251–264. [Google Scholar] [CrossRef]
- Lerman, Y.; Rofè, Y.; Omer, I. Using Space Syntax to Model Pedestrian Movement in Urban Transportation Planning. Geogr. Anal. 2014, 46, 392–410. [Google Scholar] [CrossRef]
- Xu, K.; Chai, X.; Jiang, R.; Chen, Y. Quantitative Comparison of Space Syntax in Regional Characteristics of Rural Architecture: A Study of Traditional Rural Houses in Jinhua and Quzhou, China. Buildings 2023, 13, 1507. [Google Scholar] [CrossRef]
- Ding, J.; Gao, Z.; Ma, S. Understanding Social Spaces in Tourist Villages through Space Syntax Analysis: Cases of Villages in Huizhou, China. Sustainability 2022, 14, 12376. [Google Scholar] [CrossRef]
- Li, R.; Mao, L. Spatial Characteristics of Suburban Villages Based on Spatial Syntax. Sustainability 2022, 14, 14195. [Google Scholar] [CrossRef]
- Dunnell, R.C.; Dancey, W.S. 7-the Siteless Survey: A Regional Scale Data Collection Strategy. In Advances in Archaeological Method and Theory; Schiffer, M.B., Ed.; Academic Press: San Diego, CA, USA, 1983; pp. 267–287. ISBN 978-0-12-003106-1. [Google Scholar]
- Tate, A.; Smallwood, C. Comparing the Efficiency of Paper-Based and Electronic Data Capture during Face-to-Face Interviews. PLoS ONE 2021, 16, e0247570. [Google Scholar] [CrossRef] [PubMed]
- Cunha, D.; Kastenholz, E.; Lane, B. Challenges for Collecting Questionnaire-Based Onsite Survey Data in a Niche Tourism Market Context: The Case of Wine Tourism in Rural Areas. Sustainability 2021, 13, 12251. [Google Scholar] [CrossRef]
- An, Y.; Liu, L.; Guo, Y.; Wu, X.; Liu, P. An Analysis of the Isomerism of Tibetan Vernacular Dwellings Based on Space Syntax: A Case Study of the Semi-Agricultural and Semi-Pastoral District in Gannan Prefecture, China. Buildings 2023, 13, 2501. [Google Scholar] [CrossRef]
- Wang, X.; Zhu, R.; Che, B. Spatial Optimization of Tourist-Oriented Villages by Space Syntax Based on Population Analysis. Sustainability 2022, 14, 11260. [Google Scholar] [CrossRef]
- Tang, J.; Sui, L. Geodetector-Based Livability Analysis of Potential Resettlement Locations for Villages in Coal Mining Areas on the Loess Plateau of China. Sustainability 2022, 14, 8365. [Google Scholar] [CrossRef]
- Wang, J.; Li, X.; Christakos, G.; Liao, Y.; Zhang, T.; Gu, X.; Zheng, X. Geographical Detectors-Based Health Risk Assessment and Its Application in the Neural Tube Defects Study of the Heshun Region, China. Int. J. Geogr. Inf. Sci. 2010, 24, 107–127. [Google Scholar] [CrossRef]
- Qanazi, S.; Hijazi, I.H.; Shahrour, I.; Meouche, R.E. Exploring Urban Service Location Suitability: Mapping Social Behavior Dynamics with Space Syntax Theory. Land 2024, 13, 609. [Google Scholar] [CrossRef]
- Lei, Y.; Zhou, H.; Xue, L.; Yuan, L.; Liu, Y.; Wang, M.; Wang, C. Evaluating and Comparing Human Perceptions of Streets in Two Megacities by Integrating Street-View Images, Deep Learning, and Space Syntax. Buildings 2024, 14, 1847. [Google Scholar] [CrossRef]
- Liao, T.; Li, D.; Wan, Q. Tradeoff of Exploitation-Protection and Suitability Evaluation of Low-Slope Hilly from the Perspective of “Production-Living-Ecological” Optimization. Phys. Chem. Earth Parts A/B/C 2020, 120, 102943. [Google Scholar] [CrossRef]
- Wang, M.; Wu, Y.; Wang, Y.; Li, C.; Wu, Y.; Gao, B.; Wang, M. Study on the Spatial Heterogeneity of the Impact of Forest Land Change on Landscape Ecological Risk: A Case Study of Erhai Rim Region in China. Forests 2023, 14, 1427. [Google Scholar] [CrossRef]
- Yang, R.; Yang, D. Traditioanl Settlements Study on Sciences of Human Settlements in Erhai Lake Region. Iop. Conf. Ser. Mater. Sci. Eng. 2019, 592, 12170. [Google Scholar] [CrossRef]
- Dettlaff, W. Space Syntax Analysis–Methodology of Understanding the Space. PhD Interdiscip. J. 2014, 1, 283–291. [Google Scholar]
- Cen, K.; Rao, X.; Mao, Z.; Zheng, X.; Dong, D. A Comparative Study on the Spatial Layout of Hui-Style and Wu-Style Traditional Dwellings and Their Culture Based on Space Syntax. Sustainability 2023, 15, 12398. [Google Scholar] [CrossRef]
- Sharmin, S.; Kamruzzaman, M. Meta-Analysis of the Relationships between Space Syntax Measures and Pedestrian Movement. Transp. Rev. 2018, 38, 524–550. [Google Scholar] [CrossRef]
- Huang, Y.; Zhang, Z.; Fei, J.; Chen, X. Optimization Strategies of Commercial Layout of Traditional Villages Based on Space Syntax and Space Resistance Model: A Case Study of Anhui Longchuan Village in China. Buildings 2023, 13, 1016. [Google Scholar] [CrossRef]
- Jiang, B.; Claramunt, C. Integration of Space Syntax into GIS: New Perspectives for Urban Morphology. Trans. GIS 2002, 6, 295–309. [Google Scholar] [CrossRef]
- Kelkoul, L.R.; Chougui, A. Structural Qualities of Urban Space Revealed by Spatial Representation and Intelligibility Readings: The Case of Setif City, Algeria. urbe Rev. Bras. Gest. Urbana 2022, 14, e20210393. [Google Scholar] [CrossRef]
- Qin, X.; Du, X.; Wang, Y.; Liu, L. Spatial Evolution Analysis and Spatial Optimization Strategy of Rural Tourism Based on Spatial Syntax Model—A Case Study of Matao Village in Shandong Province, China. Land 2023, 12, 317. [Google Scholar] [CrossRef]
- Soltani, A.; Allan, A.; Javadpoor, M.; Lella, J. Space Syntax in Analysing Bicycle Commuting Routes in Inner Metropolitan Adelaide. Sustainability 2022, 14, 3485. [Google Scholar] [CrossRef]
- Song, Y.; Wang, J.; Ge, Y.; Xu, C. An Optimal Parameters-Based Geographical Detector Model Enhances Geographic Characteristics of Explanatory Variables for Spatial Heterogeneity Analysis: Cases with Different Types of Spatial Data. GIScience Remote Sens. 2020, 57, 593–610. [Google Scholar] [CrossRef]
- Gao, C.; Li, S.; Sun, M.; Zhao, X.; Liu, D. Exploring the Relationship between Urban Vibrancy and Built Environment Using Multi-Source Data: Case Study in Munich. Remote Sens. 2024, 16, 1107. [Google Scholar] [CrossRef]
- Wu, Y.; Zhou, L.; Meng, Y.; Lin, Q.; Fei, Y. Influential Topographic Factor Identification of Soil Heavy Metals Using GeoDetector: The Effects of DEM Resolution and Pollution Sources. Remote Sens. 2023, 15, 4067. [Google Scholar] [CrossRef]
- Bian, J.; Chen, W.; Zeng, J. Spatial Distribution Characteristics and Influencing Factors of Traditional Villages in China. Int. J. Environ. Res. Public Health 2022, 19, 4627. [Google Scholar] [CrossRef]


| Village Name | Altitude | Economic Function | Ethnic Group | Distinctive Architecture/Landscape |
|---|---|---|---|---|
| Shuanglang Village | 1970 m | Tourism, Business | Han, Bai | Zhengjue Temple, Kuixing Pavilion |
| Dajianpang Village | 1960 m | Tourism, Business | Han, Bai | Yuji Nunnery, Feiyan Temple |
| Changyu Village | 1968 m | Tourism, Business | Han, Bai | Wenchang Palace, Jinbang Temple |
| Qingshan Village | 1962 m | Tourism, Business | Han, Bai | Qingshan Cliff Stone |
| Shikuai Village | 1850 m | Agriculture (Sericulture) | Bai | Shiniu Dam |
| Wuxing Village | 1831 m | Agriculture (Pomegranate) | Han, Bai, Dai, Naxi | Benzhu Temple |
| Huoshan Village | 2540 m | Agriculture, Tourism | Bai | Pear Blossom Pond, Bai Peasant Painting Society |
| Village Name | Type | Aerial View | Axis Line Drawing | Visual Drawing |
|---|---|---|---|---|
| Shuanglang Village | Linear |  | 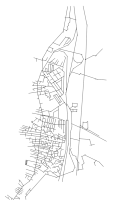 | 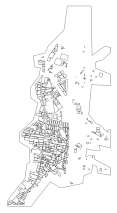 |
| Dajianpang Village | Linear |  | 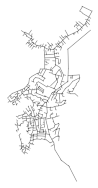 | 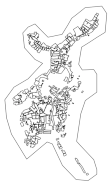 |
| Changyu Village | Linear | 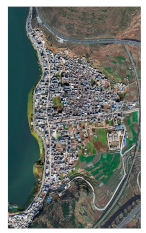 |  | 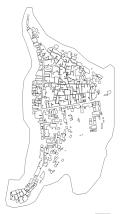 |
| Qingshan Village | Linear | 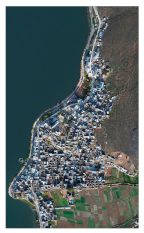 | 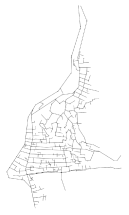 | 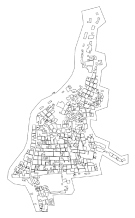 |
| Shikuai Village | Scattered | 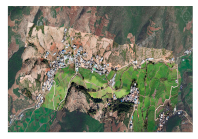 | 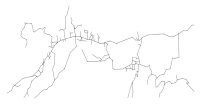 | 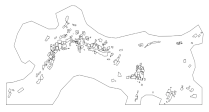 |
| Wuxing Village | Scattered | 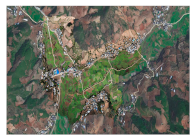 | 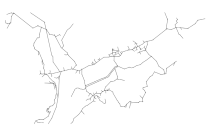 | 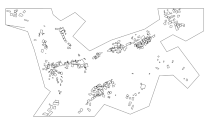 |
| Huoshan Village | Scattered | 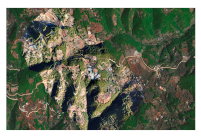 | 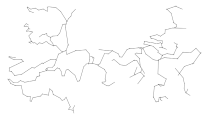 | 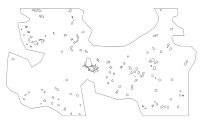 |
| Criteria | Interaction Type |
|---|---|
| q (X1∩X2) < Min (q (X1), q (X2)) | Nonlinear, weakening |
| Min(q(X1), q (X2)) < q (X1∩X2) < Max (q (X1), q (X2)) | Single variable, weakening |
| q (X1∩X2) > Max (q (X1), q (X2)) | Double variable, enhancing |
| q (X1∩X2) = q (X1) + q (X2) | Independent |
| q (X1∩X2) > q (X1) + q (X2) | Nonlinear, enhancing |
| Dimension | Factor | Resolution/m | Data Source |
|---|---|---|---|
| Elevation X1 | 30 m | https://www.gscloud.cn/ (accessed on 22 June 2023) | |
| Slope X2 | 30 m | ||
| Natural Environment | Aspect X3 | 30 m | |
| Precipitation X4 | 1000 m | https://www.resdc.cn/ (accessed on 22 June 2023) | |
| Temperature X5 | 1000 m | ||
| Socio-economy | GDP X6 | 1000 m | |
| Cultivated Land Area X7 | 30 m | ||
| Location Factors | Distance to Railway X8 | 30 m | https://www.openstreetmap.org/ (accessed on 22 June 2023) |
| Distance to County Road X9 | 30 m | ||
| Distance to Town Government X10 | 30 m | https://www.tianditu.gov.cn/ (accessed on 22 June 2023) | |
| Spatial Accessibility | Distance to Village Committee X11 | 30 m | |
| Distance to Erhai Lake X12 | 30 m |
| Village Name | No. of Axial Lines | Global Integration Value | Local Integration Value (R3) | Connectivity Value | Synergy Value | Intelligibility Value | ||||
|---|---|---|---|---|---|---|---|---|---|---|
| Max | Min | Average | Max | Min | Average | Average | Average | Average | ||
| Shuanglang Village | 603 | 1.282 | 0.372 | 0.788 | 3.753 | 0.333 | 1.403 | 2.454 | 0.563 | 0.091 |
| Dajianpang Village | 601 | 0.692 | 0.210 | 0.421 | 2.719 | 0.333 | 1.091 | 2.180 | 0.180 | 0.049 |
| Changyu Village | 487 | 1.431 | 0.429 | 0.820 | 3.402 | 0.333 | 1.353 | 2.394 | 0.620 | 0.114 |
| Qingshan Village | 443 | 0.968 | 0.306 | 0.587 | 2.854 | 0.333 | 1.155 | 2.257 | 0.455 | 0.140 |
| Shikuai Village | 225 | 0.413 | 0.142 | 0.287 | 1.896 | 0.333 | 0.949 | 2.071 | 0.193 | 0.054 |
| Wuxing Village | 335 | 0.500 | 0.180 | 0.319 | 2.418 | 0.333 | 0.951 | 2.036 | 0.202 | 0.056 |
| Huoshan Village | 261 | 0.304 | 0.107 | 0.208 | 1.569 | 0.333 | 0.881 | 2.015 | 0.187 | 0.076 |
Disclaimer/Publisher’s Note: The statements, opinions and data contained in all publications are solely those of the individual author(s) and contributor(s) and not of MDPI and/or the editor(s). MDPI and/or the editor(s) disclaim responsibility for any injury to people or property resulting from any ideas, methods, instructions or products referred to in the content. |
© 2024 by the authors. Licensee MDPI, Basel, Switzerland. This article is an open access article distributed under the terms and conditions of the Creative Commons Attribution (CC BY) license (https://creativecommons.org/licenses/by/4.0/).
Share and Cite
Sun, Y.; Zhan, H.; Gao, C.; Li, H.; Guo, X. Spatial Syntactic Analysis and Revitalization Strategies for Rural Settlements in Ethnic Minority Areas: A Case Study of Shuanglang Town, China. Buildings 2024, 14, 2531. https://doi.org/10.3390/buildings14082531
Sun Y, Zhan H, Gao C, Li H, Guo X. Spatial Syntactic Analysis and Revitalization Strategies for Rural Settlements in Ethnic Minority Areas: A Case Study of Shuanglang Town, China. Buildings. 2024; 14(8):2531. https://doi.org/10.3390/buildings14082531
Chicago/Turabian StyleSun, Yiwen, Huiwen Zhan, Chao Gao, Hang Li, and Xianhua Guo. 2024. "Spatial Syntactic Analysis and Revitalization Strategies for Rural Settlements in Ethnic Minority Areas: A Case Study of Shuanglang Town, China" Buildings 14, no. 8: 2531. https://doi.org/10.3390/buildings14082531