Experimental Investigation on Pure Torsion Behavior of Concrete Beams Reinforced with Glass Fiber-Reinforced Polymer Bars
Abstract
1. Introduction
- In a few existing torsion tests of FRP-RC members, some points could be improved. For instance, stacked rollers were also used as a torsion support which could cause additional torque. The longitudinal reinforcement was arranged asymmetrically on the cross-section, resulting in uneven stress distribution in the longitudinal bars of the upper and lower chords of the truss. The crack width and short legs of the stirrup were not measured.
- Stirrup strain limit and spiral crack angles were summarized and analyzed to provide a suggestion for torsion capacity prediction.
- A database for torsion tests of FRP-RC members was established and provided to assess the current torsion design provisions.
2. Experimental Program
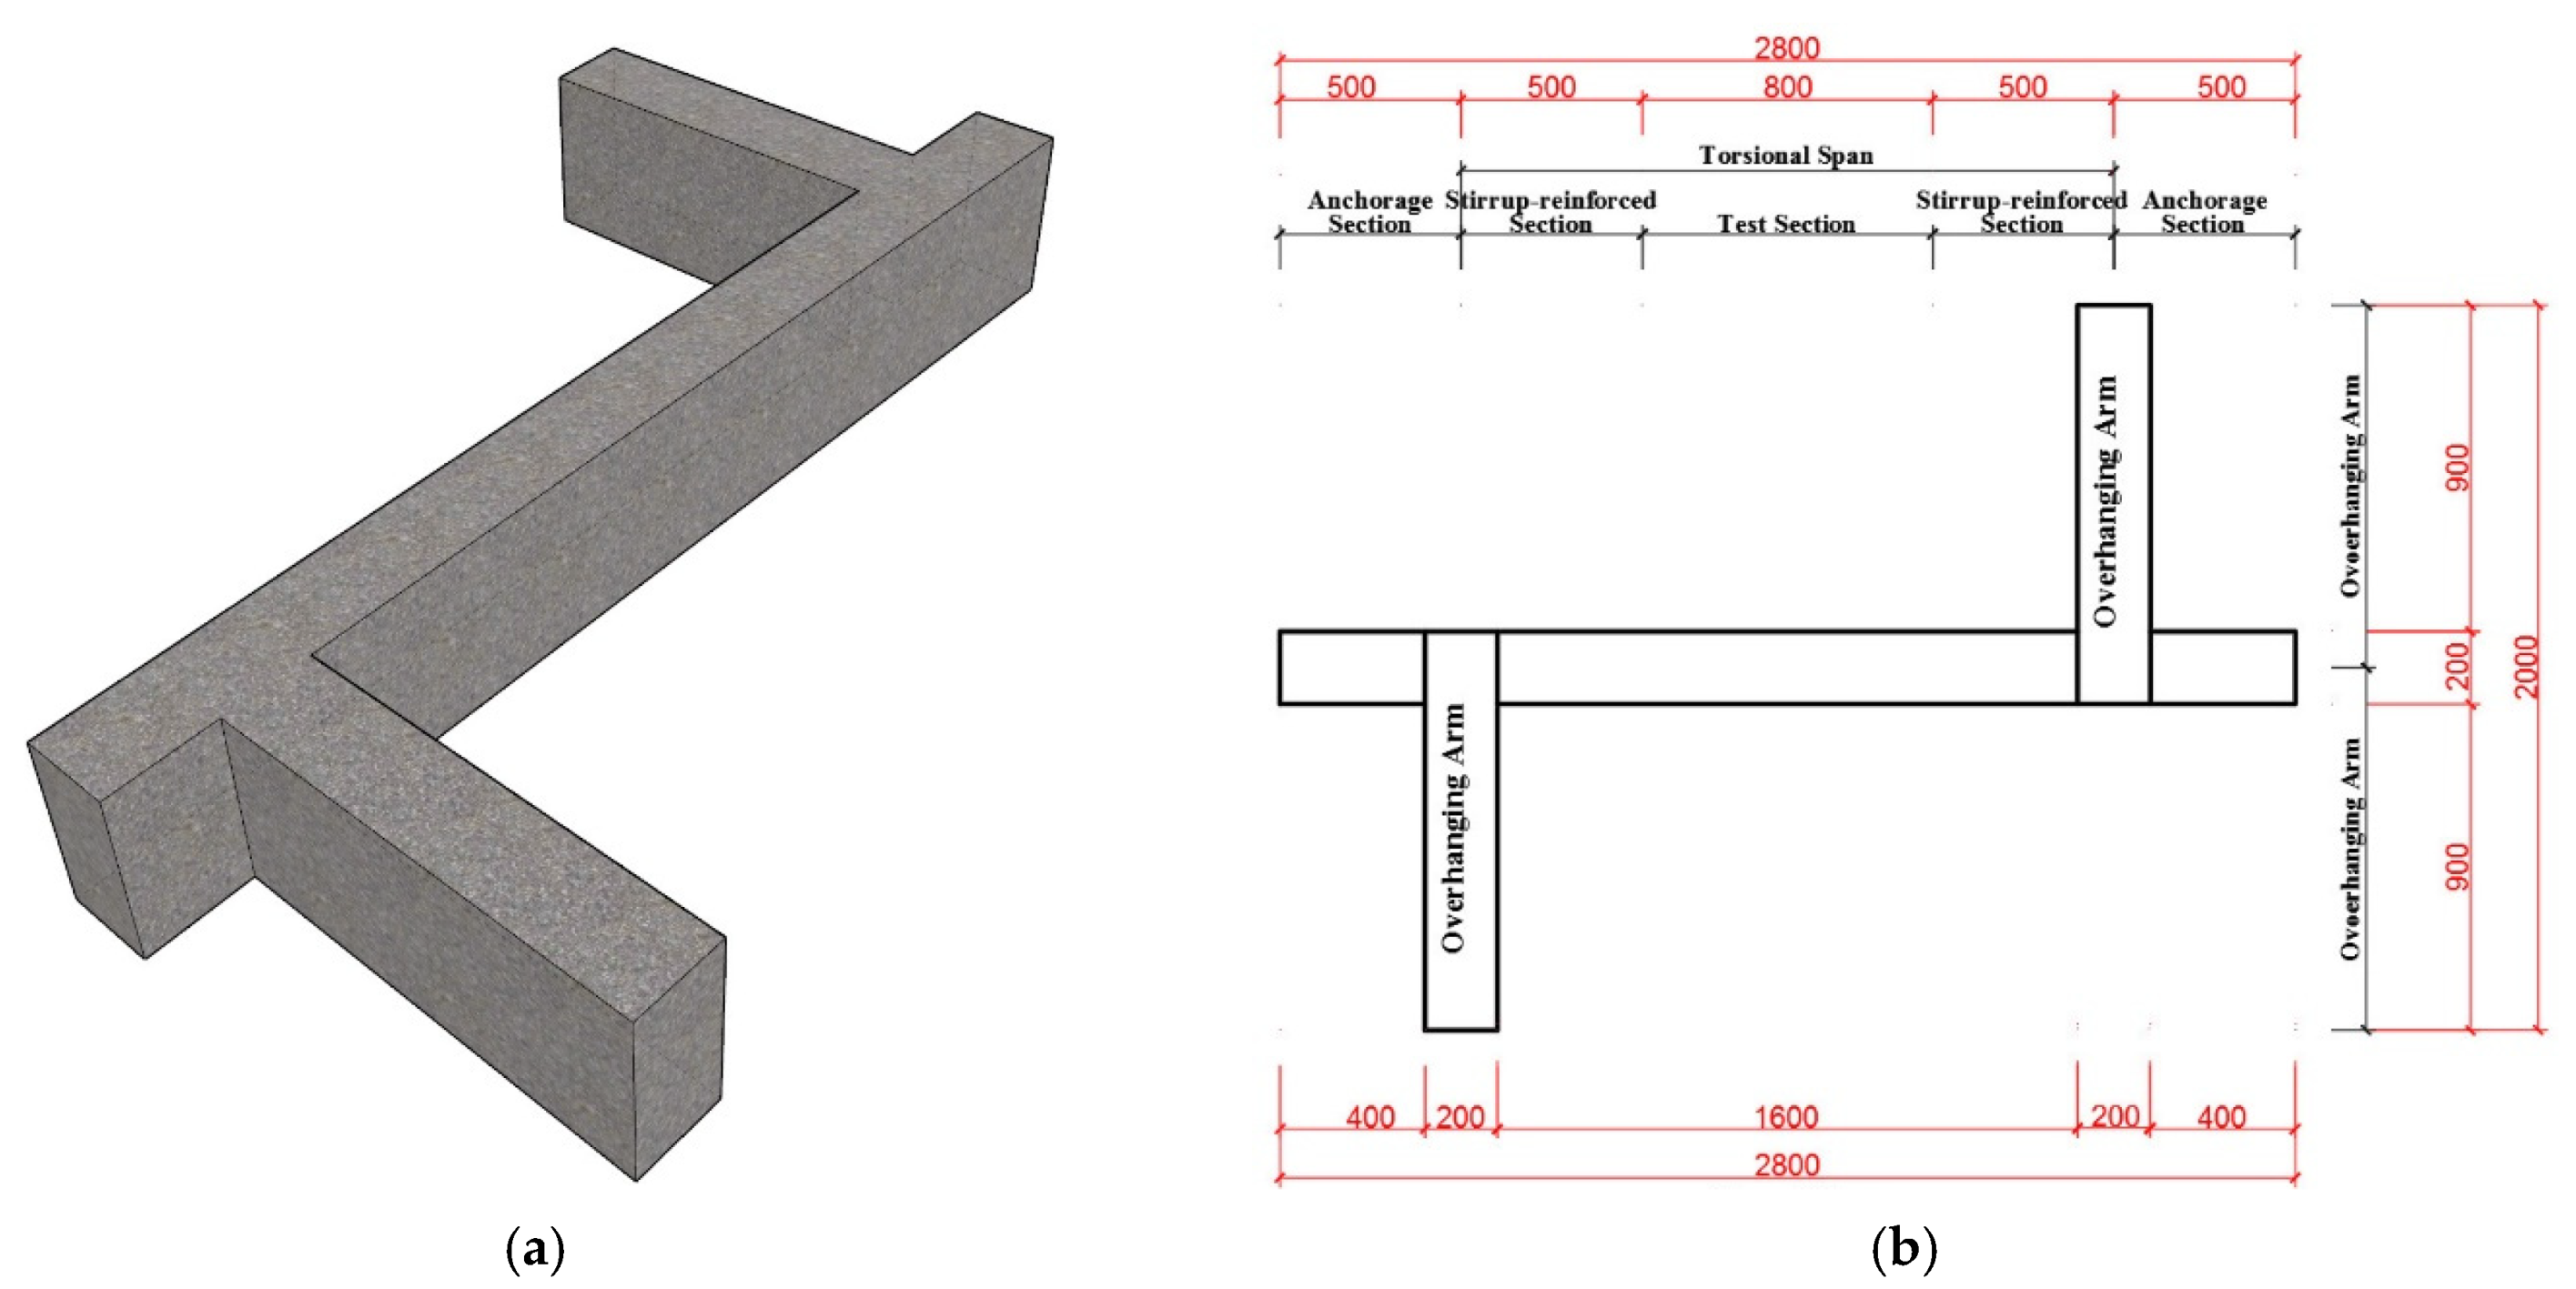
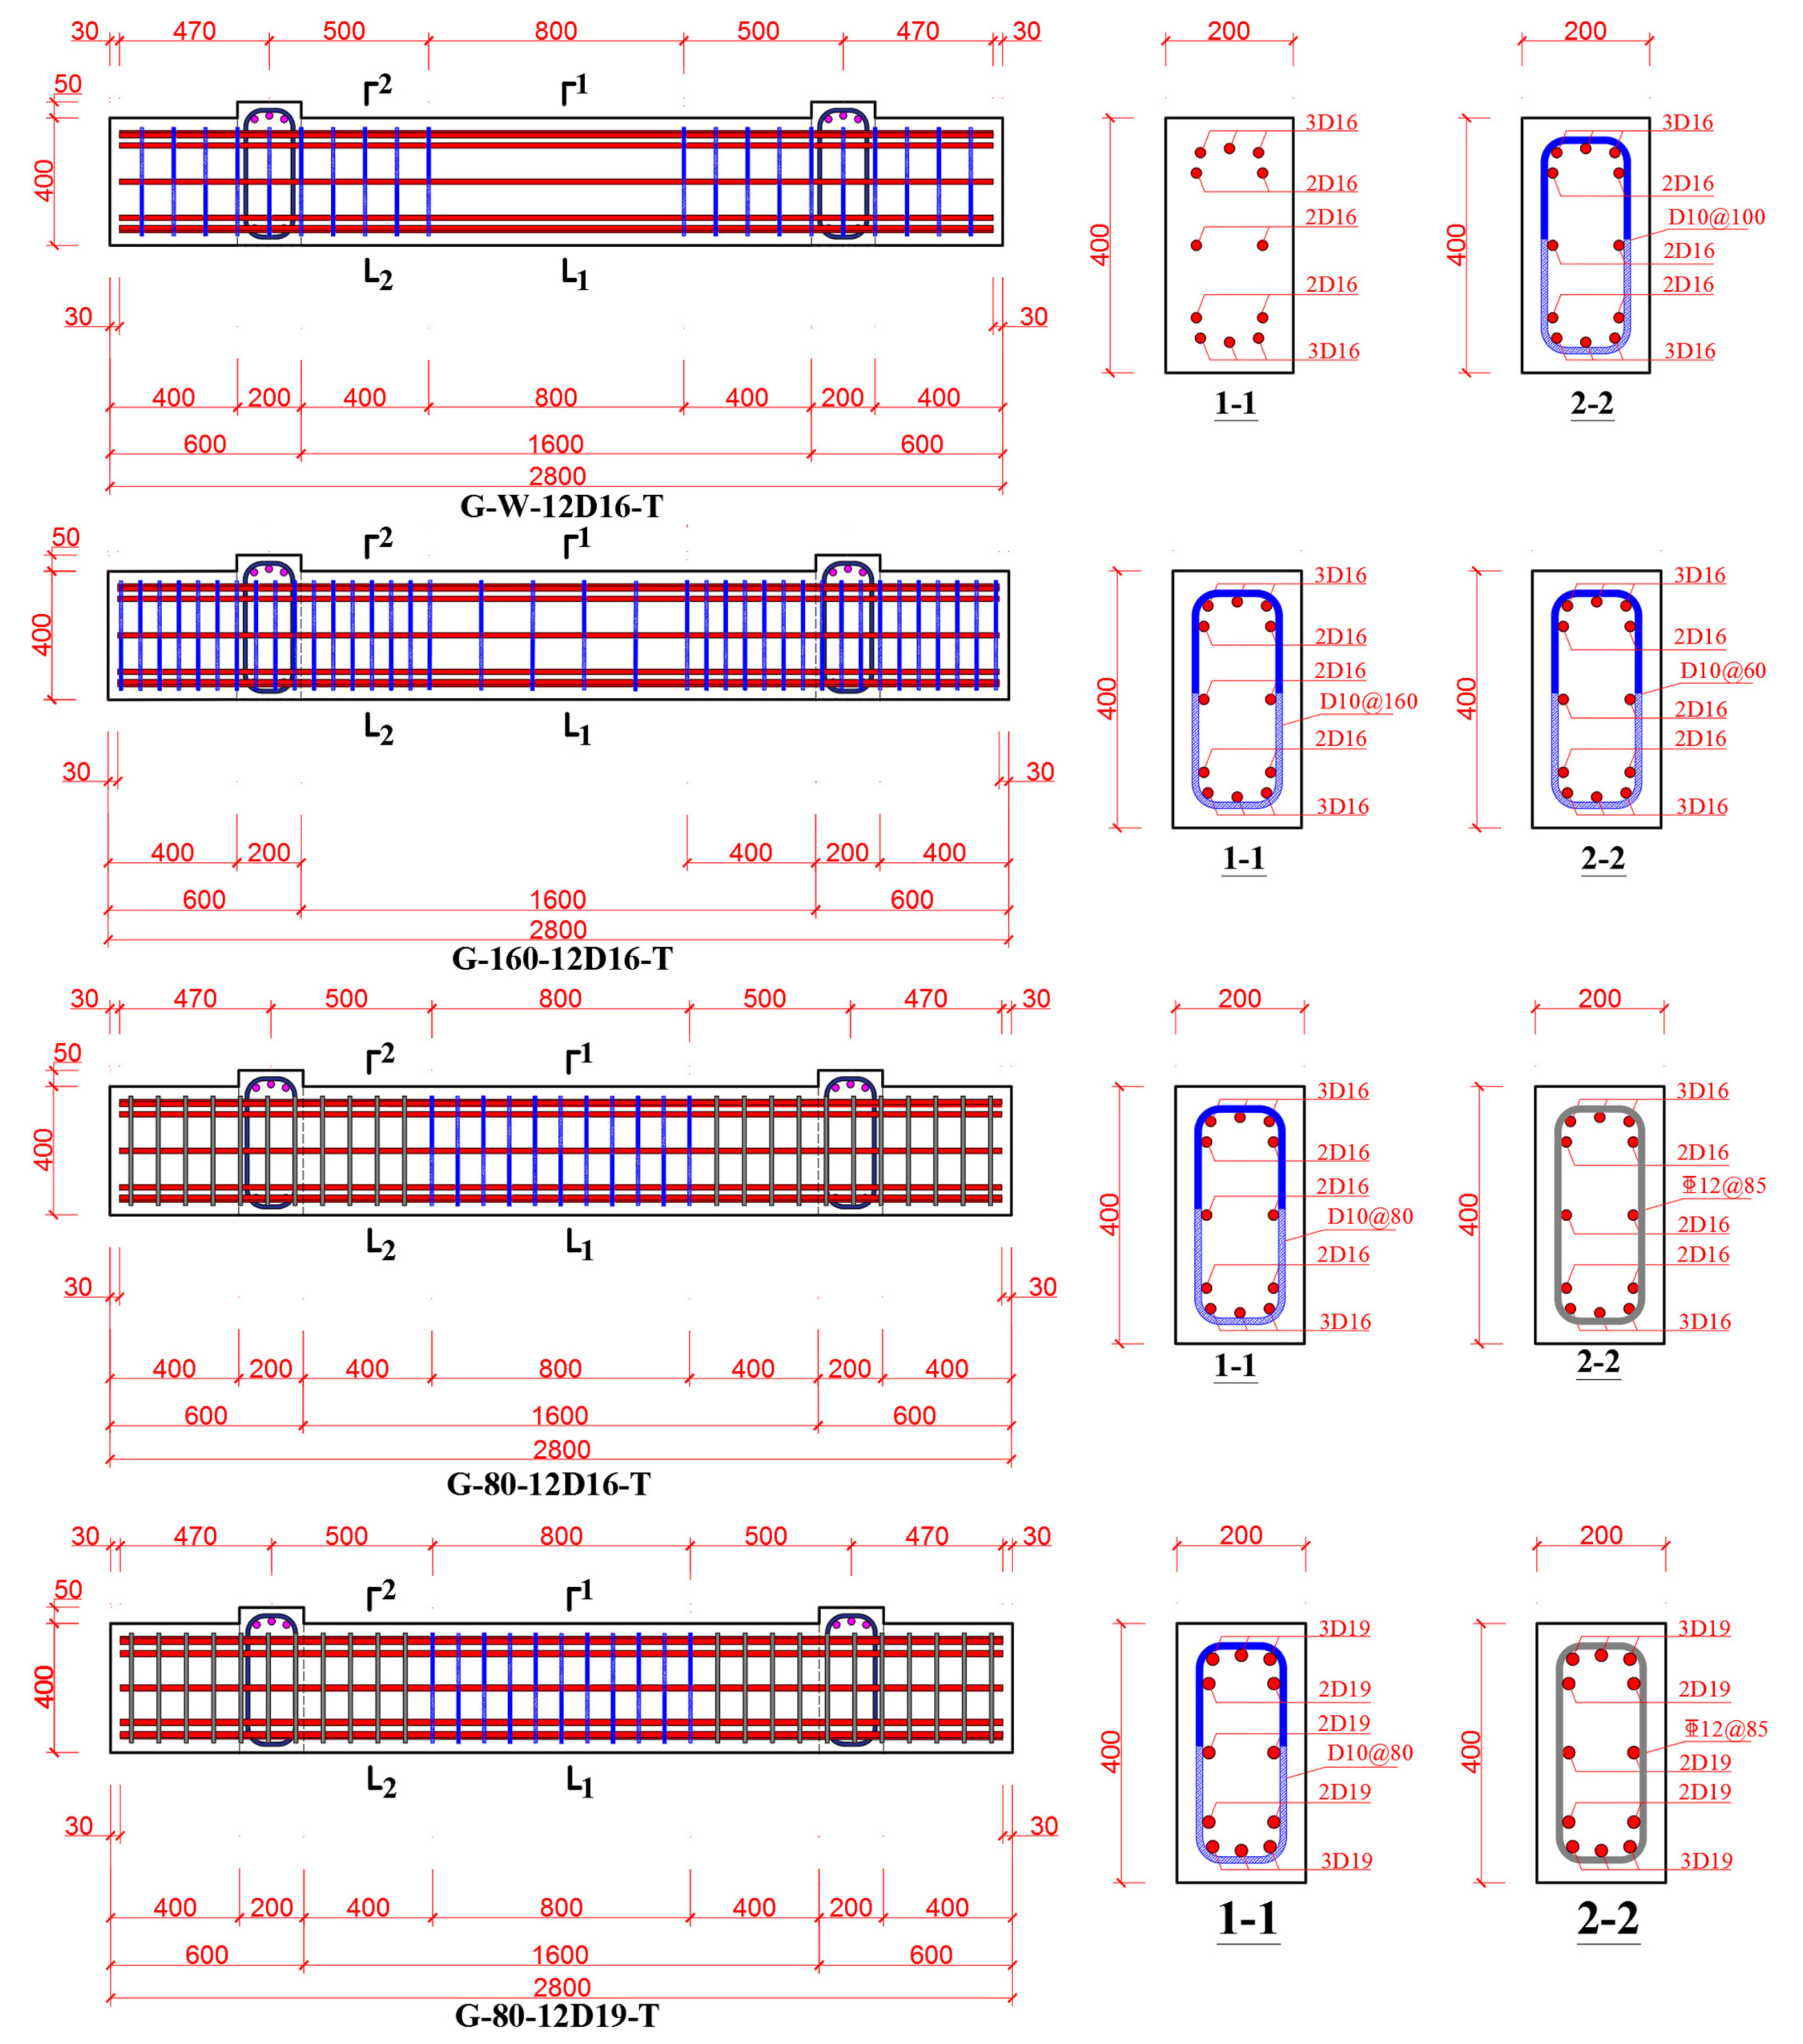
2.1. Test Specimens
2.2. Material Properties
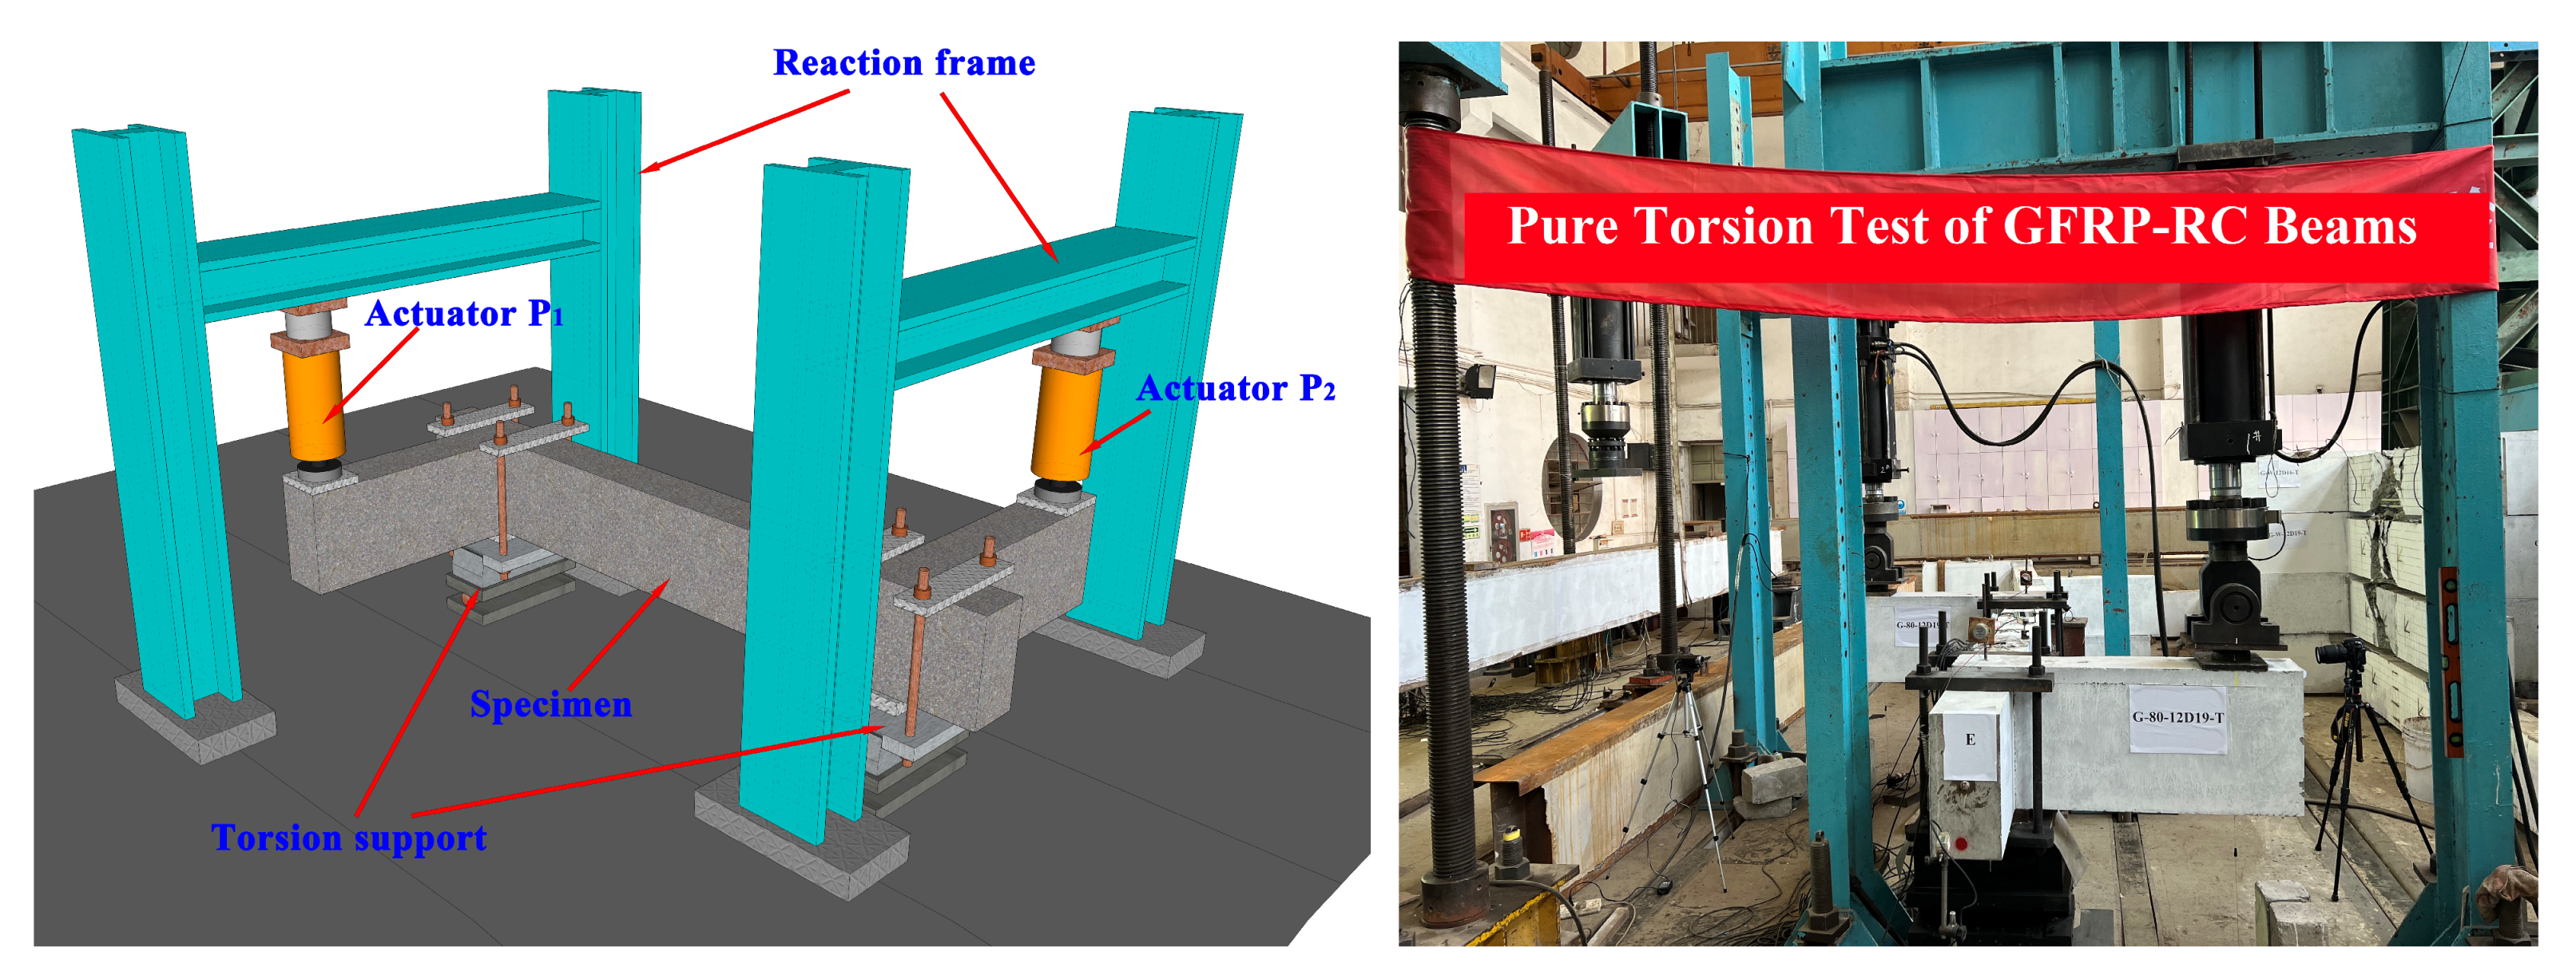
2.3. Test Setup
2.3.1. Loading Mode
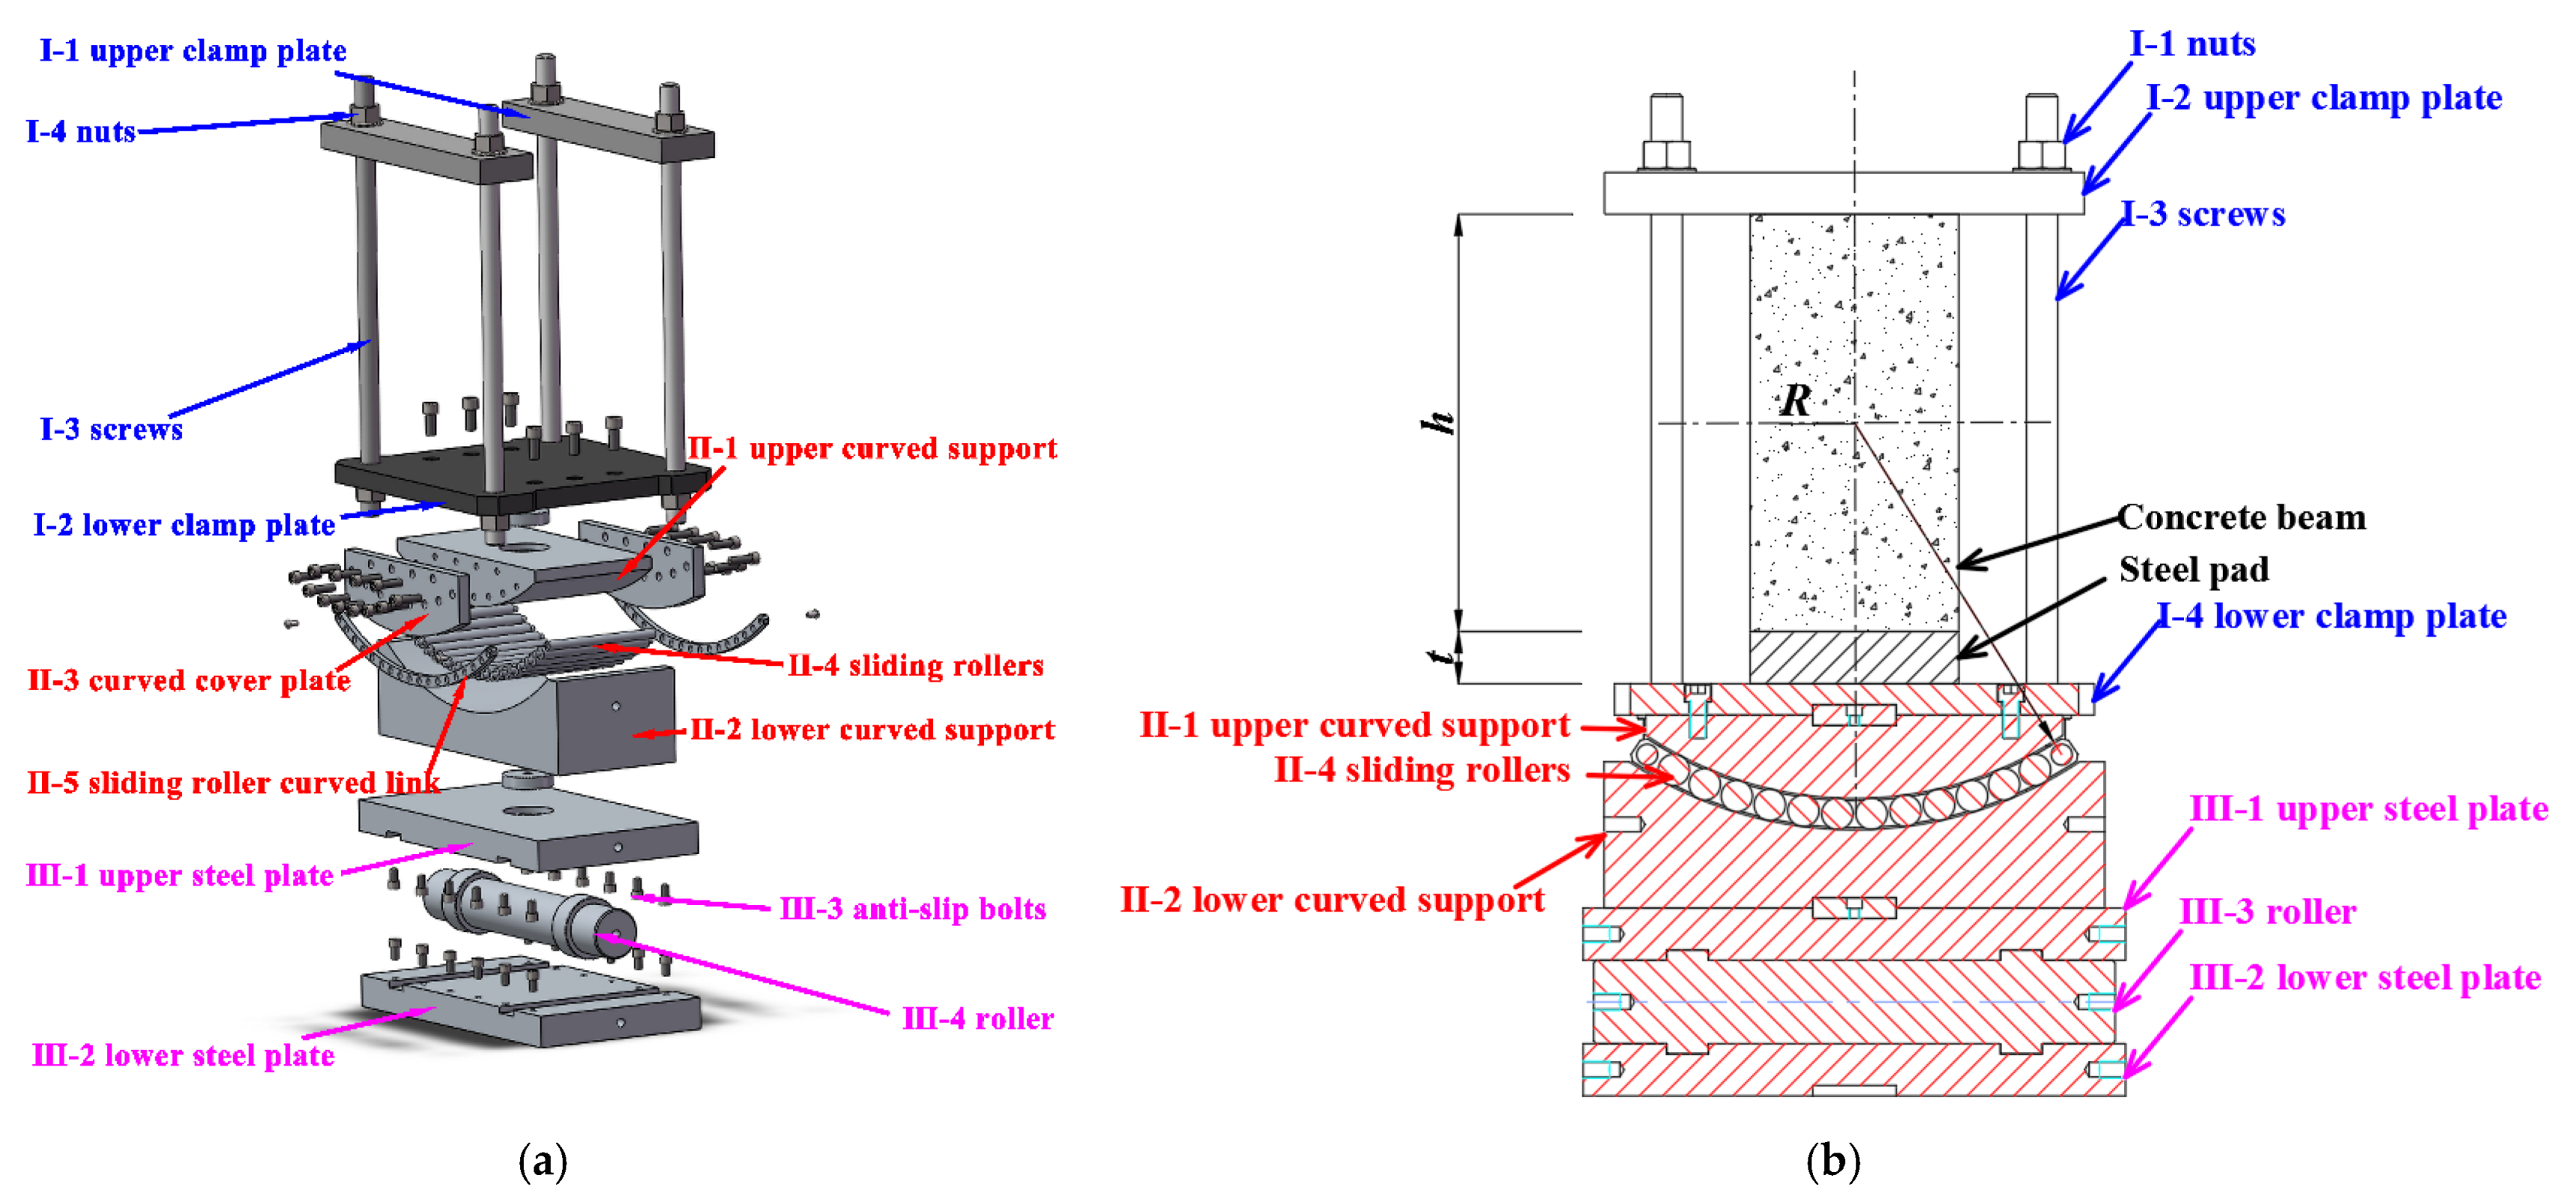
2.3.2. Torsion Support
- To ensure that the specimens could twist around the center of the cross-section, adjustable height pads were placed between the beam and the lower clamp plate (pad thickness t = R − 0.5h, h: the height of cross-section, R: the radius of the upper curved support).
- To reduce the friction caused by torsion, sliding rollers were installed on the upper and lower curved supports.
- The anti-slip bolts could be installed on the upper and lower steel plates to prevent the rollers from sliding out during the test. Besides, two sets of key slots and raised circular discs were installed on the upper and lower steel plates and rollers respectively to ensure that the rollers could roll between the upper and lower steel plates in the same direction.
2.4. Instrumentation
3. Results and Discussion
3.1. Overall Responses and Failure Patterns
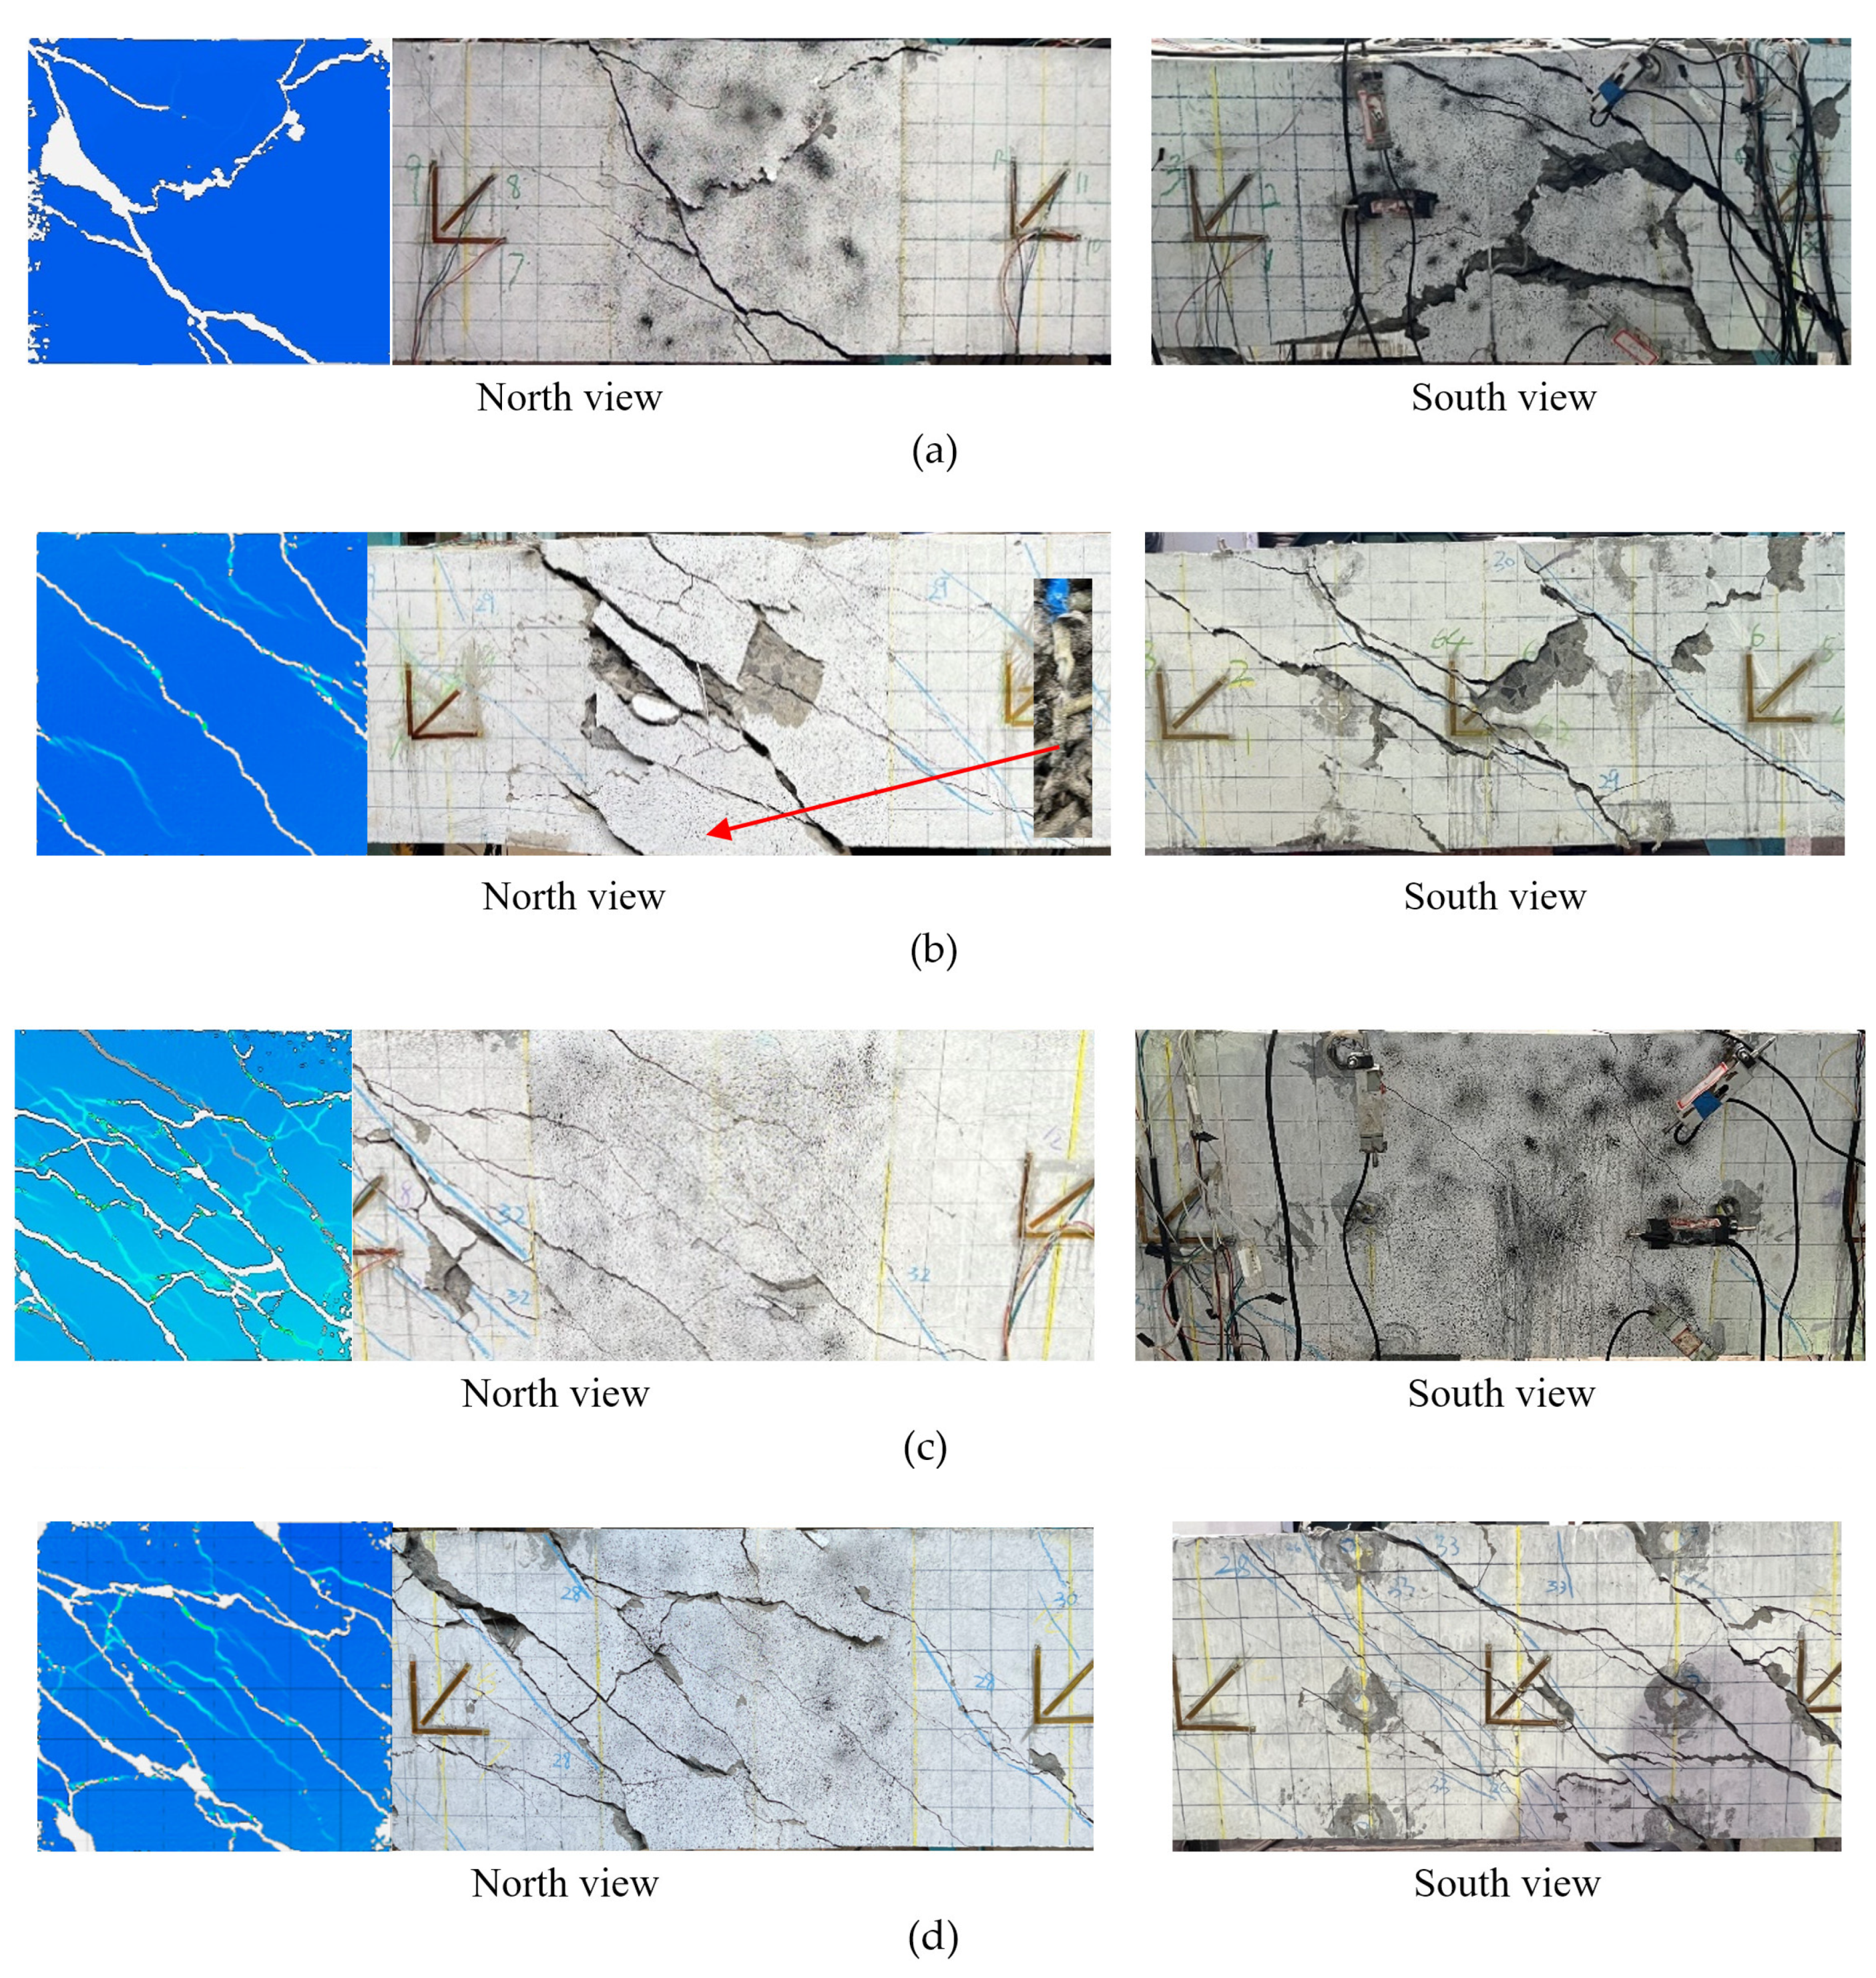
- The specimen without stirrups (G-W-12D16-T) experienced two stages: the uncracked stage and the failure stage. In the uncracked stage, the specimen exhibited visible warping on the surface. When the torque load reached cracking torque, diagonal cracks initiated from the mid-point of two long side surfaces, due to the maximum shear stress at these points. The crack rapidly extended from the midpoint to the top and bottom surfaces of the specimen, forming spiral cracks. With the increase in the width of the cracks on a randomly chosen long side surface of the specimen, the crack opening became significant. Simultaneously, a compressed plastic zone of concrete formed on the other long side surface of the specimen. Meanwhile, the spiral cracks extended to the corners of the specimen, where concrete spalling occurred. Generally, the specimen without stirrups failed immediately after cracking, which exhibited brittle failure as shown in Figure 6a.
- The specimen with stirrups experienced three stages: pre-cracking stage, cracking stage, and failure stage. Specimens with stirrups exhibited similar behavior in the pre-cracking stage to the specimen without stirrups. In the pre-cracking stage, visible warping was also observed. When the torque load reached cracking torque, diagonal cracks first appeared at the midpoint of long side surfaces. The cracks extended towards the top and bottom surfaces of the specimen, forming spiral cracks on four side surfaces. As the load increased, the number of spiral cracks increased, and the crack width widened. Concrete inclined struts formed between the spiral cracks. In the failure stage, specimen G-160-12D16-T failed due to stirrup rupturing (as shown in Figure 6b), that is, a partially over-reinforced failure pattern. Specimens G-80-12D16-T and G-80-12D19-T failed due to the crushing of concrete strut (as shown in Figure 6c,d), that is, an over-reinforced failure pattern. The cracks on the over-reinforced specimens could be classified into two types: spiral cracks and intersected cracks (as shown in Figure 6c,d). Spiral cracks primarily formed due to torsion stress on the specimen, while intersected cracks primarily occurred due to the crushing of concrete struts.
3.2. Spiral Crack Angle
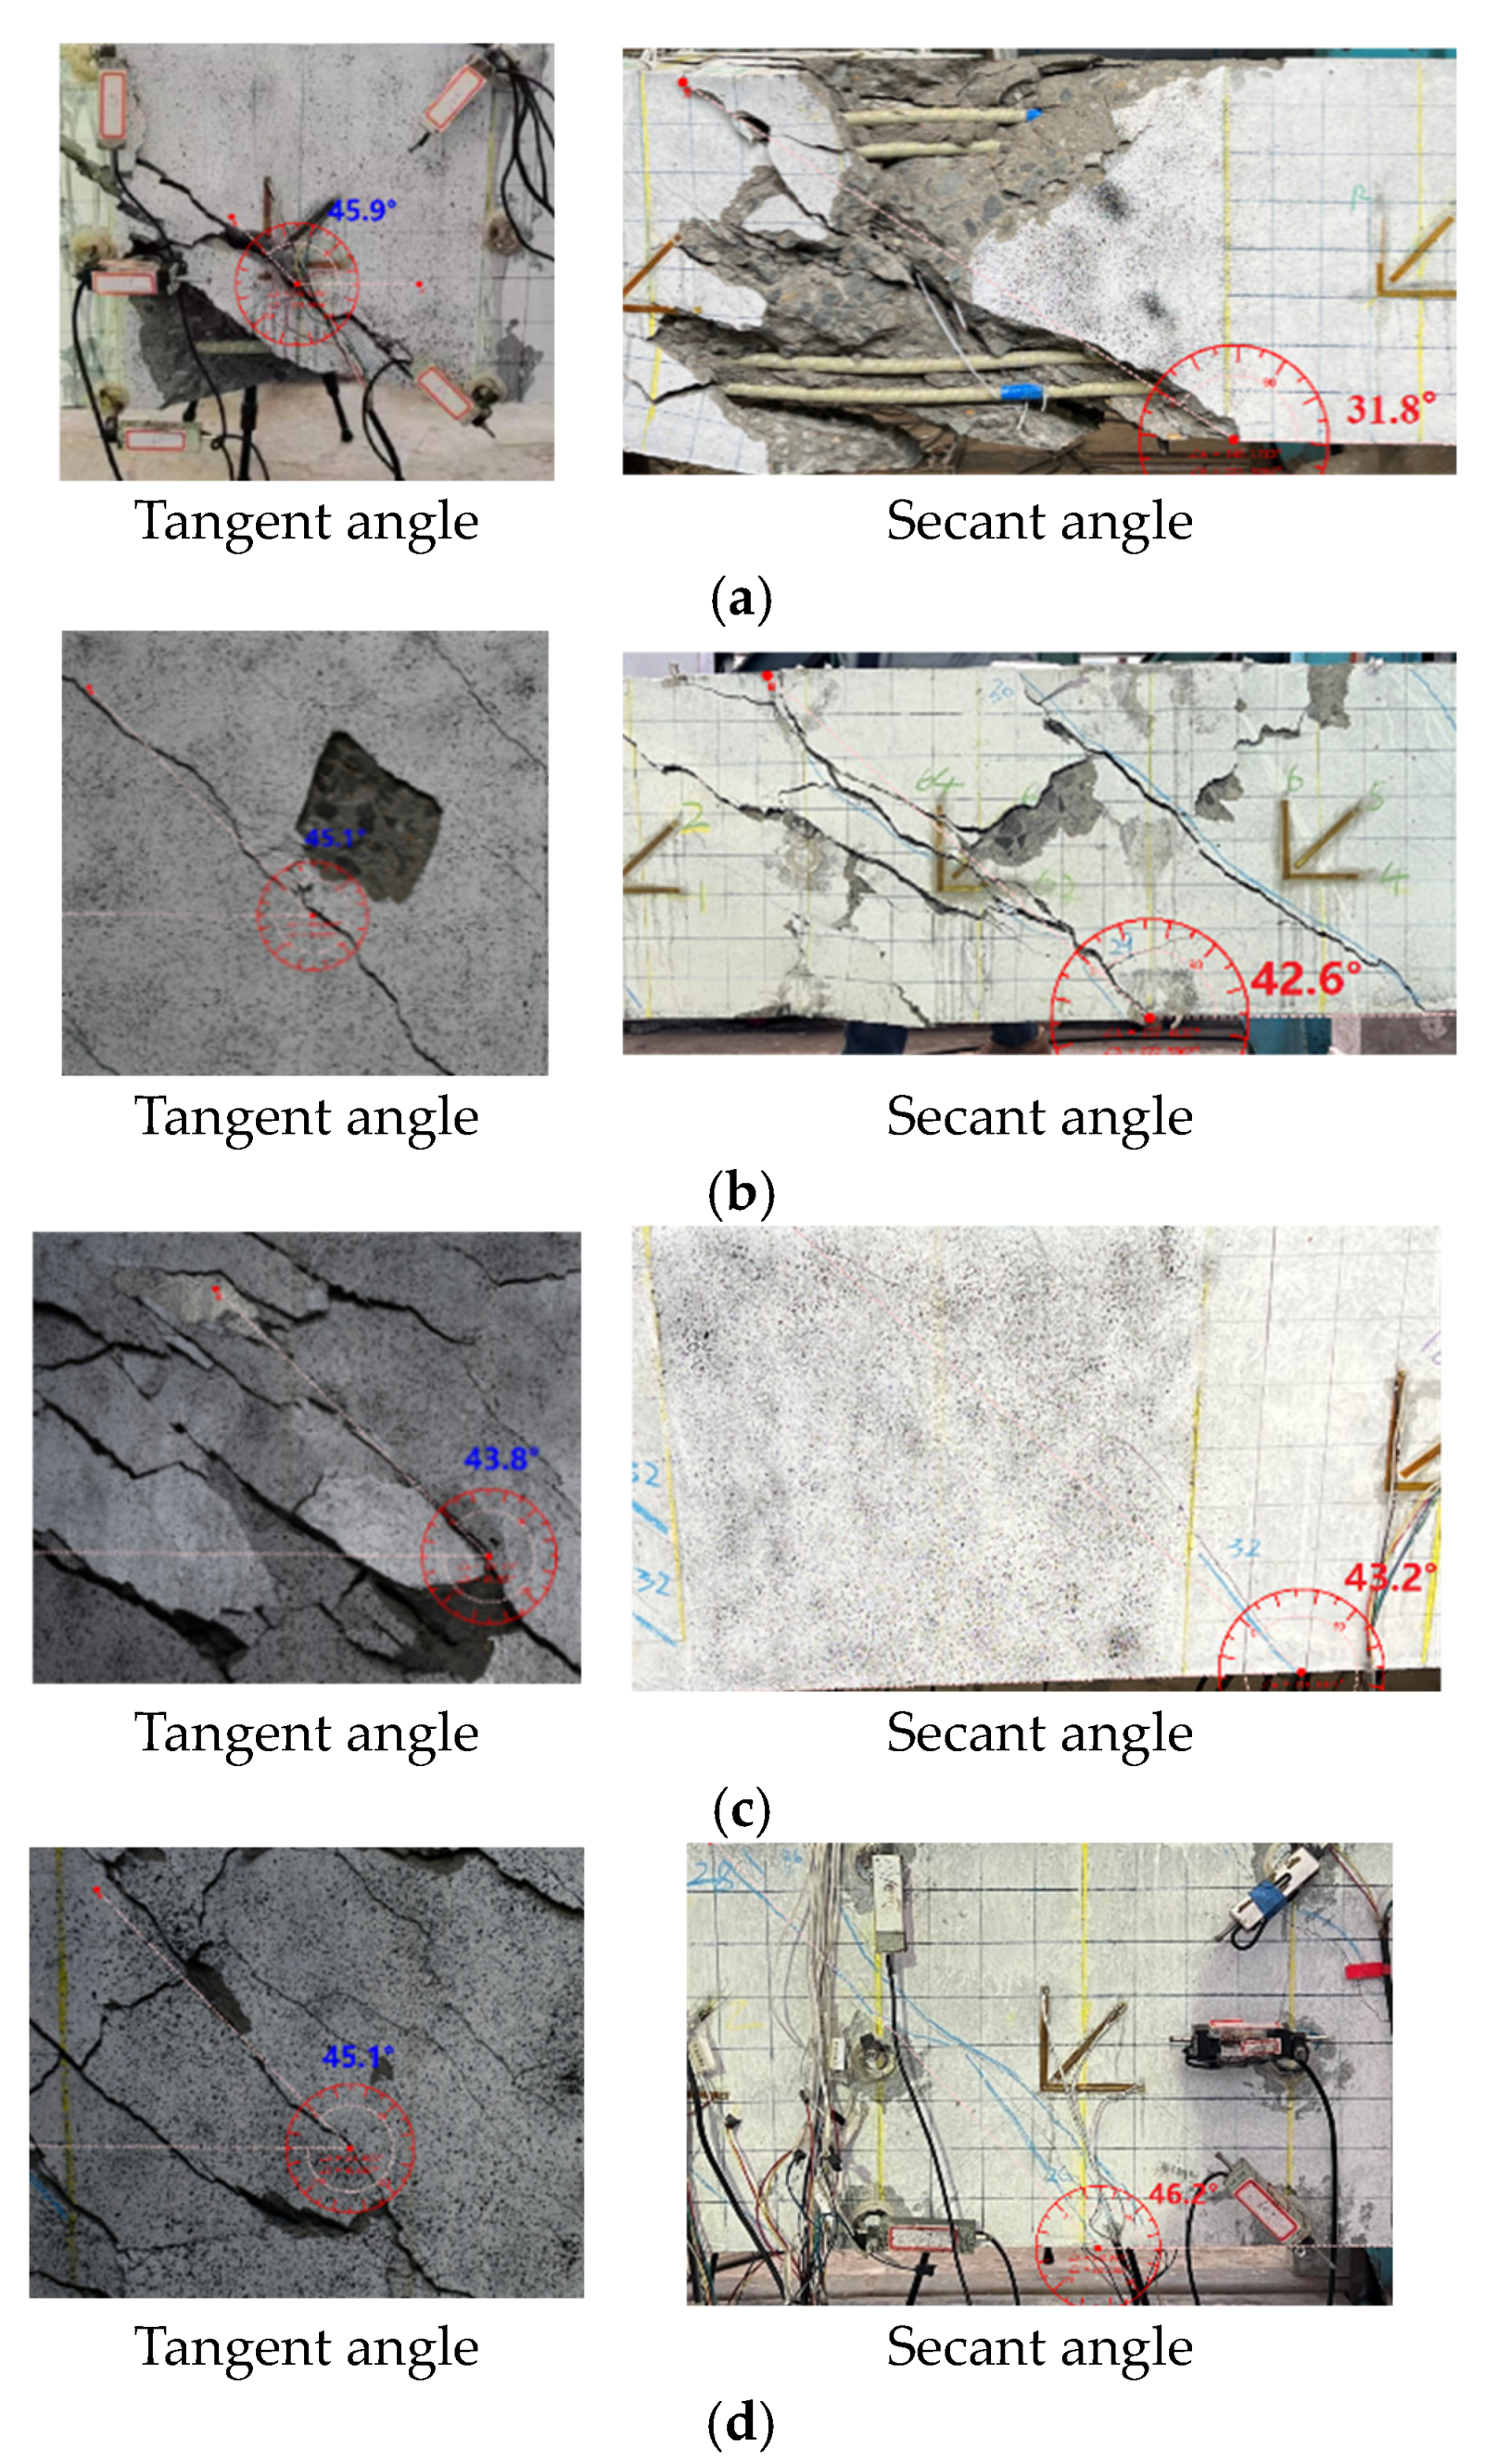
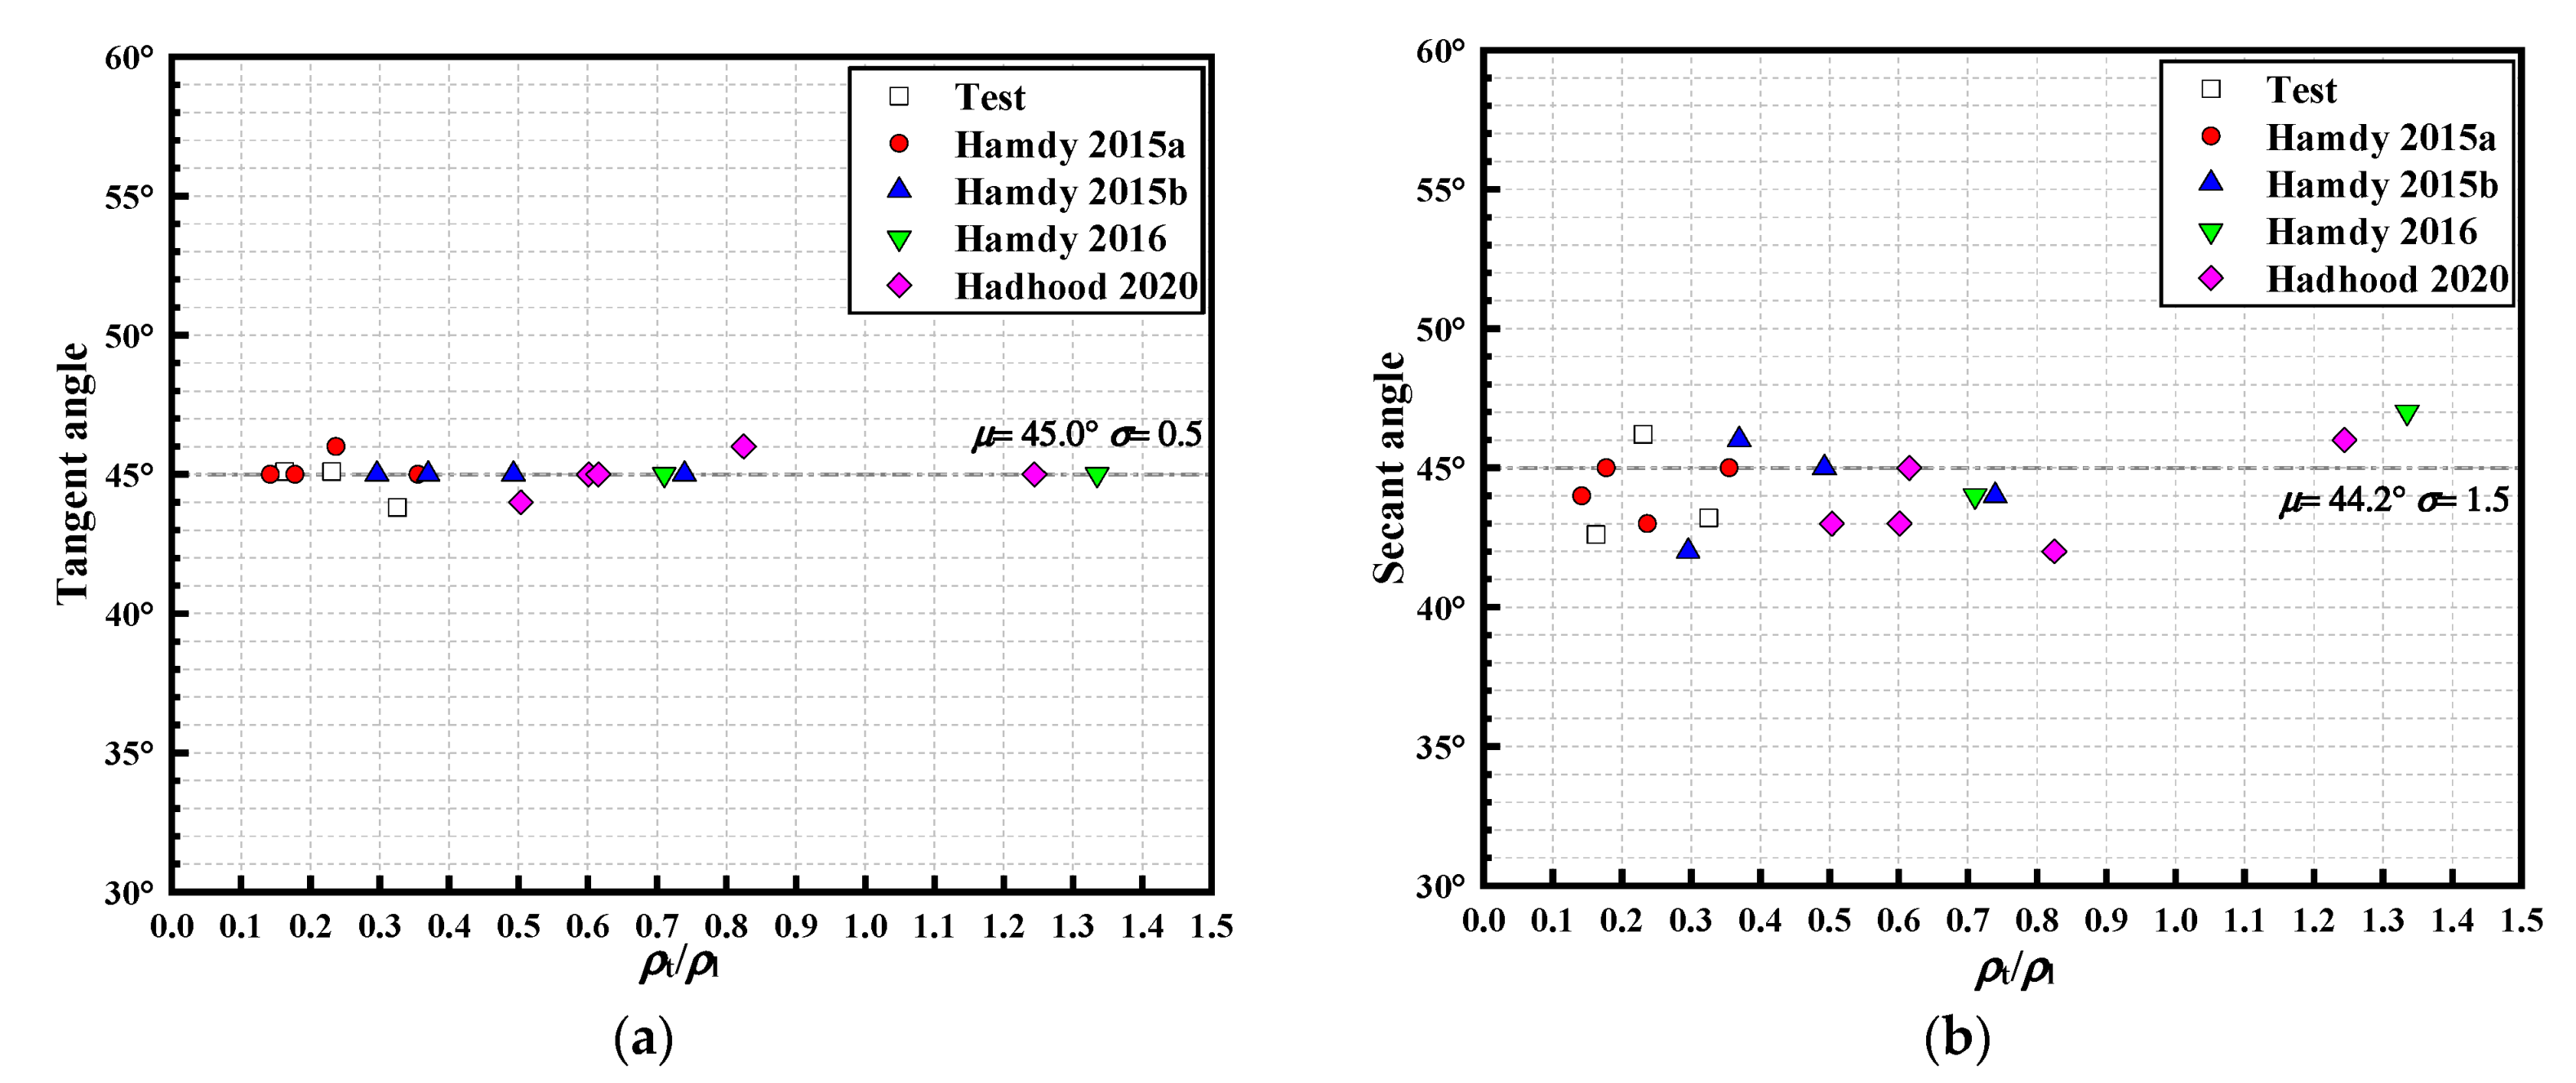
- For specimens without stirrups, the tangent angle was approximately 45.9°, while the secant angle was 31.8°. After cracking, due to lack of stirrups confinement, the cracks extended longitudinally along the axis of the specimen, resulting in a secant angle smaller than the tangent angle.
- For specimens with stirrups, the tangent angle was 45.1°, 43.8°, 45.1° for G-160-12D16-T, G-80-12D16-T, and G-80-12D19-T, respectively, and the secant angle ranged from 42.6°, 43.2°, and 46.2° for G-160-12D16-T, G-80-12D16-T, and G-80-12D19-T, respectively. For G-160-12D16-T, which failed due to stirrup rupturing, the axial elongation and crack width were larger than the other two specimens. It resulted in a slightly smaller of secant angle to the tangent angle. Comparatively, two angles were close to each other for over-reinforced beams, G-80-12D16-T and G-80-12D19-T. All in all, the angle difference was much smaller than that in the beam without stirrups. It can be attributed to the constrain of FRP stirrups.
3.3. Crack Width
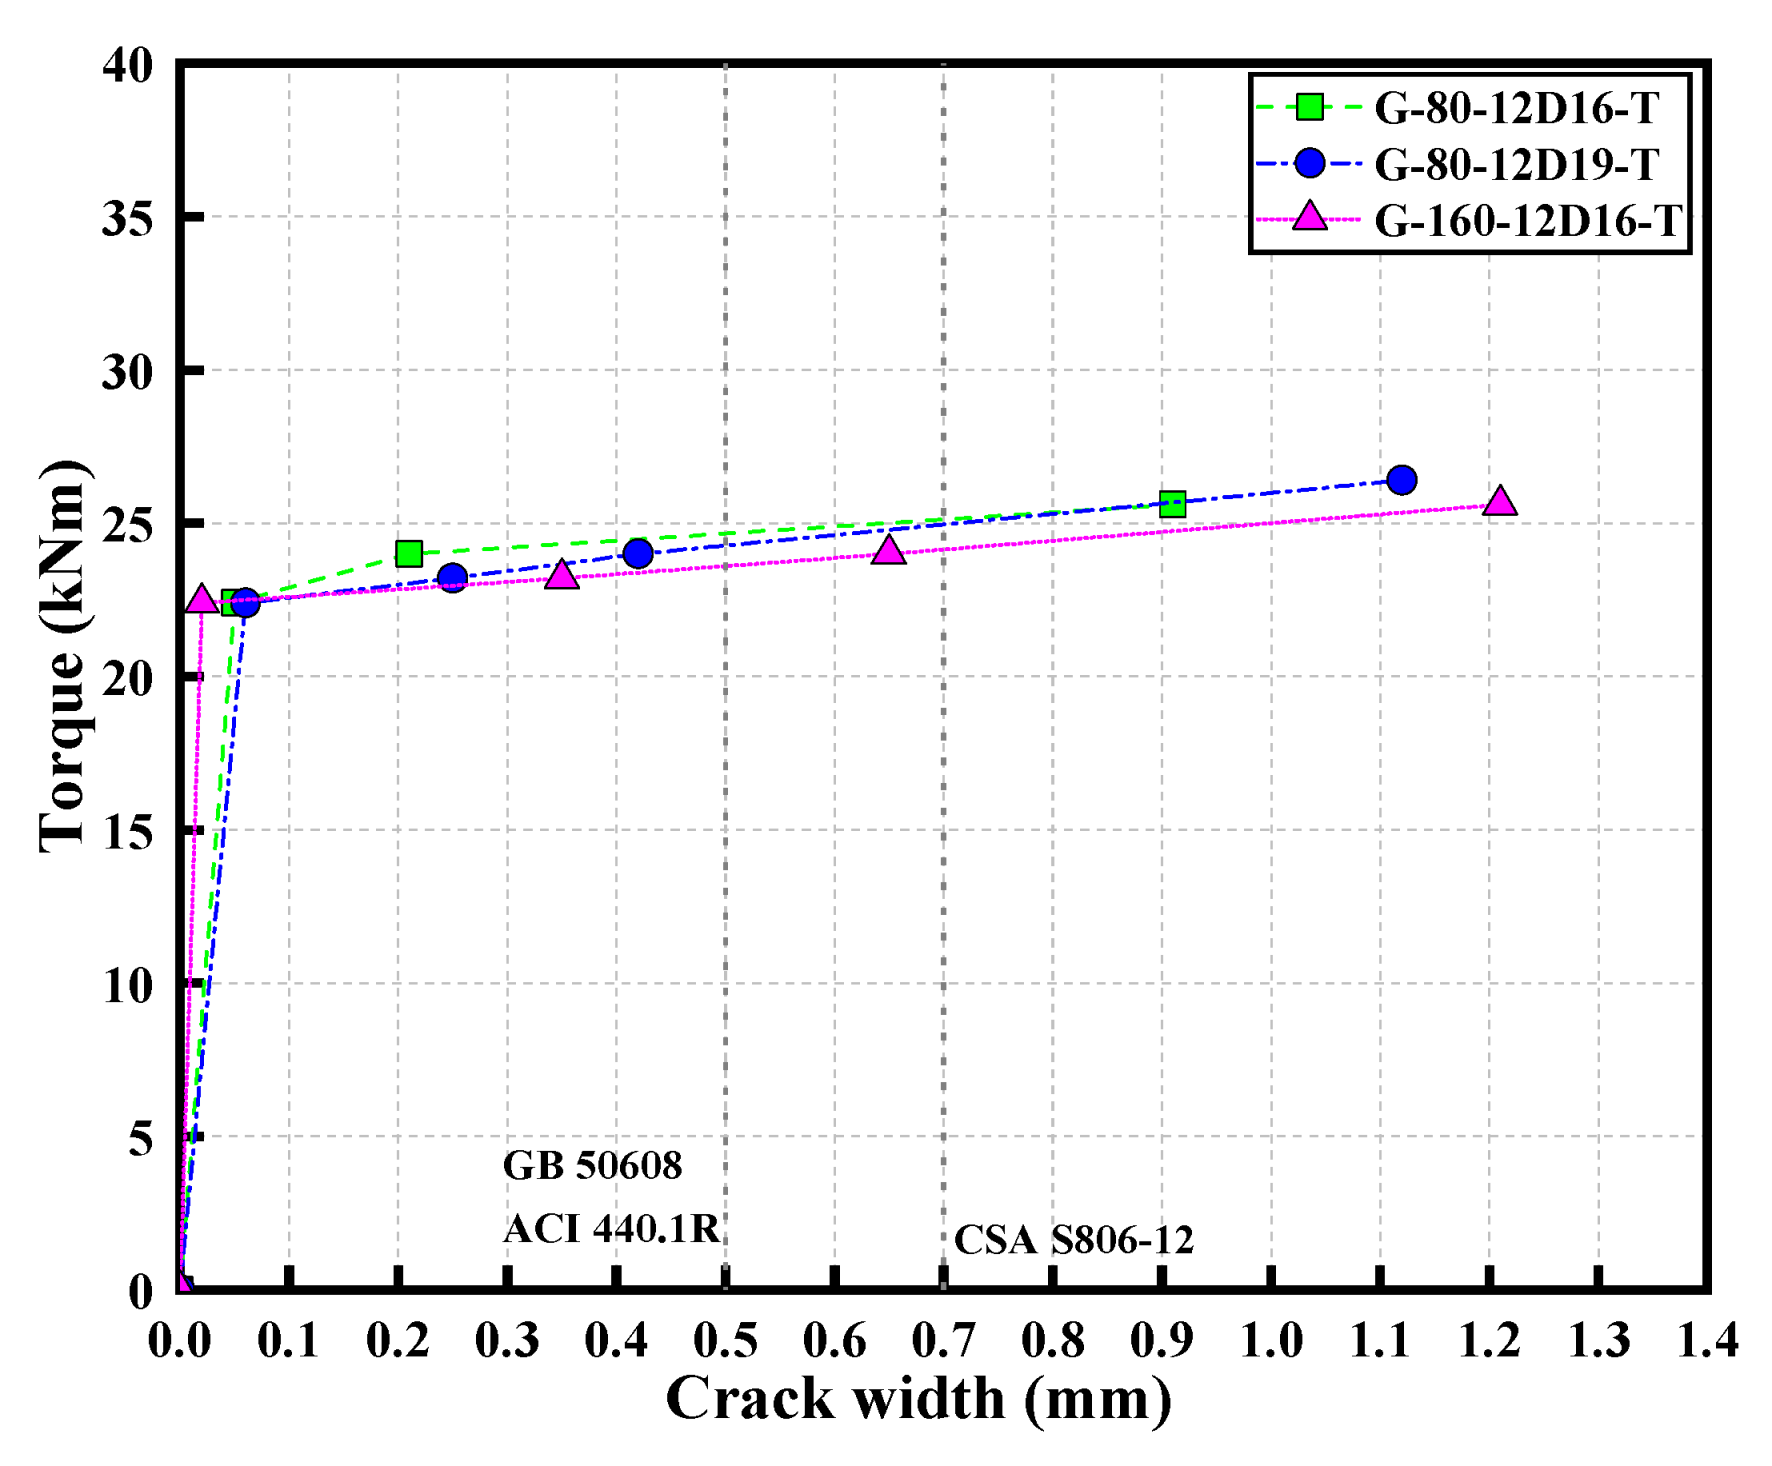
- Generally, torque–crack width curves showed a rapid increase in crack width after cracking. For the same load, specimen G-160-12D16-T exhibited the widest crack width, while specimens G-80-12D19-T and G-80-12D16-T had smaller crack width. It indicated that the stirrups had a significant influence on the crack width, while the longitudinal reinforcement ratio had a lesser effect.
- Corresponding to the crack width of 0.5 mm, torques were 23.5 kN∙m for specimen G-160-12D16-T, 24.6 kN∙m for G-80-12D16-T, and 24.3 kN∙m for G-80-12D19-T, respectively. The ratios of the ultimate torque to the torque corresponding to 0.5 mm crack width were 1.09, 1.13, and 1.16, for G-160-12D16-T, G-80-12D16-T, and G-80-12D19-T, respectively. It indicated that the torque corresponding to 0.5 mm crack width was close to torsion capacity, with safety margins ranging from 1.1 to 1.2. Due to the different mechanisms of shear crack formation compared to flexural crack, the shear crack width of FRP-RC members subjected to torsion should be further investigated.
3.4. Torque–Twist Angle Behavior
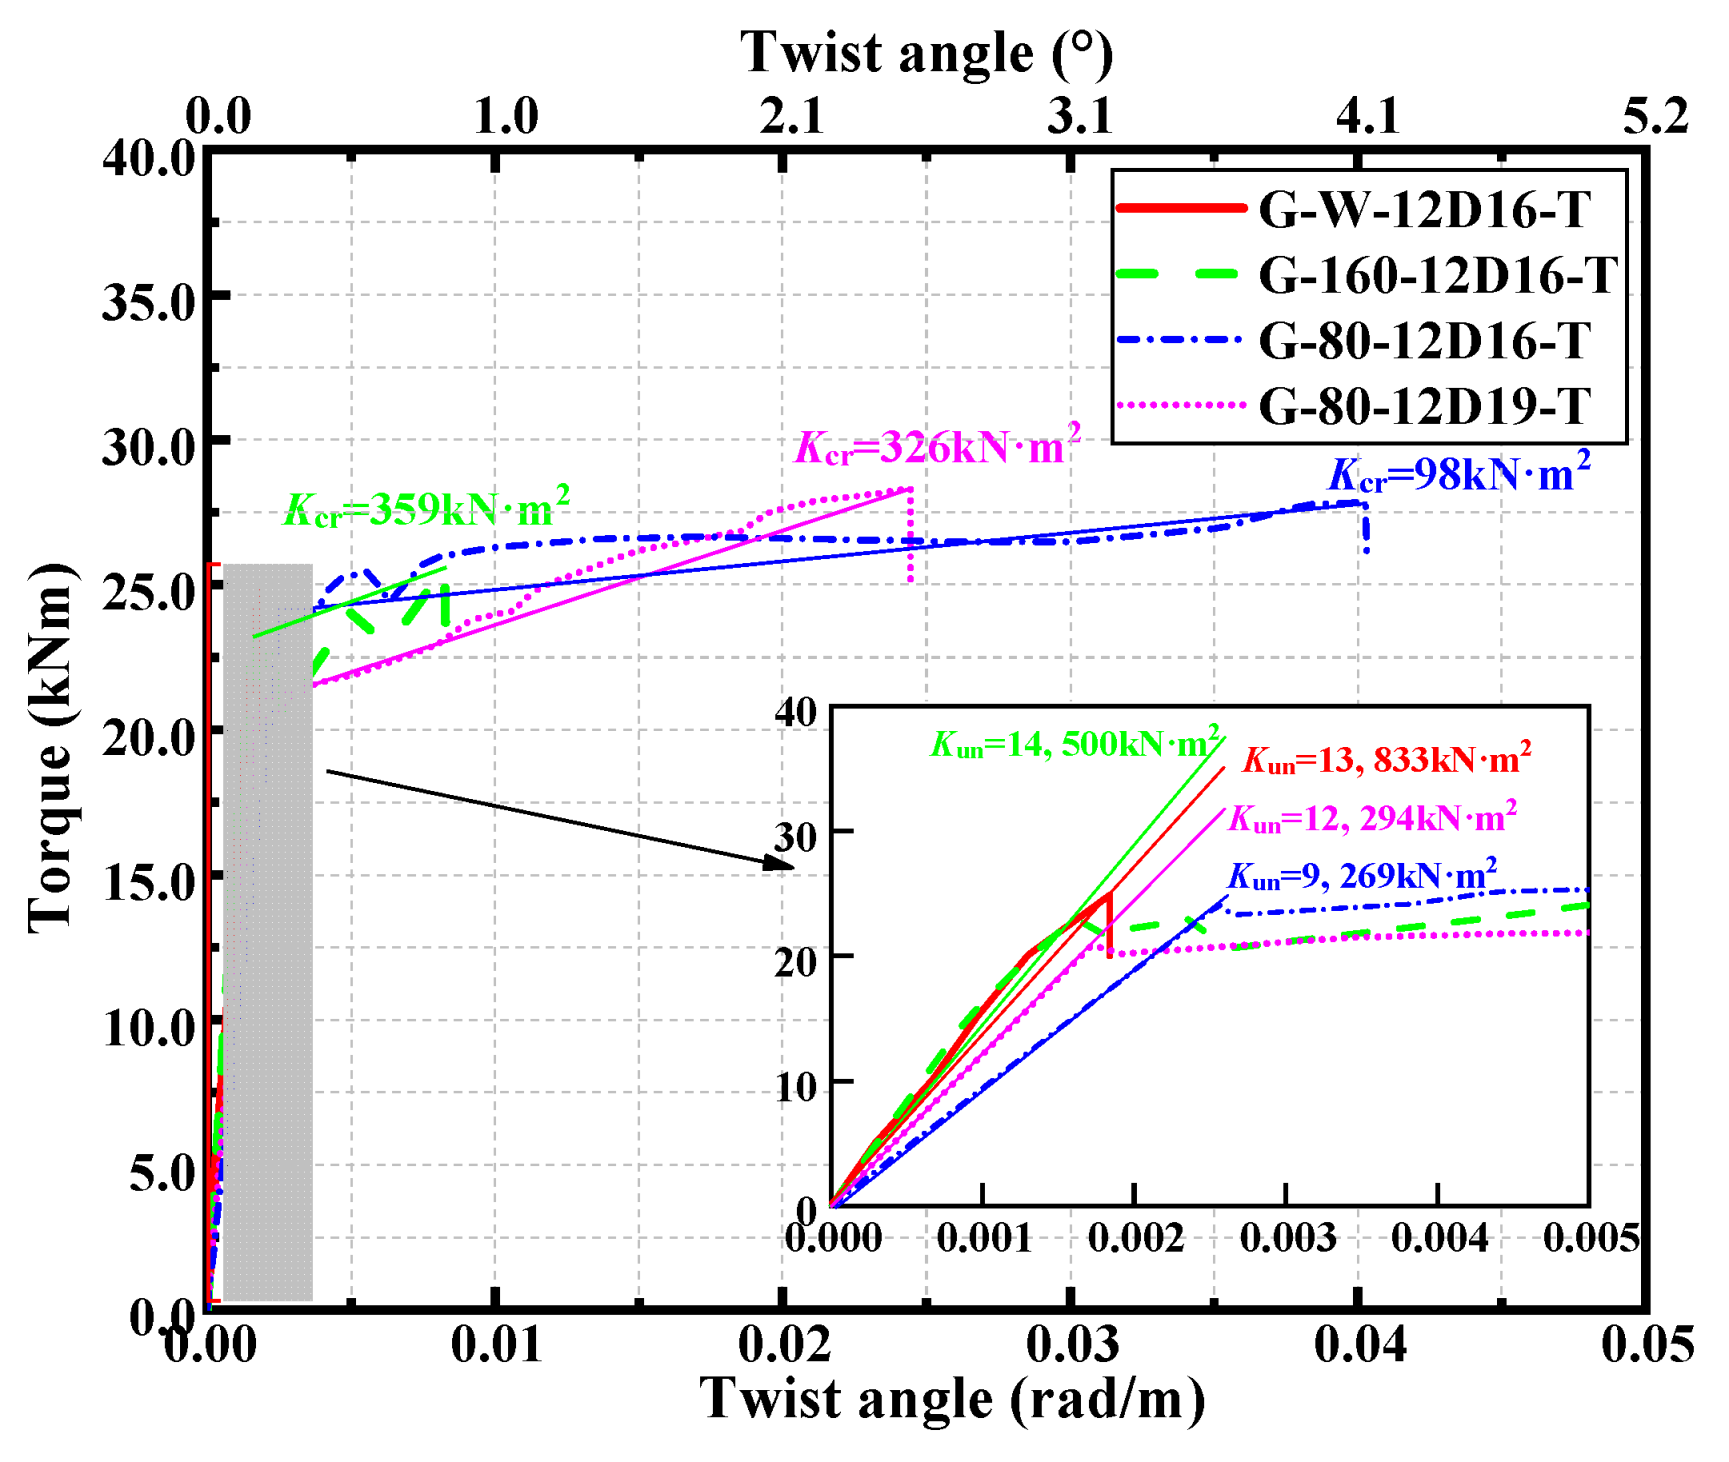
- Approximate linear torque–twist angle curves of the specimen without stirrups could be observed. The torque–twist angle behavior has no significant change after cracking. For the partially over-reinforced and over-reinforced specimens, the torque–twist angle curves exhibited bilinear characteristics. In the uncracked stage, the torque increased linearly with the twist until the cracking torque. Afterward, the torque–twist angle curves came into the cracking stage, with the torque increasing slowly until reaching the ultimate torque Tu. After reaching the ultimate torque, the torque–twist angle curves dropped rapidly. The torque–twist angle curves could be divided into three stages: uncracked stage, cracking stage, and failure stage. Similar torque–twist angle behavior of specimens with stirrups was displayed in References [8,10].
- In terms of torsion capacity, for specimens with the same longitudinal reinforcement ratio, the ultimate torques (i.e., torsion capacity) Tu for G-W-12D16-T, G-160-12D16-T, and G-80-12D16-T were 24.9 kN∙m, 25.6 kN∙m, and 27.8 kN∙m, respectively (as listed in Table 3). As the stirrup ratio increased from 0 to 0.98%, it increased by 12%. It indicated that increasing the stirrup ratio had a certain effect on enhancing the torsion capacity for partially over-reinforced beams. Besides, for over-reinforced specimens with the same stirrup ratio, the torsion capacity was 27.8 kN∙m and 28.3 kN∙m for specimens G-80-12D16-T and G-80-12D19-T, respectively (listed in Table 3). As the longitudinal reinforcement ratio increased from 3.01% to 4.25%, the torsion capacity increased by 2%, indicating that increasing the longitudinal reinforcement ratio for over-reinforced beams had a less significant effect on enhancing the torsion capacity of over-reinforced specimens.
- In terms of ultimate twist angle, for the specimen without stirrups G-W-12D16-T, partially over-reinforced specimen G-160-12D16-T, and over-reinforced specimens G-80-12D16-T and G-80-12D19-T, the ultimate twist angles ϕu were 0.0018 rad/m, 0.0083 rad/m, 0.0403 rad/m, and 0.0244 rad/m, respectively (as listed in Table 3). For specimens with the same longitudinal reinforcement ratio, increasing the stirrup ratio from 0 to 0.98% resulted in a 21-fold increase in the ultimate twist angle. Increasing the stirrup ratio from 0.49% to 0.98% resulted in a 4.9-fold increase in the ultimate twist angle. It revealed that increasing the stirrup ratio could improve the torsional deformation capacity significantly. It could be attributed confinement effect from stirrups. For over-reinforced specimens with the same stirrup ratio, increasing the longitudinal reinforcement ratio from 3.01% to 4.25% (an increase of 41%) resulted in a decrease in the ultimate twist angle from 0.0403 rad/m to 0.0244 rad/m (a decrease of 39%). It could be attributed to the dowel effect from the longitudinal bars during the twist.
- In terms of torsional stiffness, the torsional stiffness in the torque–twist angle curves could be divided into pre-cracking torsional stiffness Kun and post-cracking torsional stiffness Kcr. The pre-cracking torsional stiffness and post-cracking torsional stiffness can be calculated by Equation (1) and Equation (2), respectively. The pre-cracking torsional stiffness for specimens G-W-12D16-T, G-160-12D16-T, G-80-12D16-T, and G-80-12D19-T were 13,833 kN∙m2, 14,500 kN∙m2, 9269 kN∙m2, and 12,294 kN∙m2, respectively, with an average pre-cracking torsional stiffness of 12,474 kN∙m2 (as listed in Table 3). The variation in pre-cracking torsional stiffness among the four specimens was within 26% of the average value, indicating that the pre-cracking torsional stiffness was significantly influenced by the concrete. For specimens with stirrups, the post-cracking torsional stiffness was 359 kN∙m2, 98 kN∙m2, and 326 kN∙m2 for G-160-12D16-T, G-80-12D16-T, and G-80-12D19-T respectively, which were 2%, 1%, and 3% of their pre-cracking torsional stiffness. In Reference [8] the post-cracking torsional stiffness decreased significantly, which ranged from 1% to 3% of their pre-cracking torsional stiffness.
- 5.
- In terms of ductility index, the ratio Δ of the ultimate twist angle ϕu to the cracking twist angle ϕcr (ϕu/ϕcr) was proposed to reflect the ductility index of FRP-RC beams. The ductility index can be calculated by Equation (3). The ductility indices for the over-reinforced specimens (G-80-12D16-T and G-80-12D19-T) were 15.5 and 14.4, respectively, with an average ductility index of 14.9 (as listed in Table 3). The longitudinal reinforcement ratio had little effect on the ductility index of over-reinforced specimens. The ductility indices Δ for the specimen without stirrups G-W-12D16-T, the partially over-reinforced specimen G-160-12D16-T, and the over-reinforced specimens (G-80-12D16-T and G-80-12D19-T) were 1.0, 5.2, and 14.9, respectively. The ductility indices of the partially over-reinforced specimen G-160-12D16-T and the over-reinforced specimen G-80-12D16-T were approximately 5 times and 15 times that of the specimen without stirrups G-W-12D16-T, respectively. It indicated that increasing the stirrup ratio could improve the deformation capacity of GFRP-RC beams significantly. Over-reinforced specimens had better ductility than specimens with the other two failure patterns.
3.5. Strains in Longitudinal Reinforcement
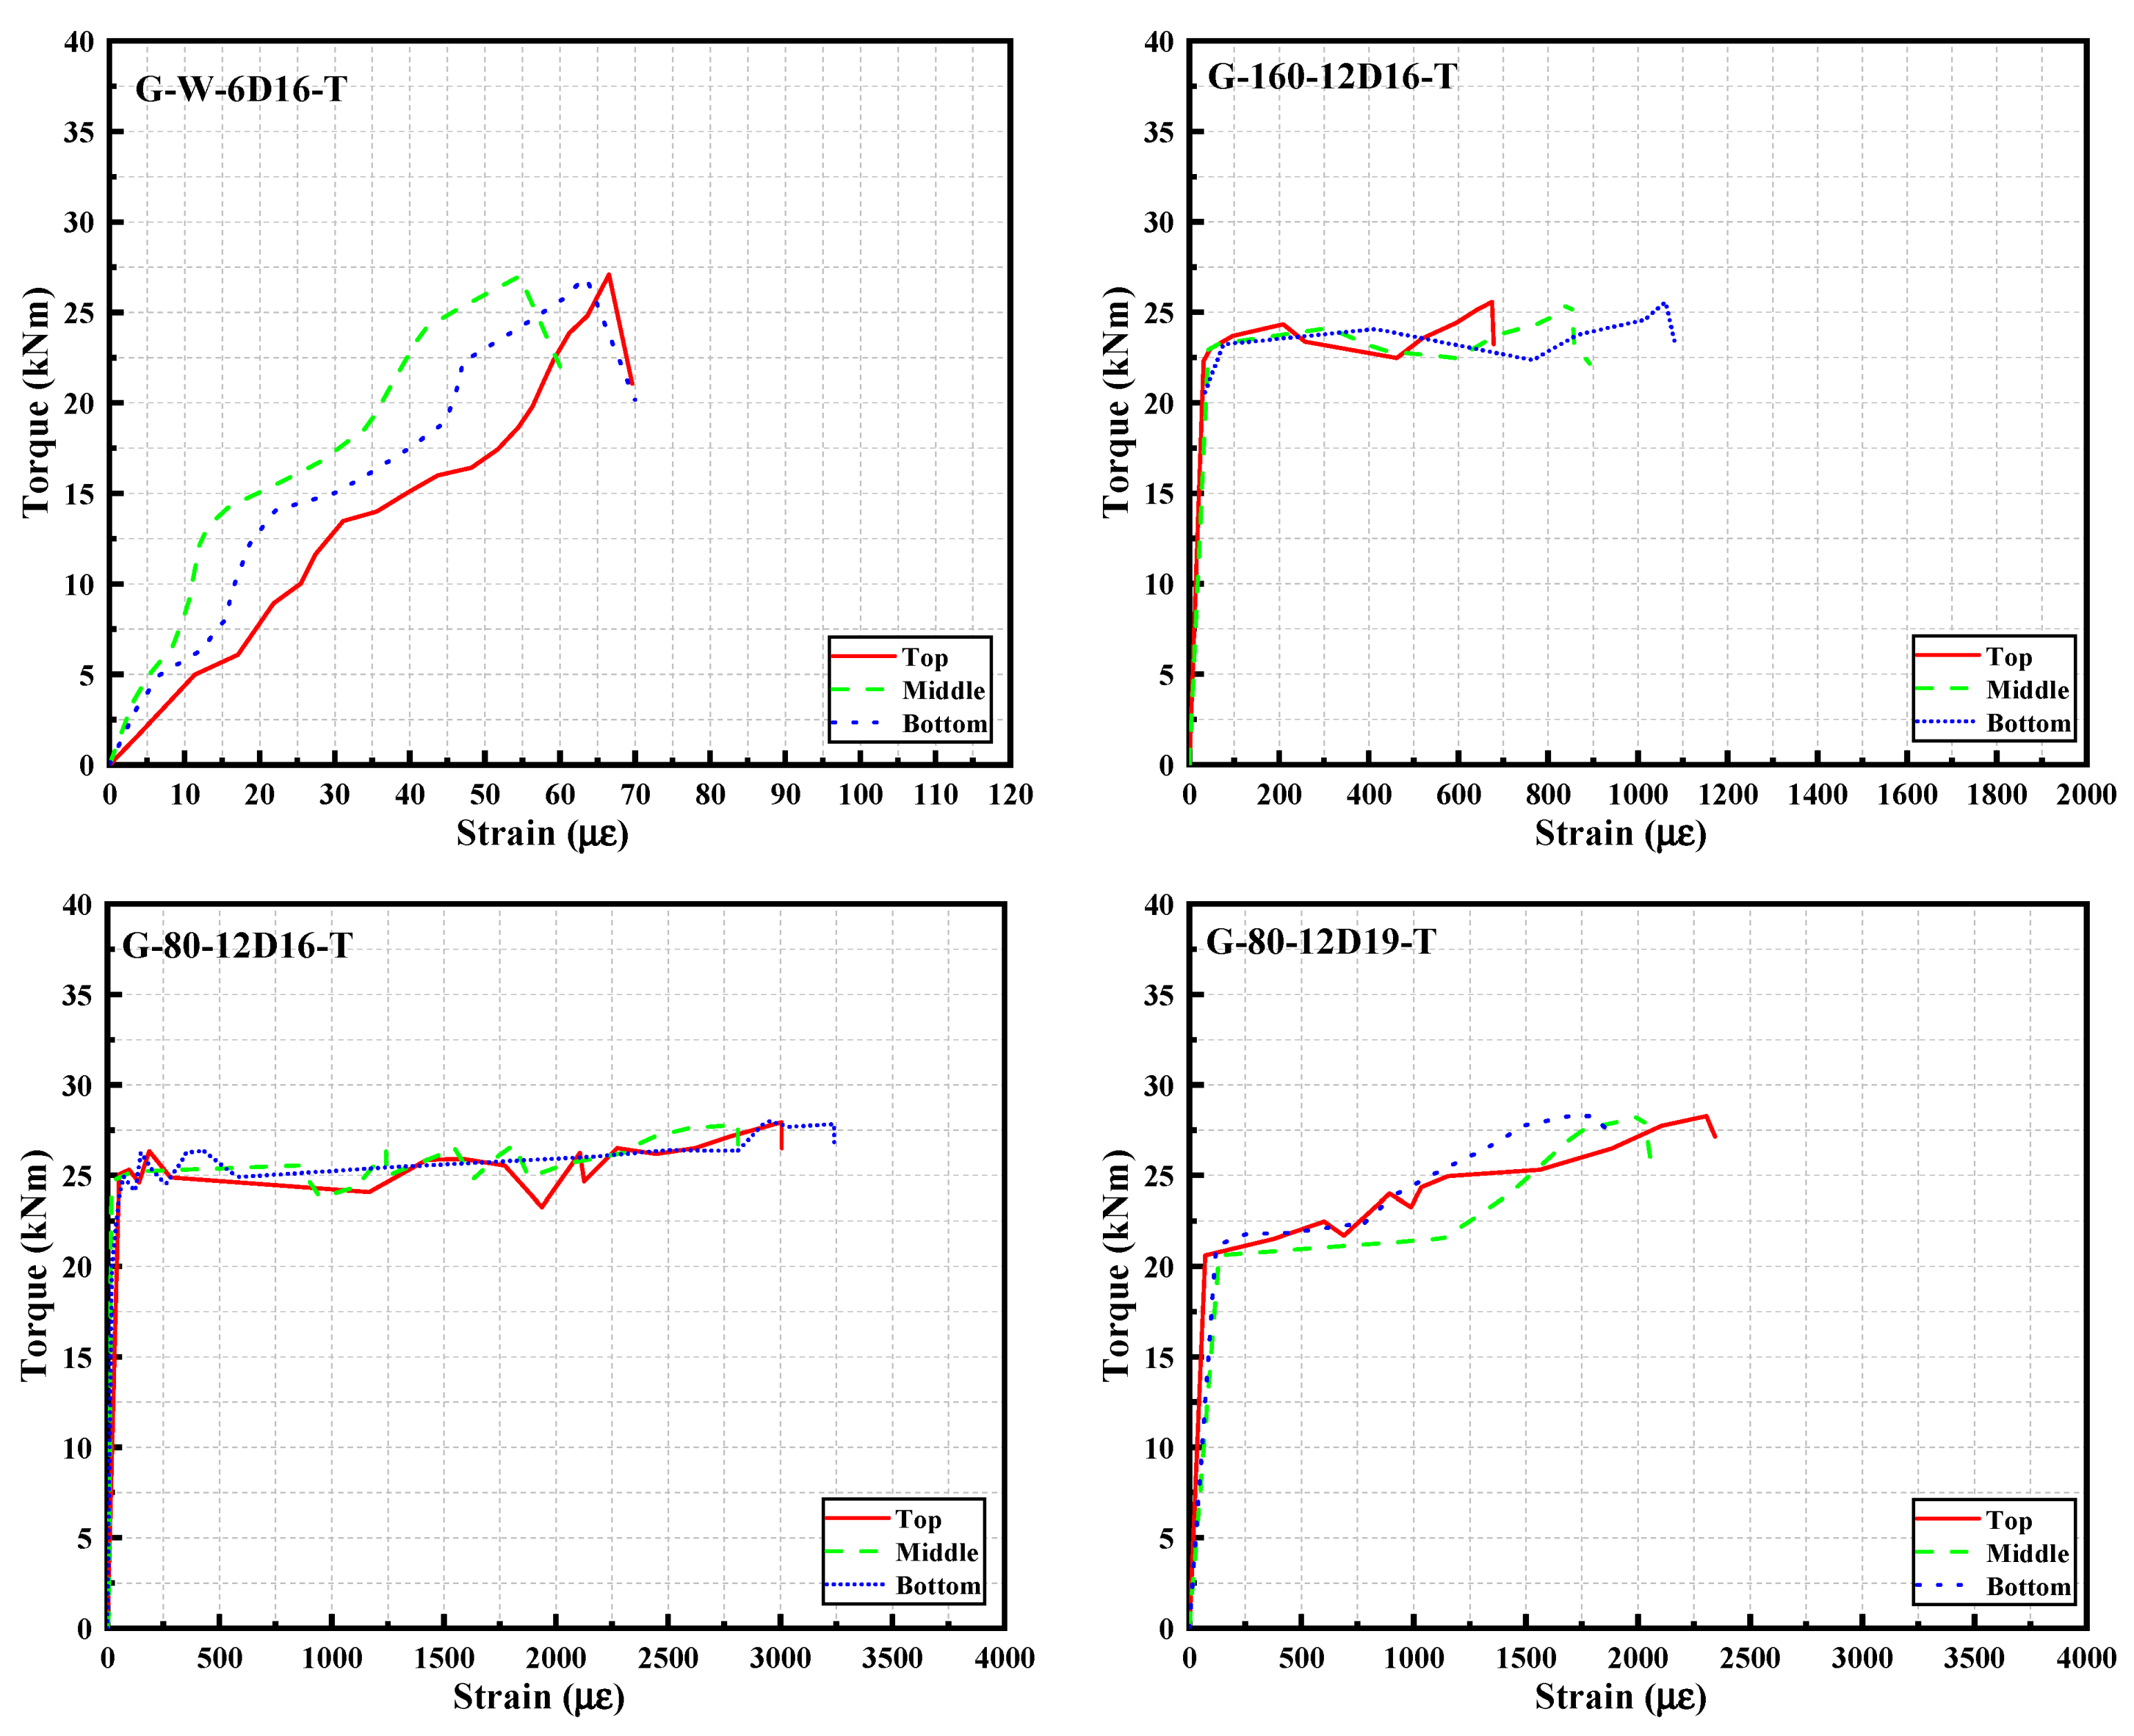
- In terms of specimens without stirrups (G-W-12D16-T), the longitudinal reinforcement strain increased with the torque before the concrete cracked. After cracking, the torque decreased rapidly, and the longitudinal reinforcement strain no longer increased. The longitudinal reinforcement strain corresponding to the ultimate torque was less than 100 με. It indicated that the contribution of the longitudinal reinforcement to the torsion capacity of the specimen without stirrups was weak. Additionally, there were little differences in the strain of the top, middle, and bottom longitudinal reinforcement, indicating that the longitudinal reinforcements at the top, middle, and bottom were in a similar stress state.
- In terms of specimens with stirrups (G-160-12D16-T, G-80-12D16-T, and G-80-12D19-T), they exhibited different performance in torque–longitudinal reinforcement strain curves. Before cracking, the longitudinal reinforcement strain was less than 100 με. After cracking, the longitudinal reinforcement strain suddenly increased and slowly continued to increase up to the ultimate torque. This showed that before cracking, the axial tension in the longitudinal reinforcement was relatively low. After cracking, there was a redistribution of internal stresses within the specimen, forming a new load transfer mechanism among the longitudinal reinforcement, stirrups, and concrete, leading to the sudden increase in longitudinal reinforcement strain.
- For specimen G-160-12D16-T, the average longitudinal reinforcement strains corresponding to ultimate torque were 863 με. For specimens G-80-12D16-T and G-80-12D19-T, the average longitudinal reinforcement strains corresponding to ultimate torque were 3018 με and 2042 με, respectively. It revealed that longitudinal reinforcement could provide sufficient tension force sustainably for partially over-reinforced specimens and over-reinforced specimens to form truss mode with longitudinal reinforcement, stirrup, and concrete structures. Comparing partially over-reinforced specimens and over-reinforced specimens, increasing the stirrup ratio could improve the torsion capacity. Higher torsion capacity resulted in more strains in longitudinal reinforcement. In comparison between G-80-12D16-T and G-80-12D16-T, the force transferred by the truss model in longitudinal reinforcement was similar, the average strain of G-80-12D16-T was higher than that of G-80-12D19-T due to smaller area of longitudinal reinforcement in G-80-12D16-T.
3.6. Strains in Transversal Reinforcement
- Generally, the torque–stirrup strain curves for the specimens G-160-12D16-T, G-80-12D16-T, and G-80-12D19-T exhibited similar behavior. Before concrete cracking, the stirrup strains were relatively small. After concrete cracking, the stirrup strains increased rapidly until they reached the ultimate torque. It indicated that the GFRP stirrups played a minor role before concrete cracking. However, after cracking, the GFRP stirrups could provide a certain enhancement to the torsion behavior of GFRP-RC beams.
- To compare the strains in different specimens, the average stirrup strain was approximately 3341 με with a standard deviation of 2131 με for specimen G-160-12D16-T. For specimen G-80-12D16-T, the average stirrup strain was approximately 4577 με with a relatively smaller standard deviation of 1664 με. For specimen G-80-12D19-T, the average stirrup strain was approximately 3364 με with a similar standard deviation of 1488 με. The strain distribution in the stirrups of over-reinforced specimens was less dispersed compared to partially over-reinforced specimens. This was mainly because the crack spacing in over-reinforced specimens was smaller than that in partially over-reinforced specimens, leading to more uniform tensile stress distribution across the stirrup legs in the partially over-reinforced specimen.
- To compare the strains in short and long stirrup legs, the ratio between strain in the short legs to the strain in the long legs of the GFRP stirrups in the middle of the test section was 0.39, 0.39, and 0.4 for specimen G-160-12D16-T, G-80-12D16-T, and G-80-12D19-T, respectively. Different from only long legs of stirrups cross the diagonal crack appeared in the beams under shear, both the short and long legs of stirrups were intersected by the spiral cracks in beams and participated in torsion resistance.
- The strain in the long leg of the ruptured stirrup was approximately 7600 με corresponding to 426 MPa, which was 0.88∙fbend,exp, and 0.39∙ffu. It indicated that 0.4∙ffu specified in CSA S806-12 proved to be reasonable for torsion design, while the stirrup strain limit 4000 με in CSA S9-6:19 and AASHTO GFRP-RC 2018 appeared to be conservative. In this study, the stirrup strain limit was regarded as the average of the ultimate strains of all stirrups that intersected the critical crack for all specimens. The stirrup strain limit of 5200 με was suggested for torsion design. However, due to limited test data, the stirrup strain limit should be further investigated.
3.7. Concrete Strain
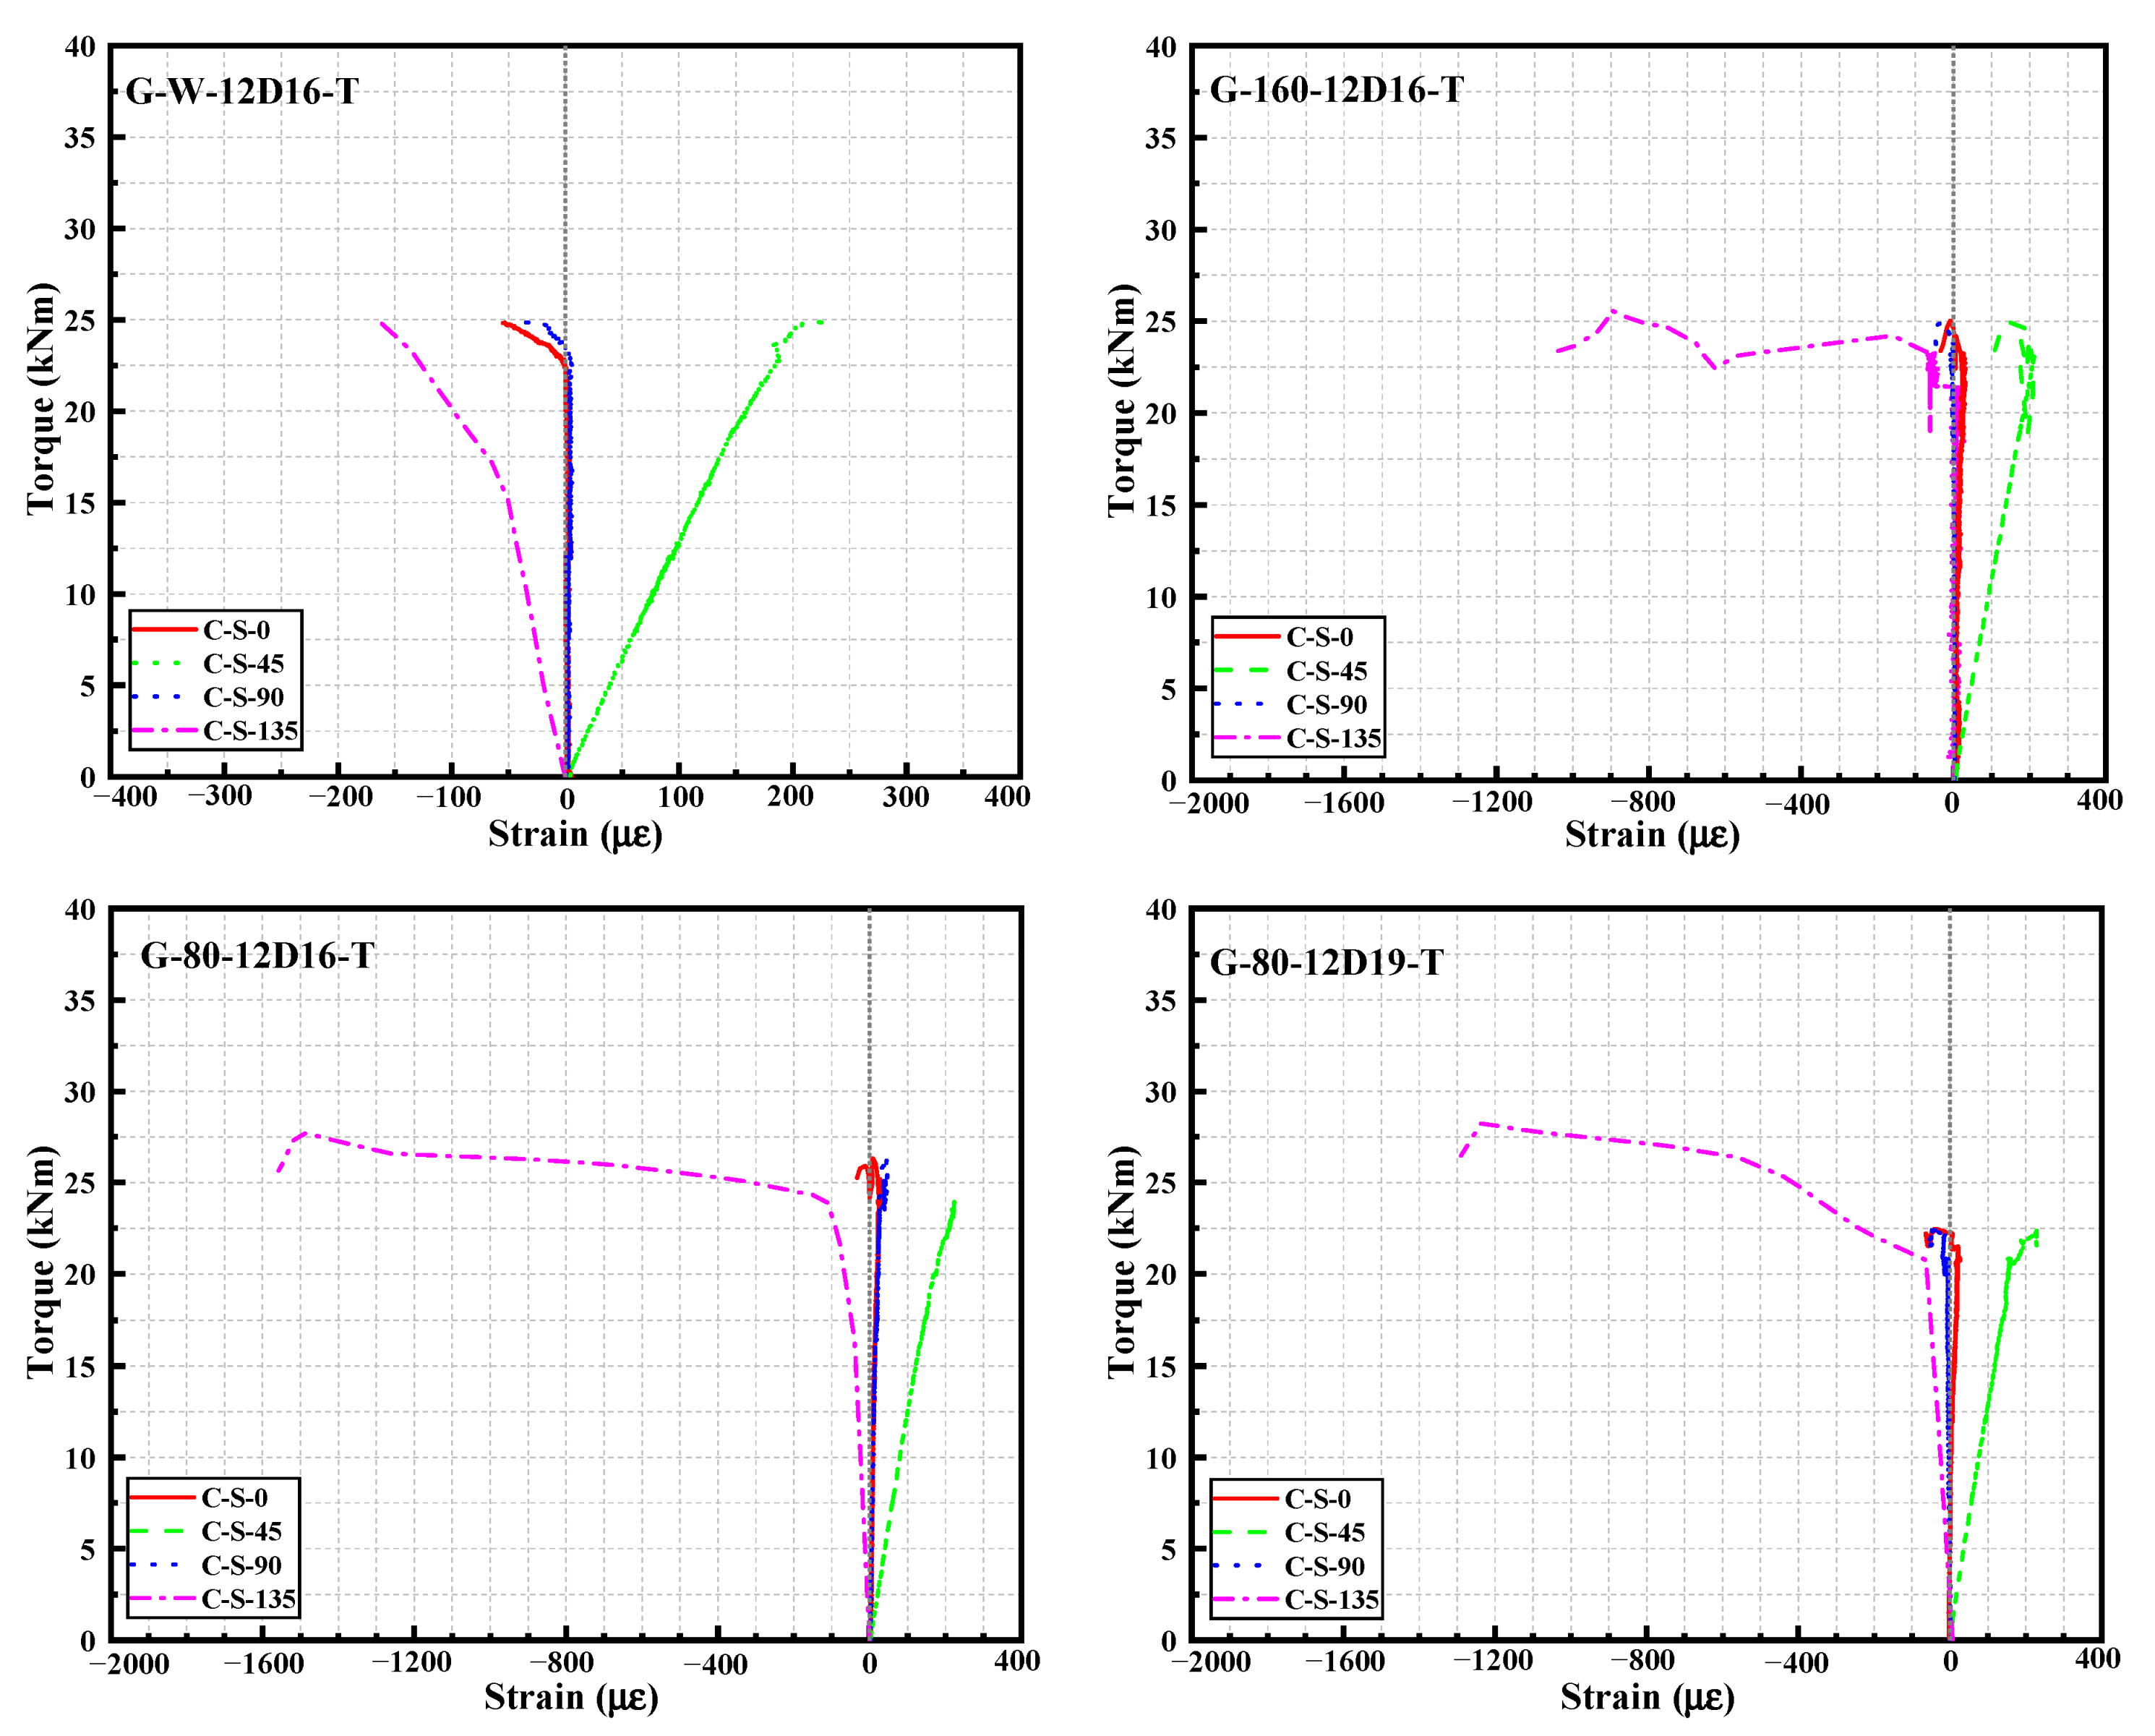
- In terms of concrete strains in 0-degree, 45-degree, and 90-degree directions, the torque–concrete strain curves for specimen without stirrups (G-W-12D16-T) and specimen with stirrups (G-160-12D16-T, G-80-12D16-T, and G-80-12D19-T) exhibited similar behavior. In all three directions, the concrete strain increased linearly with torque. The concrete strain in the 0-degree and 90-degree directions was below 50 με. The concrete strain in the 45-degree direction was approximately 200 με. Calculated with concrete strain in 0-degree, 45-degree, and 90-degree directions, the principle stress angle was about 45° for all specimens. It indicated that the surfaces of the specimens were under a pure shear stress state. The testing setup effectively achieved a pure torsion loading mode for the specimens.
- In terms of concrete strains in a 135-degree direction, for the specimen without stirrups, the compressive strain was below 200 με because of concrete cracking failure. For the partially over-reinforced specimen G-160-12D16-T, the compressive strain in the concrete at the ultimate torque was approximately 900 με. In contrast, for the over-reinforced specimens G-80-12D16-T and G-80-12D19-T, the compressive strain in the concrete at the ultimate torque was approximately 1500 με and 1200 με, respectively, with an average of 1350 με, which was 1.5 times the compressive strain at the ultimate torque for the partially over-reinforced specimen.
4. Evaluation of Torsion Design Equations and Design Suggestions
4.1. Evaluation of Torsion Capacity Equations
- Generally, the four codes underestimated the torsion capacity of FRP-RC beams. However, CSA S806-12 based on modified compression field theory provided the most accurate predictions with a mean of Texp/Tpre 1.48 and a standard deviation of 0.48. It could be attributed that the tensile strength of the FRP stirrup was regarded as 0.4 ffu which was greater than εlim∙Ef. The stirrup strain limit εlim was regarded as 4000 με for CSA S6-19 and AASHTO. and 5000 με for ACI 440.11-22.
- In terms of failure pattern, all codes provided the more conservative predictions for stirrup rupturing failure with a mean of Texp/Tpre over 1.95 compared to the predictions for concrete crushing failure. Particularly, CSA S806-12 provided an unsafety prediction with a mean of Texp/Tpre of 0.80. It indicated that the design equations in four codes should be used to calculate the torsion capacity of FRP-RC beams which failed due to stirrup rupturing.
- CSA S6: 19 provided the most conservative predictions with a mean of Texp/Tpre of 3.59. The tensile strength of stirrups specified in CSA S6: 19 was calculated by εlim∙Ef. Additionally, A0 was 0.85 times the area enclosed by the centerline of the stirrup. The concrete cover was disregarded to calculate the A0.
- CSA S6-19, AASHTO, and ACI 440.11-22 underestimated the torsion capacity of the AFRP-RC beam obviously, with a mean of Texp/Tpre over 6.18. Especially, the underestimation of torsion capacity occurred in AFRP-RC beams that failed due to stirrup rupturing. The Ef of AFRP bars was similar to that of GFRP bars. However, the ffu of the AFRP bar was about 2 times of the GFRP bars. However, εlim was used to calculate the tensile strength of stirrups in CSA S6-19, AASHTO, and ACI 440.11-22. The εlim was underestimated in calculating the torsion capacity of AFRP-RC beams.
4.2. Design Suggestions
5. Conclusions
- Three typical torsion failure patterns were observed, that is, concrete cracking failure for specimen without stirrups, stirrup rupturing failure for partially over-reinforced specimens, and concrete crushing failure for over-reinforced specimens. The variation of failure patterns can be achieved by the variation of stirrup ratio.
- Based on test data, the tangent angle of the spiral cracks was approximately 45°. The secant angle for specimens without stirrups was 31.8°, while the angle for specimens with stirrups ranges from 42°~47° with an average value of 44.2°.
- For specimens with the same longitudinal reinforcement ratio, the torsion capacity of the specimen without stirrups, partially over-reinforced specimens and over-reinforced specimens was 24.9 kN∙m, 25.6 kN∙m, and 27.8 kN∙m, respectively. When the stirrup ratio increased from 0 to 0.98%, the torsion capacity increased by 12%. For specimens with the same stirrup ratio, the torsion capacity was 27.8 kN∙m and 28.3 kN∙m for G-80-12D16-T and G-80-12D19-T, respectively. The longitudinal reinforcement ratio increased from 3.01% to 4.25%, showing an increase of only 1.8%.
- For specimens with the same longitudinal reinforcement ratio, the ultimate twist angle ϕu of the specimen without stirrups (G-W-12D16-T), partially over-reinforced specimens (G-160-12D16-T) and over-reinforced specimens (G-80-12D16-T) was 0.0018 rad/m, 0.0083 rad/m and 0.0403 rad/m, respectively. The increase in the stirrup ratio could enhance the torsion deformation capacity significantly.
- The longitudinal reinforcement strain in specimens without stirrups corresponding to ultimate torque was below 100 με, indicating that the axial tensile of the longitudinal reinforcement contributed to the torsion capacity insignificantly. The stirrups of partially over-reinforced specimens ruptured at the bend, with a rupture strain of approximately 7600 με.
- Regarding the beams with stirrup rupturing failure, CSA S806-12 provided the most accurate predictions with a mean of Texp/Tpre 1.95 and a standard deviation of 0.56. CSA S6: 19 provided the most conservative predictions with a mean of Texp/Tpre of 5.14 and a standard deviation of 3.11. In terms of torsion design, the crack angle of 45° and stirrup strain limit of 5200 με were suggested.
Author Contributions
Funding
Data Availability Statement
Acknowledgments
Conflicts of Interest
References
- Nanni, A.; De Luca, A.; Zadeh, J. Reinforced Concrete with FRP Bars Mechanics and Design; CRC Press: New York, NY, USA, 2014; pp. 3–7. [Google Scholar]
- Grace, N.; Jensen, A.; Eamon, D. Life-cycle cost analysis of carbon fiber-reinforced polymer reinforced concrete bridges. ACI Struct. J. 2012, 109, 697–704. [Google Scholar]
- Eamon, C.D.; Jensen, E.A.; Grace, N.F. Life-cycle cost analysis of alternative reinforcement materials for bridge superstructures considering cost and maintenance uncertainties. J. Mater. Civ. Eng. 2012, 24, 373–380. [Google Scholar] [CrossRef]
- Imjai, T.; Guadagnini, M.; Pilakoutas, K. Bend strength of FRP bars: Experimental investigation and bond modeling. J. Mater. Civ. Eng. 2017, 29, 04017024. [Google Scholar] [CrossRef]
- Koutchoukali, N.-E.; Belarbi, A. Torsion of High-Strength Reinforced Concrete Beams and Minimum Reinforcement Requirement. ACI Struct. J. 2001, 98, 462–469. [Google Scholar]
- Fang, I.-K.; Shiau, J.-K. Torsional Behavior of Normal- and High-Strength Concrete Beams. ACI Struct. J. 2004, 101, 304–313. [Google Scholar]
- Thomas, T.C.H. Torsion of Structural Concrete A Summary on Pure Torsion. ACI Symp. Pap. 1968, 18, 165–178. [Google Scholar]
- Hamdy, M.; Benmokrane, B. Torsion Behavior of Concrete Beams Reinforced with Glass Fiber-Reinforced Polymer Bars and Stirrups. ACI Struct. J. 2015, 112, 543–552. [Google Scholar]
- Hamdy, M.; Benmokrane, B. Reinforced Concrete Beams with and without FRP Web Reinforcement under Pure Torsion. J. Bridge Eng. 2016, 21, 04015070. [Google Scholar]
- Hamdy, M.; Omar, C.; Benmokrane, B. Torsional Moment Capacity and Failure Mode Mechanisms of Concrete Beams Reinforced with Carbon FRP Bars and Stirrups. J. Compos. Constr. 2015, 19, 04014049. [Google Scholar]
- Hadhood, A.; Gouda, M.G. Torsion in concrete beams reinforced with GFRP spirals. Eng. Struct. 2020, 206, 110174. [Google Scholar] [CrossRef]
- Xiong, H.; Li, B.; Jiang, J. Load path dependence of strain and stress for confined concrete. Mag. Concr. Res. 2016, 68, 604–618. [Google Scholar] [CrossRef]
- Deifalla, A.; Hamed, M.; Saleh, A.; Ali, T. Exploring GFRP bars as reinforcement for rectangular and L-shaped beams subjected to significant torsion: An experimental study. Eng. Struct. 2014, 59, 776–786. [Google Scholar] [CrossRef]
- Zhou, J.; Shen, W.; Wang, S. Experimental study on torsional behavior of FRC and ECC beams reinforced with GFRP bars. Constr. Build. Mater. 2017, 152, 74–81. [Google Scholar] [CrossRef]
- Deifalla, A. Torsional Behavior of Rectangular and Flanged Concrete Beams with FRP Reinforcements. J. Struct. Eng. 2015, 141, 04015068. [Google Scholar] [CrossRef]
- Mostafa, I.T.; Mousa, S.; Mohamed, H.M.; Benmokrane, B. Experimental and Analytical Behavior of GFRP-Reinforced Concrete Box Girders under Pure Torsion. J. Compos. Constr. 2024, 28, 04023064. [Google Scholar] [CrossRef]
- Hu, X.; Xue, W.; Xue, W. Bond properties of GFRP rebars in UHPC under different types of test. Eng. Struct. 2024, 314, 118319. [Google Scholar] [CrossRef]
- CAN/CSA S6:19; Canadian Highway Bridge Design Code (CAN/CSA S6:19). Canadian Standards Association: Rexdale, ON, Canada, 2019.
- ACI 440.1R-15; Guide for the Design and Construction of Structural Concrete Reinforced with FRP Bars. ACI Committee: Farmington Hills, MI, USA, 2015.
- AASHTO GFRP-RC 2018; Bridge Design Guide Specifications for GFRP-Reinforced Concrete. American Association of State Highway and Transportation Officials: Washington, DC, USA, 2018.
- GB 50608-2020; Technical Standard for Fiber Reinforced Polymer (FRP) in Construction. China Planning Press: Beijing, China, 2020.
- ACI 440.11-22; Building Code Requirements for Structural Concrete Reinforced with Glass Fiber Reinforced Polymer (GFRP) Bars-Code and Commentary. ACI Committee: Farmington Hills, MI, USA, 2023.
- CAN/CSA S806-12; Design and Construction of Building Structures with Fibre-Reinforced Polymers. Canadian Standards Association: Mississauga, ON, Canada, 2012.
- GB/T 50081-2002; Standard for Test Method of Mechanical Properties on Ordinary Concrete. China Building Industry Press: Beijing, China, 2002.
- ACI 440.3R-12; Guide Test Methods for Fiber Reinforced Polymer Composites for Reinforcing or Strengthening Concrete and Masonry Structures. ACI Committee: Farmington Hills, MI, USA, 2012.
- Xue, W.; Bai, H.; Hu, X.; Jiang, J. A Composite Torsion Test Loading Device of a Beam Member and a Test Method for Combined Action of Shear and Torsion. Chinese Patent. CN202211595007.3. 2022.
- Razaqpur, A.G.; Bencardino, F.; Rizzuti, L.; Spadea, G. FRP reinforced/prestressed concrete members: A torsion design model. Compos. Part B Eng. 2015, 79, 144–155. [Google Scholar] [CrossRef]
- ACI 318-19; Building Code Requirements for Structural Concrete Commentary on Building Code Requirements for Structural Concrete. ACI Committee: Farmington Hills, MI, USA, 2019.
- EN 1992-1-1; Eurocode 2: Design of Concrete Structures- Part 1-1: General Rules and Rules for Buildings. European Committee for Standardization: Brussels, Belgium, 1992.




| Specimens | Specimen Type | fc′ (MPa) | Stirrup Ratio ρt | Longitudinal Reinforcement Ratio ρl |
|---|---|---|---|---|
| G-W-12D16-T | Without stirrups | 39 | 0 | 3.01% |
| G-160-12D16-T | Partially over-reinforced | 39 | 0.49% | 3.01% |
| G-80-12D16-T | Over-reinforced | 42 | 0.98% | 3.01% |
| G-80-12D19-T | Over-reinforced | 41 | 0.98% | 4.25% |
| Reinforcement | Nominal Diameter (mm) | Ultimate Strength (MPa) | Bend Strength (MPa) | Elastic Modulus (GPa) |
|---|---|---|---|---|
| No. 16 GFRP | 16 | 1050 | - | 62 |
| No. 19 GFRP | 19 | 1090 | - | 60 |
| No. 10 GFRP | 10 | 1100 | 486 | 56 |
| Specimens | ϕcr(Rad/m) | ϕu(Rad/m) | ϕu/ϕcr | Tcr(kN∙m) | Tu(kN∙m) | Kun(kN∙m2) | Kcr(kN∙m2) | Failure Pattern |
|---|---|---|---|---|---|---|---|---|
| G-W-12D16-T | 0.0018 | 0.0018 | 1.0 | 24.9 | 24.9 | 13,833 | - | Concrete Cracking |
| G-160-12D16-T | 0.0016 | 0.0083 | 5.2 | 23.2 | 25.6 | 14,500 | 359 | Stirrup Rupturing |
| G-80-12D16-T | 0.0026 | 0.0403 | 15.5 | 24.1 | 27.8 | 9269 | 98 | Concrete Crushing |
| G-80-12D19-T | 0.0017 | 0.0244 | 14.4 | 20.9 | 28.3 | 12,294 | 326 | Concrete Crushing |
| Reference | Specimen | h (mm) | b (mm) | ρt (%) | Stirrup | Failure Pattern | Tu,exp (kN∙m) | Tu,exp/Tu,pre | |||
|---|---|---|---|---|---|---|---|---|---|---|---|
| CSA S806-12 | CSAS6: 19 | AASHTOGFRP-RC | ACI440.11-22 | ||||||||
| Reference [8] | BG120 | 600 | 250 | 0.47 | GFRP | SR | 52.7 | 1.51 | 3.19 | 3.01 | 2.55 |
| BG180 | 600 | 250 | 0.31 | GFRP | SR | 41.8 | 1.79 | 3.79 | 3.58 | 3.03 | |
| BG240 | 600 | 250 | 0.24 | GFRP | SR | 34.2 | 1.95 | 4.14 | 3.90 | 3.31 | |
| BG300 | 600 | 250 | 0.19 | GFRP | SR | 29.9 | 2.14 | 4.52 | 4.27 | 3.62 | |
| Reference [10] | BC120 | 600 | 250 | 0.47 | CFRP | SR | 62.9 | 1.09 | 1.31 | 1.24 | 1.05 |
| BC180 | 600 | 250 | 0.31 | CFRP | SR | 49.4 | 1.29 | 1.55 | 1.46 | 1.24 | |
| BC240 | 600 | 250 | 0.24 | CFRP | SR | 39.4 | 1.37 | 1.64 | 1.55 | 1.31 | |
| BC300 | 600 | 250 | 0.19 | CFRP | SR | 35.7 | 1.55 | 1.86 | 1.75 | 1.49 | |
| Reference [9] | BG60 | 600 | 250 | 0.94 | GFRP | CC | 56.9 | 0.81 | 1.72 | 1.62 | 1.38 |
| BC60 | 600 | 250 | 0.94 | CFRP | CC | 69.3 | 0.60 | 0.72 | 0.68 | 0.58 | |
| Reference [27] | AFRP | 150 | 115 | 1.91 | AFRP | CC | 3.7 | 0.51 | 1.26 | 0.77 | 1.00 |
| CFRP | 150 | 115 | 1.91 | CFRP | CC | 4.4 | 0.51 | 0.52 | 0.32 | 0.41 | |
| A1 | 220 | 140 | 0.26 | AFRP | SR | 8.0 | 2.10 | 7.36 | 6.13 | 5.89 | |
| A2 | 220 | 140 | 0.27 | AFRP | SR | 7.2 | 1.84 | 6.45 | 5.20 | 5.16 | |
| A3 | 220 | 140 | 0.26 | AFRP | SR | 9.2 | 2.39 | 8.38 | 6.99 | 6.71 | |
| A4 | 220 | 140 | 0.26 | AFRP | SR | 8.3 | 2.16 | 7.60 | 6.33 | 6.08 | |
| A5 | 220 | 140 | 0.26 | AFRP | SR | 10.1 | 2.62 | 9.21 | 7.67 | 7.37 | |
| A6 | 220 | 140 | 0.27 | AFRP | SR | 10.4 | 2.67 | 9.38 | 7.57 | 7.51 | |
| A7 | 220 | 140 | 0.26 | AFRP | SR | 11.5 | 2.99 | 10.48 | 8.74 | 8.38 | |
| A8 | 220 | 140 | 0.27 | AFRP | SR | 10.4 | 2.67 | 9.36 | 7.56 | 7.49 | |
| C1 | 220 | 140 | 1.20 | CFRP | CC | 10.0 | 0.53 | 0.82 | 0.64 | 0.65 | |
| C2 | 220 | 140 | 0.84 | CFRP | CC | 9.2 | 0.69 | 1.07 | 0.83 | 0.85 | |
| C3 | 220 | 140 | 1.01 | CFRP | CC | 10.0 | 0.77 | 1.08 | 0.87 | 0.87 | |
| C4 | 220 | 140 | 0.37 | CFRP | SR | 8.7 | 1.81 | 2.57 | 2.07 | 2.05 | |
| C5 | 220 | 140 | 0.84 | CFRP | CC | 13.6 | 1.01 | 1.57 | 1.22 | 1.25 | |
| C6 | 220 | 140 | 1.20 | CFRP | CC | 14.7 | 0.77 | 1.20 | 0.93 | 0.96 | |
| C7 | 220 | 140 | 1.01 | CFRP | CC | 12.3 | 0.94 | 1.32 | 1.07 | 1.06 | |
| C8 | 220 | 140 | 0.37 | CFRP | SR | 10.5 | 2.20 | 3.11 | 2.51 | 2.49 | |
| C9 | 220 | 140 | 1.20 | CFRP | CC | 12.8 | 0.67 | 1.04 | 0.81 | 0.83 | |
| This study | G-160-12D16-T | 400 | 200 | 0.49 | GFRP | SR | 25.6 | 0.88 | 1.73 | 1.42 | 1.39 |
| G-80-12D16-T | 400 | 200 | 0.98 | GFRP | CC | 27.8 | 0.90 | 1.76 | 1.45 | 1.41 | |
| G-80-12D19-T | 400 | 200 | 0.98 | GFRP | CC | 28.3 | 1.63 | 3.19 | 2.62 | 2.56 | |
| Code | In Total (32 Beams) | SR (19 Beams) | CC (13 Beams) | GFRP-RC (8 Beams) | CFRP-RC (15 Beams) | AFRP-RC (9 Beams) | ||||||
|---|---|---|---|---|---|---|---|---|---|---|---|---|
| MEAN | SD | MEAN | SD | MEAN | SD | MEAN | SD | MEAN | SD | MEAN | SD | |
| CSA S806-12 | 1.48 | 0.74 | 1.95 | 0.56 | 0.80 | 0.29 | 1.45 | 0.49 | 1.09 | 0.49 | 2.22 | 0.69 |
| CSA S6: 19 | 3.59 | 3.07 | 5.14 | 3.11 | 1.33 | 0.64 | 3.01 | 1.07 | 1.48 | 0.66 | 7.72 | 2.56 |
| AASHTO GFRP-RC | 3.02 | 2.54 | 4.37 | 2.49 | 1.06 | 0.56 | 2.73 | 1.07 | 1.23 | 0.57 | 6.33 | 2.19 |
| ACI 440.11-22 | 2.87 | 2.46 | 4.11 | 2.49 | 1.06 | 0.52 | 2.41 | 0.85 | 1.18 | 0.53 | 6.18 | 2.04 |
Disclaimer/Publisher’s Note: The statements, opinions and data contained in all publications are solely those of the individual author(s) and contributor(s) and not of MDPI and/or the editor(s). MDPI and/or the editor(s) disclaim responsibility for any injury to people or property resulting from any ideas, methods, instructions or products referred to in the content. |
© 2024 by the authors. Licensee MDPI, Basel, Switzerland. This article is an open access article distributed under the terms and conditions of the Creative Commons Attribution (CC BY) license (https://creativecommons.org/licenses/by/4.0/).
Share and Cite
Bai, H.; Jiang, J.; Xue, W.; Hu, X. Experimental Investigation on Pure Torsion Behavior of Concrete Beams Reinforced with Glass Fiber-Reinforced Polymer Bars. Buildings 2024, 14, 2617. https://doi.org/10.3390/buildings14092617
Bai H, Jiang J, Xue W, Hu X. Experimental Investigation on Pure Torsion Behavior of Concrete Beams Reinforced with Glass Fiber-Reinforced Polymer Bars. Buildings. 2024; 14(9):2617. https://doi.org/10.3390/buildings14092617
Chicago/Turabian StyleBai, Haoyang, Jiafei Jiang, Weichen Xue, and Xiang Hu. 2024. "Experimental Investigation on Pure Torsion Behavior of Concrete Beams Reinforced with Glass Fiber-Reinforced Polymer Bars" Buildings 14, no. 9: 2617. https://doi.org/10.3390/buildings14092617
APA StyleBai, H., Jiang, J., Xue, W., & Hu, X. (2024). Experimental Investigation on Pure Torsion Behavior of Concrete Beams Reinforced with Glass Fiber-Reinforced Polymer Bars. Buildings, 14(9), 2617. https://doi.org/10.3390/buildings14092617


