Article

Comparative Study on Heat Dissipation Performance of Pure Immersion and Immersion Jet Liquid Cooling System for Single Server

1
College of Urban Construction, Nanjing Tech University, Nanjing 211816, China
2
Department of Mechanical Engineering, Aalto University, 021050 Espoo, Finland
*
Author to whom correspondence should be addressed.
Buildings 2024, 14(9), 2635; https://doi.org/10.3390/buildings14092635
Submission received: 13 July 2024 / Revised: 19 August 2024 / Accepted: 22 August 2024 / Published: 25 August 2024
(This article belongs to the Special Issue High-Efficiency Heat Transfer Technology in Buildings)

Abstract

:
Heat dissipation has emerged as a critical challenge in server cooling due to the escalating number of servers within data centers. The potential of immersion jet technology to be applied in large-scale data center server operations remains unexplored. This paper introduces an innovative immersion jet liquid cooling system. The primary objective is to investigate the synergistic integration of immersion liquid cooling and jet cooling to enhance the heat dissipation capacity of server liquid cooling systems. By constructing a single-server liquid cooling test bench, this study compares the heat dissipation efficiencies of pure immersion and immersion jet liquid cooling systems and examines the impact of inlet water temperature, jet distance, and inlet water flow rate on system performance. The experimental outcomes show that the steady-state surface heat transfer coefficient of the immersion jet liquid cooling system is 2.6 times that of the pure immersion system, with increases of approximately 475.9 W/(m2·K) and 1745.0 W/(m2·K) upon adjustment of the jet distance and flow rate, respectively. Furthermore, the system model is streamlined through dimensional analysis, yielding a dimensionless relationship that encompasses parameters such as inlet water temperature, jet distance, and inlet water velocity. The correlation error is maintained below 18%, thereby enhancing the comprehension of the immersion jet cooling mechanism.

1. Introduction

As information technology advances rapidly, data centers have expanded in scale, and the computing power of servers has increased significantly, resulting in a continuous rise in their overall energy consumption. The Power Usage Effectiveness (PUE) is the primary indicator for assessing the energy efficiency of data centers. A PUE value approaching 1 suggests that the data center is highly efficient and aligns with low-carbon energy-saving standards [1]. In recent years, strategies like east–west computation and carbon neutrality have led to stricter governmental oversight of data center PUE indices. Most regions mandate PUE values below 1.3 for data centers, with some specifying even lower limits of 1.2 or 1.15. However, statistical data indicate that the average PUE for currently operational data centers is between 1.6 and 1.7, while newly designed centers average between 1.35 and 1.39 [2]. It is evident that reducing energy consumption and enhancing efficiency within the data center industry has become a central concern. Conventional air-cooled heat exchange systems are no longer sufficient for the heat dissipation demands of high-density servers. Therefore, addressing the issue of reducing data center energy consumption and fostering low-carbon sustainable development within the industry is an urgent necessity.
Liquid cooling technology, characterized by an elevated heat transfer coefficient, fluidity, and stability, has emerged as a pivotal innovation in data center refrigeration [3]. Data center liquid cooling encompasses two principal methods of heat dissipation: indirect and direct liquid cooling. Cold plate liquid cooling, the earliest form of indirect liquid cooling, has been widely used in data centers, high-performance computing, and other industries. In comparison to cold plate conduction, immersion liquid cooling—where the coolant is in direct interaction with the thermal source—offers higher thermal conductivity, greater specific heat capacity, a reduced temperature variation, and improved cooling efficiency [4]. Jet cooling, another advanced technique, involves directly spraying the coolant onto the heat transfer surface to facilitate heat exchange. This approach enhances cooling performance through localized convective heat transfer generated by the jet, making it particularly effective for managing heat dissipation in areas with concentrated heat loads [5,6].
In direct liquid cooling systems, where the coolant comes into direct contact with electronic components, maintaining insulation between the coolant and the devices is essential. Currently, common coolants include deionized water, ethylene glycol, fluorocarbon-based fluids, and mineral oils. Among these, deionized water, when used as an immersion fluid, offers significant advantages over non-conductive dielectric heat transfer fluids, including higher availability and reduced costs. Prior research has substantiated the efficacy of deionized water for cooling electronic equipment. Birbarah et al. [7] applied Parylene C, a material with electrical insulating properties, to printed circuit boards to prevent current leakage between electronic components and water, thereby allowing the direct immersion of electronic devices in water. This treatment results in a heat flux reaching 562 W/cm2 in water, double that of other dielectric coolants. Li et al. [8] developed a battery thermal management system by applying a silicone and boron nitride (SS/BN) sealant and subsequently performed water immersion cycling tests on the coated modules. It was observed that the battery module’s maximum temperature was capped at approximately 35 °C, demonstrating that the SS/BN module, when immersed in water, can mitigate the battery module’s temperature increase and safeguard its long-term safe operation. Jithin et al. [9] assessed the cooling effect of deionized water, mineral oil, and engineering fluid in a lithium-ion battery system under single-phase immersion mode. Studies have shown that the lower the viscosity of the coolant, the better its cooling effect. Compared to mineral oil and engineering fluids, deionized water effectively caps the temperature increase of lithium batteries at below 2.2 °C, exhibiting the lowest power consumption and pressure drop. Based on these findings, this study adopted strict insulation measures for the simulated thermal source and selected deionized water with its superior thermal conductivity and higher latent heat of vaporization as the coolant, thereby effectively improving the cooling efficiency.
In the realm of immersion jet cooling applications, prior research has primarily concentrated on the cooling of small electronic devices. Robinson et al. [10] examined a rectangular jet array with a diameter of 1.0 mm arranged at various spacings. They measured the mean heat transfer and pressure drop across different nozzle spacings and volume flow rates. Their findings indicated that for submerged jets, the heat transfer coefficient is strongly affected by nozzle spacing, with the smallest heat transfer coefficient for free surface jets occurring at H/dn = 10. Additionally, the relationship between the pump power required for the free surface jet and the submerged jet differs, with the submerged jet achieving a higher heat transfer coefficient. Sung et al. [11] combined the cooling effects of microchannel flow and micro-jet impingement with indirect refrigeration. Their studies demonstrated that increasing the jet velocity allows the jet to flow through the microchannel to the heated surface, thereby greatly reducing the wall temperature. Furthermore, a superposition technique was employed to segment the heat transfer surface into multiple regions, with every region governed by distinct heat transfer mechanisms and assigned unique heat transfer coefficient values. Barrau et al. [12] introduced a novel hybrid cooling method that merges the advantages of microchannel and jet impingement cooling technologies to optimize temperature uniformity in high heat flux power devices. Fan et al. [13] compared and analyzed the heat transfer performance between submerged jet impingement and confined jet impingement while also summarizing the performance of conventional coolants, dielectric fluids, and nanofluids. They also examined the impact of surface roughness, contact angle, heater size, and other parameters on boiling heat transfer. In a subsequent study, Fan et al. [14] studied the heat transfer characteristics of submerged jet impingement boiling, finding that increasing the jet velocity or reducing the nozzle diameter enhances single-phase flow heat transfer, while liquid subcooling has minimal impact on the single-phase heat transfer coefficient. While these schemes verify the superiority of immersion jet cooling technology in small electronic components, its application in large-scale, high-power density scenarios of data center servers remains in the early stages of exploration. To address this research gap, this paper proposes and validates the immersion jet liquid cooling system design tailored for data center servers. The applicability of immersion jet cooling technology is enhanced through the optimization and design of jet parameter configurations, nozzle layouts, and the integration of cooling systems.
The core innovation of the immersion jet liquid cooling system involves completely immersing the server in the coolant and integrating jet cooling to directly spray coolant onto the server surface for heat exchange. This effectively controls the server surface temperature and reduces the generation of hot spots. Furthermore, the immersion jet technology accelerates the coolant’s disturbance within the liquid cooler, ensuring that the fluid is distant from the nozzle, which also effectively contributes to heat transfer. This not only promotes the uniform distribution of the coolant but also significantly enhances its heat-carrying and transfer capabilities. The main focus of this study is to explore the integration of immersion liquid cooling with jet cooling, thereby enhancing the heat dissipation capacity of server liquid cooling systems. Through a comparative analysis of heat transfer performance against traditional immersion cooling systems, the significant benefits of immersion jet cooling technology in terms of temperature control and heat dissipation efficiency are clearly established.

2. Single Server Liquid Cooling Test Bench and Experimental Method

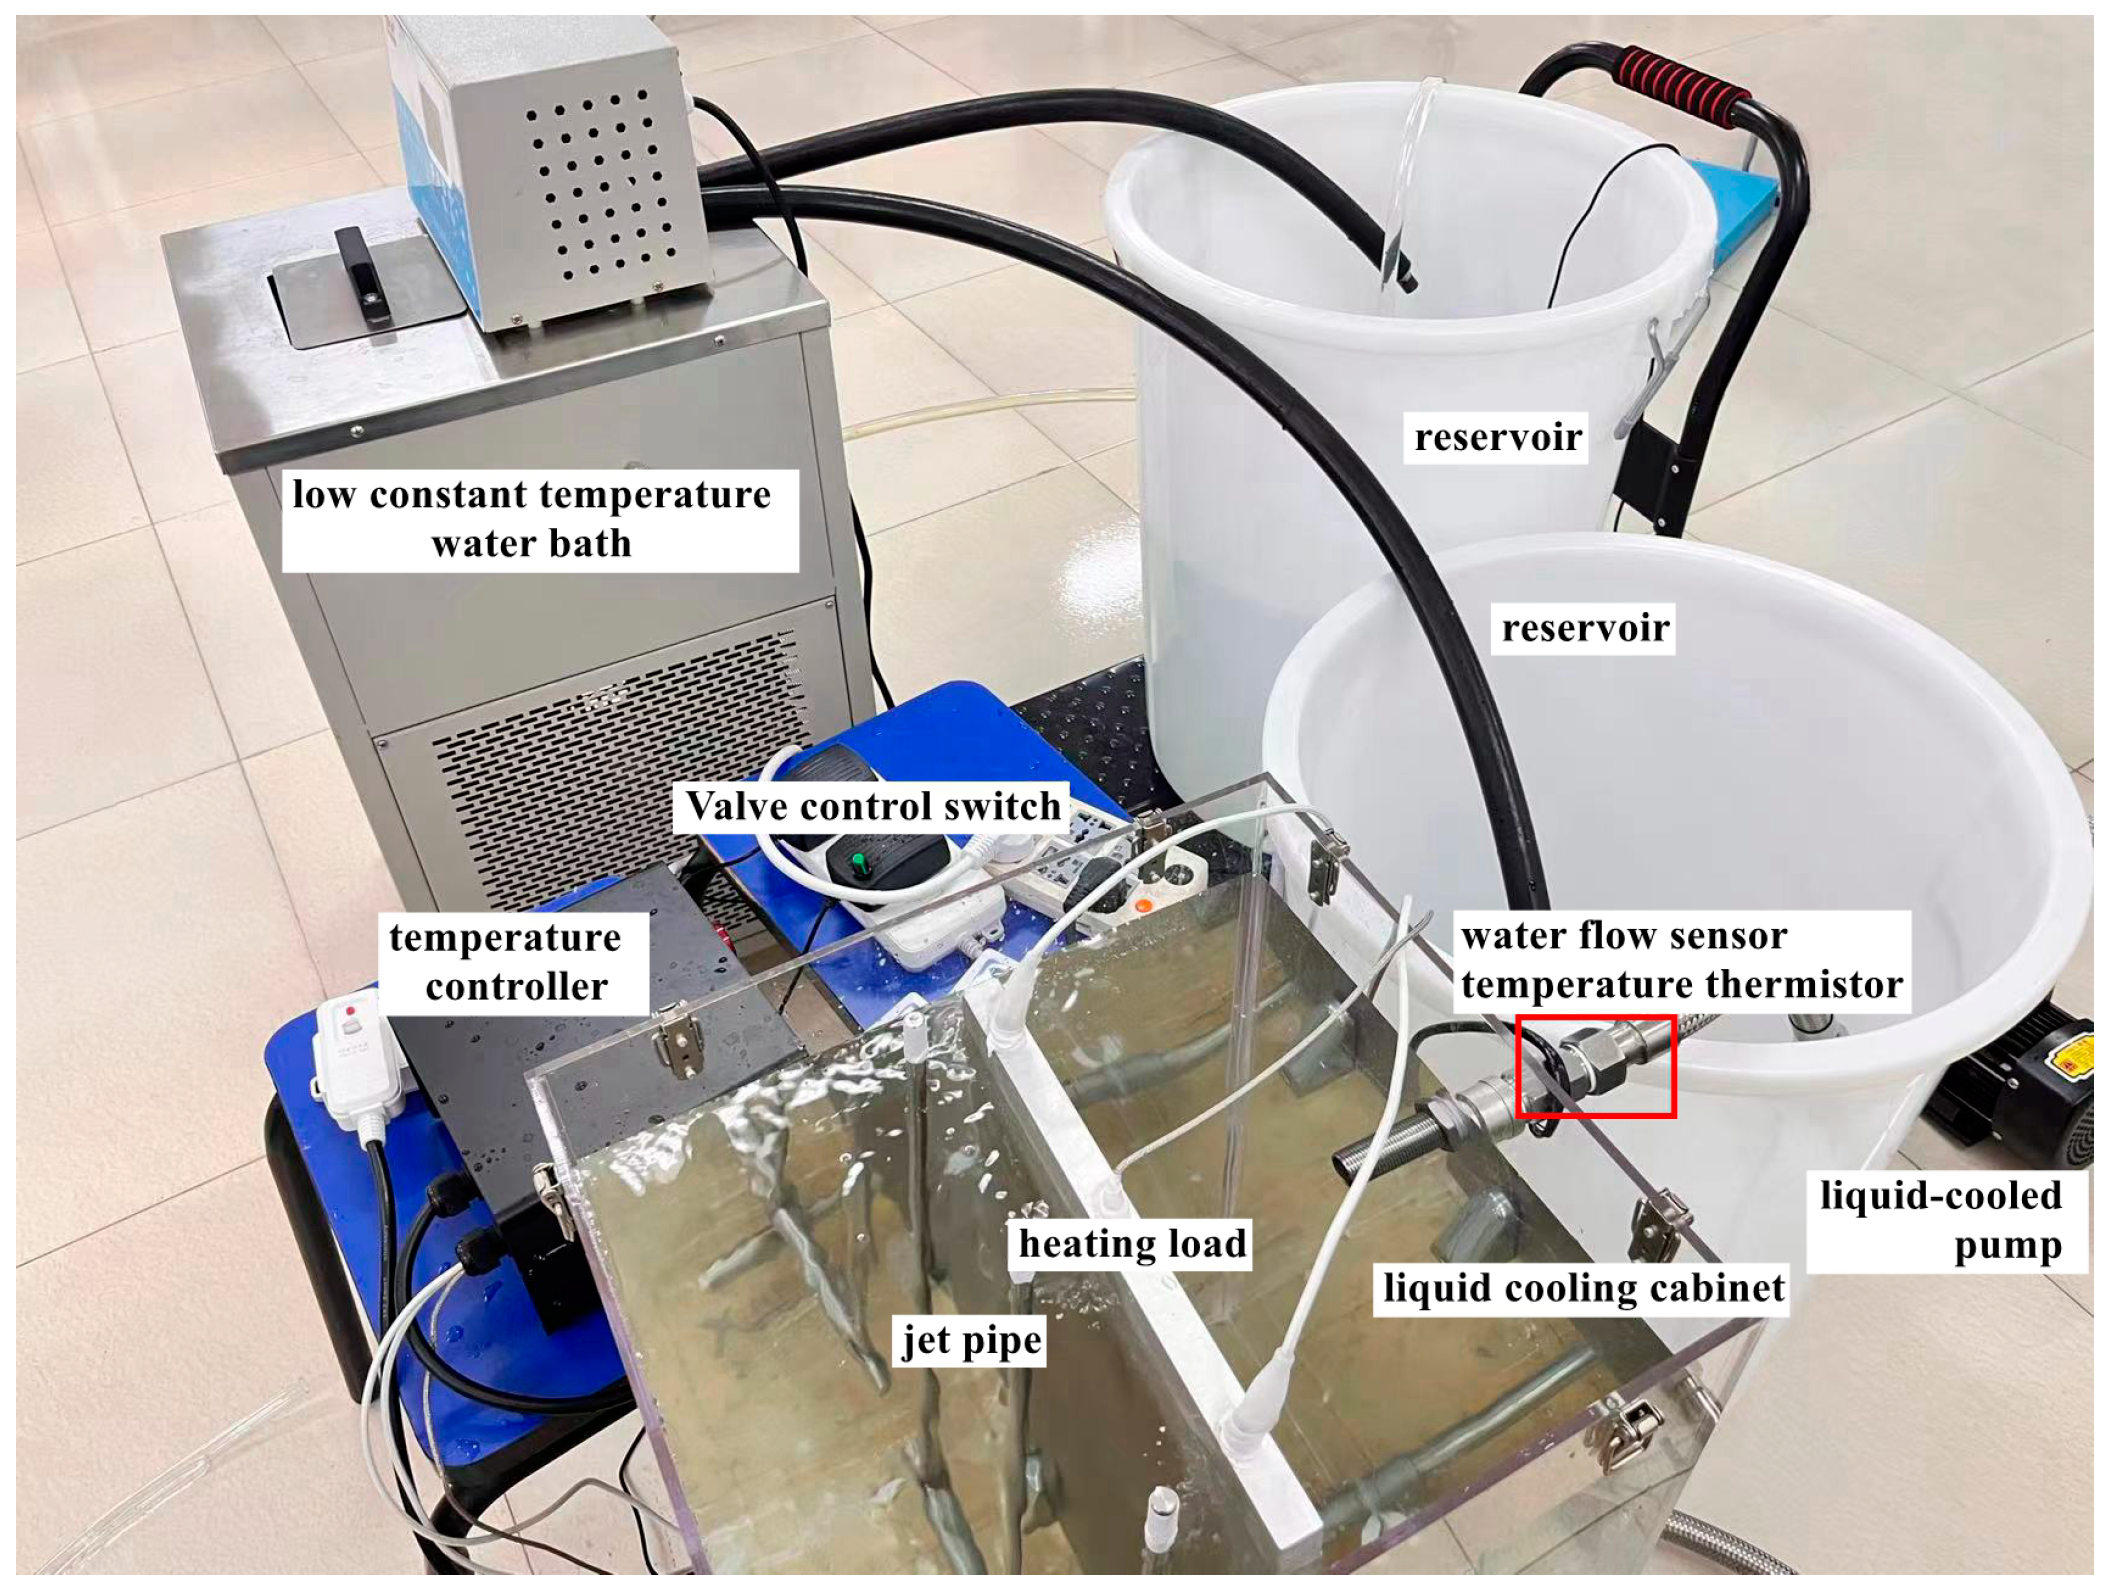
2.1. Immersion Jet Liquid Cooling Test Bench

This study presents the design and construction of an immersion jet liquid cooling test bench intended to emulate the heat dissipation process of a server within an immersion liquid cooling environment. Figure 1 illustrates a schematic representation of a single-server immersion jet cooling system. The test bench design incorporates considerations of the liquid cooler’s dimensions, the power density of the heating load, and the equipment selection. The impact of various parameters on heat dissipation performance was studied by adjusting the inlet temperature, jet distance, and inlet flow rate (Figure 2).

2.1.1. Immersion Part Design

Immersion liquid cooling is categorized into two types: single-phase and two-phase cooling [15]. The study primarily focuses on single-phase immersion liquid cooling, wherein deionized water remains in a single phase throughout the heat transfer process. The experimental platform consists of a liquid cooling cabinet, heating load, water pump, and data acquisition system. The dimensions of the liquid cooler are 0.4 m × 0.35 m × 0.8 m, with the enclosure walls fabricated from transparent acrylic to facilitate experimental observation, as shown in Figure 3. The outer wall of the liquid cooler is equipped with an inlet and an outlet, and the heating load is positioned above the inner wall. The layout of the heating load ensures that its bottom is in contact with the inner wall of the liquid cooler, the top height is lower than the outlet, and it is parallel to both sides of the box. Figure 4 displays the simulated server’s heating load, which measures 0.3 m × 0.6 m × 0.02 m and is rated at 3500 W. The heating element uses a high-temperature-resistant tubular electric heating element configured in an M-shape to achieve uniform heating. The temperature controller includes a buffer function to ensure the accuracy of temperature control of the heating plate and to avoid overshoot.
Driven by the liquid cooling pump, the coolant enters the liquid cooler through the inlet, fully immersing the heating load and absorbing the heat to achieve dissipation. The system regulates the inlet water temperature using a low constant temperature water bath, set at 18 °C, 22 °C, and 27 °C to emulate various environmental conditions. The high-temperature water, after heat exchange with the heat load, flows out through the outlet and enters the pipeline connecting to the low constant temperature water bath. When the coolant circulates in the water bath, it exchanges heat with the refrigerant, transferring heat to the refrigerant and cooling itself. After cooling, the water returns to the inlet of the liquid cooler through the pipeline. The load was heated to 60 °C, initiating the circulation of the water system. The experiment monitored the temperature variations on the heating load’s surface and the internal temperature gradients within the liquid cooler.

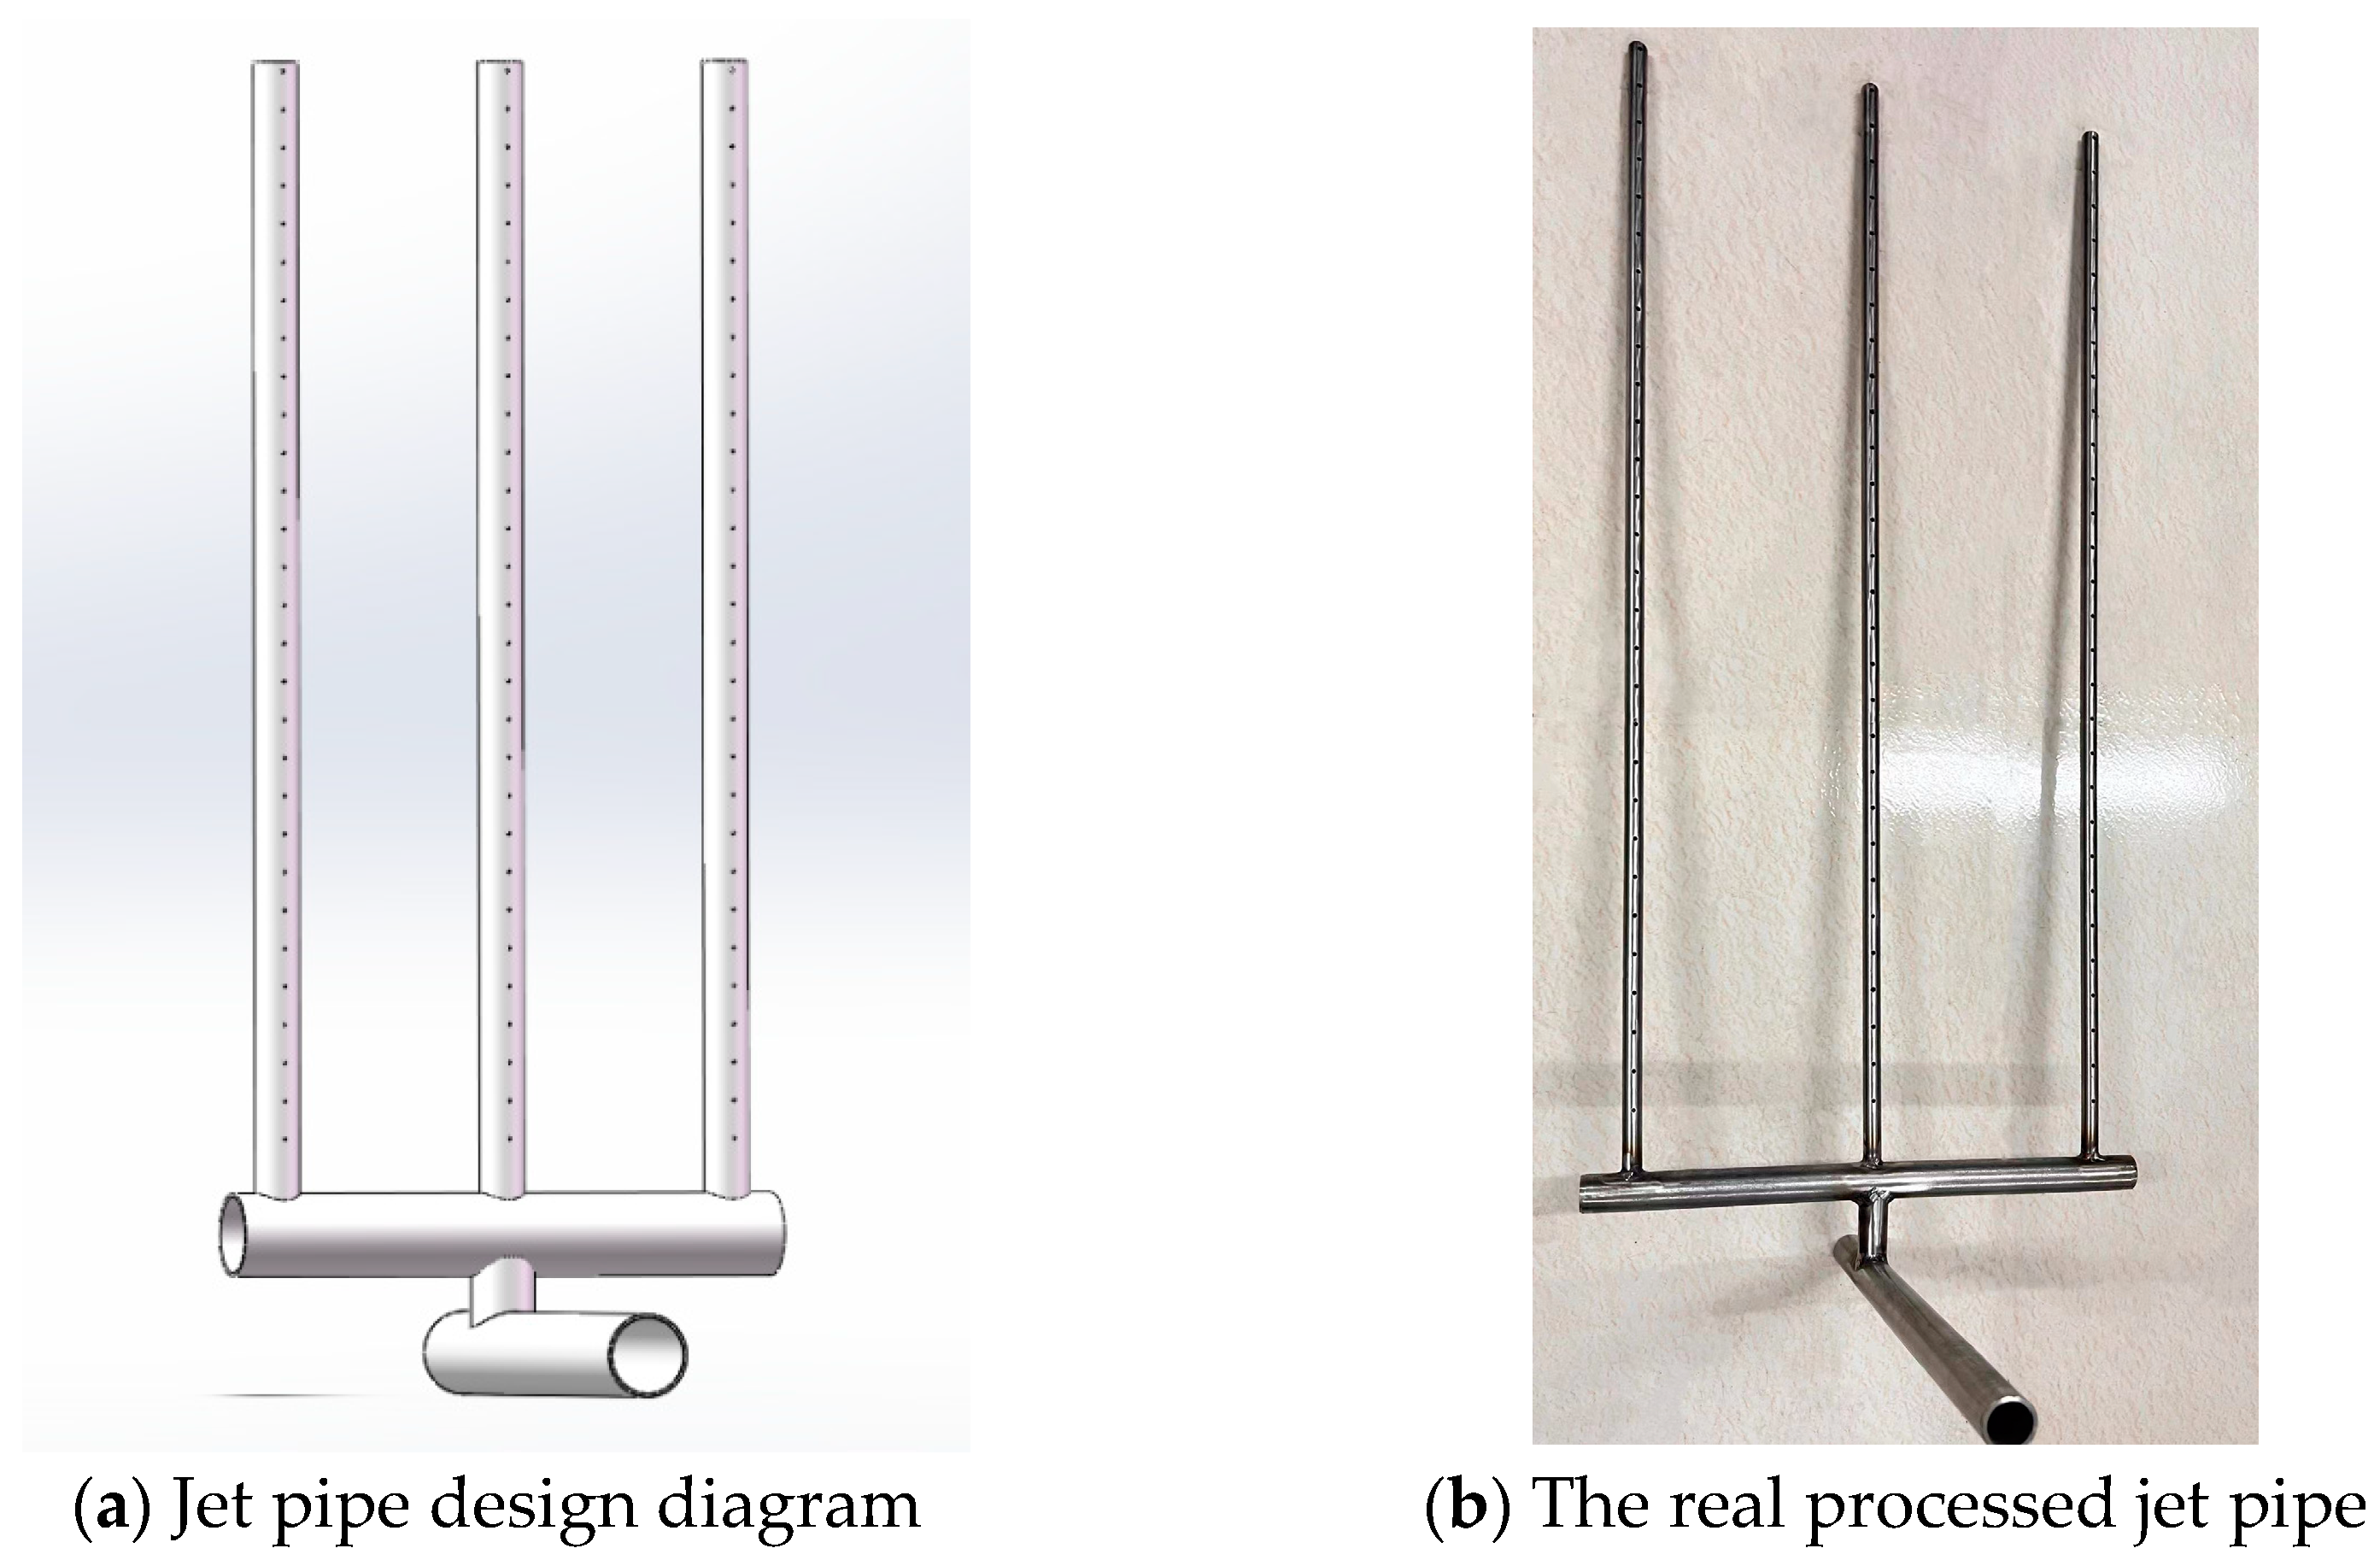
2.1.2. Jet Part Design

Based on immersion liquid cooling, the horizontal main pipe of the coolant is connected to the liquid inlet of the liquid cooler, with its vertical main pipe penetrating the cooler’s inner wall to establish a connection with the jet horizontal pipe. The jet horizontal pipe is positioned close to the bottom of the inner wall of the liquid cooler, with three jet risers arranged equidistantly along it. Coolant is sprayed through the jet impingement holes on these risers, covering the server’s surface and creating multiple regions of high convective heat transfer, thereby enhancing the cooling effect.
Figure 5 presents the design and fabrication diagram of the jet pipe. The specific dimensional parameters are detailed below: the horizontal main pipe of the coolant features a diameter of 20 mm and a length of 300 mm; the vertical main pipe features a diameter of 16 mm and a height of 40 mm. The horizontal tube has a diameter of 20 mm and a length of 300 mm. The jet riser measures 12 mm in diameter and 600 mm in height, with small holes of 1.8 mm in diameter spaced 20 mm apart.
During the experiment, the coolant passes through the inlet from the horizontal main pipe and completely submerges the heating load. Simultaneously, coolant is expelled through the jet standpipe’s impact hole at high velocity via the vertical dry pipe and the jet horizontal pipe, impinging directly on the heating load’s surface for efficient heat dissipation. After mixing with the submerged coolant, the sprayed coolant exits through the outlet adjusts its temperature through the low constant temperature water bath, and returns to the liquid cooler to complete the cycle.
This study thoroughly evaluates the impact of various parameters on the heat dissipation efficacy of the immersion jet liquid cooling system, as detailed in Table 1. Two experimental conditions were established:
Condition A: The load heating temperature is kept constant at 60 °C, with an inlet deionized water temperature of 22 °C and a jet flow rate of 13 L/min. The jet distance varies to 10 cm, 5 cm, 3 cm, and 1 cm, respectively, to assess both the temperature of the heating load and the internal temperature of the liquid cooler.
Condition B: The load heating temperature is kept constant at 60 °C, with an inlet deionized water temperature of 22 °C and a jet distance of 3 cm. The jet flow rate varies to 8 L/min, 13 L/min, and 18 L/min, and both the load temperature and the internal temperature of the liquid cooler were measured.

2.2. Experimental Method and Instrument Parameters

2.2.1. Experimental Procedure

  • The ambient temperature of the laboratory was controlled at 28 ± 2 °C, and the humidity was maintained at 40 ± 5% RH. There was no significant external heat or cold source interference.
  • A liquid-cooled test bench was constructed with installed pipeline systems and instrument accessories. Heating loads were positioned on the inner wall of the liquid-cooled cabinet, and a dedicated temperature controller was connected to regulate the heating plate’s temperature.
  • The heating load was heated to 60 °C by the temperature controller, and the inlet water temperature of the coolant was set and adjusted using a low constant temperature water bath (18 °C, 22 °C, 27 °C). The jet distance (10 cm, 5 cm, 3 cm, 1 cm) and the inlet water flow rate (8 L/min, 13 L/min, 18 L/min) were adjusted according to the experimental design requirements.
  • The experiment was initiated, and the surface temperature changes in the heating load were continuously monitored. The experiment continued until the heating load’s surface temperature achieved a steady state, defined as a temperature fluctuation within the ±0.5 °C error margin, indicating that thermal equilibrium had been attained within the system.
  • Once the heating load surface temperature stabilized, the outlet temperature of the coolant, along with the temperatures at the upper, middle, and lower levels of the liquid cooler, were recorded.
  • To ensure the reliability and repeatability of the experimental results, each experimental condition was repeated three times. Each experiment was performed according to the above steps, and the data were recorded separately. To reduce the influence of random error, the arithmetic mean of the corresponding temperature readings from the three experiments was taken.
  • Based on the collected data, the heat dissipation capability of the immersion jet liquid cooling system was evaluated against that of the pure immersion liquid cooling system. Specific parameters such as jet distance and flow rate were evaluated to ascertain their respective impacts on system heat dissipation efficiency.

2.2.2. Laboratory Apparatus

The specific equipment information of the system is shown in Table 2.

2.3. Error Analysis

Heat flux density, described as the heat transfer rate per unit area over a given time, is a critical physical quantity for characterizing heat transfer processes. The detailed formula is presented as follows:
q = Q A
where q represents the heat flux density on the exposed area of the heating load, W/m2; Q is the electrical power consumed by the heating load, W; A denotes the contact area between the heating load and the coolant, m2.
The surface heat transfer coefficient of the simulated thermal source is calculated as:
h = q T W T i n
where h denotes the surface heat transfer coefficient, W/(m2·K); TW is the temperature of the simulated thermal source surface, K; Tin is the inlet temperature of the coolant, K.
Temperature measurements of the heating load were performed using a K-type thermocouple, with an uncertainty of ±0.8 K. Additionally, a digital thermometer was employed to record the coolant’s inlet and outlet temperatures, with an uncertainty of ±0.5 K. The uncertainty in the thermocouple installation position, primarily due to the limitations of the laser drilling method, is ±0.1 mm. Furthermore, physical damage to the surface of the heating load during production and handling introduces an additional uncertainty of ±0.05 mm.
The error transfer formula is as follows [16]:
δ R R = ( δ X 1 X 1 ) 2 + ( δ X 2 X 2 ) 2 + + ( δ X M X M ) 2
where R is a factor that needs to calculate the error; X1~XM are all variables related to this factor.
The uncertainty in heat flux density is described by the following:
δ q q = ( δ A A ) 2 + ( δ T T ) 2 + ( δ y y ) 2
where A represents the contact area between the heating load and the coolant, m2; T is the temperature recorded by the K-type thermocouple, K; y is the separation between the thermocouple and the exposed area of the thermal source, mm.
The uncertainty in the surface temperature of the simulated thermal source is as follows:
δ T W T W = ( δ T T ) 2 + ( δ y Δ y ) 2
The uncertainty of surface heat transfer coefficient is as follows:
δ h h = ( δ q q ) 2 + ( δ T W T W T in ) 2 + ( δ T in T W T in ) 2
where Tin is the inlet temperature of the coolant, K.
The calculated errors in the experiment for heat flux density, surface temperature, and surface heat transfer coefficient are 3.7%, 2.4%, and 6.1%, respectively.

3. Experimental Results and Analysis

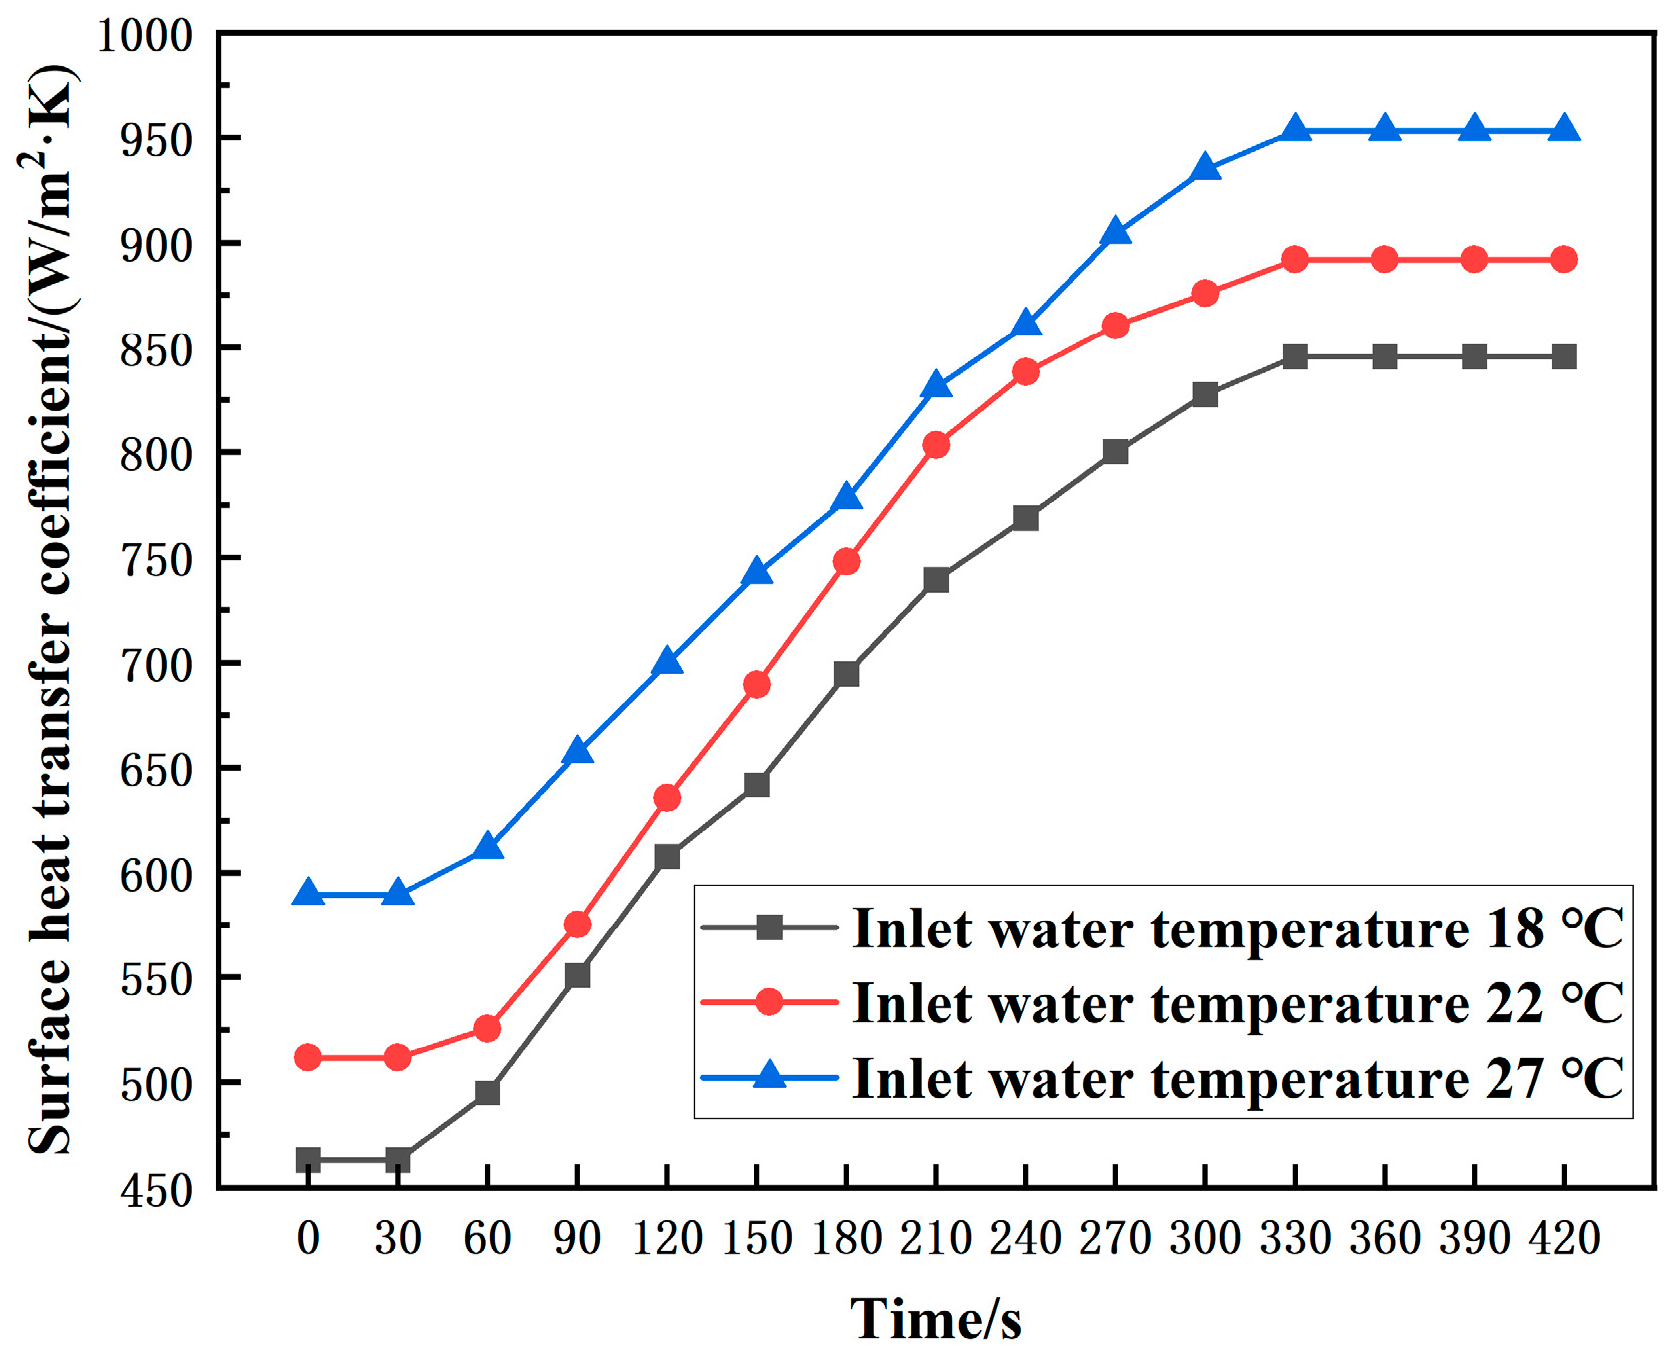
3.1. Experimental Results of Immersion Liquid Cooling System

This section analyzes the heat dissipation performance of immersion liquid cooling systems across varying inlet water temperatures. Studies have demonstrated that server temperatures vary according to different traffic environments [17]. As task processing commences, the CPU temperature escalates rapidly to approximately 50 °C, whereas under high traffic conditions, the CPU temperature may reach approximately 65 °C. Hence, a temperature of 60 °C was chosen as the constant load heating temperature for the experiment. Given the necessity of maintaining an adequate safety margin between the server chip’s operating temperature and its limit temperature, studies have indicated that the inlet temperature of the coolant on the cold source side is typically capped at 45 °C [18]. However, it should be noted that an increase in the coolant inlet temperature correlates with increased server power consumption [19], thus affecting the overall efficiency of the system. To optimize the heat dissipation effect and explore the optimal heat transfer conditions, this paper selects a lower inlet temperature span of 18 °C to 27 °C, thereby achieving an increased thermal gradient.
Table 3 clearly illustrates a direct correlation between the increase in the inlet water temperature and the corresponding rise in the outlet water temperature, highlighting the system’s thermal response to varying input conditions. When the inlet temperature is elevated from 18.0 °C to 27.0 °C, the outlet temperature concurrently rises from 27.0 °C to 32.3 °C, demonstrating that the coolant effectively absorbs the heat generated by the heating load, consistent with fundamental thermodynamic principles. Although decreasing the inlet water temperature can markedly enhance the server’s heat dissipation efficiency, it concurrently results in an augmented temperature gradient between the inlet and outlet waters. A decrease of 9 °C in the inlet water temperature is observed to cause a 3.7 °C elevation in the temperature differential between the inlet and outlet, signifying a corresponding increase in the system’s thermal load.
Further examination of the temperature distribution within the liquid cooler was conducted. The experimental data show that at an inlet temperature of 18.0 °C, although the temperature of the coolant inside the liquid cooler is the lowest, the temperature difference under this condition is the largest. At an inlet temperature of 22.0 °C, the outlet temperature is 28.9 °C, the corresponding temperature difference is 6.9 °C, and the temperature gradient inside the liquid cooler is 6.5 °C, indicating a smaller temperature difference and a better cooling state. The upper temperature of the coolant inside the liquid cooler is greater than at the bottom, indicating that the heat transfer efficiency of the upper part of the liquid cooler may be insufficient, resulting in heat accumulation in this area. This non-uniformity of temperature distribution, particularly during conditions of elevated heat loads, may adversely affect the system’s overall heat dissipation performance [20]. To optimize the heat dissipation effect and achieve a more consistent heat flux distribution, adjustments to the design of the liquid cooling system are necessary.
Figure 6 illustrates the trend of surface temperature variation in the heating load under various inlet water temperatures in the immersion liquid cooling system. At the outset of the experimental phase, a substantial temperature differential exists between the coolant and the heating load, resulting in rapid heat exchange and a swift decline across all temperature curves. As time elapsed, the rate of temperature decrease progressively diminished, achieving stabilization after 300 s, signifying the system’s progression toward a state of thermal equilibrium. When the inlet temperature is adjusted to 18 °C, the temperature of the heating load surface finally stabilizes at about 41.0 °C. Incrementing the inlet temperature to 22 °C elevates the stable temperature to 43.8 °C. At an inlet water temperature of 27 °C, the heating load surface temperature stabilizes at 47.4 °C, which is marginally higher than the former two.
Figure 7 depicts the fluctuations in the surface heat transfer coefficient over time under varying inlet water temperatures. Maintaining a constant heat flux density on the heating load surface causes inlet temperature to result in a smaller temperature difference with the simulated thermal source, thereby leading to a higher transient surface heat transfer coefficient. Approximately 30 s into the experiment, the surface temperature of the heating load gradually decreased while the heat transfer coefficient increased rapidly. Throughout the experimental progression, the coolant continuously absorbed heat while the heating load released heat continuously. The system gradually approached thermal equilibrium, with the heat transfer coefficient stabilizing. At inlet water temperatures of 18 °C, 22 °C, and 27 °C, the system’s steady-state surface heat transfer coefficients are 845.4 W/(m2·K), 891.9 W/(m2·K), and 953.2 W/(m2·K), respectively. These data suggest that the inlet temperature is a critical parameter influencing the performance of the immersion liquid cooling system. To attain greater cooling efficiency and reduce the heat load surface temperature, selecting the appropriate inlet water temperature is essential.

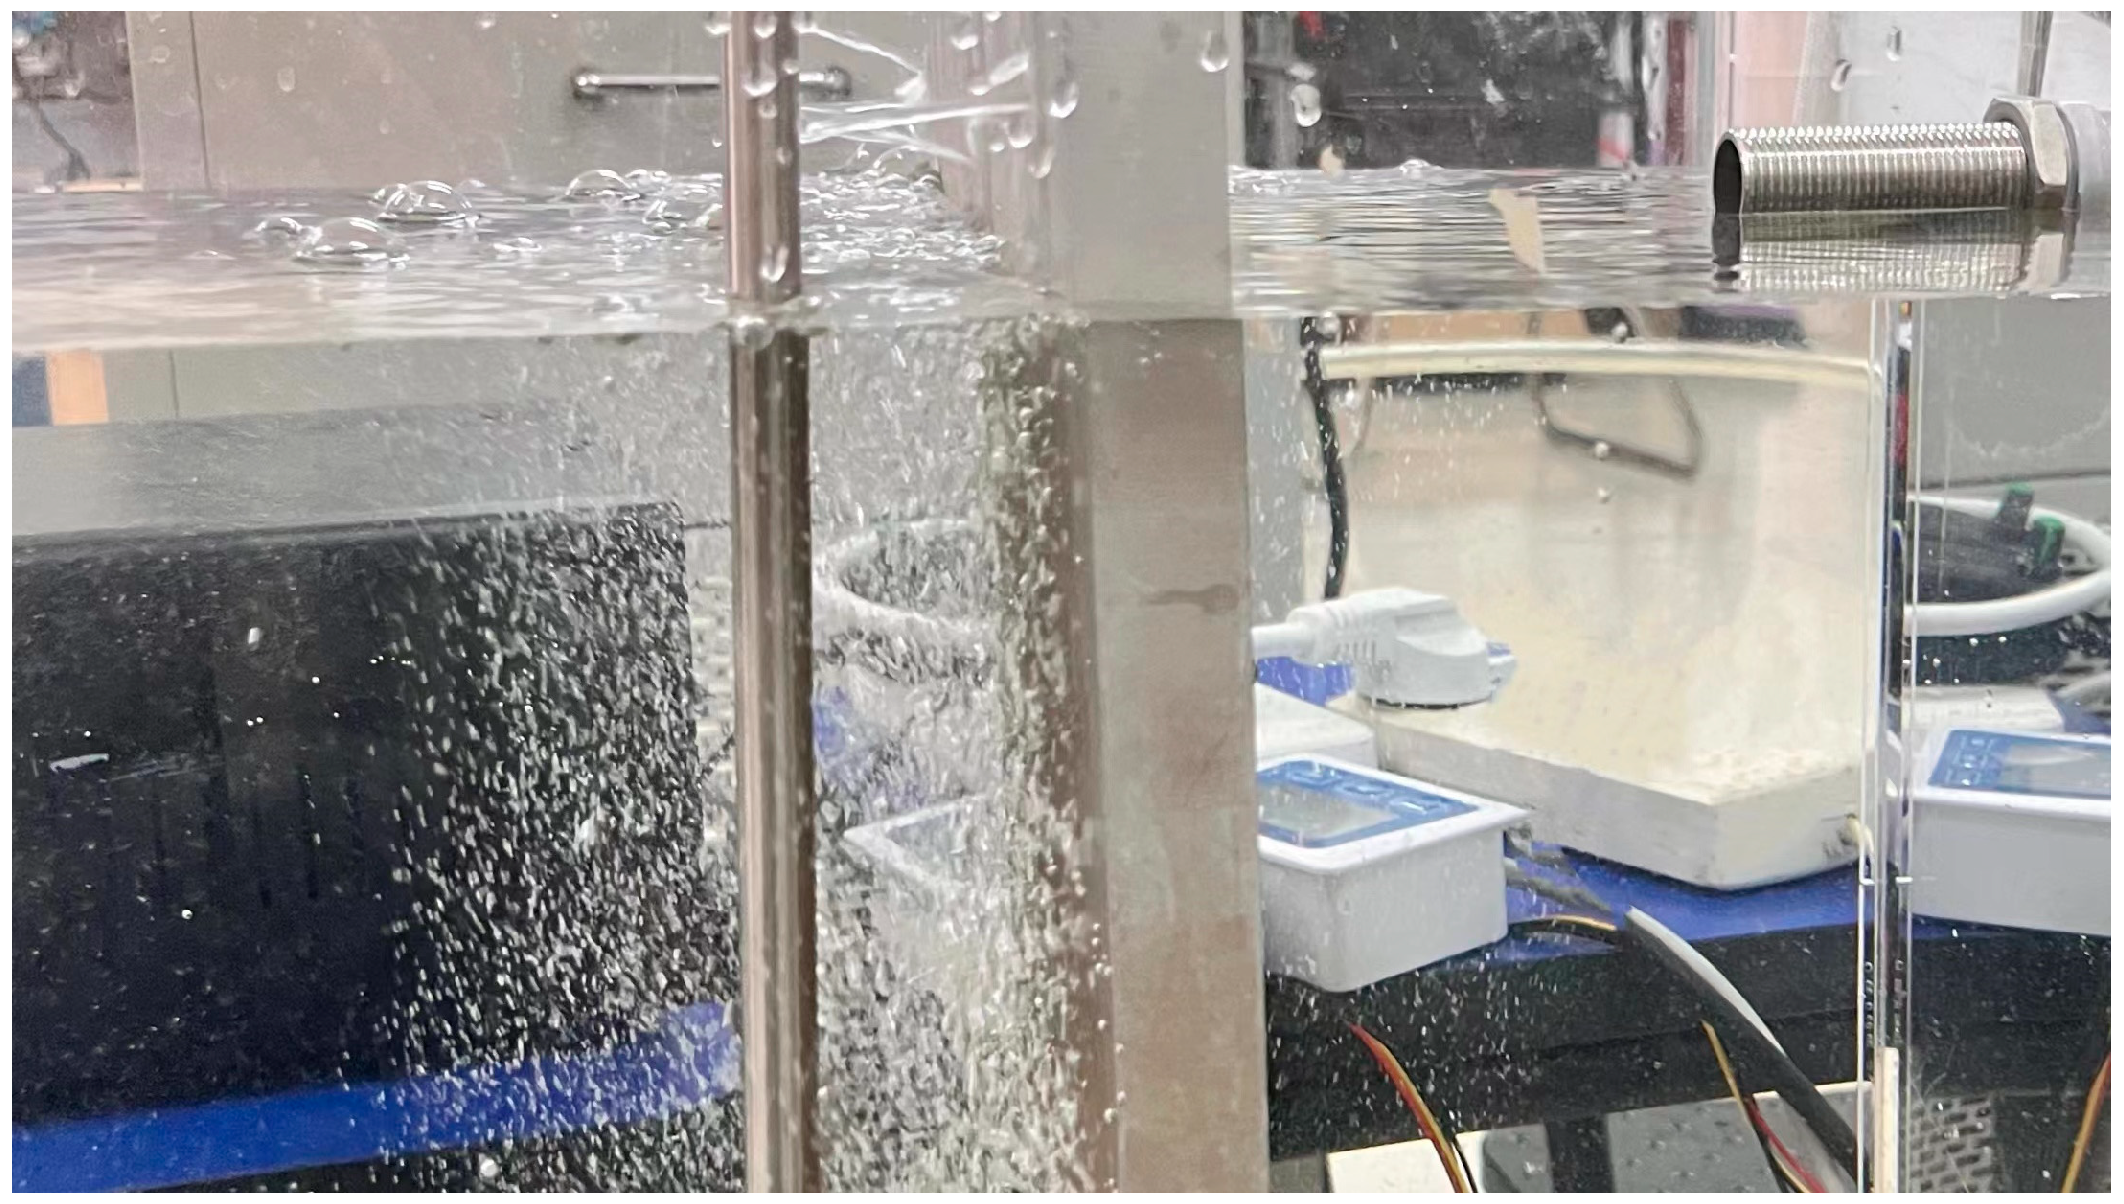
3.2. Experimental Results of Immersion Jet Liquid Cooling System

Deionized water offers higher purity and lower conductivity than tap water, thereby reducing potential interference with experimental results. Figure 8 shows the pivotal jet process within the immersion jet liquid cooling system. The jet device generates a high-speed fluid jet through the jet hole, directly impacting the surface of the heating load and enhancing the thermal mixing between the coolant and the thermal source.

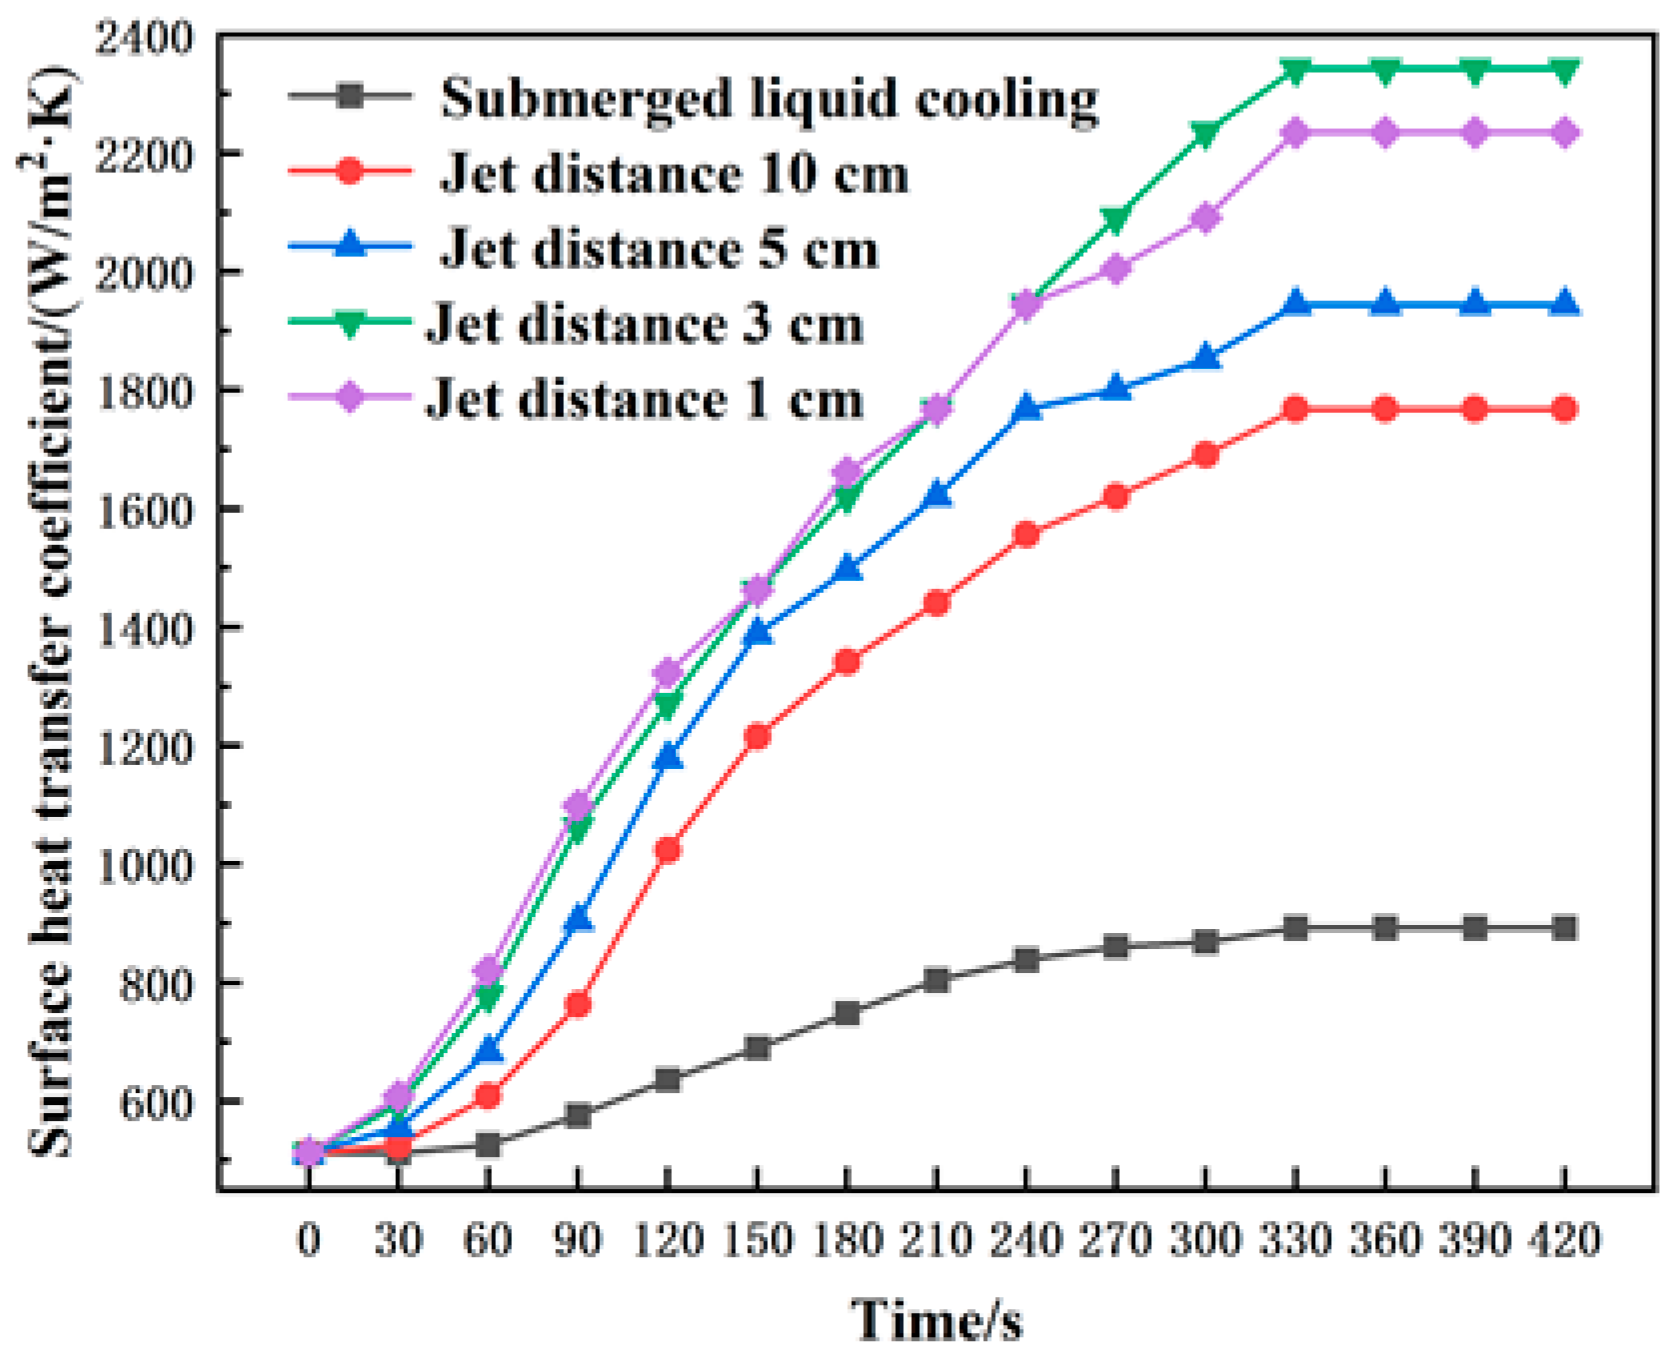
3.2.1. Comparison of Heat Dissipation Effect of Different Jet Distance

This section evaluates the impact of jet distance on the efficacy of heat dissipation within the immersion jet liquid cooling system. With an inlet temperature set at 22 °C, the inlet–outlet temperature difference measures 6.9 °C, complemented by an internal temperature gradient of 6.5 °C. Relative to the temperature difference at an inlet temperature of 18 °C, these values exhibit a reduction. In addition, although the steady-state surface heat transfer coefficient at 22 °C is 891.9 W/(m2·K), slightly lower than 953.2 W/(m2·K) at 27 °C, the surface temperature of the heating load at 22 °C is 3.6 °C lower than at 27 °C. Consequently, taking into account the control of temperature differentials, the efficiency of heat exchange, and the surface temperature of the heat load, an inlet water temperature of 22 °C was selected for the experimental setup.
In contrast to pure immersion liquid cooling systems, the coolant temperature in the upper section of the immersion jet system’s cooler diminished, whereas temperatures in the middle and lower sections were relatively increased. This phenomenon indicates that the jet effect facilitates more thorough mixing and disturbance within the cooler, thereby promoting a uniform temperature distribution and enhancing the coolant’s heat-carrying capacity. Figure 9 illustrates that, under identical inlet water temperatures and flow rates, the pure immersion system stabilizes the heating load’s surface temperature at approximately 43.8 °C, whereas the immersion jet system effectively lowers the temperature to a range of 30 °C to 33 °C, significantly below that of the pure immersion system. Furthermore, as depicted in Figure 10, the direct impact effect of the jet elevates the steady-state surface heat transfer coefficient of the immersion liquid jet system to a maximum of 2342.7 W/(m2·K), approximately 2.6 times that of the pure immersion system.
It can be seen from Table 4 that when the jet distance gradually decreases from 10 cm to 1 cm, the coverage area of the coolant on the heating load increases, resulting in more heat absorption by the coolant. Consequently, the outlet water temperature increases, and the inlet–outlet temperature difference also increases by 1.8 °C. The temperature distribution of the coolant inside the liquid cooler indicates that although the decrease in jet distance causes the temperature difference to increase slightly from 3.1 °C to 4.1 °C, this change is much lower than the 6.5 °C temperature difference observed in the pure immersion liquid cooling system. Additionally, in practical applications, while a smaller jet distance improves local heat transfer efficiency, it is also necessary to consider temperature difference control to guarantee the efficient, stable, and sustained operation of the system.
Figure 9 illustrates the temporal variation in the heating load’s surface temperature across various jet distances. During the initial phase of the experiment, the cooling rate was rapid for all curves. As time progressed, the curves gradually leveled off and stabilized, indicating that the system had reached a thermal equilibrium state. When the jet distance is set to 10 cm, the temperature of the heating load surface stabilizes at about 33.0 °C. Reducing the jet distance to 5 cm lowers the surface temperature to 32.0 °C. With a jet distance of 3 cm or 1 cm, the heating load surface temperature stabilizes at 30.3 °C and 30.7 °C, respectively. Reducing the jet distance enhances coolant disturbance, disrupts the thermal boundary layer at the load interface, and effectively lowers the operating temperature of the heating load.
Figure 10 demonstrates a higher surface heat transfer coefficient at jet distances of 1 cm and 3 cm compared to those at 5 cm and 10 cm. This suggests that reducing the jet distance enhances the jet’s coverage area over the heating wall and intensifies wall jet turbulence, thereby increasing the surface heat transfer coefficient and improving cooling performance. However, the experimental results also reveal that reducing the jet distance does not indefinitely enhance heat transfer performance. If the jet distance is too small, mutual interference among the jet fluids can cause collisions, leading to backflow and reduced heat transfer efficiency. The steady-state surface heat transfer coefficient at a jet distance of 1 cm is 2235.0 W/(m2·K), whereas, at a jet distance of 3 cm, it is higher, reaching 2342.7 W/(m2·K), as shown in Figure 10. Therefore, 3 cm was chosen for further testing to attain a more balanced heat dissipation performance.

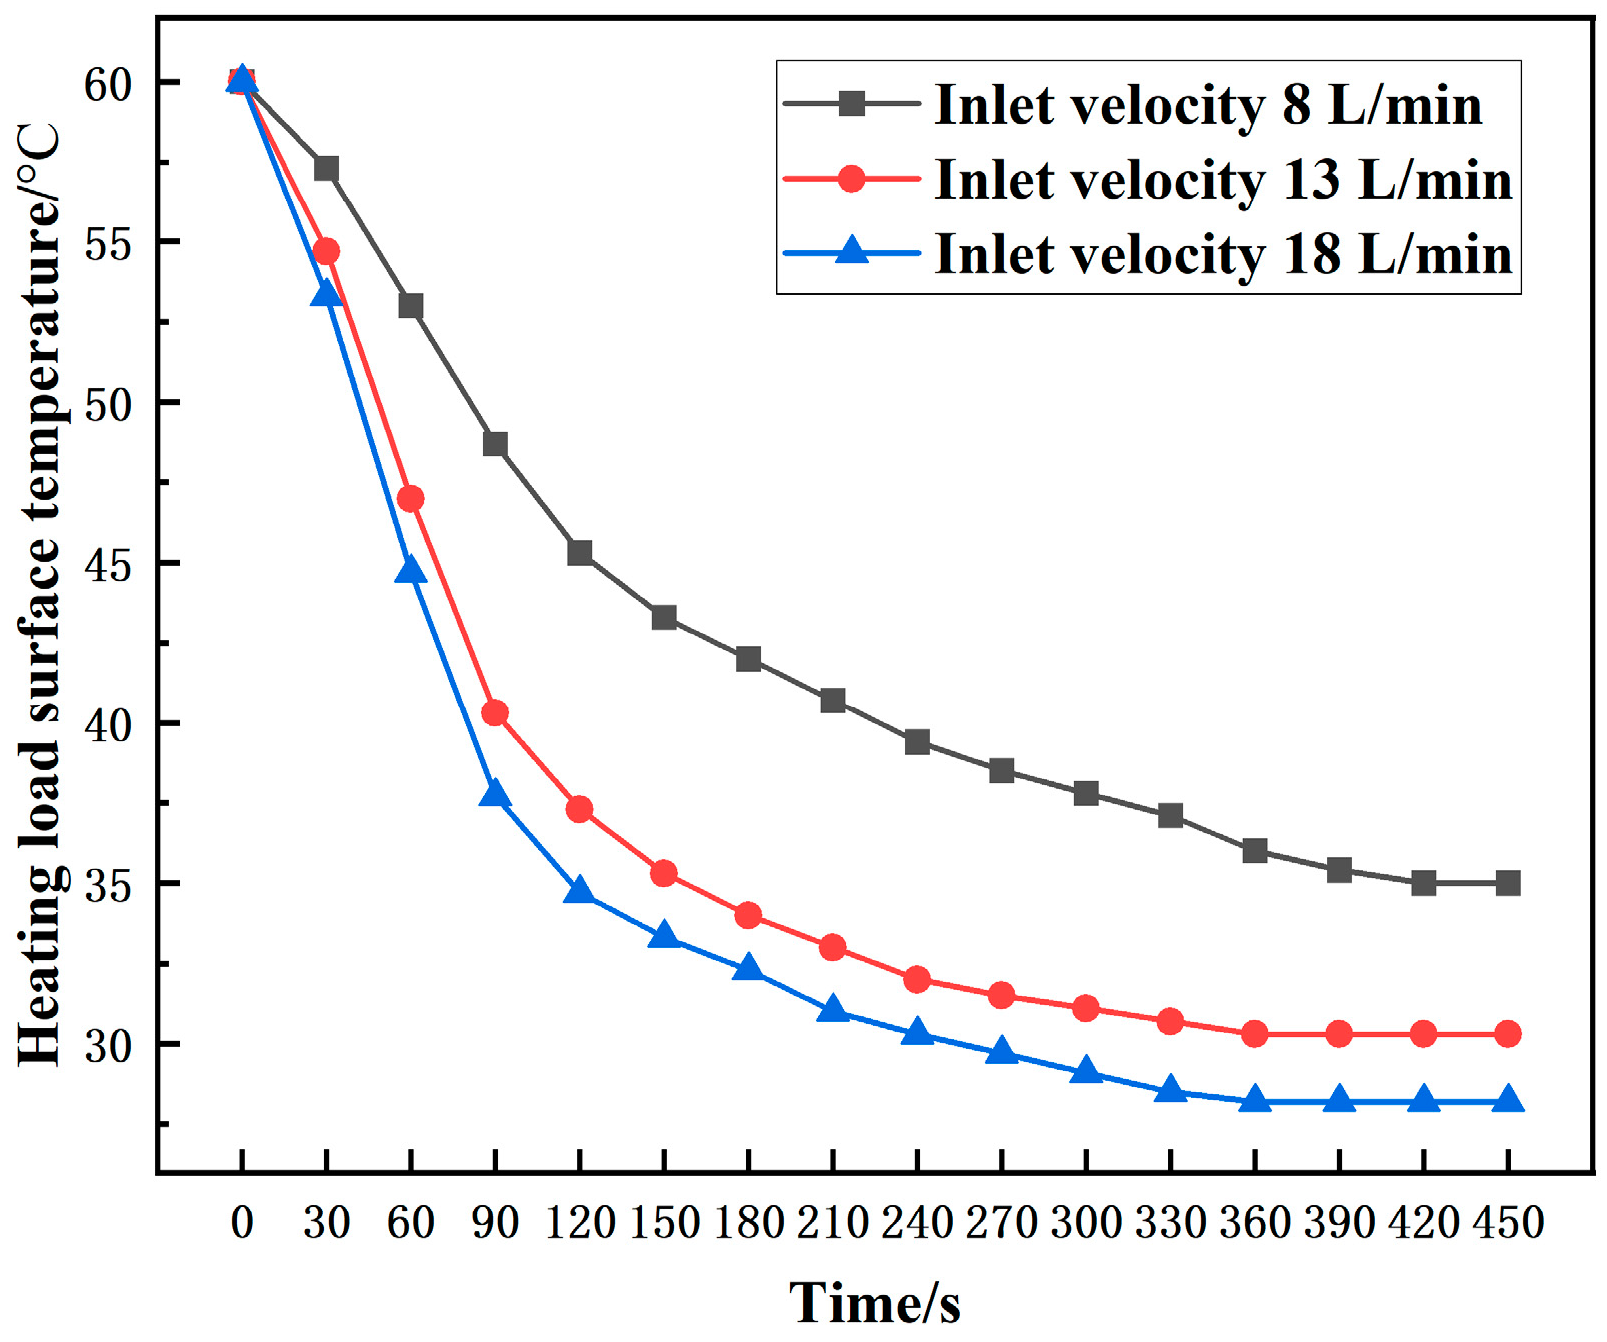
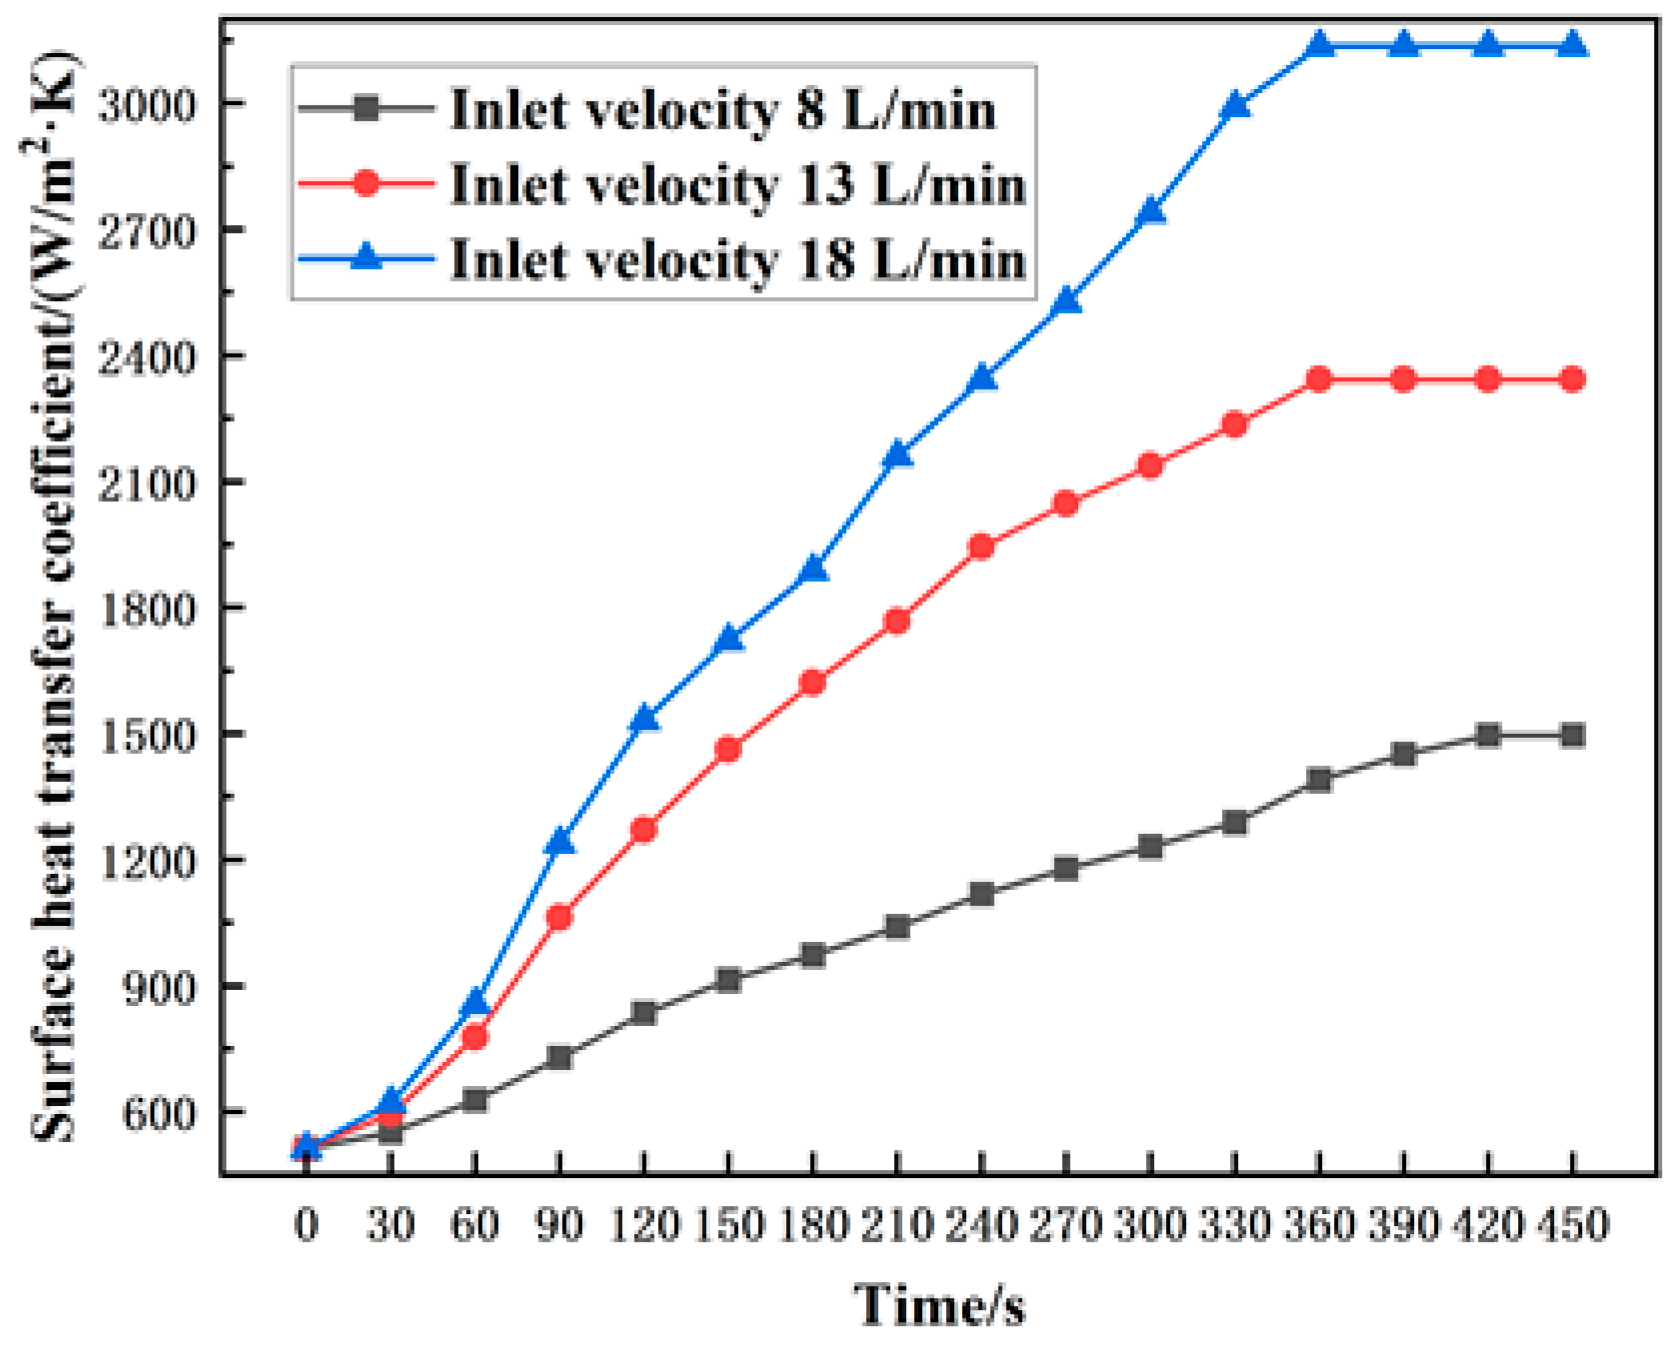
3.2.2. Comparison of Heat Dissipation Effect at Different Inlet Water Flow Rates

In this experiment, the power of the liquid-cooled pump was fixed at 0.37 kW, and a cut-off valve was used to control the water flow, thereby adjusting the flow rate. Table 5 displays the effect of the inlet water flow rate on the efficiency of the immersion jet liquid cooling system under the conditions of a fixed inlet temperature of 22.0 °C and a jet distance of 3 cm.
The findings indicate that as the flow rate increases, the outlet water temperature decreases from 30.8 °C to 28.3 °C. At the same time, the inlet–outlet temperature difference also decreased from 8.8 °C to 6.3 °C. This observation suggests that the coolant’s heat absorption efficiency is enhanced by the increased flow rate. Further analysis reveals that the coolant’s temperature distribution within the liquid cooler maintains a relatively low overall differential across the upper, middle, and bottom regions. An inlet flow rate of 8 L/min yielded a temperature difference of 5.5 °C, while at a flow rate of 18 L/min, the temperature difference was further reduced to 3.6 °C. The coolant’s accelerated passage through the system increases the contact frequency and efficiency with the heating load, diminishes the internal temperature gradient, mitigates the potential for local hot spots, and thereby promotes a more uniform temperature distribution.
Figure 11 illustrates the variation in the heating load’s surface temperature over time at various inlet flow rates. The figure clearly demonstrates a more pronounced downward trend in load temperature with increasing flow rates. At an inlet flow rate of 8 L/min, the heating load surface temperature was relatively highest, and the time required to reach stability was the longest. When the flow rate increased to 13 L/min, the surface temperature dropped to 30.3 °C. With a further increase to 18 L/min, the heating load temperature stabilized at a lower 28.0 °C. This phenomenon can be attributed to the effective reduction in the thickness of the thermal boundary layer adjacent to the heating load surface as the flow rate increases, enhancing the system’s response speed to changes in load temperature and achieving a more rapid temperature decrease, which improves overall heat exchange performance.
Figure 12 presents an analysis of the surface heat transfer coefficient at various inlet flow rates. At low flow rates, the jet’s power is inadequate, failing to effectively impact and cover the heating load’s surface, thereby limiting the system’s response to the heat load. The experimental data indicate that a steady-state surface heat transfer coefficient of approximately 1495.7 W/(m2·K) is achieved at an inlet flow rate of 8 L/min. As the inlet water velocity increases, the jet flow velocity correspondingly rises, propelling the heat transfer surface into the core area of the potential flow. This action not only enhances the coolant’s disturbance but also fosters heat exchange between the coolant and the heating load surface. With a flow rate of 18 L/min, the steady-state surface heat transfer coefficient notably escalates to 3136.2 W/(m2·K), approximately 2.1 times the value observed under low flow rate conditions.
By synthesizing the data shown in the chart, it is evident that raising the flow rate can enhance the system’s heat exchange efficiency. However, such an increase is not boundless, and escalating flow rates necessitate higher pump power, consequently increasing energy consumption [21]. In practical applications, it is imperative to thoroughly evaluate the system’s energy efficiency ratio and select an appropriate flow rate to guarantee long-term stable system operation.

4. Model Dimensionless Analysis

In the quantitative analysis of immersion jet liquid cooling systems, the presence of numerous influencing factors and complex models poses challenges for traditional analysis methods. To address this issue, building upon existing research, this paper employs the dimensional analysis method to streamline the model. Dimensional analysis is a mathematical modeling method proposed in the early 20th century in the field of physics. It is based on a basic understanding of the problem, combined with experiments and experience, and uses the principle of dimensional homogeneity in the laws of physics to determine the quantitative relationship between different physical quantities [22].
Dimensional analysis facilitates the transformation of numerous physical variables into dimensionless forms, simplifying physical parameters and enhancing the efficiency of problem-solving processes. In this study, the pivotal physical quantities encompass inlet water temperature (T), jet distance (h), and inlet water velocity (v). Based on these quantities, the following dimensionless relations are established:
Dimensionless temperature: T = T T 0
Dimensionless jet distance: h = h D
Dimensionless flow rate: v = v v 0
In the investigation of convective heat transfer, organizing experimental data into a power function of established criteria has proven to be a highly effective method [23]. The Nusselt number (Nu) characterizes the dimensionless number of convective heat transfer characteristics. Therefore, the mean thermal transmittance of the impacted surface can be formulated as the following function form:
h D λ = N u = f ( T , h , v ) = m T a h b v c
where h is the surface heat transfer coefficient, W/(m2·K); D is the jet hole diameter, m; λ is the thermal conductivity, W/(m·K).
Through an extensive evaluation of the experimental data, the subsequent correlations were derived using nonlinear least squares fitting to quantitatively describe the heat transfer properties in the liquid cooling system:
N u = 1 . 4657 T 2 . 536 h 0 . 14299 v 0 . 73814
Figure 13 shows the comparison between the correlation obtained by fitting these dimensionless parameters and the experimental data. The diagram shows that over 90% of the calculated fitting points are within the ±18% error margin of the experimental points, indicating that the fitting model has high accuracy and reliability.
A detailed examination of Equation (8) reveals the relative impact strength of dimensionless physical quantities on the Nu number. The greater the power, the more pronounced its influence on the Nu number. The coefficient of T* is the largest, indicating that the inlet temperature is the dominant factor affecting the surface heat transfer coefficient. Secondly, although the coefficient of v* is smaller than that of T*, its positive value still indicates that the flow velocity is a positive promoting factor. Increasing the flow rate enhances the dynamic characteristics of the fluid, thus effectively boosting the heat transfer efficiency. The negative coefficient of h* implies an inverse relationship between jet distance and heat transfer efficacy, such that an increased distance results in diminished heat transfer. Nevertheless, the small absolute value of its coefficient indicates that the jet distance has a relatively modest influence on overall heat transfer performance.
In summary, dimensionless analysis simplifies the processing of physical parameters and clarifies the influence order and degree of various physical quantities on heat transfer characteristics. This approach is crucial for refining the design and enhancing the performance of liquid cooling systems.

5. Conclusions

In this paper, the heat dissipation performance of pure immersion and immersion jet liquid cooling systems is compared by constructing a single-server liquid cooling test bench. The present analysis delves into the impact of various parameters on the system’s heat dissipation efficiency, specifically focusing on the inlet water temperature, jet distance, and inlet water flow rate. The ensuing findings are summarized as follows:
  • In the immersion liquid cooling system, reducing the inlet temperature from 27.0 °C to 18.0 °C can decrease the server’s surface stable temperature by 6.4 °C and enhance the steady-state surface heat transfer coefficient by 107.7 W/(m2·K). However, this also augments the temperature disparity between the inlet and outlet water, concurrently amplifying the internal temperature gradient of the liquid cooler by approximately 3.7 °C. To balance heat dissipation efficiency with the system’s heat load, an inlet water temperature of 22 °C was chosen. At this temperature setting, the inlet–outlet temperature difference was 6.9 °C, the internal temperature gradient was 6.5 °C, and the surface heat transfer coefficient remained stable at 891.9 W/(m2·K).
  • The immersion jet liquid cooling system improves the mixing and disturbance of the coolant inside the cooler through the jet effect, achieving a more uniform temperature distribution and higher heat-carrying capacity. Compared with the pure immersion system, the surface temperature of the heating load is reduced from 43.8 °C to 30.3 °C, and the steady-state surface heat transfer coefficient is increased by 2.6 times to about 2342.7 W/(m2·K).
  • When the jet distance decreases from 10 cm to 1 cm, the surface temperature of the heating load in the immersion jet liquid cooling system decreases by 2.7 °C, and the steady-state surface heat transfer coefficient increases by 467.3 W/(m2·K). However, the inlet–outlet temperature difference increases slightly. Compared with a jet distance of 1 cm, when the jet distance is adjusted to 3 cm, the backflow interference effect between the fluids is significantly mitigated, the system’s heat transfer capacity is enhanced by 107.7 W/(m2·K), and the temperature difference between the inlet and outlet water is lowered by 0.7 °C.
  • Under the premise of an inlet water temperature of 22 °C and a jet distance of 3 cm, increasing the inlet water flow rate can reduce the temperature difference between the inlet and outlet and achieve a more even temperature distribution inside the liquid cooler. Raising the flow rate from 8 L/min to 18 L/min effectively lowers the surface temperature of the heating load from 35.0 °C to 28.0 °C while also increasing the steady-state surface heat transfer coefficient from 1495.7 W/(m2·K) to 3136.2 W/(m2·K).
  • The immersion jet liquid cooling system model was simplified through dimensional analysis, and a dimensionless relationship was established. By fitting the experimental data using the nonlinear least squares method, a heat transfer correlation with an error of no more than 18% was obtained. The analysis shows that the inlet temperature is the dominant factor, the flow rate has a positive effect, and the jet distance has a limited effect, providing guidance for system optimization.

6. Patents

  • Invention name: An immersion jet cooling device and method for data center server heat dissipation.
Inventors: Yu Wang, Linhui Yuan, Na Kang.
Patent number: ZL 2022 1 1059615.2.
2.
Invention Name: Immersion Jet Cooling Device and Method for Data Room Using Natural Cold Source Pre-cooled Fluorinated Liquid.
Inventors: Linhui Yuan, Yu Wang.
Application Number: 202211237401. X.
3.
Invention name: A hierarchical cooling system and method for data center coupled with row-level air conditioning and immersion jet liquid cooling cabinet.
Inventors: Linhui Yuan, Yu Wang, Xincheng Wang.
Application number: 202310300696.9.

Author Contributions

L.Y. and Y.W.: Data Curation, Formal Analysis, Investigation, Methodology, Visualization, Writing—original draft, reviewing and editing. L.Y.: Software, Writing—original draft. Y.W. and R.K.: Supervision, Writing—reviewing and editing. Z.Y., Y.Z. and X.W.: Conceptualization, Resources, Supervision, Writing—reviewing and editing. All authors have read and agreed to the published version of the manuscript.

Funding

Key Laboratory of Icing and Anti/De-icing of CARDC: IADL20230410; Sichuan Province All-electric Navigation Aircraft Key Technology Engineering Research Center: CAFUC202401KF009; Natural science foundation of Postgraduate Research & Practice Innovation Program of Jiangsu Province: SJCX24 0506.

Data Availability Statement

Data are contained within the article.

Conflicts of Interest

The authors declare no conflicts of interest.

References

  1. Sharma, M.; Arunachalam, K.; Sharma, D. Analyzing the data center efficiency by using PUE to make data centers more energy efficient by reducing the electrical consumption and exploring new strategies. Procedia Comput. Sci. 2015, 48, 142–148. [Google Scholar] [CrossRef]
  2. Wang, Z.-Y.; Cai, H.-G.; Li, B. Blue Book of Data Center Development in China; Publishing House of Electronics Industry: Beijing, China, 2021. [Google Scholar]
  3. Chen, H.-W.; Dong, L. Current status and challenges for liquid-cooled data centers. Front. Energy Res. 2022, 10, 952680. [Google Scholar] [CrossRef]
  4. Azarifar, M.; Arik, M.; Chang, J.-Y. Liquid cooling of data centers: A necessity facing challenges. Appl. Therm. Eng. 2022, 247, 123112. [Google Scholar] [CrossRef]
  5. Wolf, D.; Viskanta, R.; Incropera, F. Turbulence dissipation in a free-surface jet of water and its effect on local impingement heat transfer from a heated surface: Part 1—Flow structure. J. Heat Transf. 1995, 117, 85–94. [Google Scholar] [CrossRef]
  6. Maddox, J.F.; Knight, R.W.; Bhavnani, S.H. Local thermal measurements of a confined array of impinging liquid jets for power electronics cooling. In Proceedings of the 2015 31st Thermal Measurement, Modeling & Management Symposium (SEMI-THERM), San Jose, CA, USA, 15–19 March 2015. [Google Scholar]
  7. Birbarah, P.; Gebrael, T.; Foulkes, T.; Stillwell, A.; Moore, A.; Pilawa-Podgurski, R.; Miljkovic, N. Water immersion cooling of high power density electronics. Int. J. Heat Mass Transf. 2020, 147, 118918. [Google Scholar] [CrossRef]
  8. Li, X.; Huang, Q.; Deng, J.; Zhang, G.; Zhong, Z.; He, F. Evaluation of lithium battery thermal management using sealant made of boron nitride and silicone. J. Power Sources 2020, 451, 227820. [Google Scholar] [CrossRef]
  9. Jithin, K.V.; Rajesh, P.K. Numerical analysis of single-phase liquid immersion cooling for lithium-ion battery thermal management using different dielectric fluids. Int. J. Heat Mass Transf. 2022, 188, 122608. [Google Scholar] [CrossRef]
  10. Robinson, A.J.; Schnitzler, E. An experimental investigation of free and submerged miniature liquid jet array impingement heat transfer. Exp. Therm. Fluid Sci. 2007, 32, 1–13. [Google Scholar] [CrossRef]
  11. Sung, M.K.; Mudawar, I. Single-phase hybrid micro-channel/micro-jet impingement cooling. Int. J. Heat Mass Transf. 2008, 51, 4342–4352. [Google Scholar] [CrossRef]
  12. Barrau, J.; Chemisana, D.; Rosell, J.; Tadrist, L.; Ibáñez, M. An experimental study of a new hybrid jet impingement/micro-channel cooling scheme. Appl. Therm. Eng. 2010, 30, 2058–2066. [Google Scholar] [CrossRef]
  13. Fan, S.; Duan, F. A review of two-phase submerged boiling in thermal management of electronic cooling. Int. J. Heat Mass Transf. 2020, 150, 119324. [Google Scholar] [CrossRef]
  14. Fan, S.; Duan, F. Correlations for heat transfer characteristics of the onset of nucleate boiling in submerged jet impingement. Int. J. Therm. Sci. 2021, 170, 107071. [Google Scholar] [CrossRef]
  15. Pambudi, N.A.; Sarifudin, A.; Firdaus, R.A.; Ulfa, D.K.; Gandidi, I.M.; Romadhon, R. The immersion cooling technology: Current and future development in energy saving. Alex. Eng. J. 2022, 61, 9509–9527. [Google Scholar] [CrossRef]
  16. Kline, S.J.; Mcclintock, F.A. Describing uncertainties in single-sample experiments. Mech. Eng. 1953, 75, 3–7. [Google Scholar]
  17. Liu, T.-M. Research and implementation of server temperature control system. Master’s Thesis, Xidian University, Xi’an, China, 2022. [Google Scholar]
  18. Oró, E.; Allepuz, R.; Martorell, I.; Salom, J. Design and economic analysis of liquid cooled data centres for waste heat recovery: A case study for an indoor swimming pool. Sustain. Cities Soc. 2018, 36, 185–203. [Google Scholar] [CrossRef]
  19. Carbó, A.; Oró, E.; Salom, J.; Canuto, M.; Macías, M.; Guitart, J. Experimental and numerical analysis for potential heat reuse in liquid cooled data centres. Energy Convers. Manag. 2016, 112, 135–145. [Google Scholar] [CrossRef]
  20. He, Z.-Q.; Yan, Y.-F.; Zhang, Z.-E. Thermal management and temperature uniformity enhancement of electronic devices by micro heat sinks: A review. Energy 2021, 216, 119223. [Google Scholar] [CrossRef]
  21. Hammoud, A.H.; Khalil, M.F. Characteristics of centrifugal pump handling stable oil-in-water emulsions. Editor. Advis. Boarde 2006, 15, 159–168. [Google Scholar]
  22. Wang, X.-Y. Fundamentals of Gas Dynamics; Northwestern Polytechnical University Press: Xi’an, China, 2006. [Google Scholar]
  23. Yang, S.-M.; Tao, W.-Q. Heat Transfer, 4th ed.; Higher Education Press: Beijing, China, 2006. [Google Scholar]
Figure 1. Diagram of single server immersion jet cooling system with its components.
Buildings 14 02635 g001
Figure 2. Real photo of the single server immersion jet experimental platform.
Buildings 14 02635 g002
Figure 3. Physical drawing of liquid cooling cabinet.
Buildings 14 02635 g003
Figure 4. Physical drawing of temperature controller heating load and low constant temperature water bath. (a) Left is temperature controller, right is heating load. (b) Constant temperature water bath.
Buildings 14 02635 g004
Figure 5. Jet pipe design and processing diagram.
Buildings 14 02635 g005
Figure 6. The surface temperature change in heating load at different inlet water temperatures in an immersion liquid cooling system.
Buildings 14 02635 g006
Figure 7. The surface heat transfer coefficient changes at different inlet water temperatures in an immersion liquid cooling system.
Buildings 14 02635 g007
Figure 8. Jet process of deionized water in immersion jet liquid cooling system.
Buildings 14 02635 g008
Figure 9. The surface temperature change in heating load under different jet distances in immersion jet liquid cooling system.
Buildings 14 02635 g009
Figure 10. The surface heat transfer coefficient change under different jet distances in immersion jet liquid cooling system.
Buildings 14 02635 g010
Figure 11. The surface temperature change in heating load under different inlet flow rates in immersion jet liquid cooling system.
Buildings 14 02635 g011
Figure 12. The surface heat transfer coefficient change under different inlet flow rates in immersion jet liquid cooling system.
Buildings 14 02635 g012
Figure 13. Comparison of fitted values and experimental values when fitting the correlation.
Buildings 14 02635 g013
Table 1. Immersion jet liquid cooling system performance test condition table.
Test ConditionLoad Heating Temperature (°C)Inlet Water Temperature (°C)Jet Flow Rate (L/min)Jet Distance (cm)
Condition A60221310/5/3/1
Condition B60228/13/183
Table 2. Experimental instrument parameters.
Instrument NameType-SpecificationRange Ability
Self-priming pump25WBZ3-8-0.25flow rate 3 m3/h, head 8 m, electric power 0.37 kW
Cut-off valveJ11W
Low constant temperature water bathDC-0530−5~100 °C
Water flow sensor flow rate 1~30 L/min
Temperature thermistorK-type0~600 °C
Digital thermometerCX-WDJ200C−50~200 °C
Table 3. Average temperature of immersion liquid cooling system under different inlet water temperatures.
Inlet Water Temperature
(°C)
Inlet Velocity
(L/min)
Outlet Water Temperature
(°C)
Water Temperature Difference
(°C)
Coolant Temperature inside Liquid Cooler
(°C)
UpperMiddleBottomTemperature Difference
18.01327.0928.219.618.99.3
22.01328.96.929.123.922.66.5
27.01332.35.332.728.027.2 5.5
Table 4. Average temperature of immersion jet liquid cooling system under different jet distances.
Inlet Water Temperature (°C)Inlet Velocity (L/min)Jet Distance (cm)Outlet Water Temperature (°C)Water Temperature Difference (°C)Coolant Temperature inside Liquid Cooler (°C)
UpperMiddleBottomTemperature Difference
22.0131027.85.828.026.524.93.1
22.013528.66.628.026.324.23.8
22.013328.96.927.926.024.03.9
22.013129.67.627.926.323.84.1
Table 5. The average temperature of immersion jet liquid cooling system under different inlet flow rates.
Inlet Water Temperature (°C)Jet Distance (cm)Inlet Velocity (L/min)Outlet Water Temperature (°C)Water Temperature Difference (°C)Coolant Temperature inside Liquid Cooler (°C)
UpperMiddleBottomTemperature Difference
22.03830.88.829.727.424.25.5
22.031328.96.927.926.024.03.9
22.031828.36.327.425.623.83.6
Disclaimer/Publisher’s Note: The statements, opinions and data contained in all publications are solely those of the individual author(s) and contributor(s) and not of MDPI and/or the editor(s). MDPI and/or the editor(s) disclaim responsibility for any injury to people or property resulting from any ideas, methods, instructions or products referred to in the content.

