Review

Electrical Resistance Tomography (ERT) for Concrete Structure Applications: A Review

1
Department of Civil Engineering, Dong-A University, 37 Nakdong-Daero 550 Beon-Gil, Busan 49315, Republic of Korea
2
Department of Civil Engineering, Kyonggi University, 154-42, Gwanggyosan-ro, Yeongtong-gu, Suwon-Si 16227, Gyeonggi-do, Republic of Korea
*
Author to whom correspondence should be addressed.
Buildings 2024, 14(9), 2654; https://doi.org/10.3390/buildings14092654
Submission received: 1 August 2024 / Revised: 23 August 2024 / Accepted: 25 August 2024 / Published: 27 August 2024
(This article belongs to the Special Issue Advanced Sustainable Low-Carbon Building Materials)

Abstract

:
Electrical resistance tomography (ERT) is gaining recognition as an effective, affordable, and nondestructive tool for monitoring and imaging concrete structures. This paper discusses ERT’s applications, including crack detection, moisture ingress monitoring, steel reinforcement assessment, and chloride level profiling within concrete. Recent advancements, such as time-lapse ERT and artificial intelligence (AI) integration, have enhanced image resolution and provided detailed data for infrastructure monitoring. However, challenges remain regarding the need for better spatial resolution, concrete-compatible electrodes, and integration with other nondestructive testing techniques. Addressing these issues will expand the applicability and reliability of the current ERT, making it an invaluable tool for infrastructure maintenance and monitoring.

1. Introduction

The rising number of aging concrete structures globally has garnered considerable attention in the construction and civil engineering sectors [1]. As these structures age, they face a variety of deterioration challenges that threaten their structural integrity and functionality. The primary issues include the natural degradation in concrete due to environmental factors, such as moisture, temperature variations, chemical reactions, and physical stresses [2]. This degradation often appears as cracking, spalling, corrosion of reinforcement (rebar), and loss of structural integrity, necessitating urgent repair and rehabilitation to ensure safety and extend service life. In particular, aged concrete structures damaged by long-term environmental impacts pose both challenges and opportunities in civil engineering and infrastructure management [2].
In response to these challenges, many countries have allocated substantial budgets for the maintenance, repair, and retrofitting of old structures [3]. For instance, the American Society of Civil Engineers estimated that approximately USD 4600 billion is required for the maintenance of infrastructure systems in the United States over a decade, with a significant portion of Europe’s annual construction budget spent on similar activities [4,5].
Nondestructive testing (NDT) methods, such as ultrasonic testing, ground-penetrating radar, and visual inspections, play a key role in assessing the condition of these structures without causing further damage [6]. These assessments are vital for making informed decisions regarding the necessity of repairs, the extent of rehabilitation needed, or potential replacements.
Electrical resistance tomography (ERT) stands at the forefront of nondestructive imaging techniques, offering invaluable insights into the characterization of materials, from geological formations to biological tissues [7]. This versatile imaging technique has gained prominence across various fields, including geophysics [8], medicine [9], civil engineering [10], and industrial process monitoring [11], owing to its ability to visualize the distribution of electrical properties within objects and structures. ERT plays a crucial role in revealing the complex electrical characteristics of various materials.
One of the remarkable features of ERT is its adaptability to various environmental and industrial scenarios. In the field of geophysics, ERT plays a vital role in subsurface exploration, helping researchers and geologists investigate the composition of geological formations, identify groundwater reservoirs, and assess soil characteristics [9]. In civil engineering, ERT aids in assessing the health of concrete structures by monitoring moisture distribution, which is critical for understanding corrosion processes and durability [12,13,14]. It is also employed for detecting leaks in underground pipes [11], ensuring the integrity of industrial reactors, and optimizing multiphase flows in various processes. The effectiveness of ERT relies on its capacity to address complex inverse problems. These problems involve inferring the internal properties of an object based on external measurements. For ERT, this means reconstructing resistivity distributions. This inherent complexity arises from the fact that changes in resistance within an object result in subtle variations at its surface [15]. Solving these inverse problems requires advanced mathematical algorithms and computational techniques [16], which makes ERT a highly interdisciplinary field that combines physics, mathematics, and engineering.
In conclusion, ERT has emerged as a versatile and indispensable imaging modality, with applications spanning multiple domains. Its ability to noninvasively visualize the distribution of electrical properties within objects and structures has revolutionized fields as diverse as medicine, geophysics, civil engineering, and industrial process monitoring. The adaptability, portability, and cost-effectiveness of the current ERT make it a valuable tool for assessing structural health. The journey of ERT, from its humble beginnings in geological surveys to its current status as a cutting-edge imaging technique, highlights its enduring significance in the world of science and technology. As ERT continues to evolve and find new applications, it promises to further enhance our understanding of the intricate electrical characteristics that underlie the physical world.

2. Fundamentals of Electrical Resistance Tomography for Concrete

2.1. Forward Problem

The governing equation for interpreting electric fields in ERT is commonly referred to as the Laplace equation, as demonstrated in Equation (1), which is a second-order partial differential equation. This equation is a simplified version of Poisson’s equation and is used as the governing equation for the analysis of steady-state heat conduction or electric fields in the context of electrical resistance tomography.
· σ u = x σ u x + y σ u y + z σ u z = 0 ,
where σ is the conductivity and u indicates the final result function of u(x, y, z) to be obtained from the Laplace equation.
To solve the Laplace equation, the definition of boundary conditions is essential. The Dirichlet, Neumann, and Robin problems are well-known boundary conditions. Two well-developed models for boundary conditions currently used in ERT are the shunt model [17] of the pure Neumann problem in Equation (2) and the complete electrode model [18] of the mixed Neumann–Robin problem in Equation (3).
Outer   boundary   of   electrodes :   u n = 0 ;   electrode   boundary :   u = U l
Outer   boundary   of   electrodes :   u n = 0 ;   electrode   boundary :   u + z · u n = U l ,
where u is the electric potential, n is the normal vector, z is the contact impedance, and Ul is the potential on the lth electrode.
Using the mathematical model of ERT, as defined previously, the electric field (u) can be obtained through either analytical or numerical methods. The analytical solution of the shunt model for cement-based materials is applicable when the electrical resistivity of the matrix is significantly lower than that of the inclusions. Yoon et al. provided an analytical solution for the shunt and complete electrode model specifically tailored to cement-based materials [19,20]. However, due to variations in the shapes of target objects and the presence of internal inclusions, electrode locations, and other factors, a numerical analysis approach is deemed more practical for applications of ERT. The finite element method (FEM) stands out as the most frequently employed tool for generating forward models [21]. Commonly utilized software tools for this purpose include COMSOL [22], ANSYS [23], and MATLAB, coupled with open-source EIDORS [24], which employs Distmesh or NetGen for meshing purposes.

2.2. Inverse Schemes for Reconstruction
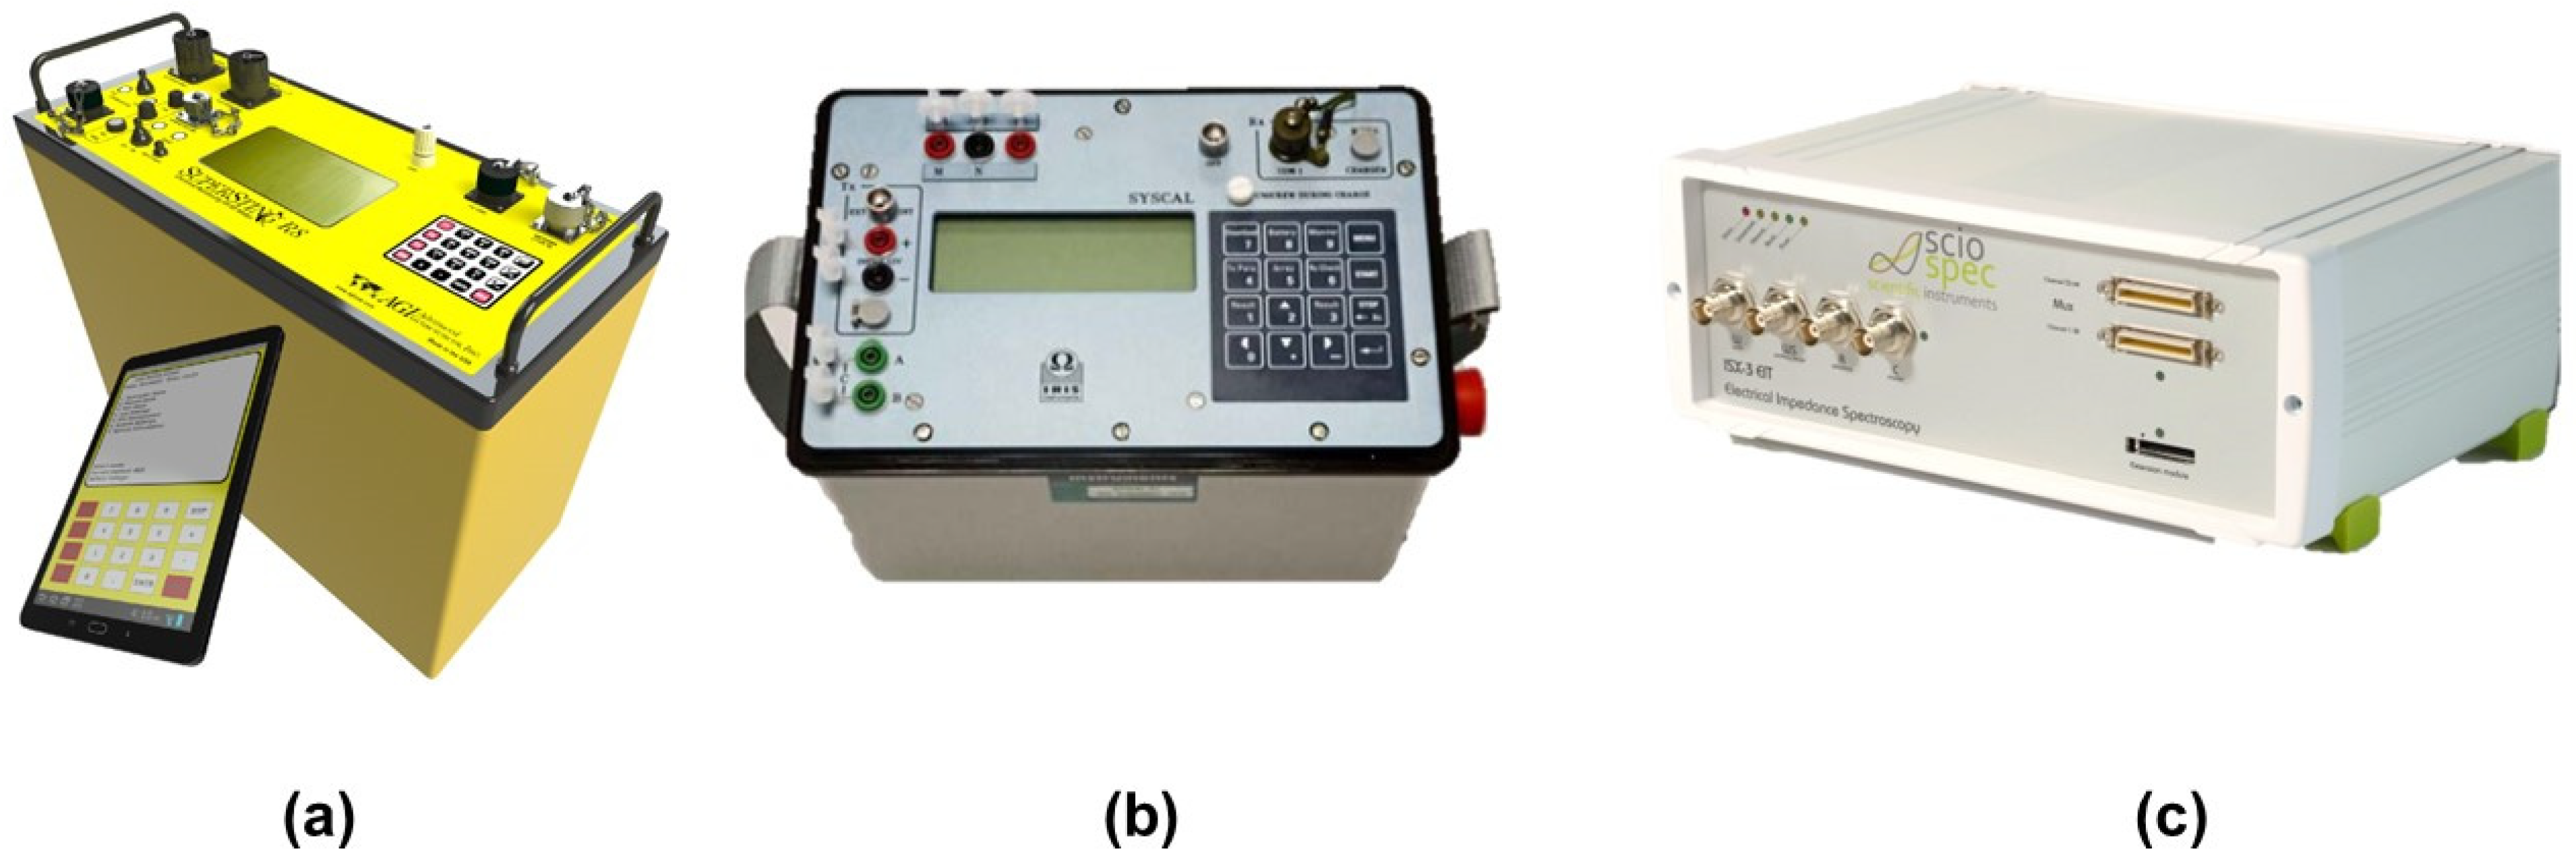
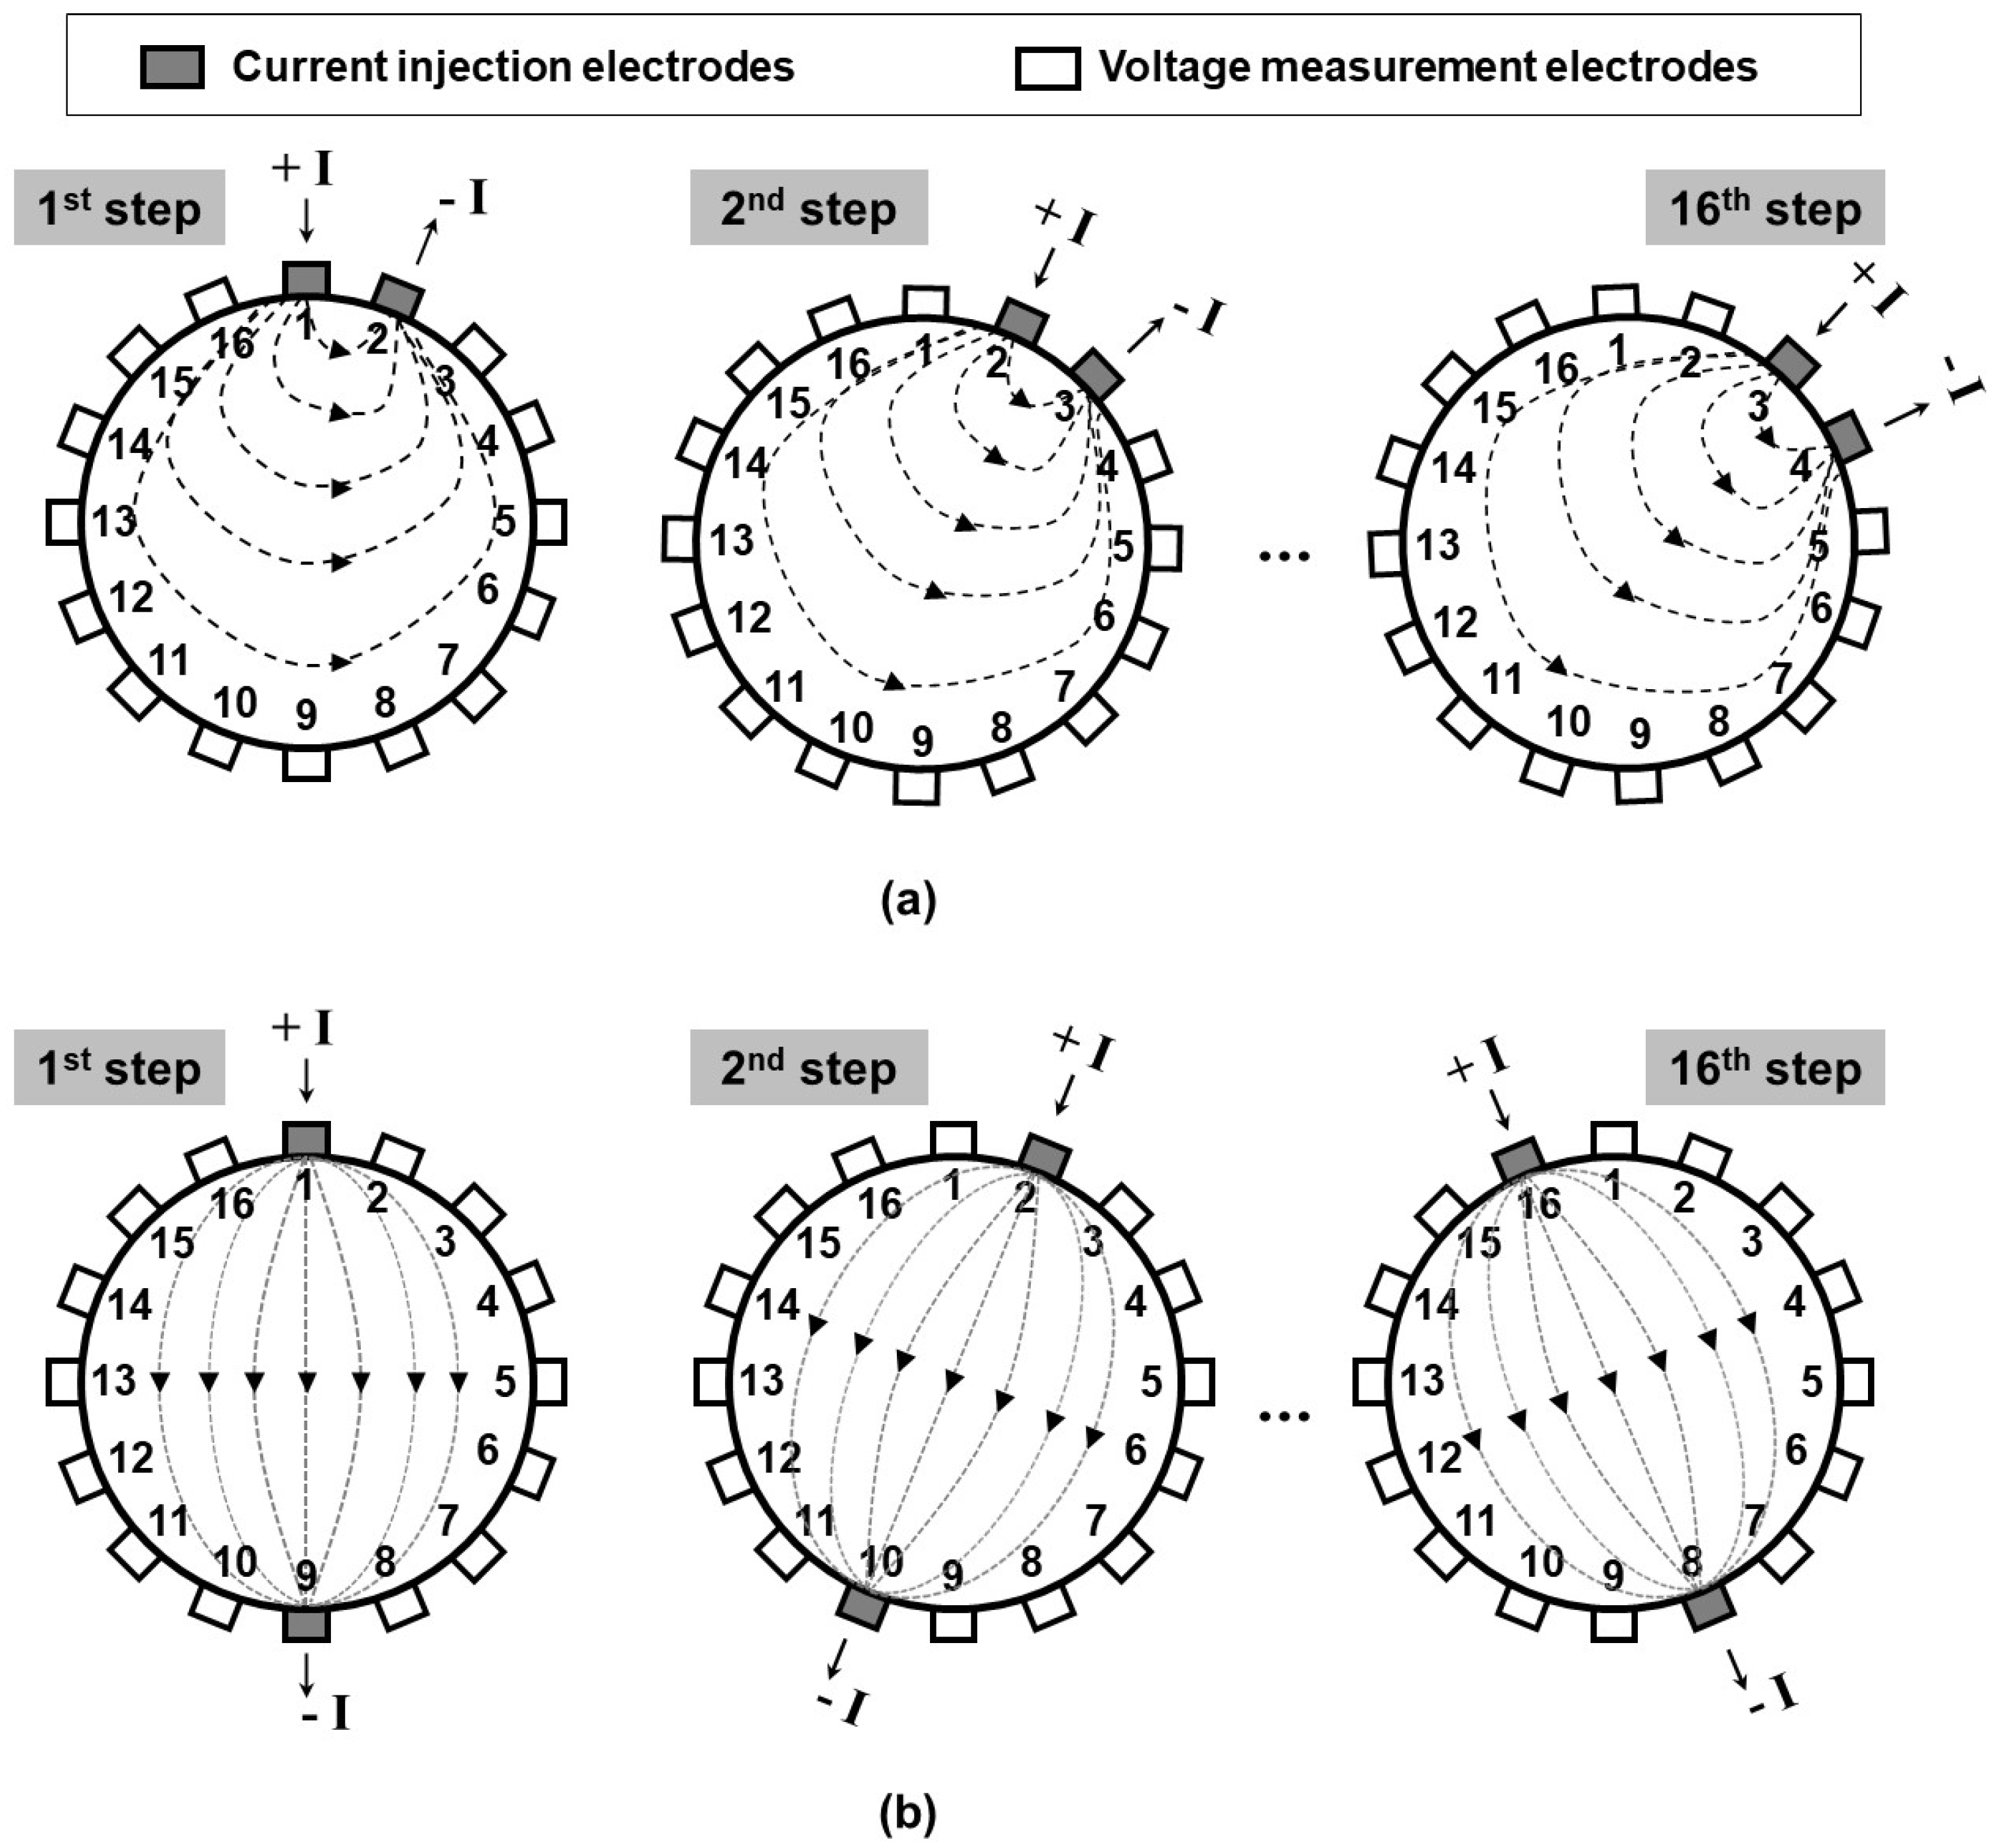
In practical ERT applications, it is essential to measure the potential of the electrodes and subsequently estimate the spatial variation in conductivities in the inverse direction. The necessity of addressing inverse problems arises from the requirement to estimate the distributed parameter (conductivity) of an object based on measured data (electrical potential or voltage). Inverse problems entail the challenge of estimating causes (parameters such as conductivity) from outcomes (measured data). They stand in contrast to the common approach of the “forward problem”, which involves estimating outcomes from causes. Consequently, ERT necessitates an inverse scheme in which the process involves reconstructing electrical conductivity or resistance using electrical potential data measured at the electrodes.
Overall, the objective of the inverse problem in ERT is to ensure the closest possible match between the potential values measured at the electrodes and those calculated through numerical analysis, which is commonly FEM. However, achieving a perfect match is not feasible in practice due to factors such as modeling errors, measurement noise, and material characteristics. Sylvester et al. has demonstrated that there is generally no unique solution to the electric field inverse problem [25]. Therefore, the inverse problem is often referred to as an ill-posed problem. Nevertheless, despite these limitations, the goal remains to minimize the objective function to an acceptable level using a least squares (LS) function.
The initial step in addressing the ERT inverse problem involves utilizing the nonregularized LS estimator outlined in Equation (4), which is primarily employed to update the Gauss–Newton optimization scheme.
δ u = J T · J 1 · J T · U m e a U c a l ,
where δu is a vector of an LS solution, J is a Jacobian matrix, and Us are vectors of the measured and calculated potentials at the electrodes.
The Jacobian matrix, U l / σ i , illustrates the alteration in potential at the electrodes resulting from changes in conductivity at individual elements of FEM mesh. Consequently, a straightforward technique involves employing the perturbation method [26] to modify the electrical conductivity of each FEM element and then calculating the alteration in potential at each electrode resulted with a Jacobian matrix U l / σ i . However, a more efficient computational strategy is the “direct method”, wherein the derivatives of the finite element system matrix are utilized to derive the Jacobian matrix [27].
The ill-posed nature of ERT renders the traditional method (utilizing the LS solution presented in Equation (4)) unstable. To mitigate this issue, a regularization matrix can be introduced to enhance the stability of the LS solution. For instance, employing Tikhonov regularization, the simplest form of regularization, allows for stabilizing the LS solution by using an identity matrix in Equation (4), thus ensuring the conditional well-posed problem of the LS problem. A more sophisticated approach involves utilizing a Laplace prior with a scaled mixture of normal distributions as the regularization matrix, which is employed to construct the regularization matrix. This process is achieved by incorporating a cost function utilizing a regularized matrix of Laplace prior into the Gauss–Newton (GN) optimization scheme, as represented by Equation (5).
δ u = J T · J + λ · R T · R 1 · J T · U m e a U c a l ,
where R is a regularization matrix and λ is a hyperparameter.
Recent applications of ERT in concrete have employed total variation (TV) reconstruction, which effectively enhances the delineation of internal inclusion boundaries [28]. However, the resolution comparison between GN schemes using Laplace priors and TV schemes remains contentious. Experimental studies by Sarode et al. comparing the reconstruction schemes of electrical tomography have consistently shown that the GN scheme with Laplace prior exhibits the lowest reconstruction error [29]. For instance, Figure 1 presents an illustrative example of reconstructed images generated by different inverse schemes. The GN algorithm with Laplace prior consistently produced high-quality reconstructed images for target shapes and sizes, akin to those achieved by the TV algorithm. These image results from the GN algorithm with Laplace prior being delineated within the red box in Figure 1. Furthermore, the GN reconstruction scheme with Laplace priors consistently yielded images of good quality similar to those produced by the TV reconstruction scheme [30]. Despite ongoing debate, it is evident that both methods outperform traditional approaches, such as the GN algorithm with Tikhonov priors or the GN algorithm with no priors in terms of reconstruction performance.

2.3. Measurements

Commercial instruments that provide ERT measurements are primarily categorized into two groups that are utilized in geoscience and medical applications. In geosciences, instruments such as the Syscal series produced by IRIS Instruments, including Syscal r1 plus, r2, and Pro (illustrated in Figure 2), or Supersting R8, are commonly employed [31]. Specifically, the ERT equipment employed for landslide investigation is comprehensively discussed in Perrone et al.’s review [31]. The characteristics of the Syscal series instruments are also detailed in Bernard et al.’s study [32]. In medical applications, electrical tomography equipment is referred to as electrical impedance tomography (EIT) [33]. EIT differs from ERT in that it utilizes impedance, comprising both real and imaginary parts of the electric potential, while ERT relies solely on resistance, utilizing only its real part, such as in by Smyl et al. [34]. However, even in medical research, if only the real part of the potential measured with EIT equipment is used, it is predominantly referred to as EIT by Tidswell et al. [35], suggesting that the terminology in each field is still somewhat fluid rather than entirely separating the concepts. One prominent form of EIT equipment is Sciospec EIT equipment (depicted in Figure 2) [21]. As current concrete research primarily employs the term ERT, the present study uses this term. Geoscience equipment typically applies a current of 1~3 A, whereas in the medical field, where it is utilized on humans or animals, currents in the unit of mA are employed. For concrete research, there is currently no research indicating which setting is more effective in concrete applications.
Figure 3 depicts representative measurement protocols utilized in applications of ERT to concrete. As shown in Figure 3, the most common ERT electrode measurement protocols are adjacent current injection and opposite current injection. In concrete material applications, adjacent electrode measurements are employed to acquire reconstructed images with enhanced resolution at the boundary where the electrodes are attached, whereas opposite current injection measurements may be more advantageous for obtaining images of the inner layers of the material [30,36]. Electrode placement methods for concrete applications typically involve covering all sides of the target specimen [15,34]. However, for structures such as tunnels, practical measurement is feasible only from one side. To address this limitation, a single-side ERT, where tomography is conducted solely from one side of the ERT object, as demonstrated in Figure 4, has been investigated [20,37,38].
In dynamic monitoring scenarios, such as time-lapse ERT for landslide monitoring, real-time inversion methods are essential [39]. Adaptive inversion techniques update the resistivity model continuously as new data are acquired, allowing for real-time tracking of subsurface changes [40]. This is particularly useful in applications where rapid decision-making is required. In some cases, ERT data can be combined with other geophysical data, such as seismic or ground-penetrating radar (GPR) data, in a process known as multimodal inversion [41]. This approach leverages the strengths of different geophysical methods to produce a more accurate and robust subsurface model. By integrating different datasets, uncertainties associated with each individual method can be reduced, leading to more reliable reconstructions. Recent advances in computational power and algorithms have led to more sophisticated inversion techniques. Stochastic methods, such as Markov chain Monte Carlo (MCMC) simulations, explore a wide range of possible models to better understand uncertainties in the reconstruction [42,43]. Machine learning approaches are also gaining popularity, where neural networks are trained to predict resistivity distributions directly from raw data, potentially bypassing some of the limitations of traditional inversion methods.

3. Applications of ERT on Concrete Materials and Structures
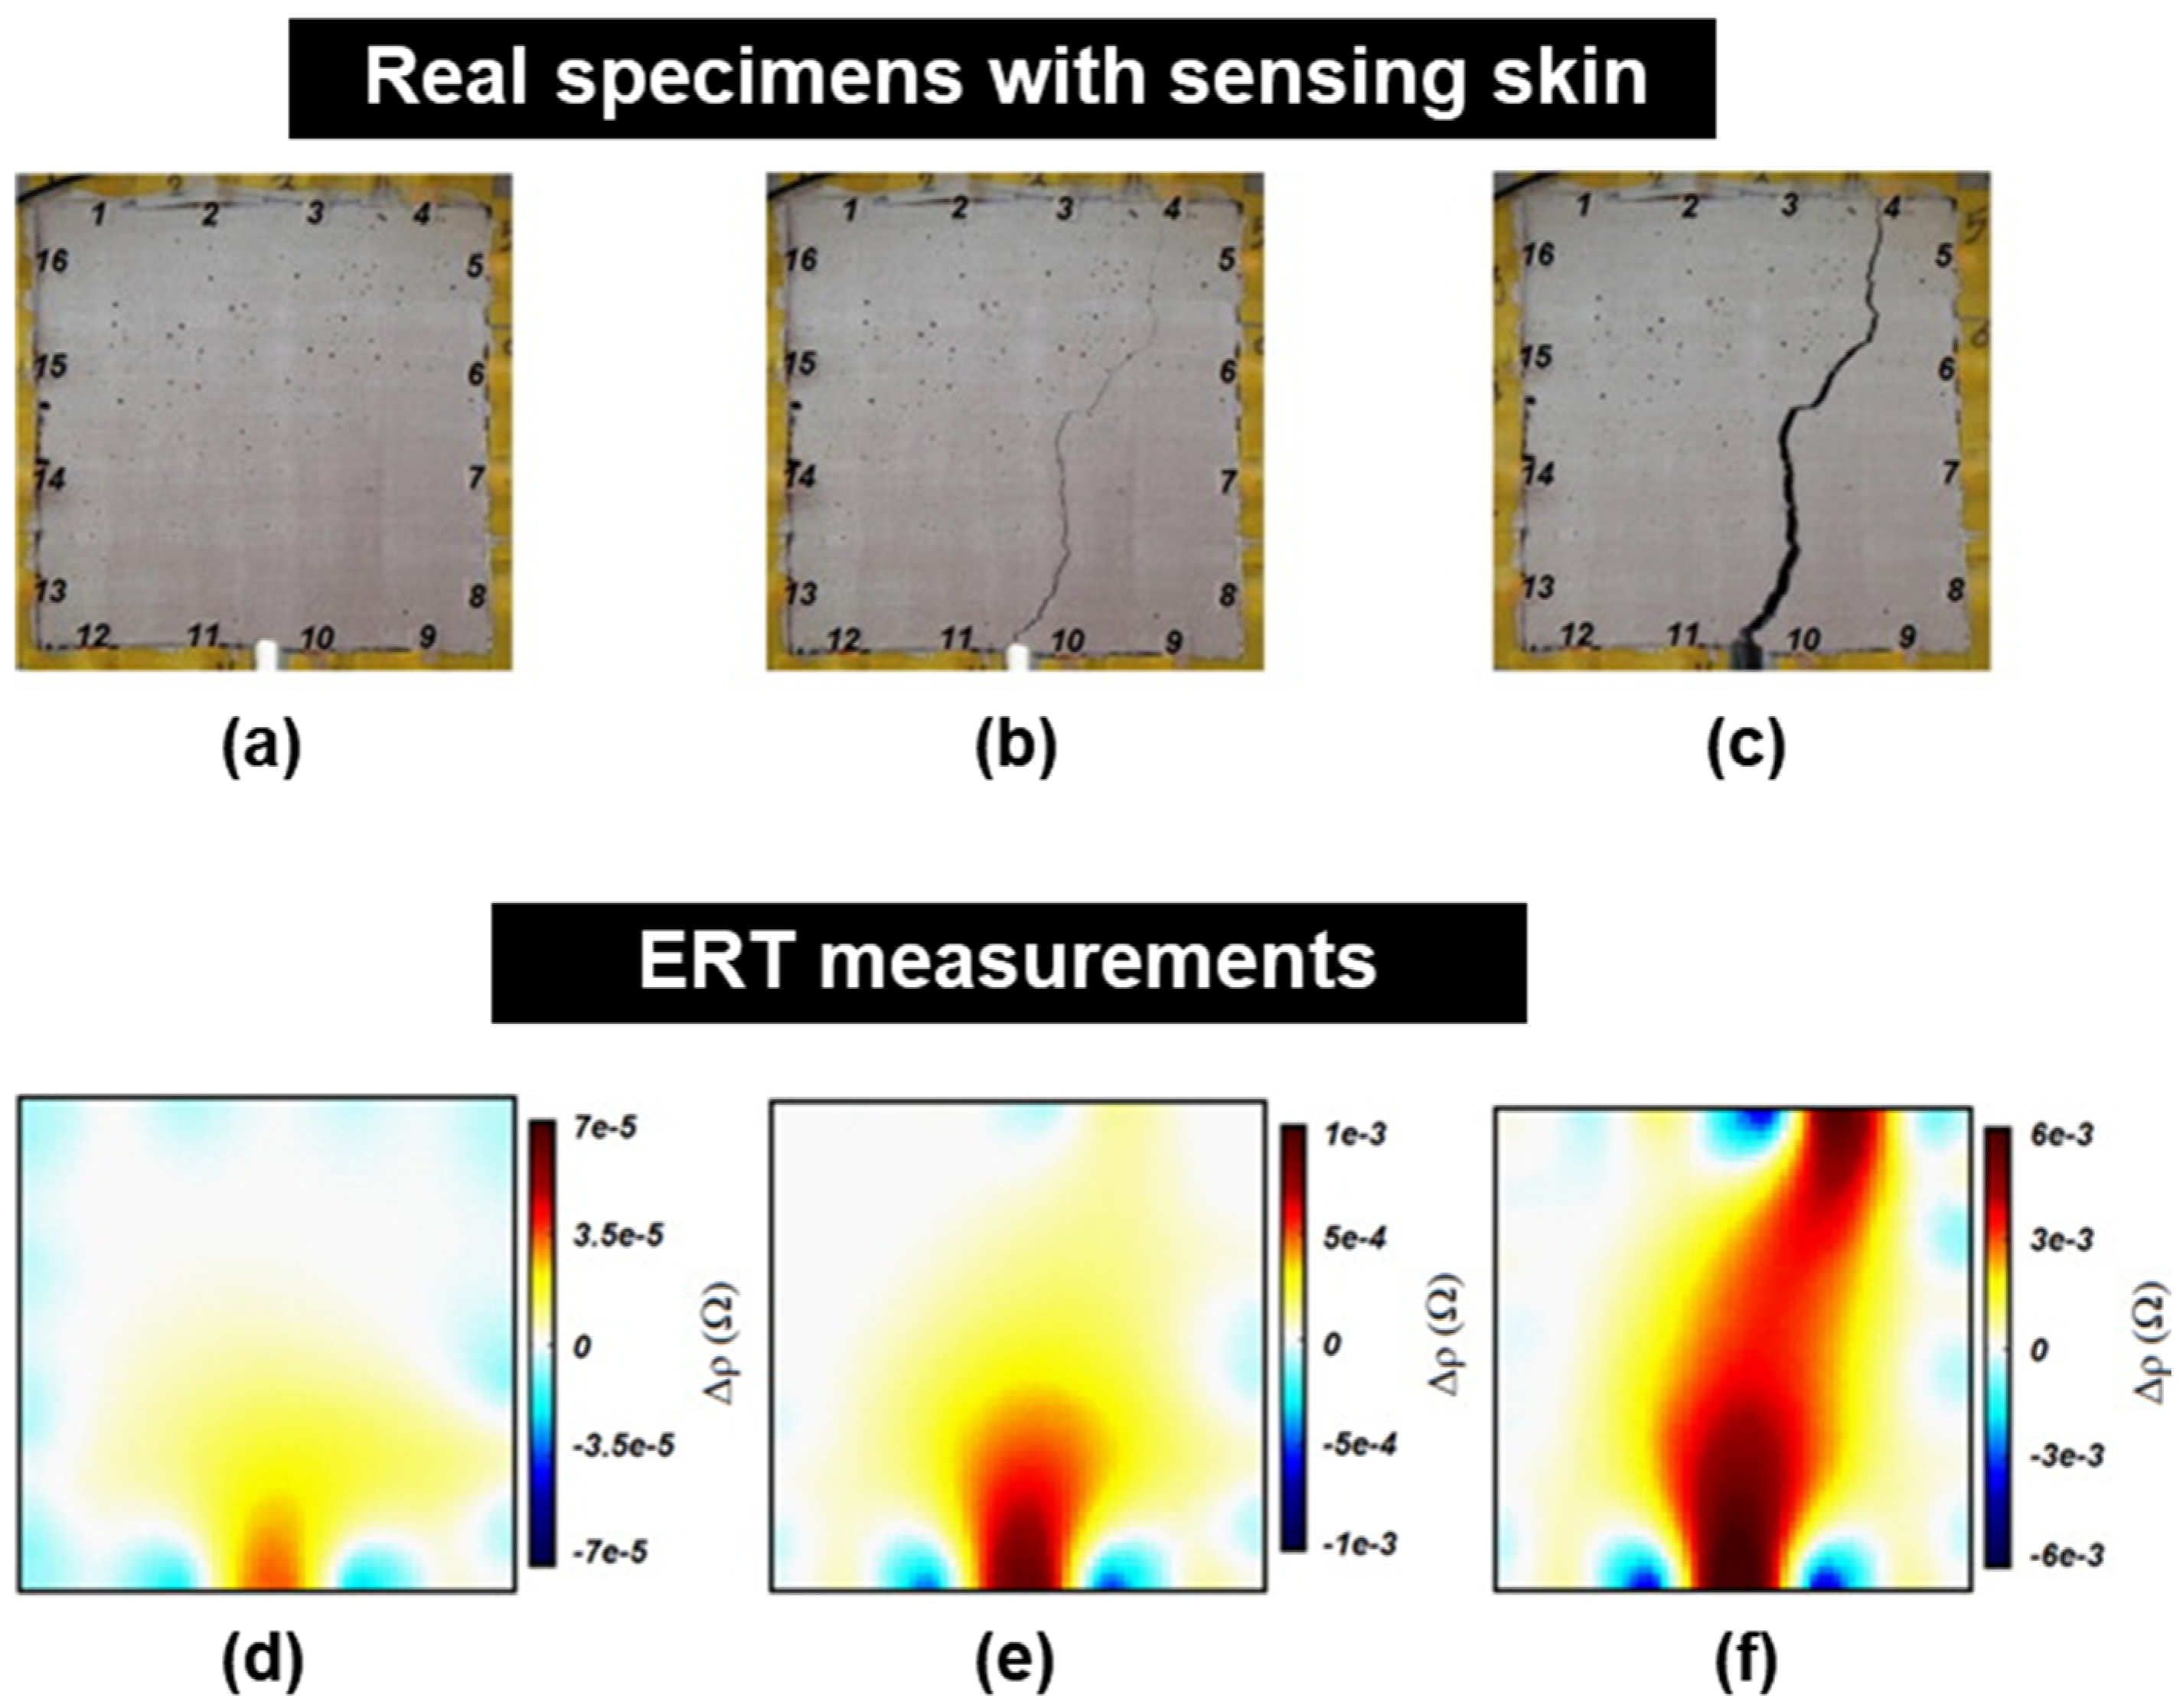
Despite numerous investigations into electrical tomography, research has predominantly focused on the medical and geotechnical engineering sectors, with limited attention given to concrete structures. This focus can be attributed to several factors: First, there is no risk associated with the use of radioactivity. Second, it offers very fast measurement speeds and facilitates real-time monitoring. Third, it is not significantly affected by external noise or vibrations. Due to these advantages, electrical tomography has been extensively utilized in the medical engineering sector.
ERT initially showed great potential in medical diagnostics and geotechnical surveys, leading to early research and development being concentrated in these areas. The medical and geotechnical engineering fields greatly benefit from the high-resolution imaging and NDT advantages of electrical tomography. Since these fields require accurate and detailed images, electrical tomography is considered a suitable tool. Additionally, medical diagnostics and geotechnical surveys directly impact human health and safety, making technological advancements in these fields more critical. For these reasons, electrical tomography technology has primarily been researched and developed in the medical and geotechnical engineering fields, with relatively few studies on concrete structures. Nevertheless, the application of ERT can be classified based on the specific objects being measured.

3.1. Crack Imaging

Imaging cracks is crucial for maintaining the integrity of concrete structures. Cracks can weaken concrete elements, posing risks of collapse or failure. Additionally, they allow for moisture, chemicals, and other harmful substances to penetrate the concrete, causing reinforcement corrosion and gradual deterioration of the structure.
To monitor crack damage, ERT was utilized to assess the spatial distribution of damage in self-sensing concrete used for airport runway pavements. This innovative concrete was created by enhancing the cement–aggregate interface with thin films of multi-walled carbon nanotubes (MWCNTs). Gupta et al. revealed that ERT-enabled self-sensing concrete could identify the severity, locations, and patterns of cracks before they became apparent on the surface [44]. In particular, with sensor arrays mounted on a single planar surface of concrete samples, the use of ERT for crack detection in concrete was also investigated. This study effectively demonstrated ERT’s ability to differentiate among crack-like defects of varying depths in concrete slabs containing plastic plates and to identify actual cracks in beams subjected to three-point bending tests. The potential of employing ERT to detect cracks in concrete was examined, with particular emphasis on realistic geometries, where the sensor array was mounted on a single planar surface of the concrete [45]. This is because in real concrete structures, it is either impossible or very difficult to install electrodes on both sides. Zhuo et al. investigated cracks in engineered cementitious composites caused by uniaxial tension loading using differential ERT [46]. The results demonstrated that bilateral edge electrode arrays were more effective at pinpointing the location of cracks than unilateral planar electrode arrays, where electrodes were placed on a single plane or surface. Ren et al. utilized ERT to visualize artificial hole defects in cement-based materials, focusing on identifying and mapping precast defects [47]. Hallaji et al. combined ERT with sensing skin technology that was employed to detect and pinpoint cracks and damage in concrete, as shown in Figure 5 [48]. The sensing skin, made with colloidal silver paint having a very low resistivity of 1.9 × 10⁻⁶ Ωm, can be easily applied to concrete surfaces using a standard brush. The fundamental concept of the study is that cracks in the concrete cause ruptures in the sensing skin because it firmly adheres to the concrete, which increases its local electrical resistivity. ERT was then employed to measure the electrical resistivity of the sensing skin. To explore the potential of ERT in detecting concrete cracks, more realistic setups were examined, specifically where the sensor array was attached to a single planar surface of the concrete. To evaluate the feasibility of the ERT with realistic setups, tests were performed on two different samples: (1) concrete slabs embedded with plastic plates and (2) beams with authentic cracks caused by three-point bending.
Reference [49] introduced “ConcrEITS”, a low-cost tomographic impedance interrogator designed for crack detection and location in concrete using conductive repair patches. Testing demonstrated that ConcrEITS measures four-probe impedance with a root mean square error of ±5.4% compared to commercial devices. Additionally, ConcrEITS effectively detected and located cracks in small concrete beam samples under four-point bending, with contour images from tomographic reconstruction clearly identifying crack locations in all six samples tested. The system shows promise as an affordable solution for monitoring and maintaining concrete infrastructure, even though further large-scale testing is recommended before field implementation.
In recent years, Chen et al. have developed ERT as viable method for detecting and reconstructing cracking patterns in concrete structures [13]. However, high-fidelity ERT reconstructions often require complex and computationally expensive processes, hindering practical use in structural health monitoring. To overcome this, the article proposes using predictive deep neural networks to efficiently solve the ERT inverse problem. Specifically, the networks are optimized using cross-entropy loss to create nonlinear mapping from ERT voltage measurements to binary probabilistic spatial crack distributions. The study trains artificial neural networks and convolutional neural networks with simulated electrical data and tests their feasibility with both experimental and simulated data, demonstrating their effectiveness in identifying flexural and shear cracking patterns in reinforced concrete (RC) elements.
Gupta et al. explored the use of self-sensing concrete for airport runway pavements, utilizing ERT to detect spatial damage during accelerated testing [44]. This concrete type maintains the standard mechanical properties needed for runways while also being able to sense deformation and strain. The study involved enhancing the cement–aggregate interface with MWCNT thin films, using an ERT algorithm for mapping conductivity, and conducting both laboratory and full-scale tests on airport pavement slabs. The results showed that ERT effectively identifies crack severity, locations, and patterns before they become visible on the surface, thus improving the damage-detection capabilities of self-sensing concrete pavements.

3.2. Moisture Penetration/Water Ingress

Concrete is often reinforced with steel bars to improve its strength and durability. When moisture penetrates the concrete, it reaches the steel reinforcement. The presence of water and oxygen initiates the steel corrosion process. The corroded steel expands, causing the surrounding concrete to crack and weaken, leading to structural damage and potential failure. Additionally, water can facilitate the penetration of harmful chemicals like chlorides and sulfates into concrete. These chemicals can react with the components of the concrete matrix, leading to deleterious reactions, such as sulfate attacks or alkali–silica reactions. These reactions can cause expansion, cracking, and overall degradation in the concrete. Thus, monitoring water or moisture penetration is crucial.
ERT can monitor moisture penetration in concrete by leveraging changes in the electrical resistivity of the concrete as it becomes saturated with water. Dry concrete has high resistivity, while wet concrete has lower resistivity because water, especially if it contains dissolved ions, conducts electricity better than a solid concrete matrix. As moisture penetrates the concrete, the regions with increased moisture content show lower resistivity compared to the dry regions. By comparing resistivity maps over time, ERT can identify areas where moisture is infiltrating and track the progression of moisture penetration.
Milad et al. explored the application of ERT for visualizing moisture distribution in cement-based materials, as detailed in Figure 6 [50]. Their findings indicated that ERT is capable of detecting moisture migration and estimating the shape and location of the moisture front, even under conditions of irregular flow. Syml et al. employed ERT to study the flow of unsaturated moisture in cement-based materials containing discrete cracks [51]. The absolute imaging framework was utilized for the ERT image reconstruction, enhancing the accuracy and tolerance of the images concerning the complex conductivity distribution in cracked materials.
ERT was utilized to nondestructively investigate the internal structure of concrete pillars during a water infiltration test. This technique successfully tracked the progressive absorption of water into the pillars, showcasing its potential applications in areas such as concrete curing monitoring, leak detection, environmental remediation, and contaminant monitoring in soil and groundwater, as shown by Buettner et al. [12]. Suryanto et al. used ERT to visualize water ingress into partially saturated concrete [52]. The spatial distribution of electrical resistance was obtained through four-point surface electrical measurements. A reference–difference algorithm was applied to qualitatively represent the moisture distribution during the first 20 h of absorption. Voss et al. investigated the feasibility of using electrical capacitance tomography (ECT), a form of electrical tomography, for imaging two-dimensional (2D) unsaturated moisture flow in cement-based materials [53]. Experiments conducted on mortar specimens with and without discrete cracks showed that ECT could effectively track the progression of moisture flow and estimate the shape and location of the moisture front. These results suggest that ECT is suitable for monitoring and visualizing 2D unsaturated moisture flow in cement-based materials, regardless of the presence of cracks.
Caetano et al. explored the effectiveness of ground penetrating radar (GPR) and ERT for detecting leaks in large unpressurized concrete pipelines (>1 m in diameter) [54]. Water distribution losses can be substantial, with some regions in Brazil experiencing up to 40% losses and even European countries averaging 23%. The study highlights that, while most research focuses on quantifying water loss, the location of failures is often overlooked. GPR and ERT were used to identify soil zones indicative of water leakage, which was confirmed by visual inspection. The accuracy of these methods was influenced by environmental factors, such as soil moisture and granulometry, and the duration of the leak. In the study, leak detection zones ranged from 6 to 15 m horizontally and 2.5 m vertically. The findings suggest that geophysical technologies can significantly enhance water resource management, especially in systems with high water loss.
Wang et al. used electrical capacitance volume tomography (ECVT) to detect and visualize water ingress in mortar, and the concrete was monitored and visualized in three dimensions by ECVT [55]. The feasibility of ECVT was first verified by conducting a moisture transfer experiment inside uncracked mortars. Then, the water ingress process into cracked mortar and concrete was monitored and visualized using this technique, which further confirmed the ability to image three-dimensional (3D) volumetric water content in materials with highly heterogeneous permittivity. In addition, the water distribution inside the cracked and uncracked mortars was simulated utilizing two finite element models. The simulated results agree well with the reconstructed ECVT results, supporting the applicability of ECVT to image 3D water transfer in uncracked and cracked cement-based materials.
Buettner et al. employed ERT to image spatial moisture distribution and movement in pavement sections during an infiltration test [56]. ERT determines electrical resistivity within a volume by measuring injected currents and the resulting electrical potentials. The data are processed using a finite element algorithm adjusted iteratively until the measured and calculated resistances align. Four arrays of ERT electrodes were installed in vertical drill holes at the corners of a square on a pavement section used for a truck-scale ramp on U.S. Highway 99 near Sacramento, CA. Water was introduced into the pavement, and ERT data were collected over several hours as the water infiltrated. The inverted ERT data provided images showing the pavement’s structure and the movement of water over time. Contrary to expectations, the water did not drain toward the shoulder based on the design, revealing unexpected infiltration behavior.
Zhuo et al. reported that moisture transport properties are crucial for the durability of cement-based materials, as water significantly contributes to degradation mechanisms and can carry harmful agents [57]. One key transport property is saturated hydraulic conductivity (SHC), which depends on porosity, pore size distribution, and pore connectivity. However, measuring SHC is challenging due to the required experimental setup and the low SHC of these materials. The paper proposes using ECT to estimate SHC during capillary absorption experiments. ECT images the specimens as they absorb water, and the time-series data of water front propagation is used to estimate SHC. The study uses a one-dimensional (1D) sharp front model to simplify moisture ingress for SHC estimation. Both numerical and experimental tests demonstrate the feasibility of this approach. Numerical results show the method’s effectiveness for both ideal 1D moisture flow and more complex flows. Experimentally, ECT-based SHC estimates for mortars align well with independently measured values using the falling head method.
Wang et al. examined the use of ECVT to monitor 3D water penetration in porous materials with different cracks [58]. ECVT was used to visualize moisture ingress into cracked bricks and has previously proven effective for imaging spatial moisture distribution in cement-based materials. The study developed and evaluated ECVT sensors with top electrodes and reconstruction algorithms to enhance spatial resolution. The results showed successful visualization of moisture ingress, with reconstructed images aligning well with known properties of unsaturated water transport and moisture flow simulations. The findings suggest that ECVT is an effective tool for imaging and quantifying 3D water penetration around cracks in porous materials.

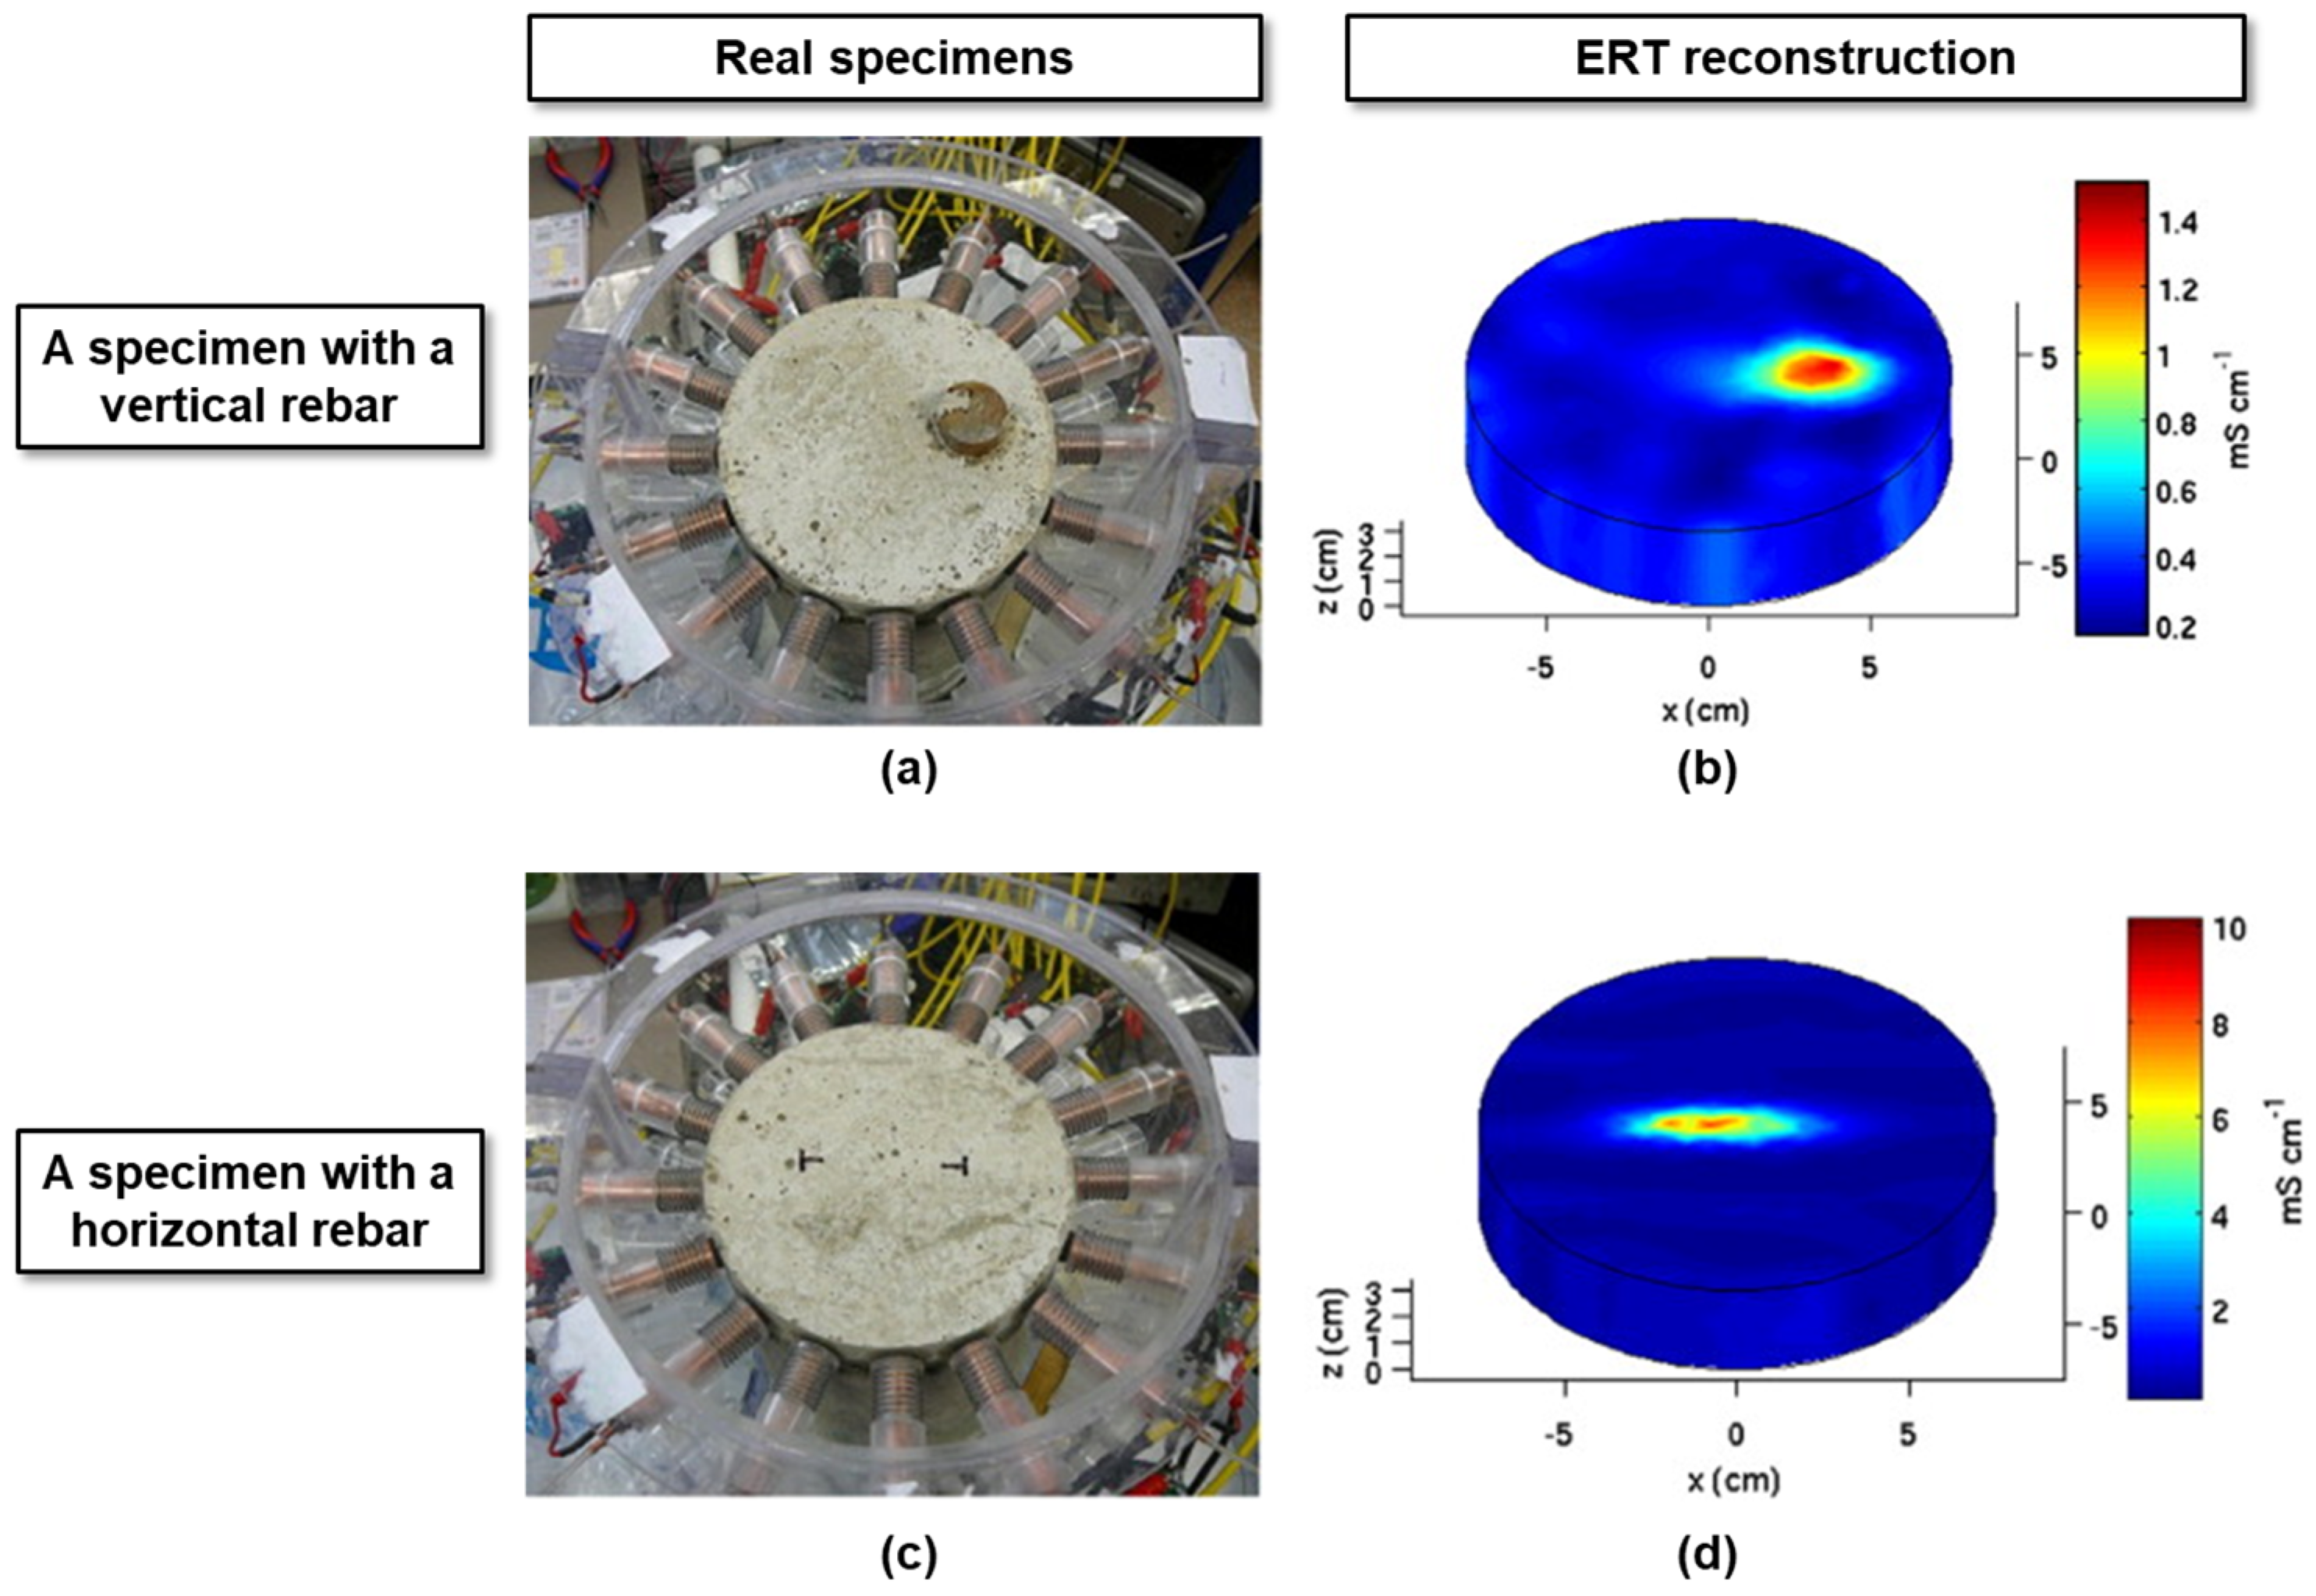
3.3. Steel Reinforcement

Steel rebars are prone to corrosion, especially in environments where moisture and chloride ions are present. Corrosion-induced expansion of the rebar can cause internal pressure in the concrete, leading to cracking, spalling, and delamination. These damages can severely affect the load-bearing capacity of the structure, increasing the risk of failure. Thus, monitoring steel rebars is essential for maintaining the structural integrity, safety, and longevity of concrete structures. It allows for early detection of issues, proactive maintenance, compliance with regulations, and overall better management of infrastructure assets.
Jeon et al. designed a frequency difference ERT algorithm to identify embedded rebars in cement-based materials, as described in [59]. Typically, ERT assesses changes in conductivity within an object over time by comparing it to reference data (initial measurements), a method known as reference–difference ERT, referenced in [50]. This method’s limitation is that it cannot generate accurate ERT images for samples where reference data (i.e., concrete in the absence of a rebar) cannot be obtained initially, such as those with an embedded rebar. To address this issue, the frequency difference ERT algorithm applies currents of two different frequencies. Ahn et al. reported that utilizing the property that the material’s resistance varies with the frequency of the injected current, it can distinguish between concrete and rebar [60]. Karhunen et al. studied locating embedded reinforcing bars in concrete, focusing on the high contact impedance between the steel bars and the concrete and the ill-posed problem of ERT reconstruction [61]. To visualize the rebar, Reichling et al. also examined the distribution of concrete resistivity perpendicular to the surface of the concrete, as detailed in [10]. In the study, the authors proposed that it is possible to derive the spatial conductivity distribution of material properties and to understand how an uneven resistivity distribution affects the corrosion rate of reinforcement. As can be seen in Figure 7, Alhajj et al. examined the effect of rebars on resistivity profiles during surveys of RC structures [62]. It is essential to account for the presence of steel rebars, as their much lower resistivity compared to concrete can significantly alter resistivity readings and impact the overall profile obtained from the survey. ERT was used to visualize vertical and horizontal steel rebars (3 cm in diameter) embedded in concrete. However, Alhajj et al. suggested that it significantly underestimated the conductivity of the rebar because the simulation model did not account for the contact impedance between the concrete and the rebar [62]. Additionally, beyond a certain threshold, differences in conductivity had a minimal impact on the boundary voltage measurements.
Taghizadieh et al. introduced an electric potential measurement technique (tomography) as a nondestructive method to evaluate concrete properties and durability [63]. A numerical meshless method was developed to solve differential equations simulating electric potential distribution in 2D concrete samples with iron block inclusions at various locations. Direct current was injected through pairs of electrodes, with measurements taken via 14 perimeter electrodes in 35 configurations. The Bayesian theorem was used for probabilistic tomography and to optimize the shape coefficient in the numerical model. The results indicated that the shape coefficient in the multiquadric radial basis function (MQ-RBF) model is significantly influenced by boundary conditions. The study found that probabilistic tomography is more accurate than deterministic methods, even without prior functions, and that the MQ-RBF model performs well in electrical tomography due to its ability to handle uncertainties in concrete properties through shape coefficient optimization.

3.4. Chloride Profile

Achrafi et al. explored the use of ERT to evaluate chloride profiles in blast furnace slag concrete with high electrical resistivity after a long curing period [64]. The study monitored chloride profiles in two 6-year-old concretes (with and without slag) during a diffusion campaign. The methodology involved determining electrical resistivity profiles through surface resistivity measurements and two different inversion processes. These resistivity profiles were then converted to chloride profiles using calibration curves. The results from NDE were compared to those from destructive evaluation (DE) at three different exposure periods, showing high similarity between the DE and NDE profiles.

4. Comparison of Current NDT and ERT

Compared to traditional NDT imaging methods, such as magnetic resonance imaging and computed tomography (CT) scans, ERT might have lower spatial resolution [30]. Nevertheless, its benefits, including affordability, portability, and lack of risk by radiation, make it a valuable option for concrete structure diagnosis. Above all, existing NDT techniques and ERT differ significantly in their fundamental technical principles and measurement mediums.
Ultrasonic testing is an NDT method that uses high-frequency sound waves to detect flaws in materials [65]. These sound waves propagate through the material and interact with interfaces between different materials or internal defects. Upon encountering these interfaces, the waves are partially reflected back to the receiver. The data collected from these ultrasound waves are then processed to generate images or visual representations of the material’s internal structure.
Acoustic emission is another type of NDT method that detects the release of energy in the form of sound waves from materials under stress [66,67]. Sensors capture these sound waves, which are analyzed to identify and locate defects or structural changes.
X-ray CT is an imaging technique that uses X-rays to create detailed cross-sectional images of objects or body parts [68,69,70]. An X-ray source emits a series of X-ray beams that pass through the object being examined. On the opposite side of the X-ray source, detectors capture the X-rays that have passed through the object. Different tissues or materials within an object absorb X-rays to varying degrees, depending on their density and composition. The X-ray source and detectors rotate around the object, taking multiple X-ray measurements from different angles. This process captures a comprehensive set of data that represents cross-sectional slices of the object. Guo et al. investigated a computer processing the captured data using complex algorithms to reconstruct detailed cross-sectional images, or slices, of the object [71]. These images can be compiled to form a 3D representation of the internal structure. In other words, CT and ERT are similar in that they are both NDT methods used for internal visualization. However, ERT is a diffusive modality, whereas CT is a rectilinear modality; thus, the reconstruction of ERT data is more challenging [30].

5. Recent Advances in ERT

5.1. Time-Lapse Electrical Resistivity Tomography (TL-ERT)

In recent years, Lapenna et al. has introduced the time-lapse electrical resistivity tomography (TL-ERT) method and applied it to various fields, including landslide monitoring [39]. TL-ERT is particularly effective for tracking changes in water content in superficial soil layers and identifying fluid infiltration pathways, which can be crucial for early landslide warning systems. Significant progress has been made in processing and interpreting TL-ERT data. However, further improvements are needed in understanding the relationship between resistivity and hydrogeological parameters, as well as in applying advanced mathematical and statistical methods for data interpretation. Moreover, the potential of TL-ERT for deeper geophysical investigations should be explored.

5.2. Integration of ERT and GPR in Geotechnical Monitoring

Capozzoli et al. highlights recent advances in electric and electromagnetic geophysical methods, focusing on their application in monitoring subsidence and settlement [72]. The study shows the effectiveness of combining ERT and GPR with direct data to evaluate building safety and address geotechnical issues, specifically in two precast buildings affected by structural decay. Yang et al. examined a typical scenario in which an RC floor overlays natural topsoil or rock [73]. Synthetic simulations show that the wire mesh acts as a good conductor for small source–receiver separations and as an equal-potential object for large separations, leading to uninterpretable low-resistivity anomalies in routine ERT inversions. To address this, two methods were proposed: modeling the wire mesh as a high-conductivity top layer for a warm-start inversion approach and adding underground electrodes to the survey array to gather deeper information. These strategies were successfully applied to a real ERT dataset from an indoor manufacturing plant with an RC floor, demonstrating improved ERT resolution.

5.3. Challenges and Solutions in ERT for Contaminated Sites

ERT [74] is widely used to investigate contaminated sites, but its effectiveness is challenged by the presence of RC layers with embedded wire mesh, as demonstrated in a dense nonaqueous-phase liquid (DNAPL) remediation site at a factory. The wire mesh complicates ERT data by creating a short-circuit, preventing currents from reaching the DNAPL depth and making conventional ERT processing ineffective. To improve ERT imaging resolution, the study employed two strategies: (1) modeling the wire mesh as a high-conductivity top layer and excluding it from inversion and (2) adding downhole electrodes in remediation wells to gather deeper data. Both the simulation and field data confirmed that these techniques effectively enhanced ERT imaging resolution in such complex environments.

5.4. Innovations in ERT Image Reconstruction and Flaw Detection

Zhuo et al. introduced Newton’s constrained reconstruction method (NCRM), an optimized inverse algorithm for detecting damage in cementitious materials [57]. The algorithm optimizes the initial parameters by applying constraints on the range and spatial distribution of conductivities. Numerical and experimental voltage datasets were used to reconstruct the conductivity distribution images. The quality of these images was assessed using correlation coefficients and position errors, indicating that NCRM enhanced image quality by reducing artifacts and improving positioning accuracy. Zhuo et al. extended ERT to detect multiple flaws in larger concrete plates using a subdomain integration method [75]. The concrete specimens were divided into four, nine, and sixteen subdomains for detection, unlike traditional ERT techniques. The feasibility of the subdomain integration method for detecting multiple flaws was evaluated through a theoretical analysis of equipotential line density and image quality indicators. The study concluded that subdomain integration is effective for detecting multiple flaws in larger cementitious components. V DenseNet-based ERT achieved superior spatial resolution, significantly enhancing imaging accuracy. Li et al. proposed a densely connected convolutional neural network (CNN) in ERT image reconstruction to address the limitations of handling sparse information flow and gradient flow, which lead to inaccuracies in reconstructed images [76]. Jauhiainen et al. proposed ERT-based sensing skin for nonplanar geometries using Riemannian geometry, enabling distributed sensing for various parameters, such as damage, strain, and temperature [77]. Quqa et al. explored the use of ERT in identifying crack locations in nanocomposite paint applied to structural components. The novelty lies in enhancing crack identification performance using deep neural networks trained with simulated datasets and leveraging crack annotations from visual inspections for transfer learning. The study demonstrated that this approach outperforms traditional methods of localizing cracks in complex damage patterns [14]. Jeon et al. [30] addressed the challenge of accurately detecting rebar positioning in concrete to inspect rebar conditions using deep learning-based ERT. Two datasets, featuring original circular ERT images in Cartesian coordinates and transformed rectangular ERT images in polar coordinates, were prepared as input data. The CNN model successfully identified rebar positions in the ERT images. Escalona-Galvis et al. investigated damage identification in carbon fiber-reinforced polymer (CFRP) composites [78]. To select the optimal set of sensing sites, which was a key challenge in the study, an effective independence measure was introduced, and finite element analyses were conducted to calculate the electrical potential in different CFRP laminate layups with 14 electrodes.

5.5. Advanced Techniques for ERT Image Enhancement and Process Monitoring

Chen et al. investigated the conditional generative adversarial network (CGAN)-based reconstruction method to improve the resolution of ERT field images [79]. Modifications to the CGAN structure tailored to ERT characteristics and the addition of loss judgment in discriminator training contributed to improved training efficiency. The testing results demonstrated enhanced sharpness and image detail reconstruction and reduced image errors, indicating the effectiveness of the method in improving the quality of ERT image reconstructions, even when using real experimental data. Li et al. introduced a supervised V-Net deep imaging method to monitor multiphase flow distribution in industrial processes for control efficiency and production optimization [80]. A 33-layer network was used with CNN modules for initial imaging, feature extraction, and image reconstruction. The network utilized residual and jump connections to enhance information flow and gradient flow. The experimental results demonstrated that the V-Net method outperforms linear back projection, Tikhonov regularization, and other related networks in imaging quality for ERT. Cimpoiaşu et al. extended the application of ERT to four-dimensional process monitoring, given that it is sensitive to moisture content and soil texture changes [81]. The study measured variations in electrical resistivity and X-ray absorption with gravimetric moisture content for two different soil types, and the results were compared with existing pedophysical relationships.

5.6. ERT for Structural Health Monitoring and Damage Detection

Numerous researchers have introduced specific applications AI in ERT. Hung et al. explored the feasibility of using ERT to detect underground tunnels on an island, supported by numerical models and deep learning techniques. Kinmen Island, once in a state of combat readiness, opened for tourism in 1992, leaving many military installations abandoned and overgrown. The results demonstrate that ERT, enhanced by deep learning, is highly effective in identifying the location, size, and shape of these tunnels [82]. Kong et al. developed a new workflow integrating DL technology with traditional ERT inversion, featuring a DL-ERT inversion model based on a U-Net structure and incorporating borehole data. To generate training data focused on specific targets, they utilized approximately 150 borehole data samples collected from different survey locations across South Korea. This approach, which includes a three-stage training process, significantly improves prediction accuracy and stability, as demonstrated in fault detection compared to traditional methods [83]. Hasan et al. introduced ERT as a noninvasive, faster alternative, establishing empirical correlations between ERT data and limited drilling results to estimate the rock mass integrity coefficient. The study was conducted in the southern region of Huizhou, Guangdong province, China. This approach provides more accurate geological insights, particularly in hard-to-access areas with sparse borehole data, and is applicable in various hard rock settings. The established correlations can be used even in regions without well tests [84]. Numerous researchers have attempted to develop integrated methodologies for structural health monitoring (SHM) of structures and infrastructures, utilizing various techniques to improve the reliability of results [85,86]. Their aim is to minimize the uncertainties inherent in individual methods, thereby reducing the likelihood of false alarms. In particular, Vincenzo et al. investigated an integrated geophysical approach using seismic and electromagnetic techniques to assess the static and dynamic properties of the Gravina Bridge in Matera, Southern Italy, and its interaction with foundation soils. The study included high-resolution geo-electrical tomographies, a Vs velocity profile, and site amplification functions to evaluate the foundation soils, while the bridge’s structural characteristics were monitored using accelerometers, velocimeters, and a microwave radar interferometer. The experimental campaigns confirmed the robustness of the approach and established a baseline for the bridge’s dynamic parameters [87].

6. Challenges and Future Directions

ERT has emerged as a vital NDT technique for evaluating the internal conditions of structures, particularly in civil engineering. Despite its advancements, there are several challenges and future directions that merit attention and research focus. Drawing insights from the previous literature, we delineate the challenges and future directions of ERT below:
  • Development of Concrete-Compatible Electrodes for Enhanced Resolution: One of the primary challenges in ERT is enhancing resolution, particularly in concrete structures where traditional electrodes may not provide optimal performance. Research efforts should focus on the development of novel electrode materials that are suitable for concrete and that can facilitate improved resolution in ERT imaging. These electrodes should exhibit superior conductivity, stability, and compatibility with the harsh environmental conditions often encountered in concrete structures.
  • Resolution Enhancement Using Artificial Intelligence Technologies: The integration of artificial intelligence (AI) technologies, such as CNNs and long short-term memory (LSTM) networks, has immense potential for enhancing the resolution of ERT imaging. By leveraging the capabilities of AI, it becomes possible to analyze subtle features indicative of structural anomalies or defects more effectively. Research in this area should focus on developing AI algorithms tailored specifically for the interpretation of ERT data, thereby improving the accuracy and resolution of ERT imaging outcomes.
  • Integration with Other NDT Techniques: In addition to CNNs and LSTMs, other AI-based techniques can be applied to integrate ERT with complementary NDT methods, such as ultrasonic tomography and GPR. By combining multiple NDT techniques through AI-driven data fusion and analysis, a more sophisticated assessment of structural integrity and conditions can be achieved. This integrated approach enhances the reliability and accuracy of defect detection and characterization in various types of structures.
  • Application in Large-Scale RC Structures: While ERT has been extensively applied in laboratory settings and smaller-scale field applications, its utilization in large-scale RC structures remains relatively limited. Research efforts should focus on adapting ERT techniques for practical deployment in large-scale structures, such as bridges, dams, and high-rise buildings. Addressing the challenges associated with scaling up ERT applications will facilitate broader adoption in civil engineering and infrastructure monitoring projects.
  • Development of Macro-CT for Large Structures Inaccessible to X-ray CT: Macro-computed tomography (macro-CT) emerges as a promising solution for imaging large structures where traditional X-ray CT techniques are impractical or infeasible. Macro-CT utilizes alternative imaging modalities of ERT to penetrate dense materials and capture internal structural details on a macroscopic scale. Research endeavors should focus on advancing macro-CT methodologies, instrumentation, and image reconstruction algorithms to address the unique challenges posed by large-scale structural imaging requirements.
In summary, addressing the aforementioned challenges and exploring the outlined future directions will contribute to the continued advancement and applicability of ERT in concrete structures. Collaboration among researchers, industry stakeholders, and technology developers will be essential in realizing the full potential of ERT as a macro-scale CT tool.

7. Conclusions

ERT is steadily advancing as a valuable tool for monitoring and imaging various systems. This technology is relatively affordable and nondestructive and lacks potential hazards, making it highly promising. The applications of ERT are expanding in the inspection of concrete structure sectors. This paper outlines the steps required to address the challenges of ERT and reviews the role of AI and various algorithms in solving the limitations of existing electrical tomography. Additionally, we explored various ERT applications on concrete materials and structures: (1) crack and cavity detection, (2) moisture penetration and water ingress, (3) steel reinforcement monitoring, and (4) chloride profiling.
Advances in ERT include TL-ERT for monitoring temporal changes, integration with AI techniques for improved image resolution, and the development of macro-scale CT methods for large structures. These innovations enhance the capability of ERT to provide detailed, accurate, and actionable data for infrastructure monitoring. However, despite significant technological advancements, there are still considerable research areas in ERT that require further exploration. Future research may focus on improving the spatial resolution of ERT images, developing more efficient computational algorithms, and integrating ERT with other imaging technologies for comprehensive monitoring solutions. Key challenges include developing concrete-compatible electrodes, improving resolution, integrating ERT with other NDT techniques, and scaling up applications for large structures. Addressing these issues will expand the applicability and reliability of ERT in various fields.
In summary, ERT is a promising NDT method, particularly for concrete materials, offering detailed insights into internal infrastructures. Continued research and technological integration will enhance its effectiveness, making it a valuable tool for infrastructure monitoring and maintenance.

Author Contributions

Conceptualization, D.J. and S.Y.; methodology, D.J.; software, S.Y.; validation, S.Y.; formal analysis, D.J.; investigation, S.Y.; resources, S.Y.; data curation, S.Y.; writing—original draft preparation, S.Y. and D.J.; writing—review and editing, S.Y. and D.J.; visualization, D.J.; supervision, S.Y.; project administration, S.Y.; funding acquisition, D.J. All authors have read and agreed to the published version of the manuscript.

Funding

This work was funded by the National Research Foundation of Korea (NRF) grant funded by the Korean government (MSIT) (No. NRF-2022R1C1C2003944).

Data Availability Statement

Data is unavailable.

Acknowledgments

This work was supported by the National Research Foundation of Korea (NRF) grant funded by the Korean government (MSIT) (No. NRF-2022R1C1C2003944).

Conflicts of Interest

The authors declare no conflict of interest.

References

  1. Qu, F.; Li, W.; Dong, W.; Tam, V.W.Y.; Yu, T. Durability deterioration of concrete under marine environment from material to structure: A critical review. J. Build. Eng. 2021, 35, 102074. [Google Scholar] [CrossRef]
  2. Mather, B. Concrete durability. Cem. Concr. Compos. 2004, 26, 3–4. [Google Scholar] [CrossRef]
  3. Torres-Machi, C.; Pellicer, E.; Yepes, V.; Chamorro, A. Towards a sustainable optimization of pavement maintenance programs under budgetary restrictions. J. Clean. Prod. 2017, 148, 90–102. [Google Scholar] [CrossRef]
  4. Cui, Q.; Johnson, P.W.; Sees, E. Long-Term Warranties on Highway Projects; University Transportation Center for Alabama: Tuscaloosa, AL, USA, 2008. [Google Scholar]
  5. Matthews, S.; Morlidge, J. Achieving durable repaired concrete structures: A performance-based approach. Proc. Inst. Civ. Eng.-Struct. Build. 2008, 161, 17–28. [Google Scholar] [CrossRef]
  6. Hoła, J.; Schabowicz, K. State-of-the-art non-destructive methods for diagnostic testing of building structures—Anticipated development trends. Arch. Civ. Mech. Eng. 2010, 10, 5–18. [Google Scholar] [CrossRef]
  7. Cheney, M.; Isaacson, D.; Newell, J.C. Electrical impedance tomography. SIAM Rev. 1999, 41, 85–101. [Google Scholar] [CrossRef]
  8. Osinowo, O.O.; Falufosi, M.O.; Omiyale, E.O. Integrated electromagnetic (EM) and Electrical Resistivity Tomography (ERT) geophysical studies of environmental impact of Awotan dumpsite in Ibadan, southwestern Nigeria. J. Afr. Earth Sci. 2018, 140, 42–51. [Google Scholar] [CrossRef]
  9. Harikumar, R.; Prabu, R.; Raghavan, S. Electrical impedance tomography (EIT) and its medical applications: A review. Int. J. Soft Comput. Eng. 2013, 3, 193–198. [Google Scholar]
  10. Reichling, K.; Raupach, M.; Klitzsch, N. Determination of the distribution of electrical resistivity in reinforced concrete structures using electrical resistivity tomography. Mater. Corros. 2015, 66, 763–771. [Google Scholar] [CrossRef]
  11. Sharifi, M.; Young, B. Electrical resistance tomography (ERT) applications to chemical engineering. Chem. Eng. Res. Des. 2013, 91, 1625–1645. [Google Scholar] [CrossRef]
  12. Buettner, M.; Ramirez, A.; Daily, W. Electrical resistance tomography for imaging concrete structures. In Structural Materials Technology; CRC Press: Boca Raton, FL, USA, 2020; pp. 299–304. [Google Scholar]
  13. Chen, L.; Gallet, A.; Huang, S.-S.; Liu, D.; Smyl, D. Probabilistic cracking prediction via deep learned electrical tomography. Struct. Health Monit. 2022, 21, 1574–1589. [Google Scholar] [CrossRef]
  14. Quqa, S.; Landi, L.; Loh, K.J. Crack identification using electrical impedance tomography and transfer learning. Comput.-Aided Civ. Infrastruct. Eng. 2023, 38, 2426–2442. [Google Scholar] [CrossRef]
  15. Karhunen, K.; Seppänen, A.; Lehikoinen, A.; Monteiro, P.J.M.; Kaipio, J.P. Electrical resistance tomography imaging of concrete. Cem. Concr. Res. 2010, 40, 137–145. [Google Scholar] [CrossRef]
  16. Webster, J.G. Electrical Impedance Tomography; CRC Press: Boca Raton, FL, USA, 1990. [Google Scholar]
  17. Ma, E. A current-based forward solver for the shunt model of electrical impedance tomography. In Proceedings of the 8th European Medical and Biological Engineering Conference EMBEC 2020, Portorož, Slovenia, 29 November–3 December 2020; Springer: Berlin/Heidelberg, Germany, 2021; pp. 1–9. [Google Scholar]
  18. Ma, E. Integral formulation of the complete electrode model of electrical impedance tomography. Inverse Probl. Imaging 2020, 14, 385. [Google Scholar] [CrossRef]
  19. Yoon, S.; Jeon, D.; Oh, J.-E.; Kim, M.-K.; Kim, D.-J. Experimentally validated analytical solutions to homogeneous problems of electrical impedance tomography (EIT) on rectangular cement-based materials. Appl. Sci. 2022, 13, 335. [Google Scholar] [CrossRef]
  20. Yoon, S.; Kim, M.K.; Kim, T.U.; Jeon, D.; Song, H.; Suh, J.-I.; Oh, J.E.; Kim, D.J. Enhancing image resolution in single-side electrical resistance tomography (ERT) by utilizing theoretical sensitivity analysis: Experimental validation and application to cement mortar. J. Build. Eng. 2024, 84, 108480. [Google Scholar] [CrossRef]
  21. Tiwari, V.K.; Meribout, M.; Khezzar, L.; Alhammadi, K.; Tarek, M. Electrical tomography hardware systems for real-time applications: A review. IEEE Access 2022, 10, 93933–93950. [Google Scholar] [CrossRef]
  22. Fouchard, A.; Bonnet, S.; Hervé, L.; David, O. Flexible numerical platform for electrical impedance tomography. In Proceedings of the COMSOL Conference, Grenoble, France, 14–16 October 2015. [Google Scholar]
  23. Madenci, E.; Guven, I. The Finite Element Method and Applications in Engineering Using ANSYS®; Springer: Berlin/Heidelberg, Germany, 2015. [Google Scholar]
  24. Adler, A.; Lionheart, W.R.B. Uses and abuses of EIDORS: An extensible software base for EIT. Physiol. Meas. 2006, 27, S25. [Google Scholar] [CrossRef]
  25. Sylvester, J.; Uhlmann, G. A uniqueness theorem for an inverse boundary value problem in electrical prospection. Commun. Pure Appl. Math. 1986, 39, 91–112. [Google Scholar] [CrossRef]
  26. Onur, O.; Eyi, S. Effects of the Jacobian evaluation on Newton’s solution of the Euler equations. Int. J. Numer. Methods Fluids 2005, 49, 211–231. [Google Scholar] [CrossRef]
  27. Gómez-Laberge, C.; Adler, A. Direct EIT Jacobian calculations for conductivity change and electrode movement. Physiol. Meas. 2008, 29, S89. [Google Scholar] [CrossRef]
  28. Smyl, D.; Pour-Ghaz, M.; Seppänen, A. Detection and reconstruction of complex structural cracking patterns with electrical imaging. NDT E Int. 2018, 99, 123–133. [Google Scholar] [CrossRef]
  29. Sarode, V.; Patkar, S.; Cheeran, A.N. Comparison of 2-D algorithms in ElT based image reconstruction. Int. J. Comput. Appl. 2013, 69, 6–11. [Google Scholar] [CrossRef]
  30. Jeon, D.; Kim, M.K.; Woo, H.; Jeong, Y.; Oh, J.E.; Kim, D.J.; Yoon, S. Detecting embedded rebar in cement mortar by frequency-difference electrical resistance tomography. Autom. Constr. 2021, 132, 103974. [Google Scholar] [CrossRef]
  31. Perrone, A.; Lapenna, V.; Piscitelli, S. Electrical resistivity tomography technique for landslide investigation: A review. Earth Sci. Rev. 2014, 135, 65–82. [Google Scholar] [CrossRef]
  32. Bernard, J.; Leite, O.; Vermeersch, F.; Instruments, I.; Orleans, F. Multi-Electrode Resistivity Imaging for Environmental and Mining Applications; IRIS Instruments: Orleans, France, 2006. [Google Scholar]
  33. Bodenstein, M.; David, M.; Markstaller, K. Principles of electrical impedance tomography and its clinical application. Crit. Care Med. 2009, 37, 713–724. [Google Scholar] [CrossRef]
  34. Smyl, D. Electrical tomography for characterizing transport properties in cement-based materials: A review. Constr. Build. Mater. 2020, 244, 118299. [Google Scholar] [CrossRef]
  35. Tidswell, T.; Gibson, A.; Bayford, R.H.; Holder, D.S. Three-dimensional electrical impedance tomography of human brain activity. Neuroimage 2001, 13, 283–294. [Google Scholar] [CrossRef]
  36. Jeon, D.; Kim, M.K.; Jeong, Y.; Oh, J.E.; Moon, J.; Kim, D.J.; Yoon, S. High-accuracy rebar position detection using deep learning–based frequency-difference electrical resistance tomography. Autom. Constr. 2022, 135, 104116. [Google Scholar] [CrossRef]
  37. Rymarczyk, T.; Kłosowski, G.; Kozłowski, E. A non-destructive system based on electrical tomography and machine learning to analyze the moisture of buildings. Sensors 2018, 18, 2285. [Google Scholar] [CrossRef] [PubMed]
  38. Rymarczyk, T.; Kłosowski, G.; Hoła, A.; Hoła, J.; Sikora, J.; Tchórzewski, P.; Skowron, Ł. Historical buildings dampness analysis using electrical tomography and machine learning algorithms. Energies 2021, 14, 1307. [Google Scholar] [CrossRef]
  39. Lapenna, V.; Perrone, A. Time-lapse electrical resistivity tomography (TL-ERT) for landslide monitoring: Recent advances and future directions. Appl. Sci. 2022, 12, 1425. [Google Scholar] [CrossRef]
  40. Mauriello, P.; Patella, D. A data-adaptive probability-based fast ERT inversion method. Prog. Electromagn. Res. 2009, 97, 275–290. [Google Scholar] [CrossRef]
  41. Teniou, S.; Meribout, M. A multimodal image reconstruction method using ultrasonic waves and electrical resistance tomography. IEEE Trans. Image Process. 2015, 24, 3512–3521. [Google Scholar] [CrossRef] [PubMed]
  42. Aleardi, M.; Vinciguerra, A.; Hojat, A. A geostatistical Markov chain Monte Carlo inversion algorithm for electrical resistivity tomography. Near Surf. Geophys. 2021, 19, 7–26. [Google Scholar] [CrossRef]
  43. Ramirez, A.L.; Nitao, J.J.; Hanley, W.G.; Aines, R.; Glaser, R.E.; Sengupta, S.K.; Dyer, K.M.; Hickling, T.L.; Daily, W.D. Stochastic inversion of electrical resistivity changes using a Markov Chain Monte Carlo approach. J. Geophys. Res. Solid. Earth 2005, 110, B02101. [Google Scholar] [CrossRef]
  44. Gupta, S.; Lin, Y.-A.; Lee, H.-J.; Buscheck, J.; Wu, R.; Lynch, J.P.; Garg, N.; Loh, K.J. In situ crack mapping of large-scale self-sensing concrete pavements using electrical resistance tomography. Cem. Concr. Compos. 2021, 122, 104154. [Google Scholar] [CrossRef]
  45. Karhunen, K.; Seppänen, A.; Lehikoinen, A.; Blunt, J.; Kaipio, J.P.; Monteiro, P.J.M. Electrical Resistance Tomography for Assessment of Cracks in Concrete. ACI Mater. J. 2010, 107, 523. [Google Scholar]
  46. Zhou, X.; Bhat, P.; Ouyang, H.; Yu, J. Localization of cracks in cementitious materials under uniaxial tension with electrical resistance tomography. Constr. Build. Mater. 2017, 138, 45–55. [Google Scholar] [CrossRef]
  47. Ren, H.; Tian, K.; Hong, S.; Dong, B.; Xing, F.; Qin, L. Visualized investigation of defect in cementitious materials with electrical resistance tomography. Constr. Build. Mater. 2019, 196, 428–436. [Google Scholar] [CrossRef]
  48. Hallaji, M.; Pour-Ghaz, M. A new sensing skin for qualitative damage detection in concrete elements: Rapid difference imaging with electrical resistance tomography. NDT E Int. 2014, 68, 13–21. [Google Scholar] [CrossRef]
  49. McAlorum, J.; Perry, M.; Ward, A.C.; Vlachakis, C. ConcrEITS: An electrical impedance interrogator for concrete damage detection using self-sensing repairs. Sensors 2021, 21, 7081. [Google Scholar] [CrossRef] [PubMed]
  50. Hallaji, M.; Seppänen, A.; Pour-Ghaz, M. Electrical resistance tomography to monitor unsaturated moisture flow in cementitious materials. Cem. Concr. Res. 2015, 69, 10–18. [Google Scholar] [CrossRef]
  51. Smyl, D.; Rashetnia, R.; Seppänen, A.; Pour-Ghaz, M. Can electrical resistance tomography be used for imaging unsaturated moisture flow in cement-based materials with discrete cracks? Cem. Concr. Res. 2017, 91, 61–72. [Google Scholar] [CrossRef]
  52. Suryanto, B.; Saraireh, D.; Kim, J.; McCarter, W.J.; Starrs, G.; Taha, H.M. Imaging water ingress into concrete using electrical resistance tomography. Int. J. Adv. Eng. Sci. Appl. Math. 2017, 9, 109–118. [Google Scholar] [CrossRef]
  53. Voss, A.; Hänninen, N.; Pour-Ghaz, M.; Vauhkonen, M.; Seppänen, A. Imaging of two-dimensional unsaturated moisture flows in uncracked and cracked cement-based materials using electrical capacitance tomography. Mater. Struct. 2018, 51, 68. [Google Scholar] [CrossRef]
  54. Caetano, T.R.; Santos, H.A.; van Dam, R.L. Leak identification in non-pressurized concrete pipelines by the use of geophysical methods. J. Appl. Geophy 2023, 208, 104883. [Google Scholar] [CrossRef]
  55. Wang, W.; Zhao, K.; Zhang, P.; Bao, J.; Xue, S. Investigation of water ingress into uncracked and cracked cement-based materials using electrical capacitance volume tomography. Mater. Des. 2022, 220, 110877. [Google Scholar] [CrossRef]
  56. Buettner, M.; Ramirez, A.; Daily, W. Electrical resistance tomography for imaging the spatial distribution of moisture in pavement sections. In Structural Materials Technology; CRC Press: Boca Raton, FL, USA, 2020; pp. 342–347. [Google Scholar]
  57. Zhou, X.; Wang, J.; Tu, F.; Bhat, P. Damage detection in cementitious materials with optimized absolute electrical resistance tomography. Struct. Health Monit. 2022, 21, 2420–2435. [Google Scholar] [CrossRef]
  58. Wang, W.; Zhang, P.; Yang, D.; Xue, S. Imaging of unsaturated moisture flow inside cracked porous brick using electrical capacitance volume tomography. J. Build. Eng. 2023, 64, 105626. [Google Scholar] [CrossRef]
  59. Kuen, J.; Woo, E.J.; Seo, J.K. Multi-frequency time-difference complex conductivity imaging of canine and human lungs using the KHU Mark1 EIT system. Physiol. Meas. 2009, 30, S149–S164. [Google Scholar] [CrossRef]
  60. Ahn, S.; Jun, S.C.; Seo, J.K.; Lee, J.; Woo, E.J.; Holder, D. Frequency-difference electrical impedance tomography: Phantom imaging experiments. J. Phys. Conf. Ser. 2010, 224, 012152. [Google Scholar] [CrossRef]
  61. Karhunen, K.; Seppänen, A.; Lehikoinen, A.; Kaipio, J.P.; Monteiro, P.J.M. Locating reinforcing bars in concrete with electrical resistance tomography. In Concrete Repair, Rehabilitation and Retrofitting II; Alexander, M.G., Beushausen, H.-D., Dehn, F., Moyo, P., Eds.; Taylor & Francis Group: London, UK, 2009. [Google Scholar]
  62. Alhajj, M.A.; Palma-Lopes, S.; Villain, G. Accounting for steel rebar effect on resistivity profiles in view of reinforced concrete structure survey. Constr. Build. Mater. 2019, 223, 898–909. [Google Scholar] [CrossRef]
  63. Taghizadieh, N.; Movahedi, S. Numerical Meshless Method in Conjunction with Bayesian Theorem for Electrical Tomography of Concrete. Int. J. Eng. 2020, 33, 1070–1084. [Google Scholar]
  64. Achrafi, M.K.E.L.; Bonnet, S.; Villain, G. Electrical resistivity tomography results analyzed with two inversion methods to determine chloride profiles on BFS concrete having very high electrical resistivity. Constr. Build. Mater. 2023, 407, 133361. [Google Scholar] [CrossRef]
  65. Naik, T.R.; Malhotra, V.M.; Popovics, J.S. The ultrasonic pulse velocity method. In Handbook on Nondestructive Testing of Concrete, 2nd ed.; CRC Press: Boca Raton, FL, USA, 2003; pp. 1–8. [Google Scholar]
  66. Carpinteri, A.; Lacidogna, G.; Niccolini, G. Damage analysis of reinforced concrete buildings by the acoustic emission technique. Struct. Control Health Monit. 2011, 18, 660–673. [Google Scholar] [CrossRef]
  67. Sagar, R.V.; Mohit; Deepak, S.; Desai, P.R. Statistical analysis of acoustic emissions generated during unconfined uniaxial compression of cementitious materials. Constr. Build. Mater. 2019, 225, 692–708. [Google Scholar] [CrossRef]
  68. Kuusela, P.; Pour-Ghaz, M.; Pini, R.; Voss, A.; Seppänen, A. Imaging of reactive transport in fractured cement-based materials with X-ray CT. Cem. Concr. Compos. 2021, 124, 104211. [Google Scholar] [CrossRef]
  69. Ponikiewski, T.; Gołaszewski, J.; Rudzki, M.; Bugdol, M. Determination of steel fibres distribution in self-compacting concrete beams using X-ray computed tomography. Arch. Civ. Mech. Eng. 2015, 15, 558–568. [Google Scholar] [CrossRef]
  70. Michel, A.; Pease, B.J.; Geiker, M.R.; Stang, H.; Olesen, J.F. Monitoring reinforcement corrosion and corrosion-induced cracking using non-destructive x-ray attenuation measurements. Cem. Concr. Res. 2011, 41, 1085–1094. [Google Scholar] [CrossRef]
  71. Guo, Y.; Chen, X.; Chen, B.; Wen, R.; Wu, P. Analysis of foamed concrete pore structure of railway roadbed based on X-ray computed tomography. Constr. Build. Mater. 2021, 273, 121773. [Google Scholar] [CrossRef]
  72. Capozzoli, L.; De Martino, G.; Polemio, M.; Rizzo, E. Geophysical Techniques for Monitoring Settlement Phenomena Occurring in Reinforced Concrete Buildings. Surv. Geophys. 2020, 41, 575–604. [Google Scholar] [CrossRef]
  73. Yang, L.; Yang, D.; Yuan, Q. Electrical resistivity tomography through reinforced concrete floor. Near Surf. Geophys. 2024, 22, 47–59. [Google Scholar] [CrossRef]
  74. Yang, L.; Yang, D.; Yuan, Q. High-resolution ERT imaging of DNAPL contamination at complex soil remediation sites. In First International Meeting for Applied Geoscience & Energy, Society of Exploration Geophysicists; Society of Exploration Geophysicists: Houston, TX, USA, 2021; pp. 1961–1965. [Google Scholar]
  75. Zhou, X.; Tu, F.; Wang, J.; Li, Q. Subdomain integration method of electrical resistance tomography for multiple flaws detection in cementitious materials. Struct. Health Monit. 2022, 21, 2436–2452. [Google Scholar] [CrossRef]
  76. Li, F.; Tan, C.; Dong, F. Electrical Resistance Tomography Image Reconstruction With Densely Connected Convolutional Neural Network. IEEE Trans. Instrum. Meas. 2021, 70, 1–11. [Google Scholar] [CrossRef]
  77. Jauhiainen, J.; Pour-Ghaz, M.; Valkonen, T.; Seppänen, A. Nonplanar sensing skins for structural health monitoring based on electrical resistance tomography. Comput.-Aided Civ. Infrastruct. Eng. 2021, 36, 1488–1507. [Google Scholar] [CrossRef]
  78. Escalona-Galvis, L.W.; Venkataraman, S. Optimum reduction of sensing electrodes for delamination identification with electrical resistance tomography. Struct. Control Health Monit. 2021, 28, e2726. [Google Scholar] [CrossRef]
  79. Chen, Y.; Li, K.; Han, Y. Electrical resistance tomography with conditional generative adversarial networks. Meas. Sci. Technol. 2020, 31, 055401. [Google Scholar] [CrossRef]
  80. Li, F.; Tan, C.; Dong, F.; Jia, J. V-Net Deep Imaging Method for Electrical Resistance Tomography. IEEE Sens. J. 2020, 20, 6460–6469. [Google Scholar] [CrossRef]
  81. Cimpoiaşu, M.O.; Kuras, O.; Pridmore, T.; Mooney, S.J. A pedophysical relationship between X-ray computed tomography and electrical resistivity data. J. Env. Eng. Geophys. 2020, 25, 181–187. [Google Scholar] [CrossRef]
  82. Hung, Y.-C.; Zhao, Y.-X.; Hung, W.-C. Development of an Underground Tunnels Detection Algorithm for Electrical Resistivity Tomography Based on Deep Learning. Appl. Sci. 2022, 12, 639. [Google Scholar] [CrossRef]
  83. Kong, S.; Oh, J.; Yoon, D.; Ryu, D.-W.; Kwon, H.-S. Integrating Deep Learning and Deterministic Inversion for Enhancing Fault Detection in Electrical Resistivity Surveys. Appl. Sci. 2023, 13, 6250. [Google Scholar] [CrossRef]
  84. Hasan, M.; Shang, Y.; Meng, H.; Shao, P.; Yi, X. Application of electrical resistivity tomography (ERT) for rock mass quality evaluation. Sci. Rep. 2021, 11, 23683. [Google Scholar] [CrossRef] [PubMed]
  85. Rashetnia, R.; Smyl, D.; Hallaji, M.; Seppänen, A.; Pour-Ghaz, M. Structural health monitoring using electrical resistance tomography based sensing skin: Detecting damage, corrosive elements, and temperature change. In 9th International Conference on Inverse Problems in Engineering (ICIPE): Papers; University of Waterloo: Waterloo, ON, Canada, 2017. [Google Scholar]
  86. Tallman, T.N.; Smyl, D.J. Structural health and condition monitoring via electrical impedance tomography in self-sensing materials: A review. Smart Mater. Struct. 2020, 29, 123001. [Google Scholar] [CrossRef]
  87. Serlenga, V.; Gallipoli, M.R.; Ditommaso, R.; Ponzo, C.F.; Tragni, N.; Perrone, A.; Stabile, T.A.; Calamita, G.; Vignola, L.; Carso, R.F. An integrated approach for structural behavior characterization of the Gravina Bridge (Matera, Southern Italy). Struct. Health Monit. 2021, 20, 3371–3391. [Google Scholar] [CrossRef]
Figure 1. Examples of reconstructed images using various inverse schemes: (a) GN scheme with Tikhonov prior, (b) GN scheme with Laplace prior, and (c) TV scheme reconstruction [29].
Buildings 14 02654 g001
Figure 2. Images of ERT and EIT commercial equipment: (a) Supersting R8 (ERT), (b) Syscal r1 (ERT), and (c) Sciospec EIT.
Buildings 14 02654 g002
Figure 3. Schematic procedures of ERT current injection methods in two-dimensional illustrations: representative measurement protocols for (a) adjacent current injection and (b) opposite current injection.
Buildings 14 02654 g003
Figure 4. Example of single-sided ERT: (a) appearance of the sample under ERT measurement and (b) ERT reconstructed image derived from inverse analysis.
Buildings 14 02654 g004
Figure 5. ERT measurements utilizing sensing skin for concrete materials. These images, sourced from [48], have been reorganized with permission. (a) no crack, (b) initiation of the crack, (c) crack development, (d) no crack in ERT image, (e) initiation of the crack in ERT image, and (f) crack development in ERT image.
Buildings 14 02654 g005
Figure 6. Visualizing moisture penetration using the ERT. These images are sourced from [50] and have been rearranged with permission.
Buildings 14 02654 g006
Figure 7. ERT reconstruction results based on the orientation of the rebar: (a) Real specimen with a vertical rebar, (b) ERT reconstruction of the specimen with vertical rebar, (c) Real specimen with a horizontal rebar, (d) ERT reconstruction of the specimen with horizontal rebar.
Buildings 14 02654 g007
Disclaimer/Publisher’s Note: The statements, opinions and data contained in all publications are solely those of the individual author(s) and contributor(s) and not of MDPI and/or the editor(s). MDPI and/or the editor(s) disclaim responsibility for any injury to people or property resulting from any ideas, methods, instructions or products referred to in the content.

