Abstract
In recent years, the use of machine learning has been expanded to several fields, with promising advances in structural engineering applications. Deep neural network models have been implemented to predict the structural response of systems under conventional loading. Some of those neural network models are based on datasets containing images, test data, and/or data produced by using finite element models developed for a specific environment. While the accuracy of these models relies on the size and quality of the dataset, their use for blast analysis is rather limited, as publicly available data are scarce or restricted. Reinforced concrete (RC) walls or slabs under blast loading are commonly evaluated for flexural and shear behaviour, for which performance guidelines are widely available. While such response mechanisms are typically associated with the far-field range, the target response is controlled by local failure modes when blast loads are generated by contact or near-contact detonations. This paper introduces the implementation of a neural network model for the response prediction of RC walls subjected to contact and near-contact explosions. The model predicts the damage category (i.e., no damage, spall, and breach) associated with a given explosion scenario. The model is trained using experimental data from multiple test programmes available in open-source literature. It considers several parameters associated with the explosive charge (e.g., type, geometry, charge weight, and standoff) and RC target (e.g., material properties, geometry, and reinforcement). The model is able to accurately predict 81% of the total breached specimens, 66% of the total spalled specimens, and 71% of the full set of non-damaged specimens, with an overall accuracy of 72%, with precision and recall ranging from 60 to 76% and 66 to 81%, respectively. The current model is shown to be a significantly better predictor of the damage category than the semi-empirical approach outlined in UFC 3-340-02, making it a promising tool that can be improved with the inclusion of more experimental data.
Keywords:
blast loading; contact detonation; RC wall; breach; spall; machine learning; deep neural network 1. Introduction
Reinforced concrete (RC) slabs or walls are commonly used structural components in modern engineering structures. Due to an increasing number of terrorist threats but also due to military and firefighting operations, such structures might be subjected to intentional or accidental explosions. When high explosives (HEs) are detonated at a very small standoff distance or in direct contact with these structures, very localised damage, such as breach and spall, may occur due to the sudden release of a large amount of energy, which can lead to a significant loss in the structural loading capacity and further initiate collapse. Moreover, high-speed concrete debris can lead to unforeseen casualties and property loss.
While far-field explosions tend to generate a uniform load distribution on the target, contact and near-contact detonations generate an extremely intense and highly non-uniform load distribution, generally difficult to accurately estimate. Rather than inducing a global response on the target, it might cause local damage before the overall response of the structural element starts. Such localised damage is highly dependent on the charge, target strength, and interaction between the charge and target. Several damage classifications have been proposed, with the most accepted being referred to as (i) no damage, (ii) scabbing, (iii) spalling, and (iv) breaching [1,2,3].
The performance of RC targets under such a loading scenario has been extensively investigated over the last past decades [4,5,6,7,8,9,10,11]. While the target response depends mainly on the concrete strength, explosive material, and standoff distance, several other variables have been found to play an important role in the target performance. Morishita [4] conducted an experimental testing programme on the effect of multiple detonations on RC panels under contact charges. The authors found that the extent of breaching damage was greater influenced by the number of consecutive explosions than the total charge weight used for the detonations. In an additional study, Morishita [5] studied the effect of soil cover between an explosive charge and RC panels. It was found that the soil cover had a significant effect on mitigating the blast damage on the panels, serving as a shock absorber, reducing the overall damage extent. A new method to predict the panel performance was proposed using the McVay approach [2] and the test results. More recently, Ichino [10] performed a series of experiments to investigate the effect of different aggregate sizes on the performance of RC panels under contact detonations. The authors reported that the maximum coarse aggregate diameter plays a critical role on the panel’s damage extent.
Aiming to investigate the influence of short fibres on the concrete mix, Foglar [7] conducted an experimental programme, where concrete targets were subjected to contact detonations. Although different type of fibres were used, such as low ductility steel and polypropylene fibres, the authors reported that the spalling performance of the specimens was minimally affected by their use. In a similar study, Yao [11] investigated the blast-resistant characteristics of hybrid fibre-reinforced concrete (HFRC) panels due to contact detonations, with testing specimens containing different types of fibres, such as polypropylene, polyvinyl alcohol and steel fibres. The authors reported that no significant improvements were observed in the damage pattern when comparing to conventional RC panels. Contrarily, Nam [8] carried out a series of experiments on Fibre-Reinforced Cementitious Composite (FRCC) panels, containing five different types of fibre mixture, under the explosion of contact charges. Test results showed that cracks on the protected side were partially controlled when comparing to conventional RC panels.
In addition to experimental studies, several analytical and semi-empirical formulations to predict the target performance have been presented. Generally, these formulations evaluate performance by identifying thresholds through a combination of physical principles and curve fitting [3,12,13,14]. Basler and Partner [12] introduced a semi-empirical threshold limit for the following categories: minor damage, spalling and perforation. They developed charts for bare and cased charge conditions. McVay [2] presented semi-empirical threshold limits for the following categories: breach, spalling and no damage. Limitations on the predictions were highlighted for conditions with large- and small-scale detonations. Marchand [13] presented a semi-empirical threshold limit accounting for the effects of dynamic strain rate in both concrete and reinforcement. Such threshold limits were adopted and are still currently used by Unified Facilities Criteria “Structures to Resist the Effects of Accidental Explosions” (UFC 3-340-02) [3]. After this, the authors provided an updated approach to identify the threshold limits, accounting for impulse effect on the target performance. This approach included a semi-empirical limit based on 475 available tests and theoretical principles [15]. Although such semi-empirical methods have been widely used, they require extensive experimental work and can provide inaccurate results when the number of independent variables is large and the physical interactions between them are complex. As such, it is important to have robust and reliable predictive models based on existing input and output data to drive down the cost of conducting further experiments at early stages.
With the recent advancements in machine learning (ML), regression algorithms (e.g., Support Vector Machine (SVM), decision trees, random forest, and neural networks) and classification prediction algorithms (e.g., AdaBoost, naïve Bayes, and neural networks) have been employed in many applications [16,17,18,19]. Additionally, deep neural network (DNN) modelling has become a powerful approach to deal with highly complex situations. While SVM and DNN are the most efficient methods for highly non-linear complex situations, the DNN methodology can incorporate several parameters that are traditionally not taken into account by available semi-empirical methods, which is specially useful in the context of predicting concrete performance due to contact detonations. This paper uses the DNN modelling approach to predict the performance of RC targets under contact and near-contact charges. The model predicts the damage category (i.e., no damage, spall and breach) as schematically shown in Figure 1, and is developed based on an expanded dataset of experimental data from multiple test programmes available in the open-source literature. It considers charge properties (e.g., burst type, geometry, and weight), wall target (e.g., material properties, geometry, and reinforcement) and the proximity between the target and charge. Since scabbing phenomena occur in the early stages of the target response, this study considers scabbing to belong to the no-damage prediction category.

Figure 1.
RC target performance categories under contact/near-contact charges: (a) no damage, (b) spall and (c) breach.
2. Data Collection and Description
The quality and quantity of training data points play a key role in developing a deep neural network. The dataset used in this paper was compiled by Marchand et al. into a technical report published by the United States Air Force Research Laboratory (AFRL-MN-EG-TR-1998-7032) [15], which includes data points from multiple research studies investigating the behaviour of RC walls subjected to contact and near-contact detonations. For the purpose of this work, this dataset was expanded to include additional data points from several other studies [1,14,20,21,22,23,24,25,26,27,28,29,30,31,32]. Overall, the raw dataset includes 554 data points and features multiple input variables, such as burst type, charge weight, charge shape, charge placement, and fibre content on concrete mix, accounting for three output variables correlated with the target damage assessment. The raw database only includes bare charges, and every data point collected consists of all ten features without any missing information, with every data point being unique to the dataset. To identify how the selected database compares against established semi-empirical approaches for performance prediction, the reported performance of each data point in the dataset is displayed against the spall and breach threshold limits provided in UFC 3-340-02 [3]. For an efficient comparison, the dataset is processed to calculate the spall parameter , identified as
for non-contact bare charges and
for contact charges, where R is the distance from the target to the centre of the charge, is the concrete compressive strength, and is the adjusted charge mass, calculated by
with as a burst configuration factor, W as the equivalent TNT charge weight, and as the charge shape factor. Such a comparison is shown Figure 2. From the data, it can be seen that not only are some data points outside the range of applicability defined in UFC 3-340-02 [3] but also some of the points fall outside the corresponding semi-empirical prediction interval. More interestingly, it is clear that many data points fall on the non-conservative side (i.e., experimental points with reported associated damage to be more extensive than the corresponding prediction), especially for experimental points with a calculated spall parameter . Such observations emphasise the need to investigate the feasibility of alternate methodologies, such as DNN models, in suppressing the limited range of applicability of semi-empirical methods, while avoiding further experimental testing.
Figure 2.
Comparison between the compiled dataset and the threshold spall and breach curves described in UFC 3-340-02 [3].
3. Model Development
The DNN model presented in this work was developed, including the training and testing, validation, and performance measures, using TensorFlow and the Keras Sequential Model, an open-source neural network library written in Python [33].
3.1. Analysis of Dataset
The quality of training data has a huge impact on the efficiency, accuracy, and complexity of DNN models. Compiled raw datasets may contain data points from selected features that are physically not relevant for the studied problem. In the particular dataset presented above, several data points were found to be characterised by a scaled distance , which lies out of the design range considered for contact and close-in detonations, according to UFC 3-340-02 [3]. As such, all data points with an associated scaled distance were removed from the dataset. Raw data also include data points that are significantly different from the rest of the data, the so-called outliers. Ideally, data points should be statistically relevant to the output data that a model intends to predict. Therefore, it is important to properly filter the dataset to ensure that the observations best represent the physical problem. Generally, outliers should be carefully hand-picked to ensure the best expected performance, but this process is generally time-consuming, particularly when analysing large sets of data. A commonly used approach to detect and remove outliers is the Inter-Quartile Range (IQR) score, which is a measure of statistical dispersion, defined as
where Q3 and Q1 are the 75th and the 25th percentiles of the data, respectively. The IQR score is used to define lower and upper bounds, where any data point lying outside this range is considered an outlier and, consequently, removed from the dataset. This decision range is given by
where k is the scale factor. In this case, the scale factor is taken as , as it represents the factor that induces the filtered data to be within the range of three standard deviations () from the mean in an equivalent Gaussian distribution, thereby likely avoiding the deletion of pertinent data. Given the characteristics of the dataset, a filter is only applied on the upper bound of the data distribution. Table 1 lists the count, range/categories, average and standard deviation of each input feature after filtering, while Figure 3 depicts the distributions of the continuous features. With a data range between two extreme bounds, performance prediction using the current dataset would lead to a more accurate result, where data are more abundant within those bounds (i.e., high density).

Table 1.
Statistics summary of the dataset used in the training process.
Figure 3.
Frequency distribution (number of appearances) of input features from the filtered dataset (498 data points): (a) standoff distance, (b) charge weight, (c) charge length, (d) diameter, (e) target thickness, (f) concrete compressive strength, and (g) reinforcement ratio.
Additionally, the relevance of each input parameter is evaluated by means of a comprehensive statistical analysis using the Pearson Correlation Coefficient (r). It expresses the strength of the relationship between two variables and is defined as
where n is the sample size, and X and Y are the two variables to be correlated. Positive correlation occurs when two variables evolve in the same direction (i.e., one variable increases/decreases its value with the other), while negative correlation represents an opposite evolution of two variables. The smaller the absolute value of this coefficient, the lower the dependency observed between two specific variables. As a rule of thumb, it is accepted that a coefficient ranging from 0.7 to 1.0 (−0.70 to −1.0) indicates high correlation between variables, moderate correlation from 0.5 to 0.7 (−0.5 to −0.7), low correlation from 0.3 to 0.5 (−0.3 to −0.5), and negligible correlation from 0.0 to 0.3 (0.0 to −0.3) [34]. Figure 4 shows the correlation coefficients for the interaction of all input features. As expected, input features that are physically not correlated present very small correlation factors (e.g., concrete compressive strength and charge weight), while features that are known to influence each other present larger coefficients [35]. It should be noted that although the input parameters are assumed to be independent variables for the purpose of modelling, some variables are intrinsically related (e.g., charge weight and charge diameter). An ideal condition would require calculating the network connectivity with corresponding weights.
Figure 4.
Correlation matrix of features in the dataset.
A similar relationship between input–output variables can be obtained by performing a one-way analysis of variance (ANOVA). This identifies the relevance of each input feature to the performance of the targets by using the F-statistic and p-value as the relevance metrics. The p-value ranges from 0 to 1 and estimates the probability of failing to reject the null hypothesis. As such, the smaller the p-value, the smaller the probability. On the other hand, the F-statistic reflects the implication of the regression coefficient. The higher this value and the smaller the value of p, the more statistical significance the corresponding input feature has to the correlated output. In this work, a confidence interval of the ANOVA is set to 95% (p-value < 0.05) to reject the null hypothesis. Thus, input features with a calculated p-value less than 0.05 are considered substantial [36]. The calculated F-statistic and p-value for every input feature are listed in Table 2. From the data, it is visible that while all features included in the dataset are considered relevant in determining the output data, features with higher relevance include the charge shape, target thickness, concrete compressive strength, and charge diameter. Interestingly, the standoff distance is considered the least relevant in this list of features, most probably due to the limited range included in the database. Following these results, all features are considered in the training process of the neural network model.
Table 2.
Results of the one-way analysis of variance.
In addition to data cleansing, a normalisation technique is applied to all input features in the dataset. It seeks to make different samples seen by a neural network model more similar to each other, which helps the model in generalising well to new data [16]. The most common form of data normalisation involves centring the data around zero, through the z-score method, as calculated by
where Y denotes the normalised data and X, , and indicate the original data, their average, and their standard deviation, respectively.
3.2. Network Architecture
The behaviour of a neural network model is controlled by a set of constants, referred to as structural hyperparameters, such as neurons per hidden layer, number of hidden layers, and learning rate. Hyperparameters are adjustable parameters that let you control the training process and heavily affect the model performance. Although several approaches to determining the number of hidden layers and neurons per hidden layer have been used, no general guideline has been formulated [37,38]. As such, the number of neurons and hidden layers were optimised by the improvement (tendency) in the accuracy of prediction through an independent two-step process. The initial number of neurons per hidden layer was set to be 512, and the number of hidden layers was systematically increased from one to ten. For every iteration, the accuracy of prediction was registered for up to 500 epochs. Similarly, the optimisation of the number of neurons per hidden layer was performed by setting each hidden layer to have 64 initial neurons with a subsequent two-fold at each iteration. For every iteration, the model was trained on a 80/20 training/validation split subset. The division of the entire dataset into the training set and test set was randomly carried out, and the performance of the model on the test set was an indication of the performance of the model on the unknown data.
Throughout the training process, the neural network receives input data and generates output predictions, which are subsequently evaluated against the real target values. The dissimilarity between the projected output and the true target value is referred to as the loss or cost function. To find the optimal set of parameters that minimises this function, the Adaptive Moment Estimation (Adam) optimisation algorithm was implemented to efficiently search for the optimal set of parameters, such as learning rate, momentum, decay rates, and batch sizes [39]. These parameters determine how the algorithm updates the weights and biases of the neural network during training.
To prevent overfitting, which occurs when a neural network performs well on training data but is unable to generalise and perform accurately on unseen data, weight regularisation was implemented using the L2 regularisation method [40]. This method adds penalty factors to the network layers to alter the weight propagation through the layers, facilitating the model to converge optimally. Finally, the number of neurons on the last hidden layers was also analysed and reduced across the network, with a dropout rate of 25%.
Overall, the input layer contains the features listed in Table 1, while the output layer is based on the performance categories (no damage, spall, and breach). The model predicts the probability of each performance category, selecting the one with the highest probability of occurrence as the assumed output performance. Table 3 shows an example of the output category selection process for random data points from the testing dataset. Figure 5 depicts the variation in prediction accuracy (for training and validation subsets) for an increasing number of hidden layers and neurons at the last epoch. To achieve a stable level of accuracy on the predicted data, the final neural network model was set to be built with seven hidden layers and 512 neurons per layer. The architecture of the DNN model is shown in Figure 6. The tuned parameters are listed in Table 4.
Table 3.
Output category selection process for representative data points from the testing dataset.
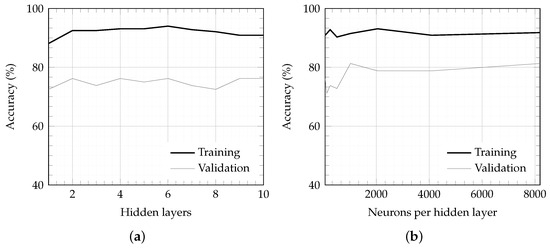
Figure 5.
Evolution of prediction accuracy with increasing (a) number of layers (with 256 neurons per layer) and (b) number of neurons per layer (for a total of 7 layers).
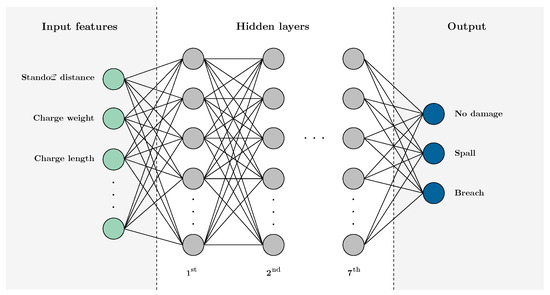
Figure 6.
DNN model architecture.
Table 4.
Tuned hyperparameters for the developed neural network.
4. Results and Discussion
The final DNN model was evaluated using testing data, randomly selected at the time of training, and corresponding to 20% of the full dataset presented in Section 3.1. The testing subset was not used for training purposes. Predicted outputs are compared with actual tested data in Figure 7. From the results, it can be seen that the model was able to accurately predict 81% of the total breached specimens, 66% of the total spalled specimens, and 71% of the full set of non-damaged specimens.
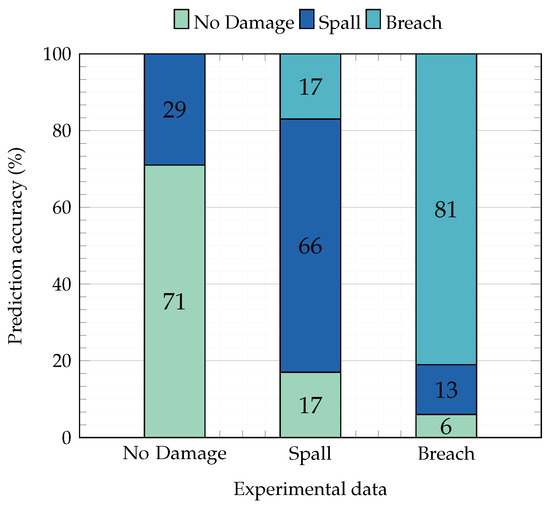
Figure 7.
Accuracy prediction for each output category and comparison with testing data.
Label NoDamage Spall Breach No Damage 71.0 29 0 Spall 17 66.0 17 Breach 6 13 81
4.1. Performance Metrics
The performance of a neural network model can be assessed using a confusion matrix, also referred to as an error matrix. It is a structured arrangement of information that is commonly utilised to assess the accuracy and effectiveness of classification models, which aim to predict categorical labels for individual input instances. Figure 8 shows the confusion matrix for the multi-class classification set presented above. Each element in the confusion matrix is equal to the number of observations known to be in damage category i, but the predicted damage category j. As such, elements along the main diagonal correspond to the damage categories that were accurately classified by the machine learning algorithm, while elements outside the main diagonal represent the damage categories that were incorrectly predicted.
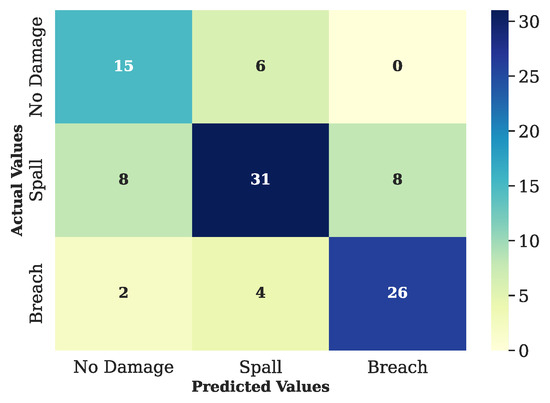
Figure 8.
Confusion matrix summarising the model performance for a total of 100 observations, corresponding to the testing subset.
Using this method, important metrics on the model’s performance can be established, such as accuracy, precision, recall and F1-scores. For that, predicted results need to be broken down into individual 2 × 2 binary matrices displaying the number of true positives (TP), true negatives (TN), false positives (FP), and false negatives (FN) produced by the model on the test data, for each of the three different damage categories so that individual performance metrics can be calculated. As such, accuracy refers the proportion of correct predictions in the confusion matrix out of all predictions. For multi-class problems, accuracy is defined as
where n is the number of samples, and are the true and predicted output labels of the given sample, respectively, and [[…]] is the Iverson bracket which returns 1 when the expression within it is true, and 0 otherwise. Similarly, precision is the proportion of correct predictions in the confusion matrix out of all positive predictions, given by
while recall measures the proportion of correct predictions in the confusion matrix out of all positive classes, established as
Even though precision and recall data are very useful to understand the performance of a specific algorithm, they offer a trade-off, as one comes at the cost of another. While higher precision scores are obtained when false positives are minimised, higher recall can be associated with a lax critic that permits any sample that is likely to be a positive class to be accepted. This, however, can lead to the incorrect classification of borderline negative samples as “positive”, which subsequently reduces the precision. As such, the F1-score combines precision and recall using their harmonic mean, and maximising the F1-score implies simultaneously maximising both precision and recall. Thus, the F1-score becomes a useful metric in evaluating learning models in conjunction with accuracy, defined by
Table 5 lists the calculated metrics based on the approach described above. As can be seen, the model achieves an overall accuracy of 72%. While this is a promising result for such a complex model, it disregards class balance and the cost of different errors, as it treats all classes as equally important and looks at all correct predictions. However, as in most real-world applications, the current database is not perfectly balanced, which means that there is not a uniform distribution of experimental damage predictions. As such, the precision and recall of individual classification classes are analysed. Ultimately, the choice of metric depends on the particular task and the trade-off between different types of errors. In the context of RC damage prediction, due to contact or near-contact detonations, it is preferred that accuracy and other metrics are higher for more severe damage categories to tend towards conservative predictions. As such, the increase in model F1-score going from no damage to breach is a favourable trend.
Table 5.
Performance metrics of the DNN model.
4.2. Comparison with Semi-Empirical Equations
While several semi-empirical equations have been proposed to estimate the damage extension of concrete targets under contact and near-contact detonations [3,12,13,14], the accuracy of these equations is usually judged on the agreement with very limited experimental data, on which they are based. The most accepted and widely used approach is available in UFC 3–340-02 [3], and described in Section 2.
For the purpose of verifying how the prediction of the DNN model presented in this paper compares with the results of the approach proposed in UFC 3–340-02 [3], a thorough comparison on the basis of a unique set of experimental data was performed. For that reason, the dataset presented in Section 3.1 and used for the DNN development was additionally filtered to remove all data points associated with input features not accounted for in UFC 3–340-02 [3] approach. This resulted in a final dataset composed of 463 data points, which was processed by both the DNN and the semi-empirical approach. Damage predictions from both methods are presented in Figure 9a–c for the experimental subsets of No Damage, Spall and Breach labelled specimens, respectively. Results show that the predictions of the DNN model are significantly more accurate than the semi-empirical equations. The accuracy of the DNN model ranges from 79 to 92%, while the accuracy of the semi-empirical approach ranges from 52 to 65% for a given damage level.
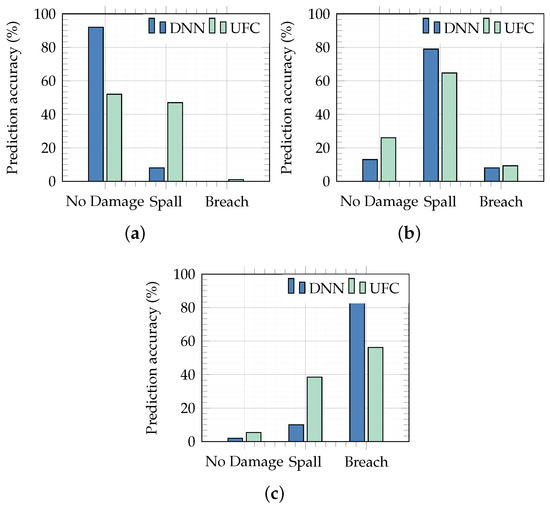
Figure 9.
Damage predictions from the DNN model and the approach described in UFC 3–340-02 [3] regarding the experimental subset labelled as (a) no damage, (b) spall, and (c) breach.
Figure 10a shows the confusion matrix for the multi-class classification set obtained by using the DNN model, while Figure 10b shows a similar approach for the results obtained by using the semi-empirical equations. From these figures, performance metrics are obtained and listed in Table 6.
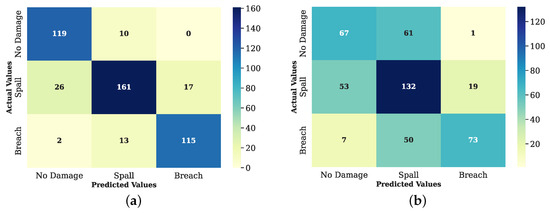
Figure 10.
Confusion matrices for the performance of (a) the DNN model and (b) semi-empirical equations.
Table 6.
Comparison of performance metrics for the DNN model and semi-empirical approach.
Overall, it is clear that the DNN model performs significantly better than the semi-empirical equations, especially when comparing No Damage and Spall true positive predictions. Additionally, the F1-score for the DNN model is consistently high for all damage categories.
5. Conclusions
The performance prediction of RC wall/slabs subjected to contact or near-contact detonations is typically conducted using a few available empirical and semi-empirical methods. However, such methodologies have limited range of applicability, and their predictions are sometimes not accurate, mostly due to the highly complex interaction between input features and physical phenomena. Given this complexity, DNN modelling becomes an excellent candidate for performance prediction.
This paper introduces a deep neural network (DNN) model to predict the performance of RC targets subjected to contact and near-contact explosive charges. A processed dataset of 498 data points, compiled from publicly available data from experimental testing, was used for the training process of the algorithm. The model includes ten input features, such as burst type, charge weight, charge shape and fibre content on concrete mix, and three categorical output predictions of target performance. Based on the previous sections, the following summation points and conclusions can be drawn:
- Data cleansing was conducted based on physical considerations, such as scaled distance, and through outlier detection approaches, such as the Inter-Quartile Range methodology. This resulted in the removal of 56 data points from the raw dataset.
- Input feature selection was conducted based on a comprehensive statistical analysis using the Pearson Correlations Coefficient and analysis of variance (ANOVA). From the analysis, it was observed that all input features considered were statistically significant, being located within a confidence interval of 95% (p-values < 0.05).
- The model is able to accurately predict 81% of the total breached specimens, 66% of the total spalled specimens, and 71% of the full set of non-damaged specimens.
- The DNN model shows an overall accuracy of 72%, while precision and recall range from 60 to 76% and 66 to 81%, respectively.
- The F1-score ranges from 65 to 79%, increasing going from no damage to breach. This is particularly relevant in the context of blast damage since conservative predictions are generally the preferred outcome when dealing with false predictions.
- Comparison with semi-empirical approaches, such as the one described in UFC 3-340-02, indicates a significantly better performance of the DNN model, with accuracy ranging from 79 to 92%, whereas the accuracy of the semi-empirical approach ranges from 52 to 65% for a reduced dataset.
- Overall, the neural network approach is a promising tool to be used for the damage prediction of RC targets under contact and near-contact detonations. While the current model has proven to be more efficient than historical semi-empirical approaches, its full potential can be unlocked if additional experimental data points become available to be used in the training process.
Author Contributions
Methodology, D.H., R.M. and A.M.; Validation, D.H., R.M. and J.F.; Formal analysis, D.H. and R.M.; Investigation, D.H.; Resources, R.M.; Data curation, D.H., R.M. and J.F.; Writing—review & editing, D.H., R.M., A.M. and J.F. All authors have read and agreed to the published version of the manuscript.
Funding
This research received no external funding.
Data Availability Statement
Data is contained within the article.
Conflicts of Interest
Authors David Holgado, Rodrigo Mourão, Arturo Montalva and Jason Florek were employed by the company Stone Security Engineering, P.C.
Abbreviations
The following abbreviations are used in this manuscript:
| ML | Machine Learning |
| DNN | Deep Neural Network |
| NN | Neural Network |
| RC | Reinforced Concrete |
| ANOVA | Analysis of Variance |
References
- Lönnqvist, L. The Effects of High Explosives in Contact with Reinforced Concrete Slabs. In Proceedings of the Sixth International Symposium on Interaction of Nonnuclear Munitions with Structures (6th), Panama City Beach, FL, USA, 3–7 May 1993. [Google Scholar]
- McVay, M. Spall Damage Of Concrete Structures; Technical Report SL-88-22; US EWES Structures Laboratory: Vicksburg, MS, USA, 1988. [Google Scholar]
- UNIFIED FACILITIES CRITERIA (UFC). Structures to Resist the Effects of Accidental Explosions; Technical Report UFC 3-340-02; US Department of Defense: Washington, DC, USA, 2008. [Google Scholar]
- Morishita, M.; Tanaka, H. Effects of Multiple Detonations on the Damage of Reinforced Concrete Slabs. Struct. Eng. Eng. 2004, 2004, 317–322. [Google Scholar] [CrossRef]
- Morishita, M.; Asonuma, T.; Kuriki, S.; Takemoto, K.; Saito, K.; Matsuo, K. Damage of Reinforced Concrete Slabs Subjected to Standoff Detonations and Effects of Cover Soil as a Shock Absorber. J. Struct. Earthq. Eng. 2006, 62, 865–876. [Google Scholar] [CrossRef]
- Beppu, M.; Ohno, T.; Ohkubo, K.; Li, B.; Satoh, K. Contact Explosion Resistance of Concrete Plates Externally Strengthened with FRP Laminates. Int. J. Prot. Struct. 2010, 1, 257–270. [Google Scholar] [CrossRef]
- Foglar, M.; Hajek, R.; Kovar, M.; Štoller, J. Blast Performance of RC Panels with Waste Steel Fibers. Constr. Build. Mater. 2015, 94, 536–546. [Google Scholar] [CrossRef]
- Nam, J.; Kim, H.; Kim, G. Experimental Investigation on the Blast Resistance of Fiber-Reinforced Cementitious Composite Panels Subjected to Contact Explosions. Int. J. Concr. Struct. Mater. 2017, 11, 29–43. [Google Scholar] [CrossRef]
- Hajek, R.; Fladr, J.; Pachman, J.; Stoller, J.; Foglar, M. An Experimental Evaluation of the Blast Resistance of Heterogeneous Concrete-Based Composite Bridge Decks. Eng. Struct. 2019, 179, 204–210. [Google Scholar] [CrossRef]
- Ichino, H.; Beppu, M.; Williamson, E.B. Blast-Resistant Performance of a Two-Stage Concrete Plate Subjected to Contact Explosions. Constr. Build. Mater. 2020, 259, 119766. [Google Scholar] [CrossRef]
- Yao, W.; Sun, W.; Shi, Z.; Chen, B.; Chen, L.; Feng, J. Blast-Resistant Performance of Hybrid Fiber-Reinforced Concrete (HFRC) Panels Subjected to Contact Detonation. Appl. Sci. 2019, 10, 241. [Google Scholar] [CrossRef]
- Local Damage Effects on Concrete Slabs by Explosive Charges. Technical Report 3113.10-2; Ernst Basler and Partner, 1982.
- Marchand, K.; Woodson, S.; Knight, T. Revisiting Concrete Spall and Breach Prediction Curves: Strain Rate. (Scale Effect) and Impulse (Pulse Length and Charge Shape) Considerations; Technical Report; Department of the Army, Corps of Engineers: Vicksburg, MS, USA, 1994. [Google Scholar]
- Remennikov, A.M.; Youssef, J.; Ngo, T.D.; Mentus, I. Breach Diameter Analysis of Concrete Panels Subjected to Contact Charge Detonations. Int. J. Impact Eng. 2018, 120, 95–109. [Google Scholar] [CrossRef]
- Marchand, K. Concrete Hard Target Spall and Breach Model; Technical Report AFRL-MN-EG-TR-1998-7032; Air Force Research Laboratory: San Antonio, TX, USA, 1998. [Google Scholar]
- Chollet, F. Deep Learning with Python, 2nd ed.; Manning Publications: Shelter Island, NY, USA, 2021. [Google Scholar]
- Awad, M.; Khanna, R. Efficient Learning Machines: Theories, Concepts, and Applications for Engineers and System Designers; Apress: Berkeley, CA, USA, 2015. [Google Scholar] [CrossRef]
- Feng, W.; Wang, Y.; Sun, J.; Tang, Y.; Wu, D.; Jiang, Z.; Wang, J.; Wang, X. Prediction of thermo-mechanical properties of rubber-modified recycled aggregate concrete. Constr. Build. Mater. 2022, 318, 125970. [Google Scholar] [CrossRef]
- Tang, Y.; Feng, W.; Chen, Z.; Nong, Y.; Yao, M.; Liu, J. Experimental and Theoretical Investigation on the Thermo-Mechanical Properties of Recycled Aggregate Concrete Containing Recycled Rubber. Front. Mater. 2021, 8, 123832. [Google Scholar] [CrossRef]
- Jonasson, T. Contact Charges 1—The Effects of High Explosive Charges in Close Contact with Reinforced Concrete Slabs. Technical Report C20809-2.6; FOA, 1990. [Google Scholar]
- Cavelti, B. Concrete Slabs Subjected to Blast Loads. In Proceedings of the 16th International Symposium for the Interaction of Munitions with Structures, Sandestin, FL, USA, 9–13 November 2015. [Google Scholar]
- Li, J.; Wu, C.; Hao, H. An Experimental and Numerical Study of Reinforced Ultra-High Performance Concrete Slabs under Blast Loads. Mater. Des. 2015, 82, 64–76. [Google Scholar] [CrossRef]
- Li, J.; Wu, C.; Hao, H. Spallation of Reinforced Concrete Slabs under Contact Explosion. In Proceedings of the 2016 Second Asian Conference on Defence Technology (ACDT), Chiang Mai, Thailand, 21–23 January 2016; pp. 42–45. [Google Scholar] [CrossRef]
- Li, Z.; Liu, Y.; Yan, J.b.; Yu, W.l.; Huang, F.l. Experimental Investigation of P-Section Concrete Beams under Contact Explosion and Close-in Explosion Conditions. Def. Technol. 2018, 14, 540–549. [Google Scholar] [CrossRef]
- Foglar, M.; Kovar, M. Spalling of Concrete Subjected to Blast Loading. MATEC Web Conf. 2013, 6, 07005. [Google Scholar] [CrossRef]
- Foglar, M.; Hajek, R.; Fladr, J.; Pachman, J.; Stoller, J. Full-Scale Experimental Testing of the Blast Resistance of HPFRC and UHPFRC Bridge Decks. Constr. Build. Mater. 2017, 145, 588–601. [Google Scholar] [CrossRef]
- Yamaguchi, M.; Murakami, K.; Takeda, K.; Mitsui, Y. Blast Resistance of Polyethylene Fiber Reinforced Concrete to Contact Detonation. ACT 2011, 9, 63–71. [Google Scholar] [CrossRef]
- Dua, A.; Braimah, A. Assessment of Reinforced Concrete Slab Response to Contact Explosion Effects. J. Perform. Constr. Facil. 2020, 34, 04020061. [Google Scholar] [CrossRef]
- Morishita, M.; Tanaka, H.; Ando, T.; Hagiya, H. Effects of Concrete Strength and Reinforcing Clear Distance on the Damage of Reinforced Concrete Slabs Subjected to Contact Detonations. Concr. Res. Technol. 2004, 15, 89–98. [Google Scholar] [CrossRef]
- Grisaro, H.Y.; Turygan, S.; Sielicki, P.W. Concrete Slab Damage and Hazard from Close-In Detonation of Weaponized Commercial Unmanned Aerial Vehicles. J. Struct. Eng. 2021, 147, 04021190. [Google Scholar] [CrossRef]
- Grisaro, H.Y.; Benamou, D.; Mitelman, A. Field Tests of Fiber Reinforced Concrete Slabs Subjected to Close-in and Contact Detonations of High Explosives. Int. J. Impact Eng. 2022, 162, 104136. [Google Scholar] [CrossRef]
- Yang, D.; Zhang, B.; Liu, G. Experimental Study on Spall Resistance of Steel-Fiber Reinforced Concrete Slab Subjected to Explosion. Int. J. Concr. Struct. Mater. 2021, 15, 23. [Google Scholar] [CrossRef]
- Abadi, M.; Agarwal, A.; Barham, P.; Brevdo, E.; Chen, Z.; Citro, C.; Corrado, G.S.; Davis, A.; Dean, J.; Devin, M.; et al. TensorFlow: Large-Scale Machine Learning on Heterogeneous Distributed Systems. arXiv 2015, arXiv:1603.04467. [Google Scholar] [CrossRef]
- Mukaka, M.M. Statistics Corner: A Guide to Appropriate Use of Correlation Coefficient in Medical Research. Malawi Med. J. 2012, 24, 69–71. [Google Scholar]
- Kaushik, V.; Singh, D.; Kumar, M. Effects of Fibers on Compressive Strength of Concrete. Mater. Today Proc. 2023, 80, 3281–3285. [Google Scholar] [CrossRef]
- Dahiru, T. P-Value, a True Test of Statistical Significance? A Cautionary Note. Ann. Ib. Postgrad. Med. 2011, 6, 21–26. [Google Scholar] [CrossRef] [PubMed]
- Liu, Y.; Starzyk, J.A.; Zhu, Z. Optimizing Number of Hidden Neurons in Neural Network. In Proceedings of the International Conference on Artificial Intelligence and Applications, Los Angeles, CA, USA, 9–13 July 2007. [Google Scholar]
- Karsoliya, S. Approximating Number of Hidden Layer Neurons in Multiple Hidden Layer BPNN Architecture. Int. J. Eng. Trends Technol. 2012, 3, 714–717. [Google Scholar]
- Kingma, D.P.; Ba, J. Adam: A Method for Stochastic Optimization. arXiv 2017, arXiv:1412.6980. [Google Scholar] [CrossRef]
- Cortes, C.; Mohri, M.; Rostamizadeh, A. L2 Regularization for Learning Kernels. arXiv 2012, arXiv:1205.2653. [Google Scholar] [CrossRef]
Disclaimer/Publisher’s Note: The statements, opinions and data contained in all publications are solely those of the individual author(s) and contributor(s) and not of MDPI and/or the editor(s). MDPI and/or the editor(s) disclaim responsibility for any injury to people or property resulting from any ideas, methods, instructions or products referred to in the content. |
© 2024 by the authors. Licensee MDPI, Basel, Switzerland. This article is an open access article distributed under the terms and conditions of the Creative Commons Attribution (CC BY) license (https://creativecommons.org/licenses/by/4.0/).