Article

Research on the Pile–Soil Interaction Mechanism of Micropile Groups in Transparent Soil Model Experiments

1
School of Civil Engineering, Dalian University of Technology, Dalian 116024, China
2
Institute of Civil and Architectural Engineering, Tongling University, Tongling 244000, China
3
School of Civil Engineering, Nanjing Tech University, Nanjing 211816, China
*
Author to whom correspondence should be addressed.
Buildings 2024, 14(9), 2753; https://doi.org/10.3390/buildings14092753
Submission received: 27 June 2024 / Revised: 9 August 2024 / Accepted: 22 August 2024 / Published: 2 September 2024
(This article belongs to the Section Building Energy, Physics, Environment, and Systems)

Abstract

:
Micropile groups (MPGs) are typical landslide resistant structures. To investigate the effects of these two factors on the micropile–soil interaction mechanism, seven sets of transparent soil model experiments were conducted on miniature cluster piles. The soil was scanned and photographed, and the particle image velocimetry (PIV) technique was used to obtain the deformation characteristics of the pile and soil during lateral loading. The spatial distribution information of the soil behind the pile was obtained by a 3D reconstruction program. The results showed that a sufficient roughness of the pile surface was a necessary condition for the formation of a soil arch. If the surface of the pile was smooth, stable arch foundation formation was difficult. When the roughness of the pile surface increases, the soil arch range behind the pile and the load-sharing ratio of the pile and soil will increase. After the roughness reaches a certain level, the above indicators hardly change. Pile spacing within the range of 5–7 d (pile diameters) was suitable. The support effect was poor when the pile spacing was too large. No stable soil arch can be formed, and the soil slips out from between the piles.

1. Introduction

A micropile (MP) is a small-diameter pile with a slenderness ratio of 30 [1], initially designed for foundation improvement [2,3]. In recent years, they have often been used as a means of support for small to medium-sized slopes. MPs offer benefits such as a lightweight structure, reduced construction time, minimal slope disturbance, and effective group pile reinforcement [4]. Compared with conventional piles [5,6], MPs excel in emergency slope stabilization and have garnered significant attention [7]. Due to the inherent limitations of single-pile support, MPs are often arranged in groups, complicating the pile–soil interaction mechanisms [8]. As flexible piles, they exhibit considerable displacement under loading, with distinct failure patterns differing from larger piles [9]. The primary failure mode for MPs is bending, contrasting with soil failure criteria. Current understanding of the pile–soil interaction in MPs lags behind practical applications.
Numerous studies have examined the strength characteristics [10,11] of soil arches in larger conventional piles and the pile–soil interaction mechanisms [12]. The study of MPs is mainly performed by numerical simulations and model experiments. The experiments were mainly conducted using traditional measurement methods, for example, earth pressure cells, acceleration sensors, and strain gauges [13]. Displacement gauges were used to measure the displacement of pile tops, pile cap beams and soil displacements. The slopes reinforced by MPGs were studied by using shaking table experiments [14,15,16], centrifuge experiments [17,18], model experiments [19,20] and large-scale in situ experiments [14,21]. These researchers evaluated the reinforcement capacity of MPs under seismic loading, or pile top loading [22], and compared it with that of conventional piles [18]. These studies extensively analyze the force mechanisms, mechanical properties, deformation behaviors, and failure modes of MP-reinforced slopes. However, a substantial gap remains in understanding pile–soil interaction mechanisms and synergistic deformation behaviors in these reinforced slopes.
However, most current computational methods for micropiles (MPs) are based on Ito’s plastic failure theory [23], which considered plastic failure in the surrounding soil as the failure criterion [24]. In addition, the simplified design method of conventional piles or soil nails is used in the design specification of MPs for their calculation [25]. Existing research on MPs mostly focuses on the mechanical characterization of the piles, while the interaction mechanism of piles and soil is relatively lacking in systematicity. As flexible piles with considerable slenderness, MPs undergo significant deformation under load, with the failure criterion being plastic failure [26]. In model experiments, the MP’s diameter is small, and the slope is supported in the form of group piles. Therefore, if traditional intrusive measurement methods are used, dimensional effects can easily influence soil movement and alter the stress distribution [27].
However, transparent soil and PIV techniques [28,29,30], as a non-invasive measurement, can directly observe the displacement of the soil and the structure [31,32], ensuring the accuracy of the group pile experiment results. Previous studies showed that the physical and mechanical properties of transparent soil and real soil have little difference [33], which meets the requirements of geotechnical engineering for the basic properties of experiment materials [34,35,36]. Transparent soil has been used to study the soil arching effect of anti-slide piles [37], slope stability under settlement conditions [38], and the morphology evolution of slope shear bands [39]. In summary, current research has not fully utilized transparent soil, an advanced experimental method, to study the pile–soil interaction mechanism at the microscopic level. The application of transparent soil technology, with its unique visualization advantages, offers the potential to reveal the microscopic behavior at the pile–soil interface, which is unattainable with traditional soil materials.
In this study, the pile–soil interaction mechanism of MPs under lateral load was investigated by using the transparent soil experimental technique. Seven sets of transparent soil physical model experiments have been conducted. First, based on the characteristics of transparent soil and the characteristics of PIV technology, a lateral loading and image acquisition system for transparent soil slopes was established. Then, the impact of pile surface roughness and spacing on soil arching and pile–soil interaction was analyzed. Finally, by writing a 3D reconstruction program, the variation of the soil around the pile along the depth direction was visually observed. The purpose of this study was to investigate the pile–soil interaction mechanism and the macro and micro soil arch effect of MGPs through transparent soil experiments. It provides a basis for the design calculation of MGPs and its application in slope stability.

2. Physical Model Experiments

2.1. Experimental Apparatus

The experimental model system was self-designed, as illustrated in Figure 1. It comprises a loading device (servo motor, loading plate, pressure transducer, Programmable logic Controller), measurement subsystem 1 (laser apparatus, high precision linear guide rail, optical platform frame), measurement subsystem 2 (high speed industrial camera, high precision linear guide rail, image acquisition system), dual-module controller, and acrylic vacuum model case. To accommodate the visibility of the transparent soil, the acrylic vacuum model case was constructed from an acrylic sheet with a wall thickness of 3 cm. Internal dimensions were 40 cm × 29 cm × 35 cm (length × width × height). The side plate of the model case was removed before loading, and the servo motor was controlled to perform loading at a speed of 1 mm/s. A black shade cloth was draped around the model system to create a dark environment, ensuring the capture of clear light spots. A 2000 mW sheet laser was mounted on the high-precision linear guide rail, projecting light onto the soil within the model case. The resolution of the high-speed industrial camera was configured to 3000 × 4000 pixels and was fixed to a high-precision linear guide rail positioned at the top of the model box. Both sets of high-precision linear guide rails operate in unison to synchronize the movement of the two measurement subsystems, thereby facilitating “CT” scanning of the slope model at consistent intervals.

2.2. Model Piles

The MP models used in the experiments are shown in Figure 2. Hollow aluminum tube made of 6063, with a length of 300 mm, an outer diameter of 10 mm, and a wall thickness of 0.25 mm, were utilized as MPs. The elastic modulus of the pile was 6.9 × 10⁴ MPa, and it was secured at the bottom with a stabilizing steel plate.
As shown in Figure 2a–d, a total of four kinds of roughness were used on the surface of the pile, and four kinds of fused silica sand with different particle sizes were pasted on the surface of the pile with epoxy resin. The particle sizes ranged from 0.1–0.2 mm, 0.2–0.5 mm, 0.5–1.0 mm, and 1.0–3.0 mm. The roughness of the pile was typically measured using the normalized roughness ratio Rn [40,41,42]. The relationship of Rn is expressed as Rn = R t d 50 . Where, R n is the normalized roughness; Rn is the maximum roughness, which is the maximum vertical distance between the crest and the trough; d 50 is the average grain size value of the sandy soil. The conditions and fabrication details of the transparent soil model experiments were summarized in Table 1. Where d represents the diameter of the pile.

2.3. Transparent Soil

The transparent clay specimens were made of fused quartz and pore fluid with matching refractive index. In this investigation, the particle size of the fused quartz sand ranged from 0.5 to 1.0 mm, with an average particle diameter (d50) of 0.62 mm. The refractive index of the pore fluid made by mixing N-dodecane and White Oil 15 in the ratio of 1:20 by mass at 25 °C reached 1.4585 (Figure 3). In this case, the transparency of the configured soil could be up to 20 cm, and distinct light spots could be formed under laser irradiation.
Based on previous experimental investigations, the ideal visible depth of transparent soil can attain 10 mm. Hence, the burial depth of the MPs was not less than two-thirds. Therefore, the anti-slide section of the pile in the model was 10 cm, and the buried depth was 20 cm. In preparing the slope model, the pore fluid was first added to the model box and MPs were placed, followed by slow pouring of fused silica sand. Once the filling soil reached a thickness of 5 cm, it was roughly compacted. During this process, it was ensured that the pore fluid was about 3 cm above the surface of the soil to reduce the air carried into the soil. Finally, the upper cover plate of the acrylic vacuum model case was covered, and the vacuum pump was used to evacuate it for 20 min. Prior to adding the next soil layer, the surface of the preceding layer was textured to prevent overall delamination. After reaching a soil thickness of 200 mm by adhering to the outlined procedure, three layers of 0.05 mm thick Teflon film were laid as a sliding surface. Then, the soil was filled in layers to the top of the pile according to the previous steps. After the slope model was filled, acrylic plates were positioned on top and pressed with heavy weights for 24 h to achieve 70% soil compaction.

2.4. Experimental Procedures

The slope was loaded with lateral displacement, with a maximum load displacement of 40 mm. Before the experiment, the side plate was removed and the loading plate was adjusted to make contact with the soil. Then, the power of the laser was adjusted to ensure that the reflected spot brightness of the soil particles was appropriate. The camera was positioned above the model box with its lens aligned perpendicularly to the laser plane. The focal length and aperture were adjusted to capture a clear laser spot image. The loading distance was 1 mm each time, and the servo motor was loaded at a constant speed of 0.5 mm/s. At the end of loading, the two measurement subsystems move synchronously to scan and photograph the soil at a speed of 0.2 mm/s. The synchronized motion trajectory of the camera and laser is shown in Figure 4. Starting from the sliding surface, the scan passed sequentially through points S1, S2, S3, up to S50, with each laser slice spaced 2 mm apart. Each measurement section was held for 1 s, during which the high-speed industrial camera automatically captured images to produce laser scatter images for each section. The experiment involved repeatedly executing the steps mentioned above until a load displacement of 40 mm was achieved, at which point the trial concluded upon complete destruction of the pile or soil.

3. Results and Analysis

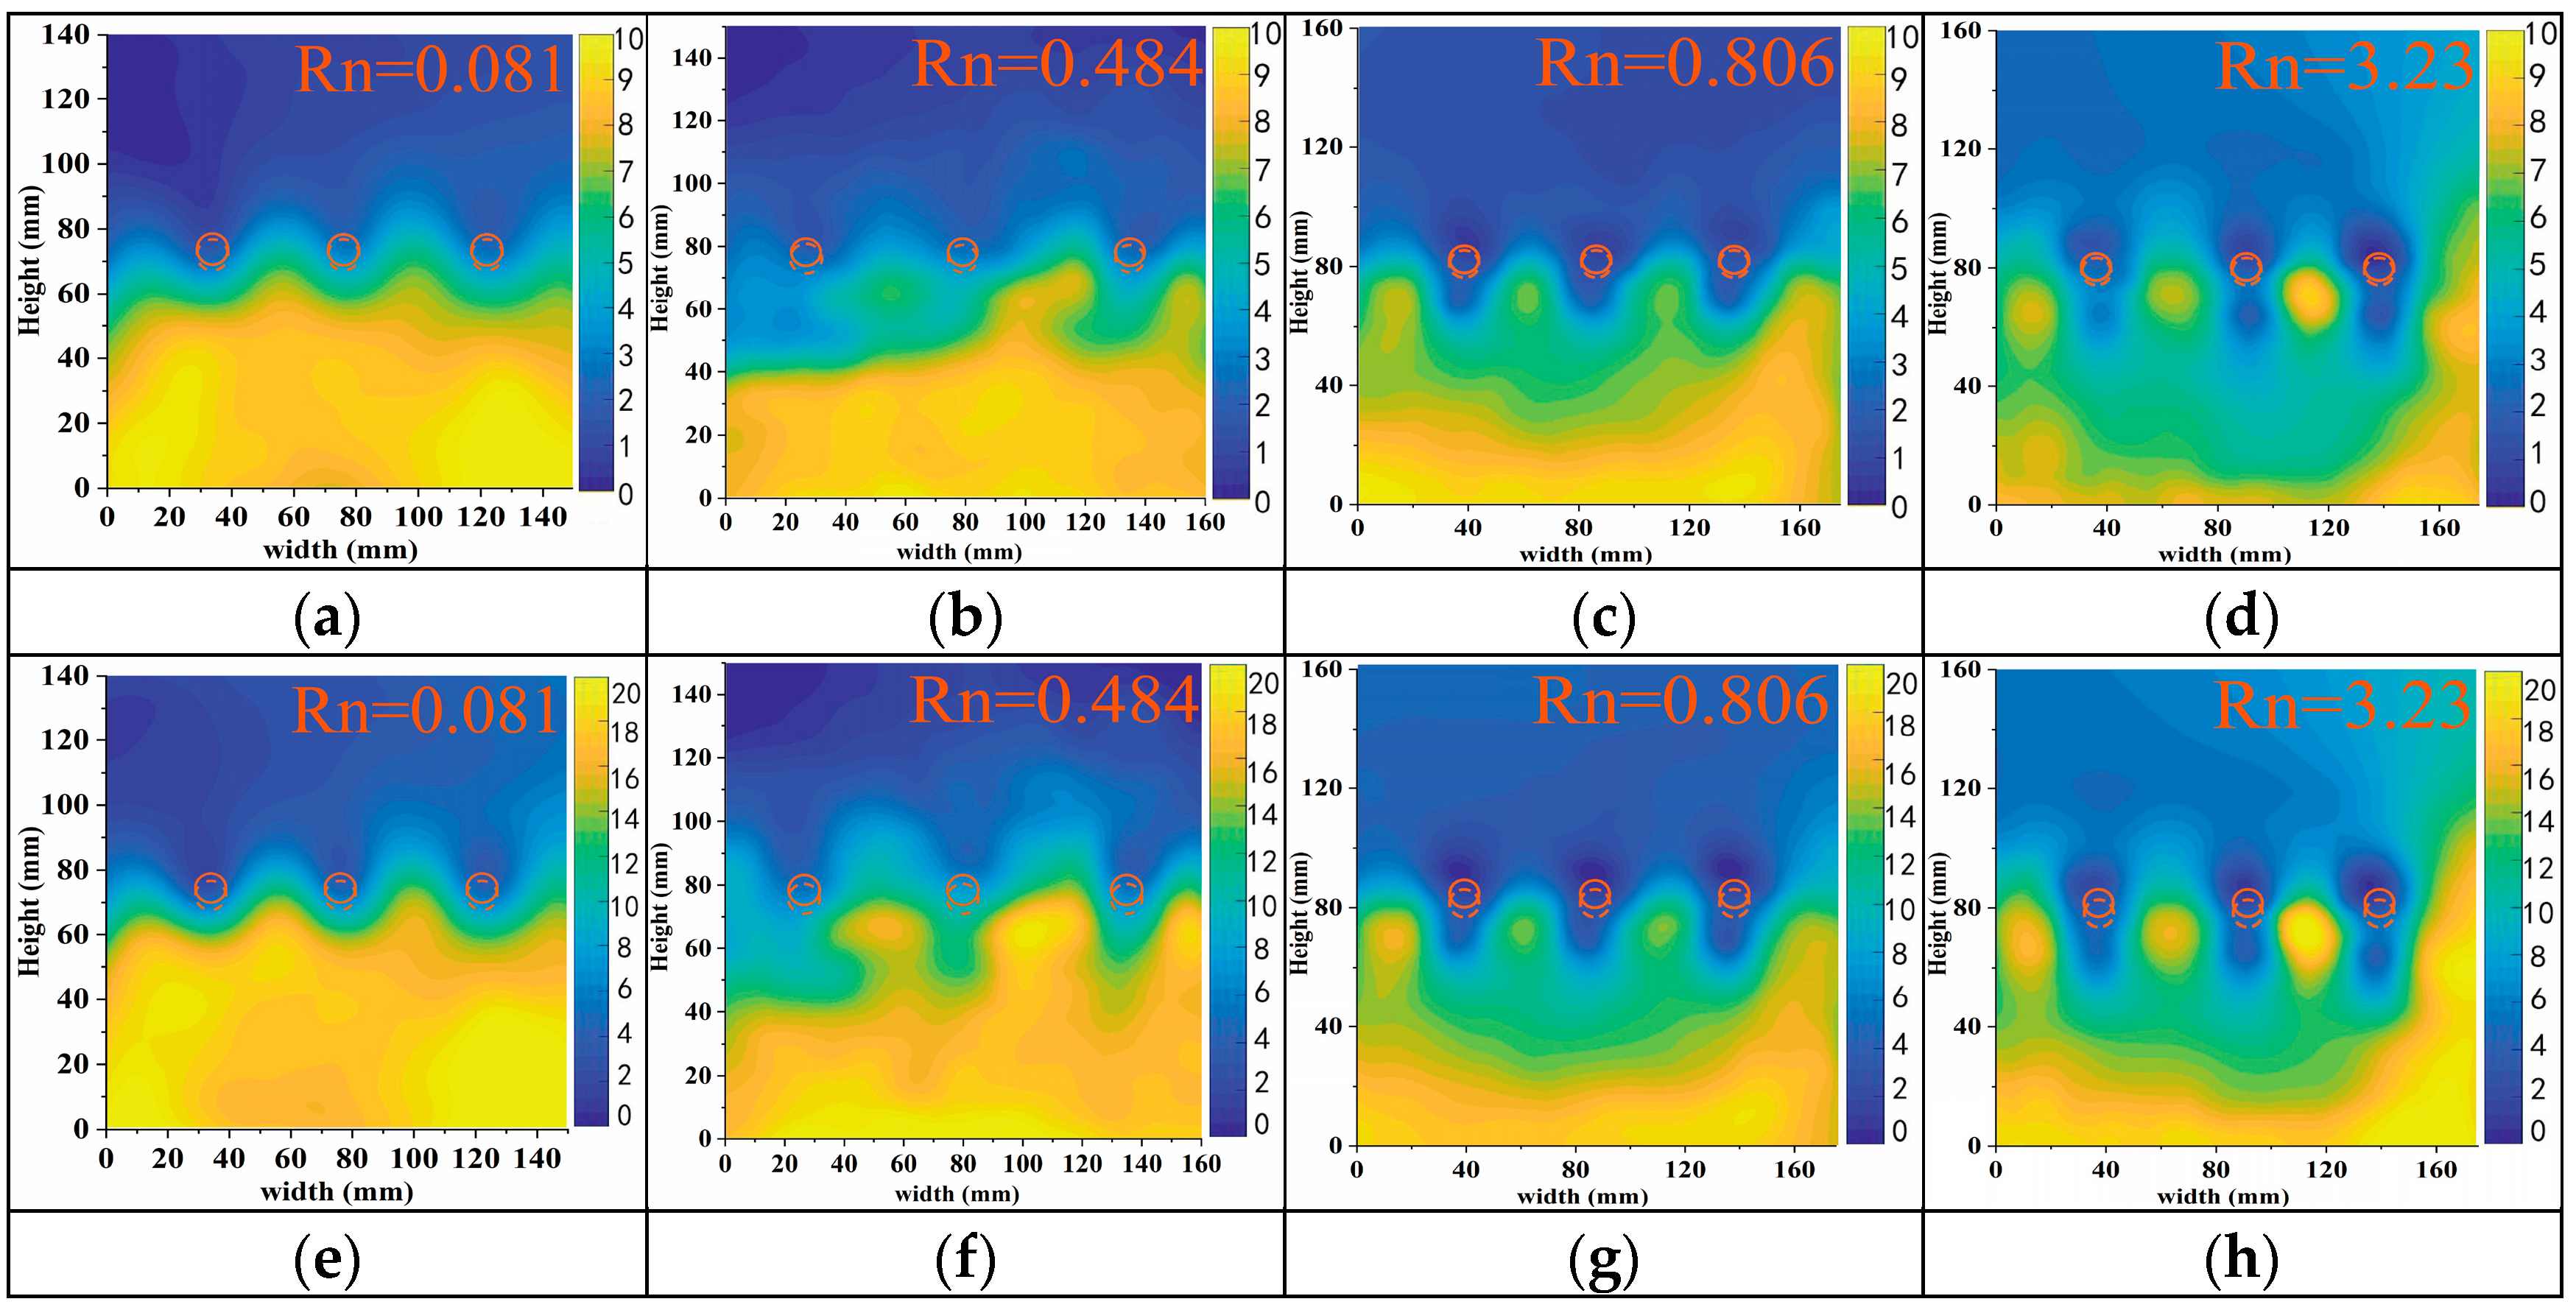
3.1. Effect of Roughness

To investigate the influence of pile surface roughness on the mechanism of pile–soil interaction, four groups of slope models reinforced with MPs with different roughness were subjected to lateral loading. Then, the displacement of soil at the top of the piles and in each slice were observed and recorded.

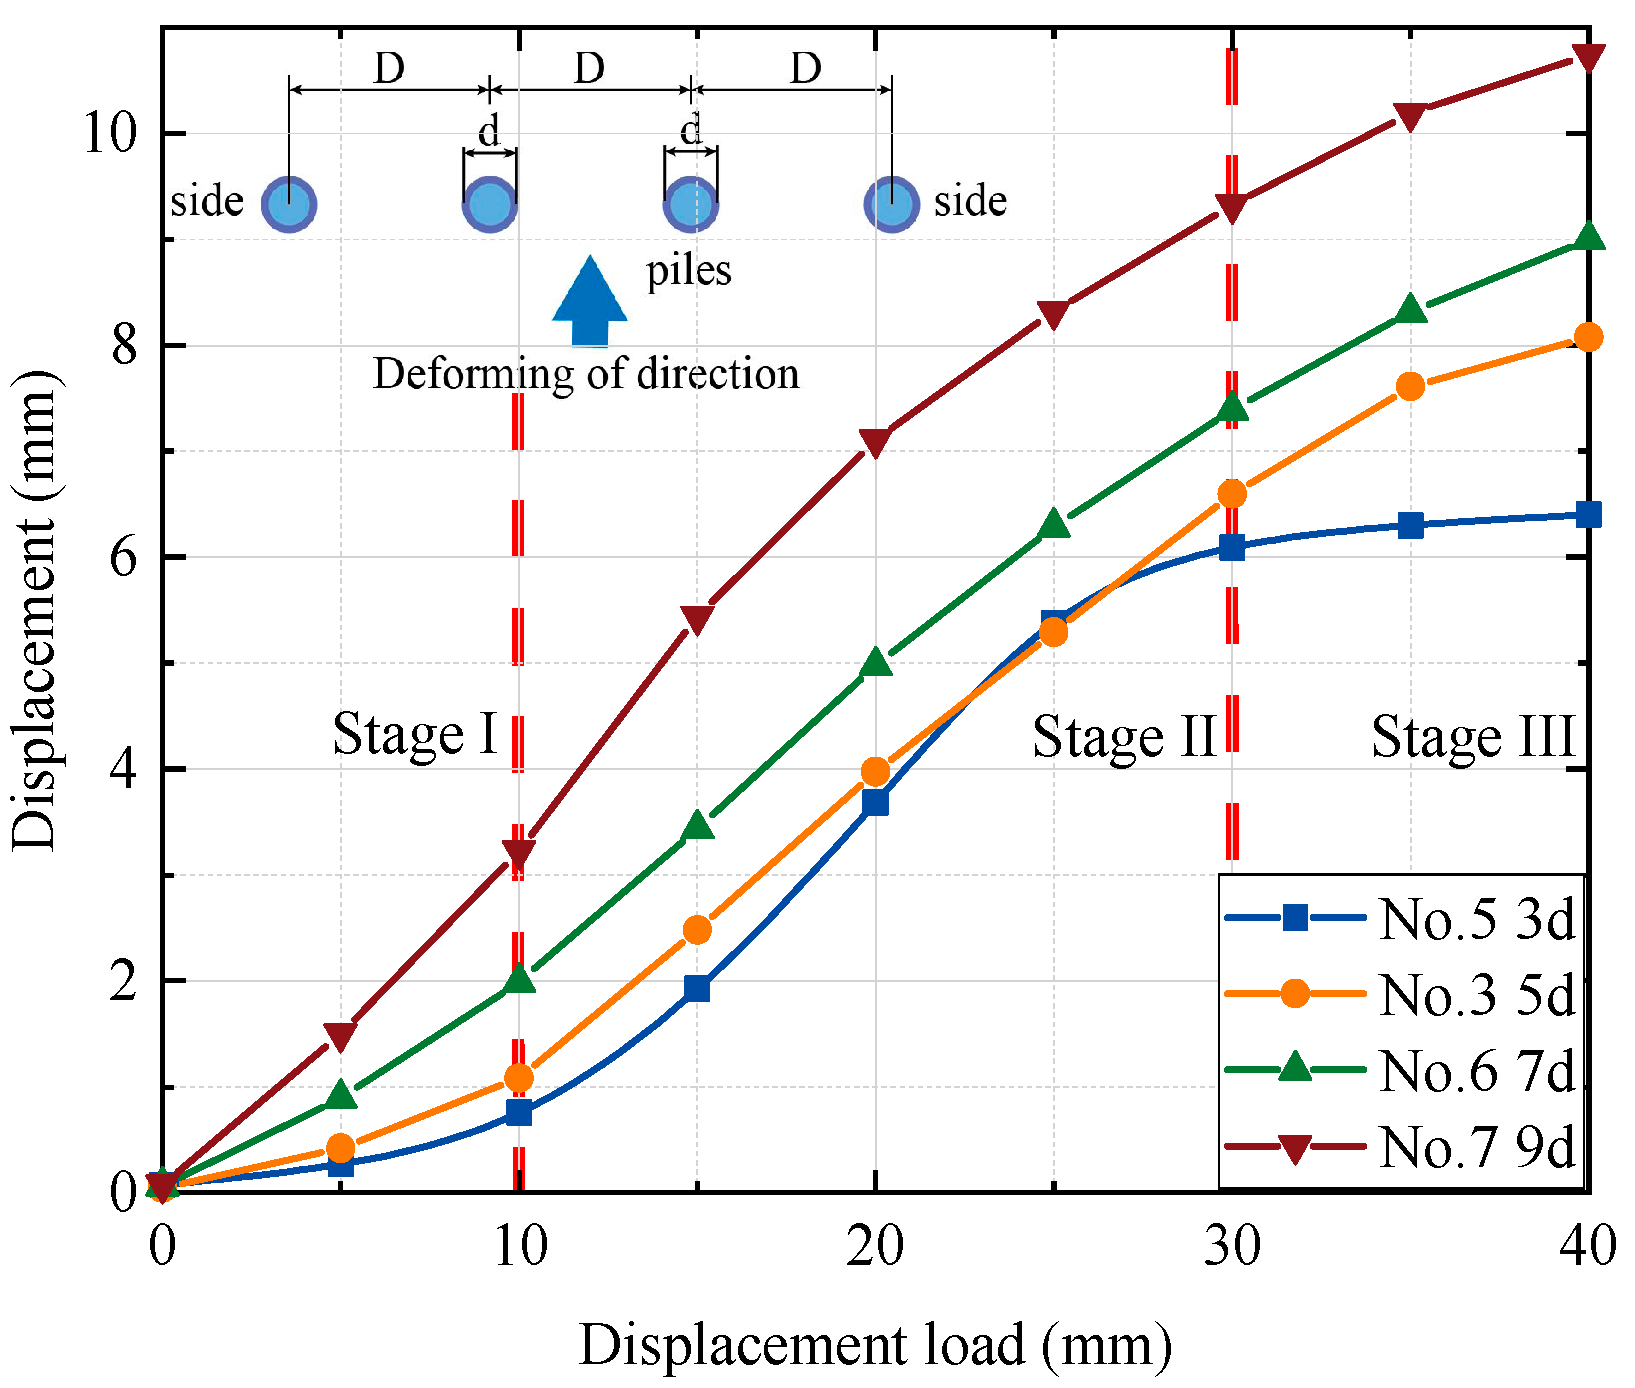
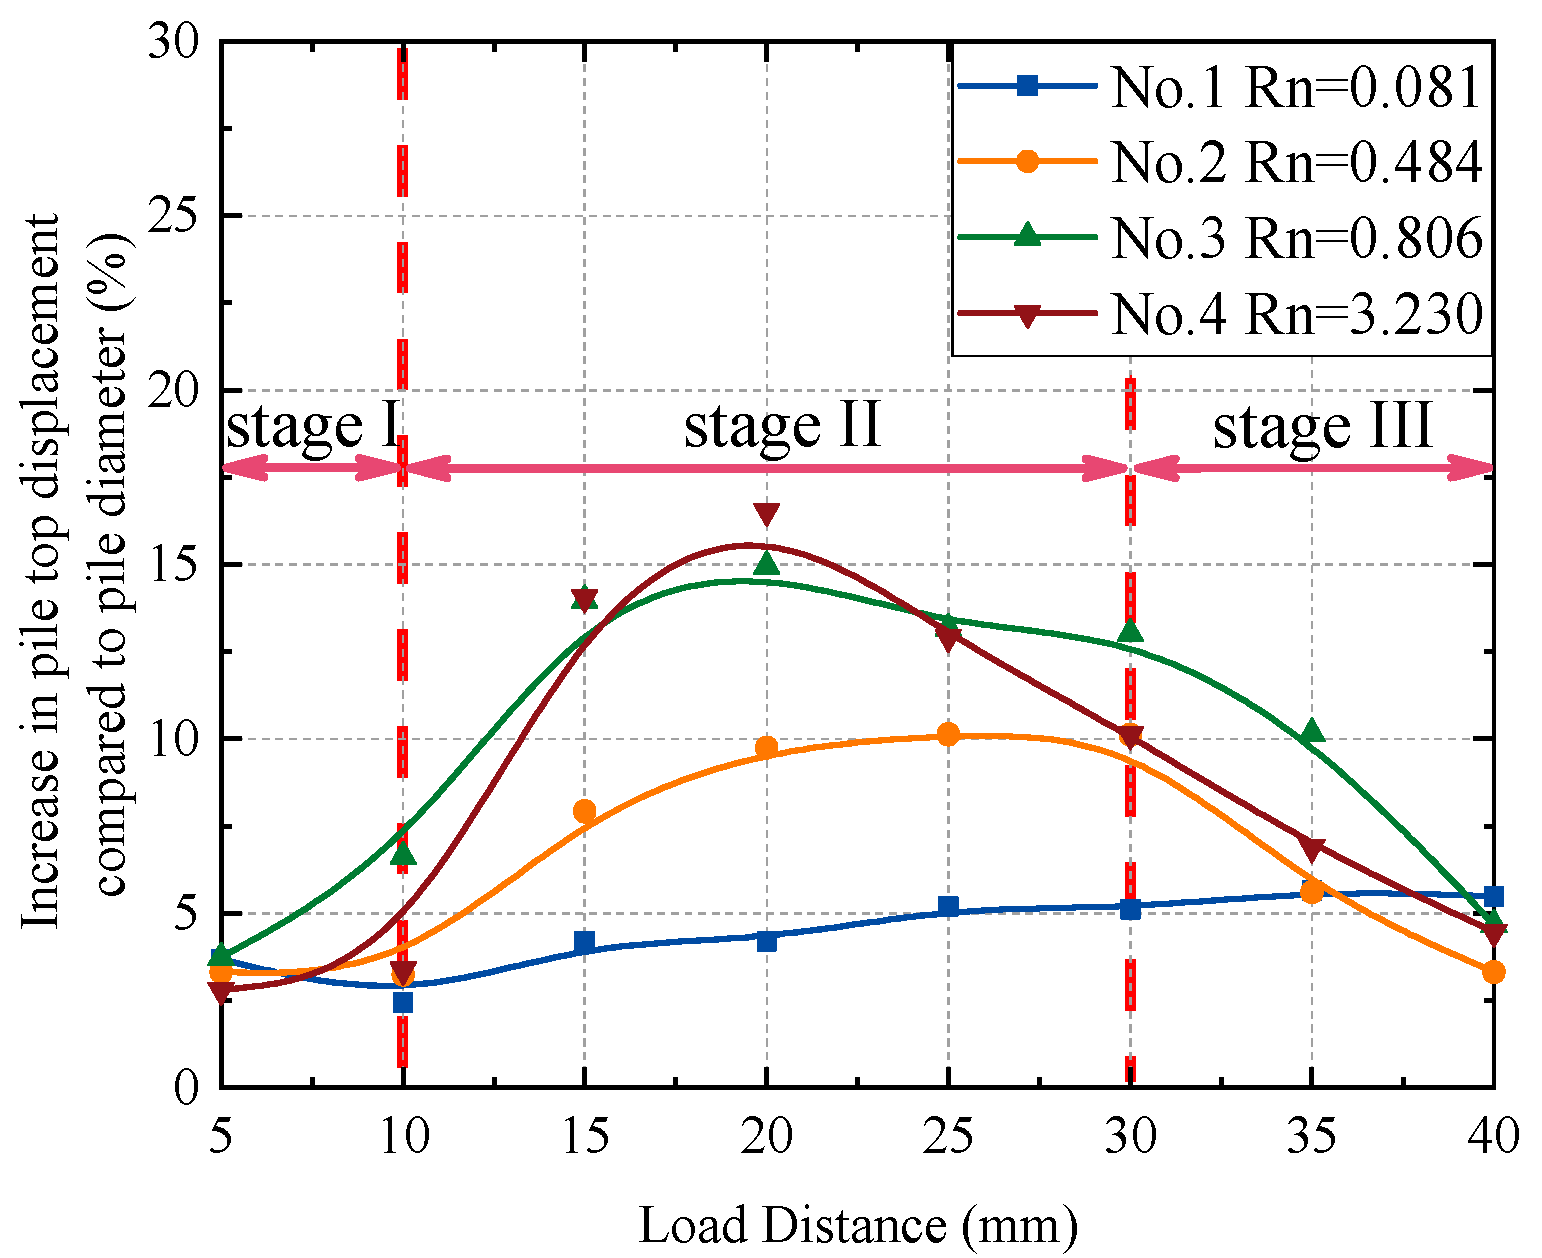
3.1.1. Pile Deformation

Under the condition that the pile spacing was 5 d, load displacement on slopes with varied pile roughness was analyzed. Section S50 images at the pile top were processed. The load displacement curve of the pile top was described. Deformation patterns of MPs depth-wise were similar across conditions, with piles above the slip surface bending. Increased load leads to bending failure and the plastic hinge near the slip surface.
Displacement at the pile top for varying roughness is shown in Figure 5. Experiment No. 1 had a smooth pile surface with normalized roughness Rn = 0.081, resulting in low bond and friction with the soil. Consequently, the load sharing ratio was small, leading to a pile top displacement of just 3.52 mm at 40 mm loading distance, with no significant failure to the piles. This displacement curve trend differed from the other three groups.
Experiments No. 2, No. 3, and No. 4 on pile top load displacement showed similar trends in three stages: slow, accelerated, and unstable deformation. In stage I, soil compression occurred behind the pile, with top displacement under 1.5 mm and no plastic deformation. Stage II saw accelerated deformation, uneven soil displacement, increased load sharing, and plastic deformation, with top displacements over 5.5% of pile length—Experiment No. 3 increased by 6.05 mm. In stage III, displacement grew slowly, with No. 2 increasing by 0.89 mm and No. 3 reaching 8 mm and it was considered that the pile had collapsed.

3.1.2. Deformation Pattern

The PIV technique was used to obtain displacement clouds of the soil. The normalized roughness, Rn, of the pile surface for the four groups of experiments in Group 1 (Table 1) were 0.081, 0.484, 0.806, and 3.23, respectively. Figure 6 shows soil displacement clouds for 10–40 mm load displacements. Where the dashed circles in the figure indicate the initial position of the pile and the solid circles indicate the position of the top of the pile after loading. The displacement cloud images can reflect the interaction of pile and soil to a certain extent and can be used to identify the characteristics of the soil arch.
The vertical columns in Figure 6 depict soil displacement for groups 1 to 4 under four load displacements. Experiment No. 1 had soil particles (0.1–0.2 mm) with normalized roughness Rn = 0.081. The smooth surface of pile and low soil-particle friction led to a minimal load sharing ratio and a maximum top displacement of 3.52 mm. In Experiment No. 2 (soil particles 0.2–0.5 mm, Rn = 0.484), soil deformation stages included gradual arch foot formation, stable soil arch at 30 mm displacement (width similar to pile diameter, height twice the pile diameter), and arch top failure with soil slippage. Experiments No. 3 and No. 4 exhibited similar inhomogeneous deformation with significant soil arch formation.
The loading distances for the four rows in Figure 6 were 10, 20, 30, and 40 mm. Initially at 10 mm displacement, large deformations in the MPs were not observed in any experiment (Figure 6a–d). Displacements of the soil behind piles in experiment No. 1 were denser and showed no significant pile blocking effect or soil arch formation. Compared with the other experiments, the overall displacement in No. 1 was relatively large, whereas experiments No. 3 and No. 4 showed clear soil arch characteristics. Results indicated that greater pile surface roughness increased shielding effects and reduced overall soil displacement. During mid-loading at 20–30 mm displacement, deformation in piles varied (Figure 6f–h,j–l), with similar soil arch thickness in experiments No. 2, No. 3, and No. 4. Experiment No. 4 exhibited a slightly higher soil arch due to the increased particle size of pasted particles on the pile surface, which expanded the pile diameter and, consequently, the pile–soil interaction area. Experiment No. 4 showed a higher soil arch due to increased pile diameter from larger pasted particles, enhancing pile–soil interaction. Soil arches were thicker at the top and thinner at the base. At 40 mm load displacement, the soil arch in experiment No. 2 collapsed, leading to soil sliding between piles. Soil arches in experiments No. 3 and No. 4 remained intact, but the height in No. 3 was relatively low.
In addition, from the perspective of the model experiments, the roughness was more suitable when the pile surface was pasted with 0.5–1.0 mm grain size. The dragging effect between MPs and soil was more obvious, and the interaction of pile and soil could be observed effectively, which could be applied to the subsequent experiments.

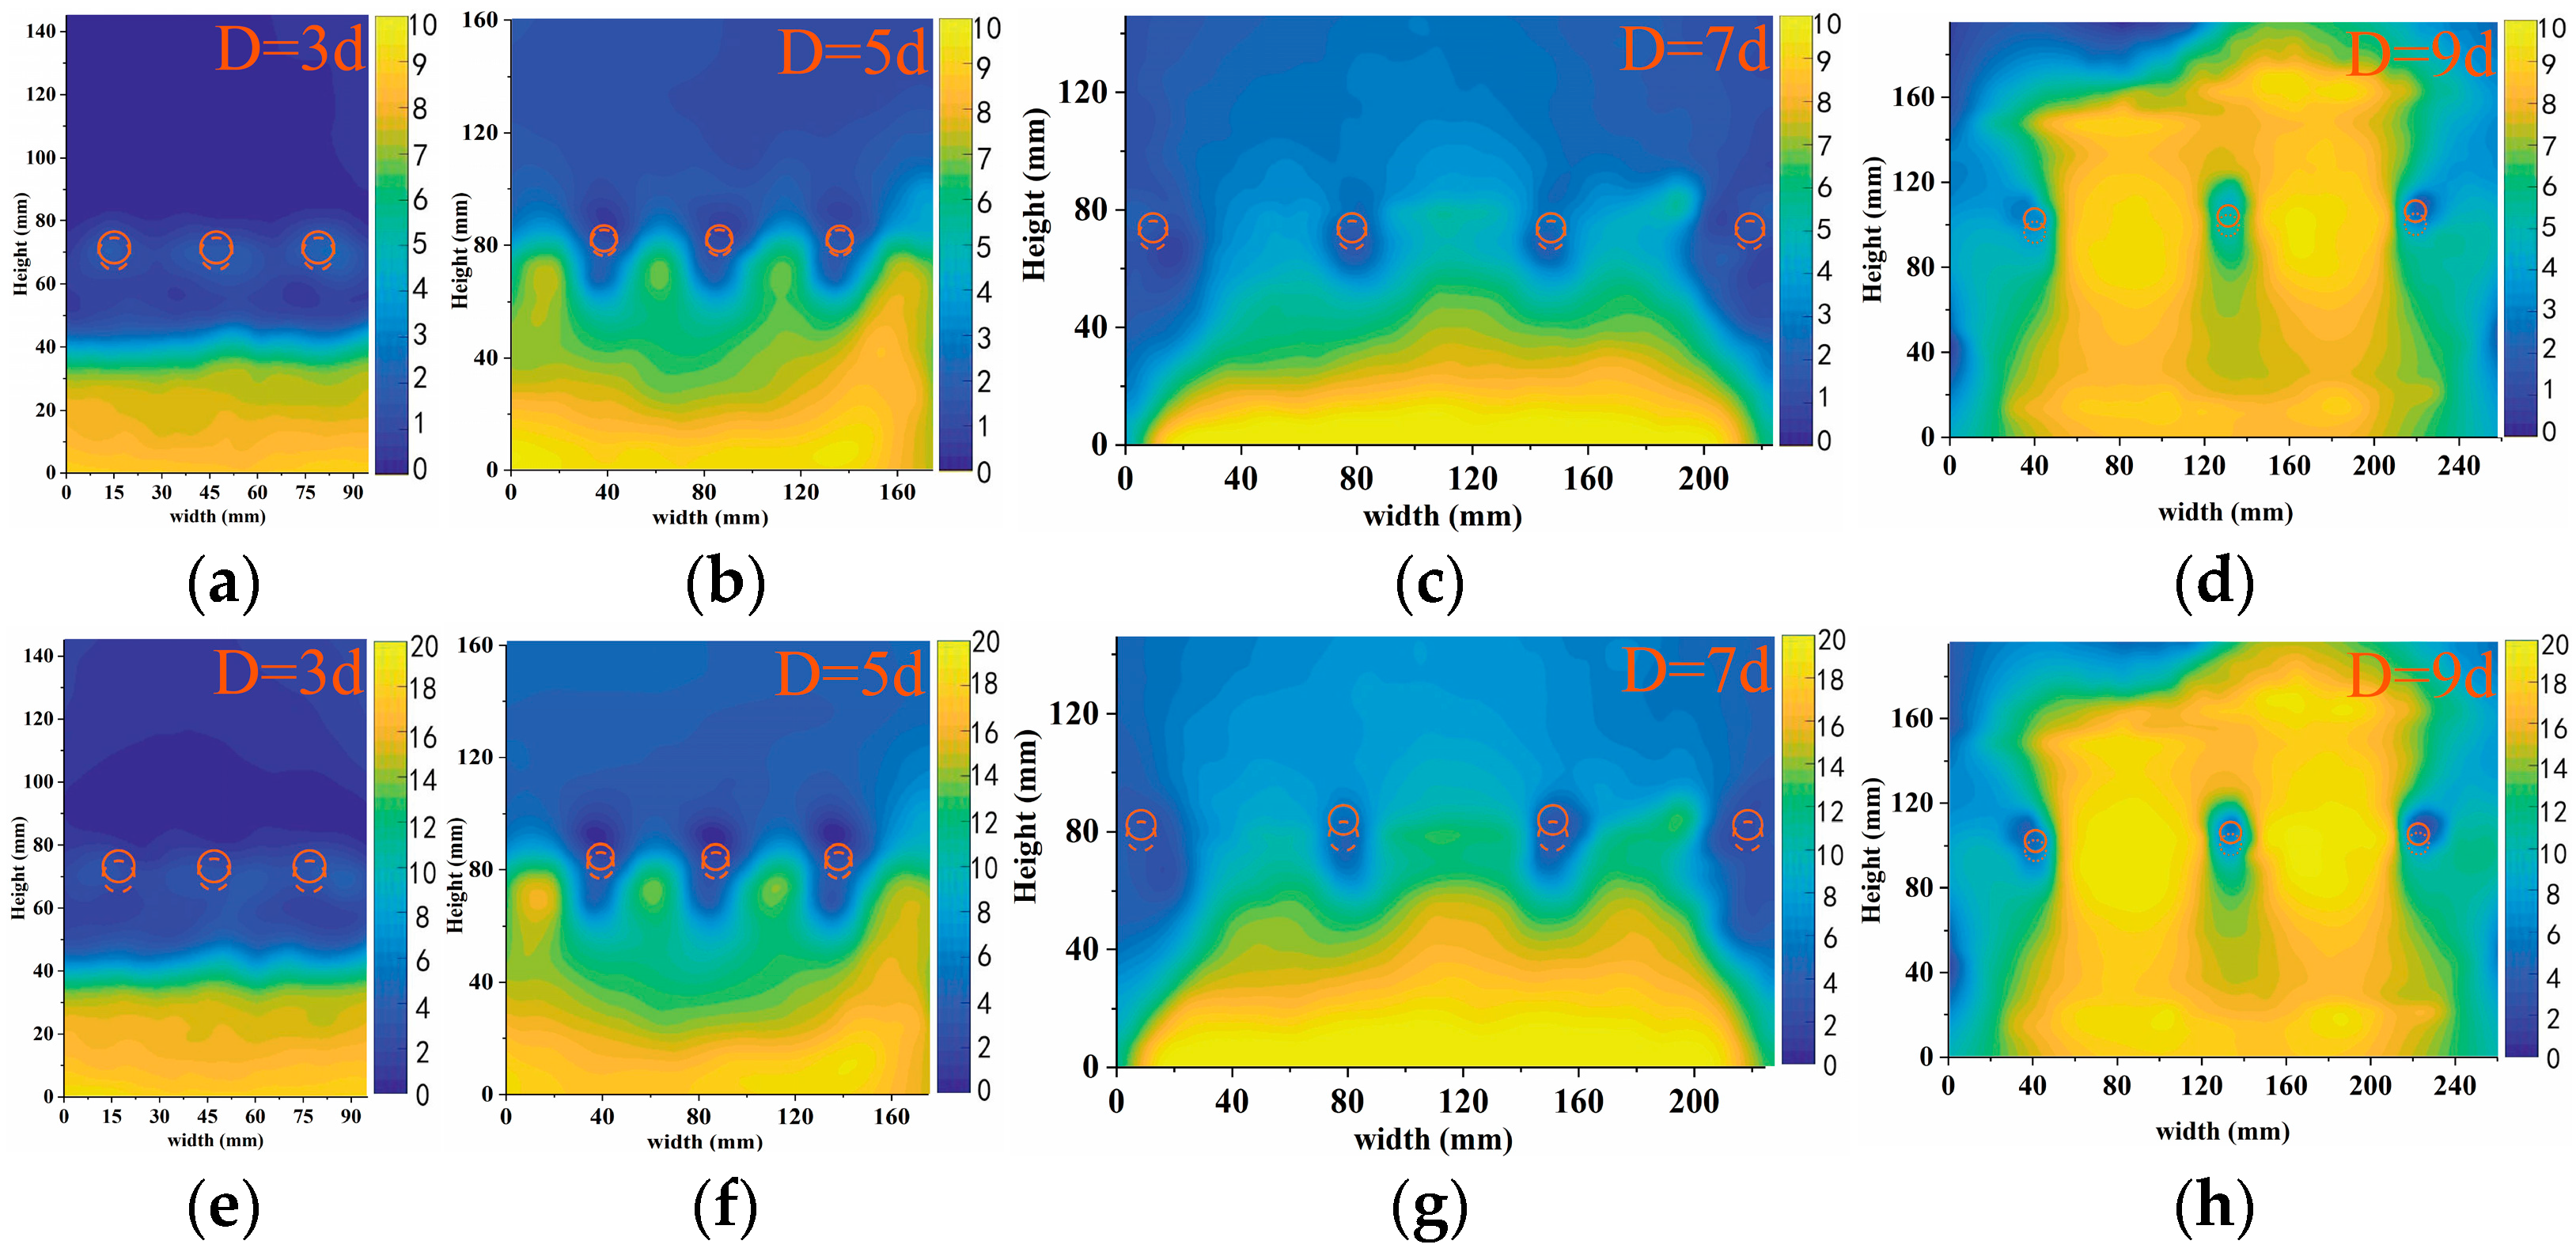
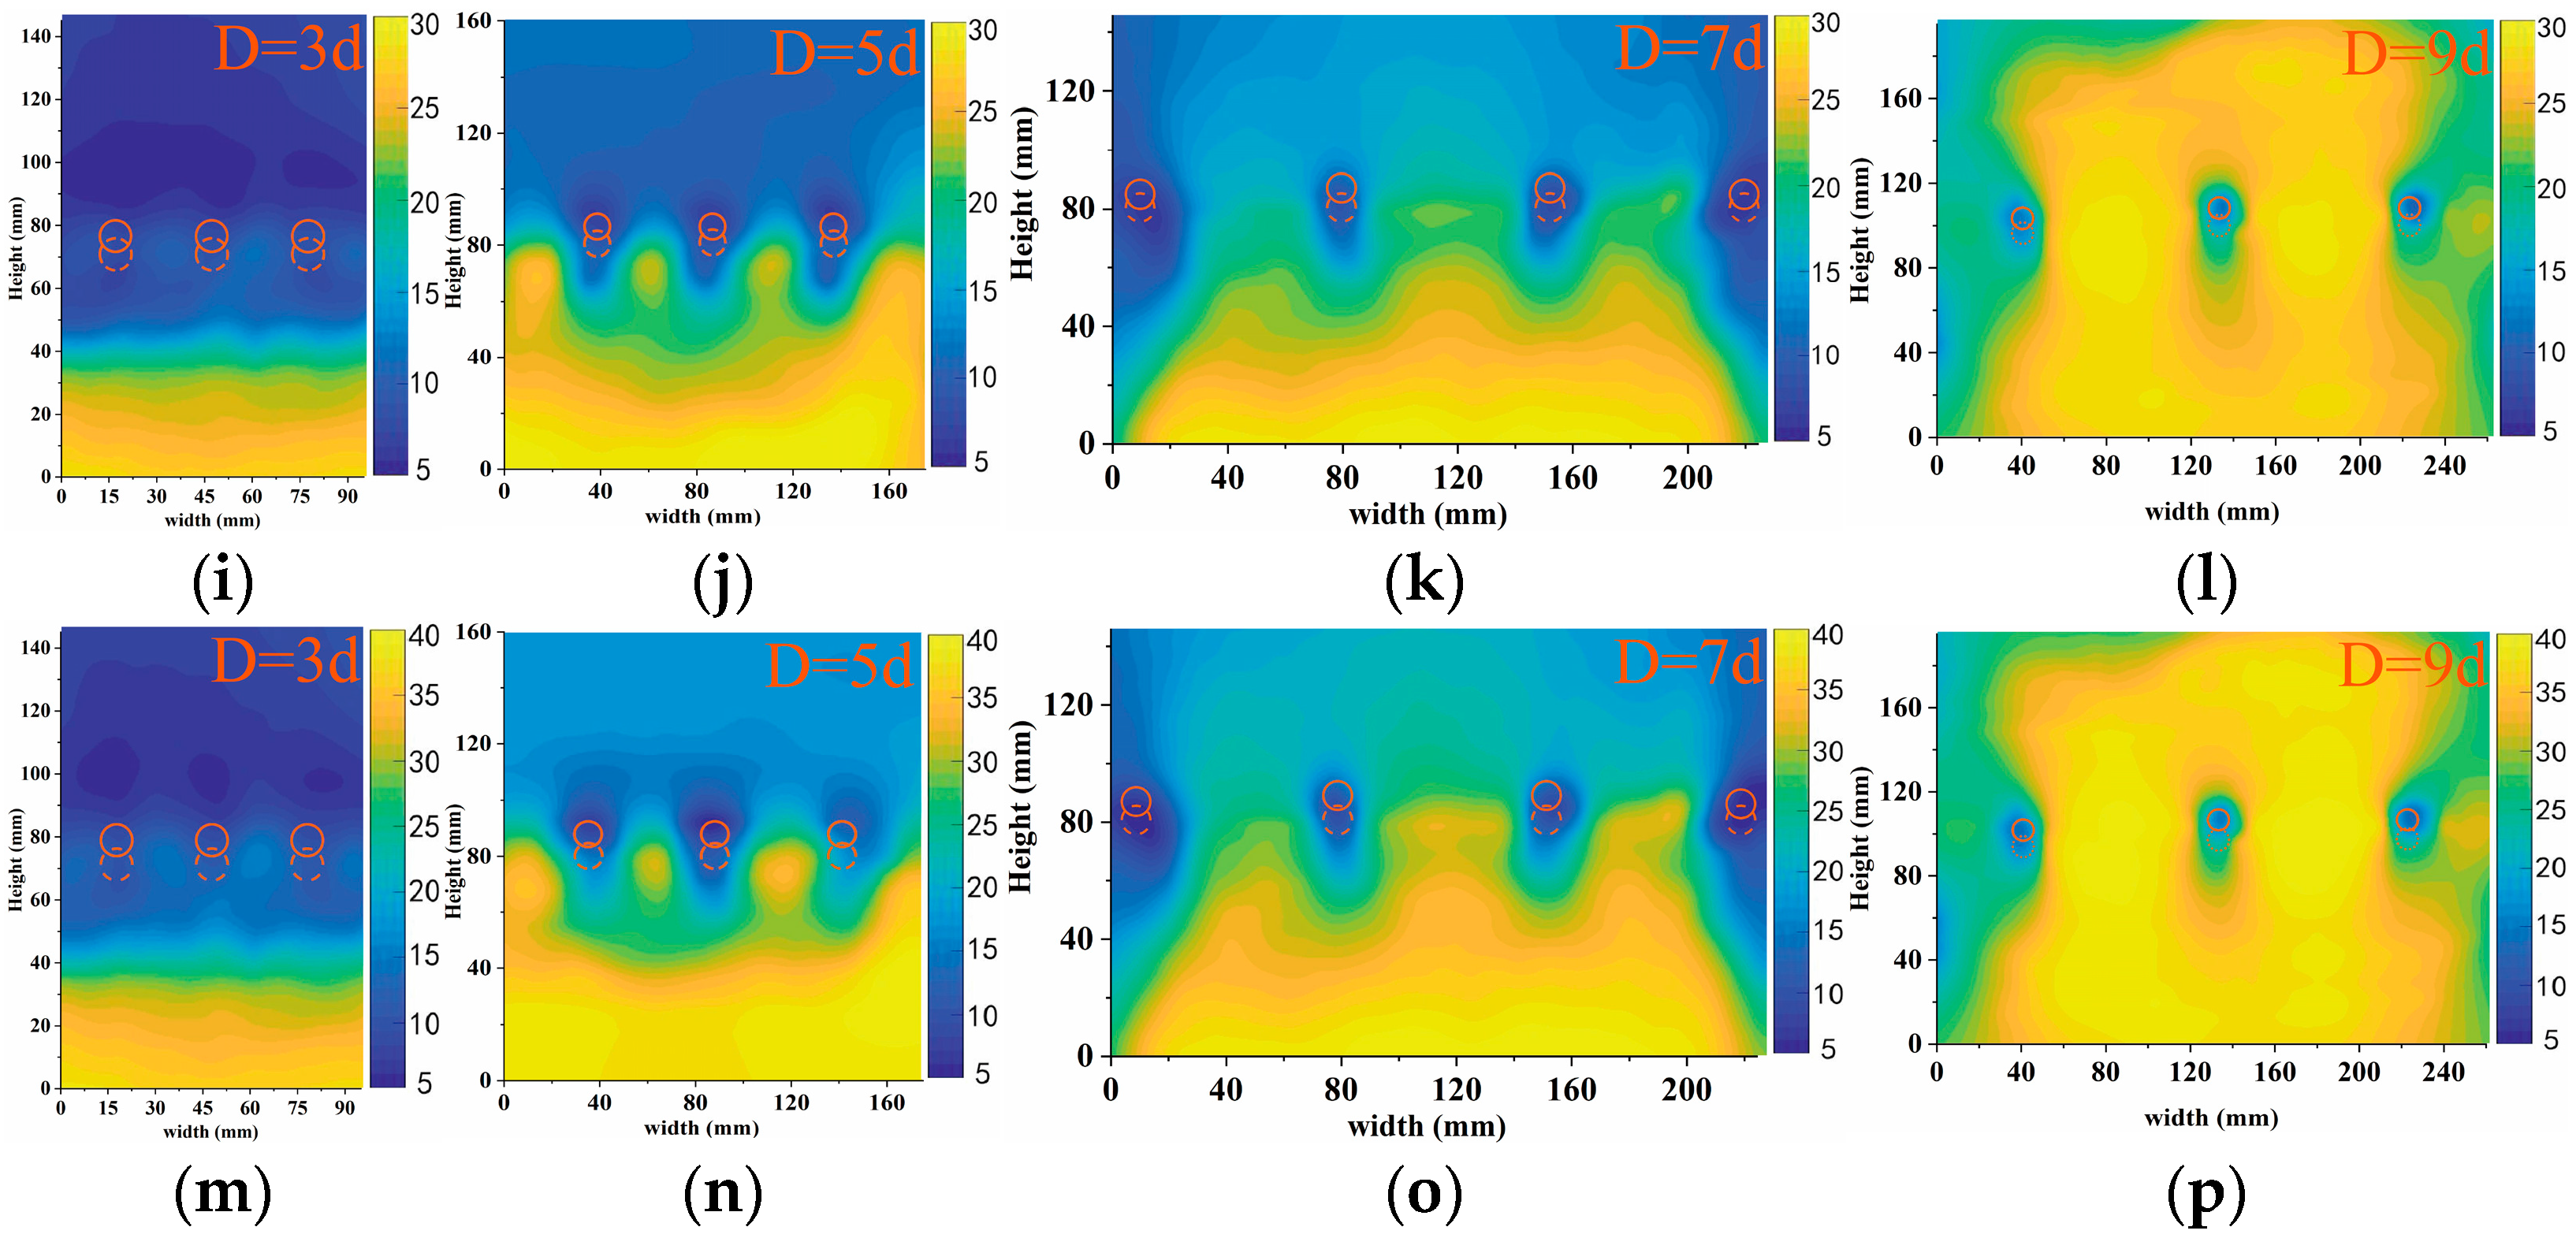
3.2. Effect of Pile Spacing

Four sets of experiments with pile spacing of 3 d, 5 d, 7 d, and 9 d were loaded under the condition of pile normalized roughness Rn = 0.806. The load displacement curve of the pile top was obtained by analyzing and processing the section image at the top of the pile.

3.2.1. Pile Deformation

The load displacement curves of MP tops at different pile spacings are illustrated in Figure 7. Generally, pile top displacement decreased as spacing increased. Final displacements were 6.40 mm, 8.07 mm, 8.99 mm, and 10.75 mm in the four experiments.
The pile spacing in experiments No. 5, No. 3, and No. 6 were 3 d, 5 d, and 7 d. Displacement trends showed three stages: slow, accelerated, and unstable deformation. At 10 mm load displacement (stage I), displacements in No. 5, No. 3, and No. 6 were 0.76 mm, 1.08 mm, and 1.99 mm. In experiment No. 5 with pile spacing of 3 d, the MPs’ shading effect was more obvious, and its mode of action was similar to that of a retaining wall. Between 10 and 30 mm (stage II), No. 3 and No. 6 showed similar curves, with MPs’ top displacement increasing by 5.51 mm and 5.41 mm. At 30–40 mm (stage III), No. 3’s displacement rose by 1.48 mm, with small amount of soil flowing around the pile. In experiment No. 6, the MPs top displacement increased by 1.6 mm, with a rising load-displacement curve. However, the pile top displacement of experiment No. 5 only increased by 0.31 mm. This was due to the small pile spacing in experiment No. 5, which led to a small total width of the group piles. After the soil was collapsed, it slid away from both sides around the pile group.
The pile spacing in experiment No. 7 was 9 d, the phase of the pile top load displacement curve was not obvious, and the changing trend was different from the other three groups. With a 10 mm load, the pile top displacement reached 3.22 mm, exceeding the other groups significantly. From 20 mm to 40 mm loading, the curve’s slope was 0.182, smaller than the others. This was due to the large pile spacing in Experiment No. 7, eliminating adjacent pile interactions.

3.2.2. Deformation Pattern

The four experimental groups No. 5, No. 3, No. 6, and No. 7 with pile spacings of 3 d, 5 d, 7 d, and 9 d are shown in Figure 8. The displacement cloud image features dashed circles for the initial pile positions and solid circles for the pile tops’ post-loading. The figure illustrates how pile spacing influences soil deformation and pile top displacement.
The pile spacing for experiment No. 3 and No. 6 were 5 d and 7 d, and the shielding effect of the piles on the soil was relatively similar. As the load increased, the soil arch behind the pile was produced first in both sets of experiments. Under increasing load, a soil arch formed behind the piles and eventually thinned or failed at the top, leading to flow failure between the piles. Moreover, the displacement of the inner side of the soil arch was greater than that of the outer side. When the load displacement was 0–10 mm (Figure 8b–c), the soil was compressed under loading. When the load displacement was 10–30 mm (Figure 8f–g,j–k), the soil arch thinned and the soil between the piles was extruded, but the shape of the soil arch was not collapsed. In experiment No. 6, the larger pile spacing hindered soil arch formation, and at 30–40 mm displacement (Figure 8n–o), vault failure and soil extrusion were observed. Despite this, the MPs maintained shading effects on the soil and did not fail completely.
However, when the pile spacing was too large or too small, the deformation condition of the soil and the displacement law of the pile top have large differences. The pile spacing of experiment No. 5 was 3 d. During the loading process (Figure 8a–m), the soil behind the pile did not deform much due to the increase in the load. This was because the pile spacing in this experiment was too small, and the group piles act similarly to retaining walls. During the experiment, the soil between the piles produced the phenomenon of mortise and tenon. The pile spacing for experiment No. 7 was 9 d (Figure 8d–p). Due to the large pile spacing, the interaction relationship between adjacent piles was weak, and the soil behind the piles could not form a stable soil arch. This group of experiments was dominated by monopile load bearing. The rate of change in pile top displacement was low after the flow failure of the perimeter soil around the piles.
When the pile spacing was either too large or too small, significant differences in soil deformation and pile top displacement were observed. In experiment No. 5 with a 3 d spacing, the soil behind the pile showed minimal deformation due to the small spacing, causing the piles to act like retaining walls and creating a mortise and tenon effect. In experiment No. 7, with a 9 d spacing, weak interactions between piles prevented the formation of a stable soil arch, resulting in monopile load bearing and a low rate of pile top displacement change after soil flow failure.

3.3. Three-Dimensional Reconstruction

Three-dimensional reconstruction refers to the construction of a three-dimensional visual image model using a series of scattered images on the plane [43]. Most of the soils and structures in geotechnical engineering will involve three-dimensional deformation. Using 3D reconstruction technology, the deformation in space can be analyzed more intuitively. The displacement clouds of each soil layer obtained by automatic scanning is shown in Figure 9. As can be seen in Figure 9, the first slice was at the sliding surface, and the remaining slices extend upward along the vertical with fixed spacing.

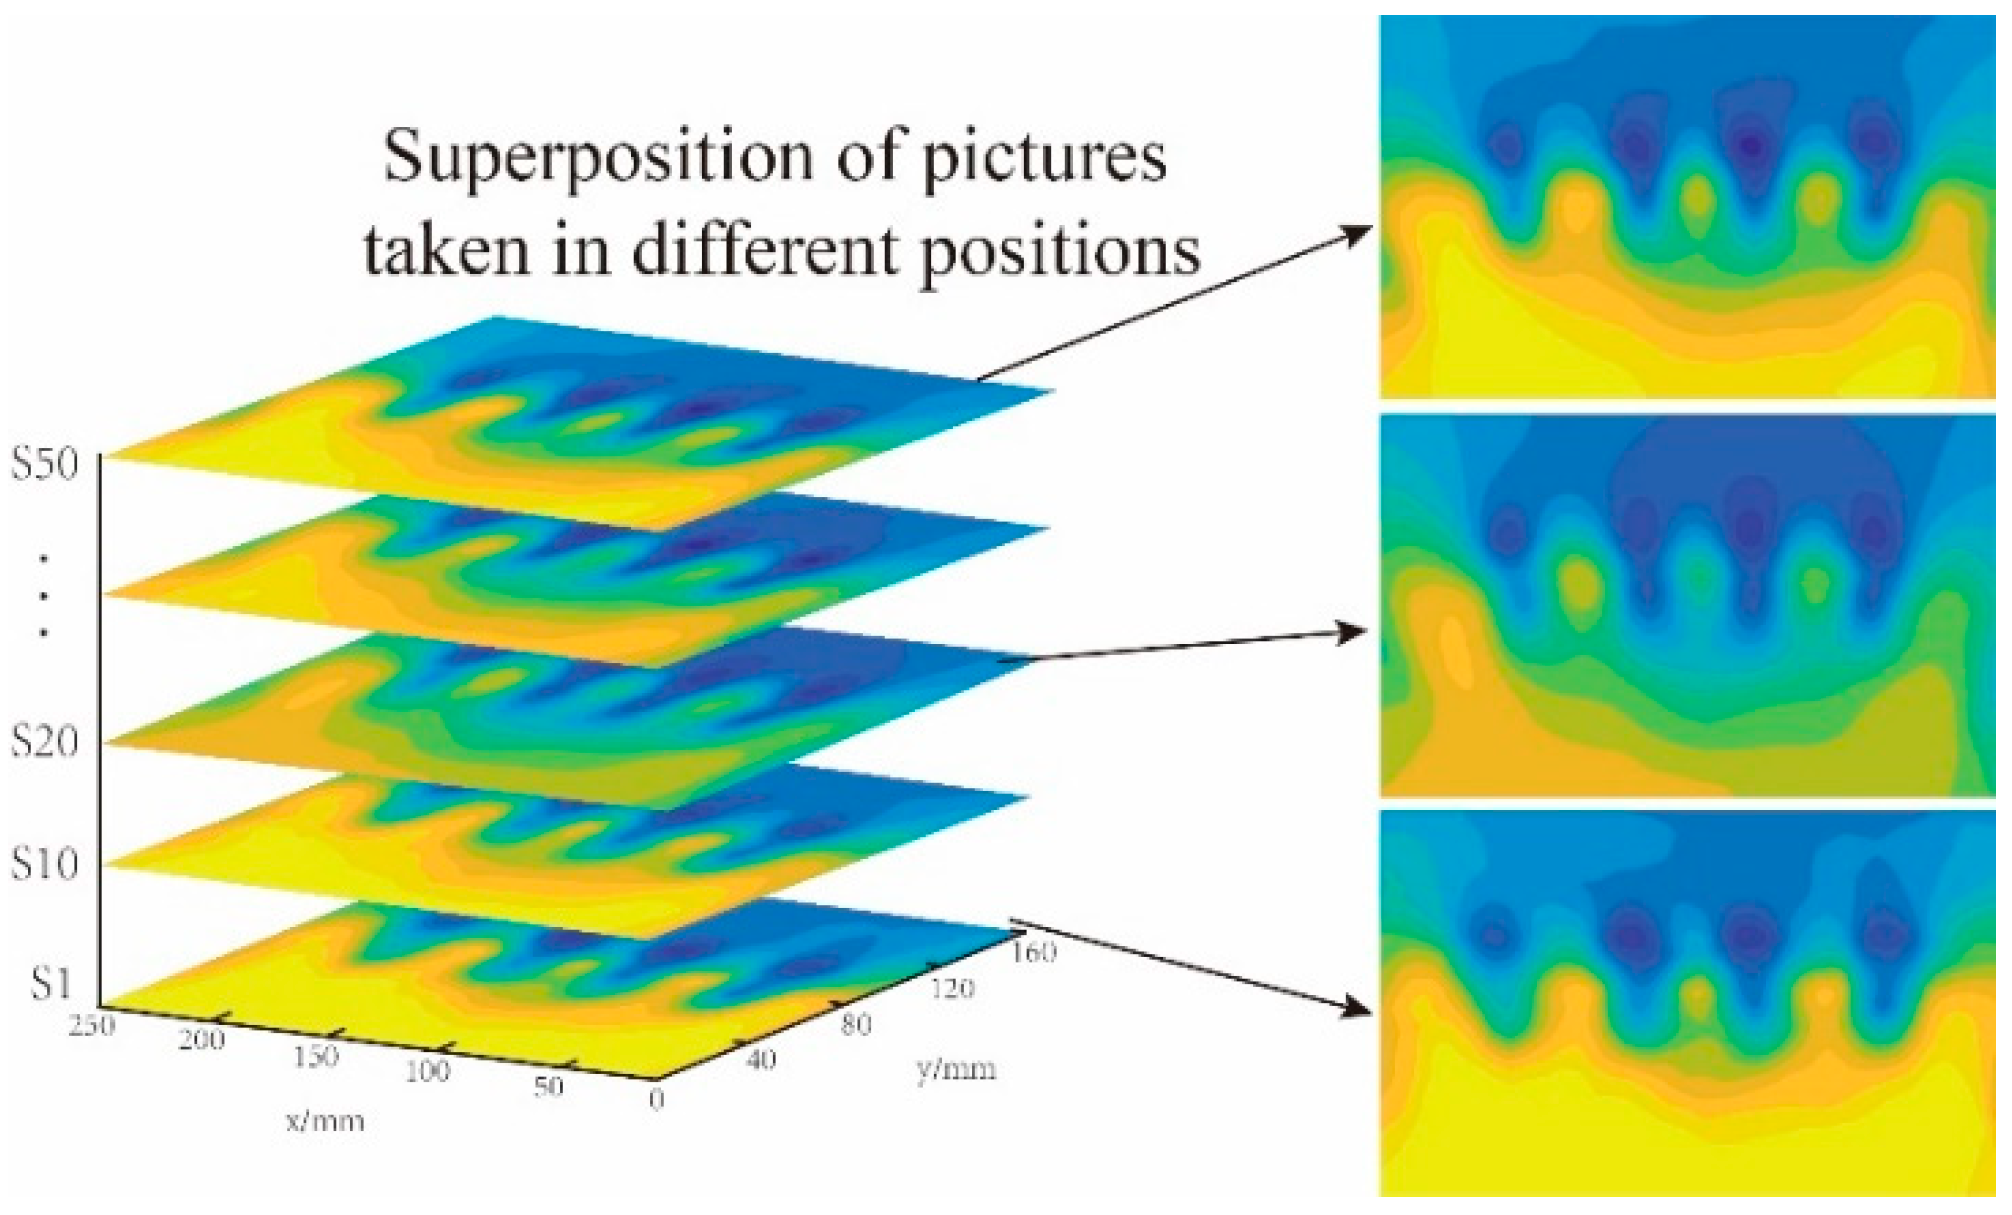
3.3.1. Reconstruction Method

An improved 3D reconstruction process for transparent soil visualization testing consists of three main steps: (1) Control the laser and high-speed industrial camera moving synchronously to perform a “CT scan” on the slide part. With a spacing of 5 mm, the soil displacement of 50 slices were obtained. The PIV technique was used to obtain the displacement cloud image of the soil and then extract the displacement contours of the same value in each cloud image. (2) When performing 3D reconstruction, a linear interpolation algorithm was first applied between contour lines in adjacent images to make the reconstructed contour surfaces smoother. Then, the extracted data were fitted with a cubic spline difference function on this basis to effectively improve the accuracy and reliability of the data. Finally, the filloutliers function was used to detect and replace outliers to improve the reliability and accuracy of the data. (3) After generating the 3D reconstructed contour surfaces, an adaptive modeling approach was used and coupled with a drawing algorithm for light projection. This is to better render the spatial details of the 3D displacement field and optimize the appearance of the 3D contour surface.
The deformation in the horizontal plane in this experiment was the real soil displacement obtained by image processing. And the vertical deformation along the z-axis was constructed by the interpolation function. Although the obtained vertical deformation was not an exact value, it still provided reasonable information on the deformation trend.

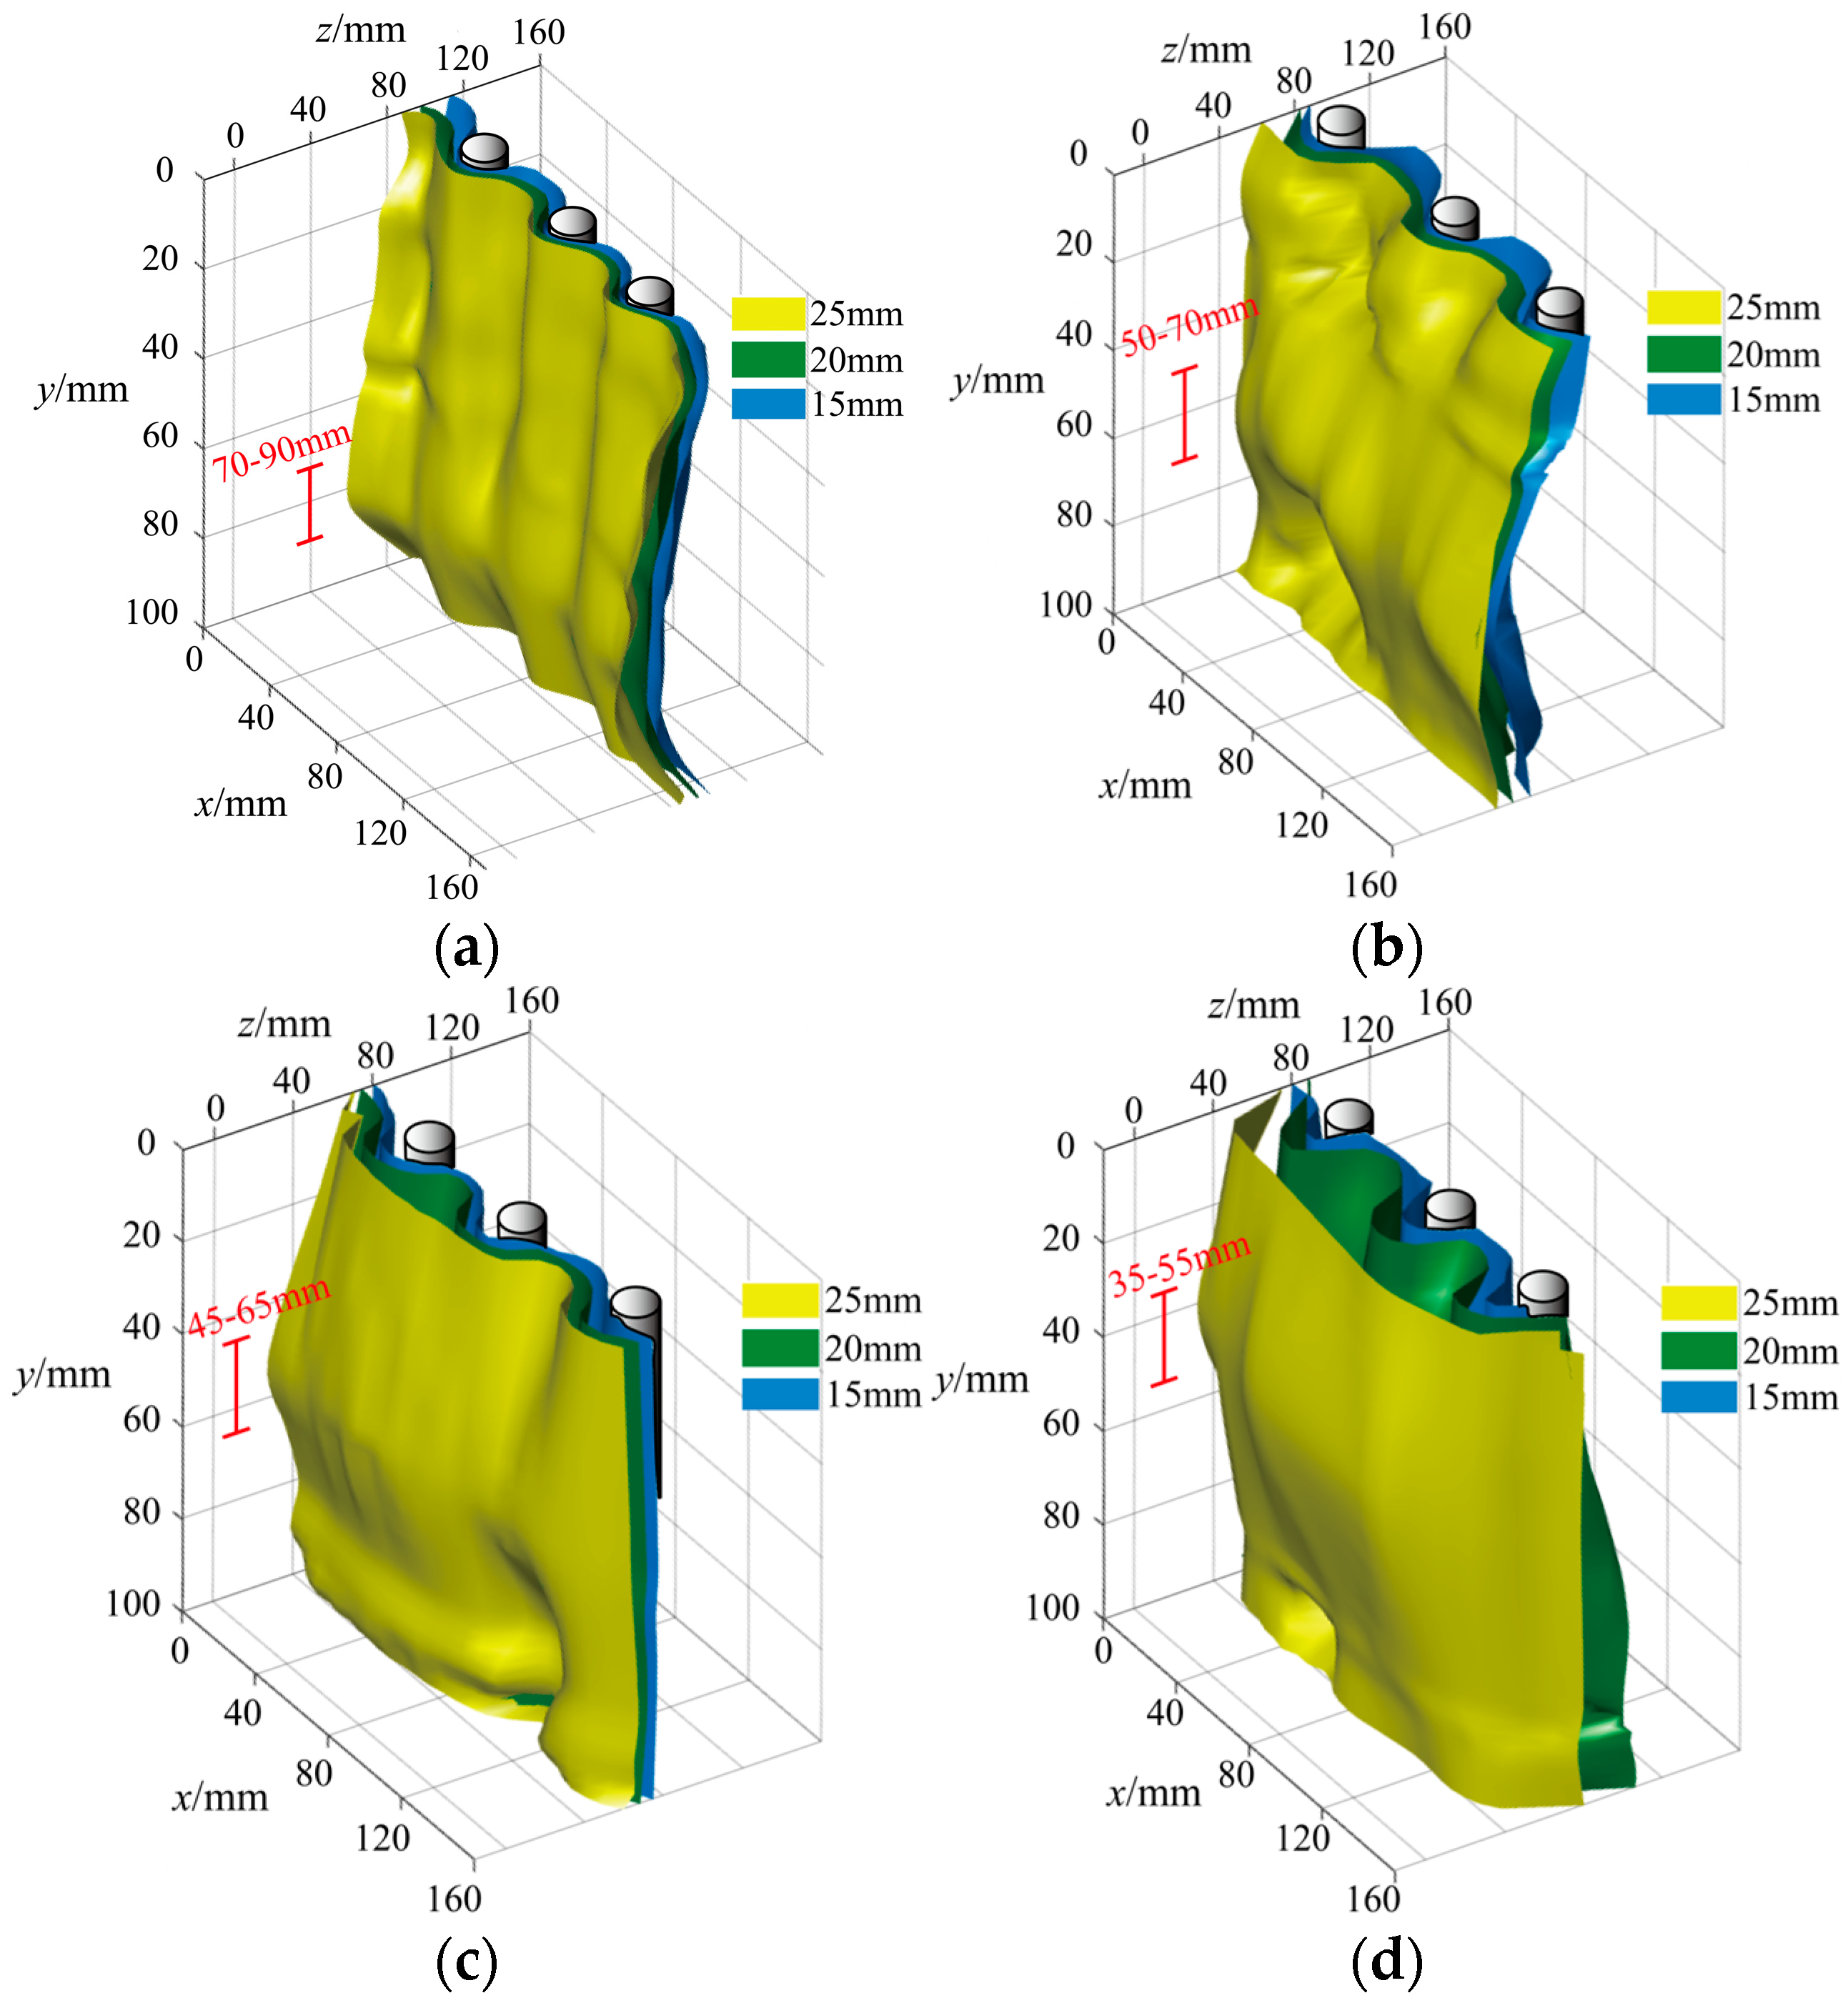
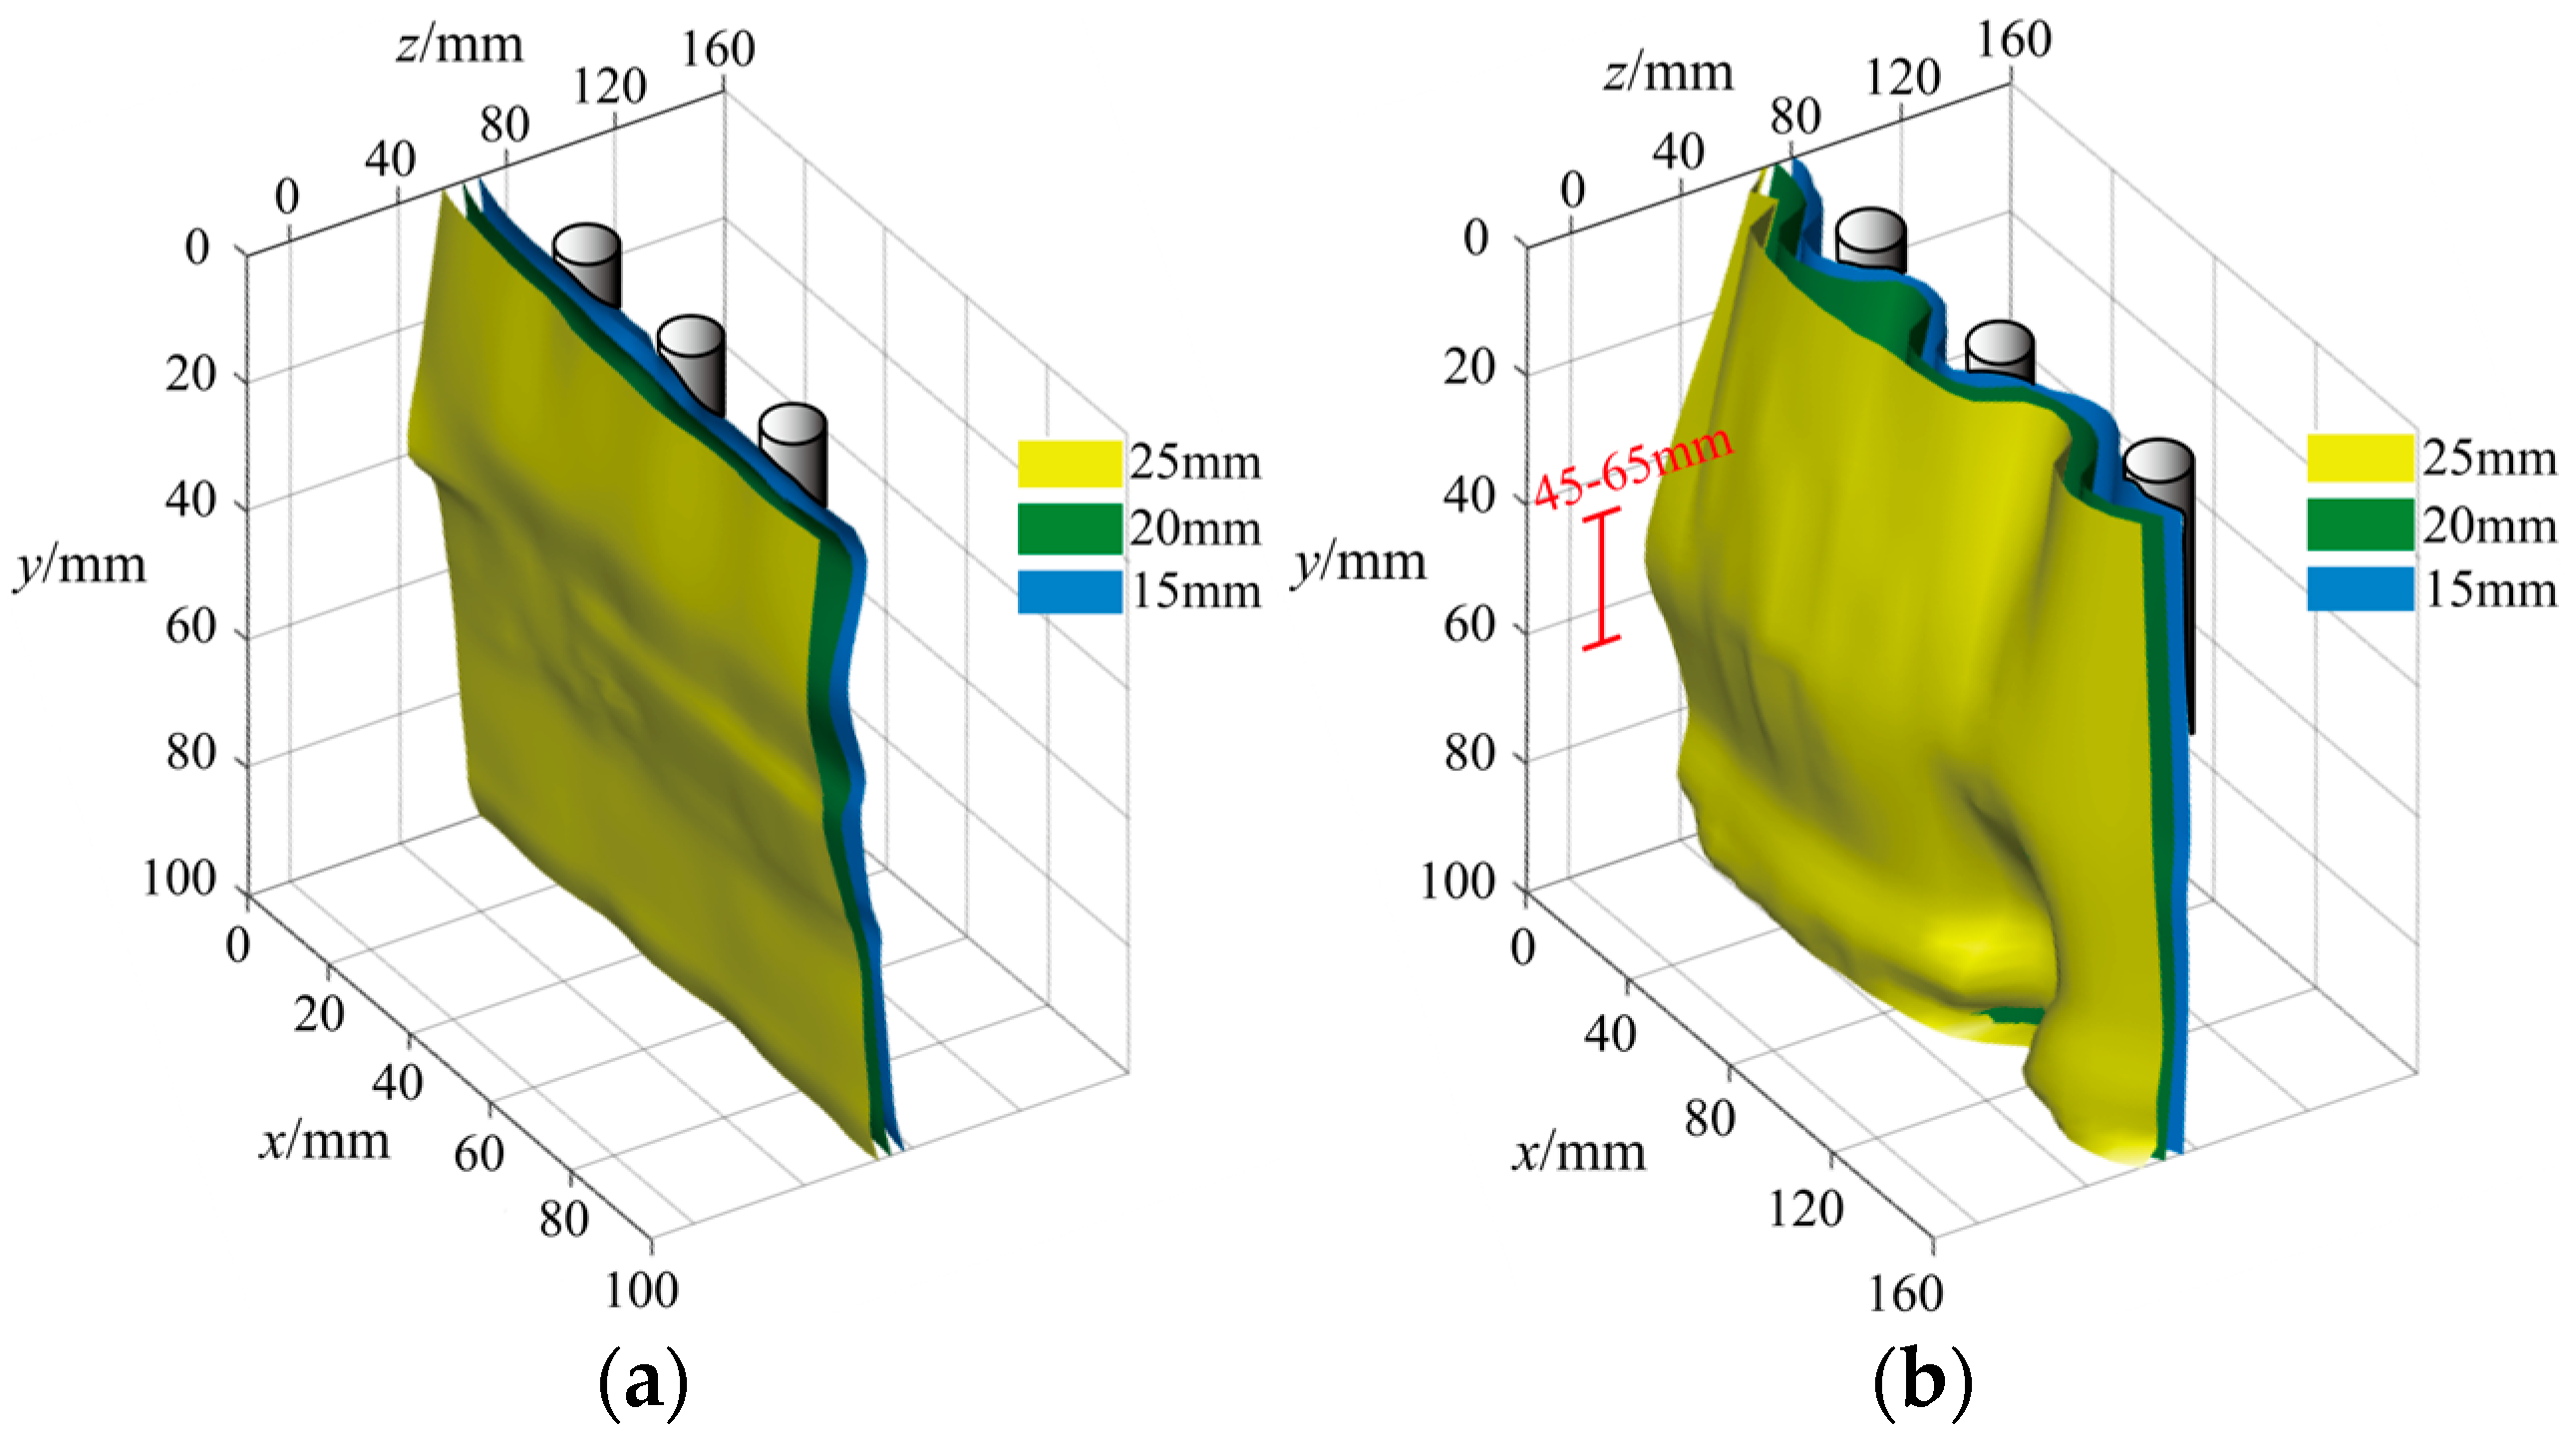
3.3.2. Result of 3D Reconstruction

Under lateral load, the pile displacement of MPs was relatively large. The spatial effect of the change in soil displacement behind the pile with depth was significant. Figure 10 and Figure 11 show the three-dimensional reconstructed models of the contour surface of the soil behind the MPs at the upper part of the sliding surface of the slope model. These illustrate soil deformation at varying roughness and pile spacing when the load reached 30 mm. The 3D contour surfaces reveal the uneven soil deformation supported by MPs.
When the surface roughness of the pile differs greatly at the same pile spacing, the soil behind the piles deformed in a more similar manner (Figure 10). In the vertical direction, the soil arch was thin at the top of the pile. At roughness Rn = 0.081, contour surfaces were closely spaced, causing soil near the pile top to slide out, with the maximum arch position around 80–90 mm. As roughness increased, the soil arch moved upward and thickened. The maximum soil arch positions of experiments No. 2–No. 4 were between 50–70 mm, 45–60 mm, and 30–60 mm, respectively.
Pile spacing significantly influences soil deformation patterns behind MPGs (Figure 11). When the pile spacing was 3 d, the contour surfaces behind the piles were generally flat. And the distance between each surface was smaller near the slip crack surface. At 9 d spacing, the blocking effect of the MPGs was weak, leading to complete soil slippage. When the pile spacing was 5 d and 7 d, the retaining effect of group piles was stronger, and the soil arch effect could be produced behind the piles. Among them, when the pile spacing was 5 d, the 15 mm contour surface exhibited minimal sliding from the piles. And the 15 mm contour surface slipped out from between the piles less when the pile spacing was 5 d. When the pile spacing was 7 d, the soil arch was only formed between 40 and 80 mm, and the thickest position of the soil arch was at 60–70 mm. The soil at the pile top slips out from between the piles.

4. Discussion

4.1. Effect of Pile Surface Roughness on Soil Arch

The pile surface roughness influenced pile–soil interaction mechanisms by altering the MPs’ load sharing ratio. The load displacement curves exhibit three deformation stages (Figure 5 and Figure 12). The displacement cloud imagery of the soil at each loading phase is depicted in Figure 6. Aside from experiment No. 1, where the pile surface exhibited specific roughness, the surrounding soil demonstrated a comparable deformation pattern. Sufficient friction between the pile and soil is crucial for developing supporting arch footings. Based on the soil arch model, soil arches are divided into end bearing and friction arches. Pile roughness enhances arch formation, greatly influencing friction arches across all experimental groups.
The pile surfaces in tests No. 2, No. 3, and No. 4 were relatively rough, and their pile–soil interaction mechanisms were similar. In stage I, the soil behind the pile compressed, and there was a small amount of uplift under the load. The increase in pile top displacement compared to its diameter was not significant in all groups (Figure 12). In stage II, pile top displacement growth increased, peaking at 10.13%, 14.95%, and 16.52%. In the cloud displacement images, soil arch height increased with pile surface roughness. End bearing and frictional arches were stronger on rough piles, reducing soil rupture. Increased pressure on the pile improved support by reducing relative displacement between soil and pile. In stage III, excessive cumulative deformation weakened or damaged the end bearing arch. The experiment showed reduced pile top displacement growth and a collapsed soil arch. Tests No. 3 and No. 4 had similar displacement cloud images and load-displacement trends. This suggests that beyond a certain roughness, further increase does not improve group pile bearing capacity. After the three-dimensional reconstruction, the spacing of each group of contour surfaces at the top of the pile was close.
This is because the soil stress at the top of the pile was smaller, the displacement produced by the particles was smaller, and the thickness of the soil arch and the height of the arch are relatively small. This was because the soil stress at the top of the pile was smaller and the displacement of the particles was smaller, which led to a relatively small thickness and arch height of the soil arch. As depth increases, soil arch thickness grows. Near the slip crack surface, the soil arch was thinner because some stress was transferred to the soil in front of the pile, weakening the soil arch.
In summary, increasing the roughness of the pile surface will increase the height of the soil arch and the interaction force between pile and soil. Furthermore, it will increase the pile–soil load sharing ratio and cause the MPGs to have a stronger support capacity.

4.2. Effect of Pile Distance on Soil Arch

The soil migrates stress to the pile through the soil arch effect, and the stress migration was achieved through the shear strength of the soil. In the case of excessive pile spacing, the direction of the principal stress at the loading surface of the pile was rotated and the angle between it and the loading direction was reduced. This leads to the shear strength of the soil at the foot of the arch not being able to meet the required amount and the soil not being self-stabilized. In turn, the soil around the piles fails. The angles of the principal stresses at the load bearing surface were different for different pile spacings, which led to different experimental phenomena.
The pile deformation could be divided into three stages, as above, for different pile spacings, corresponding to stage I, stage II and stage III in Figure 7 and Figure 13. The displacement increment at the top of the pile in test No. 7 was the largest, while the smallest was in group No. 5. When the pile spacing was 9 d, the piles shaded the soil, but there was no interactive relationship between adjacent piles (Figure 8). In the other three tests, the soil behind the pile was compressed and produced a slight bulge. In stage II, tests No. 3 and No. 6 show similar trends.
From the 3D reconstruction results (Figure 11), it can be seen that these two groups of piles produce a more stable soil arch after the piles, which had a similar effect on soil shading. The peak of the increase in pile top displacement growth (Figure 13) in test No. 7 was the highest, and the curve decreases rapidly later. This is due to the large pile spacing, which led to premature failure of the monopiles under load. The peak of the curve for test No. 5 was relatively large, but the rate of decline was fastest in the later part of the curve. This showed that the sliding speed of slope failure occurs faster when the pile spacing of micropiles was too small for slope support. Therefore, an appropriate pile spacing should be selected to ensure the stability of the slope or reduce the sliding speed when the slope was failing, to provide valuable time for emergency rescue. In stage III, the curves of experiments No. 3, No. 6, and No. 9 were similar in variation due to the excessive deformation accumulated in the pile.
From the three-dimensional reconstruction (Figure 11), it can be seen that an effective soil arch was formed only at a pile spacing of 5D and 7D. In general, the structural performance of the soil arch under lateral load weakened with increasing pile spacing. When the pile spacing was greater than 7D, it was difficult to produce an effective interaction relationship between the MPGs.
In addition, from the perspective of the model experiments, pile spacing between 5 d and 7 d is more suitable for the subsequent experimental study of multi-row miniature group piles.

5. Conclusions

Seven model experiments were carried out on transparent soil slopes reinforced by MPGs under lateral loading conditions. By analyzing load displacement curves, soil mass displacement, and 3D reconstructions, the following main conclusions were drawn:
The deformation process of a pile can be divided into three stages: slow deformation stage, accelerated deformation stage and unstable deformation stage. When inhomogeneous deformation of the soil occurs and the load sharing ratio on the pile increases, the pile undergoes accelerated deformation. After the soil arch behind the pile is ruptured, the acceleration of pile top displacement decreases.
A stable soil arch cannot be formed when the pile is smooth. When the pile roughness increases, the soil arch effect behind the pile is obvious and the influence range is expanded. And the load sharing ratio of the pile is higher and the supporting effect is enhanced.
A stable soil arch can be formed when the pile spacing is between 5D and 7D. When the pile spacing increases, the pile group effect decreases and the earth pressure on the single pile increases. When the pile spacing is 3D, the tight wedge effect occurs in the soil. At a pile spacing of 9D, the soil behind the pile produces flow-around failure. A soil arch cannot be generated in both cases.
The three-dimensional reconstruction of the soil behind the pile can visualize the pattern of soil displacement with depth. Under suitable conditions, the highest point of the soil arch of the MPGs occurs at the lower central position. The increase in pile roughness causes the highest position of the soil arch to move toward the top of the pile. The pile spacing increases, causing the highest position of the soil arch to move toward the sliding surface.

Author Contributions

All authors contributed to the study conception, design and writing of this publication. All authors have read and agreed to the published version of the manuscript.

Funding

This work is funded by the Anhui Provincial Department of Education Key Project for Natural Science Research in Universities (Grant Nos. 2023AH051658), Tongling University Talent Launch Project (Grant Nos. 2021tlxyrc19).

Data Availability Statement

All data generated or analyzed during this study are included in this article.

Conflicts of Interest

The authors declare no conflicts of interest.

References

  1. Justo, E.; Vazquez-Boza, M.; Luis Justo, J.; Luis Arcos, J. An elastoplastic model for the analysis of a driven pile extended with a micropile. Comput. Geotech. 2017, 87, 10–19. [Google Scholar] [CrossRef]
  2. Moayed, R.Z.; Naeini, S.A. Imrovement of loose sandy soil deposits using micropiles. Ksce J. Civ. Eng. 2012, 16, 334–340. [Google Scholar] [CrossRef]
  3. Chimdesa, F.F.; Chimdesa, F.F.; Jilo, N.Z.; Hulagabali, A.; Babalola, O.E.; Tiyasha, T.; Ramaswamy, K.; Kumar, A.; Bhagat, S.K. Numerical analysis of pile group, piled raft, and footing using finite element software PLAXIS 2D and GEO5. Sci. Rep. 2023, 13, 15875. [Google Scholar] [CrossRef] [PubMed]
  4. Mao, W.W.; Liu, B.; Rasouli, R.; Aoyama, S.; Towhata, I. Performance of piles with different configurations subjected to slope deformation induced by seismic liquefaction. Eng. Geol. 2019, 263, 105355. [Google Scholar] [CrossRef]
  5. Li, Q.; Zhang, Y.Y.; Chen, C.; Wen, M.J.; Guan, W.J.; Duan, W.W. Dynamic response of a large-diameter end-bearing pile in permafrost. Sci. Rep. 2024, 14, 582. [Google Scholar] [CrossRef]
  6. Liu, D.Z.; Hu, X.L.; Zhou, C.; Xu, C.; He, C.C.; Zhang, H.; Wang, Q. Deformation mechanisms and evolution of a pile-reinforced landslide under long-term reservoir operation. Eng. Geol. 2020, 275, 105747. [Google Scholar] [CrossRef]
  7. Pei, Z.; Nian, T.; Wu, H.; Zhang, Y.; Zhang, C.; Wang, R. Research Progress on Emergency Treatment Techniques for Landslide Geological Hazards. J. Disaster Prev. Mitig. Eng. 2021, 41, 1382–1394. [Google Scholar]
  8. Li, C.D.; Wu, J.J.; Tang, H.M.; Wang, J.; Chen, F.; Liang, D.M. A novel optimal plane arrangement of stabilizing piles based on soil arching effect and stability limit for 3D colluvial landslides. Eng. Geol. 2015, 195, 236–247. [Google Scholar] [CrossRef]
  9. Gong, W.P.; Tang, H.M.; Wang, H.; Wang, X.R.; Juang, C.H. Probabilistic analysis and design of stabilizing piles in slope considering stratigraphic uncertainty. Eng. Geol. 2019, 259, 105162. [Google Scholar] [CrossRef]
  10. He, C.; Hu, X.L.; Liu, D.Z.; Xu, C.; Wu, S.S.; Wang, X.; Zhang, H. Model tests of the evolutionary process and failure mechanism of a pile-reinforced landslide under two different reservoir conditions. Eng. Geol. 2020, 277, 105811. [Google Scholar] [CrossRef]
  11. Sun, Z.-J.; Wang, Q.; Min, R.; Duan, Q.-W. Sensitivity analysis of influencing factors of pile foundation stability based on field experiment. Structures 2023, 54, 14–22. [Google Scholar] [CrossRef]
  12. Hu, X.L.; Liu, D.Z.; Niu, L.F.; Liu, C.; Wang, X.; Fu, R. Development of soil-pile interactions and failure mechanisms in a pile-reinforced landslide. Eng. Geol. 2021, 294, 106389. [Google Scholar] [CrossRef]
  13. Memar, M.; Zomorodian, S.M.A.; Vakili, A.H. Effect of pile cross-section shape on pile group behaviour under lateral loading in sand. Int. J. Phys. Model. Geotech. 2020, 20, 308–319. [Google Scholar] [CrossRef]
  14. Dong, J.; Wu, Z.H.; Li, X.; Chen, H.Y. Dynamic response and pile-soil interaction of a heavy-haul railway embankment slope reinforced by micro-piles. Comput. Geotech. 2018, 100, 144–157. [Google Scholar] [CrossRef]
  15. Li, N.; Men, Y.M.; Yuan, L.Q.; Wang, B.Q.; Li, J.; Liu, X.L. Seismic response of micropiles-reinforced landslide based on shaking table test. Geomat. Nat. Hazards Risk 2019, 10, 2030–2050. [Google Scholar] [CrossRef]
  16. Khidri, M.; Deng, L.J. Field axial cyclic loading tests of screw micropiles in cohesionless soil. Soil Dyn. Earthq. Eng. 2021, 143, 106601. [Google Scholar] [CrossRef]
  17. Zhu, B.-L.; Chen, Q.; Wu, X.-Y. Centrifugal Model Test Research on Mechanical Characteristics Micropile Groups Reinforcing Slope. J. Sichuan Univ. 2012, 44, 1–8. [Google Scholar]
  18. Pei, Z.W.; Zhang, Y.J.; Nian, T.K.; Song, X.L.; Zhao, W. Performance investigation of micropile groups in stabilizing unstable talus slopes via centrifuge model tests. Can. Geotech. J. 2022, 60, 351–365. [Google Scholar] [CrossRef]
  19. Chen, Z.; Shuai, S.; Pu, S.; Zhang, L.; Rao, J. Study on the ultimate flexural bearing capacityof micro anti-slide piles. J. Civ. Environ. Eng. 2019, 41, 59–66. [Google Scholar]
  20. Liu, X.L.; Liu, Y.S.; Liu, K.; Su, Y.Y. Experimental investigation on anti-sliding performance of grouted micro-pipe pile groups. Nat. Hazards 2022, 113, 1367–1384. [Google Scholar] [CrossRef]
  21. Liu, X.L.; Yan, J.K.; Liu, L.; Han, B. Large-Scale Model Test of a Micropile Group for Landslide Control. Adv. Civ. Eng. 2021, 2021, 6687124. [Google Scholar] [CrossRef]
  22. Li, N.; Men, Y.M.; Yuan, L.Q.; Gao, H.; Li, J.; Wang, B.Q. Study on the Mechanical Characteristic of Micropiles Supporting Landslide Under Step-Loadings. Geotech. Geol. Eng. 2020, 38, 2761–2771. [Google Scholar] [CrossRef]
  23. Sun, S.W.; Wang, J.C.; Bian, X.L. Design of micropiles to increase earth slopes stability. J. Cent. South Univ. 2013, 20, 1361–1367. [Google Scholar] [CrossRef]
  24. Sun, S.W.; Zhu, B.Z.; Wang, J.C. Design method for stabilization of earth slopes with micropiles. Soils Found. 2013, 53, 487–497. [Google Scholar] [CrossRef]
  25. Administration, F.H. Micropile Design and Construction; United States Department of Transportation: Dallas, TX, USA, 2005.
  26. Jia, J.; Wang, Z. Kinematic limit analysis method for micro-pile reinforced 3D trapezoidal slope. Arab. J. Geosci. 2022, 15, 1146. [Google Scholar] [CrossRef]
  27. Ads, A.; Bless, S.; Iskander, M. Shape effects on penetration of dynamically installed anchors in a transparent marine clay surrogate. Acta Geotech. 2023, 18, 3043–3059. [Google Scholar] [CrossRef]
  28. Zhou, C.; Ma, W.C.; Sui, W.H. Transparent soil model test of a landslide with umbrella-shaped anchors and different slope angles in response to rapid drawdown. Eng. Geol. 2022, 307, 106765. [Google Scholar] [CrossRef]
  29. Qi, C.G.; Zheng, J.H.; Zuo, D.J.; Chen, G. Measurement on soil deformation caused by expanded-base pile in transparent soil using particle image velocimetry (PIV). J. Mt. Sci. 2017, 14, 1655–1665. [Google Scholar] [CrossRef]
  30. Wang, Z.; Li, C.; Ding, X.M. Application of transparent soil model tests to study the soil-rock interfacial sliding mechanism. J. Mt. Sci. 2019, 16, 935–943. [Google Scholar] [CrossRef]
  31. Liu, C.; Tang, X.W.; Wei, H.W.; Wang, P.P.; Zhao, H.H. Model Tests of Jacked-Pile Penetration into Sand Using Transparent Soil and Incremental Particle Image Velocimetry. Ksce J. Civ. Eng. 2020, 24, 1128–1145. [Google Scholar] [CrossRef]
  32. Wang, Z.T.; Luo, G.Y.; Kong, G.Q.; Zhang, Y.; Lu, J.Q.; Chen, Y.; Yang, Q. Centrifuge model tests on anchor pile of single point mooring system under oblique pullout load using transparent sand. Ocean Eng. 2022, 264, 112441. [Google Scholar] [CrossRef]
  33. Tao, F.J.; Xu, Y.; Zhang, Z.; Ye, G.B.; Han, J.; Cheng, B.N.; Liu, L.; Yang, T.L. Progressive development of soil arching based on multiple-trapdoor tests. Acta Geotech. 2022, 18, 3061–3076. [Google Scholar] [CrossRef]
  34. Wei, L.T.; Xu, Q.; Wang, S.Y.; Wang, C.L.; Chen, J.F. Development of transparent cemented soil for geotechnical laboratory modelling. Eng. Geol. 2019, 262, 105354. [Google Scholar] [CrossRef]
  35. Kong, G.Q.; Li, H.; Wang, Z.T.; Wen, L. Comparison of dynamic properties between transparent sand and natural sand. Rock Soil Mech. 2018, 39, 1935–1940+1947. [Google Scholar] [CrossRef]
  36. Xiao, Y.; Sun, Y.F.; Yin, F.; Liu, H.L.; Xiang, J. Constitutive Modeling for Transparent Granular Soils. Int. J. Geomech. 2017, 17. [Google Scholar] [CrossRef]
  37. Chen, Q.; Dong, G.; Wang, C.; Zhu, B.; Zhao, X. Characteristics Analysis of Soil Arching Effect Behind Pile Based on Transparent Soil Technology. J. Southwest Jiaotong Univ. 2020, 55, 509–522. [Google Scholar]
  38. Sui, W.H.; Zheng, G.S. An experimental investigation on slope stability under drawdown conditions using transparent soils. Bull. Eng. Geol. Environ. 2018, 77, 977–985. [Google Scholar] [CrossRef]
  39. Wei, L.T.; Qiang, X.; Wang, S.Y.; Wang, C.L.; Xu, J. The morphology evolution of the shear band in slope: Insights from physical modelling using transparent soil. Bull. Eng. Geol. Environ. 2020, 79, 1849–1860. [Google Scholar] [CrossRef]
  40. Tehrani, F.S.; Han, F.; Salgado, R.; Prezzi, M.; Tovar, R.D.; Castro, A.G. Effect of surface roughness on the shaft resistance of non-displacement piles embedded in sand. Geotechnique 2016, 66, 386–400. [Google Scholar] [CrossRef]
  41. Tovar-Valencia, R.D.; Galvis-Castro, A.; Salgado, R.; Prezzi, M. Effect of Surface Roughness on the Shaft Resistance of Displacement Model Piles in Sand. J. Geotech. Geoenviron. Eng. 2018, 144, 04017120. [Google Scholar] [CrossRef]
  42. Kim, G.; Ham, K.; Lee, J. Effects of Surface Roughness on Lateral Load-Carrying Capacities of Piles Embedded in Sand. J. Geotech. Geoenviron. Eng. 2020, 146, 04020064. [Google Scholar] [CrossRef]
  43. Liu, C.; Tang, X.W.; Wei, H.W.; Zhao, H.H. A New Spatial Deformation Measurement Method Using 3D Reconstruction Technology during Pile Penetration. Ksce J. Civ. Eng. 2021, 25, 4106–4120. [Google Scholar] [CrossRef]
Figure 1. Schematic sketch of the physical model experiment (mm): (1 Camera, 2 Loading device, 3 PLC electrical box, 4 Load cell, 5 Acrylic model box, 6 Model pills, 7 Transparent soil, 8 Laser device).
Buildings 14 02753 g001
Figure 2. Model piles for transparent soil experiments: (a) No. 1 (0.1–0.2 mm); (b) No. 2 (0.2–0.5 mm); (c) No. 3 (0.5–1.0 mm); and (d) No. 4 (1.0–3.0 mm).
Buildings 14 02753 g002
Figure 3. Production of transparent soil.
Buildings 14 02753 g003
Figure 4. Synchronous motion track of camera and laser.
Buildings 14 02753 g004
Figure 5. Load displacement curves at different roughness values.
Buildings 14 02753 g005
Figure 6. Displacement cloud images of the soil with different pile roughness ((ad): loading displacement was 10 mm, (eh): loading displacement was 20 mm, (il): loading displacement was 30 mm, (mp): loading displacement was 40 mm).
Buildings 14 02753 g006aBuildings 14 02753 g006b
Figure 7. Load displacement curves at different pile spacings.
Buildings 14 02753 g007
Figure 8. Effect of pile spacing on soil arch ((ad): loading displacement was 10 mm, (eh): loading displacement was 20 mm, (il): loading displacement was 30 mm, (mp): loading displacement was 40 mm).
Buildings 14 02753 g008aBuildings 14 02753 g008b
Figure 9. Overlay of slices.
Buildings 14 02753 g009
Figure 10. Three–dimensional reconstruction of the soil behind the pile with different pile roughness. (a) No. 1 Rn = 0.081; (b) No. 2 Rn = 0.484; (c) No. 3 Rn = 0.806; (d) No. 4 Rn = 3.23.
Buildings 14 02753 g010
Figure 11. Three–dimensional reconstruction of the soil behind the pile at different pile spacing. (a) No. 5 D = 3 d; (b) No. 3 D = 5 d; (c) No. 6 D = 7 d; (d) No. 7 D = 9 d.
Buildings 14 02753 g011aBuildings 14 02753 g011b
Figure 12. Pile top displacement compared to pile diameter with different pile roughness.
Buildings 14 02753 g012
Figure 13. Pile top displacement compared to pile diameter with different pile spacing.
Buildings 14 02753 g013
Table 1. Specimen design details.
Experiment GroupExperimentPile Spacing DDiameter of Pasted Fused Quartz/mmNumber of PilesNormalized Roughness Rn
Group1No. 15 d0.1–0.240.081
No. 25 d0.2–0.540.484
No. 35 d0.5–1.040.806
No. 45 d1.0–3.043.230
Group2No. 53 d0.5–1.040.806
No. 35 d0.5–1.040.806
No. 67 d0.5–1.040.806
No. 79 d0.5–1.030.806
Disclaimer/Publisher’s Note: The statements, opinions and data contained in all publications are solely those of the individual author(s) and contributor(s) and not of MDPI and/or the editor(s). MDPI and/or the editor(s) disclaim responsibility for any injury to people or property resulting from any ideas, methods, instructions or products referred to in the content.

