Article

Finite Element Method Simulation Study on the Temperature Field of Mass Concrete with Phase Change Material

1
School of Transportation and Logistics Engineering, Shandong Jiaotong University, Jinan 250357, China
2
Key Laboratory of Sustainable Transportation of Yellow River Basin, Jinan 250357, China
3
School of Traffic Civil Engineering, Shandong Jiaotong University, Jinan 250357, China
*
Author to whom correspondence should be addressed.
Buildings 2024, 14(9), 2755; https://doi.org/10.3390/buildings14092755
Submission received: 11 August 2024 / Revised: 28 August 2024 / Accepted: 29 August 2024 / Published: 2 September 2024
(This article belongs to the Special Issue Applications of Phase Change Materials (PCMs) in Buildings)

Abstract

:
Phase change materials can be converted between solid, liquid, and gaseous states, absorbing or releasing a large amount of heat. PCM is incorporated into concrete to adjust the temperature difference between inside and outside of concrete, which can reduce cracking. In this paper, the finite element analysis method is used to establish the model of an ordinary concrete structure, doped with phase change materials, on the basis of mechanical properties and a temperature regulation test performed by calculating the adiabatic temperature rise of concrete with different contents of composite phase change material, comparing the experimental and simulation results of the ordinary concrete structures with phase change materials, and analyzing the change in temperature field of the concrete structure with the content of self-prepared composite phase change materials. It is found that the addition of self-prepared composite phase change materials reduces the temperature peak of the concrete structure in the stage of hydration heat and delays the time taken to reach the temperature peak. Then, the temperature field of the phase change mass concrete structure is established, and the influence law of composite phase change material admixture on the temperature field of mass concrete is summarized through the time–temperature curves of different admixture amounts and positions so as to predict the possibility of cracks in mass concrete.

1. Introduction

With the rapid development of national urban construction and transportation infrastructure, the requirements for transportation engineering materials are getting higher and higher. As an important building material, mass concrete is more and more widely used in the field of traffic engineering. Therefore, it is of great theoretical significance and practical value to discuss the application of mass concrete in traffic engineering.
Mass concrete structures usually require no tensile stress or only small tensile stress. However, during construction and operation, large tensile stress is often generated inside the structure due to its own temperature change, which causes cracks in the structure, destroys the integrity of the structure, reduces the durability of the structure, and brings great harm. It is also difficult to limit this kind of tensile stress within the allowable range [1]. Therefore, cracks have always been a common and difficult problem to deal with in the pouring construction of mass concrete.
Mass concrete structure cracks can also be divided into internal causes and external causes according to the causes [2]. The internal causes include the shrinkage of concrete, temperature change, load action, etc. The concrete will contract during the condensation process, resulting in stress inside the concrete. When the stress exceeds the strength of the concrete, it will cause cracks. Temperature changes [3] will also lead to changes in the volume of concrete, resulting in the generation of internal stress, resulting in cracks. The external causes include foundation settlement, earthquake, and other external environmental factors. Through the investigation and arrangement of the cracking causes of concrete engineering in recent years at home and abroad, it is found that non-load cracks [4] account for 80% of the cracking causes of concrete engineering, which are mainly caused by volume deformation, namely shrinkage and temperature. Therefore, based on the analysis of the causes of mass concrete cracking, it is urgent to find effective measures to prevent and improve cracking.
Phase change materials (PCMs) are a class of materials that can undergo physical changes in a specific temperature range and can be converted between solid, liquid, and gaseous states. Due to the phase transition principle that they can absorb or release a large amount of heat during the phase transition process [5], they have broad application prospects in energy storage, thermal insulation, building energy conservation, electronics, solar energy, and other fields. In recent years, in view of the problem of cracks in mass concrete caused by temperature, domestic and foreign researchers have incorporated phase change materials into concrete to absorb part of the heat generated by concrete hydration or release a certain amount of heat, reducing the temperature difference between the inside and outside of concrete so as to improve the cracking of mass concrete. Ding Han, combined with the existing theoretical calculation of the adiabatic temperature rise of phase change concrete, when comparing with the adiabatic temperature rise obtained by the prepared polyethylene glycol/jujube-core biological phase change concrete [6], found that the phase change material had a significant effect on the temperature control of concrete. It was concluded that, with the increase in the amount of phase change material, the temperature control effect of phase change material on concrete also increases. According to the basic theory of the adiabatic temperature rise of ordinary concrete, Wang [7] analyzed the adiabatic temperature rise process of phase change concrete, expounded the temperature control theory of phase change concrete, established the simulation calculation formula of the adiabatic temperature rise curve of phase change concrete, and simulated and analyzed the temperature field and stress field of the temperature control process by ANSYS, establishing the adiabatic temperature rise model of phase change temperature control concrete. The temperature rise process was divided into three sections, and the simulation calculation formula of adiabatic temperature rise was formed. The influence of initial temperature on a large volume was studied by Midas [8]. The simulation results show that, with an increase in initial temperature, the time of the internal temperature reaching the peak value is faster, the maximum temperature stress increases, and the temperature difference between the inside and outside also increases.
The research content of this paper is the influence of self-made phase change materials on the hydration of mass concrete and the finite element study of the temperature field of mass concrete.

2. Materials and Methods

2.1. Phase Change Materials

In this paper, palmitic acid and stearic acid organic phase change materials [9] were selected, and tetraethyl orthosilicate was used as the precursor of the silica sol system. The sol–gel method is used to prepare phase change materials. The principle is to form a sol system in the solution and to form a gel system with a specific structure and properties by controlling the gel process of the sol. The materials used in the test are shown in Table 1, and the phase transition properties of palmitic acid and stearic acid used in the test are shown in Table 2.

2.2. Concrete Material

2.2.1. Materia

According to the ‘ordinary concrete mix design specification’ JGJ55-2011 [10], the mix design of phase change concrete was carried out. The design strength grade was set to C30, the theoretical mix ratio was calculated, and then the concrete laboratory test was carried out. According to the actual working performance and strength of the trial concrete, the amount of raw materials was adjusted and the adjusted mix ratio was used as the actual mix ratio of this experiment. The raw materials required for the test are shown in Table 3, and the actual mix ratio design of concrete is shown in Table 4.

2.2.2. Equipment

(1)
Specimen mold: The thermodynamic thermostat performance test uses a 300 × 300 × 300 mm3 plastic mold, as shown in Figure 1a;
(2)
A-BF multi-channel temperature recorder: Dongguan Bufan Electronic Co., Ltd (Dongguan Guangdong China)., as shown in Figure 1b;
(3)
High- and low-temperature test chamber BC1300: Shanghai Yiheng Technology Co., Ltd (Shanghai China)., as shown in Figure 1c.

2.3. Finite-Element Modeling

Midas FEA NX 2022 is a software in the field of Midas simulation. It is the only non-linear and detailed analysis software for civil engineering in all Chinese cultures. Its geometric modeling and meshing technology adopt the core technology of the pre-processing and post-processing software Midas FEA NX 2022, which has been widely used in the field of civil engineering, and integrates the powerful linear and nonlinear analysis kernel of Midas. A special module is set up for the analysis of hydration heat, which simplifies the simulation analysis of the temperature field of the mass concrete structure. In order to ensure the safety and stability of the mass concrete structure, it is of great significance to use finite element simulation software to simulate and analyze it [11,12].
The analysis process and steps of the finite element simulation software FEA in terms of temperature field are as follows:
(1)
Modeling: first of all, it is necessary to establish a three-dimensional model, including a structural model and material model. In the model, it is necessary to define the characteristics of the material itself, such as thermophysical parameters, thermal conductivity, specific heat capacity, etc.;
(2)
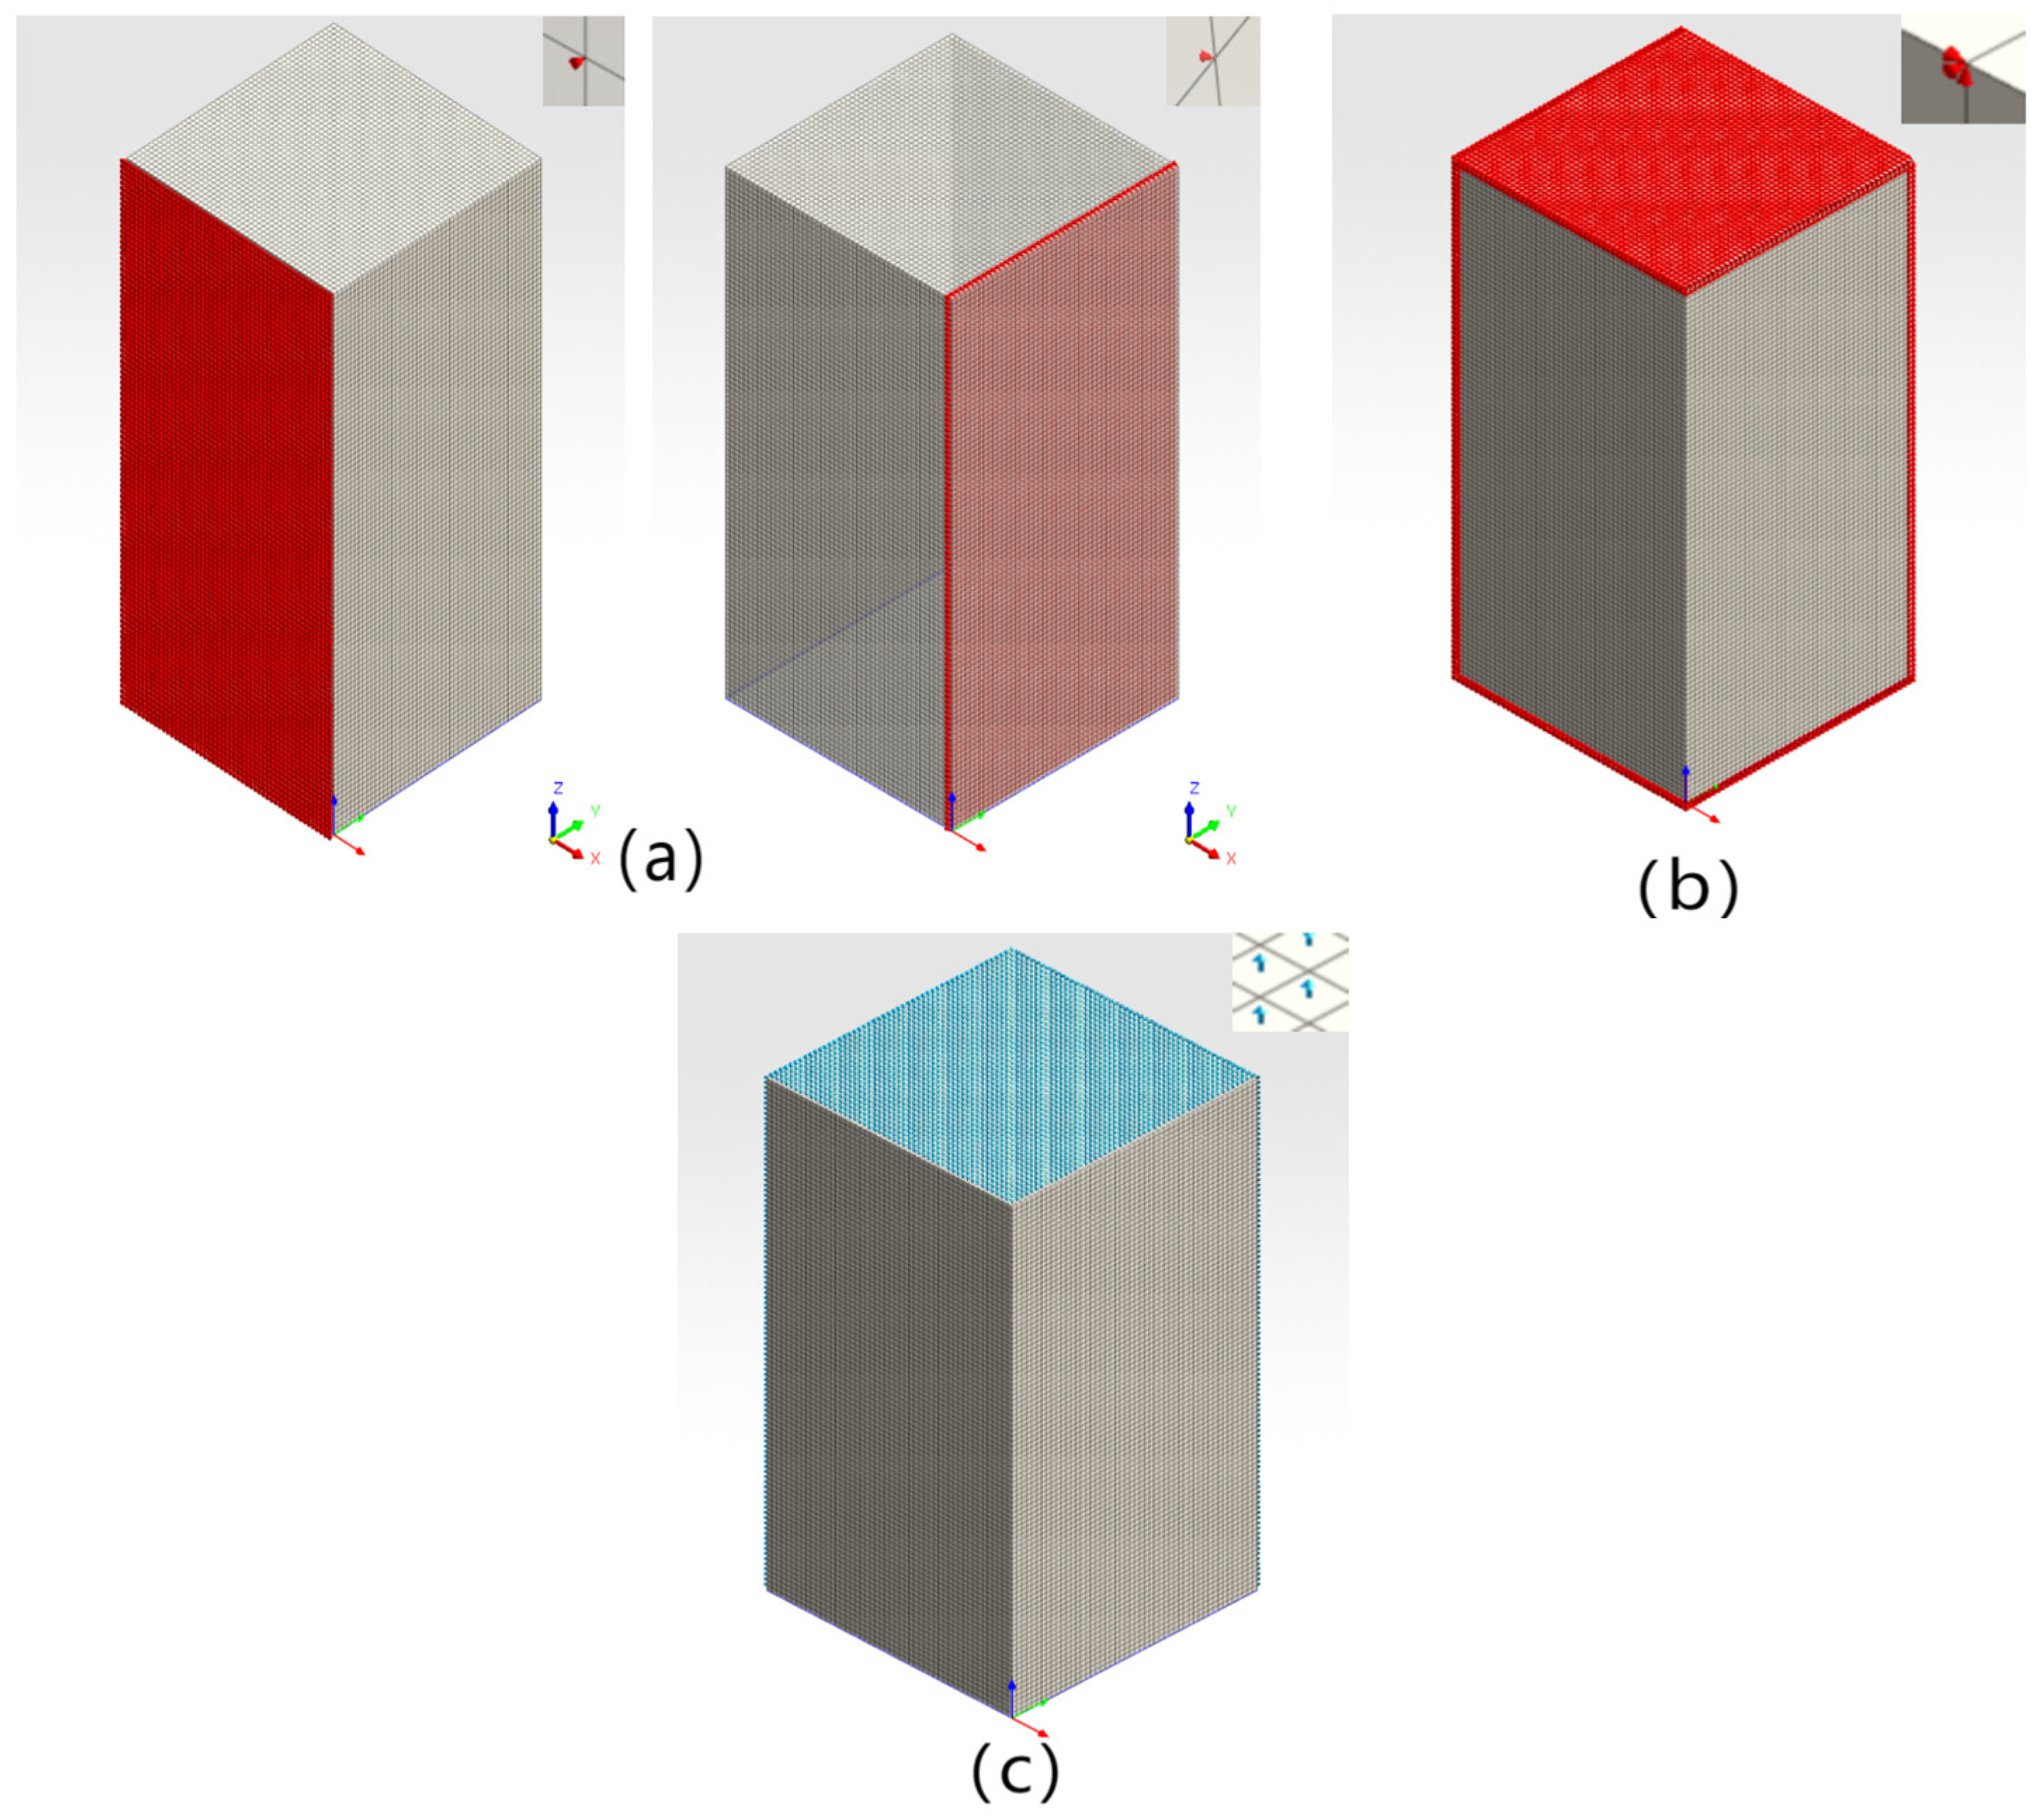
Setting boundary conditions: setting the boundary conditions of the model, including the boundary conditions of the structure and the boundary conditions of the analysis, such as the application of thermal loads. Different boundary conditions need to be set in different parts of the model to simulate the heat transfer process in practical engineering;
(3)
Define the construction management stage: define the time step and time course in the analysis process to ensure the accuracy and reliability of the analysis results;
(4)
Thermal analysis: the temperature field analysis, which is used to simulate the transient temperature field of the temperature change effect with time;
(5)
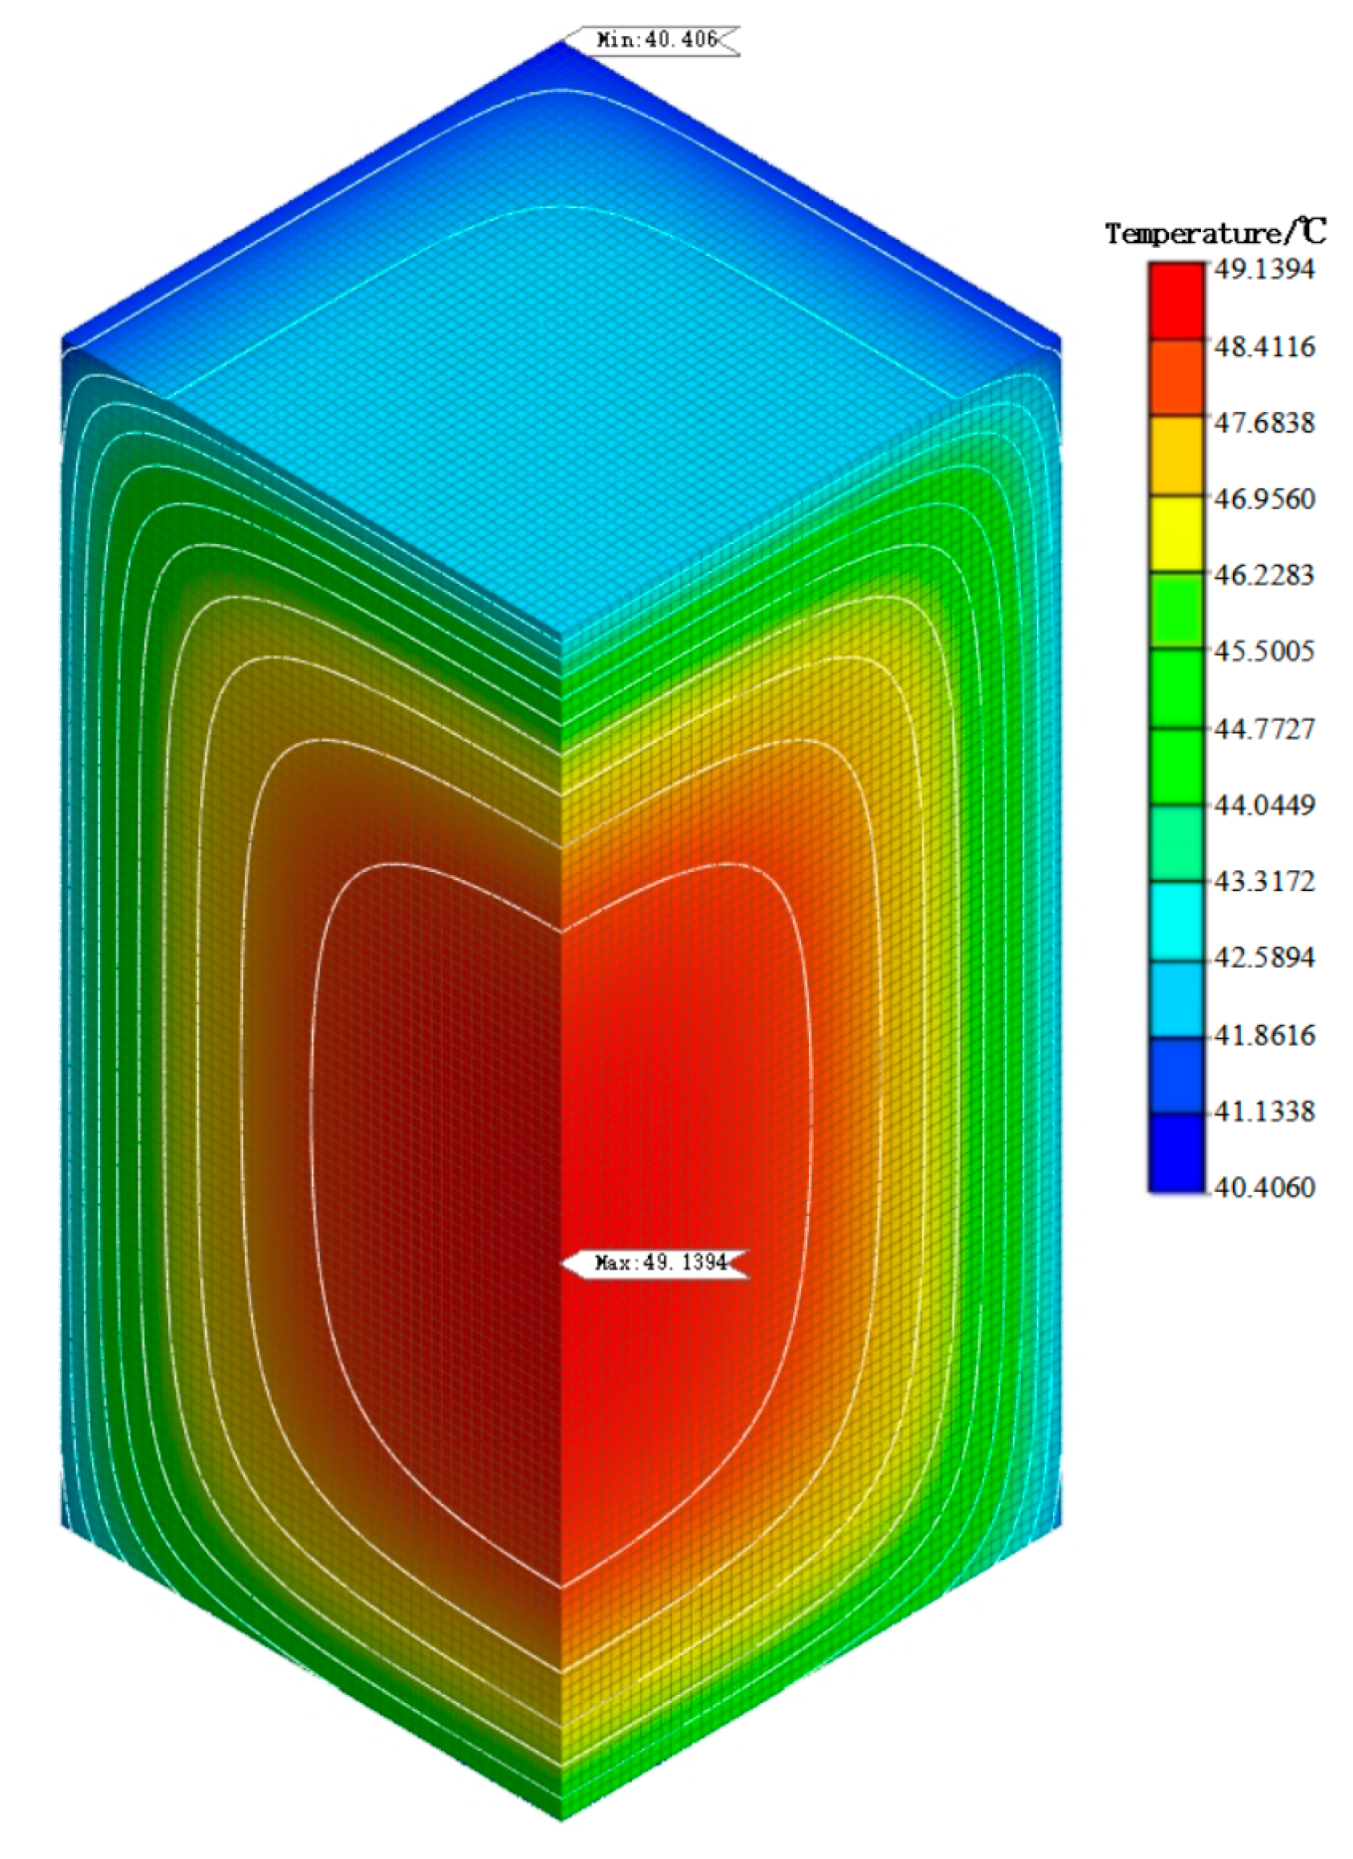
Results post-processing: view and post-process the analysis results of the calculated temperature values, including drawing temperature cloud maps, temperature change maps, etc.
In this paper, based on the principle of phase change, a self-prepared composite phase change material suitable for adjusting the hydration heat of mass concrete is added to ordinary concrete, and phase change concrete with energy storage and temperature regulation functions is successfully prepared. The finite element simulation software FEA is used to simulate the temperature field. Comparing the experimental data with the simulation data, it is found that the temperature change trend of the two is basically the same. Therefore, the simulation method used in this paper is highly effective and feasible for the simulation of the temperature field of ordinary concrete mixed with phase change materials; then, this simulation method is used to simulate the temperature field of mass concrete. It is shown that the addition of phase change materials reduces the temperature peak of concrete in the hydration heat stage and delays the time taken to reach the temperature peak. It alleviates the problem of increasing temperature stress due to excessive internal and external temperature gradients and reduces the possibility of cracks caused by temperature stress exceeding structural design stress. It provides a research basis and reference for the temperature field simulation of concrete mixed with phase change materials in the future.

3. Preparation and Properties of Phase Change Materials

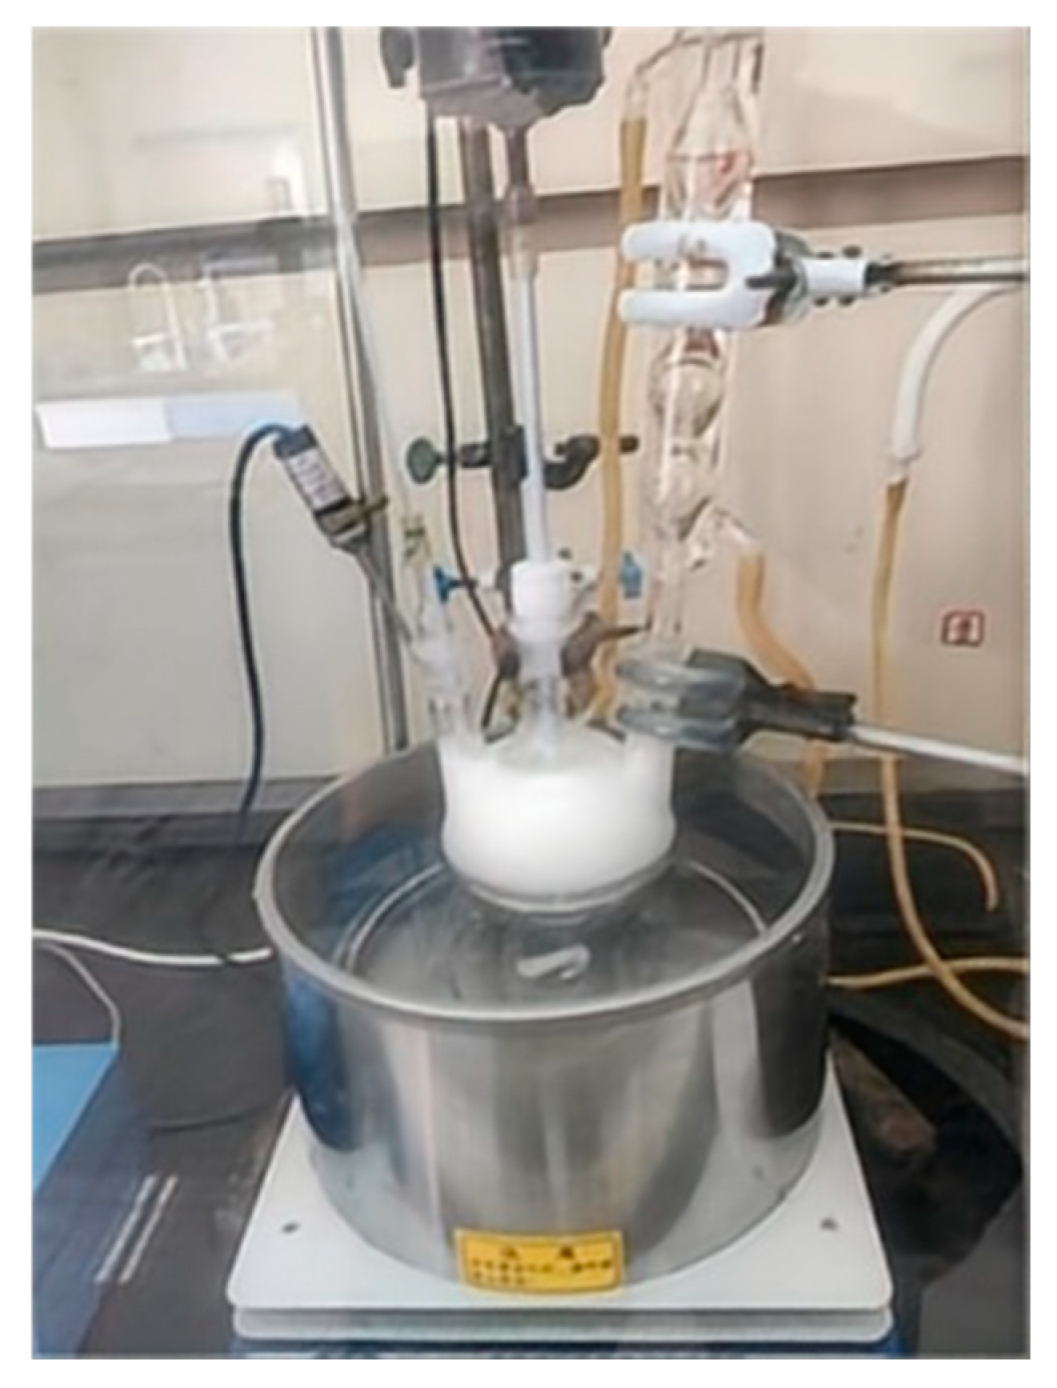
3.1. Preparation of Phase Change Materials

Based on the experimental research of the existing literature [13], the experimental scheme is as follows: tetraethyl orthosilicate, ethanol, and distilled water were taken in three flasks in proportion, and the preparation process was as shown in Figure 2. The mixture was first heated in an oil bath at 60 °C and slowly stirred for 30 min, and then an appropriate amount of hydrochloric acid was added to the flask to adjust the pH to 2–3, and then stirring continued for 6 h. The mixture of palmitic acid and stearic acid was added to the flask after melting. After 30 min of high-speed stirring, an appropriate amount of ammonia was slowly added to adjust the pH of the solution to about 7, and then stirring was continued for 30 min to make it naturally aged to room temperature. Finally, the mixture left in the flask was filtered, washed, and dried to constant weight, and the obtained white powder was a composite phase change material (Figure 3).

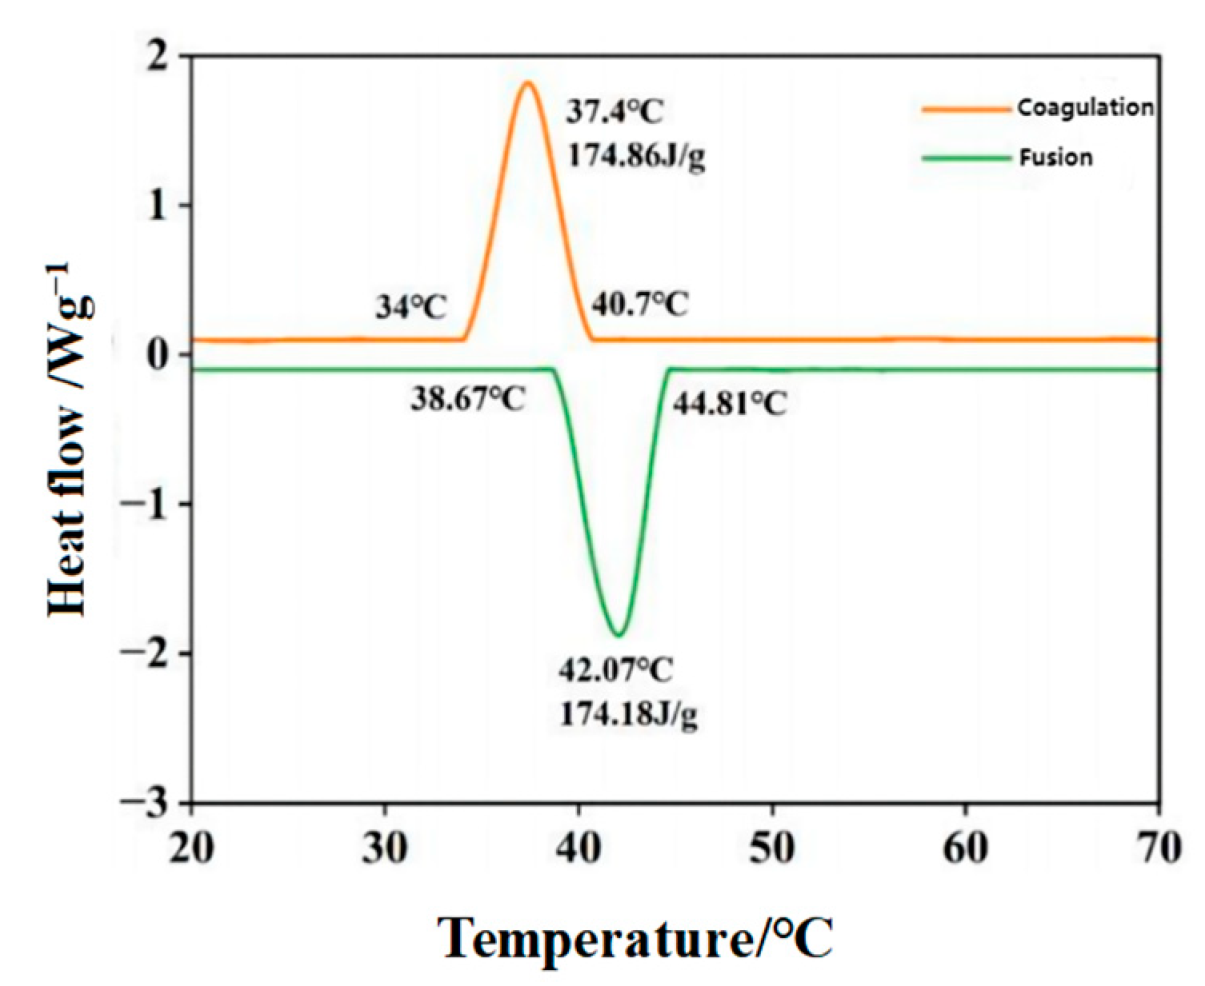
3.2. Phase Transition Properties

Differential scanning calorimetry (DSC) [14] can be used to reflect the phase change characteristics of phase change materials. A differential scanning calorimeter can be used to measure the relationship between enthalpy change and temperature or time due to changes in physical and chemical properties of samples. The phase change temperature and phase change enthalpy of the self-prepared composite phase change material were determined by DSC. The phase change temperature determines the application environment of the material and the phase change enthalpy determines the ability of the same material to absorb or release heat under the condition of unit mass. The phase change temperature and latent heat of phase change materials without a phase change cycle and after 50 phase change cycles were tested by a Swiss Mettler DSC3 (Beijing Huiyi Technology Co., Ltd., Beijing, China) differential scanning calorimeter. Nitrogen was used as the protective gas, the purge rate was 50 mL/min, the test temperature range was −20~60 °C, and the test speed was 2 °C/min.
From the DSC test results of the self-prepared composite phase change material in Figure 4, it can be seen that the enthalpy value in the phase change process is about 170 J/g. The material begins to absorb heat when the temperature reaches about 38.67 °C in the heating environment, which reduces the temperature. The material begins to release heat when the temperature reaches about 40.7 °C in the cooling environment, which increases the temperature.

4. Study on Performance of Phase Change Concrete

4.1. Mechanical and Temperature Tests of Ordinary Concrete Mixed with Phase Change Materials

In recent years, research on the performance of concrete mixed with phase change materials is a research direction that has attracted much attention in the engineering field. As an artificial material with reversible phase change characteristics, phase change materials can absorb or release a large amount of heat when external conditions (such as temperature) change so as to achieve the purpose of temperature regulation. The application of phase change materials in concrete can not only improve the thermal insulation performance of concrete but also realize the intelligent temperature control function and provide a new solution for the energy saving and comfort of buildings [15]. This chapter will discuss the influence of different contents of composite phase change materials on the performance of concrete, including mechanical properties and temperature regulation performance. Through systematic experimental research and data analysis, the relationship between the content of phase change materials and the performance of concrete is analyzed so as to provide theoretical guidance and practical basis for the application of phase change concrete. Referring to the existing literature [16], this experiment selects the direct mixing method to prepare phase change concrete. Firstly, the self-prepared composite phase change material is mixed with fine material, and then it is mixed with aggregate. Among them, the content of phase change materials is 0 wt%, 0.5 wt%, 1 wt%, 2 wt%, and 3 wt% of the total mass of concrete. The phase change concrete specimens of 3 d, 7 d, and 28 d ages were prepared. The results of compressive and flexural strength tests under normal curing conditions, high-temperature cycle conditions, and high- and low-temperature cycle conditions were as follows.
From Figure 5, it can be seen that, with the increase in the content of composite phase change material, the compressive and flexural properties of concrete gradually decrease, which is consistent with the results of the existing literature [16]. This phenomenon is mainly due to the fact that the addition of self-prepared composite phase change material will reduce the contact area between cementitious material and aggregate. The decrease in the contact surface leads to a decrease in the adhesion between the cement mortar and the aggregate, increases the gap between the cement mortar and the aggregate, makes the overall compactness of the concrete worse, and finally destroys the compressive and flexural properties of the concrete. Therefore, the overall compactness and partial adhesion of phase change concrete need to be improved. It can be seen from Figure 6 that, after 50 high-temperature cycles, the compressive and flexural strength of the phase change concrete specimens did not change significantly. From Figure 6 and Figure 7, it can be seen that, with the increase in the content of self-prepared composite phase change material, the strength of concrete specimens after the high-temperature cycle and high- and low-temperature cycle gradually decreases. It can be seen that the high-temperature cycle and high- and low-temperature cycle have no obvious effect on the compressive and flexural strength of phase change concrete, and the increase in curing time and the conditions of high-temperature curing will also increase the strength of concrete. Therefore, the concrete specimens mixed with self-prepared composite phase change material can still maintain good mechanical properties after 50 high-temperature cycles and 20 high- and low-temperature cycles.
Combined with the mechanical properties test, the temperature-regulating performance test of concrete containing 0 wt%, 0.5 wt%, and 1 wt% phase change material was carried out. Due to the limited test conditions, the concrete temperature regulation test used a scale test block with a volume of 300 × 300 × 300 mm3 to simulate the mass concrete in advance. Through the control of specimen insulation and heat insulation, the hydration heat and temperature change processes of mass concrete were approached. The effect of self-prepared composite phase change temperature-regulating material on the temperature control of the early cement hydration heat of concrete was studied. The temperature field was simulated by finite element simulation software, and the temperature regulation effect of self-prepared composite phase change material on the two temperature rise stages of concrete specimens was explored. The temperature change caused by the cement hydration of concrete specimens of phase change materials was monitored and analyzed. There are four embedded points in total. There are three monitoring points from top to bottom along the center of the specimen. The first monitoring point is 0.1 m away from the outer surface of the upper layer. The second monitoring point is located at the center position. The third monitoring point is 0.1 m away from the bottom surface. The center point is 0.1 m away from the outer side at the same height; that is, the center point of the side is also set at a monitoring point. The concrete specimens were named ‘TW-x’, and the content of phase change materials was 0 wt%, 0.5 wt%, and 1 wt%.
It can be seen from Figure 8 that the temperature change trend caused by the early hydration heat of all concrete specimens is basically the same: with an increase in age, the internal temperature of concrete specimens gradually increases, and, after reaching a certain peak, it slowly decreases and tends to be gentle. This phenomenon is consistent with the overall change trend of cement hydration heat temperature rise. From the diagram, it can also be found that, with an increase in the content of the self-prepared composite phase change material, the increase in the temperature until it reaches the peak value is slowed down, the time taken to reach the maximum temperature is longer, and the temperature peak value is lower. This shows that after the self-prepared composite phase change material is formed in the concrete specimen, the cement hydration releases heat and causes the internal temperature of the concrete specimen to rise. The self-prepared composite phase change material reaches the phase change temperature range and absorbs a part of the heat generated by the hydration heat; during the cooling process, the cooling rate of concrete specimens TW-0.5 and TW-1 with composite phase change materials is significantly slower than that of concrete specimen TW-0 without phase change materials due to the decrease in peak value.
The addition of composite phase change materials slows down the temperature rise rate and drop rate inside the concrete specimen and its temperature peak is reduced, which will effectively prevent the temperature crack caused by the tensile stress caused by the rapid temperature rise and drop rate of the concrete [17]. This phenomenon shows that the self-prepared composite phase change material plays a role in the regulation of the early hydration heat of concrete. Comparing the internal temperature changes of concrete under three dosages, it is found that, in the early temperature rise stage of concrete hydration heat, the internal temperature trends of all concrete specimens are basically the same: the bottom temperature is the highest, the internal center temperature is the second, and the side temperature and top temperature are lower. The self-prepared composite phase change material not only has a certain control effect on the temperature rise of early cement hydration heat but also has a significant delay effect on the time taken to reach the highest temperature during the temperature rise process. The addition of self-made composite phase change materials can reduce the overall temperature rise and temperature drop rate of concrete and slow down the increase in temperature difference between inside and outside of the concrete. Therefore, the possibility of cracks in concrete specimens due to the increase in tensile stress caused by temperature is reduced.

4.2. Temperature Field Simulation of Ordinary Concrete Structure with Phase Change Materials

4.2.1. Model Construction and Parameter Setting

In this section, the finite element analysis Midas FEA NX 2022 simulation software is used to analyze the hydration heat of the concrete model. According to the results of the thermodynamic temperature adjustment test in the previous section, due to the symmetry of the concrete specimen structure, in order to facilitate the calculation and processing of the results, one-quarter of the structure is taken to establish the model, a 0.15 × 0.15 × 0.30 m3 concrete specimen model is constructed, and the mesh is divided into 0.01 m sections. The setting environment is a high temperature of 40 °C, the initial temperature of concrete is 25 °C, and the concrete material parameters are set according to the characteristics of the test material, as shown in Table 5.

4.2.2. Boundary Condition Setting

This section mainly studies the temperature field of ordinary concrete and analyzes the solid element and the set boundary conditions. The model is established based on the results of the temperature adjustment test in the previous section. As shown in Figure 9, the BC surface in the model is two adjacent surfaces outside the specimen: the A surface is the top surface of the specimen, and the F surface is the bottom surface of the specimen. The bottom of the contact test box, the two rectangular planes D and E shown in Figure 9, are two inner sections of the model, which are set as symmetrical boundaries, and the ABCF surface is a fixed boundary. After that is the setting of thermal load. This step only considers the convection boundary and heat source, without considering the self-weight of the structure. The ABC plane considers the convection boundary of the air. The heat source of ordinary concrete is calculated according to the composite index model (Formula (1)) proposed by academician Zhu Bofang [19]. The heat source of phase change concrete is calculated by the formula (Formula (2)) of the adiabatic temperature rise model [7] derived from the existing literature. Thus, the setting of boundary conditions is completed.
T ( t ) = Q 0 c ρ ( 1 e m t )
In the formula, Q0 is the final heat release of cement, kJ·kg−1; m is the heat release rate constant of cement; t is the age, d; c is the specific heat capacity of concrete, and its unit is kJ·kg−1·°C; ρ is the density of concrete, kg·m−3.
{ T ( t ) = Q 0 c ρ ( 1 e m t ) ( 0 t t 1 ) T ( t ) = T 0 ( t 1 t t 2 ) T ( t ) = Q 0 e m t 1 M p q c ρ { 1 exp [ a T 0 b ( t t 2 ) c ] } ( t > t 2 )
In the formula, Q0 is the final heat release of cement, kJ·kg−1; Mp is the mass of phase change material, kg; q is the latent heat of phase change material, kJ·kg−1; b and c are constants.

4.2.3. Simulation Analysis of Early Hydration Heat Temperature Field

From the beginning of concrete pouring to the end of hydration heat release, there is an obvious heat dissipation process in the early stage. The mechanical properties and thermal properties of concrete during the pouring period change dramatically with time. This period is also the focus of our test and simulation. Midas FEA NX 2022 software is used to solve and analyze the operation of the mass concrete structure, obtain the relevant data of the mass concrete temperature field, simulate the one-time pouring of this structure, define a hydration heat construction stage [20], and activate the fixed boundary, symmetrical boundary, convection boundary, and heat source function at one time. When calculating the temperature field, the solution time step is 4 h, and the solution time history is set to 172 h. When extracting the results, the consistency of the nodes should be ensured, so the temperature field data at the same point should be taken.
Combined with the cement hydration heat, concrete adiabatic temperature rise test law, and 2.1 concrete temperature regulation test data, it can be seen that the concrete in the non-adiabatic state can reach the maximum temperature rise in 3–7 days, and then the temperature begins to decrease. The temperature data after the temperature tends to stability within 172 h are extracted and the temperature history curve is drawn. At the same time, combined with the concrete temperature regulation test, four nodes at the same position are selected. Among them, No. 4202 node is located in the center of the structure, reflecting the temperature change of the center of the structure, No. 618 node reflects the temperature change of the bottom surface, No. 4216 node reflects the temperature change at the height of the side center, and No. 7786 node reflects the temperature change of the top surface near the air. F-0, F-0.5, and F-1 represent the simulated specimens of phase change concrete with 0%, 0.5%, and 1% self-made composite phase change materials, respectively.
Figure 10, Figure 11 and Figure 12 are the temperature nephograms of No. 4202 node in F-0, F-0.5, and F-1 during the whole time course. From the diagram, it can be seen that, in the same time course, the highest temperature of ordinary concrete is 44.74 °C, and the lowest temperature is 40.40 °C; the highest temperature of phase change concrete with 0.5% phase change material is 44.26 °C, and the lowest temperature is 40.37 °C. The highest temperature of phase change concrete with 1% phase change material is 42.87 °C, and the lowest temperature is 40.24 °C. This shows that, with the increase in the content of self-prepared composite phase change material, the peak temperature of concrete gradually decreases. Therefore, it is considered that the maximum temperature rise inside the phase change concrete with 1% content in this period of time is about 2 °C lower than that inside the ordinary concrete, and the temperature difference is about 2 °C lower than that of the outer concrete. This shows that the self-prepared composite phase change material has certain feasibility and effectiveness for the temperature control simulation of the temperature field of the concrete structure.
Figure 13 is the temperature change curve of 4202, 618, 4216, and 7786 nodes of phase change concrete when the contents of ordinary concrete and phase change material are 0.5% and 1%. Figure 14 shows the temperature change of 4202 node in F-0, F-0.5, and F-1. It can be seen from Figure 13 that the overall temperature change trend of ordinary concrete and phase change concrete is consistent. As the cement hydrates, the temperature continues to rise. When the phase change point of the self-prepared composite phase change material is reached, the self-prepared composite phase change material undergoes phase change and begins to absorb heat. It can be seen from the diagram that the overall temperature of the four nodes selected in the phase change concrete is lower than that of the ordinary concrete, and, with the increase in the content of the composite phase change material, the overall temperature is lower. When ordinary concrete and phase change concrete reach the highest temperature point, the temperature begins to decline slowly, and the cooling rate of phase change concrete is lower than that of ordinary concrete. In the process of heating and cooling, the temperature gradient of phase change concrete is smaller than that of ordinary concrete, and the decrease in temperature change range reduces the possibility of temperature cracks.
From the change rule of 4202 node temperature history in Figure 14, it can be seen that the maximum temperature rise inside the phase change concrete is 2.3 °C lower than that inside the ordinary concrete. Therefore, the addition of phase change materials effectively reduces the maximum temperature rise of concrete and the internal and external temperature difference of the structure, which can effectively avoid the possibility of reducing temperature cracks. Comparing the experimental results of temperature regulation, it can be seen that the simulation method in this section is consistent with the temperature regulation effect of self-prepared composite phase change materials in concrete [21], indicating the feasibility of the method in this section to simulate the temperature field of the concrete structure, thus continuing to simulate the temperature field of the mass concrete structure.

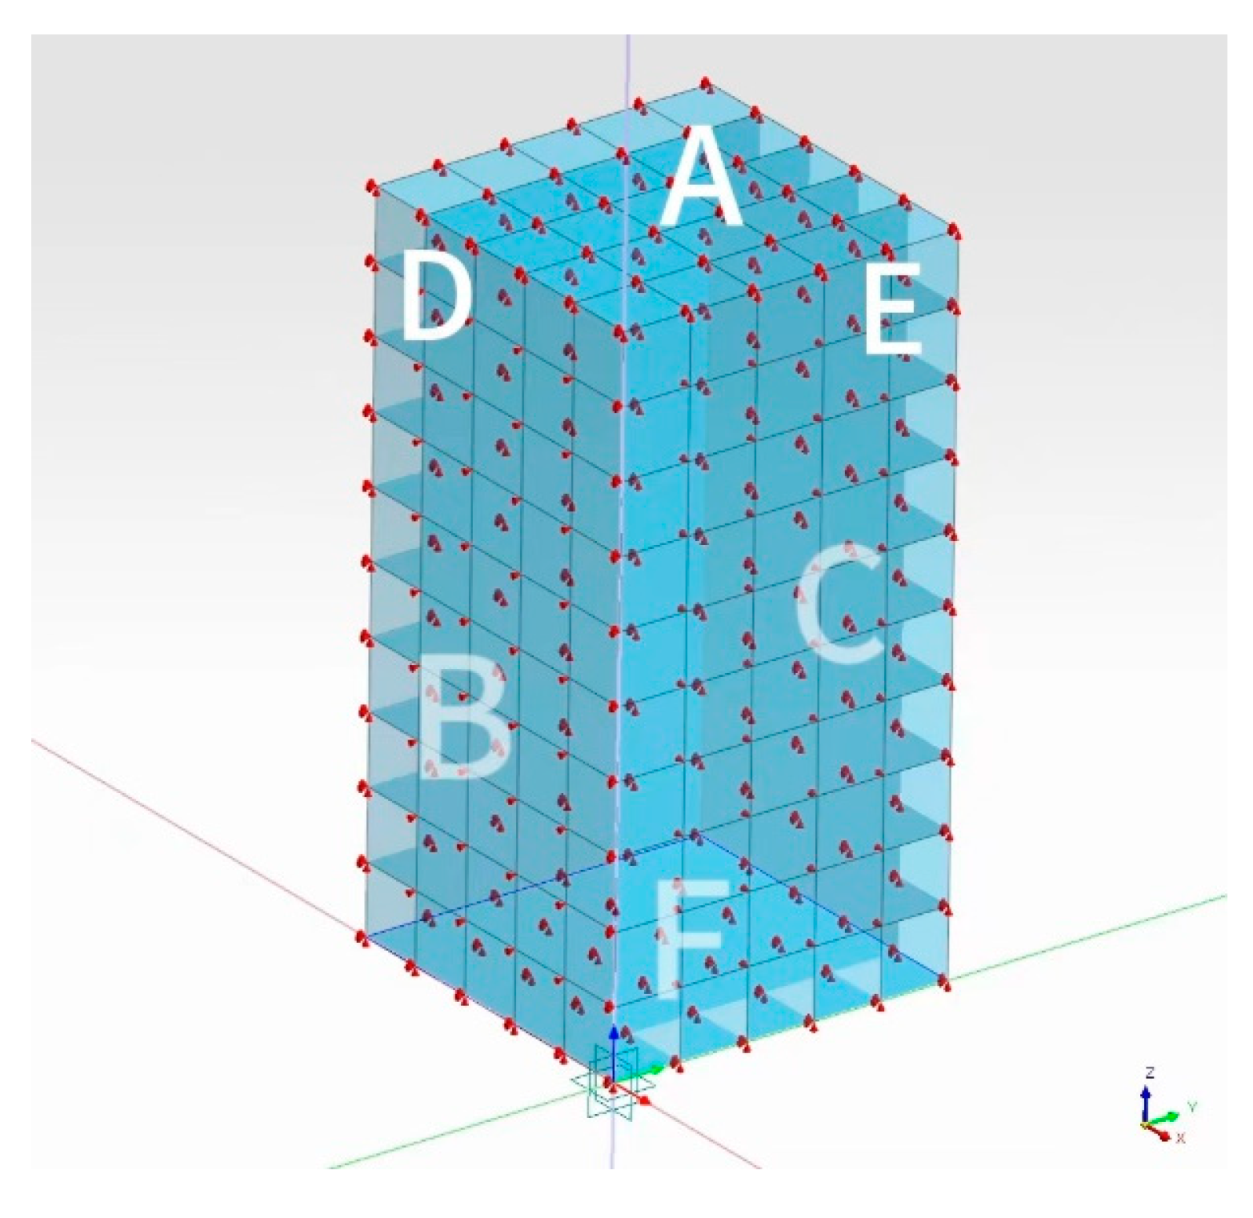
5. Temperature Field Simulation of Mass Concrete Structure with Phase Change Materials

5.1. Model Construction and Parameter Setting

According to the results of Section 4, a 1 × 1 × 1 m3 mass concrete specimen was constructed, and a one-quarter model was established. The structure size was 0.5 × 0.5 × 1 m3, and the grid was divided into 0.01 m sections. The parameter settings are consistent with Table 5.

5.2. Boundary Condition Setting

This section mainly studies the temperature field of mass concrete and sets the solid element and its boundary conditions. In the model establishment, the two adjacent inner sections inside the model are set to symmetrical boundaries, as shown in Figure 15a. The four surfaces of the two adjacent surfaces on the outside of the specimen, the top surface of the specimen, and the bottom surface of the specimen are set as fixed boundaries, as shown in Figure 15b. After that is the setting of thermal load. This step only considers the convection boundary and heat source and does not consider the self-weight of the structure. The two adjacent surfaces outside the specimen, the top surface of the specimen, and the bottom surface of the specimen consider the convection boundary of the air, as shown in Figure 15c. The adiabatic temperature rise is consistent with the 2.2 calculation method.

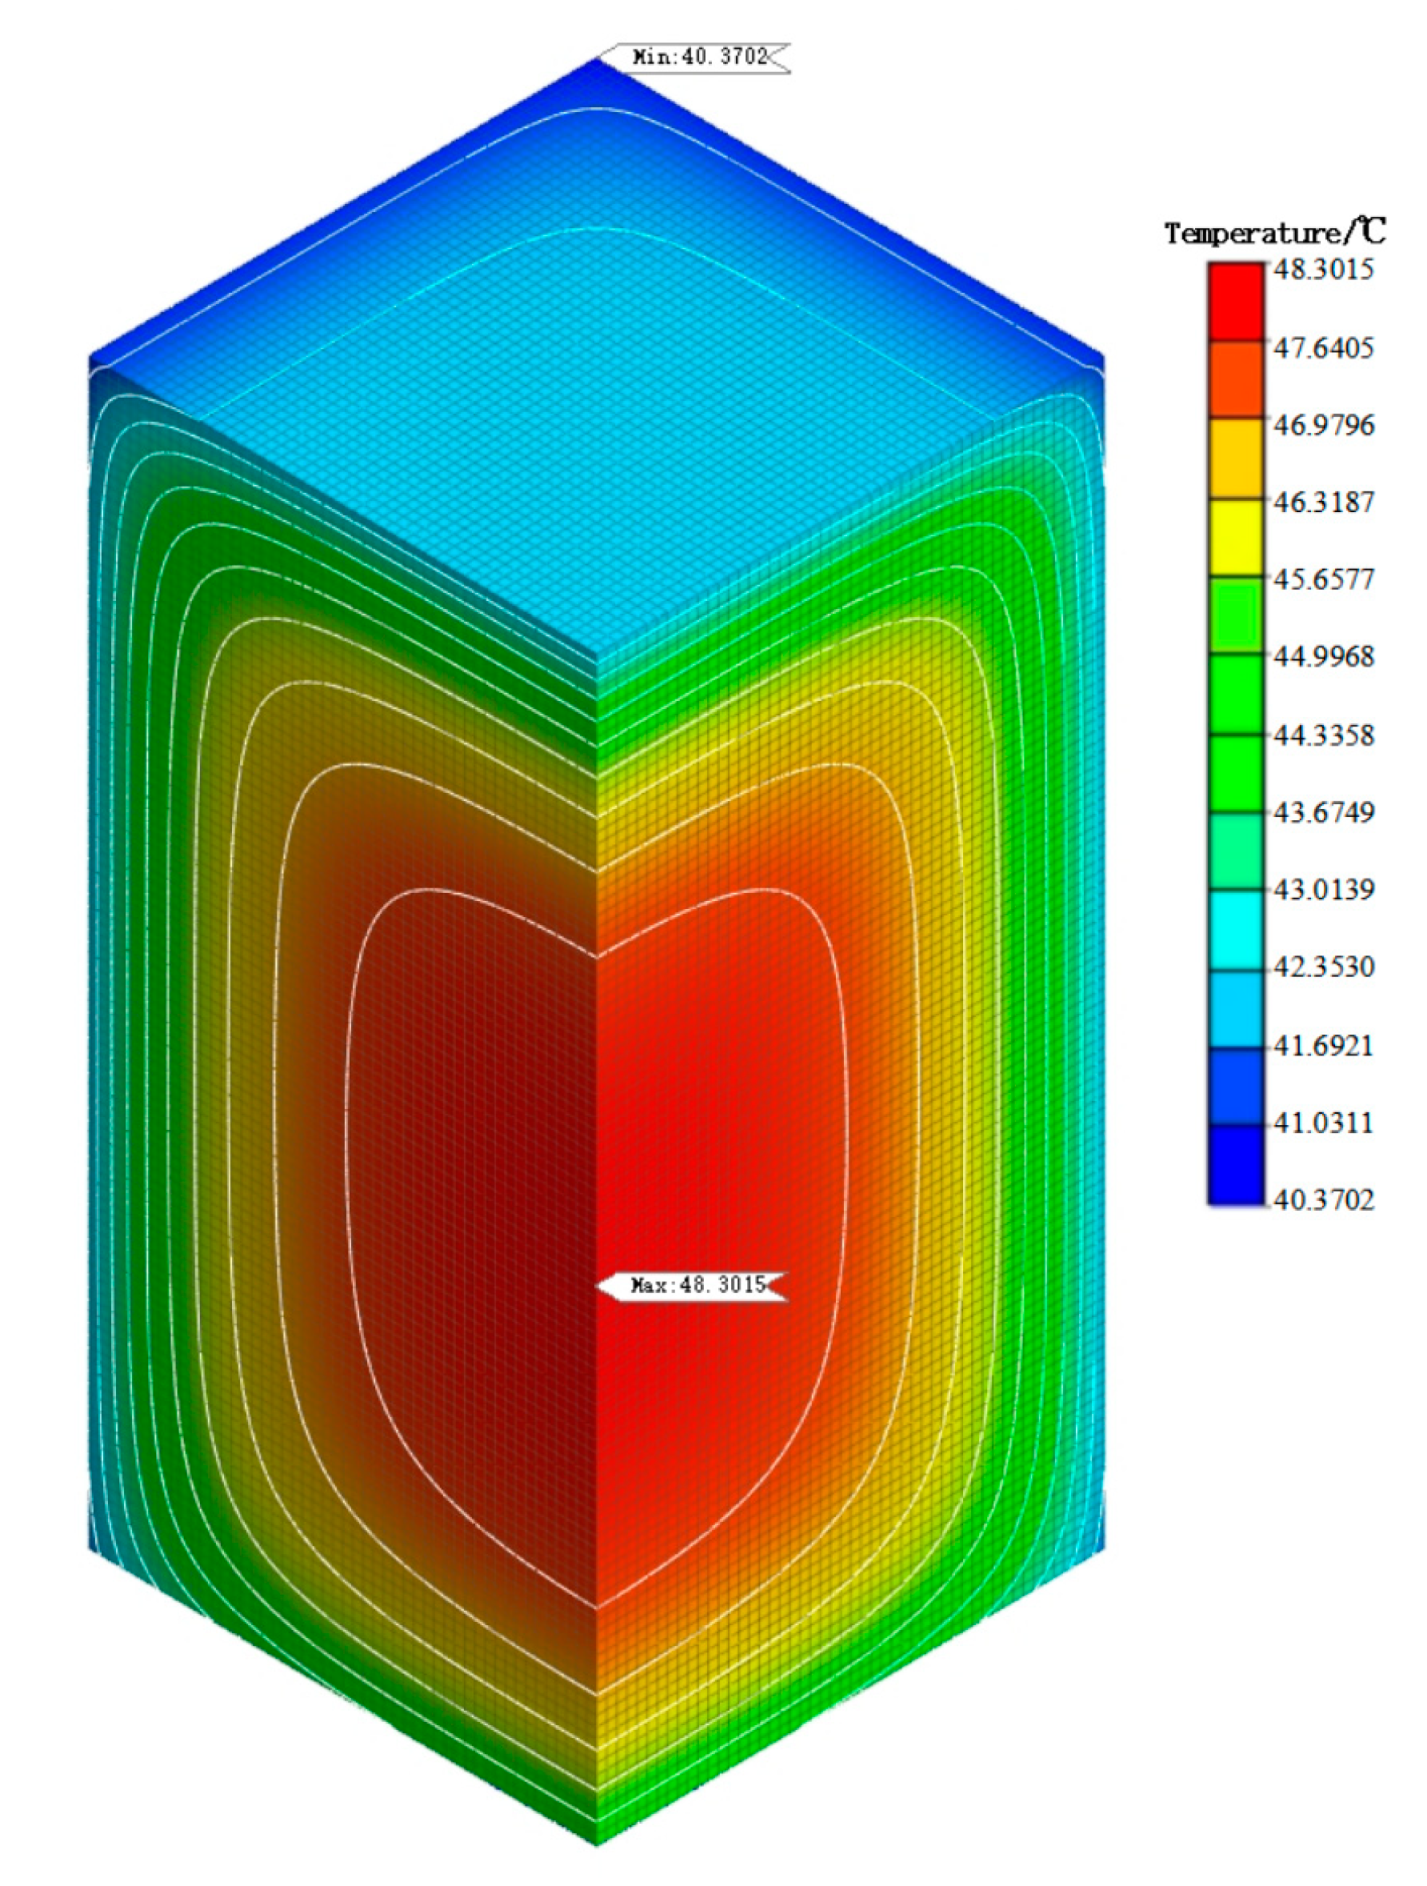
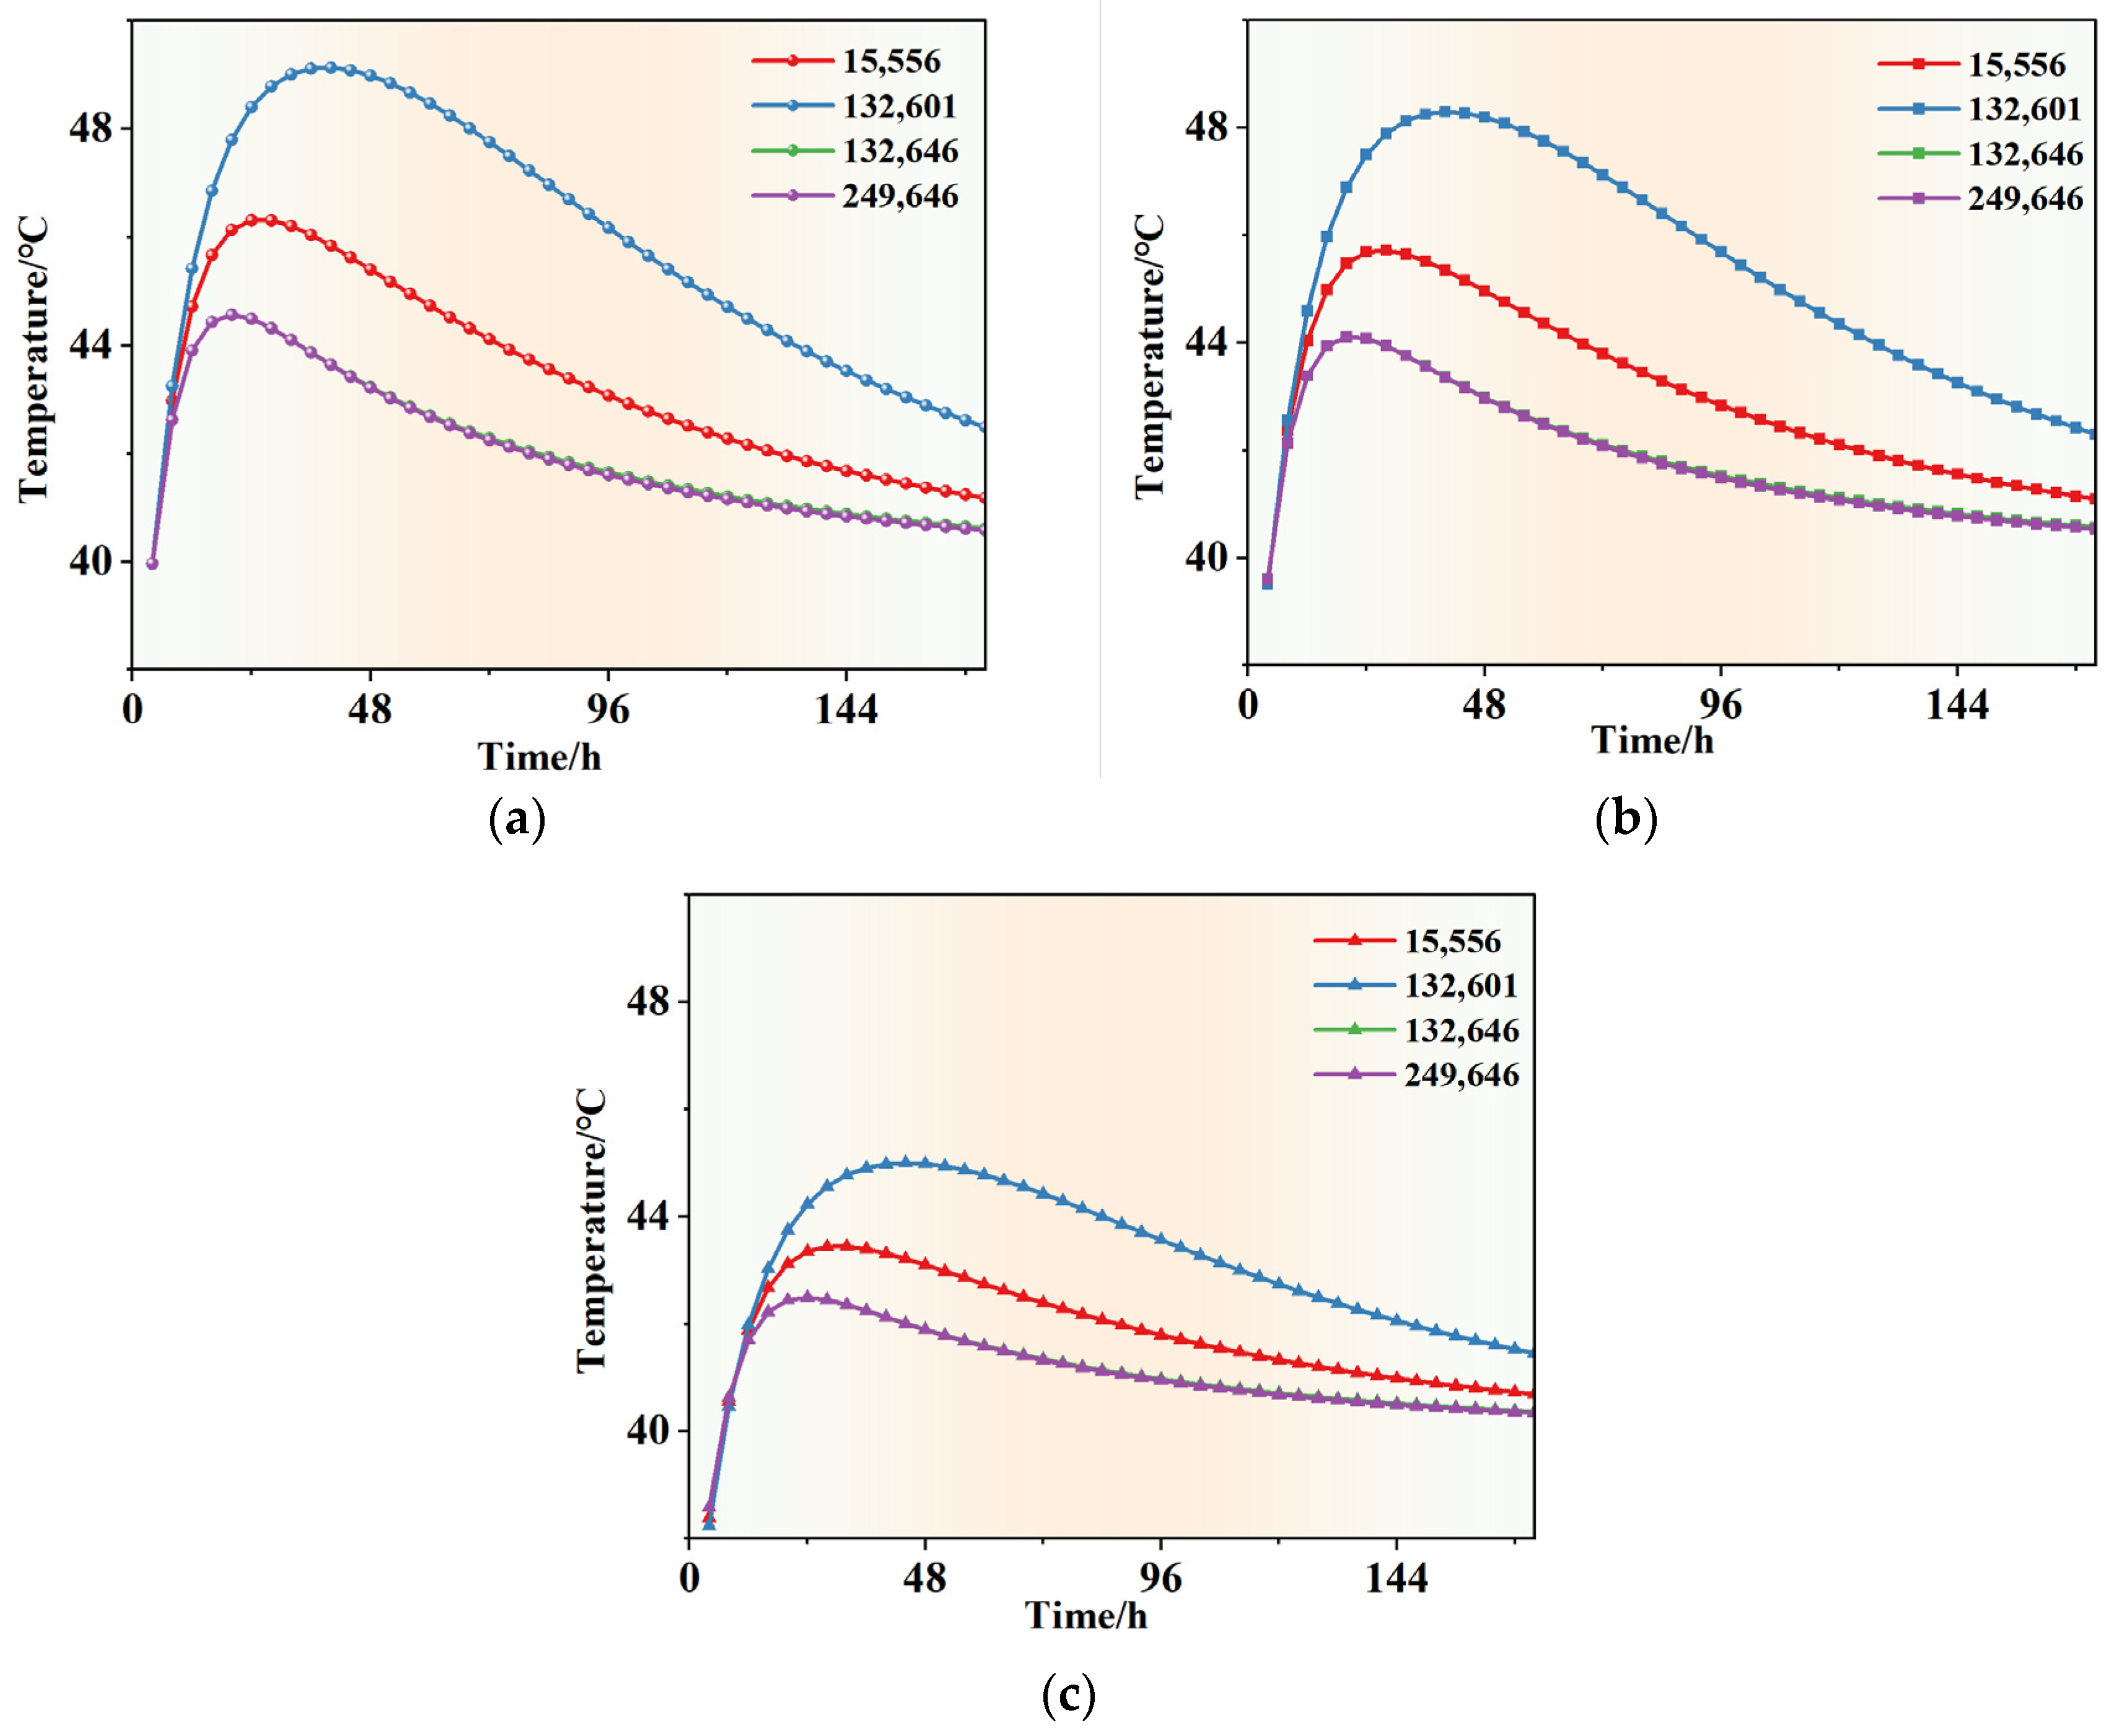
5.3. Simulation Analysis of Early Hydration Heat Temperature Field

The temperature history data of the mass concrete structure model constructed in this section after the temperature stabilized in the whole 172 h are all extracted and the temperature history curve is drawn. At the same time, four nodes in the same position are selected. Among them, No. 132601 node is located in the center of the structure, reflecting the temperature change of the center of the structure, No. 15556 node reflects the temperature change of the bottom surface, No. 132646 node reflects the temperature change of the inner side at the center height, and No. 249646 node reflects the temperature change of the outer side at the center height. F-0, F-0.5, and F-1 represent the simulated specimens of phase change mass concrete with 0%, 0.5%, and 1% self-made composite phase change materials, respectively. When calculating the temperature field, the solution time step is 4 h and the solution time history is set to 172 h. When extracting the results, the consistency of the nodes should be ensured, so the temperature field data at the same point should be taken.
Figure 16, Figure 17 and Figure 18 are the temperature nephograms of F-0, F-0.5, and F-1, respectively, when the temperature reaches the peak value in the whole time course. From the diagram, it can be seen that, in the same time course, the maximum temperature of the ordinary mass concrete structure is 49.14 °C and the minimum temperature is 40.40 °C; the maximum temperature of the phase change mass concrete structure with 0.5% phase change material is 48.30 °C and the minimum temperature is 40.37 °C; the maximum temperature of the mass concrete structure with 1% phase change material content is 45 °C and the minimum temperature is 40.24 °C. This shows that, with an increase in phase change material content, the peak temperature of the mass concrete structure gradually decreases. Therefore, it is considered that the internal maximum temperature rise of the phase change mass concrete structure with 1% content in this period of time is 4.14 °C lower than the internal maximum temperature rise of the ordinary mass concrete structure and 3.98 °C lower than the temperature difference of the outer concrete. This shows that the self-prepared composite phase change material has certain feasibility and effectiveness for the temperature control simulation of the temperature field of the mass concrete structure.
It can be seen from Figure 19 that the overall temperature change trend of the ordinary mass concrete structure and the phase change mass concrete structure is consistent. As the cement hydrates, the temperature continues to rise. When the phase change point of the self-prepared composite phase change material is reached, the self-prepared composite phase change material undergoes phase change and begins to absorb heat. It can be seen from the figure that the overall temperature of the four nodes selected in the mass phase change concrete structure is lower than that of the ordinary mass concrete structure, and, with the increase in the content of the composite phase change material, the overall temperature is lower. When the two reach the highest temperature point, the temperature begins to decline slowly, and the cooling rate of the phase change mass concrete structure is lower than that of the ordinary mass concrete structure. In the heating–cooling process, the temperature gradient of the phase change mass concrete structure is smaller than that of the ordinary mass concrete structure, and the decrease in the temperature change range reduces the possibility of temperature cracks.
It can be seen from the temperature history of No. 132601 node in Figure 20 that the maximum temperature rise inside the phase change mass concrete structure is 4.14 °C lower than that of the ordinary mass concrete structure. Therefore, the addition of phase change materials effectively reduces the maximum temperature rise and internal and external temperature difference of mass concrete structures, which can effectively reduce the possibility of temperature cracks.

6. Conclusions

In this paper, the mechanical parameters and thermodynamic parameters of the simulation are determined according to the mechanical and temperature regulation test results. Through the theoretical derivation of the adiabatic temperature rise of the phase change concrete in the existing literature combined with the influencing factors of the temperature rise of the mass concrete, the adiabatic temperature rise is selected as the main control parameter for measuring the temperature regulation effect of the phase change concrete. According to the mature theoretical support of the temperature field simulation of the concrete structure, the temperature field simulation software FEA is selected to simulate the temperature field of the phase change concrete. The simulation analysis conclusions are as follows.
(1)
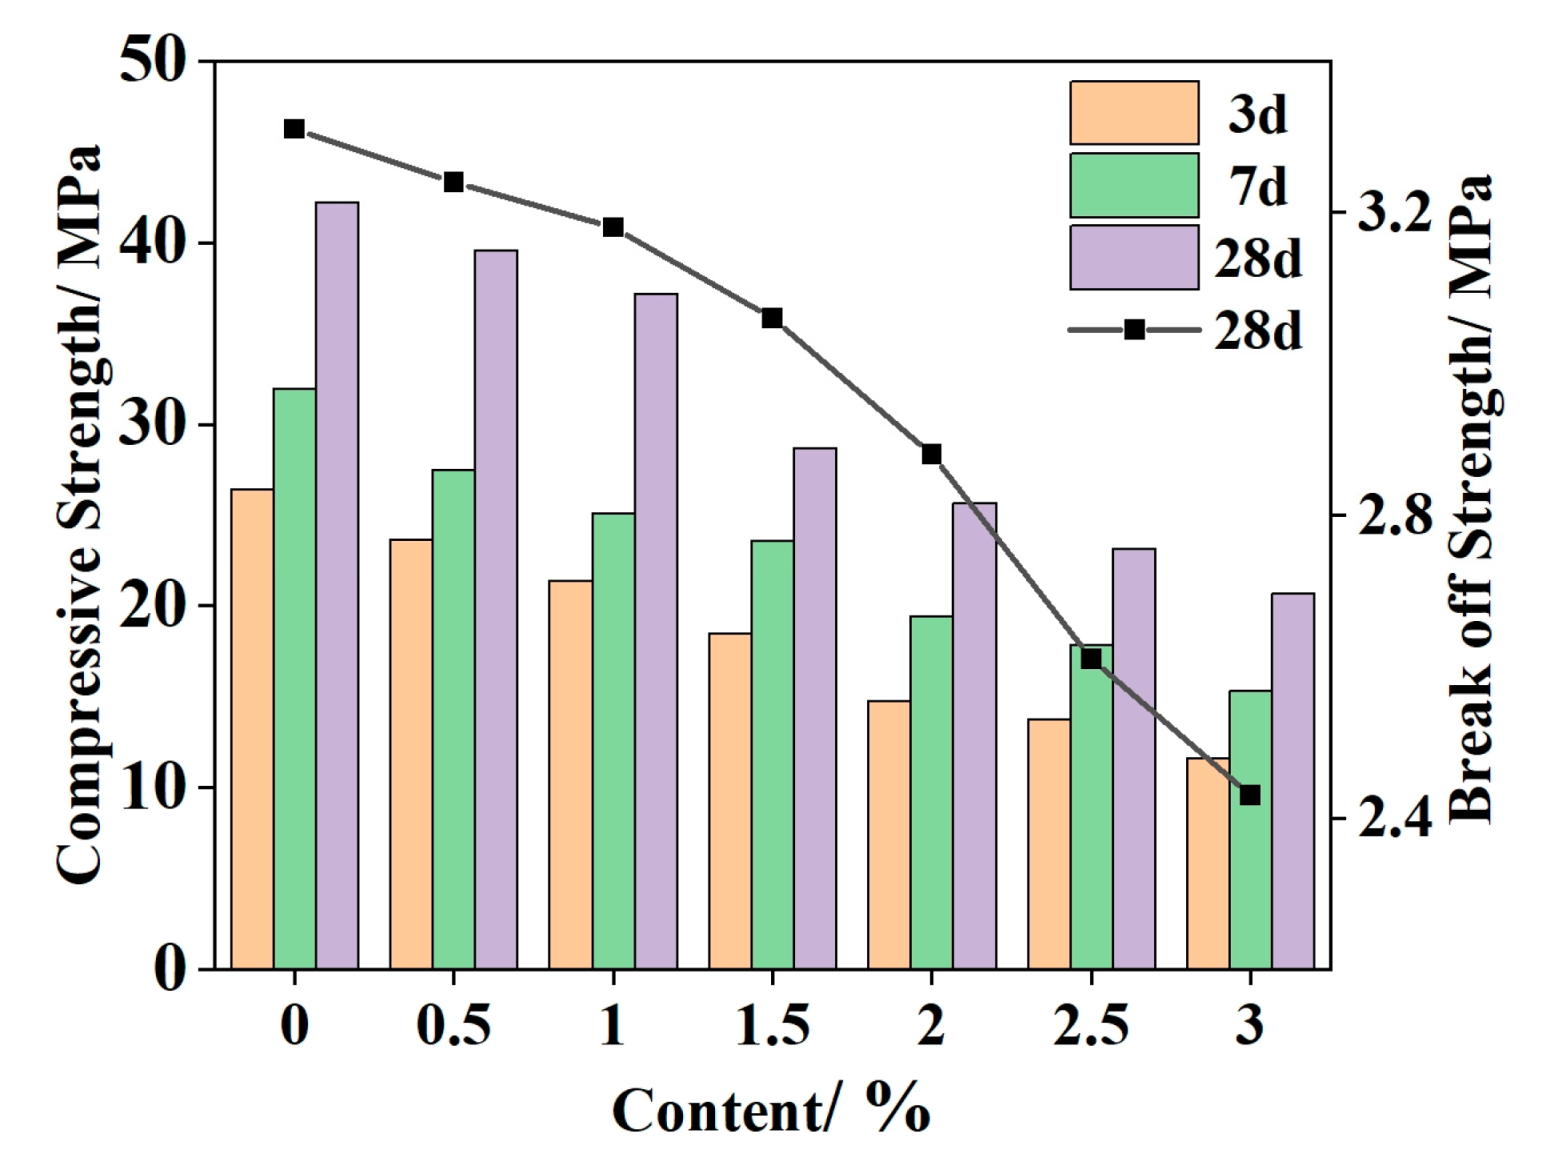
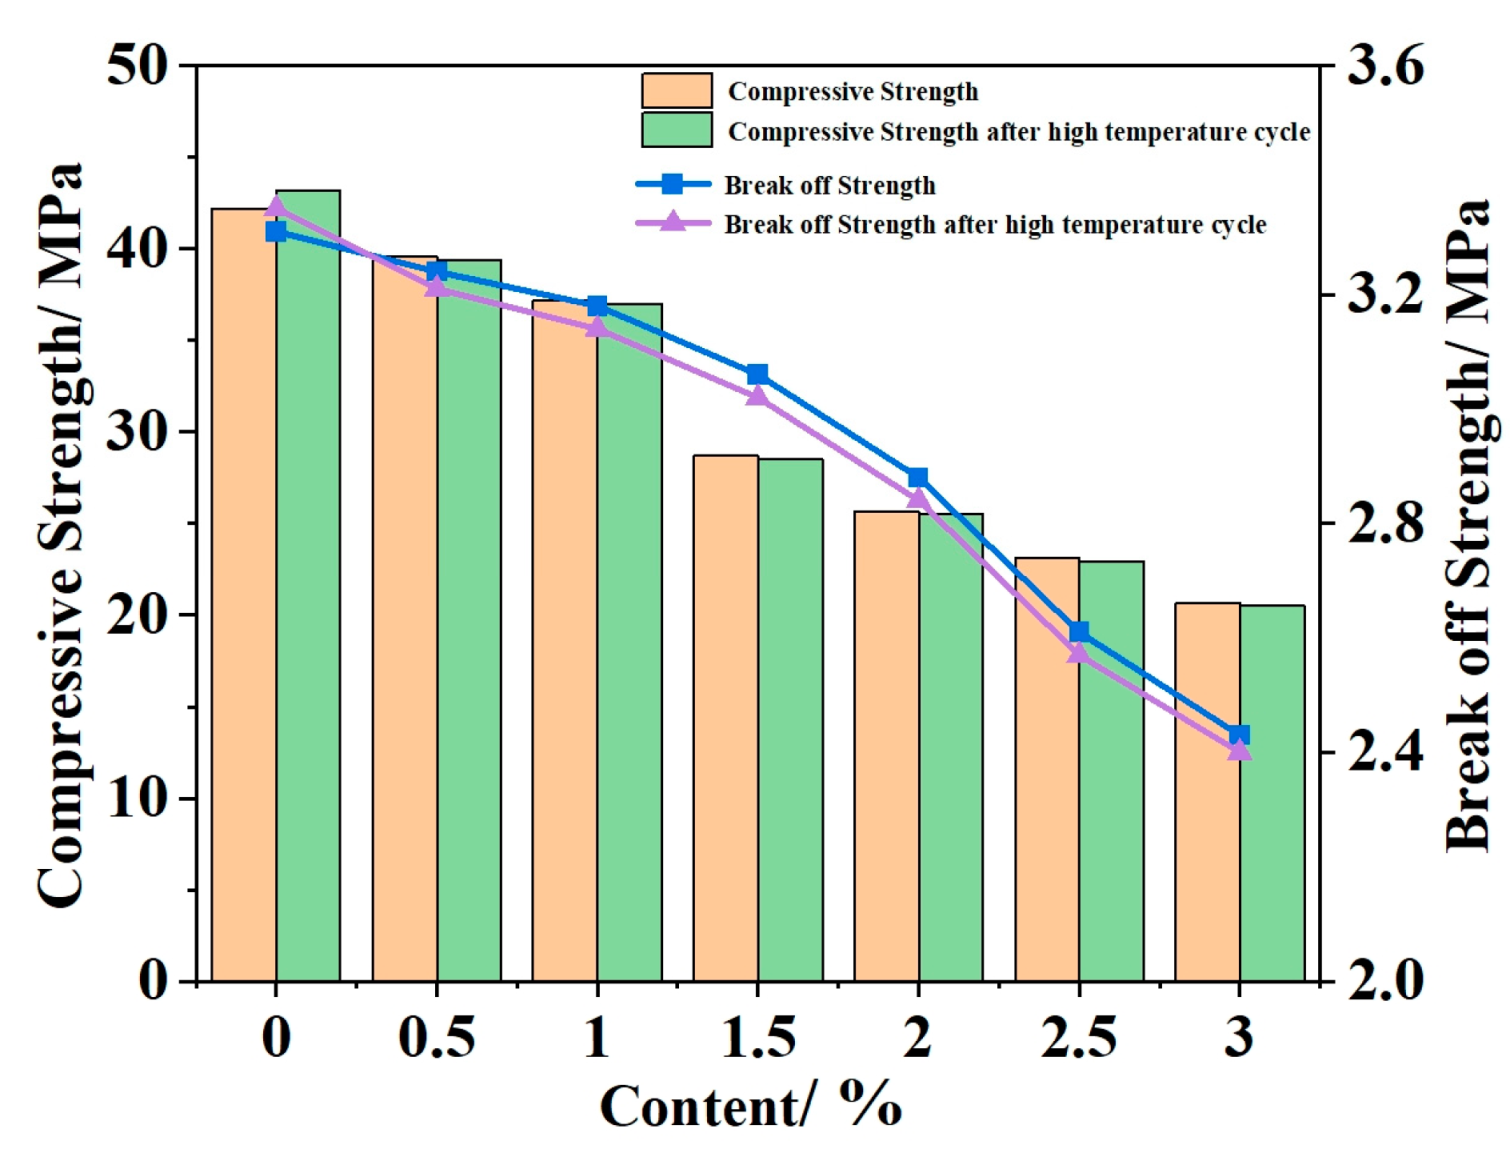
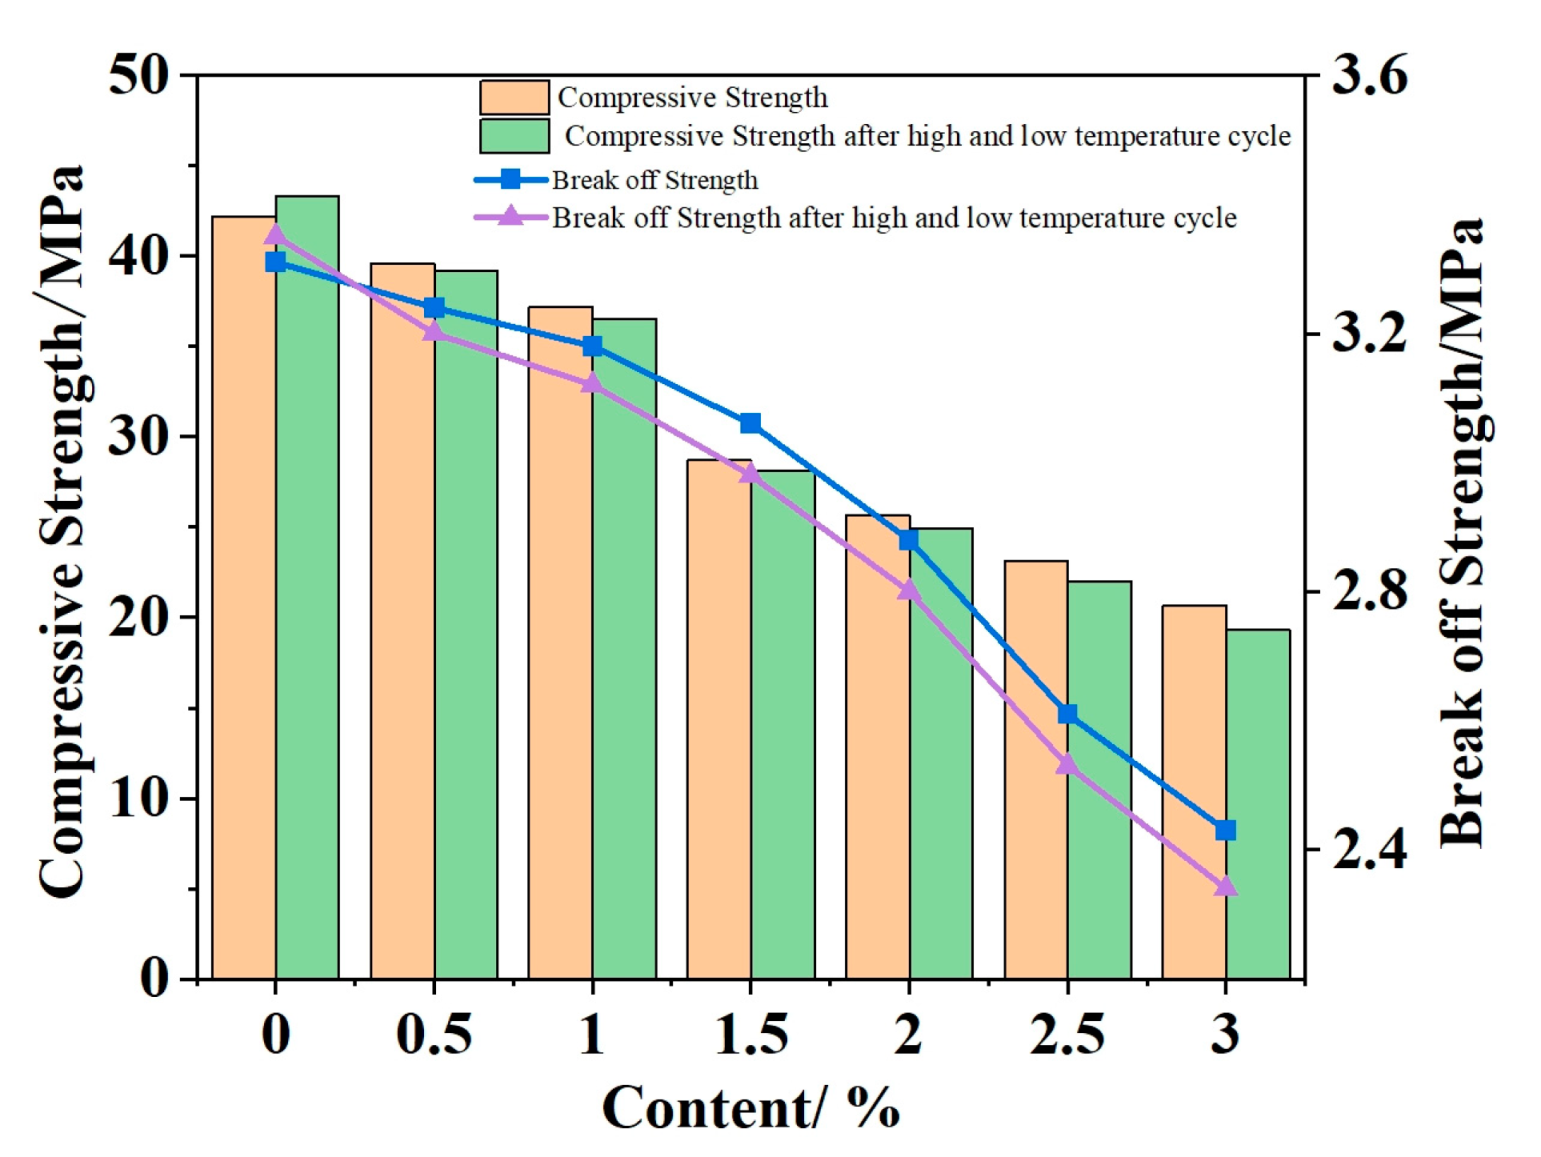
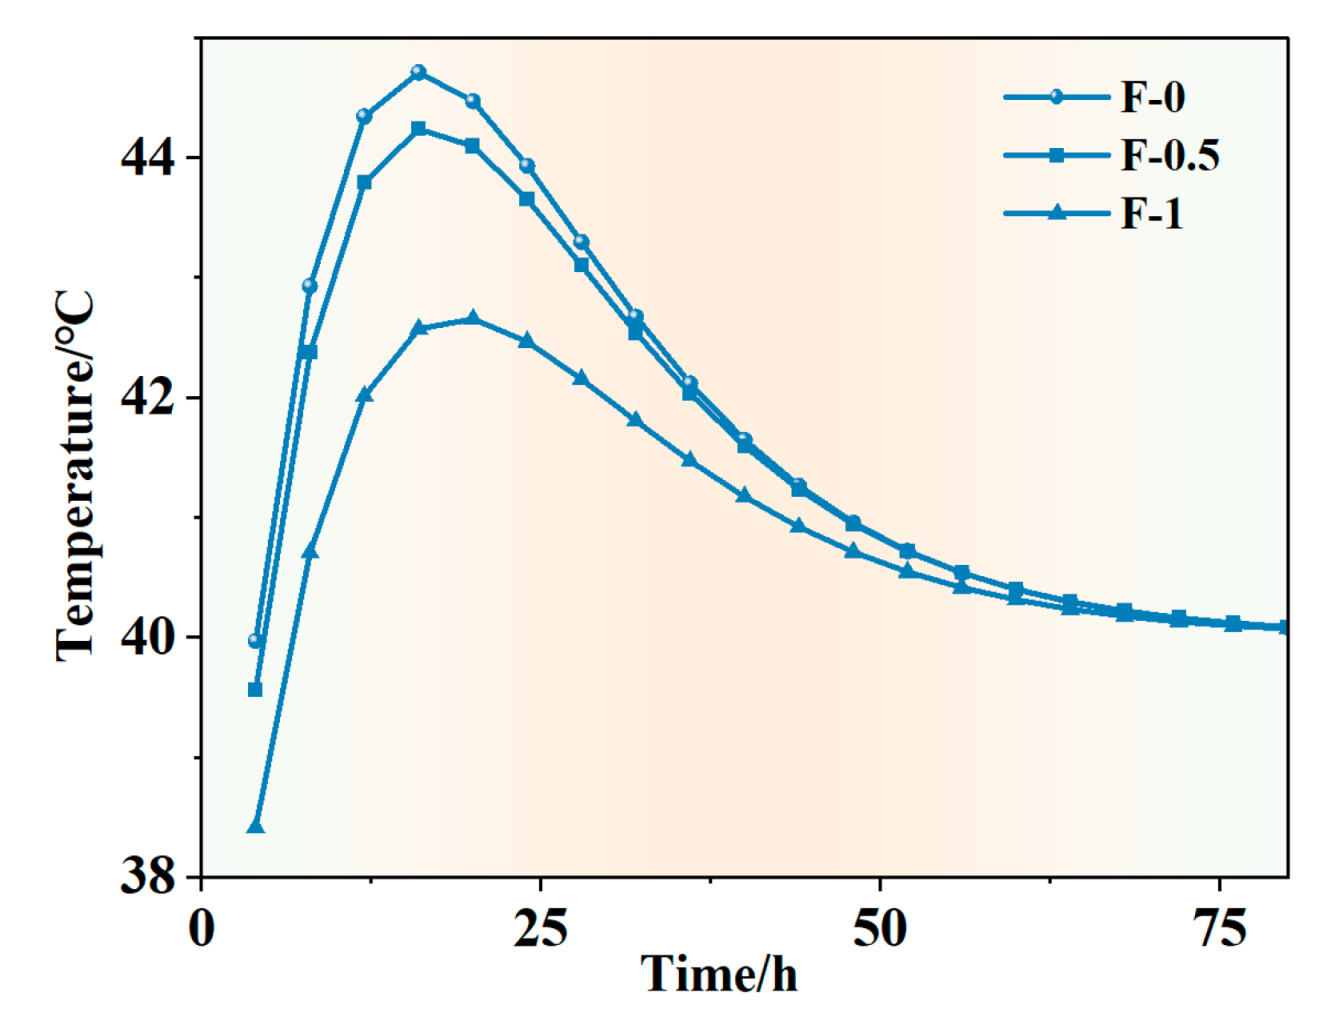
According to the basic mechanical test results of phase change concrete, with an increase in the content of self-prepared composite phase change material, the compressive and flexural properties of concrete decrease but still meet the basic mechanical requirements; in the experiment of the thermal thermoregulation performance of phase change concrete, the self-prepared composite phase change material has a certain regulation and reduction effect on the peak temperature rise caused by the early hydration heat of concrete and, at the same time, delays the time taken to reach the peak temperature rise and realizes the effect of ‘high-temperature peak clipping’ and ‘delay effect’.
(2)
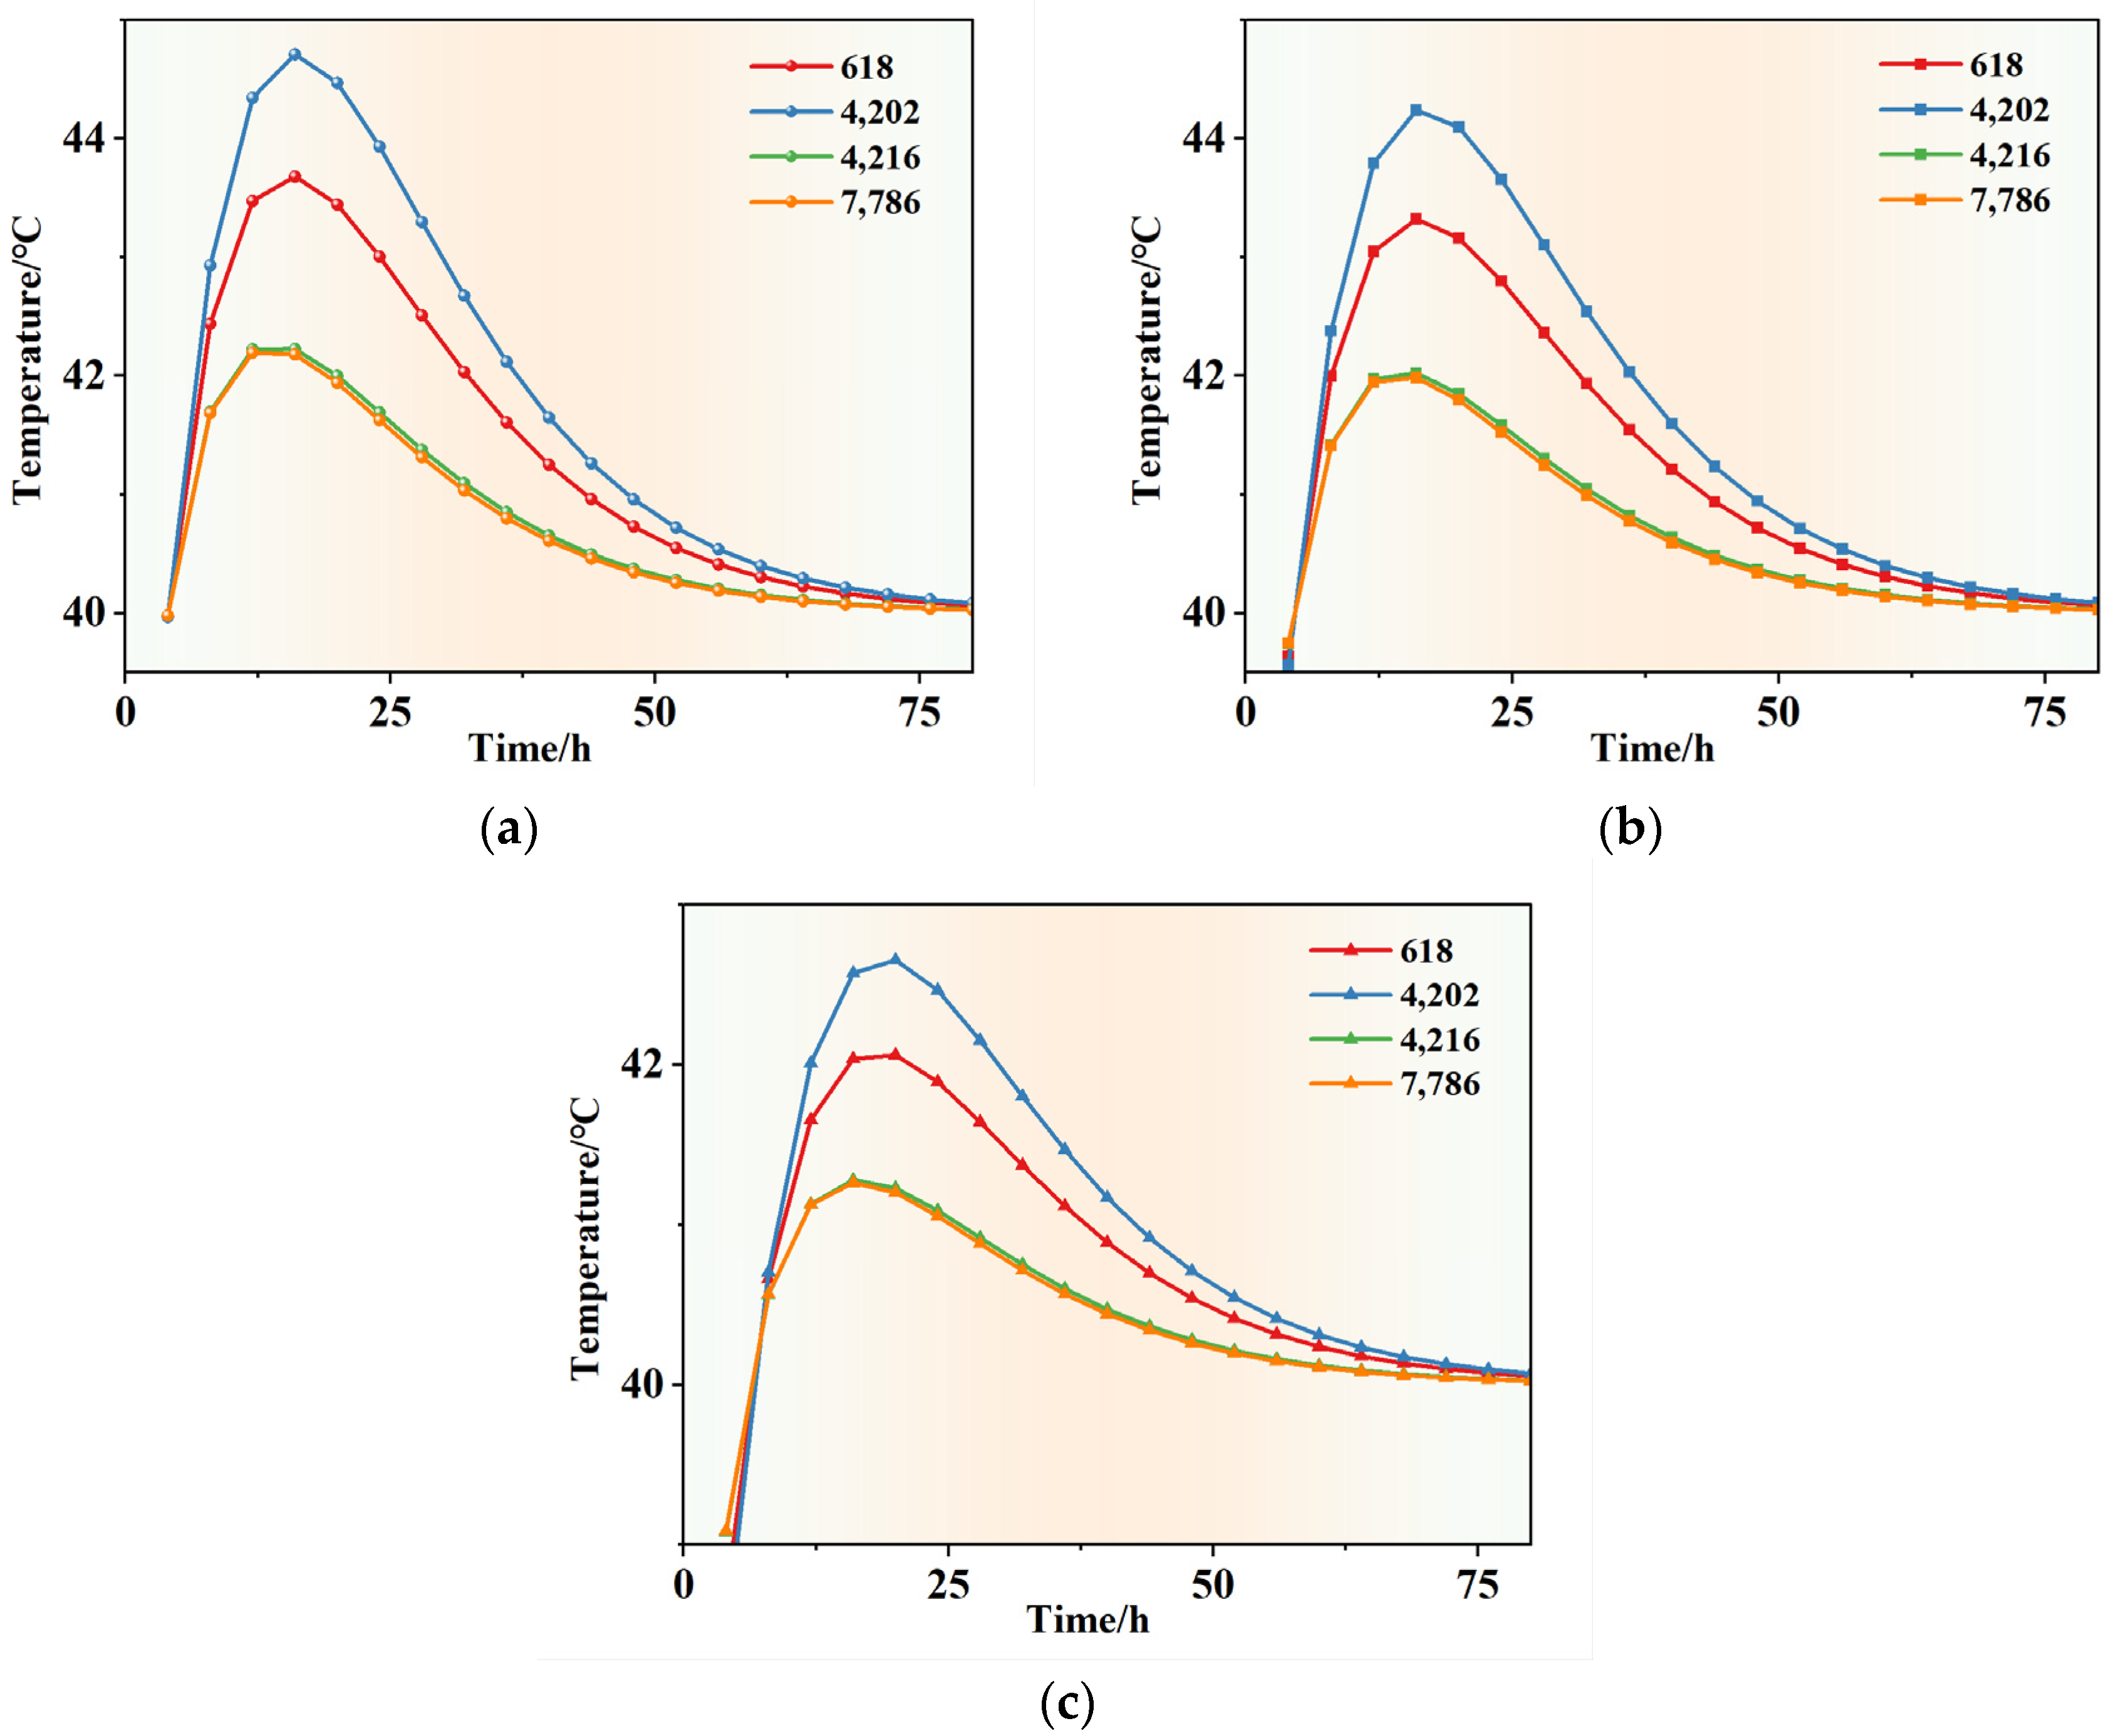
Using the adiabatic temperature rise calculation method of mass phase change concrete proposed in the existing literature, the temperature field simulation analysis of concrete mixed with self-prepared composite phase change materials is carried out. The simulation analysis results are similar to the experimental temperature regulation data of phase change concrete and ordinary concrete, indicating that the simulation analysis method in this paper is suitable for the simulation of the temperature field of a concrete structure mixed with composite phase change materials and the analysis of the temperature regulation effect.
(3)
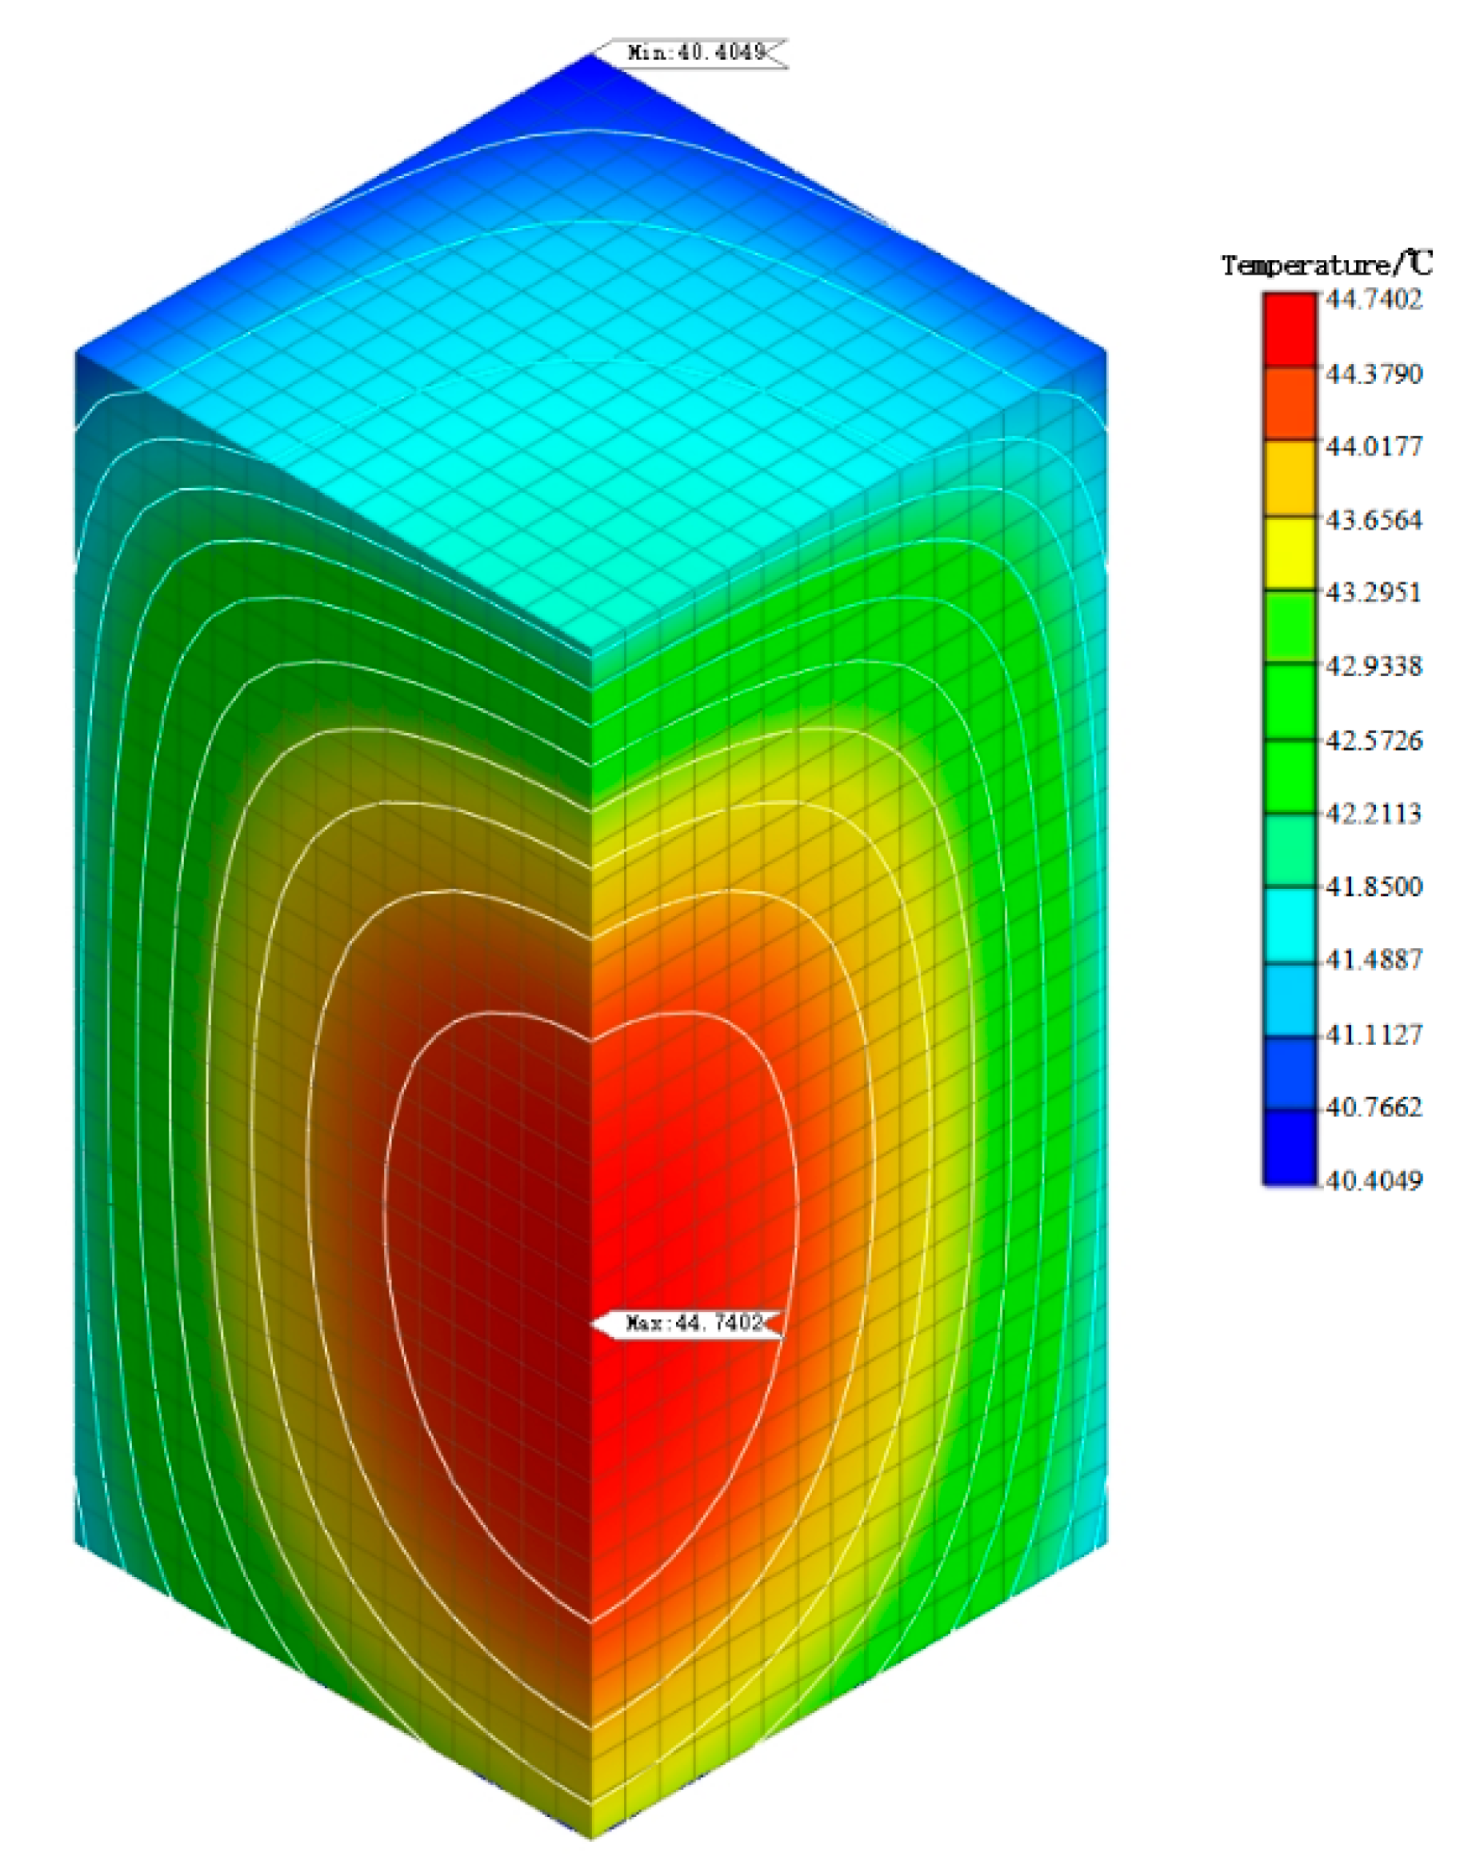
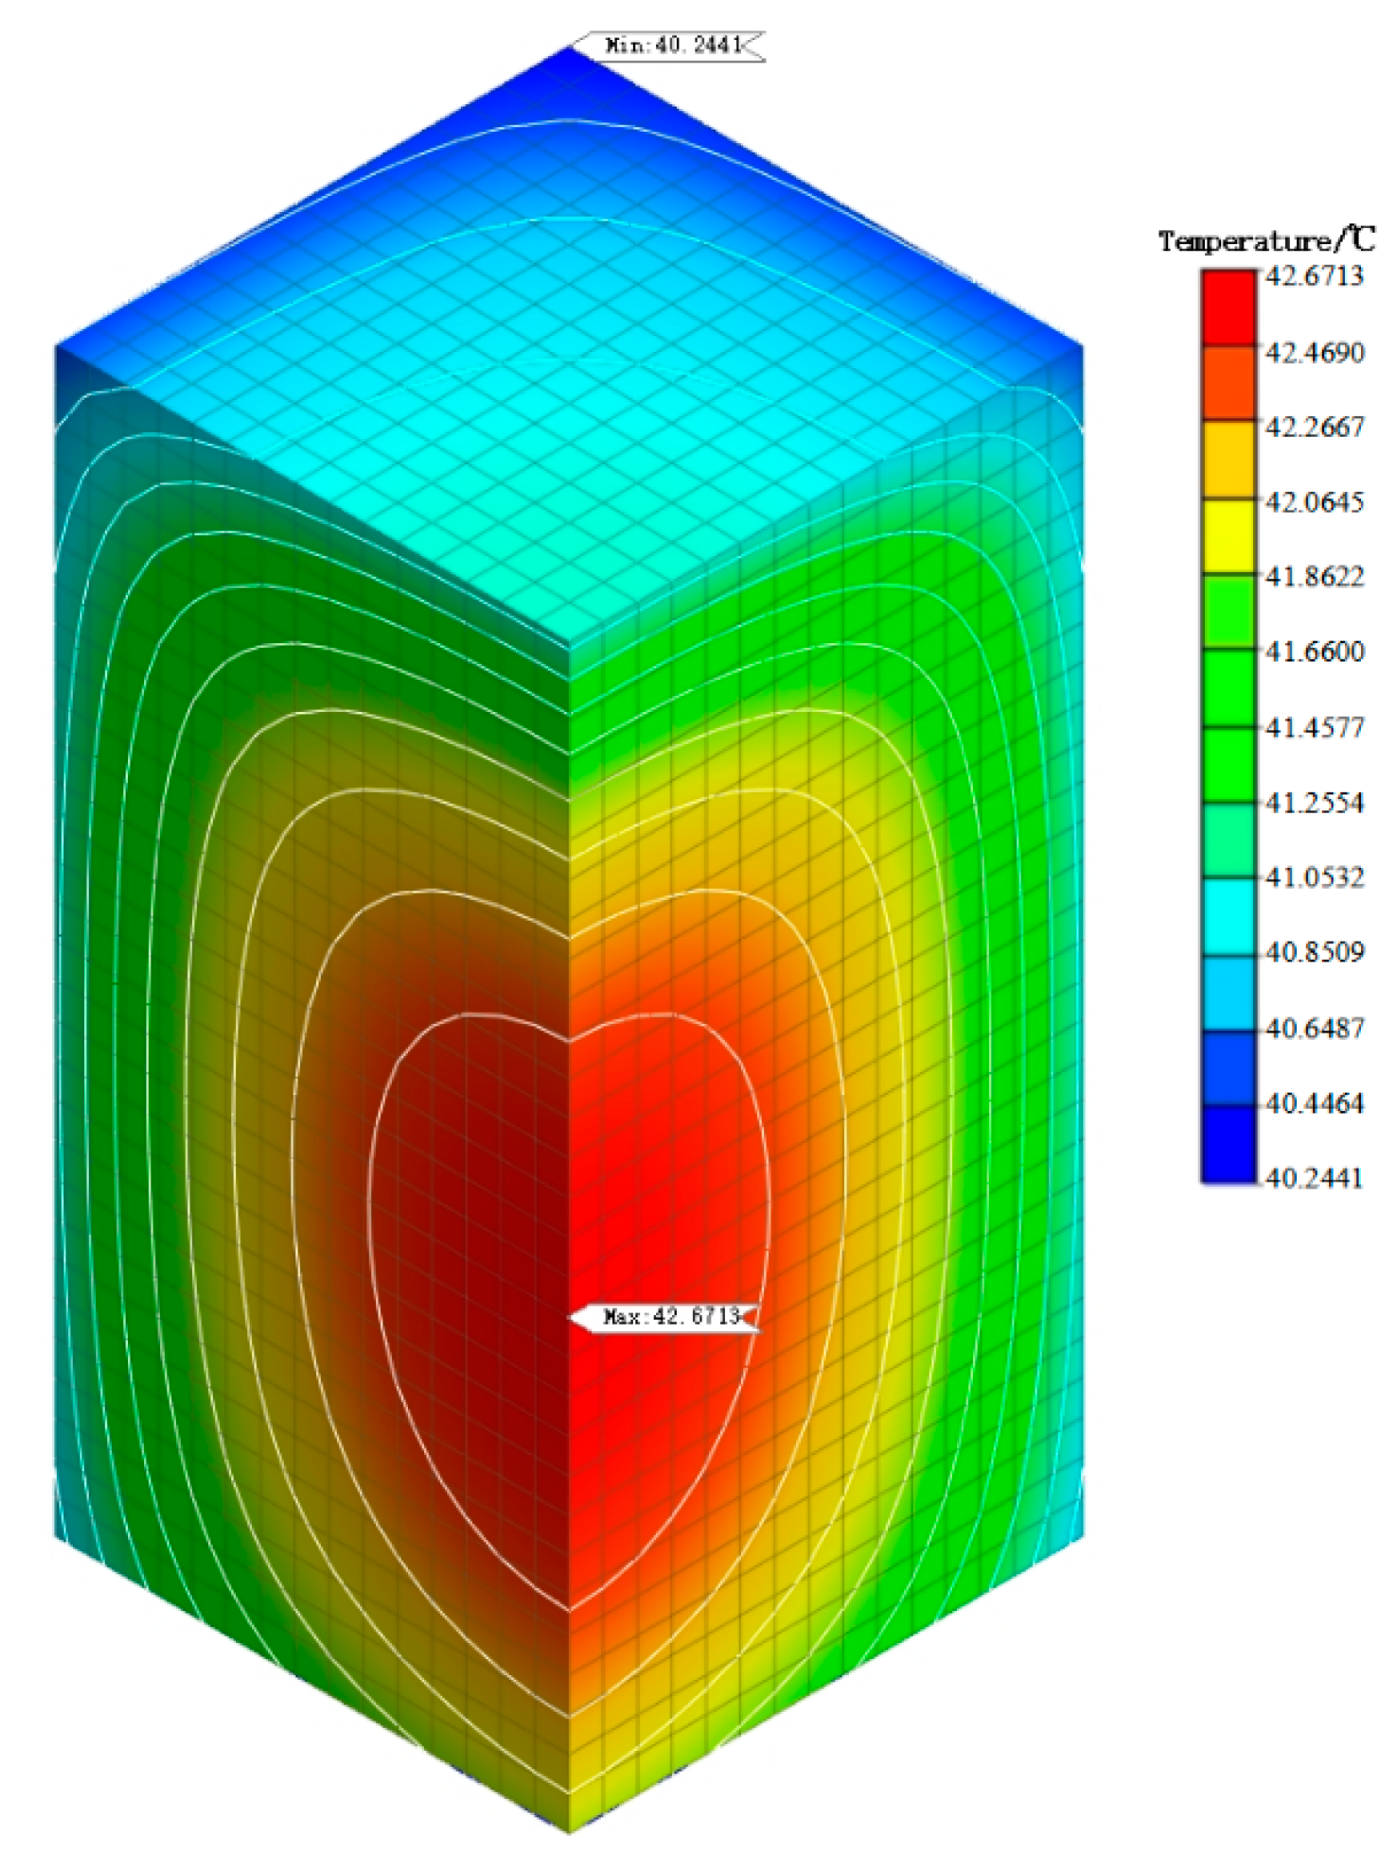
From the analysis of the temperature field of mass concrete, it is found that the addition of self-prepared composite phase change material reduces the temperature peak of the mass concrete structure. Compared with the temperature field of the mass concrete structure without composite phase change material and with a content of 1%, it is found that the maximum temperature is reduced by 4.14 °C and the heating–cooling rate of concrete is slowed down. This shows that the composite phase change material reduces the internal and external temperature difference of the structure by reducing the temperature peak inside the mass concrete structure, thus alleviating the influence of the increase in temperature stress caused by the increase in internal and external temperature difference and reducing the possibility of cracks caused by temperature stress exceeding the structural design stress. Therefore, the self-prepared composite phase change has a certain control effect on the temperature field of the mass concrete structure.

Author Contributions

Conceptualization, R.C. and H.S.; methodology, W.Z.; formal analysis, H.S.; data curation, R.C.; writing—original draft preparation, R.C.; writing—review and editing, K.Y.; All authors have read and agreed to the published version of the manuscript.

Funding

This study is supported by the Innovative Team Project of Ji’nan Government (No. 202333036).

Data Availability Statement

The original contributions presented in the study are included in the article; further inquiries can be directed to the corresponding authors.

Conflicts of Interest

The authors declare no conflicts of interest.

References

  1. Dawei, J. Study on crack control of mass concrete. Build. Struct. 2023, 53, 2275–2279. [Google Scholar] [CrossRef]
  2. He, L.; Li, X.F.; Tang, B.F. Causes and Treatment Countermeasures of Mass Concrete Cracks in Bridge Construction. Highway 2019, 64, 98–101. [Google Scholar]
  3. Wang, P.H.; Xu, Q.G. Application of mass concrete crack control technology in construction engineering. Build. Struct. 2022, 52, 1015–1018. [Google Scholar] [CrossRef]
  4. Haidong, Z. Causes and control of non-load cracks in mass concrete in bridge engineering. Transp. World 2019, 94–95. [Google Scholar] [CrossRef]
  5. Zhang, Y.X.; Li, S.H.; Cao, K.; Li, X.L.; Gu, W.W. Numerical simulation of energy release performance of solar phase change energy storage tank. Energy Storage Sci. Technol. 2013, 2, 377–382. [Google Scholar]
  6. Han, D. Preparation and Properties of Composite Phase Change Materials Suitable for Temperature Control of Mass Concrete. Master’s Thesis, Zhejiang Ocean University, Zhoushan, China, 2019. [Google Scholar]
  7. Wang, J. Theoretical Basis Research and Preparation of Phase Change Temperature Control Concrete. Ph.D. Thesis, Wuhan University of Technology, Wuhan, China, 2011. [Google Scholar]
  8. Song, W. Effect of initial temperature on hydration heat of mass concrete. J. Hunan City Univ. 2020, 29, 12–15. [Google Scholar]
  9. Zhao, M. Preparation and Properties of Palmitic Acid-Stearic Acid/Porous Graphite Form-Stable Phase Change. Master’s Thesis, Inner Mongolia University of Science and Technology, Baotou, China, 2023. [Google Scholar] [CrossRef]
  10. JGJ 55-2011; Specification for Mix Proportion Design of Ordinary Concrete. National Standards of the People’s Republic of China: Beijing, China, 2011.
  11. Geng, M.S.; Lin, E.J.; Lv, J.B.; Fu, B. Hydration heat analysis and temperature control of massive concrete pile caps. Concrete 2021, 50–55. [Google Scholar]
  12. Khan, R.M.A.; Shafighfard, T.; Ali, H.Q.; Mieloszyk, M.; Yildiz, M. Strength prediction and experimental damage investigations of plain woven CFRPs with interacting holes using multi-instrument measurements. Polym. Compos. 2023, 44, 3594–3609. [Google Scholar] [CrossRef]
  13. Zhang, X. Preparation and Properties of Stearic Acid/SiO2 Composite Phase Change Materials by Sol-Gel. Master’s Thesis, Harbin Institute of Technology, Harbin, China, 2012. [Google Scholar]
  14. Liu, D.; He, S.Y.; Dong, Y.X.; Sheng, J.F.; Li, X.F. Preparation and properties of calcium lactate composite phase change cold storage material. Cold Storage Technol. 2024, 47, 28–34. [Google Scholar] [CrossRef]
  15. Zhao, H.J.; Wan, X.; Lu, J.H.; Zhang, H.Y.; Guo, B.H. Development and application of phase change energy storage materials in the field of construction. China Plast. 2023, 37, 46–61. [Google Scholar] [CrossRef]
  16. Zhu, H.Z.; Chen, R.P.; Gou, S.; Wang, D.Q.; Hu, L.X. Preparation and properties of phase change materials for cement pavement temperature regulation at low temperature. Mater. Bull. 2021, 35, 14198–14203. [Google Scholar]
  17. Shi, W.; Hou, J. Study on temperature field distribution characteristics of paraffin phase change temperature control concrete. Silic. Bull. 2013, 32, 2183–2186. [Google Scholar] [CrossRef]
  18. Feng, X.; He, C. Principles of Chemical Engineering, 2nd ed.; Scientific Press: Christchurch, New Zealand, 2007. [Google Scholar]
  19. Zhu, B. Thermal Stress and Temperature Control of Mass Concrete; China Electric Power Press: Beijing, China, 2003. [Google Scholar]
  20. Wang, J.; Guo, X.; Qiu, W.H.; Kong, Y.M. Study on the influence of curing methods on the temperature field of mass concrete construction in summer. J. Xuchang Univ. 2023, 42, 90–95. [Google Scholar]
  21. Haonan, S. Research on Temperature Control of Mass Concrete Based on Phase Change Principle. Master’s Thesis, Shandong Jiaotong University, Jinan, China, 2024. [Google Scholar] [CrossRef]
Figure 1. Main equipment diagram: (a) thermodynamic performance test mold; (b) temperature recorder; (c) high- and low-temperature test chamber.
Buildings 14 02755 g001
Figure 2. Self-made composite phase change material process.
Buildings 14 02755 g002
Figure 3. Self-made composite phase change material.
Buildings 14 02755 g003
Figure 4. DSC curves of composite phase change materials prepared by ourselves.
Buildings 14 02755 g004
Figure 5. The compressive and flexural properties of concrete with different contents.
Buildings 14 02755 g005
Figure 6. The compressive and flexural properties of concrete with different contents under high-temperature cycling conditions.
Buildings 14 02755 g006
Figure 7. Compressive and flexural properties of concrete with different contents under high- and low-temperature cycling conditions.
Buildings 14 02755 g007
Figure 8. Temperature changes of different contents at different monitoring positions of concrete specimens.
Buildings 14 02755 g008
Figure 9. Model boundary condition diagram. A is the top surface in Z direction; B is the bottom of the X side; C is the top surface in the Y direction; D is the bottom of the Y direction; E is the top surface of X aspect; F is the bottom surface in Z direction.
Buildings 14 02755 g009
Figure 10. Temperature cloud diagram of No. F-0 4202 node.
Buildings 14 02755 g010
Figure 11. F-0.5 4202 node temperature cloud diagram.
Buildings 14 02755 g011
Figure 12. F-1 The temperature cloud of No. 4202 node.
Buildings 14 02755 g012
Figure 13. The temperature change curves of F-0, F-0.5, and F-1 nodes; (a) temperature change curve of F-0 node; (b) temperature change curve of F-0.5 node; (c) the temperature change curve of F-1 node.
Buildings 14 02755 g013
Figure 14. The temperature change of 4202 node in F-0, F-0.5, and F-1.
Buildings 14 02755 g014
Figure 15. Model boundary condition diagram: (a) the x-direction and y-direction symmetrical boundary diagram of the inner section; (b) schematic diagram of fixed boundary of outer surface; (c) convective boundary diagram of outer surface.
Buildings 14 02755 g015
Figure 16. Temperature cloud diagram when F-0 reaches the peak temperature.
Buildings 14 02755 g016
Figure 17. Temperature cloud diagram when F-0.5 reaches the peak temperature.
Buildings 14 02755 g017
Figure 18. The temperature cloud diagram when F-1 reaches the temperature peak.
Buildings 14 02755 g018
Figure 19. Temperature curves of F-0, F-0.5, and F-1 nodes; (a) temperature change curve of F-0 node; (b) temperature change curve of F-0.5 node; (c) the temperature change curve of F-1 node.
Buildings 14 02755 g019
Figure 20. The temperature change of No. 132601 node in F-0, F-0.5, and F-1.
Buildings 14 02755 g020
Table 1. Main test materials.
Test ReagentSpecificationManufacturer
Palmitic acid (C16H32O2, PA)Analytical pure (RG), 98%+Shanghai Titan Technology Co., Ltd. (Shanghai China).
Stearic acid (C18H36O2, SA)Analytical pure (RG), 99% (Mixture)Shanghai Titan Technology Co., Ltd. (Shanghai China).
Tetraethyl orthosilicate (C8H20O4Si, TEOS)Analytical pure (AR)Guangdong Wengjiang Chemical Reagent Co., Ltd. (Guangdong China).
Anhydrous ethanol (C2H5OH)Analytically pure (AR), concentration ≥99.7%Shanghai Titan Technology Co., Ltd. (Shanghai China).
Hydrochloric acid (HCL)The concentration is 33~35%Laiyang City Kant Chemical Co., Ltd. (Laiyang Yantai China).
Ammonia liquor (NH4OH)Analysis pure (AR) concentration of 25~28%Shanghai Titan Technology Co., Ltd. (Shanghai China).
Table 2. Phase transition properties of palmitic acid and stearic acid.
Phase Transformation FormStarting Temperature/°CPeak Temperature/°CTemperature Range/°CEnthalpy Value/J·g−1
Palmitic acidfusion53.8358.2353.83~59.20202.17
solidification50.2652.0750.26~53.90198.05
Stearic acidfusion62.4364.7362.43~66.10234.20
solidification58.1660.1358.16~60.73235.16
Table 3. Test materials.
MaterialsRemark
CementP.O42.5 grade ordinary Portland cement, Jinan Century Innovation Cement Co., Ltd (Jinan Shandong China).
Fly ashGrade I
Mineral powderGrade S95
SandOrdinary test river sand
Cobble4.75–9.5 mm particle size and 9.5–19.0 mm particle size, accounting for 60% and 40%, respectively
Water reducing agentHighly efficient polycarboxylic acid water reducer, water reduction rate of more than 25%, a content of 0.8% of cement mass
WaterOrdinary tap water
Table 4. Design of concrete mix proportion (kg/m3).
CementFly AshMineral PowderWaterSandCobbleWater Reducing Agent
4.75–9.59.5–19.0
21398161516014887331.7
Table 5. Material parameters.
Concrete Material ParametersUnitSet Value
Elastic modulusMPa31,991.10
Poisson ratio/0.2
Weight densitykN·m−32549
Thermal conductivityW·m−1·K−12.78
Thermal expansion coefficient/1 × 10−5
Convection coefficient [18] W·m−2·K−120
Specific heatkJ·kg−1·K−11.85
Disclaimer/Publisher’s Note: The statements, opinions and data contained in all publications are solely those of the individual author(s) and contributor(s) and not of MDPI and/or the editor(s). MDPI and/or the editor(s) disclaim responsibility for any injury to people or property resulting from any ideas, methods, instructions or products referred to in the content.

