Article

A Study on Outdoor Thermal Comfort of College Students in the Outdoor Corridors of Teaching Buildings in Hot and Humid Regions

1
School of Visual Arts Design, Guangzhou Academy of Fine Arts, Guangzhou 510261, China
2
Innovation School of Great Bay Area, Guangzhou Academy of Fine Arts, Guangzhou 510261, China
*
Author to whom correspondence should be addressed.
Buildings 2024, 14(9), 2756; https://doi.org/10.3390/buildings14092756
Submission received: 17 July 2024 / Revised: 11 August 2024 / Accepted: 13 August 2024 / Published: 2 September 2024
(This article belongs to the Section Building Energy, Physics, Environment, and Systems)

Abstract

:
It is important to create a favorable environment for various student activities and interactions by improving the thermal comfort of semi-outdoor spaces in teaching buildings. However, there has been limited research focusing on the thermal comfort levels of college students in these areas, such as corridors (access ways connecting different buildings outdoors). This study aims to assess the thermal comfort levels of college students in the corridors of teaching buildings in hot and humid regions. Based on field measurements and questionnaire surveys, the study evaluated the thermal comfort levels of male and female college students. The findings indicate the following: (1) air temperature and air velocity are the primary thermal environmental parameters affecting college students in corridor spaces, regardless of gender; (2) physiological equivalent temperature (PET) and Universal Thermal Climate Index (UTCI) were used as indices to evaluate the thermal environment of outdoor corridor spaces. Males and females perceive the outdoor environment as hot when PET (UTCI) values reach 33.5 (34.5) °C and 33.3 (33.5) °C, respectively. When the PET (UTCI) values reach 39.0 °C (37.5 °C) for males and 37.7 °C (38.3 °C) for females, individuals in corridor spaces will face extreme heat stress; (3) females find it more challenging than males to tolerate hot outdoor environments. The unacceptable temperatures for males and females are 31.1 °C and 31.8 °C, respectively; and (4) in hot outdoor environments, females are more susceptible than males to experiencing fatigue and negative emotions. The results of this study provide valuable insights for the future design and renovation of teaching buildings on university campuses.

1. Introduction

The ongoing trend of urbanization is currently the primary trend shaping the development of countries worldwide [1]. However, this trend necessitates a delicate balance between land consumption and green infrastructure [2]. It not only significantly alters the composition of urban landscapes but also induces changes in microclimate conditions, resulting in the so-called urban heat island (UHI) effect, which causes temperatures in urban areas to be higher than in surrounding rural areas [3,4,5]. In order to address the ongoing deterioration of urban environments, researchers are exploring various strategies to mitigate urban heat, such as adjusting urban layouts [6,7], increasing green spaces [8,9,10], and altering building forms [11]. However, they focus more on large-scale outdoor open spaces, and less attention is paid to the semi-outdoor spaces of buildings, such as overhead spaces (on the ground floor of buildings), courtyards, corridors, etc., which are relatively small-scale spaces. Furthermore, physiological differences, such as age and gender, may lead to varying levels of individual tolerance to outdoor thermal environments [12,13,14,15]. For instance, children have a higher metabolic rate than adults and are more sensitive to being hot compared to adults [16,17]. Middle-aged and elderly individuals generally tolerate higher temperatures better than adolescents [18,19]. Therefore, before optimizing and renovating the target space, it is essential to thoroughly consider its primary user demographics and have a clear understanding of their thermal comfort levels in this space.
In China, by the year 2020, the total number of college students exceeded 41 million [20]. Contemporary college students face multiple pressures, including academic tasks and employment, which can cause emotional distress, affecting both their physical health and academic performance [21,22]. Studies have shown that anxiety affects a significant portion of college students, with 8–13% experiencing mild anxiety, 20% experiencing moderate symptoms, and more than 4% being affected by severe anxiety [23]. Furthermore, extensive research indicates that high temperatures have a notable impact on both physical and mental health. Lower temperatures can alleviate negative psychological effects, whereas higher temperatures often exacerbate them [24,25]. For instance, high-temperature environments can lead to increased anxiety [26], amplify negative emotions, and lead to fatigue [27]. Engaging in outdoor activities can significantly enhance individuals’ life satisfaction and physical health, with natural outdoor environments directly linked to improvements in mental well-being [28]. However, hot outdoor environments may discourage students from participating in outdoor activities, leading to increased sedentary behavior and posing threats to physical health [29]. Additionally, this trend also contributes to higher energy consumption in buildings [30,31]. Therefore, understanding college students’ thermal comfort levels in outdoor spaces is crucial.
Currently, there is a substantial amount of research on the outdoor thermal comfort levels of college students. For instance, studies have focused on the thermal comfort of college students during military training [32], sports activities inside gymnasiums [33], and walking in overhead spaces and courtyards [34]. The teaching building not only provides classroom space for college students but also offers space for spontaneous learning and interaction. The outdoor corridor space (a kind of semi-outdoor space whose top is covered by the building) in the teaching building is often a passageway connecting different adjacent buildings and is also an outdoor space frequently used by university students in their daily lives. While some studies have considered the thermal environment levels in these spaces, the thermal comfort levels of individuals in these areas have not been thoroughly explored [35,36,37]. Therefore, it is important to understand the thermal comfort levels of college students in corridor spaces.
To assess outdoor thermal comfort levels, standard thermal environment parameters such as air temperature (Ta), relative humidity (RH), wind speed (Va), and mean radiant temperature (Tmrt) may not fully capture individuals’ thermal sensation. Therefore, researchers have developed numerous thermal indices to evaluate environmental conditions and assess potential thermal stress on individuals, such as PMV (predicted mean vote), PET, UTCI, WBGT (wet-bulb globe temperature), and others [38,39]. Among these indices, UTCI stands out as it is based on the Fiala multi-node model and is defined as the equivalent ambient temperature of a reference environment, making it a widely used indicator for outdoor thermal comfort evaluation [40]. PET, developed from the Munich personal energy balance model [41], is another commonly used indicator, has been widely applied in various climatic regions, especially in hot and humid regions [42,43,44]. However, the suitability of these thermal indices for assessing thermal comfort in the corridor spaces of teaching buildings in hot and humid regions remains a topic of debate.
In summary, this study aims to investigate the thermal comfort levels of college students in the corridor spaces of teaching buildings in hot and humid regions of China during the summer. By analysis of subjective thermal comfort data, the research aims to identify the primary thermal environment parameters that affect students in these corridor spaces and evaluate the effectiveness of various thermal indices. The findings of this study can provide support for optimizing and renovating teaching buildings on university campuses.

2. Methods

2.1. Study Area

Guangzhou (112° E–114.2° E, 22.3° N–24.1° N) is situated in the hot and humid regions of China, characterized by hot and humid summers and mild winters, classified under the Köppen climate classification as Cfa. The annual average air temperature and relative humidity in this region are approximately 22 °C and 77% [45], respectively. The summer season in Guangzhou typically spans from June to September, with universities beginning their summer break around the end of June.
This study was conducted on 20 June 2024 and 24 to 26 June 2024, at the Guangzhou Academy of Fine Arts on Xiaoguwei Island in Panyu District, Guangzhou. As shown in Figure 1, the measurement points were positioned in the corridors of the 2nd and 3rd floors of the teaching building at the Guangzhou Academy of Fine Arts. The surroundings of the teaching building are densely populated with trees, featuring a playground on the left side and a driveway to the north.

2.2. Instruments and Measured Parameters

In this study, thermal environmental parameters during the testing period were recorded using a thermal comfort level recorder (SSDZY-1), including air temperature, mean radiant temperature, relative humidity, and wind speed. Detailed information about the instruments used in the experiment is listed in Table 1. The diameter (D) of the globe thermometer is 0.15 m, and the surface emissivity (εg) is 0.95. According to ISO 7726 [46], the instrument was placed at a distance of 1.0 m from the subjects. Additionally, the heart rate of subjects was measured and recorded using a fingertip pulse oximeter (YX102).
T m r t = T g + 273 4 + 1.1 × 10 8 × V a 0.6 ε g × D 0.4 × T g T a 1 4 273
where Ta represents the air temperature, Tg represents the black globe temperature, Va represents the wind speed, D is the black globe thermometer diameter, and εg is the emissivity.

2.3. Questionnaire and Experimental Procedure

All college students participating in the study were led by a teacher to the outdoor corridor of the teaching building. In order to avoid potential differences in the results of the study due to the different intensities of activities and the different spaces in which the university students were located before reaching the outdoor corridor, all participants were asked to take a 15 min break in the corridor under the supervision of the instructor to ensure that they were acclimatized to the environment of the outdoor corridor, during which time they could choose to sit or stand. They then participated in questionnaires and heart rate measurements.
Prior to the start of the formal survey, we asked the instructor to explain each question in the questionnaire to all participants in the classroom and to ask subjects to answer the questions about their true physical and psychological state during the experiment in order to eliminate potential ambiguities and to ensure a clear understanding of the questionnaire’s content. Therefore, the completion time for each participant’s questionnaire was controlled to within 1.5 min. Questionnaires were filled out from 10:00 to 17:00, with a lunch break from 12:00 to 14:30. Therefore, no questionnaires were collected during this time period. In addition, each subject was asked to complete only one questionnaire. All participants included in the study had been residing in Guangzhou for at least one year. Additionally, all participants had no history of illness or chronic diseases, and they did not take any medication during the experiment.
The questionnaire for this study is primarily divided into the following three parts. The first part records participants’ personal information, including gender, age, height, weight, clothing insulation material, and current heart rate. All information in this section was measured and recorded by on-site experiment personnel. The second part of the questionnaire assesses participants’ thermal sensation. To better differentiate students’ thermal perceptions in the corridor, we utilized a 9-point thermal sensation scale based on the traditional ASHRAE 7-point scale. The scale is as follows: −4, very cold; −3, cold; −2, cool; −1, slightly cool; 0, neutral; 1, slightly warm; 2, warm; 3, hot; and 4, very hot. Acceptability is assessed using a binary scale: −1, unacceptable; 1, acceptable. Additionally, we considered participants’ wind sensation in the corridor space using a scale that ranges from −4 to +4: −4, too little wind; −3, very little wind; −2, little wind; −1, slightly little wind; 0, just right wind; 1, slightly strong wind; 2, strong wind; 3, very strong wind; and 4, too strong wind. The third part includes assessments of physical fatigue and emotional state. Physical fatigue assessment includes 1,heavy head; 2, body feels lazy; 3, body stiffness; 4, yawning/nodding off; 5, feeling sleepy/wanting to lie down; and 6, none. Emotional assessment includes 1, distracted/unable to concentrate; 2, no desire to talk; 3, anger/easily irritable; 4, anxiety; and 5, none.

2.4. Data Processing

2.4.1. The Principle of Metabolic Rate Measurement

Previous studies have often estimated participants’ metabolic rates using recommended values, which may lead to deviations from actual conditions. In this study, we selected heart rate as a surrogate indicator for metabolic rate. The relationship between the measured metabolic rate and heart rate can be calculated employing the following equation [33,47]:
M = H R H R 0 R M + M 0
where M is the metabolic rate (W/m2); M 0 is the metabolic rate in the inactive rate (W/m2); HR is the heart rate at the moment; H R 0 is the heart rate at rest under thermally neutral conditions; and RM is the increase in the heart rate per unit of metabolic rate, which is stated by the following formula:
R M = H R m a x H R 0 M W C M 0
where H R m a x is the maximum heart rate, H R m a x = 205 0.62 × A , and MWC (W/m2) is the maximum working capacity described in the following formulas:
M W C m a l e = 41.7 0.22 × A × W 0.666
M W C f e m a l e = 35.0 0.22 × A × W 0.666
where A is the age in years, and W is the weight in Kg.

2.4.2. Thermal Indices

Individual metabolic rates estimated based on heart rate, combined with environmental parameters, are used to calculate the PET values using RayMan software. UTCI was computed using the “UTCI calculator”. The calculation of UTCI requires wind speed data at 10 m above ground level. In this study, wind speed was measured at 1.1 m above ground level and converted to the required 10 m height using the following formula:
V 10 = V 1.1 log ( 10 / 0.01 ) / log ( x / 0.01 )
where V 1.1 is the wind speed at 1.1 m above the ground, and V 10 is the wind speed at 10 m above the ground.

3. Results

3.1. Field Thermal Parameters

The thermal environment parameters during the field measurement period, including air temperature, relative humidity, mean radiant temperature, and wind speed, are shown in Figure 2. The average air temperature and mean radiant temperature in the corridor space ranged from 31.5 to 32.7 and 32.3 to 33.2 °C, respectively. The average relative humidity ranged from 66.5 to 74.6%. This implies that during the field measurement period, the climate conditions were typical of a hot and humid summer in the region. During the measurements over the first three days, the average wind speeds in the corridor were 1.15, 1.04, and 1.19 m/s. It was only on the fourth day that the average wind speed reached 2.20 m/s. Overall, in the summer months in hot and humid areas, the wind speeds in the corridor spaces of the academic building may generally be low.

3.2. Subjects’ Information

A total of 595 questionnaires were collected, and the characteristics of the subjects are shown in Table 2. Among them, there were 162 questionnaires from males and 433 from females. The average age, height, and weight for males were 19.6 years, 1.75 m, and 64.7 kg, respectively. For females, the average age, height, and weight were 19.2 years, 1.63 m, and 53.8, respectively.

3.3. Votes

3.3.1. Preference Votes

Male and female college students’ preferences for environmental parameters in corridor spaces are illustrated in Figure 3. Specifically, 93% of males and 94% of females prefer a lower air temperature, while 7% of males and 5% of females prefer the air temperature to remain unchanged. In terms of mean radiant temperature, 30% of males and 23% of females prefer it to remain unchanged, whereas 67% of males and 75% of females prefer a lower mean radiant temperature. Preferences for relative humidity among males and females were as follows: 16% (8%) prefer it higher, 39% (29%) prefer it unchanged, and 45% (63%) prefer it lower. Regarding wind speed, 83% of males and 78% of females prefer higher wind speeds, while 12% of males and 20% of females think the wind speed can remain unchanged.

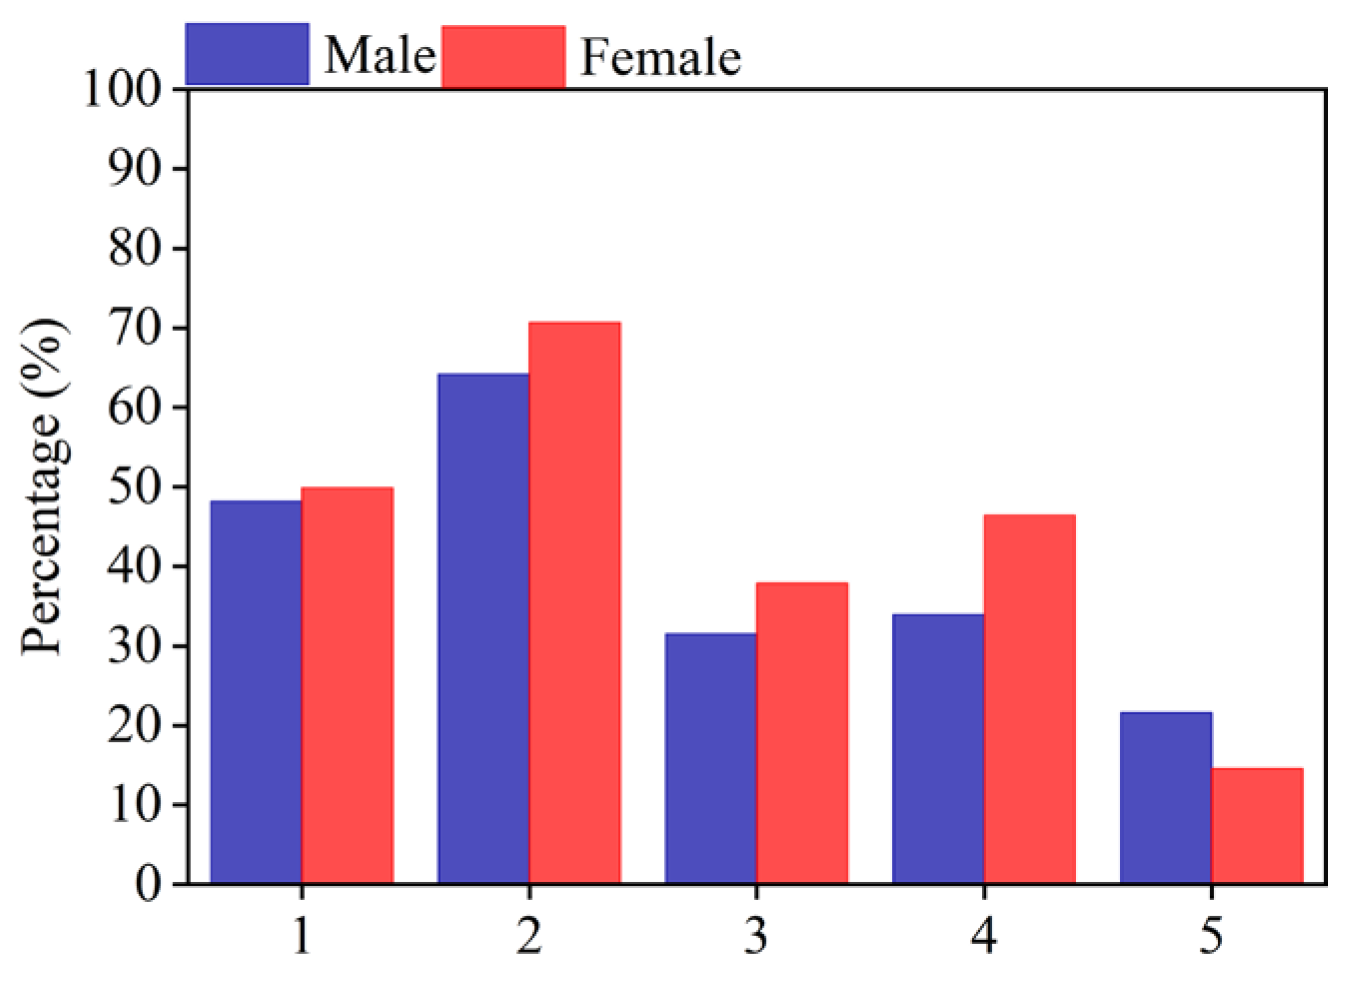
3.3.2. Physical Fatigue Evaluation Votes

The percentage of physical fatigue evaluations among college students is depicted in Figure 4. Among male college students, the percentages reporting heavy head, body feels lazy, body stiffness, yawning/nodding off, feeling sleepy/wanting to lie down, and none were 33.3%, 56.8%, 24.1%, 50.0%, 51.2%, and 19.8%, respectively. Among female college students, the percentages reporting heavy head, body feels lazy, body stiffness, yawning/nodding off, feeling sleepy/wanting to lie down, and none were 42.0%, 71.6%, 26.8%, 46.0%, 54.7%, and 9.7%, respectively. Specifically, in terms of the body feeling lazy, females were 14.8% higher than males. Based on these data, it can be inferred that compared to male college students, female college students are more likely to experience fatigue in hot outdoor environments.

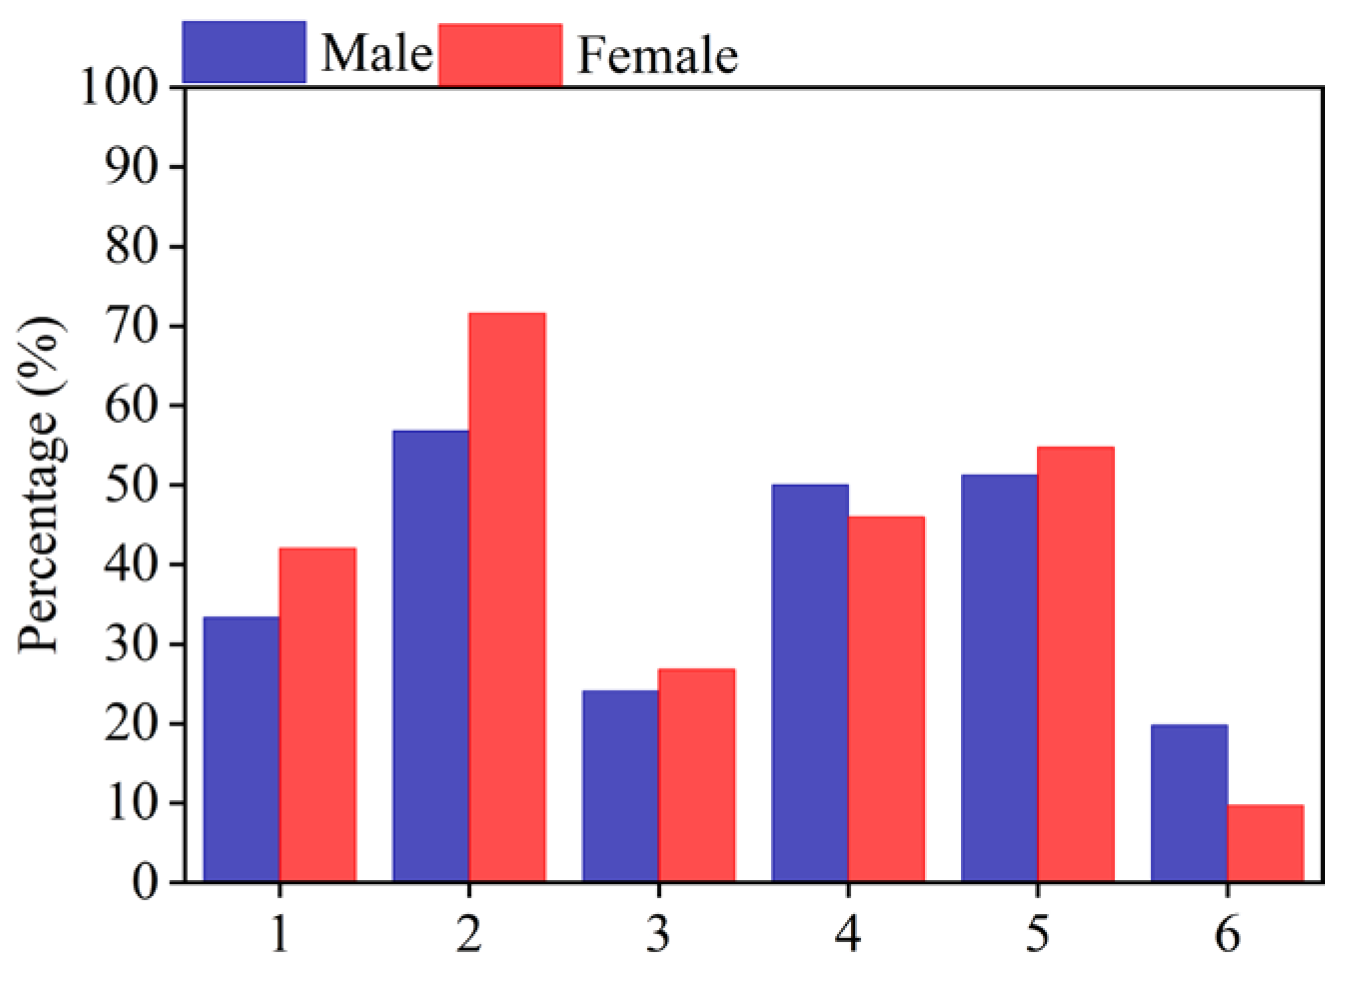
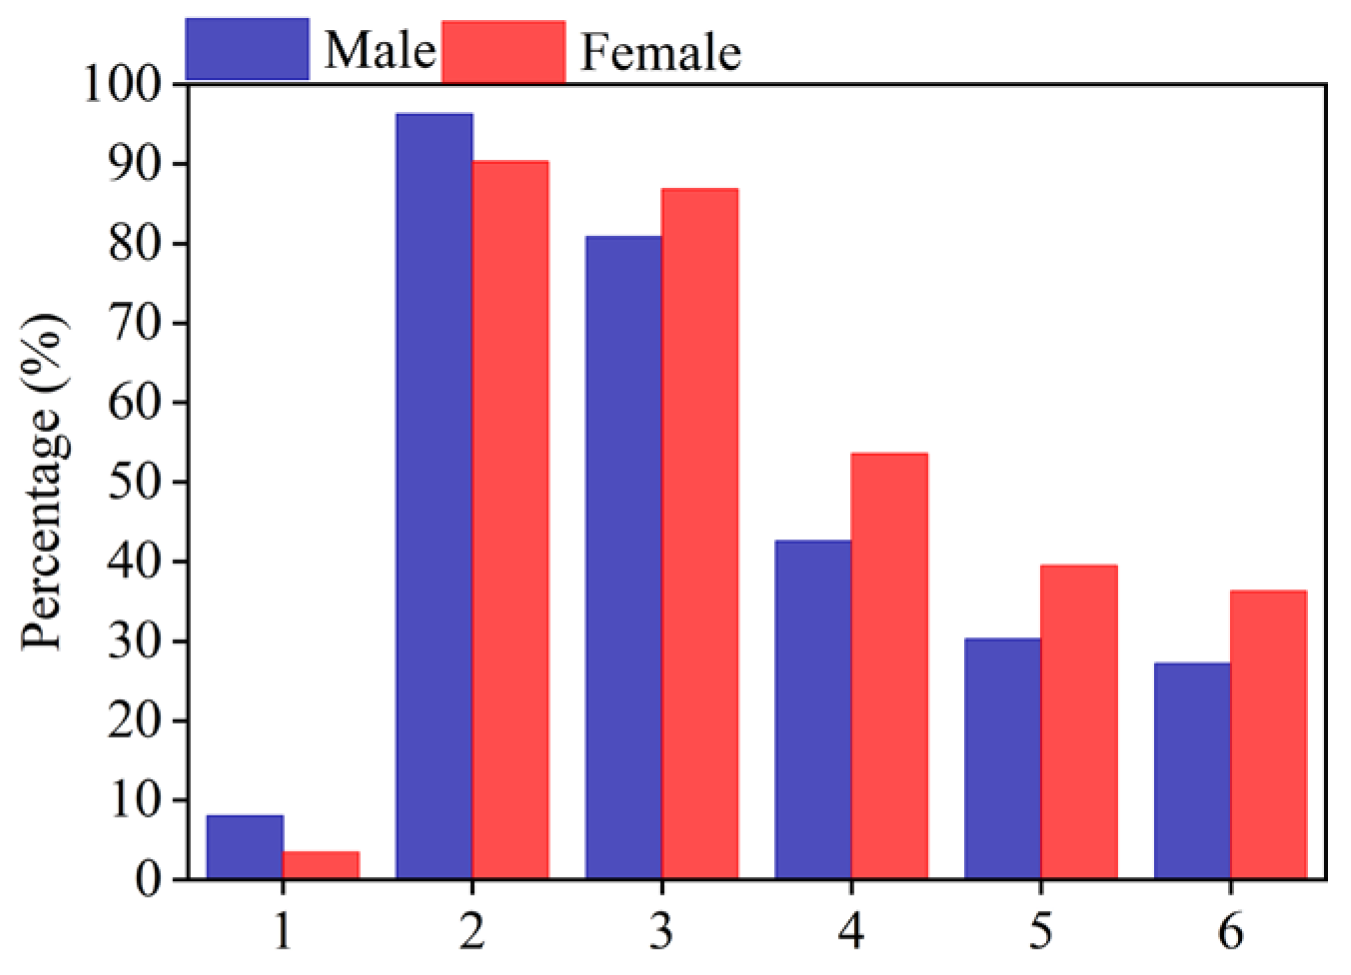
3.3.3. Psychological Evaluation Votes

The percentage of psychological evaluation votes is shown in Figure 5. Among male college students, the percentages reporting distracted/unable to concentrate, no desire to talk, anger/easily irritable, anxiety, and none were 48.1%, 64.2%, 31.5%, 34.0%, and 21.6%, respectively. Among female college students, the percentages reporting distracted/unable to concentrate, no desire to talk, anger/easily irritable, anxiety, and none were 49.9%, 70.7%, 37.9%, 46.4%, and 14.5%, respectively. Based on the above data, it can be inferred that compared to male college students, hot outdoor environments are more likely to induce negative emotions in female college students. Specifically, the difference in the percentage reporting anxiety between the two groups can be as high as 12.4%.

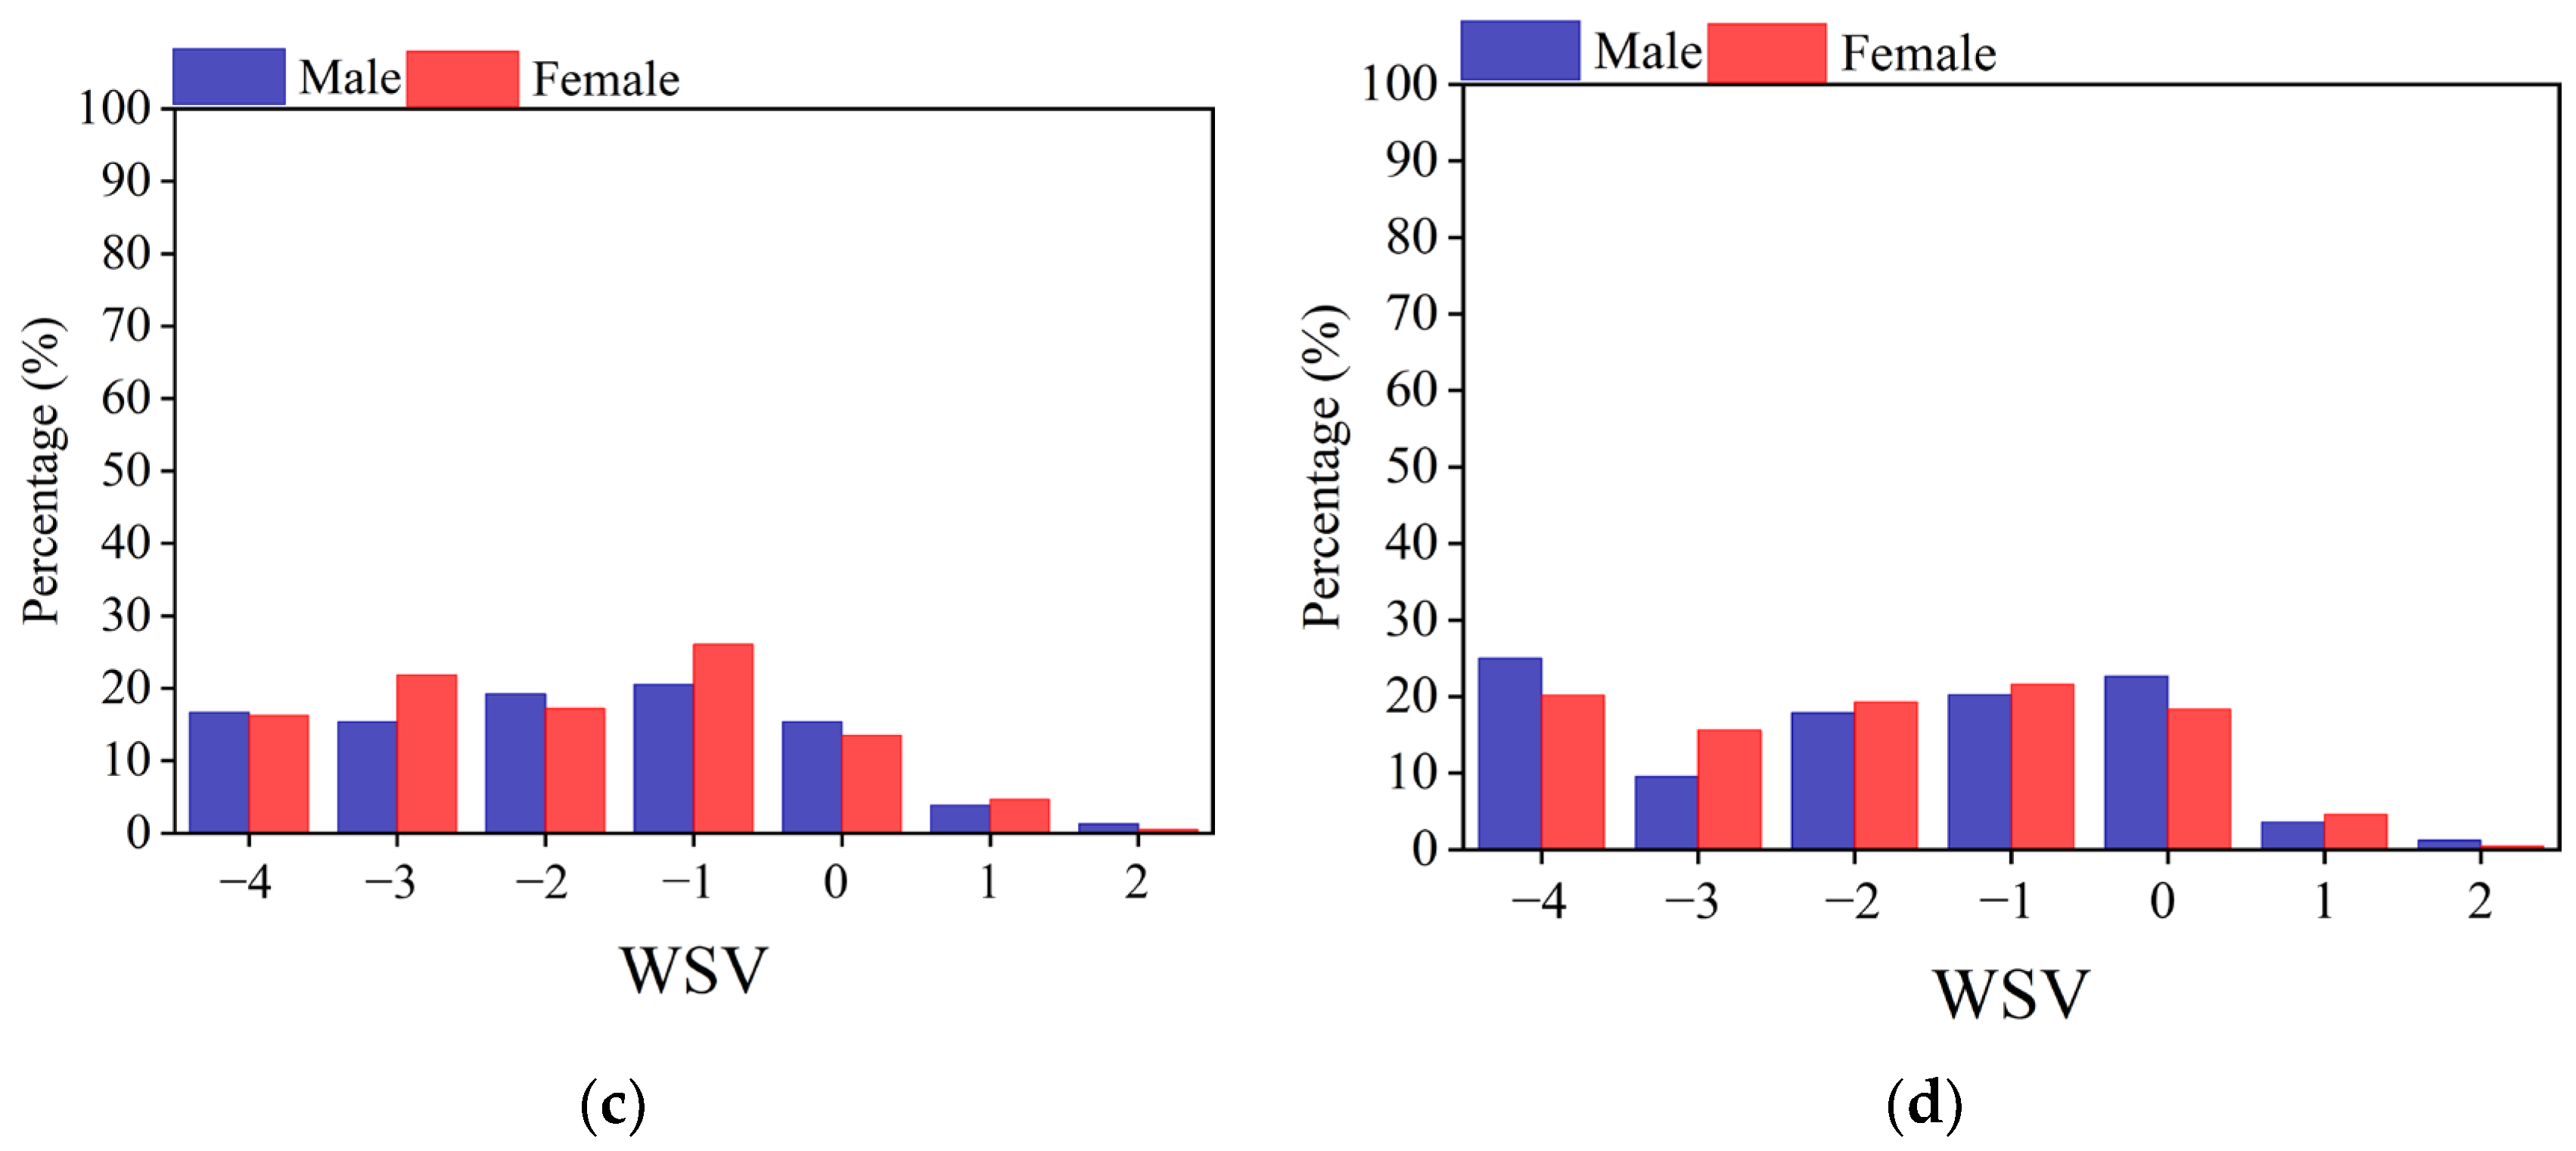
3.3.4. Thermal Sensation Votes and Wind Sensation Votes

The average air temperature recorded by the questionnaires collected for this study was 32 °C. Therefore, all data were divided into groups above and below 32 °C in order to demonstrate more clearly the differences in voting between different temperature zones.
The thermal sensation vote for the group with an air temperature below 32 °C is shown in Figure 6a. In total, 42.3% of males and 50.2% of females felt “hot” (3), and 20.5% of males and 17.2% of females felt “very hot” (4). Only 6.4% of men and 5.1% of women felt neither cold nor hot (neutral, 0). In contrast, as shown in Figure 6b, in the group where the air temperature was higher than 32 °C, 52.4% of males and 45.2% of females felt “hot” (3), while the number of males and females feeling “very hot” (4) increased to 28.6% and 32.1%, respectively. As shown in Figure 6c, in the group with air temperatures below 32 °C, 16.7% of males and 16.3% of females perceived the wind speed to be too low (−4). In total, 15.4% of males and 21.9% of females perceived the wind speed to be very low (−3), and 15.4% of males and 13.5% of females perceived the wind speed to be just right (0). However, almost no one thought the wind speed was too high. In contrast, as shown in Figure 6d in the group where the air temperature was higher than 32 °C, 25.0% of males and 20.2% of females thought that the wind speed was too low (−4). This suggests that in hot outdoor environments, people may be more willing to accept higher wind speeds.

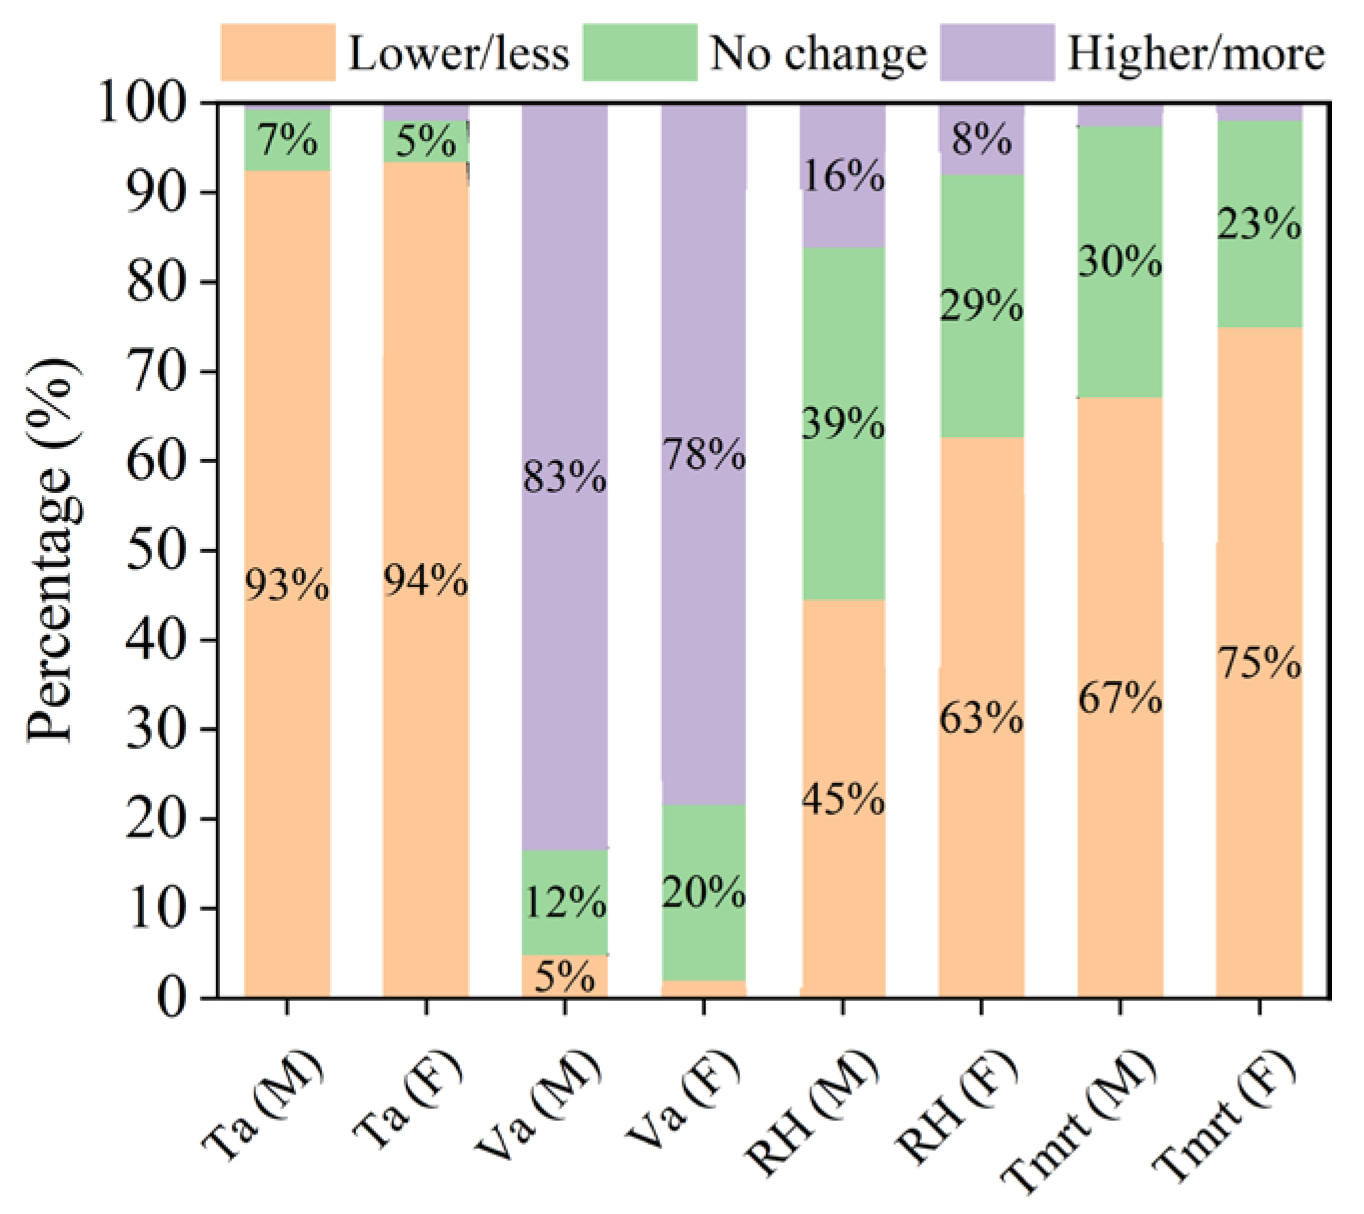
3.3.5. Thermal Adaptation Behavior Votes

The percentage of thermal adaptation behaviors by gender is shown in Figure 7. For males, the percentages of thermal adaptation behaviors are as follows: 8.0% chose drinking hot beverages; 96.3% chose drinking cold beverages; 80.9% chose seeking shade; 42.6% chose using an umbrella; 30.2% chose using a portable fan; 27.2% chose wearing sun-protective clothing. For females, the percentages of heat adaptation behaviors are as follows: 3.5% chose drinking hot beverages; 90.3% chose drinking cold beverages; 86.8% chose seeking shade; 53.6% chose using an umbrella; 39.5% chose using a portable fan; 36.3% chose wearing sun-protective clothing. Based on the above summary, males are relatively more inclined than females to choose cooling through drinking hot beverages during the summer. On the other hand, females are relatively more inclined than males to choose using an umbrella, a portable fan, and wearing sun-protective clothing for cooling purposes. It is important to note that whether or not an individual carries a parasol or portable fan is largely influenced by the individual’s decision to do so while out and about.

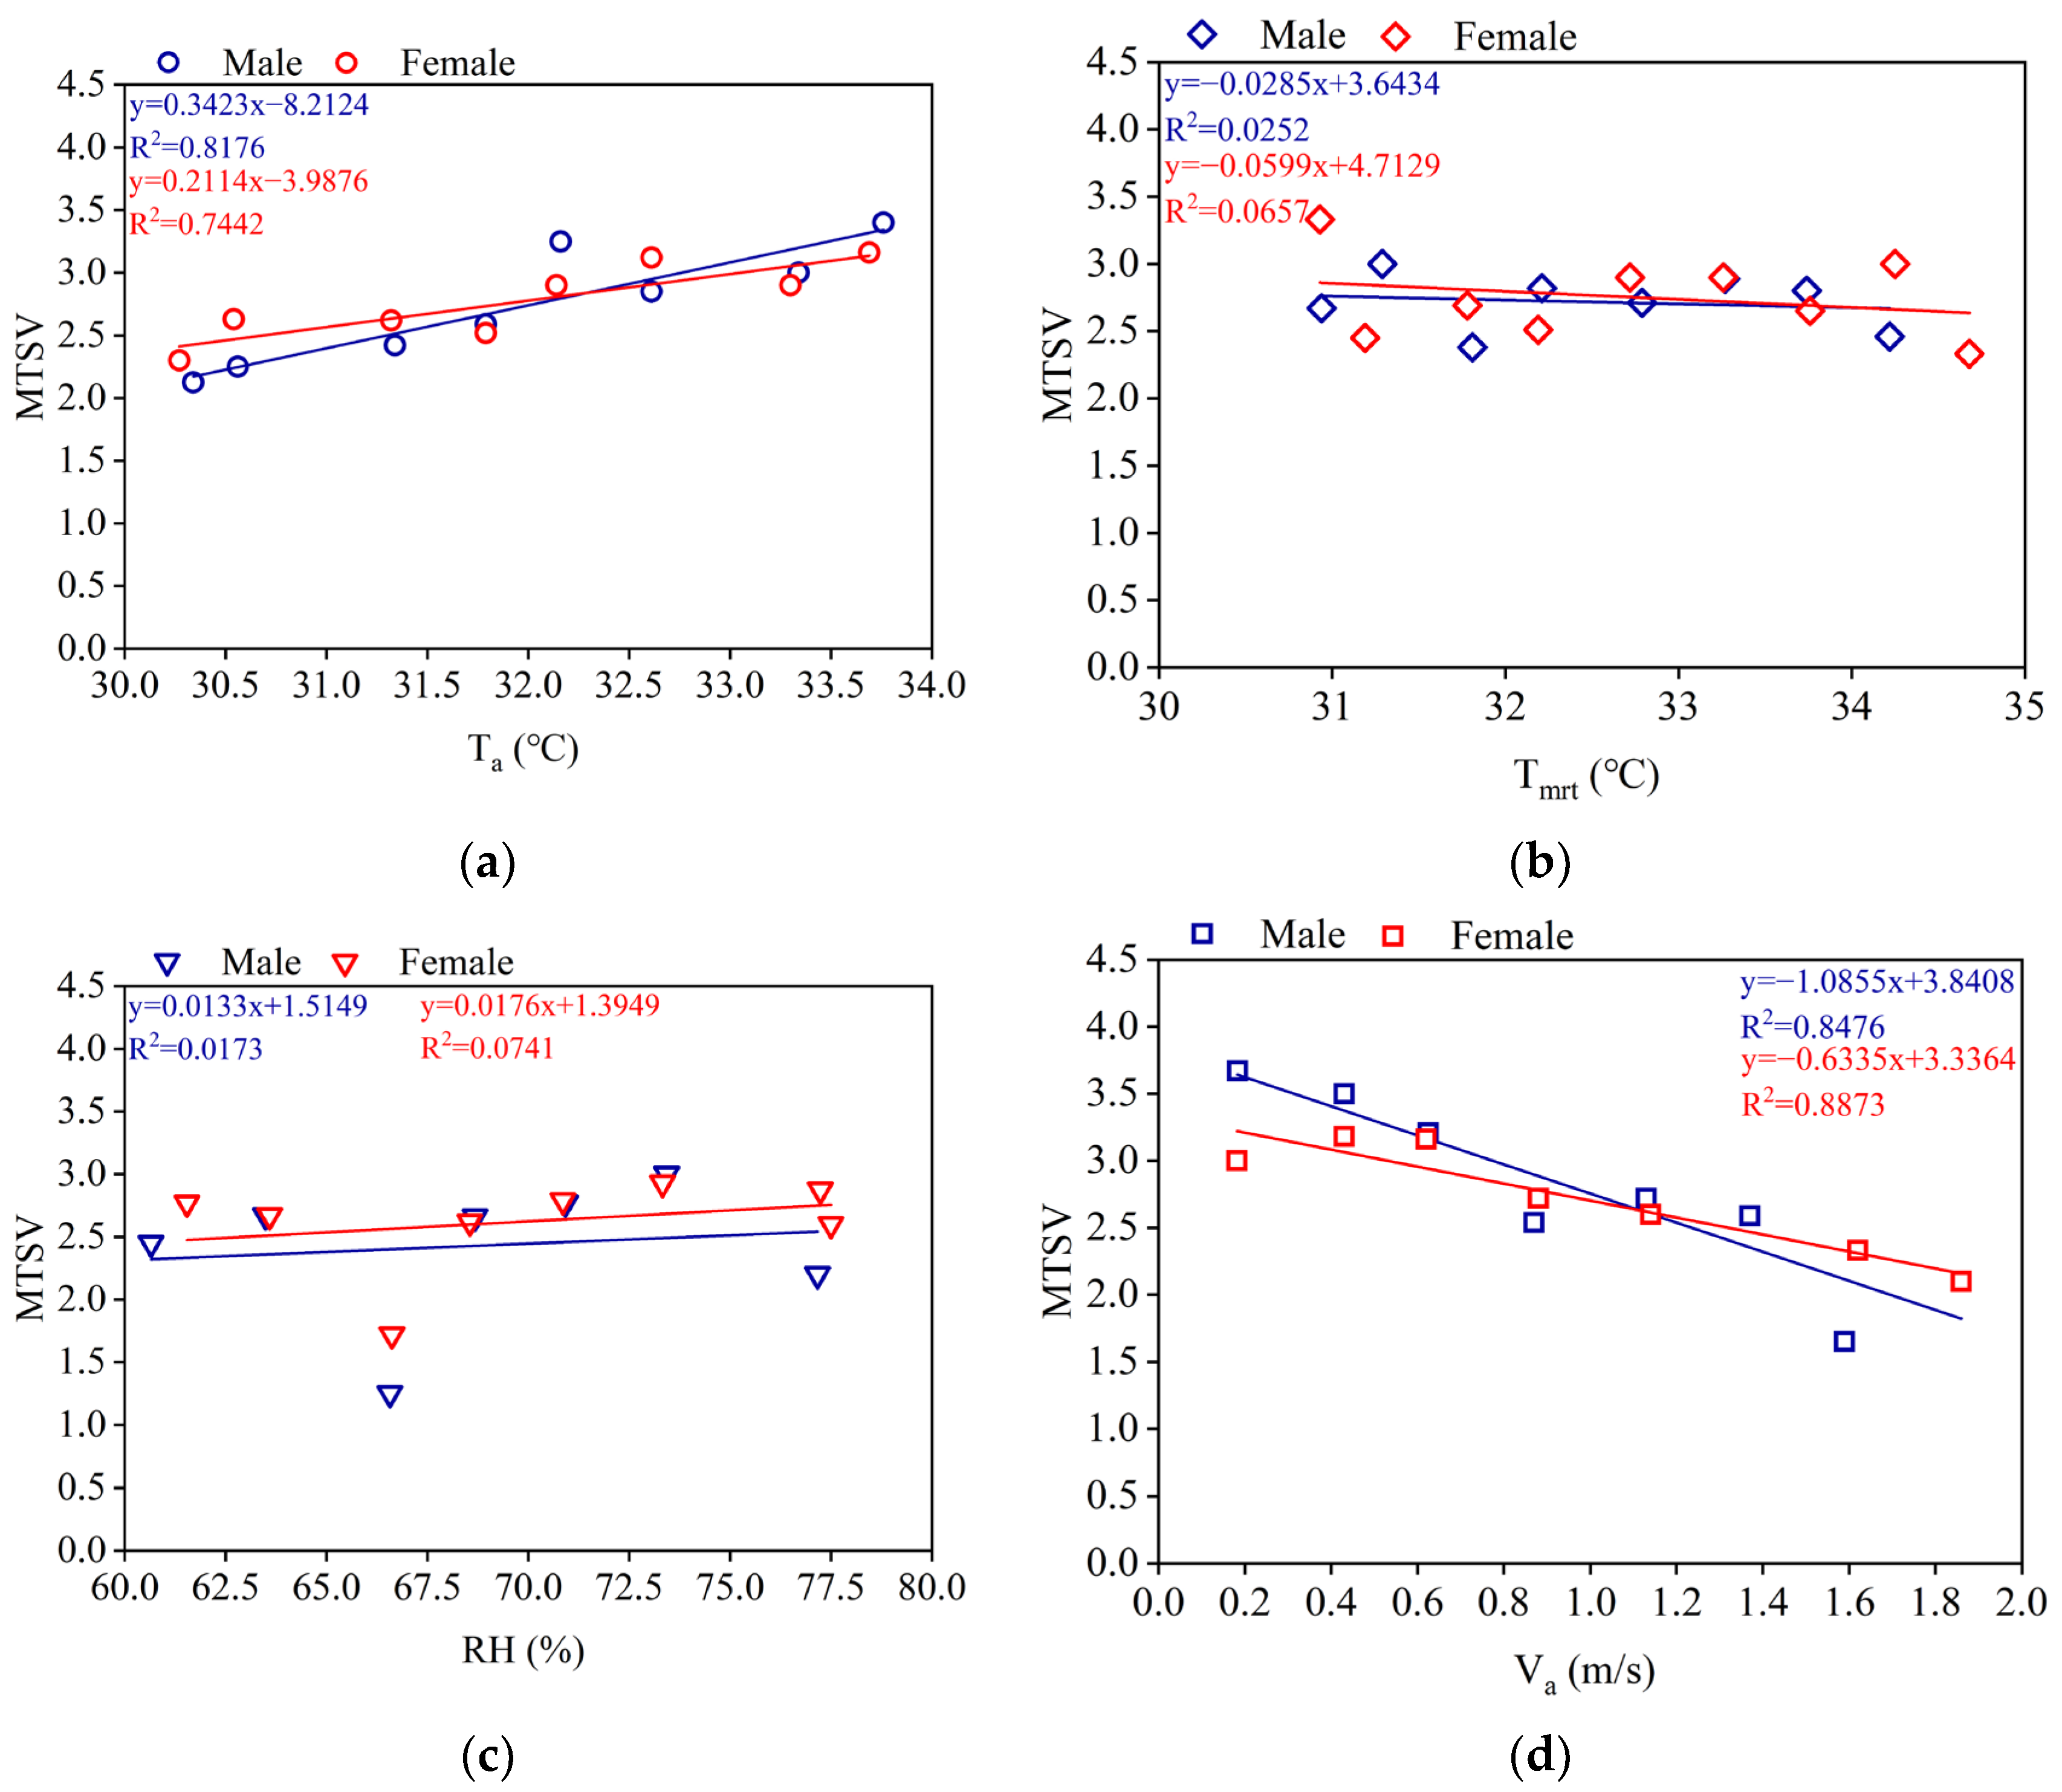
3.4. Thermal Parameters with MTSV

Linear regression was employed to study the relationship between thermal environmental parameters and thermal sensation votes. In this study, the mean thermal sensation votes were calculated with intervals of 0.5 °C for air temperature and mean radiant temperature, 2.5% for relative humidity, and 0.25 m/s for wind speed.
As shown in Figure 8, both males (R2 = 0.8176) and females (R2 = 0.7442) show a significant correlation between their thermal sensation voting and the air temperature. When MTSV = 2.5, it means people will feel hot. The corresponding temperatures for males and females are 31.3 °C and 30.7 °C, respectively. Additionally, both males and females show no correlation between their thermal sensation votes in the corridor and relative humidity (R2 < 0.1) or mean radiant temperature (R2 < 0.1). Furthermore, both males (R2 = 0.8476) and females (R2 = 0.8873) show a highly significant relationship between MTSV and wind speed. Therefore, as the wind speed increases, both males and females experience a decrease in thermal sensation. The corresponding wind speeds for males and females when MTSV = 2.5, calculated using the relationship, are 1.23 m/s and 1.32 m/s, respectively.

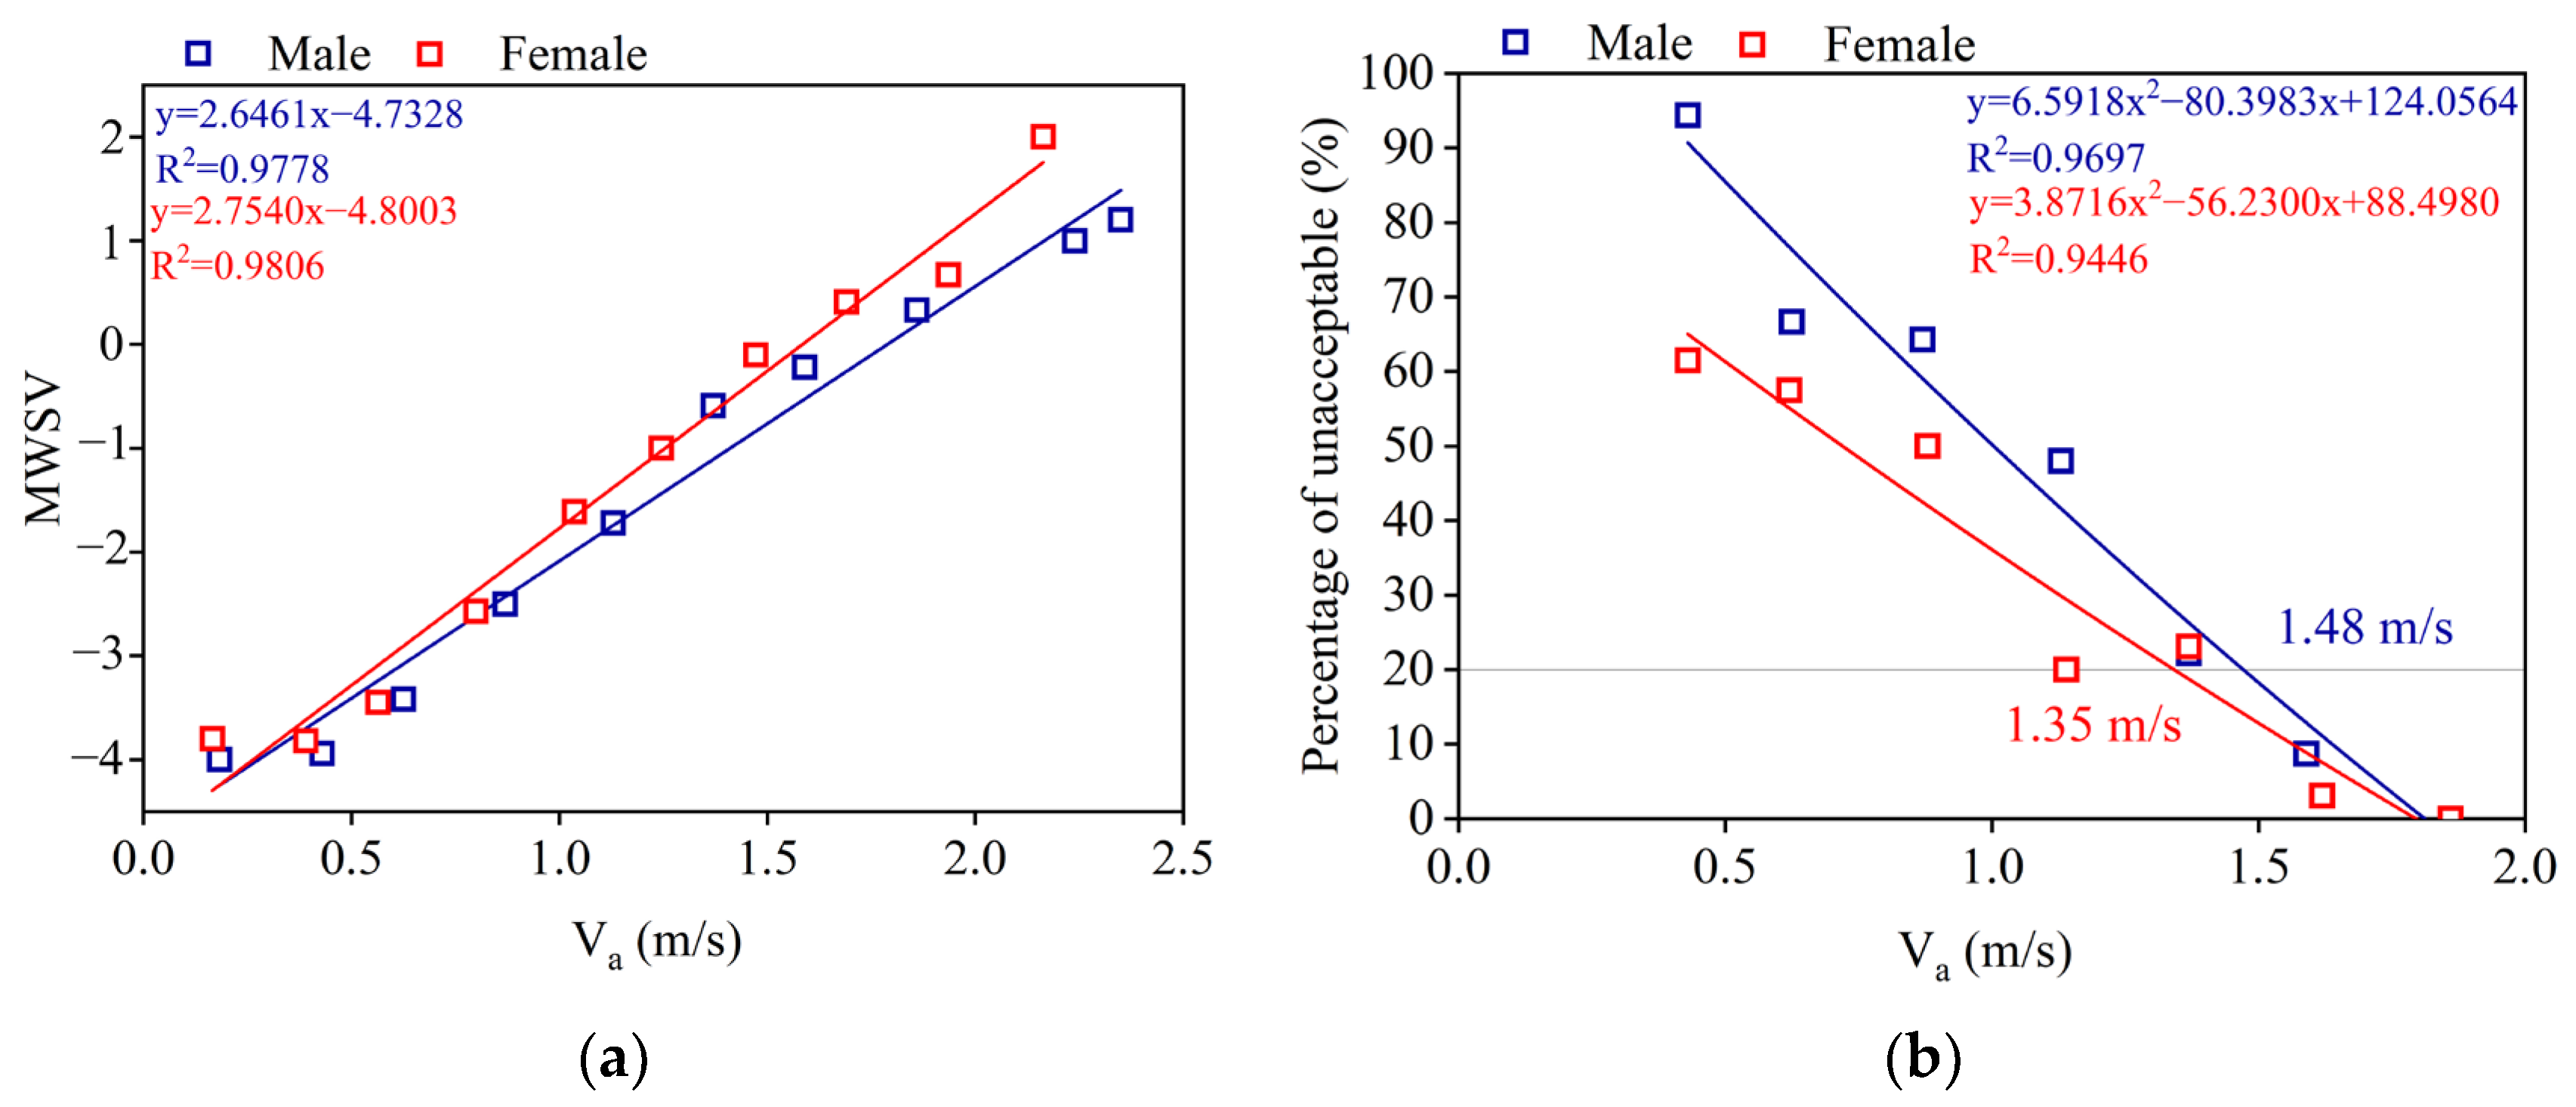
3.5. MWSV and Unacceptable Wind Speed

The mean wind sensation votes were calculated with intervals of 0.25 m/s for wind speed.
As shown in Figure 9, wind sensation voting shows a strong correlation with wind speed (R2 > 0.9). When MWSV = 0, it indicates that people perceive the wind speed to be just right. Through calculation using the relationship, the neutral wind speeds for males and females were 1.79 m/s and 1.74 m/s, respectively. When MWSV = −2, it indicates that people perceive the wind speed to too low, and the corresponding wind speeds were 1.03 m/s (male) and 1.02 m/s (female). Furthermore, the relationship between wind speed and the unacceptability rate was significant (R2 > 0.9). When the wind speed was >1.48 m/s, over 80% of males thought the wind speed could be accepted, while when wind speed was > 1.35 m/s, over 80% of females thought the wind speed could be accepted.

3.6. Heart Rate and Metabolic Rate

Heart rate and metabolic levels are shown in Figure 10. For males, the minimum, maximum, and average heart rates were 66.0, 107, and 87.5 beats/min, respectively. For females, the minimum, maximum, and average heart rates were 50, 120, and 90 beats/min, respectively. This is similar to a study conducted in Guangzhou investigating the thermal comfort of college students during military training. The average heart rate of students during rest periods ranged from 78.2 to 101.0 beats/min [32], confirming the accuracy of this study’s tests. In corridor spaces, compared to males, females have a lower minimum heart rate but a higher average heart rate. Instantaneous metabolic rates for males and females were estimated based on heart rate. For males, the minimum, maximum, and average metabolic rates were 83.7, 273.7, and 171.6 W/m2, respectively. For females, the minimum, maximum, and average metabolic rates were 70.7, 255.8, and 145.7 W/m2, respectively. Therefore, males have a higher metabolic rate compared to females.

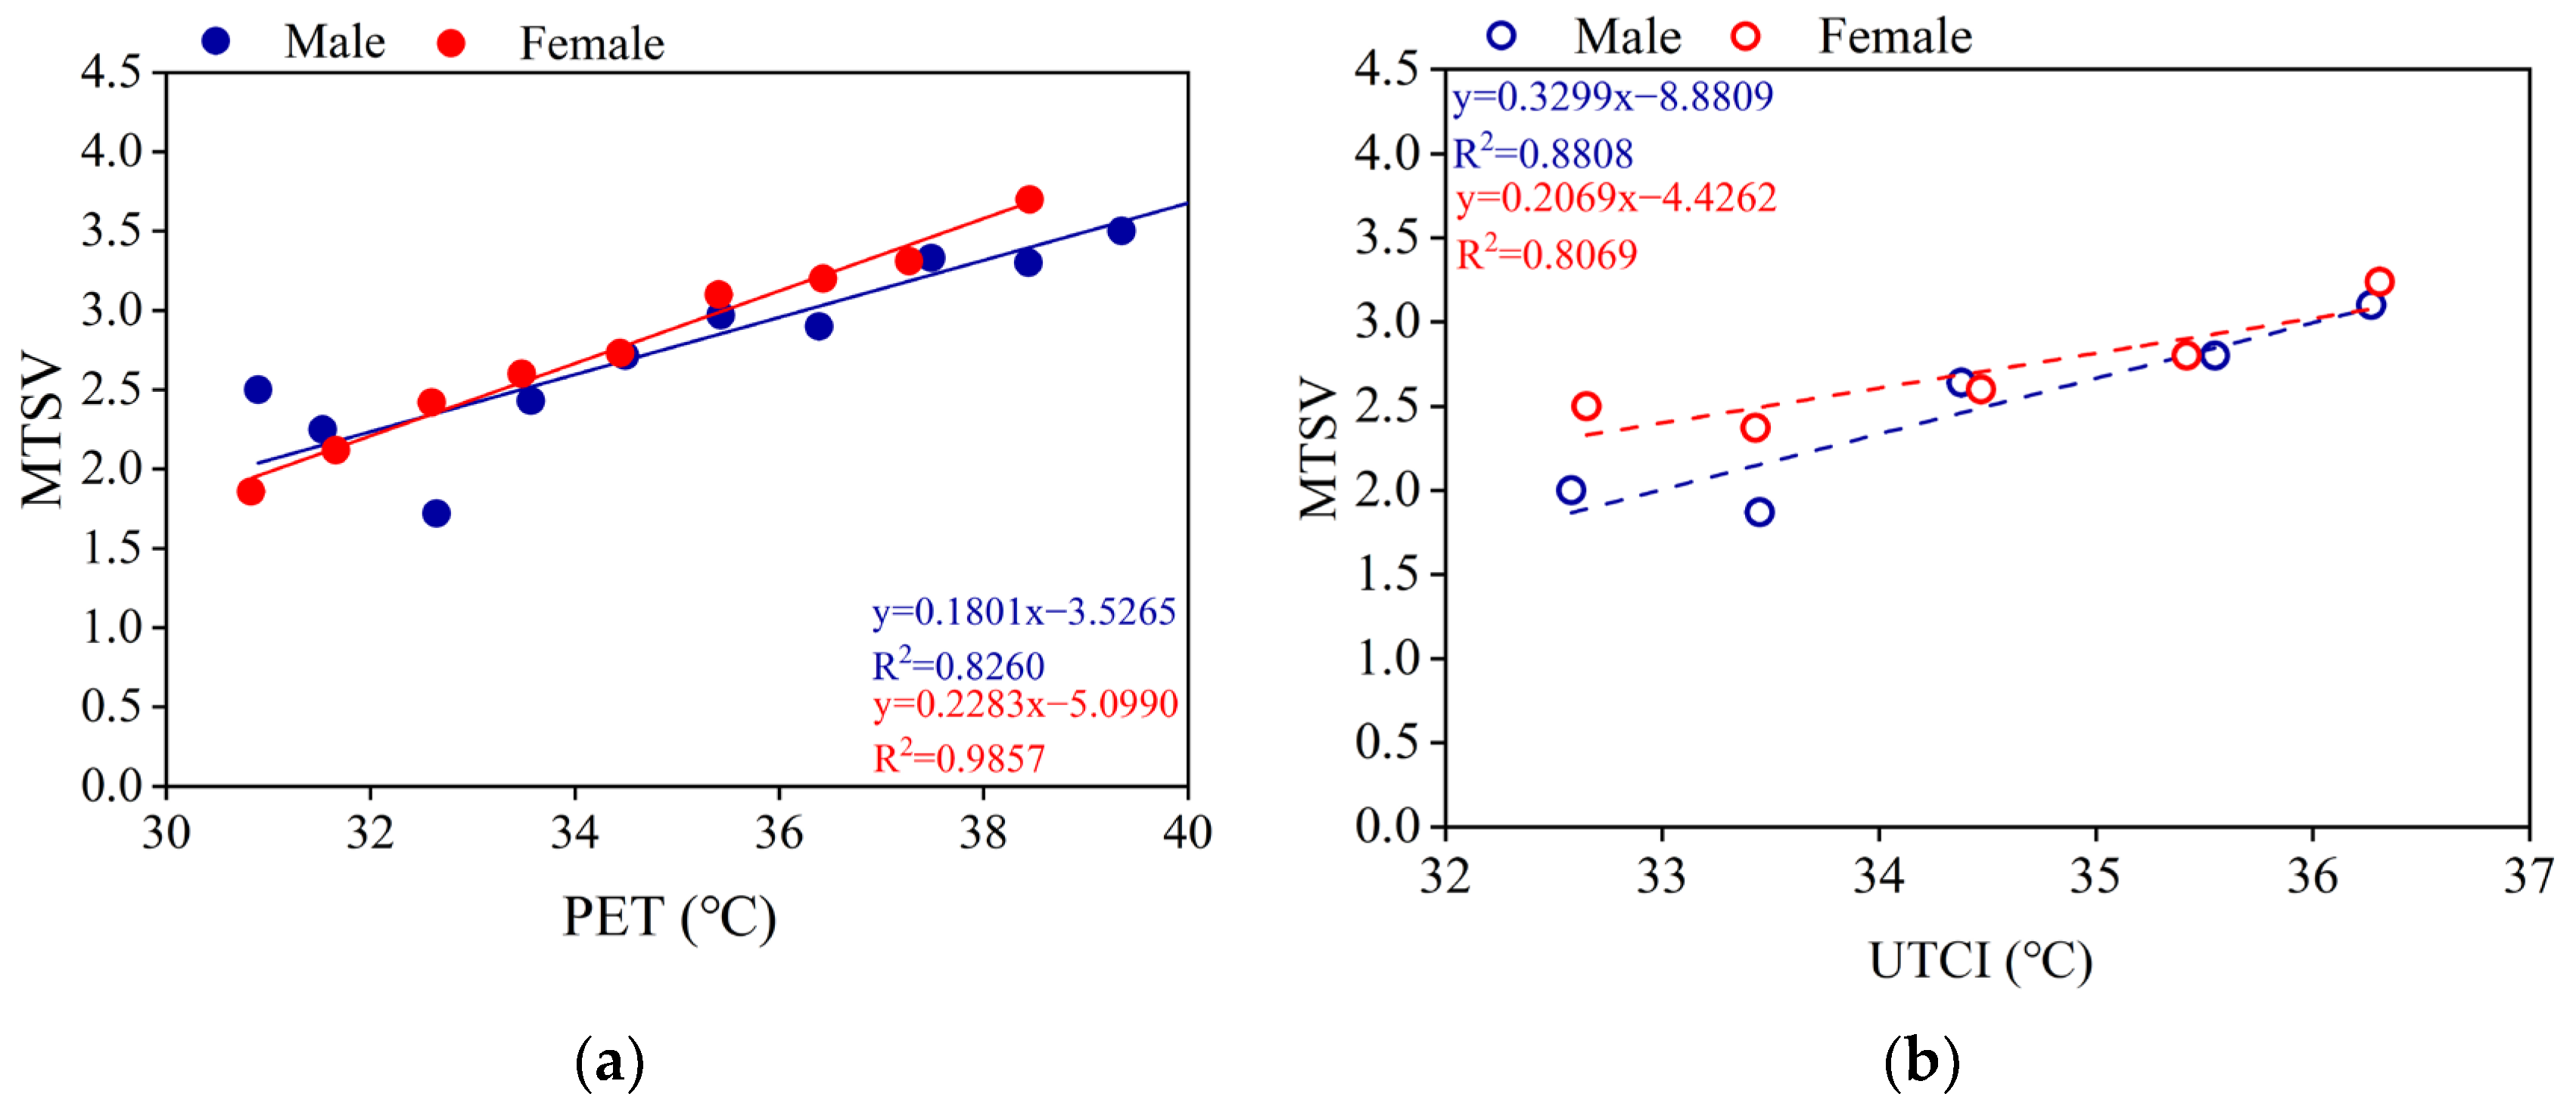
3.7. MTSV with PET and UTCI

The mean thermal sensation votes were calculated with intervals of 1 °C for PET and UTCI.
The results indicate that MTSV showed a significant linear relationship with PET and UTCI (Figure 11). The relationship between MTSV and PET was more significant for females (R2 = 0.9857) compared to males (R2 = 0.8260), while the relationship between MTSV and UTCI was more significant for males (R2 = 0.8176) compared to females (R2 = 0.7442). Regarding PET, the slope of PET against MTSV is 0.1801, corresponding 5.6 °C PET/MTSV (male); the slope of PET against MTSV is 0.2283, corresponding 4.4 °C PET/MTSV (female). When MTSV = 2.5, which indicates that individuals will experience strong heat stress, the corresponding PET values for males and females were 33.5 °C and 33.3 °C, respectively. Regarding UTCI, the slope of UTCI against MTSV is 0.3299, corresponding 3.0 °C UTCI/MTSV (male); the slope of UTCI against MTSV is 0.2069, corresponding 4.8 °C UTCI/MTSV (female). When MTSV = 2.5, the corresponding UTCI values for males and females were 34.5 °C and 33.5 °C, respectively. In summary, in corridor spaces, females perceive lower thermal indices as hotter compared to males. The specific thermal stress levels for males and females are shown in Table 3. When the PET (UTCI) values reach 39.0 °C (37.5 °C) for males and 37.7 °C (38.3 °C) for females, individuals in corridor spaces will face extreme heat stress.

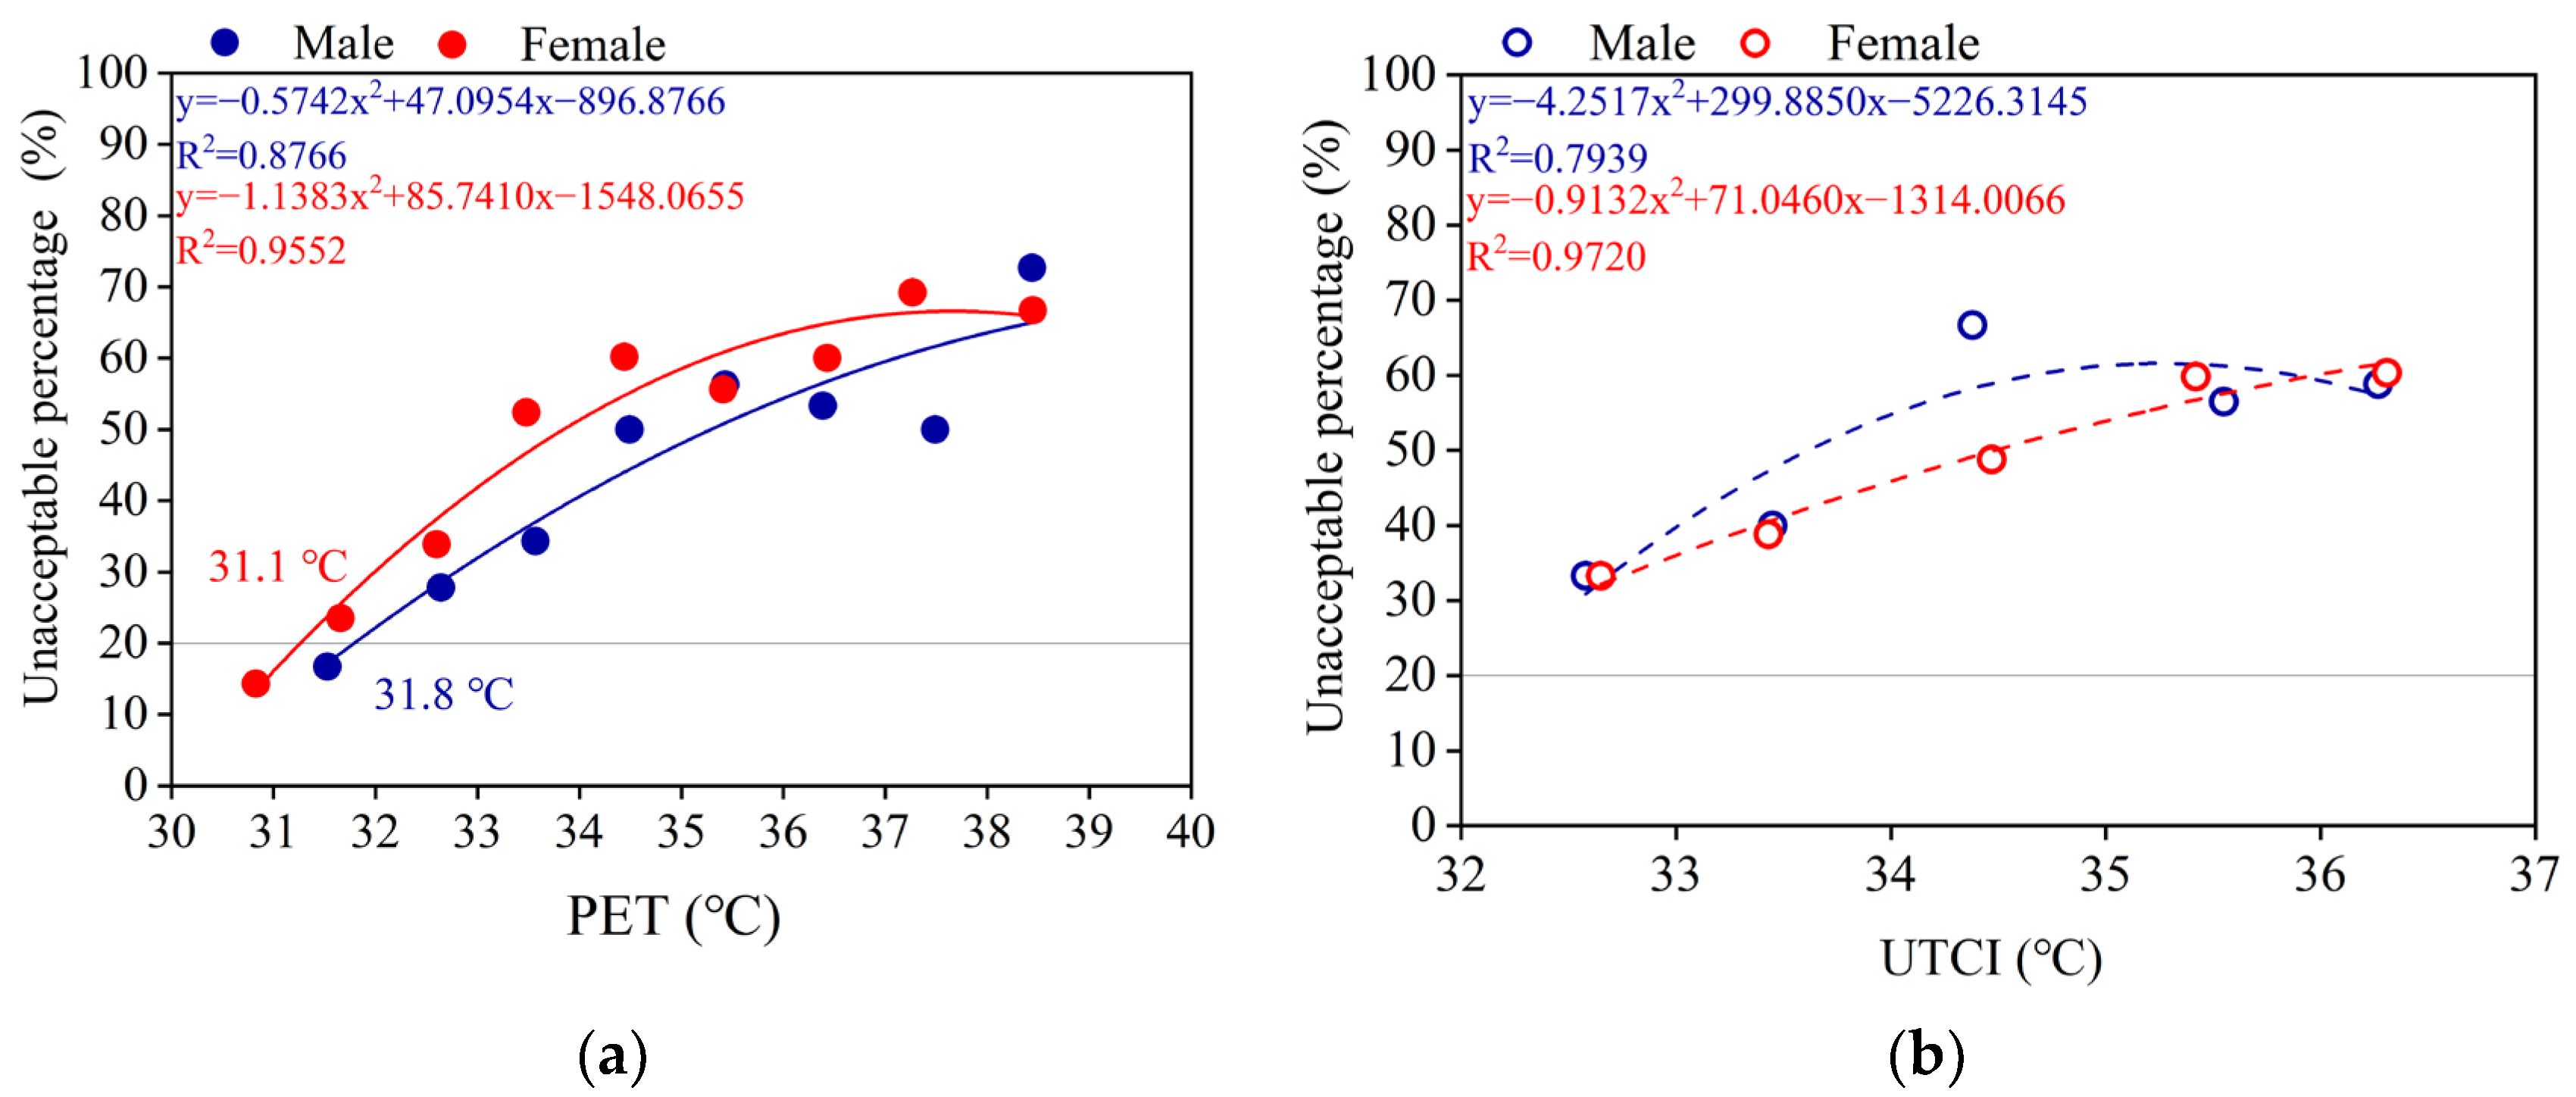
3.8. Unacceptable PET and UTCI

As shown in Figure 12, the relationship between the unacceptable percentage and PET is slightly lower for males (R2 = 0.8766) compared to females (R2 = 0.9552), while the relationship between the unacceptable percentage and UTCI is more significant for females (R2 = 0.9702) compared to males (R2 = 0.7939). The calculations show that the threshold of unacceptable PET for males is 31.8 °C, slightly higher than 31.1 °C for females. Regarding UTCI, due to the limited range of UTCI values obtained in this experiment, the threshold of unacceptable UTCI could not be calculated. However, by comparing the unacceptable PET values, it is evident that in corridor spaces, males can tolerate higher outdoor thermal environments compared to females.

4. Discussion

Previous research has extensively focused on the primary thermal parameters affecting outdoor thermal comfort across various climatic regions. For instance, in Changsha, Ta plays a significant role in people’s perception of outdoor thermal comfort [48]. In Marrakech and Phoenix, there is a significant correlation (R2 > 0.9) between Tg and residents’ actual thermal sensation votes [49]. A study in Shanghai indicated that air temperature, wind speed, and solar radiation are the primary microclimate parameters influencing thermal sensation votes and thermal comfort votes [50]. In Guangzhou, air temperature and mean radiant temperature are both microclimate parameters that influence residents’ thermal sensation [51]. However, there may be differences in the primary environmental parameters affecting pedestrian thermal sensation across different built environments [52]. For example, a study in Guangzhou indicated that air temperature and mean radiant temperature are the main parameters influencing pedestrian thermal sensation in courtyard spaces. However, in adjacent open spaces, only air temperature is the primary parameter affecting pedestrian thermal sensation [34]. In the context of this study, regardless of gender, factors affecting thermal sensation among college students in the corridors of teaching buildings include air temperature and wind speed.
Different built environments may impose varying thermal stress on pedestrians. For instance, in outdoor open spaces, participants may perceive hot when the PET (UTCI) values reach 34.7 °C (36.5 °C) [51], whereas in courtyard or overhead spaces, the discomfort threshold may be reached at 37.8 °C (courtyard) or 35.8 °C (overhead space) [34]. These thresholds are higher than the PET values reported in this study, which were 33.5 °C (male) and 33.3 °C (female). Furthermore, some studies suggest that there are differences in thermal tolerance between genders. A study conducted during the summer in Guangzhou found that the threshold at which male children perceive hot is 1.91 °C (UTCI) higher than that for female children [13]. In this study, male college students perceive hot at a threshold that is 0.2 (1.0) °C PET (UTCI) higher compared to female students. This may be because age and gender significantly affect the metabolic heat production in young individuals. As individuals age, their metabolic heat production typically increases, with boys usually having higher values than girls, and males generally having higher metabolic rates than females [53]. Therefore, this may result in higher instantaneous thermal index values for male college students compared to females under the same outdoor thermal conditions. Furthermore, in this study, the upper acceptable limit of PET for females was 31.1 °C, while for males it was 31.8 °C. This is similar to findings from a study in Taiwan, where the upper acceptable PET limit for females (28.8 °C) was lower than that for males (33.2 °C) [54]. Similarly, a study conducted in Al Ain, UAE, which investigated how gender affects subjective comfort and behavioral adaptation, noted that males and females have different ranges of thermal comfort, with females having an upper limit of comfort temperature that is 0.7 °C (PET) lower relative to males [55]. Furthermore, it is worth noting that an individual’s perception of thermal comfort may be related to an individual’s willingness to travel. A study of thermal comfort in waterfront campgrounds showed that the upper limit of acceptable temperature for an individual while playing was 36.7 °C [56], which was much higher than in this study. The data above indicate that females have a lower tolerance for heat compared to males. In other words, female participants psychologically perceive hot conditions as less tolerable than male participants do.
Previous studies have attempted to explain the impact of indoor physical environmental factors on students’ internal anxiety [25]. However, compared to indoor environments, outdoor conditions can be more severe, potentially heightening individuals’ susceptibility to risks [57]. One finding from this study is that gender differences in thermal tolerance may make females more vulnerable to health risks in hot outdoor environments. As shown in Figure 4 and Figure 5, compared to male college students, females exhibit a higher tendency to experience body laziness (14.8% higher) and internal anxiety (12.4% higher). Additionally, the behavioral differences in thermal adaptation between females and males further demonstrate females’ resistance to hot outdoor environments compared to males (Figure 7). Similar to the results of this study, a study showed that females were more biased toward adjusting thermal comfort through equipment [58].

5. Limitations and Future Research

In order to fully understand the findings of this study, it is important to acknowledge its limitations. This study investigated the thermal comfort of college students in outdoor corridor spaces during summer in a hot and humid region. However, corridors serve as a passive ventilation and shading strategy, and their impact on outdoor thermal comfort for individuals may vary from season to season. Therefore, future research should consider conducting studies in various seasons. Furthermore, this study only focused on the outdoor thermal comfort levels of college students after resting in outdoor corridor spaces. Future research should also explore differences in the thermal comfort of college students at different activity intensities in outdoor corridor spaces and the resulting changes in mental mood. Additionally, there was an imbalance in the number of males and females in this study, and future research should try to make the subjects gender balanced to avoid potential problems.

6. Conclusions

This study investigated the corridor spaces of university teaching buildings in hot and humid regions during the summer. It combined thermal environment parameters, thermal indices, and a questionnaire survey to examine the thermal sensations of male and female college students in these corridor spaces. The conclusion drawn from the study are as follows:
(1)
In corridor spaces, Ta and Va are the primary thermal environment parameters influencing colleges’ thermal sensation;
(2)
Males and females perceive hot when their PET (UTCI) values reach 33.5 (34.5) °C and 33.3 (33.5) °C, respectively. When the PET (UTCI) values reach 39.0 °C (37.5 °C) for males and 37.7 °C (38.3 °C) for females, individuals in corridor spaces will face extreme heat stress;
(3)
The unacceptable PET for males and females are 31.1 °C and 31.8 °C, respectively, indicating that females find high-temperature environments more difficult to tolerate than males;
(4)
In hot outdoor environments, females are more prone than males to experience fatigue and negative emotions.

Author Contributions

Conceptualization, Q.Z. and C.L.; methodology, Q.Z.; formal analysis, Q.Z.; investigation, Q.Z. and Y.L.; resources, C.L.; data curation, Q.Z. and Y.L.; writing—original draft preparation, Q.Z.; writing—review and editing, C.L.; visualization, Q.Z.; supervision, C.L.; project administration, C.L. All authors have read and agreed to the published version of the manuscript.

Funding

This research received no external funding.

Data Availability Statement

The data presented in this study are available on request from the corresponding author.

Conflicts of Interest

The authors declare no conflicts of interest.

References

  1. Yang, J.; Zhao, Y.; Guo, T.; Luo, X.; Ji, K.; Zhou, M.; Wan, F. The impact of tree species and planting location on outdoor thermal comfort of a semi-outdoor space. Int. J. Biometeorol. 2023, 67, 1689–1701. [Google Scholar] [CrossRef] [PubMed]
  2. Lin, P.; Song, D.; Qin, H. Impact of parking and greening design strategies on summertime outdoor thermal condition in old mid-rise residential estates. Urban. For. Urban. Gree 2021, 63, 127200. [Google Scholar] [CrossRef]
  3. Chen, X.; Zhao, H.; Li, P.; Yin, Z. Remote sensing image-based analysis of the relationship between urban heat island and land use/cover changes. Remote Sens. Environ. 2006, 104, 133–146. [Google Scholar] [CrossRef]
  4. Rizwan, A.M.; Dennis, Y.; Liu, C.H. A review on the generation, determination and mitigation of Urban Heat Island. J. Environ. Sci. 2008, 20, 120–128. [Google Scholar] [CrossRef]
  5. Zhao, L.; Lee, X.; Smith, R.B.; Oleson, K. Strong contributions of local background climate to urban heat islands. Nature 2014, 511, 216–219. [Google Scholar] [CrossRef] [PubMed]
  6. Tian, X.; Zhang, H.; Liu, L.; Huang, J.; Liu, L.; Liu, J. Establishment of LCZ-based urban building energy consumption dataset in hot and humid subtropical regions through a bottom-up method. Appl. Energ. 2024, 368, 123491. [Google Scholar] [CrossRef]
  7. Wang, Q.; Peng, L.L.H.; Jiang, W.; Yin, S.; Feng, N.; Yao, L. Urban form affects the cool island effect of urban greenery via building shadows. Build. Environ. 2024, 254, 111398. [Google Scholar] [CrossRef]
  8. Abdallah, A.S.H.; Mahmoud, R.M.A. Urban morphology as an adaptation strategy to improve outdoor thermal comfort in urban residential community of new assiut city, Egypt. Sustain. Cities Soc. 2022, 78, 103648. [Google Scholar] [CrossRef]
  9. Teshnehdel, S.; Akbari, H.; Di Giuseppe, E.; Brown, R.D. Effect of tree cover and tree species on microclimate and pedestrian comfort in a residential district in Iran. Build. Environ. 2020, 178, 106899. [Google Scholar] [CrossRef]
  10. Zhang, K.; Qi, F.; Zhang, T.; Zhou, L. The impact of trees on the peak cooling load of detached rural residences. Energ. Build. 2024, 317, 114311. [Google Scholar] [CrossRef]
  11. Ali-Toudert, F.; Mayer, H. Numerical study on the effects of aspect ratio and orientation of an urban street canyon on outdoor thermal comfort in hot and dry climate. Build. Environ. 2007, 42, 1553–1554. [Google Scholar] [CrossRef]
  12. Niu, J.; Hong, B.; Geng, Y.; Mi, J.; He, J. Summertime physiological and thermal responses among activity levels in campus outdoor spaces in a humid subtropical city. Sci. Total Environ. 2020, 728, 138757. [Google Scholar] [CrossRef]
  13. Guo, T.; Lin, Z.; Zhao, Y.; Fang, Z.; Fan, Y.; Zhang, X.; Yang, J.; Li, Y. Investigation and optimization of outdoor thermal comfort in elementary school campuses: Example from a humid-hot area in China. Build. Environ. 2024, 248, 111055. [Google Scholar] [CrossRef]
  14. Cohen, P.; Cohen, S.; Shashua-Bar, L.; Tanny, J.; Potchter, O. Outdoor thermal perception and adaptation of immigrants from cold climates to hot arid climate. Build. Environ. 2023, 243, 110631. [Google Scholar] [CrossRef]
  15. Yuan, T.; Hong, B.; Li, Y.; Wang, Y.; Wang, Y. The Right Activities at Right Spaces: Relationships between Elderly Adults’ Physical Activities and Thermal Responses. Buildings 2023, 13, 721. [Google Scholar] [CrossRef]
  16. Pontzer, H.; Yamada, Y.; Sagayama, H.; Ainslie, P.N.; Andersen, L.F.; Anderson, L.J.; Arab, L.; Baddou, I.; Bedu-Addo, K.; Blaak, E.E.; et al. Daily energy expenditure through the human life course. Science 2021, 373, 808. [Google Scholar] [CrossRef] [PubMed]
  17. Wang, D.; Jiang, J.; Liu, Y.; Wang, Y.; Xu, Y.; Liu, J. Student responses to classroom thermal environments in rural primary and secondary schools in winter. Build. Environ. 2017, 115, 104–117. [Google Scholar] [CrossRef]
  18. Fang, Z.; Tang, T.; Zheng, Z.; Zhou, X.; Liu, W.; Zhang, Y. Thermal responses of workers during summer: An outdoor investigation of construction sites in South China. Sustain. Cities Soc. 2021, 66, 102705. [Google Scholar] [CrossRef]
  19. Fang, Z.; Feng, X.; Xu, X.; Zhou, X.; Lin, Z.; Ji, Y. Investigation into outdoor thermal comfort conditions by different seasonal field surveys in China, Guangzhou. Int. J. Biometeorol. 2019, 63, 1357–1368. [Google Scholar] [CrossRef]
  20. Dong, Z.; Zhao, K.; Ren, M.; Ge, J.; Chan, I.Y.S. The impact of space design on occupants’ satisfaction with indoor environment in university dormitories. Build. Environ. 2022, 218, 109143. [Google Scholar] [CrossRef]
  21. Weitzman, E.R. Poor mental health, depression, and associations with alcohol consumption, harm, and abuse in a national sample of young adults in college. J. Nerv. Ment. Dis. 2004, 192, 269–277. [Google Scholar] [CrossRef]
  22. Sun, N.; Liu, W.; Zheng, Z. Campus outdoor environment, learning engagement, and the mental health of college students during the COVID-19 pandemic: From the perspective of students in different grades. Front. Public Health 2023, 11, 1143635. [Google Scholar] [CrossRef]
  23. Liu, X.; Ping, S.; Gao, W. Changes in Undergraduate Students’ Psychological Well-Being as They Experience University Life. Int. J. Environ. Res. Public Health 2019, 16, 2864. [Google Scholar] [CrossRef] [PubMed]
  24. Mullins, J.T.; White, C. Temperature and mental health: Evidence from the spectrum of mental health outcomes. J. Health Econ. 2019, 68, 102240. [Google Scholar] [CrossRef] [PubMed]
  25. Wen, Q.; Zhou, Q.; Ye, H.; Guo, Q.; Shan, J.; Huang, Z. A Perceptual Assessment of the Physical Environment in Teaching Buildings and Its Influence on Students’ Mental Well-Being. Buildings 2024, 14, 1790. [Google Scholar] [CrossRef]
  26. Hoisington, A.J.; Stearns-Yoder, K.A.; Schuldt, S.J.; Beemer, C.J.; Maestre, J.P.; Kinney, K.A.; Postolache, T.T.; Lowry, C.A.; Brenner, L.A. Ten questions concerning the built environment and mental health. Build. Environ. 2019, 155, 58–69. [Google Scholar] [CrossRef]
  27. Noelke, C.; McGovern, M.; Corsi, D.J.; Jimenez, M.P.; Stern, A.; Wing, I.S.; Berkman, L. Increasing ambient temperature reduces emotional well-being. Environ. Res. 2016, 151, 124–129. [Google Scholar] [CrossRef] [PubMed]
  28. Chang, C.C.; Oh, R.; Nghiem, T.; Zhang, Y.C.; Tan, C.; Lin, B.B.; Gaston, K.J.; Fuller, R.A.; Carrasco, L.R. Life satisfaction linked to the diversity of nature experiences and nature views from the window. Landsc. Urban. Plan. 2020, 202, 103874. [Google Scholar] [CrossRef]
  29. Thivel, D.; Tremblay, A.; Genin, P.M.; Panahi, S.; Riviere, D.; Duclos, M. Physical Activity, Inactivity, and Sedentary Behaviors: Definitions and Implications in Occupational Health. Front. Public Health 2018, 6, 288. [Google Scholar] [CrossRef]
  30. Cheng, F.; Li, Y.; Wu, Y.; Cheng, Y.; Lin, Z. Experimental study of air distribution and heating performances of deflection ventilation. Energ. Build. 2023, 282, 112800. [Google Scholar] [CrossRef]
  31. Guo, J.; Xia, D.; Zhang, L.; Zou, Y.; Yang, X.; Xie, W.; Zhong, Z. Future indoor overheating risk for urban village housing in subtropical region of China under long-term changing climate. Build. Environ. 2023, 246, 110978. [Google Scholar] [CrossRef]
  32. Tang, T.; Zhou, X.; Zhang, Y.; Feng, X.; Liu, W.; Fang, Z.; Zheng, Z. Investigation into the thermal comfort and physiological adaptability of outdoor physical training in college students. Sci. Total Environ. 2022, 839, 155979. [Google Scholar] [CrossRef] [PubMed]
  33. Zhang, Y.; Zhou, X.; Zheng, Z.; Oladokun, M.O.; Fang, Z. Experimental investigation into the effects of different metabolic rates of body movement on thermal comfort. Build. Environ. 2020, 168, 106489. [Google Scholar] [CrossRef]
  34. Zhao, Y.; Yang, J.; Fang, Z.; Zhang, X.; Guo, T.; Li, Y. Passive design strategies to improve student thermal comfort: A field study in semi-outdoor spaces of academic buildings in hot-humid areas. Urban. Clim. 2024, 53, 101807. [Google Scholar] [CrossRef]
  35. Gan, S.; Chen, W.; Feng, J. Case Study of Space Optimization Simulation of Existing Office Buildings Based on Thermal Buffer Effect. Buildings 2024, 14, 1611. [Google Scholar] [CrossRef]
  36. Rizzo, K.; Camilleri, M.; Gatt, D.; Yousif, C. Optimising Mechanical Ventilation for Indoor Air Quality and Thermal Comfort in a Mediterranean School Building. Sustainability 2024, 16, 766. [Google Scholar] [CrossRef]
  37. Prasetya, A.; Ho, A.D.; Kubota, T. Analysis of Typical Layout of Apartment Buildings in Indonesia. Buildings 2023, 13, 1387. [Google Scholar] [CrossRef]
  38. Zare, S.; Shirvan, H.E.; Hemmatjo, R.; Nadri, F.; Jahani, Y.; Jamshidzadeh, K.; Paydar, P. A comparison of the correlation between heat stress indices (UTCI, WBGT, WBDT, TSI) and physiological parameters of workers in Iran. Weather Clim. Extrem. 2019, 26, 100213. [Google Scholar] [CrossRef]
  39. Takakura, J.; Fujimori, S.; Takahashi, K.; Hijioka, Y.; Hasegawa, T.; Honda, Y.; Masui, T. Cost of preventing workplace heat -related illness through worker breaks and the benefit of climate-change mitigation. Environ. Res. Lett. 2017, 12, 064010. [Google Scholar] [CrossRef]
  40. Blazejczyk, K.; Epstein, Y.; Jendritzky, G.; Staiger, H.; Tinz, B. Comparison of UTCI to selected thermal indices. Int. J. Biometeorol. 2012, 56, 515–535. [Google Scholar] [CrossRef] [PubMed]
  41. Höppe, P. The physiological equivalent temperature -: A universal index for the biometeorological assessment of the thermal environment. Int. J. Biometeorol. 1999, 43, 71–75. [Google Scholar] [CrossRef]
  42. Zhang, Y.; He, H.; Dai, K.; Lin, Z.; Fang, Z.; Zheng, Z. Thermal responses of face-masked pedestrians during summer: An outdoor investigation under tree-shaded areas. Build. Environ. 2023, 233, 110058. [Google Scholar] [CrossRef]
  43. Zhang, S.; Zhang, X.; Niu, D.; Fang, Z.; Chang, H.; Lin, Z. Physiological equivalent temperature-based and universal thermal climate index-based adaptive-rational outdoor thermal comfort models. Build. Environ. 2023, 228, 109900. [Google Scholar] [CrossRef]
  44. Lam, C.K.C.; Gao, Y.; Yang, H.; Chen, T.; Zhang, Y.; Ou, C.; Hang, J. Interactive effect between long-term and short-term thermal history on outdoor thermal comfort: Comparison between Guangzhou, Zhuhai and Melbourne. Sci. Total Environ. 2021, 760, 144141. [Google Scholar] [CrossRef] [PubMed]
  45. Li, K.; Zhang, Y.; Zhao, L. Outdoor thermal comfort and activities in the urban residential community in a humid subtropical area of China. Energ. Build. 2016, 133, 498–511. [Google Scholar] [CrossRef]
  46. ISO 7726; Ergonomics of the Thermal Environment—Instruments for Measuring Physical Quantities. ISO: Geneva, Switzerland, 1998.
  47. Zhang, Y.; Liu, J.; Zheng, Z.; Fang, Z.; Zhang, X.; Gao, Y.; Xie, Y. Analysis of thermal comfort during movement in a semi-open transition space. Energ. Build. 2020, 225, 110312. [Google Scholar] [CrossRef]
  48. Liu, W.; Zhang, Y.; Deng, Q. The effects of urban microclimate on outdoor thermal sensation and neutral temperature in hot-summer and cold-winter climate. Energ. Build. 2016, 128, 190–197. [Google Scholar] [CrossRef]
  49. Aljawabra, F.; Nikolopoulou, M. Thermal comfort in urban spaces: A cross-cultural study in the hot arid climate. Int. J. Biometeorol. 2020, 64, 305. [Google Scholar] [CrossRef]
  50. Wei, D.; Lian, Z.; Liu, B. A Field Study of Outdoor Human Thermal Perception in Three Seasons in Shanghai, China. Buildings 2022, 12, 1453. [Google Scholar] [CrossRef]
  51. Fang, Z.; Xu, X.; Zhou, X.; Deng, S.; Wu, H.; Liu, J.; Lin, Z. Investigation into the thermal comfort of university students conducting outdoor training. Build. Environ. 2019, 149, 26–38. [Google Scholar] [CrossRef]
  52. Wei, C.; Zhao, L.; Chang, H.; Xumo, P. Thermal comfort analysis and improvement of outdoor sports spaces in universities: A case study of Xi’an Jiaotong University. Environ. Sci. Pollut. Res. 2023, 30, 76575–76594. [Google Scholar] [CrossRef] [PubMed]
  53. Gao, S.; Yang, L.; Li, Y.; Liu, S.; Zhang, H.; Arens, E.; Zhai, Y. Metabolic rate in children and adolescents: Tabulate values for common activities and comparisons with standards and adult values. Build. Environ. 2023, 244, 110804. [Google Scholar] [CrossRef]
  54. Tung, C.; Chen, C.; Tsai, K.; Kantor, N.; Hwang, R.; Matzarakis, A.; Lin, T. Outdoor thermal comfort characteristics in the hot and humid region from a gender perspective. Int. J. Biometeorol. 2014, 58, 1927–1939. [Google Scholar] [CrossRef]
  55. Elnabawi, M.H.; Aoul, K.A.T.; Alhumaidi, A.; Osman, B.; Alshehhi, R.; Almahri, S. A behavioural analysis of outdoor thermal comfort in a hot, arid climate: A culture and gender equality perspective. Archit. Sci. Rev. 2024, 67, 1–15. [Google Scholar] [CrossRef]
  56. Luo, X.; Zhao, Y.; Yang, J.; Li, Y.; Luo, Z. Adaptive design strategies for thermal comfort in waterfront campsites during summer in hot and humid regions. Int. J. Therm. Sci. 2024, 199, 108945. [Google Scholar] [CrossRef]
  57. Shi, Y.; Xiang, Y.; Zhang, Y. Urban Design Factors Influencing Surface Urban Heat Island in the High-Density City of Guangzhou Based on the Local Climate Zone. Sensors 2019, 19, 3459. [Google Scholar] [CrossRef]
  58. Tang, H.; Gao, Y.; Tan, S.; Guo, Y.; Gao, W. Field Investigation on Adaptive Thermal Comfort in Rural Dwellings: A Case Study in Linyi (China) during Summer. Buildings 2024, 14, 142. [Google Scholar] [CrossRef]
Figure 1. Testing site.
Buildings 14 02756 g001
Figure 2. Outdoor thermal parameters data: (a) Ta; (b) Tmrt; (c) RH; (d) Va.
Buildings 14 02756 g002
Figure 3. Thermal parameter preference votes.
Buildings 14 02756 g003
Figure 4. Physical fatigue evaluation votes: 1, heavy head; 2, body feels lazy; 3, body stiffness; 4, yawning/nodding off; 5, feeling sleepy/wanting to lie down; 6, none.
Buildings 14 02756 g004
Figure 5. Psychological evaluation votes: 1, distracted/unable to concentrate; 2, no desire to talk; 3, anger/easily irritable; 4, anxiety; 5, none.
Buildings 14 02756 g005
Figure 6. (a) Air temperature < 32.0 °C, thermal sensation votes; (b) air temperature > 32.0 °C, thermal sensation votes; (c) air temperature < 32.0 °C, wind sensation votes; (d) air temperature > 32.0 °C, wind sensation votes.
Buildings 14 02756 g006aBuildings 14 02756 g006b
Figure 7. Thermal adaptation behavior votes: 1, drinking hot beverages; 2, drinking cold beverages; 3, seeking shade; 4, using an umbrella; 5, using a portable fan; 6, wearing sun-protective clothing.
Buildings 14 02756 g007
Figure 8. Relationship between MTSV and thermal parameters: (a) Ta; (b) Tmrt; (c) RH; (d) Va.
Buildings 14 02756 g008
Figure 9. (a) Relationship between MWSV and Va; (b) relationship between unacceptable percentage and Va.
Buildings 14 02756 g009
Figure 10. (a) The heart rate data of subjects; (b) the metabolic rate data of subjects.
Buildings 14 02756 g010
Figure 11. (a) Relationship between PET and MTSV; (b) relationship between UTCI and MTSV.
Buildings 14 02756 g011
Figure 12. (a) Relationship between PET and unacceptable percentage; (b) relationship between UTCI and unacceptable percentage.
Buildings 14 02756 g012
Table 1. Information about instruments.
InstrumentTypeParameterMeasurement RangeAccuracySampling Rate (s)
Thermal comfort level recorderSSDZY-1Air temperature (Ta)−20 °C~+80 °C±0.3 °C60
Relative humidity (RH)0.01–99.9%±2% (10–90%)60
Black globe temperature (Tg)−20–80 °C±0.3 °C60
Wind speed (Va)0.05–5 m/s5% ± 0.05 m/s60
Table 2. Subjects’ anthropometric data.
SexNumberAverage Age in Years (SD)Average Height in m (SD)Average Weight in kg (SD)
Male16219.6 (1.88)1.75 (0.07)64.7 (10.65)
Female43319.2 (1.65)1.63 (0.05)53.8 (9.04)
Table 3. Comparison of males’ and females’ thermal stress.
Thermal SensationHeat StressPET (Male)PET (Female)UTCI (Male)UTCI (Female)
Neutral (−0.5–0.5)No thermal stress----
Slightly warm (0.5–1.5)Slight heat stress----
Warm
(1.5–2.5)
Moderate heat stress27.9–33.528.9–33.331.5–34.528.6–33.5
Hot
(2.5–3.5)
Strong heat stress33.5–39.033.3–37.734.5–37.533.5–38.3
Very hot
(3.5–4.5)
Extreme heat stress>39.0>37.7>37.5>38.3
Disclaimer/Publisher’s Note: The statements, opinions and data contained in all publications are solely those of the individual author(s) and contributor(s) and not of MDPI and/or the editor(s). MDPI and/or the editor(s) disclaim responsibility for any injury to people or property resulting from any ideas, methods, instructions or products referred to in the content.

