

Study on Mechanical Properties of Steel Fiber-Reinforced Geopolymer Concrete under Multi-Axial Loads
Abstract
:1. Introduction
2. Experiments Program
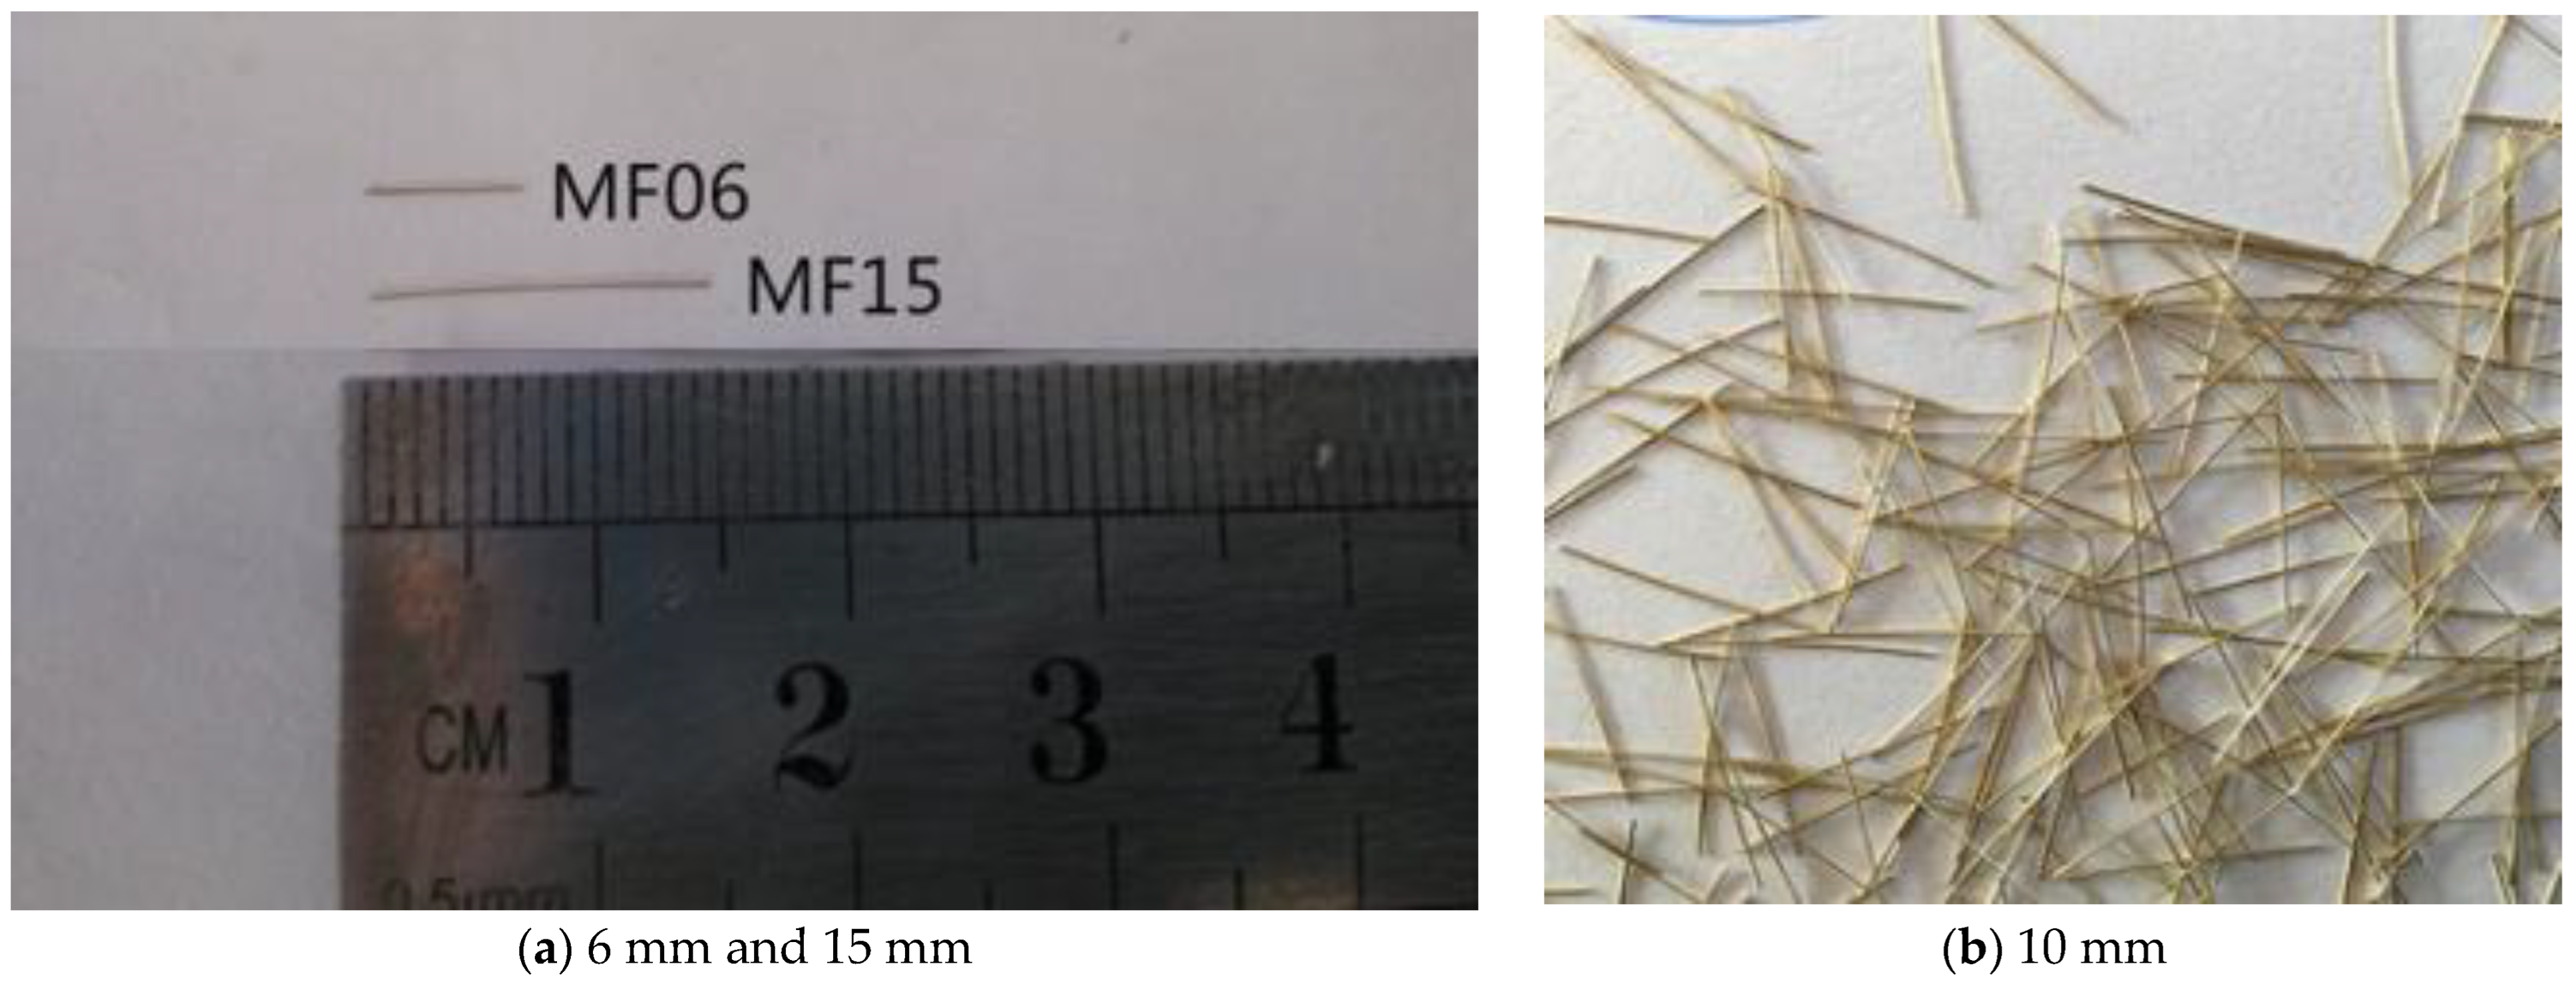
2.1. Materials
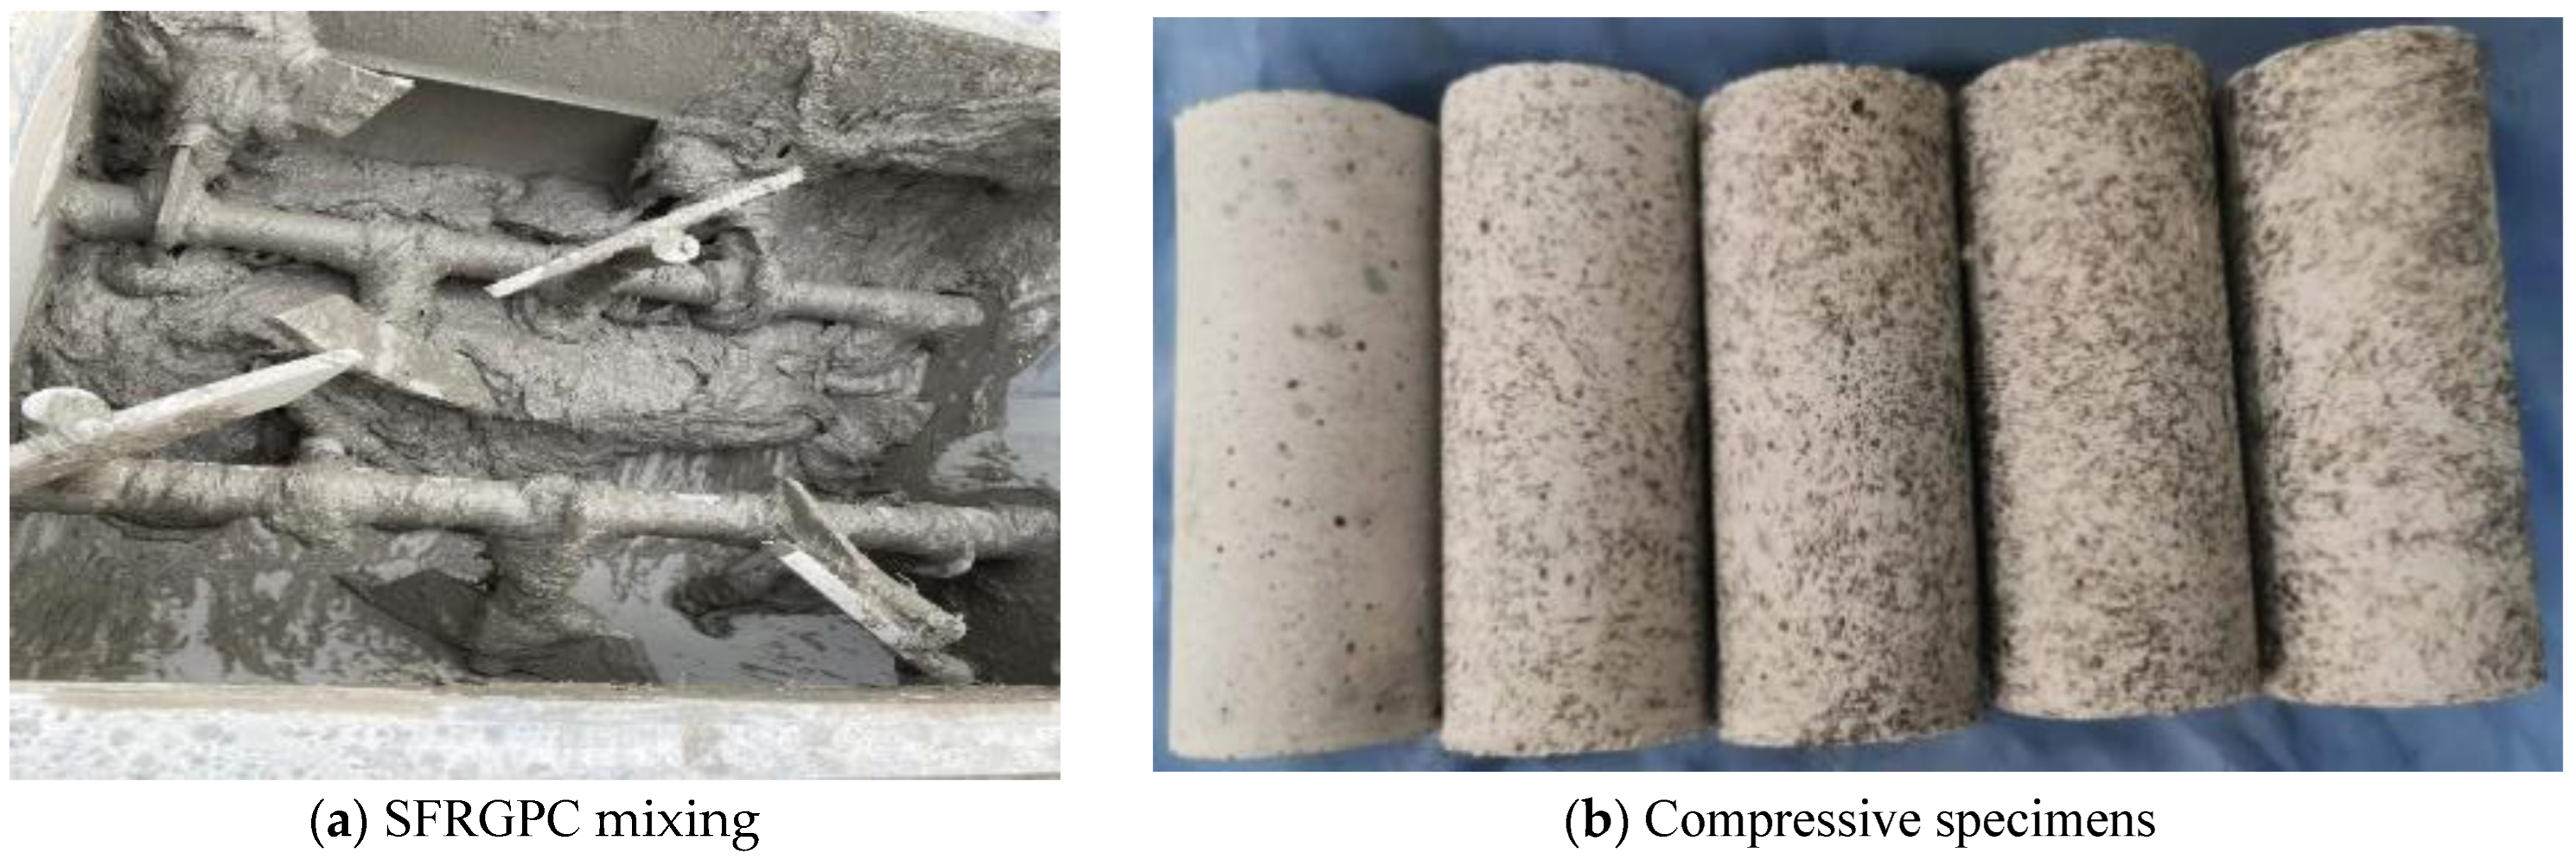
2.2. Specimens
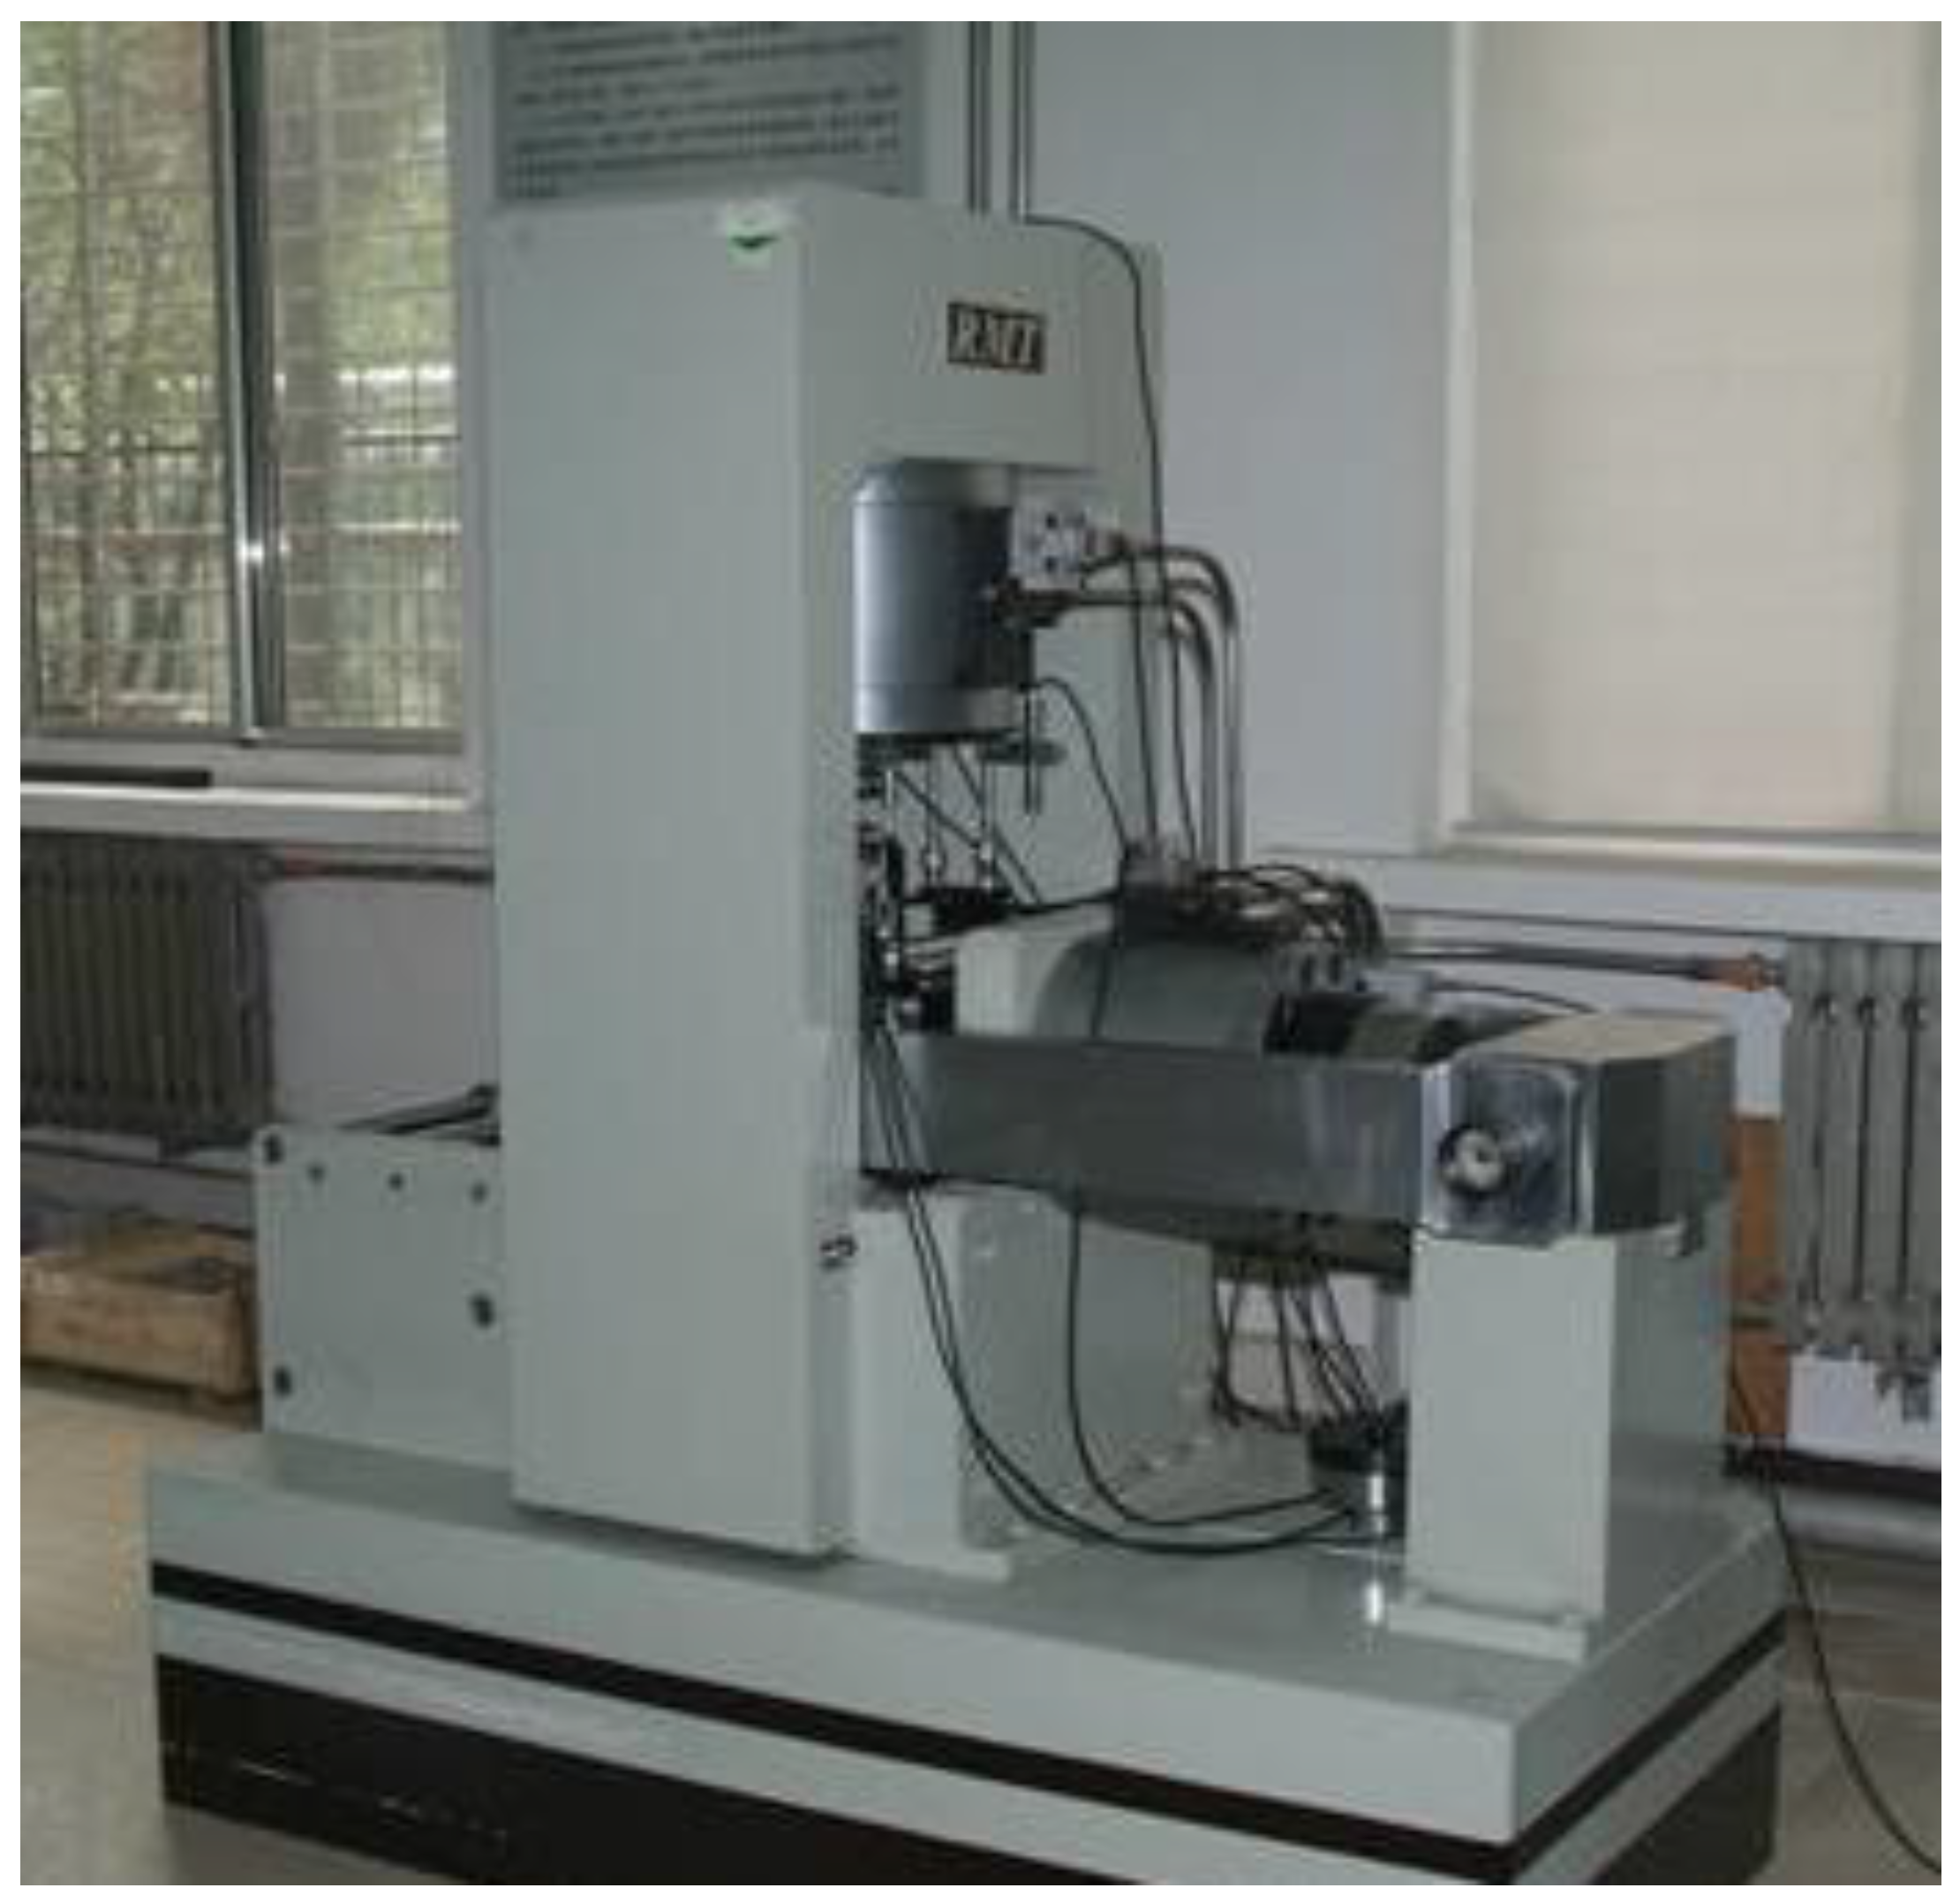
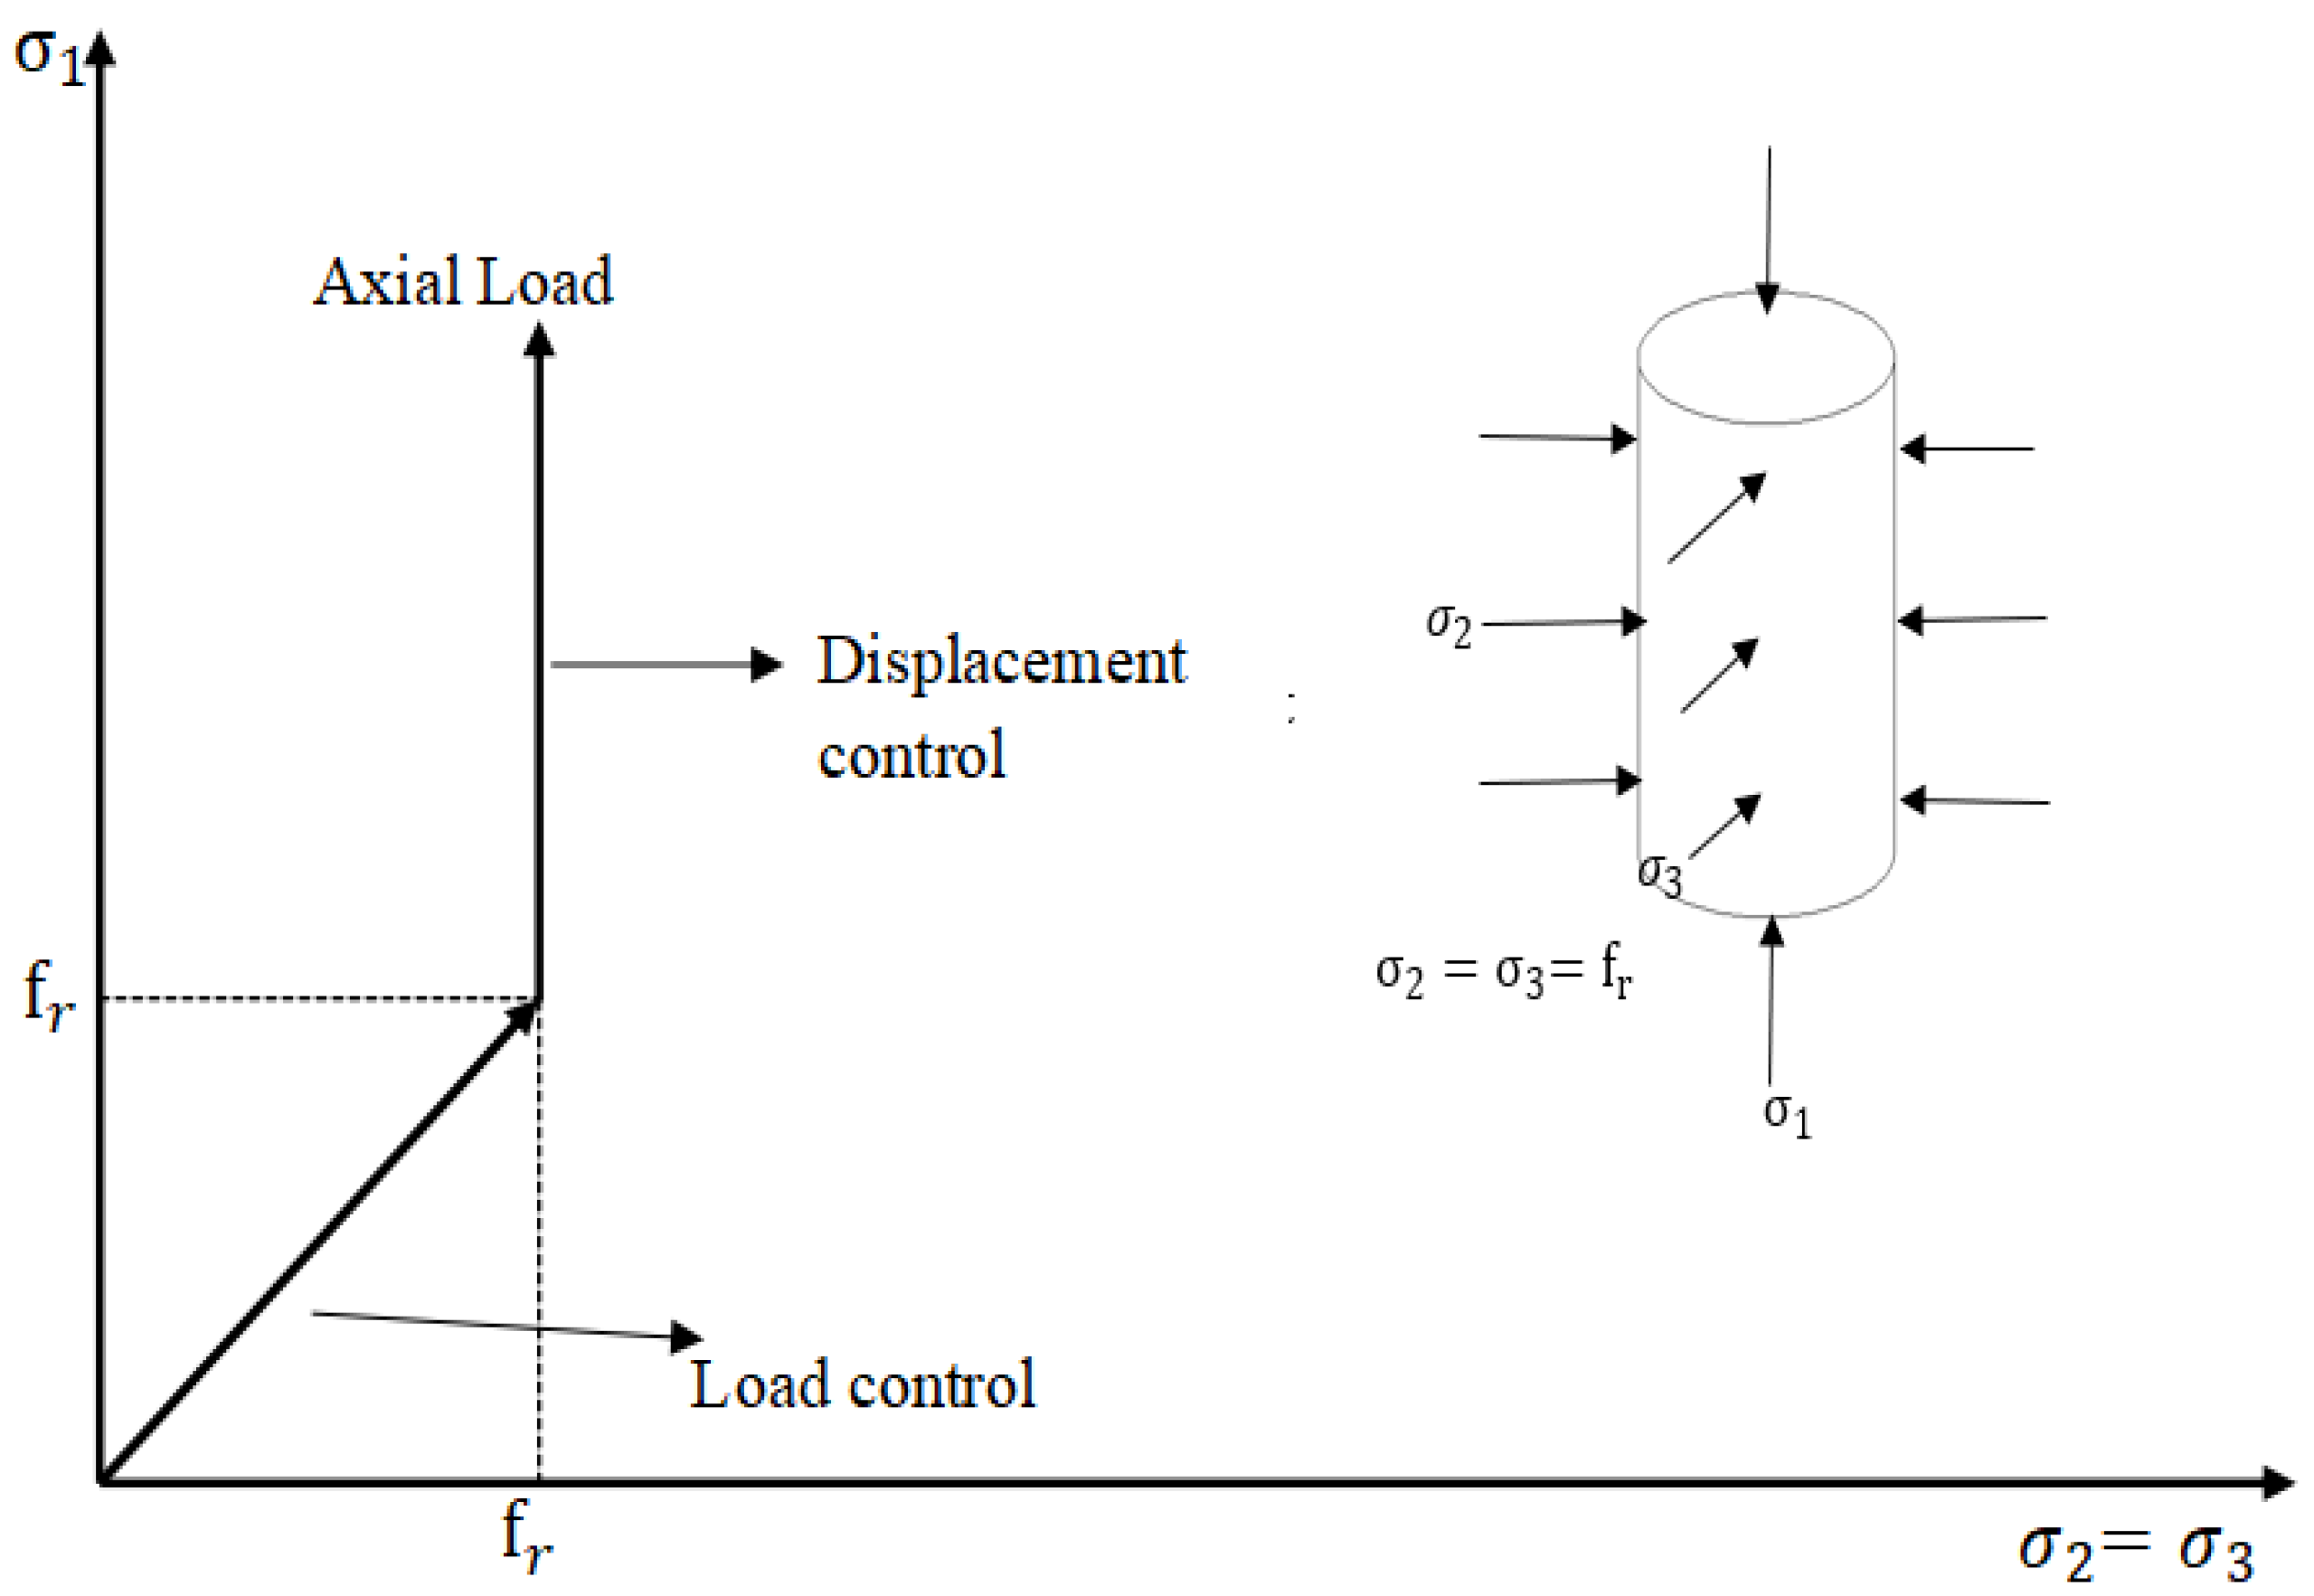
2.3. Experimental Setup
3. Experimental Results
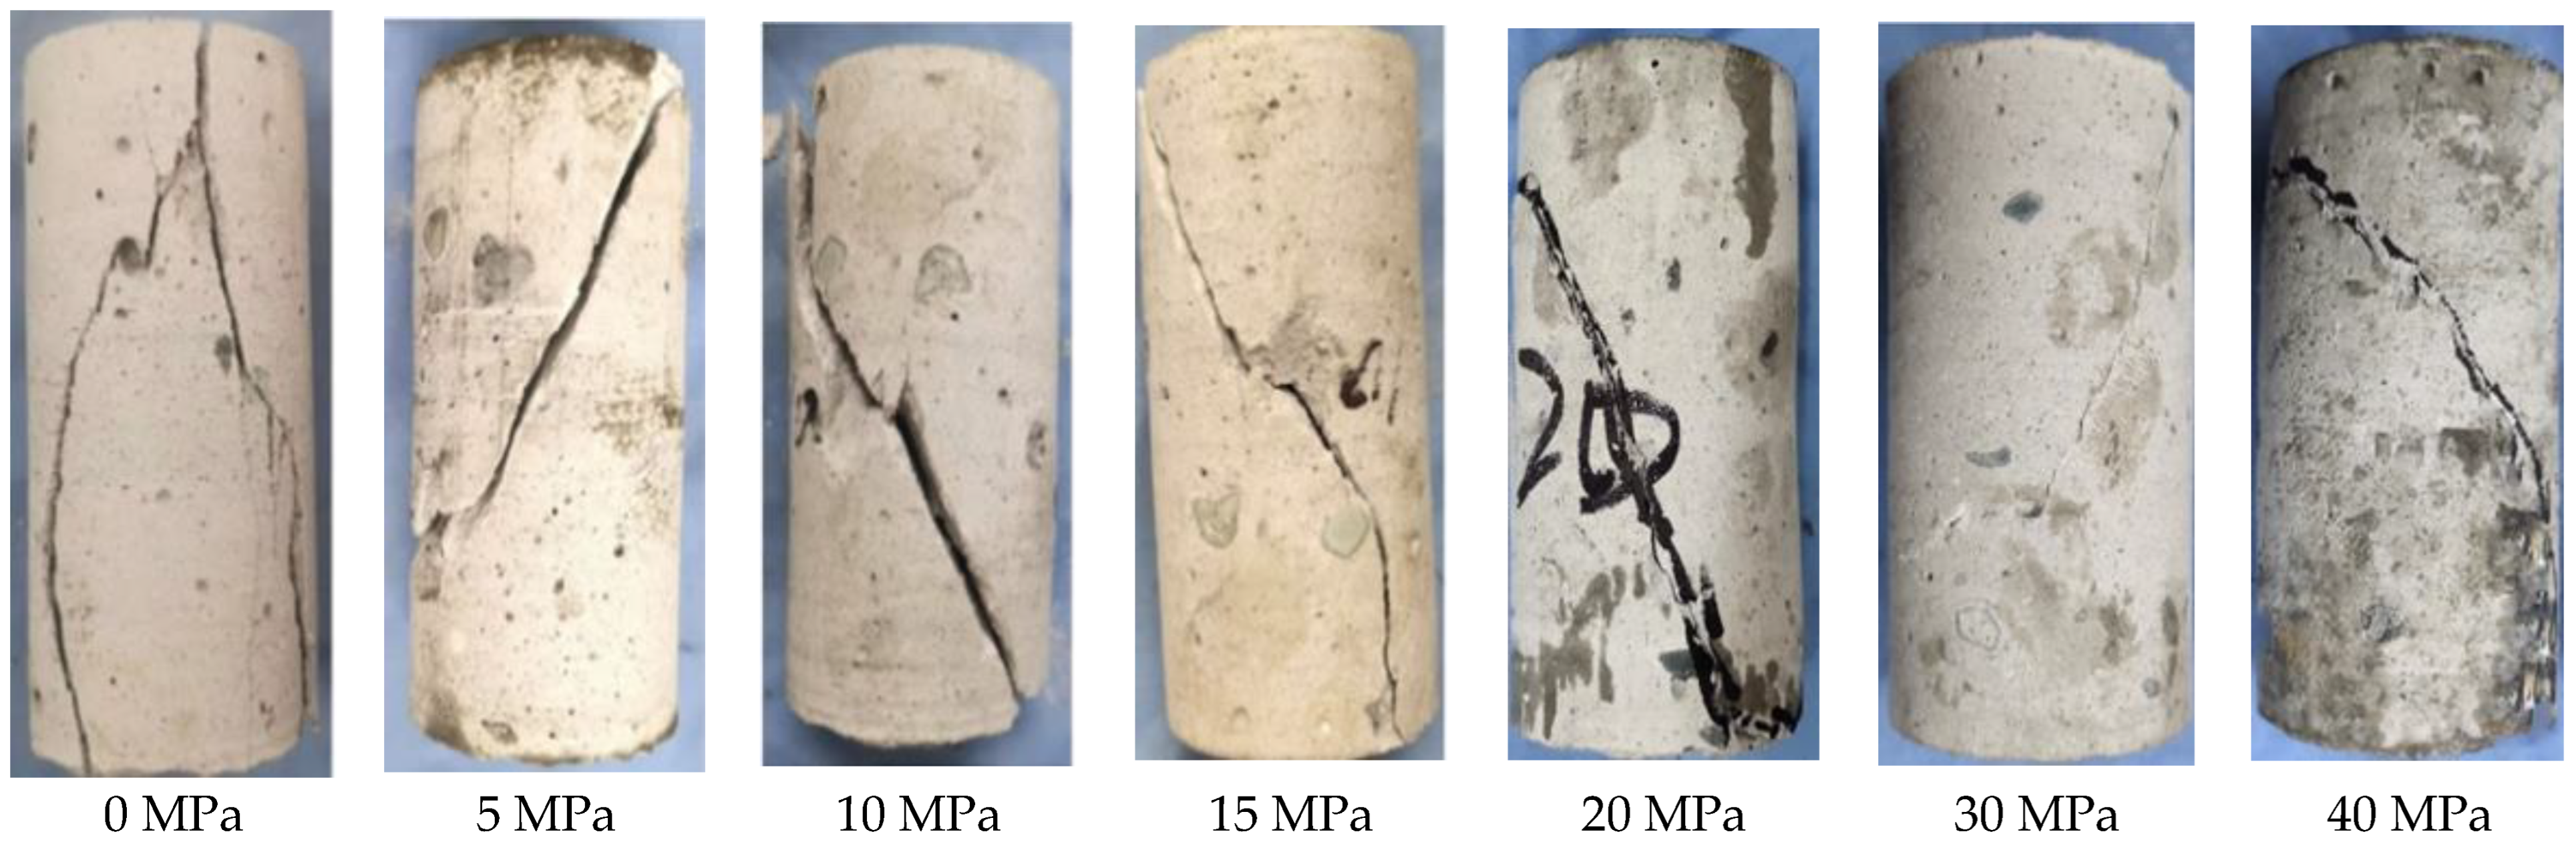
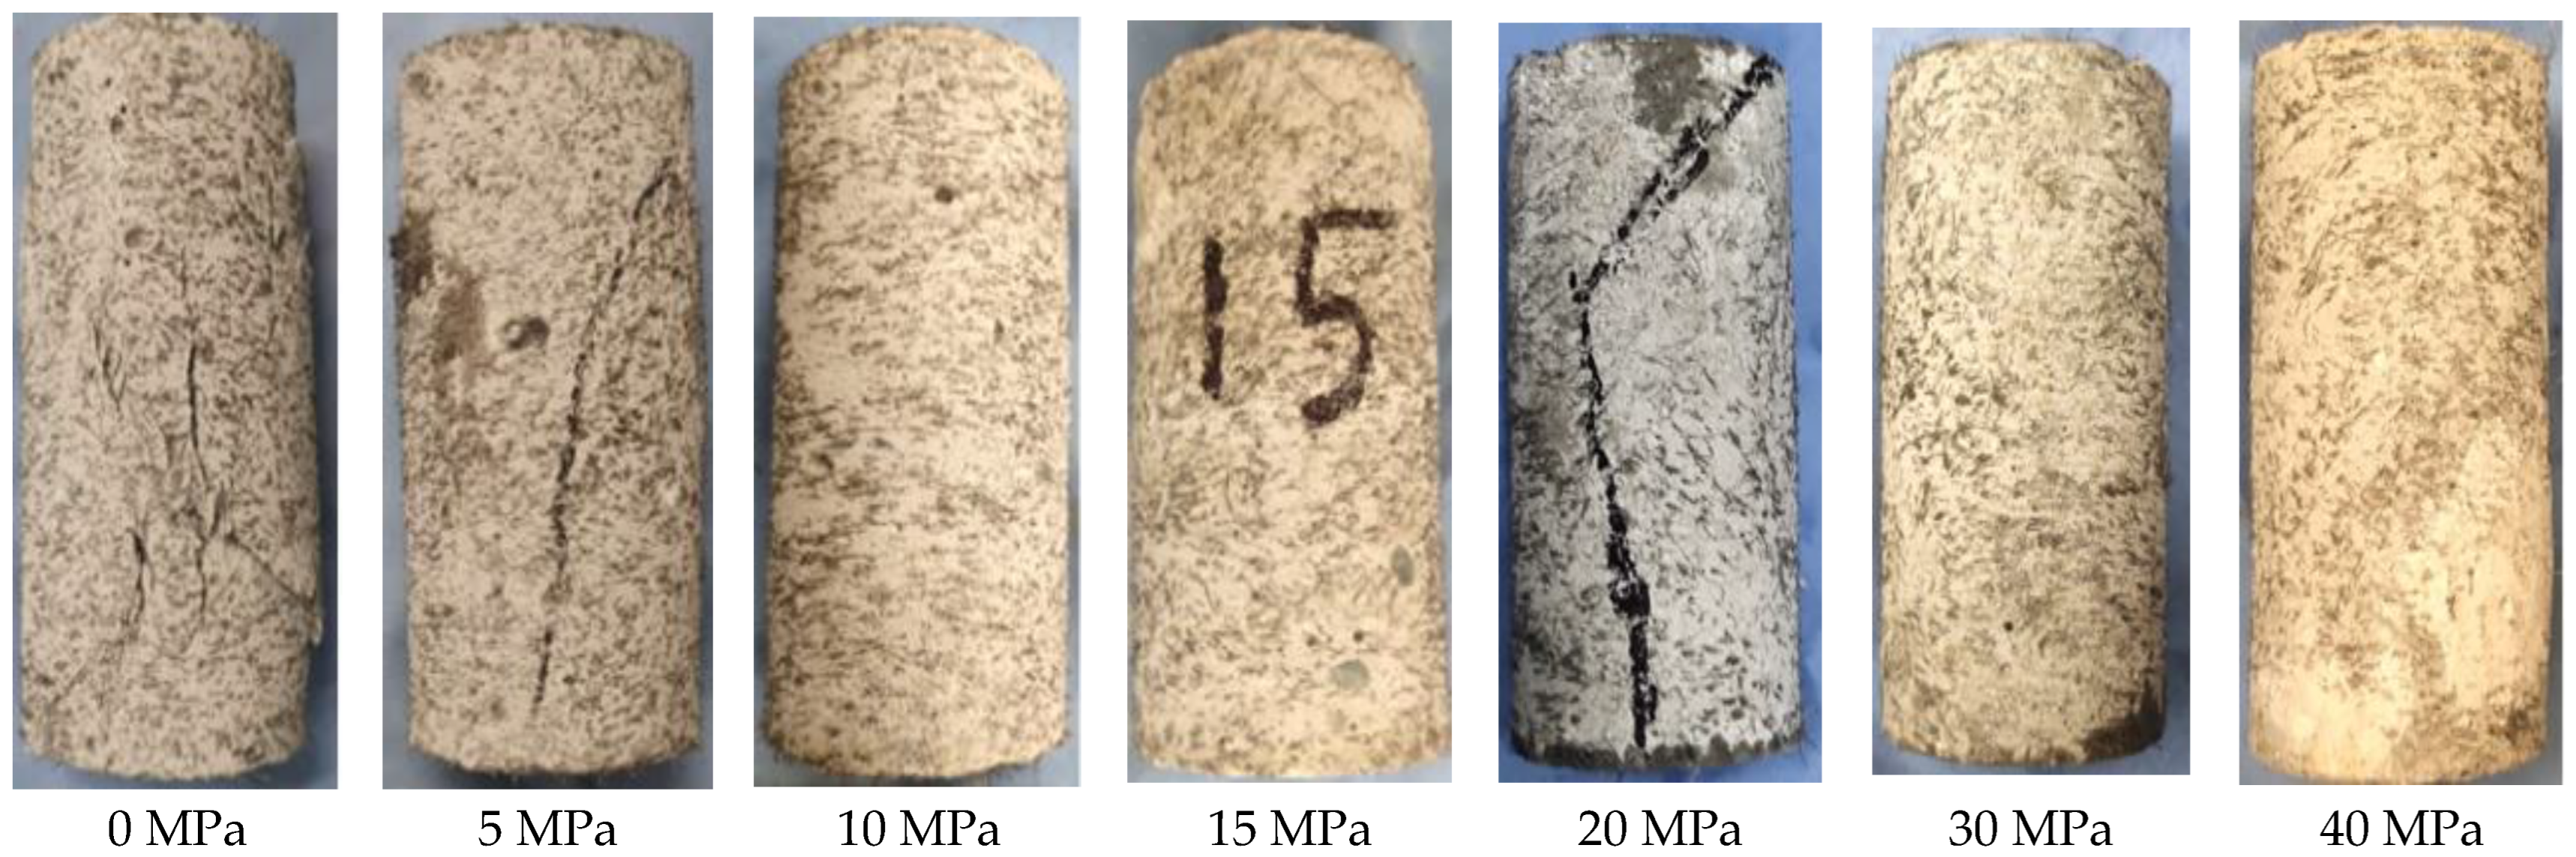
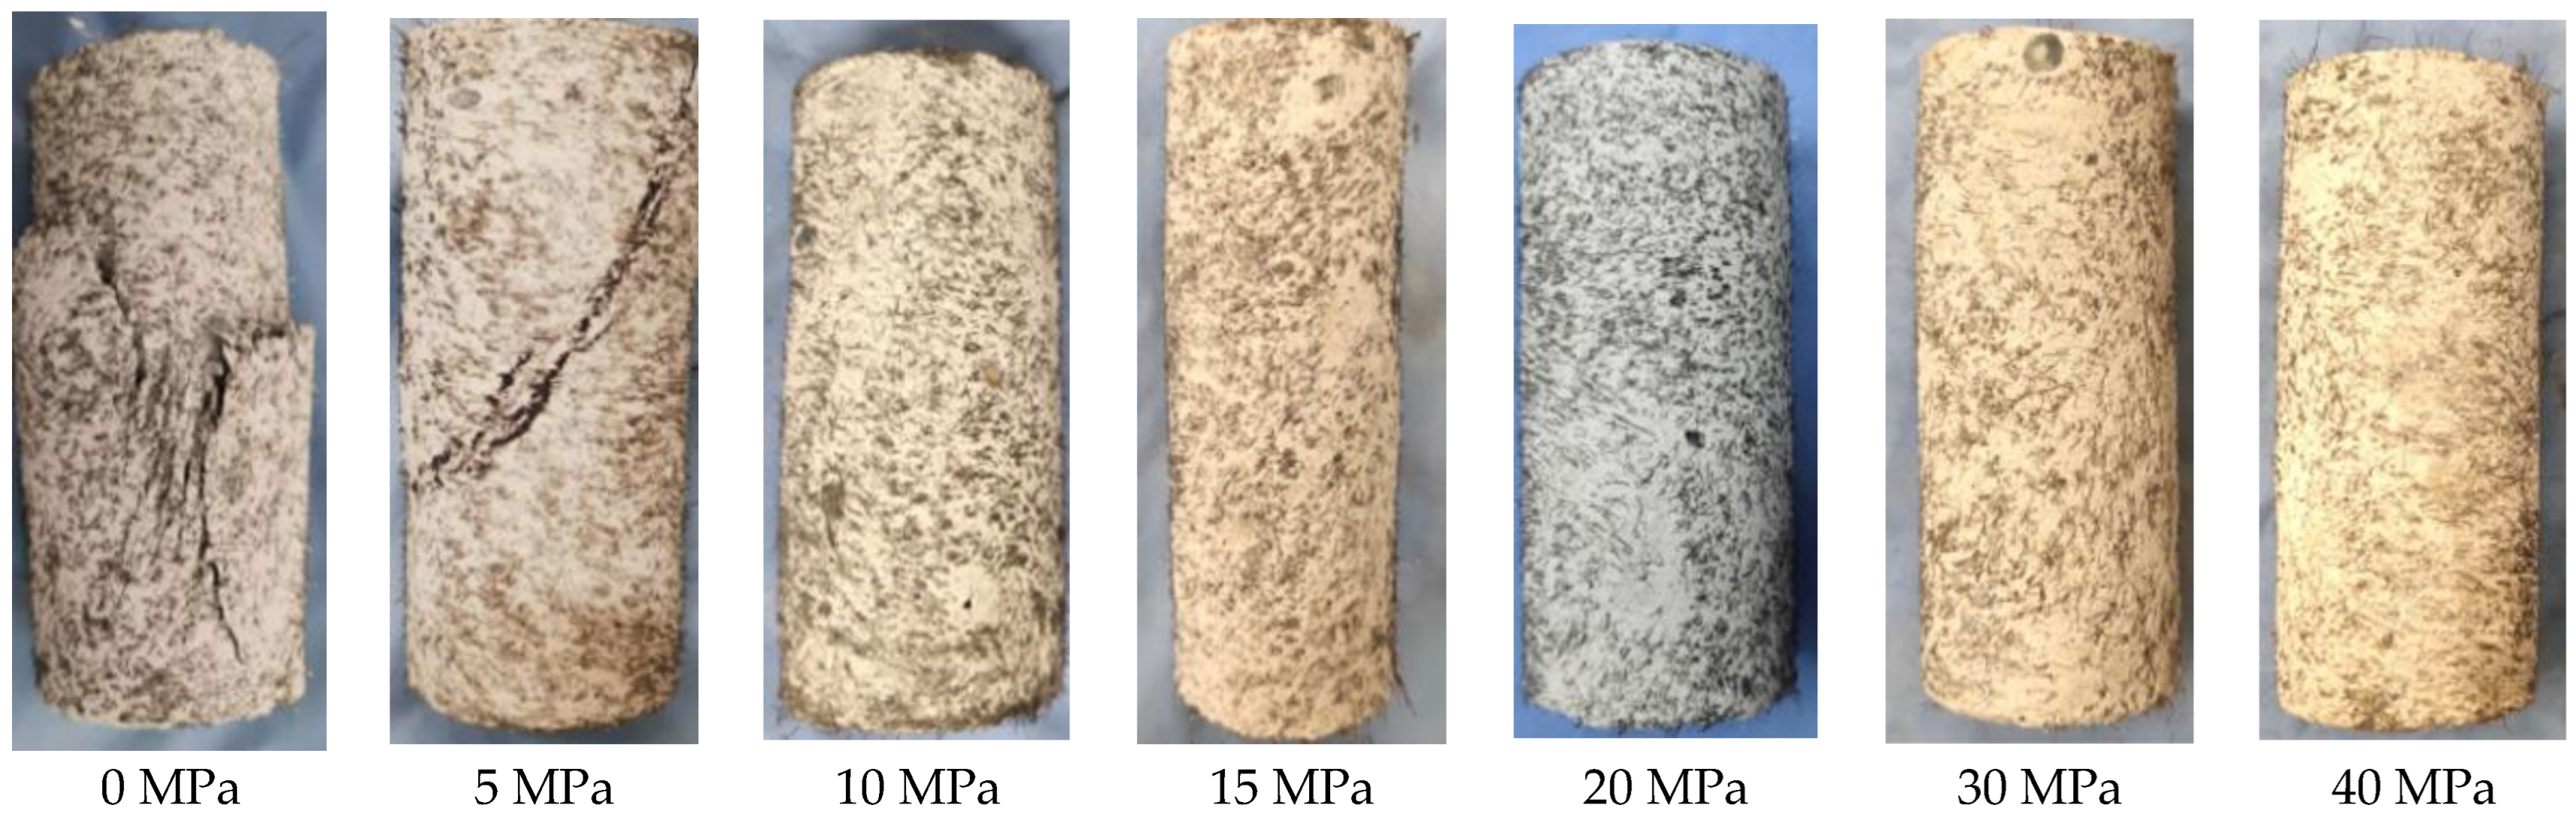
3.1. Failure Modes
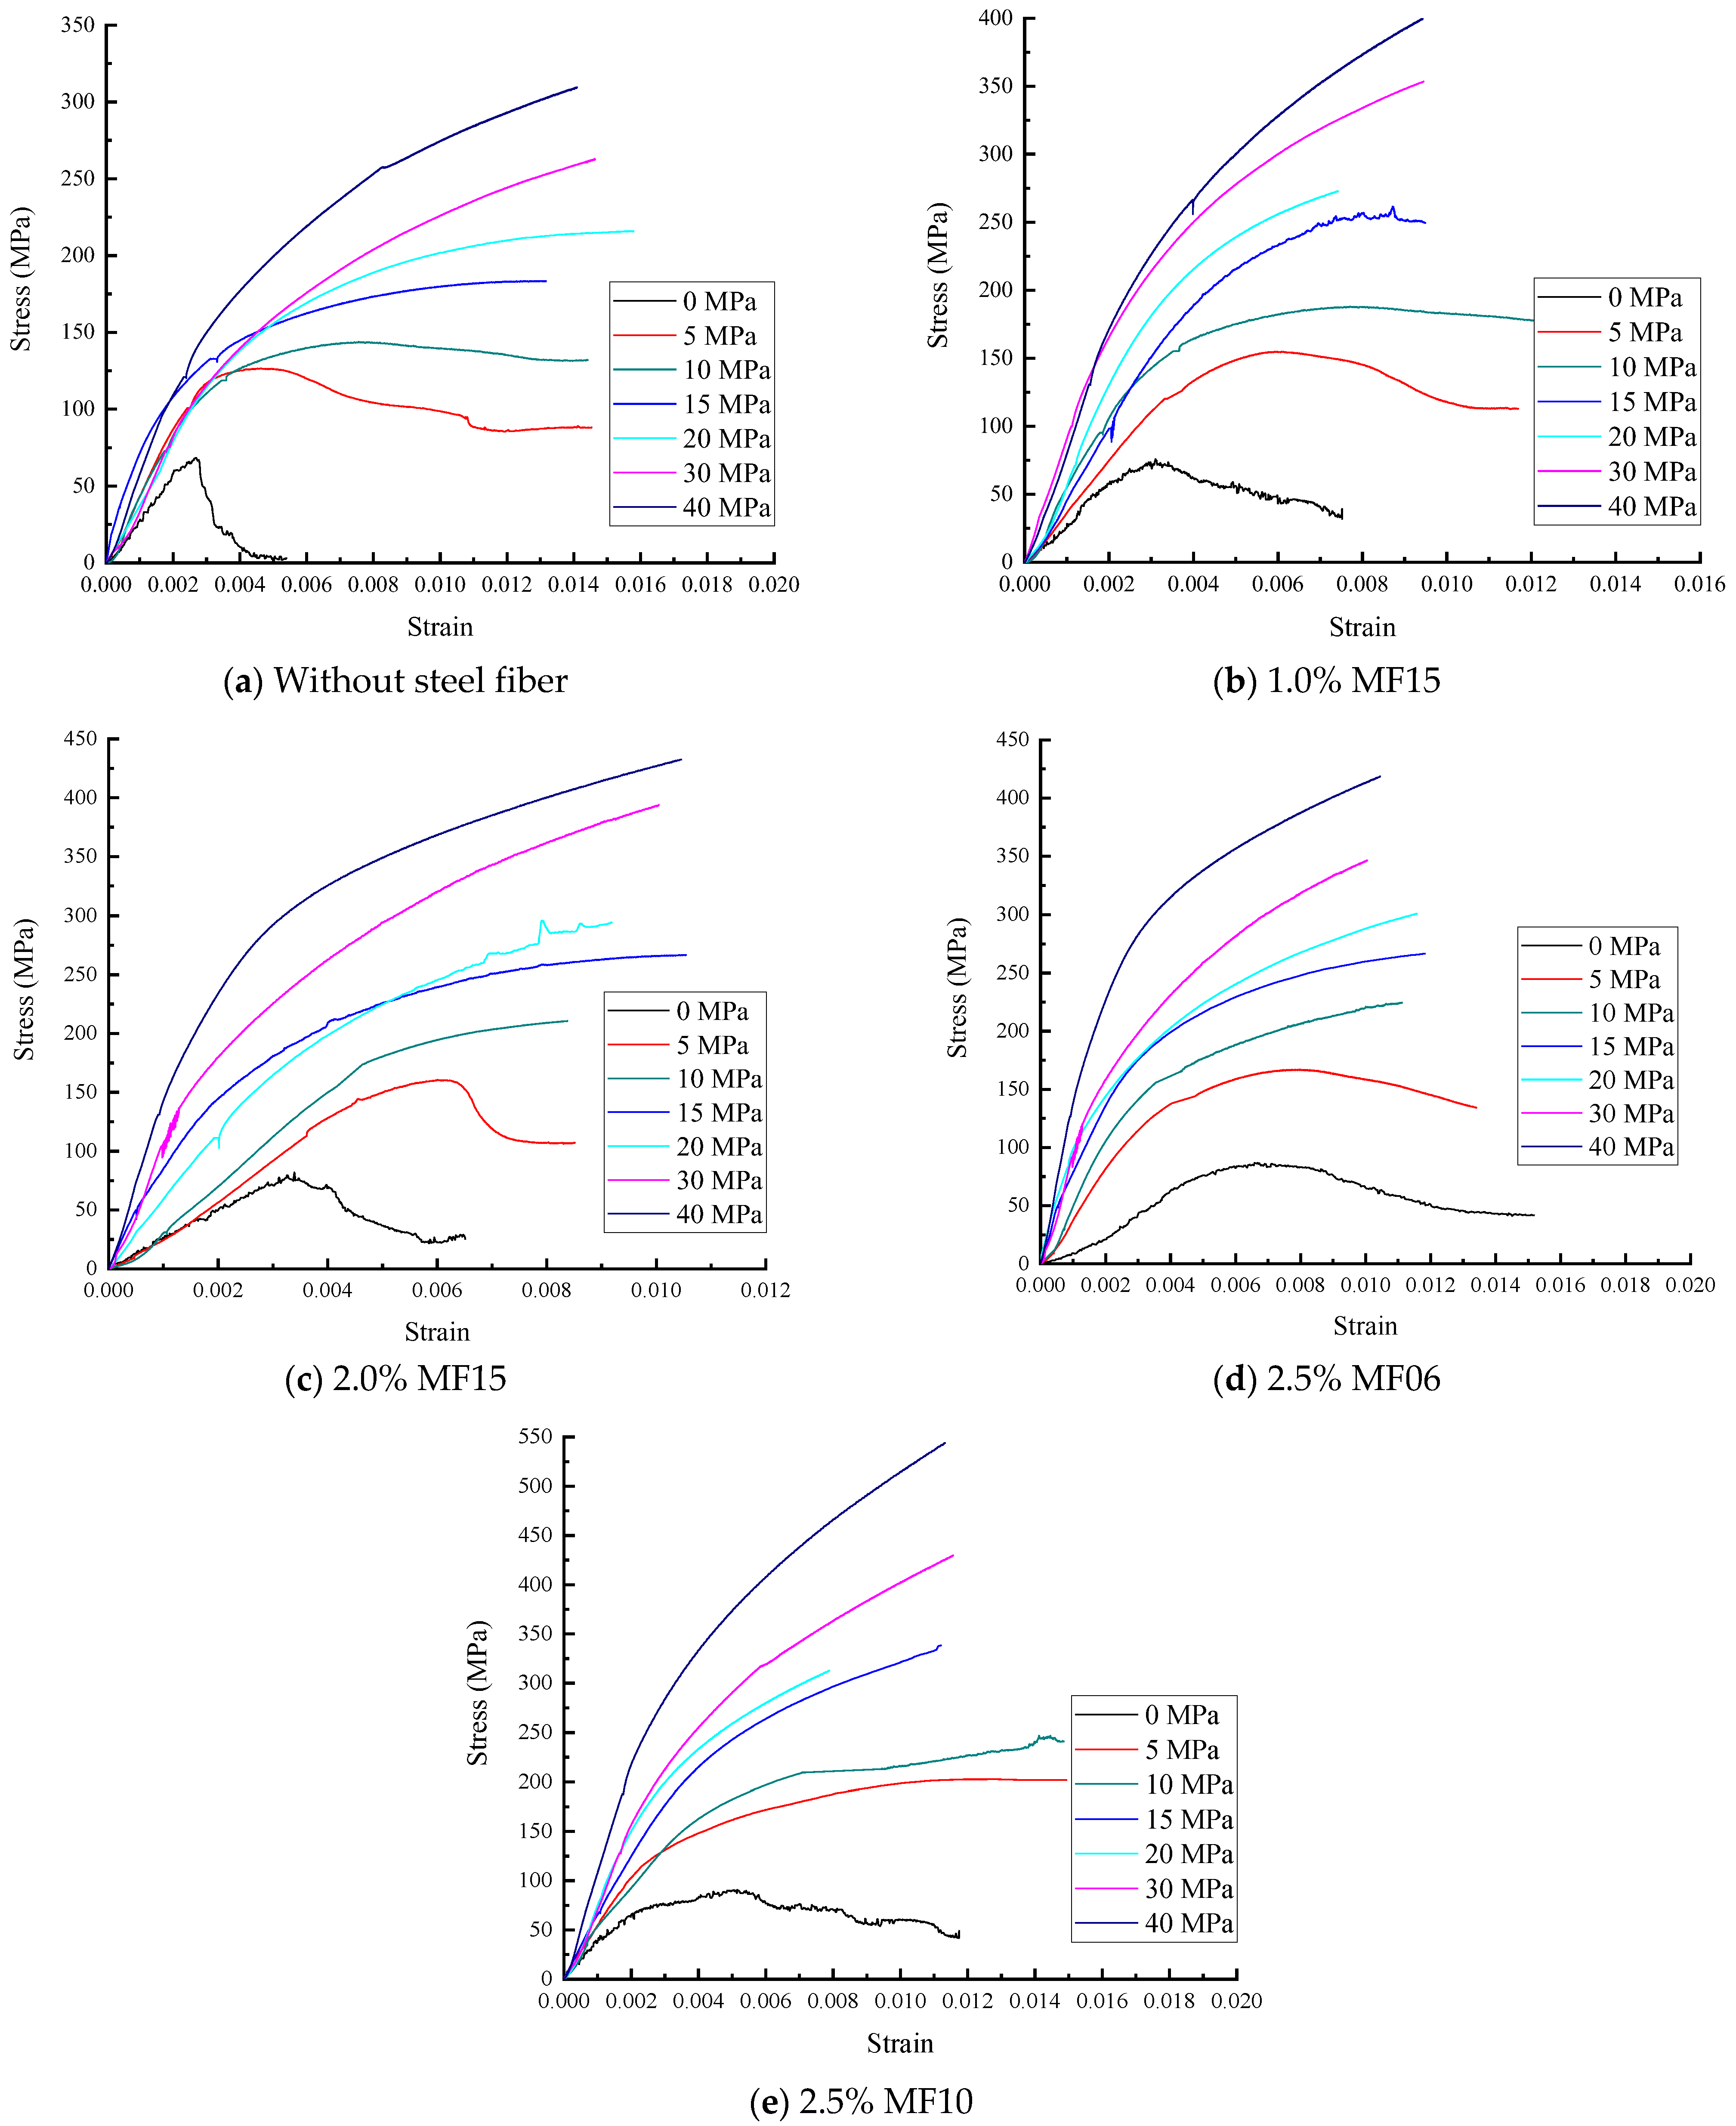
3.2. Stress–Strain Curves
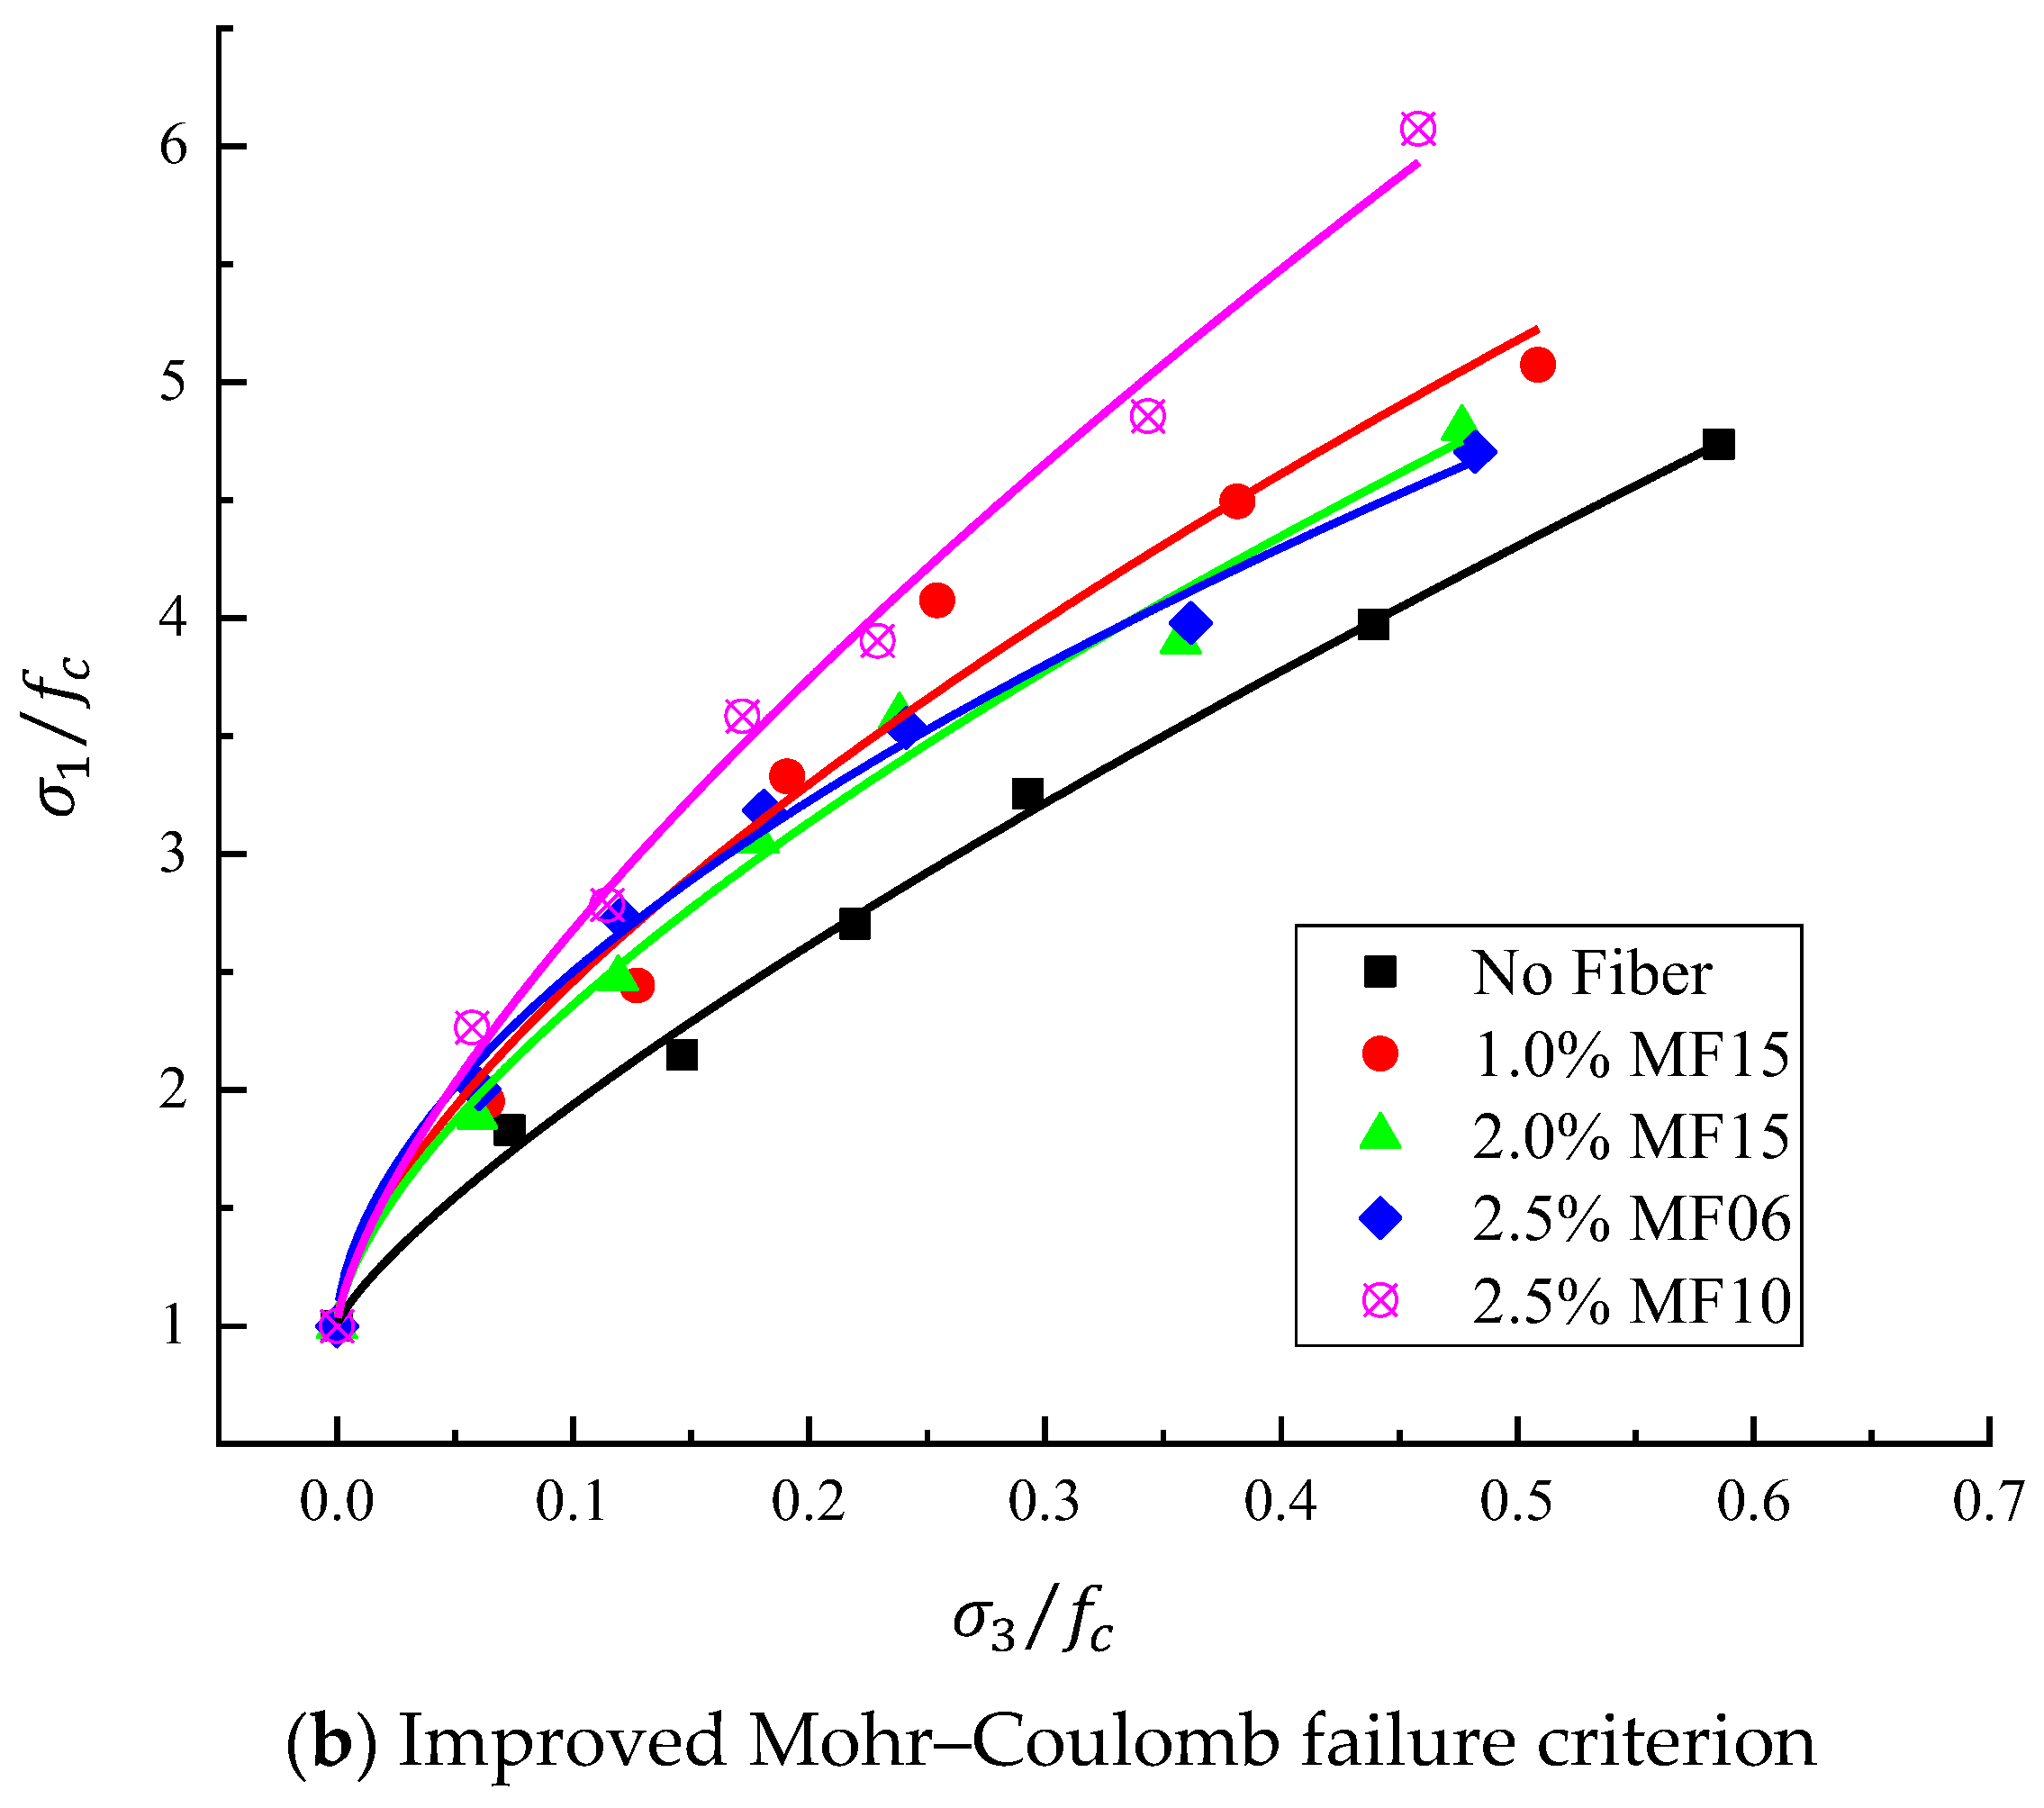
3.3. Failure Criterion
4. Discussion
4.1. Failure Pattern
4.2. Peak Stress
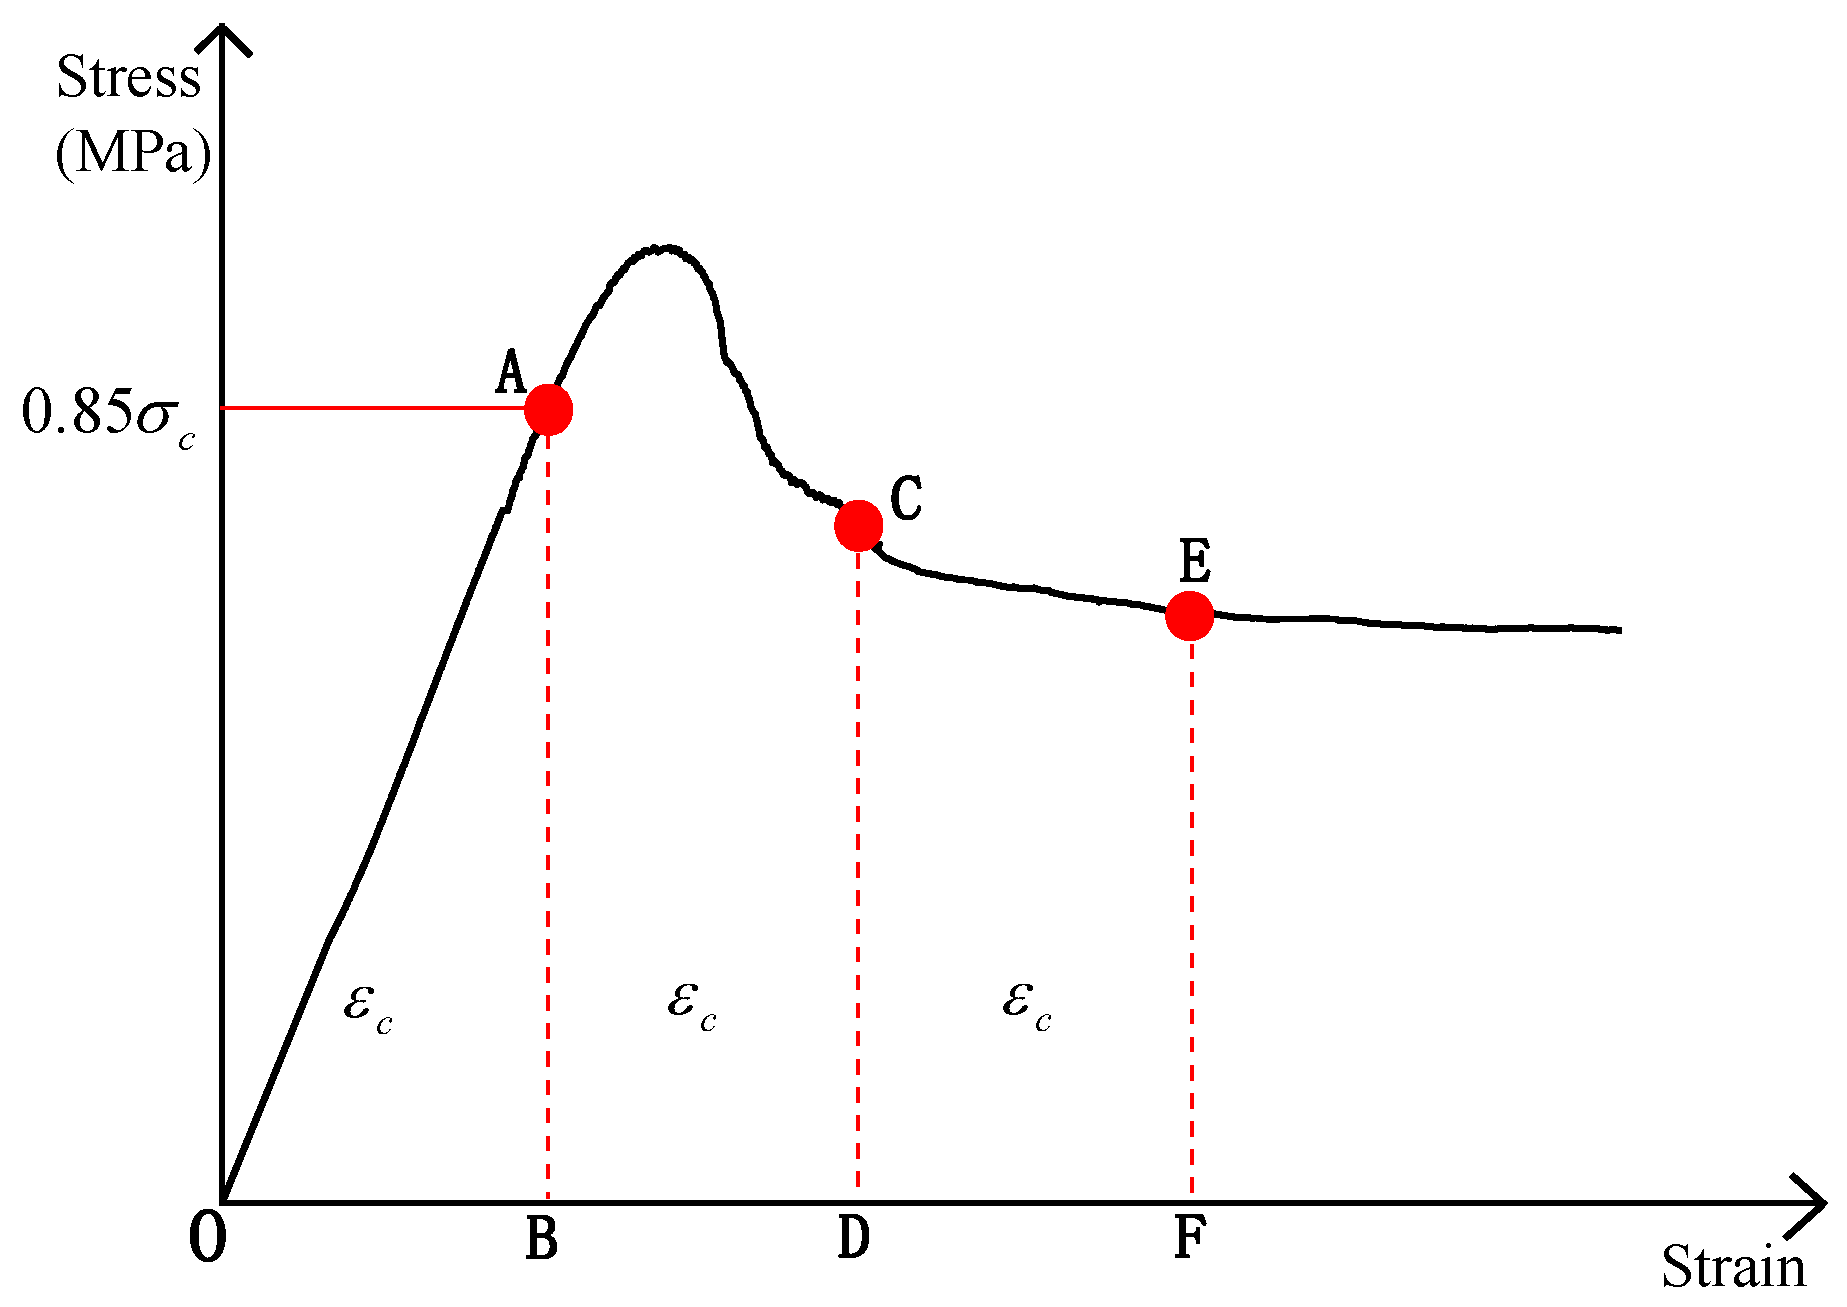
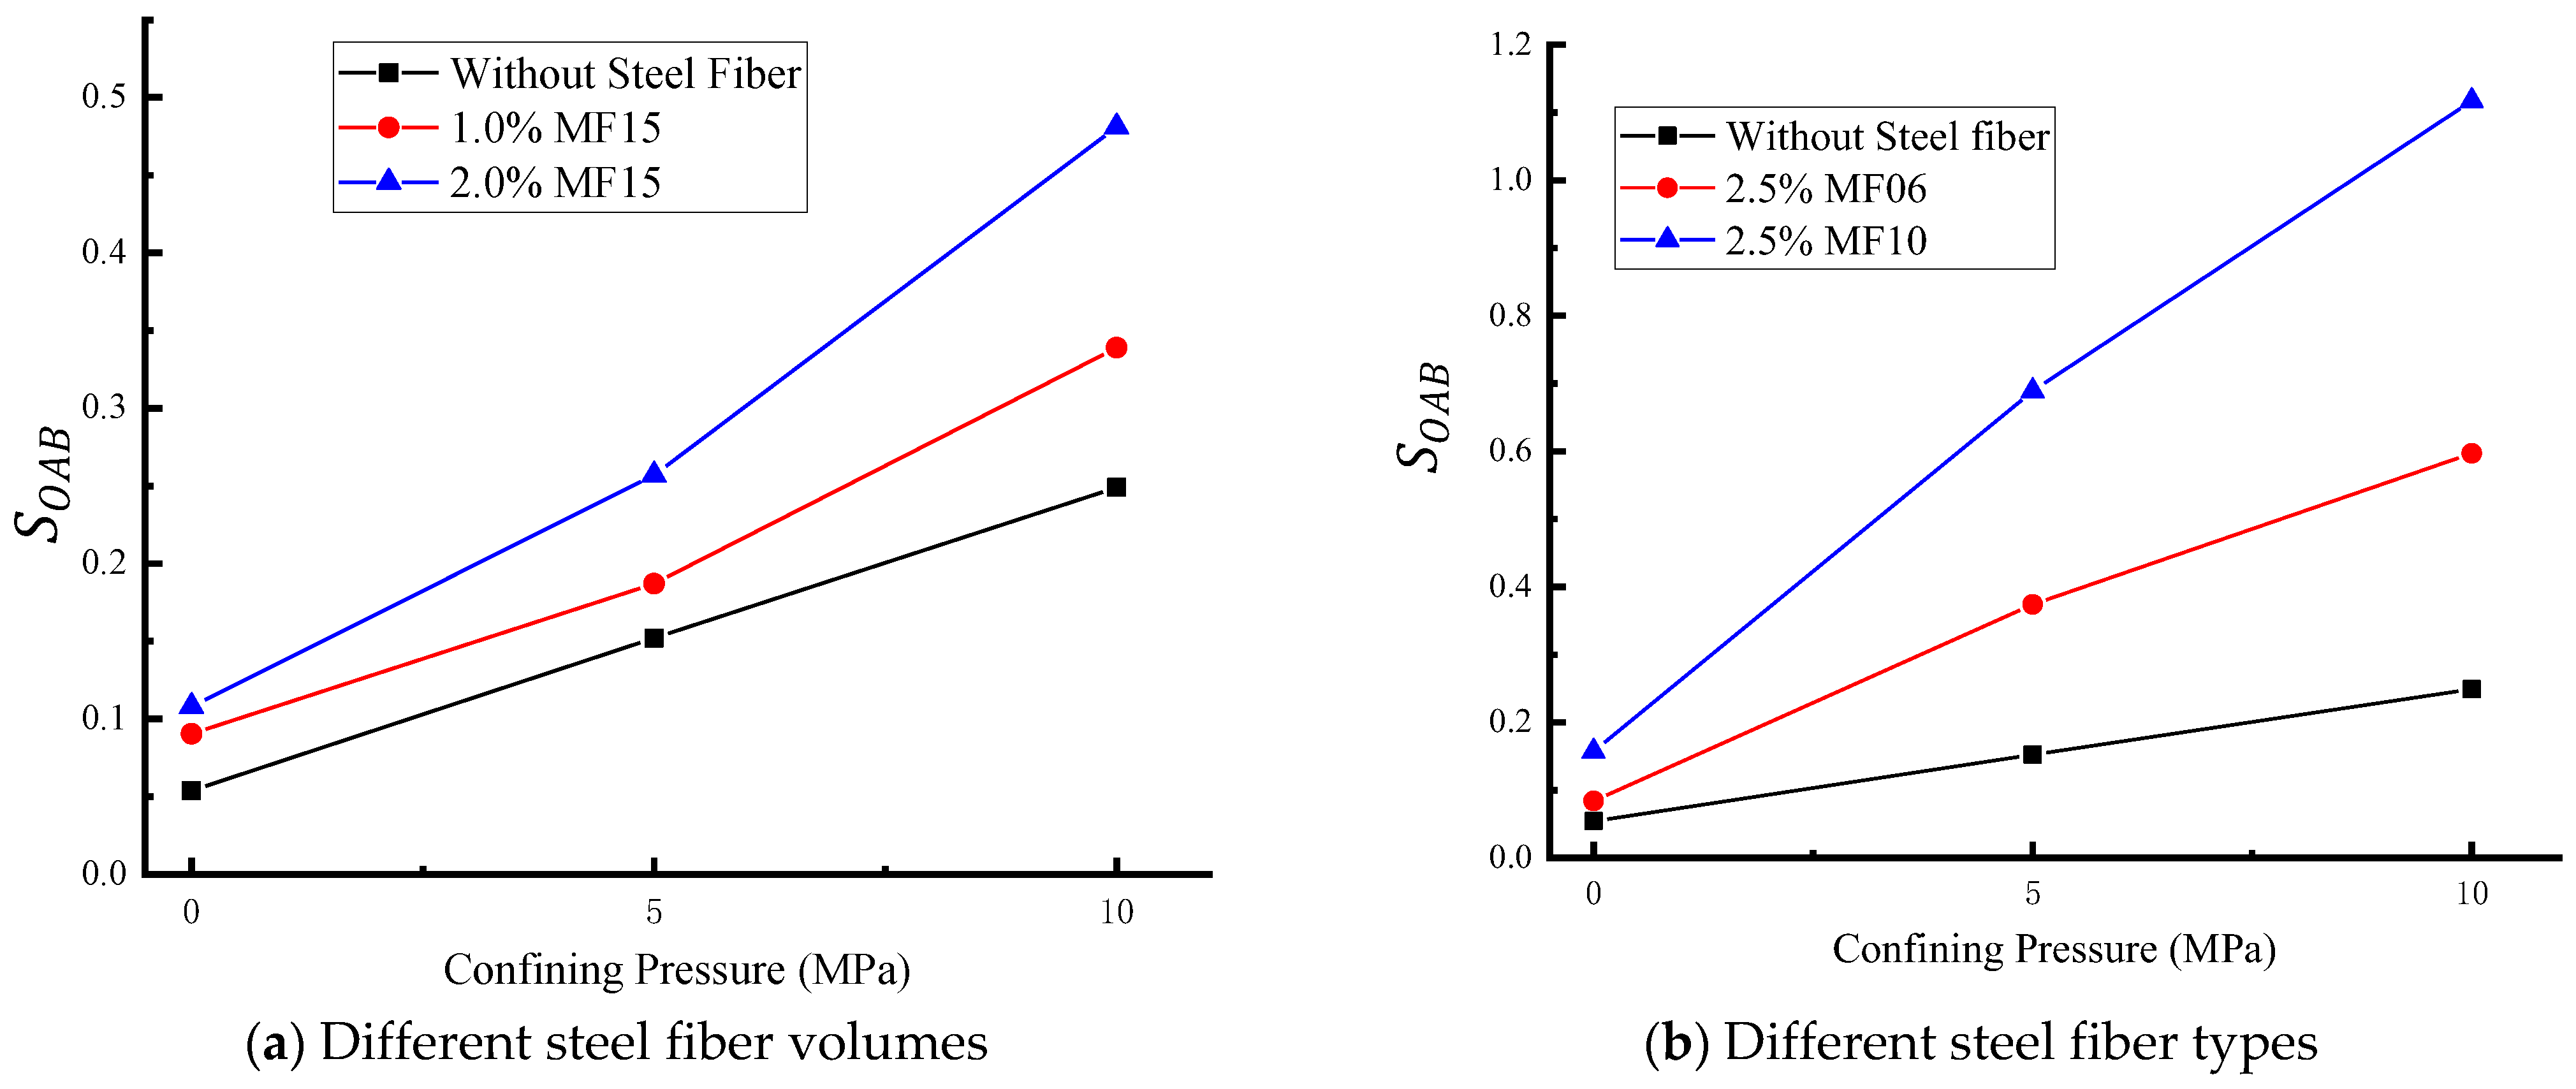
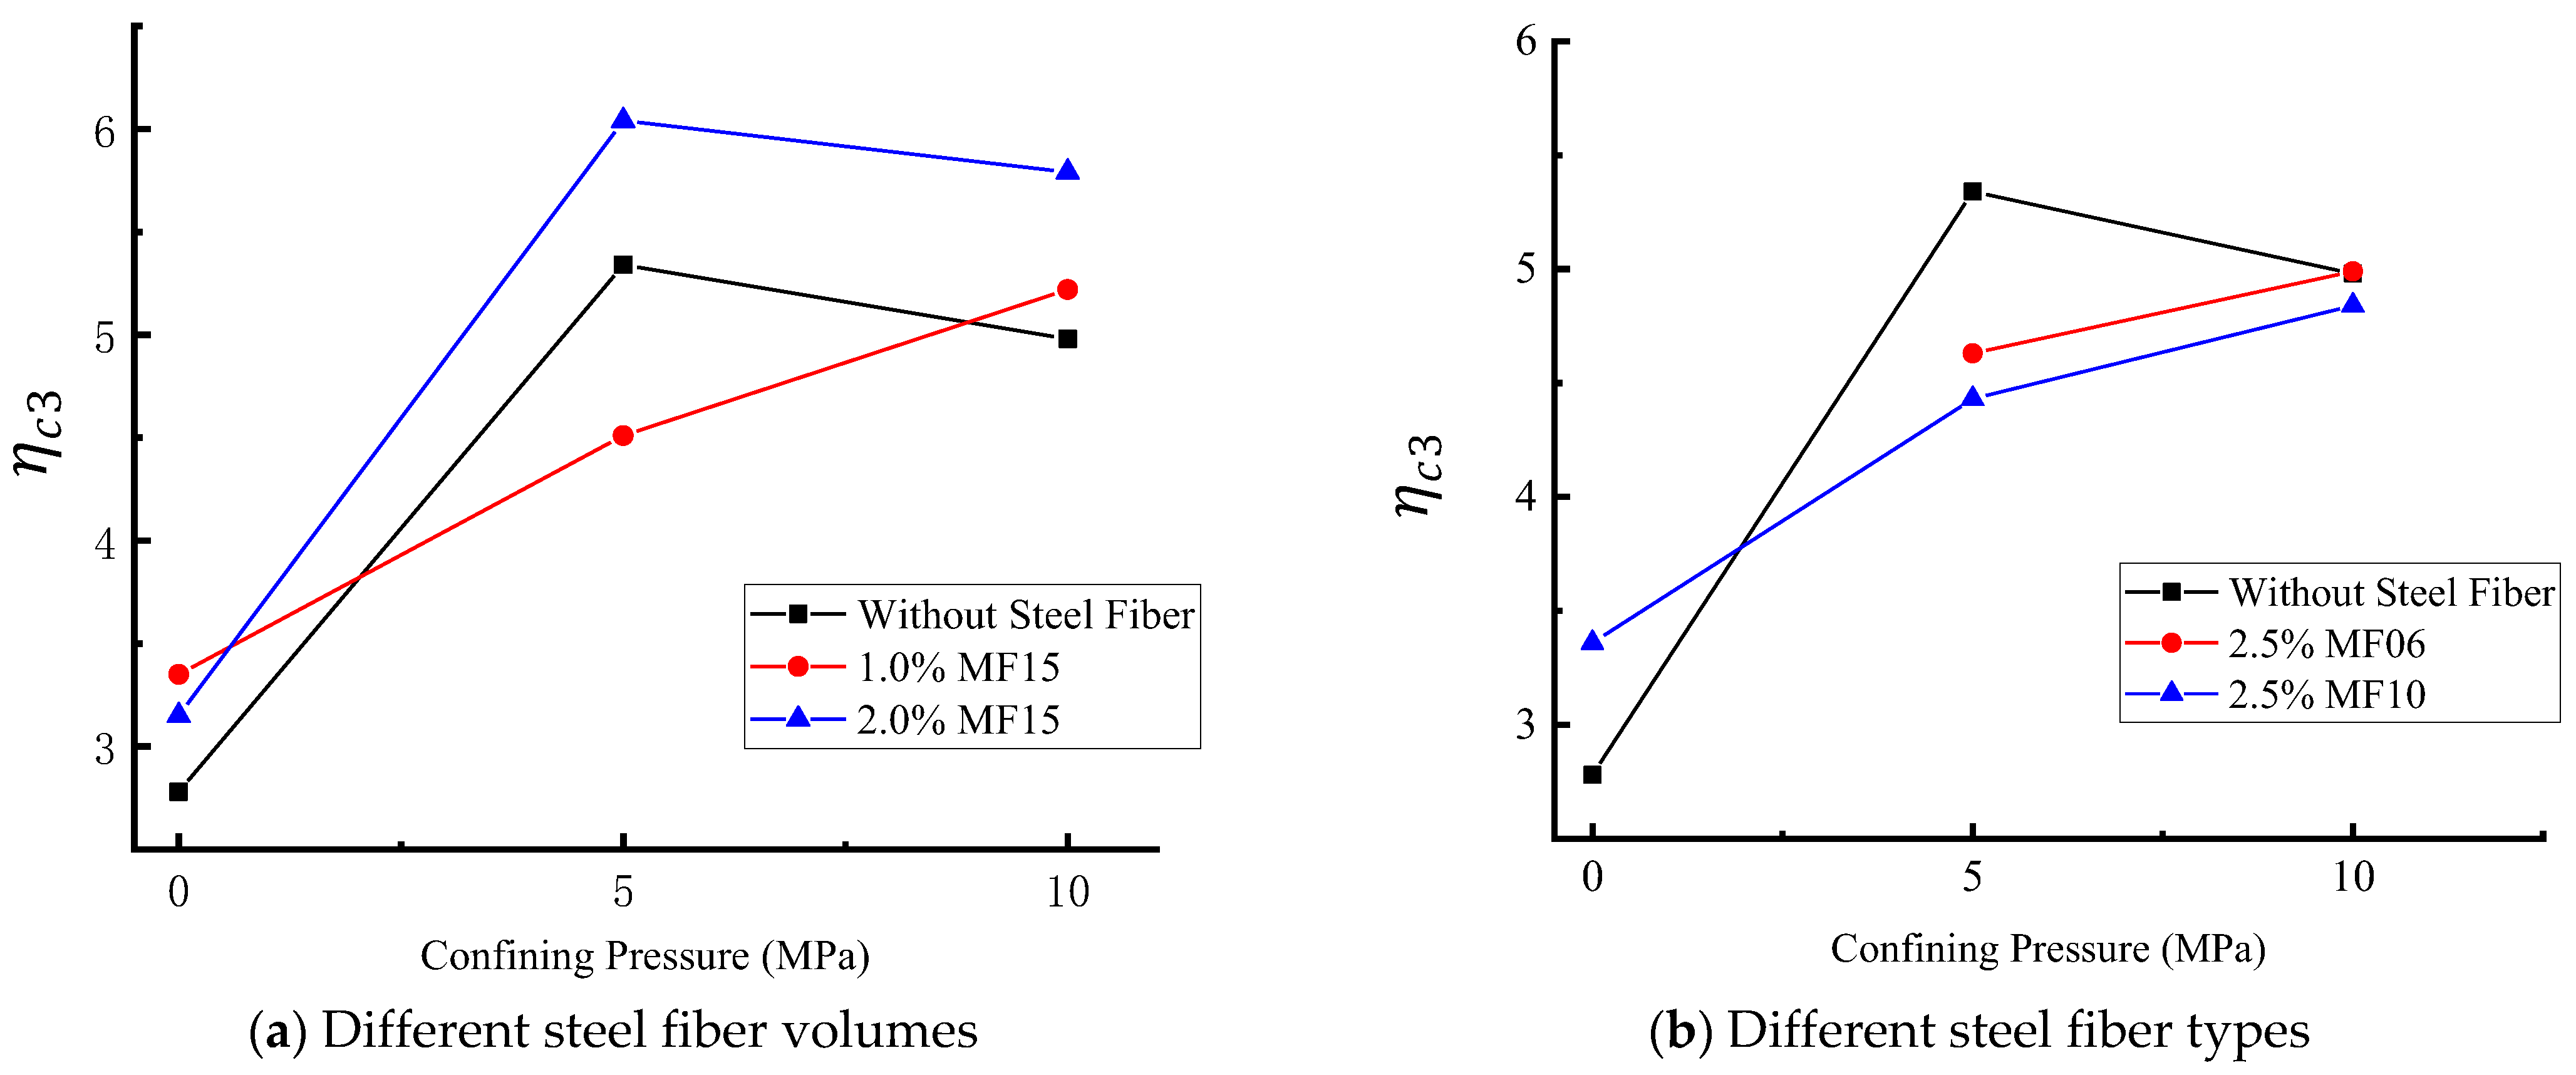
4.3. Compression Toughness
5. Numerical Simulation
5.1. Modeling Method and Verification
5.2. Size Effect
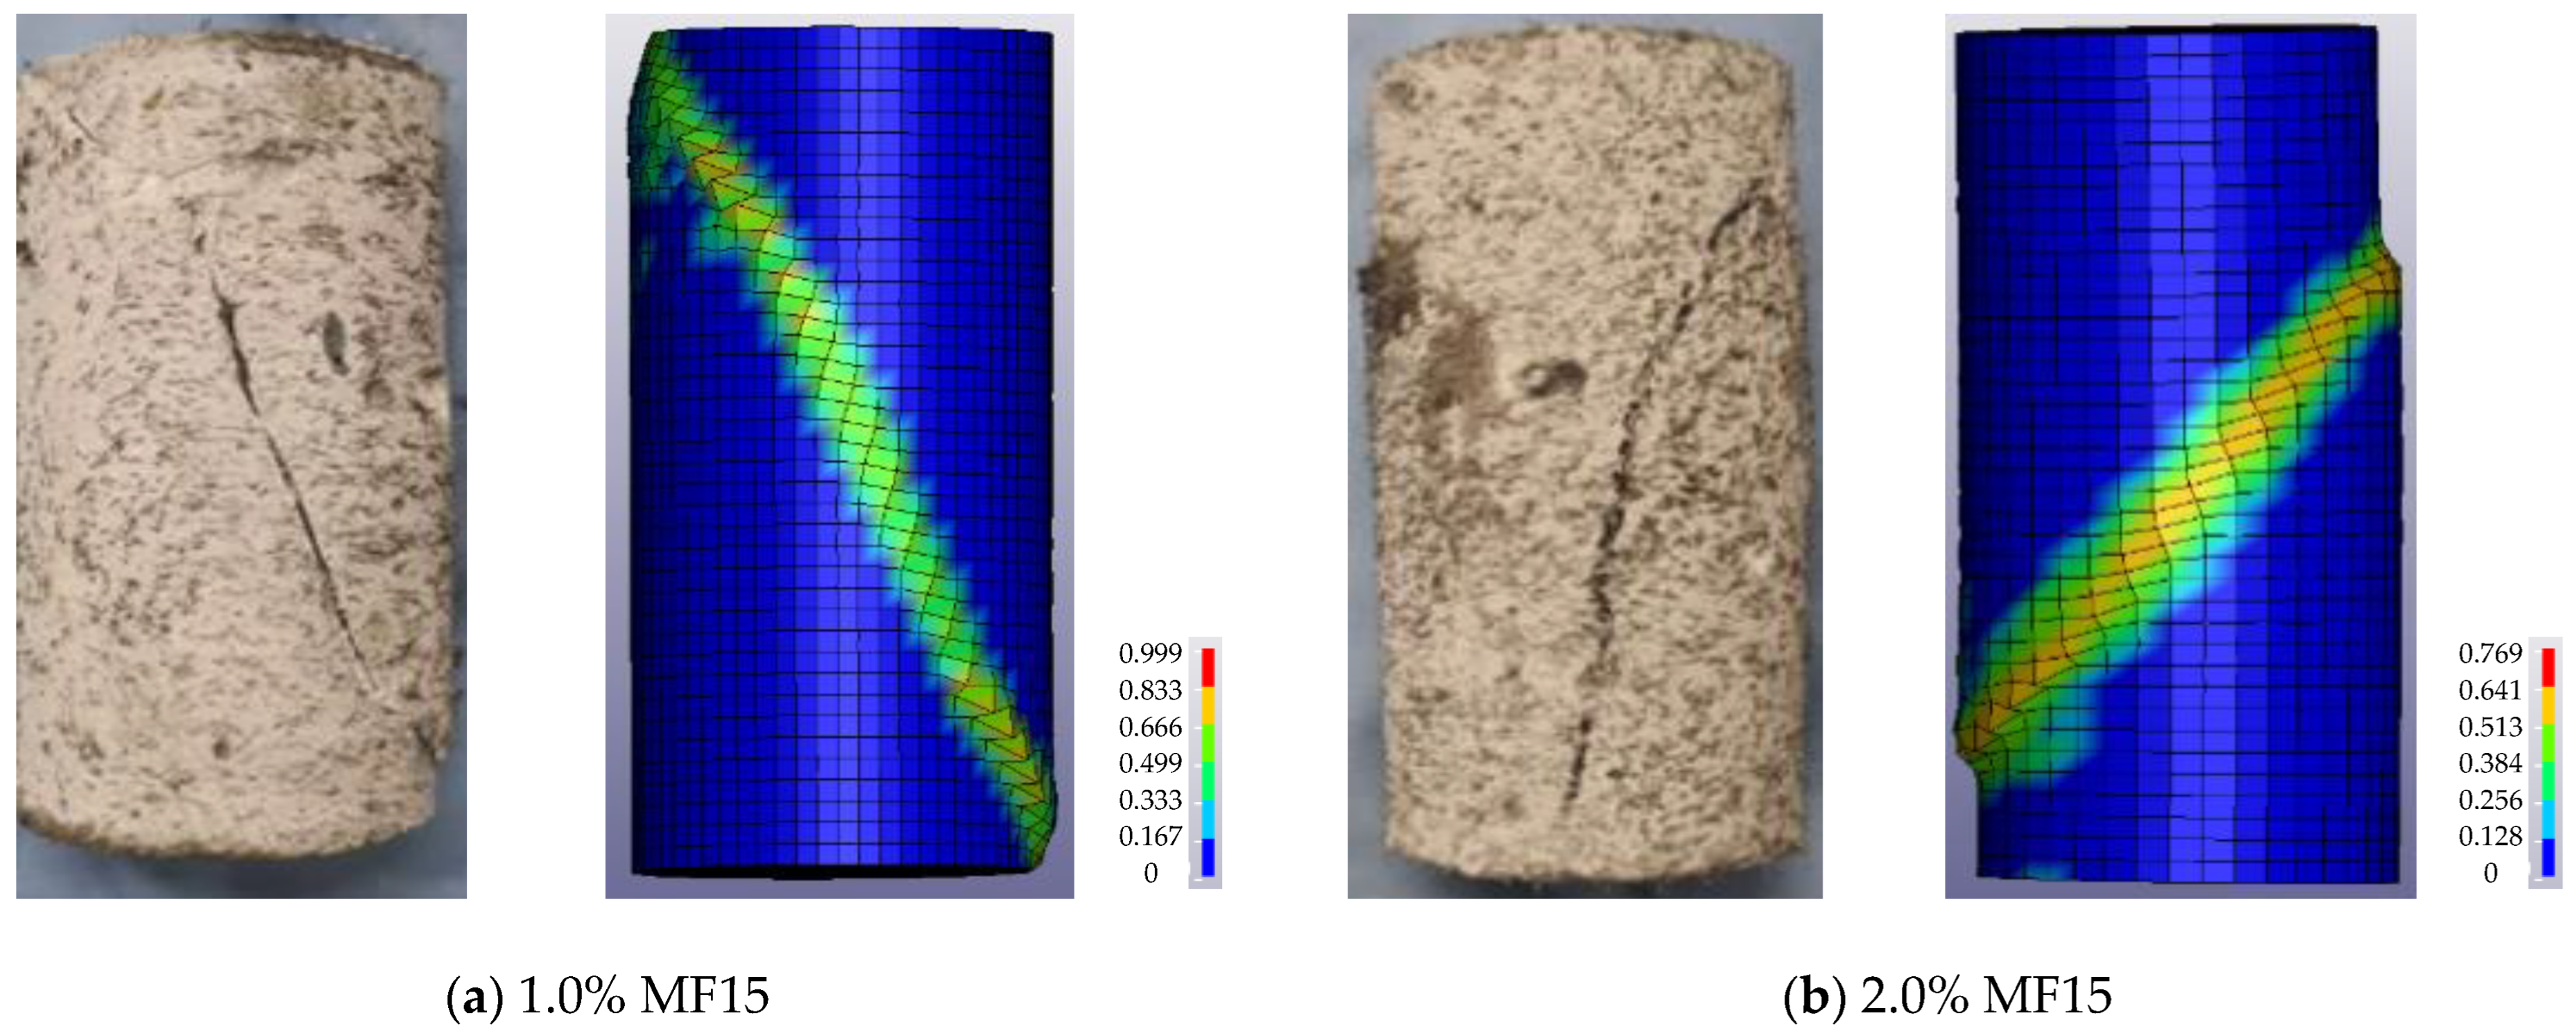
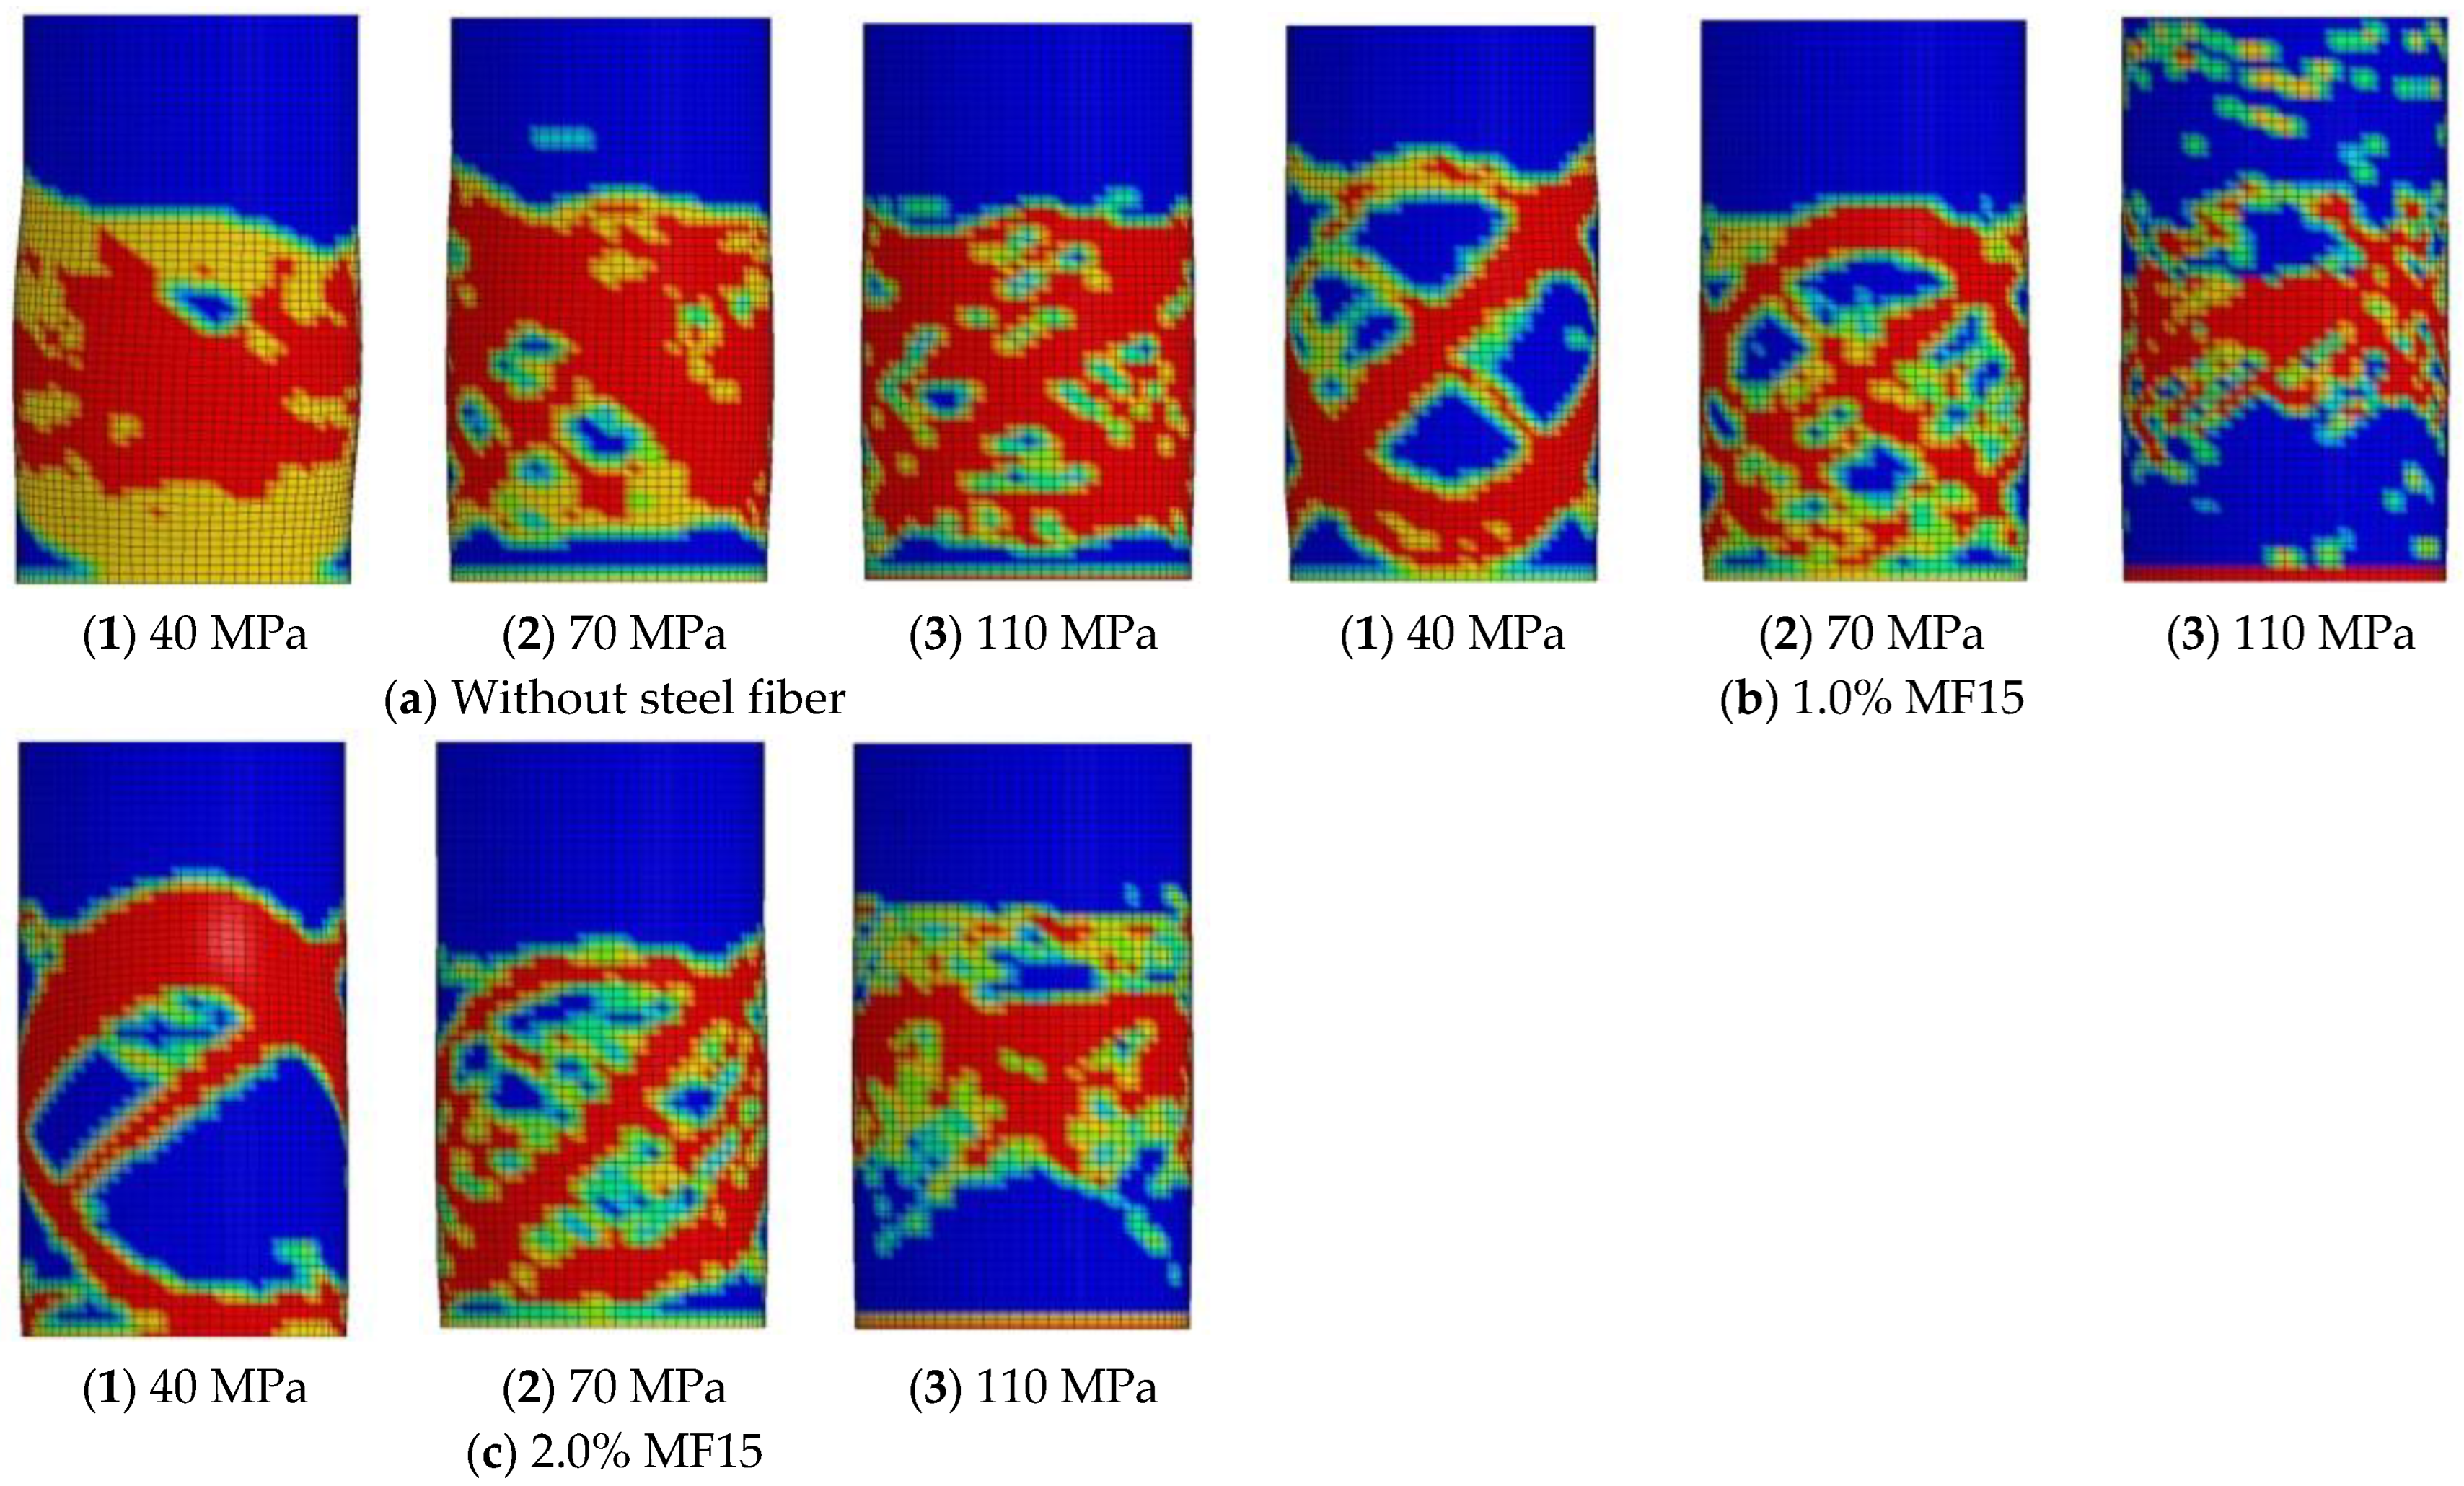
5.2.1. Failure Patterns
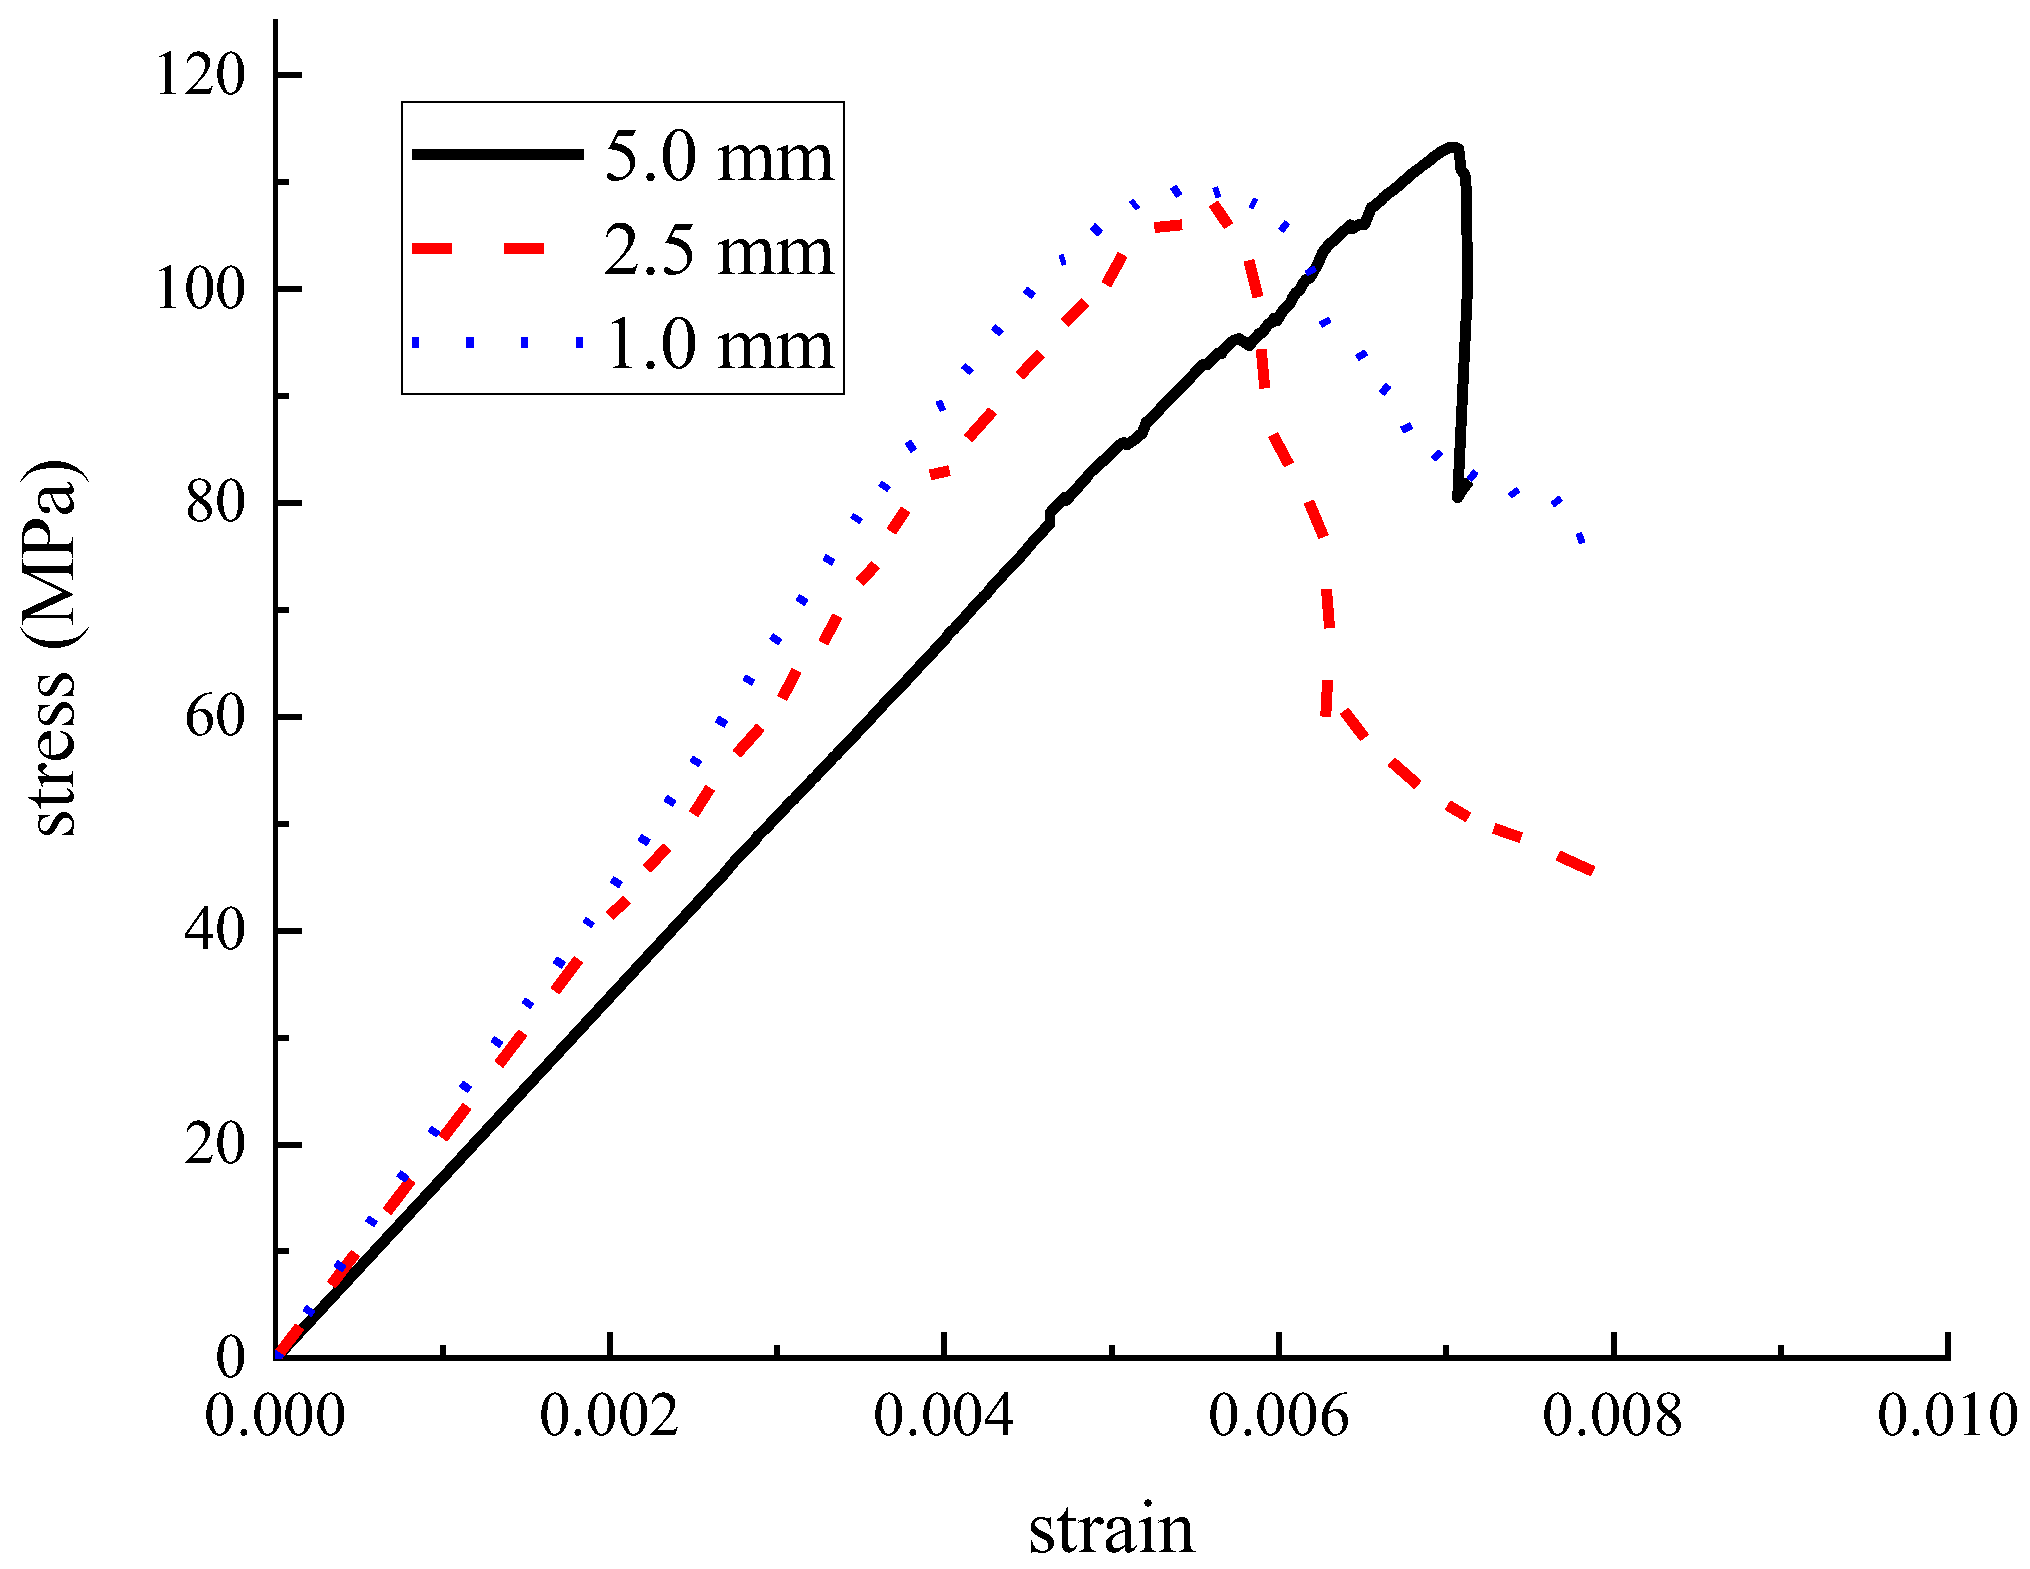
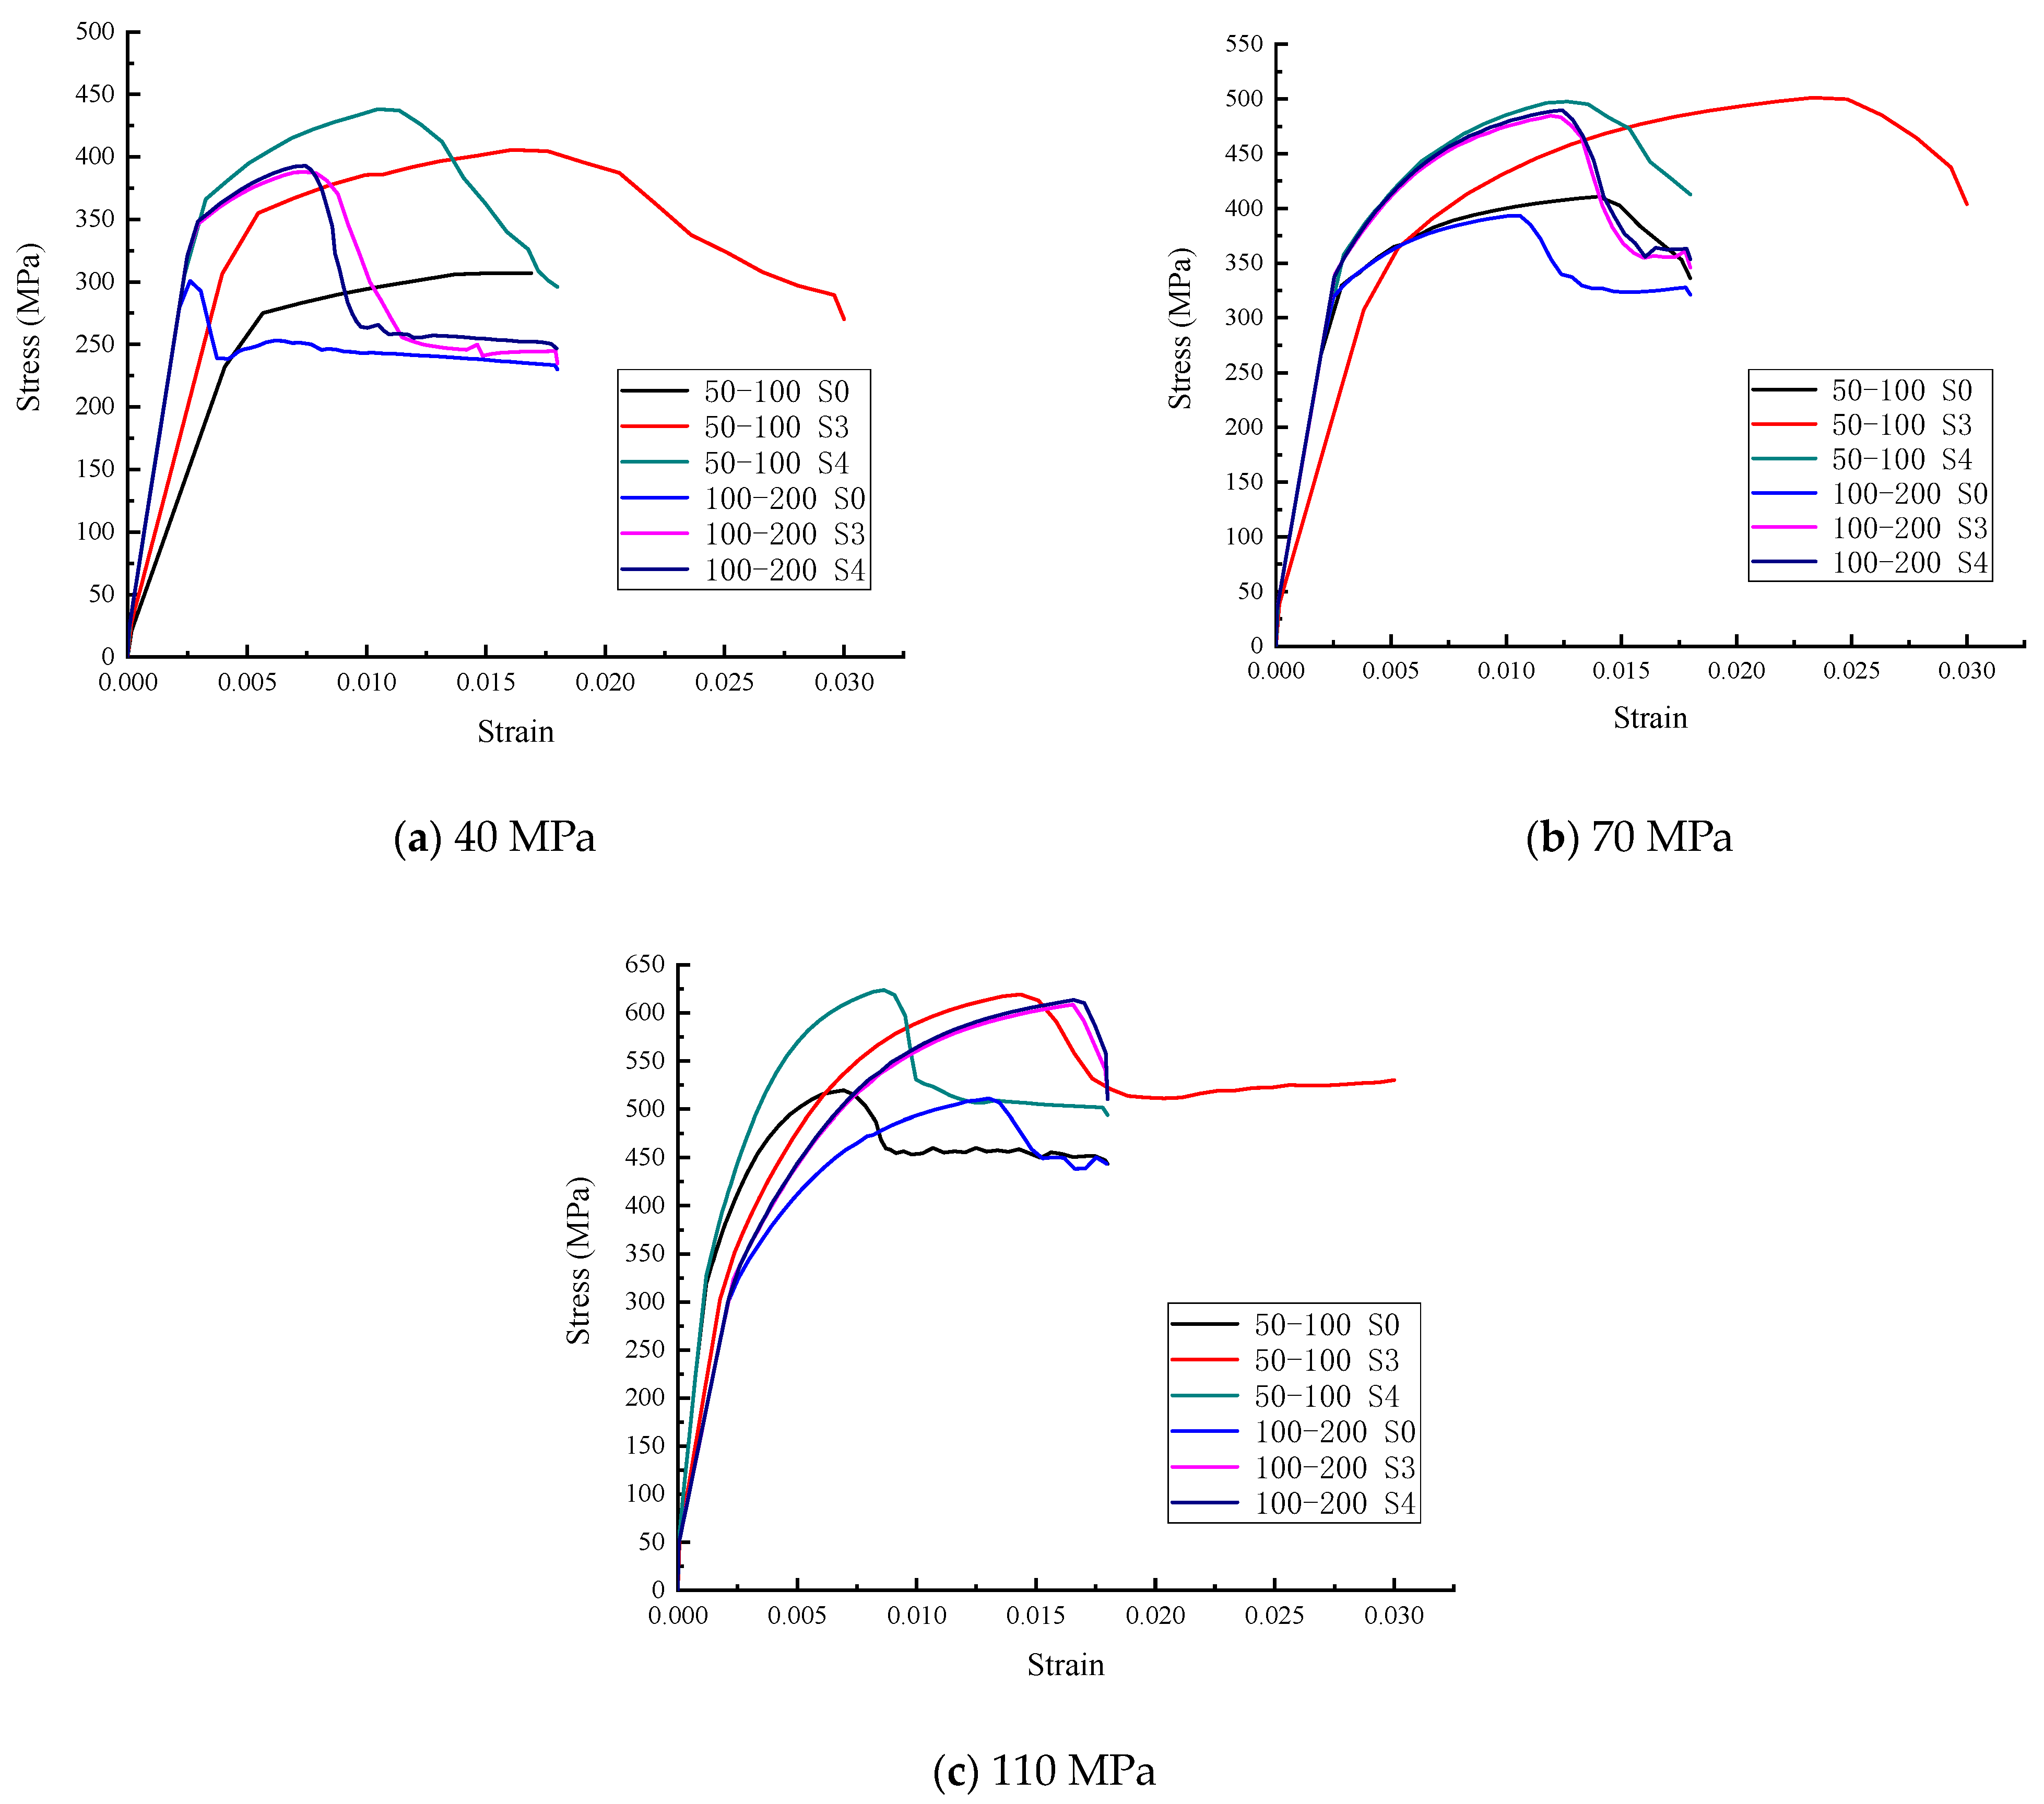
5.2.2. Stress–Strain Curve
6. Conclusions
- 1.
- Under uniaxial compression, with the increase in steel fiber content, the failure mode of the SFRGPC specimens gradually developed into ductile failure.
- 2.
- Under multi-axial compression, with the confining pressure increased, a corresponding increase in the angle between the failure crack and the longitudinal axis of the specimens occurred. As the confining pressure and steel fiber content increased, the brittleness of the SFRGPC can be completely eliminated, and its resistance to breaking can be greatly improved.
- 3.
- The steel fiber content and ratio of length to diameter have obvious influence on the compressive strength of SFRGPC. As the steel fiber content increased, the compressive strength increased by 1.15–1.44 times; as the ratio of length to diameter increased, the compressive strength increased by 1.21–1.70 times. The increase in confining pressure can improve the compressive strength of concrete. With the increase in confining pressure, the increase trend of compressive strength becomes smooth. The relationship between the peak stress and the confining pressure is linear and proportional.
- 4.
- The confining pressure, steel fiber content, and steel fiber length have substantial influences on the compressive toughness index . Under increasing confining pressure, increases linearly; however, after confining pressure is higher than 5 MPa, tends toward a steady state when the confining pressure increases.
- 5.
- By modifying the parameters of the material model, a uniform numerical model was established, and the simulation results matched the experimental data.
Author Contributions
Funding
Data Availability Statement
Acknowledgments
Conflicts of Interest
References
- Nguyen, H.T.; Pham, T.K.; Promentilla, M.A.B. Development of Geopolymer-Based Materials from Coal Bottom Ash and Rice Husk Ash with Sodium Silicate Solutions. In Proceedings of the 4th Congrès International de Géotechnique—Ouvrages—Structures, Ho Chi Minh City, Vietnam, 26–27 October 2017; Springer: Singapore, 2017. [Google Scholar]
- Mcguire, E.M.; Provis, J.L.; Duxson, P.; Crawford, R.H. Geopolymer Concrete: Is There an Alternative and Viable Technology in the Concrete Sector which Reduces Carbon Emissions. In Proceedings of the Concrete: Building A Sustainable Future, Perth, Australia, 22 October 2011. [Google Scholar]
- Davidovits, J. Geopolymer Cement a review. Geopolymer Sci. Tech. 2013, 21, 1–11. [Google Scholar]
- Morsy, M.S.; Alsayed, S.H.; Al-Salloum, Y.; Almusallam, T. Effect of Sodium Silicate to Sodium Hydroxide Ratios on Strength and Microstructure of Fly Ash Geopolymer Binder. Arab. J. Sci. Eng. 2014, 39, 4333–4339. [Google Scholar] [CrossRef]
- Nematollahi, B.; Sanjayan, J. Effect of different superplasticizers and activator combinations on workability and strength of fly ash based geopolymer. Mater. Des. 2014, 57, 667–672. [Google Scholar] [CrossRef]
- Arora, S.; Jangra, P.; Lim, Y.Y.; Pham, T.M. Strength, durability, and microstructure of self-compacting geopolymer concrete produced with copper slag aggregates. Environ. Sci. Pollut. Res. 2022, 30, 666–684. [Google Scholar] [CrossRef]
- Ghafoor, M.T.; Khan, Q.S.; Qazi, A.U.; Sheikh, M.N.; Hadi, M.N.S. Influence of alkaline activators on the mechanical properties of fly ash based geopolymer concrete cured at ambient temperature. Constr. Build. Mater. 2021, 273, 121752. [Google Scholar] [CrossRef]
- Lincy, G.A.; Velkennedy, R. Experimental optimization of metakaolin and nanosilica composite for geopolymer concrete paver blocks. Struct. Concr. 2020, 22, E442–E451. [Google Scholar]
- Yoo, D.Y.; Banthia, N. Mechanical properties of ultra-high-performance fiber-reinforced concrete: A review. Cem. Concr. Compos. 2016, 73, 267–280. [Google Scholar] [CrossRef]
- Ranjbar, N.; Zhang, M. Fiber reinforced geopolymer composites: A review. Cem. Concr. Compos. 2019, 107, 103498. [Google Scholar] [CrossRef]
- Ganesh, A.C.; Muthukannan, M. Development of high performance sustainable optimized fiber reinforced geopolymer concrete and prediction of compressive strength. J. Clean. Prod. 2020, 282, 124543. [Google Scholar] [CrossRef]
- Moradikhou, A.B.; Esparham, A.; Avanaki, M.J. Physical & mechanical properties of fiber reinforced metakaolin-based geopolymer concrete. Constr. Build. Mater. 2020, 251, 118965. [Google Scholar]
- Liu, J.; Wu, C.; Liu, Z.; Li, J.; Xu, S.; Liu, K.; Su, Y.; Chen, G. Investigations on the response of ceramic ball aggregated and steel fibre reinforced geopolymer-based ultra-high performance concrete (G-UHPC) to projectile penetration. Compos. Struct. 2021, 255, 112983. [Google Scholar] [CrossRef]
- Noushini, A.; Hastings, M.; Castel, A.; Aslani, F. Mechanical and flexural performance of synthetic fibre reinforced geopolymer concrete. Constr. Build. Mater. 2018, 186, 454–475. [Google Scholar] [CrossRef]
- Liu, Y.; Zhang, Z.; Shi, C.; Zhu, D.; Li, N.; Deng, Y. Development of ultra-high performance geopolymer concrete (UHPGC): Influence of steel fiber on mechanical properties. Cem. Concr. Compos. 2020, 112, 103670. [Google Scholar] [CrossRef]
- Sharma, U.; Gupta, N.; Bahrami, A.; Özkılıç, Y.O.; Verma, M.; Berwal, P.; Althaqafi, E.; Khan, M.A.; Islam, S. Behavior of Fibers in Geopolymer Concrete: A Comprehensive Review. Buildings 2024, 14, 136. [Google Scholar] [CrossRef]
- Meskhi, B.; Beskopylny, A.N.; Stel’makh, S.A.; Shcherban’, E.M.; Mailyan, L.R.; Shilov, A.A.; El’shaeva, D.; Shilova, K.; Karalar, M.; Aksoylu, C.; et al. Analytical Review of Geopolymer Concrete: Retrospective and Current Issues. Materials 2023, 16, 3792. [Google Scholar] [CrossRef]
- Çelik, A.İ.; Özkılıç, Y.O.; Bahrami, A.; Hakeem, I.Y. Effects of glass fiber on recycled fly ash and basalt powder based geopolymer concrete. Case Stud. Constr. Mater. 2023, 19, e02659. [Google Scholar] [CrossRef]
- Özkılıç, Y.O.; Çelik, A.İ.; Tunç, U.; Karalar, M.; Deifalla, A.; Alomayri, T.; Althoey, F. The use of crushed recycled glass for alkali activated fly ash based geopolymer concrete and prediction of its capacity. J. Mater. Res. Technol. 2023, 24, 8267–8281. [Google Scholar] [CrossRef]
- Kufper, H. Behavior of Concrete under Biaxial Stresses. Aci J. 1969, 66, 656–666. [Google Scholar]
- Zhou, J.; Pan, J.; Ma, H.; Zhao, J.; Li, Z. Behavior of high-performance concrete under multiaxial tensile-compressive loading. Constr. Build. Mater. 2020, 260, 119887. [Google Scholar] [CrossRef]
- Wang, Y.Z.; Wang, Y.B.; Zhao, Y.Z.; Li, G.Q.; Lyu, Y.F.; Li, H. Experimental study on ultra-high performance concrete under triaxial compression. Constr. Build. Mater. 2020, 263, 120225. [Google Scholar] [CrossRef]
- Ren, G.M.; Wu, H.; Fang, Q.; Liu, J.Z.; Gong, Z.M. Triaxial compressive behavior of UHPCC and applications in the projectile impact analyses. Constr. Build. Mater. 2016, 113, 1–14. [Google Scholar] [CrossRef]
- Khan, M.Z.N.; Hao, Y.; Hao, H.; Shaikh, F.U.A.; Liu, K. Mechanical properties of ambient cured high-strength plain and hybrid fiber reinforced geopolymer composites from triaxial compressive tests. Constr. Build. Mater. 2018, 185, 338–353. [Google Scholar] [CrossRef]
- Meng, E.; Yu, Y.; Zhang, X.; Su, Y. Experimental and theoretical research on the mechanical performance of totally recycled concrete under triaxial compression after high temperatures. Constr. Build. Mater. 2020, 261, 120012. [Google Scholar] [CrossRef]
- Zhang, K.; Zhao, L.Y.; Ni, T.; Zhu, Q.Z.; Shen, J.; Fan, Y.H. Experimental investigation and multiscale modeling of reactive powder cement pastes subject to triaxial compressive stresses. Constr. Build. Mater. 2019, 224, 242–254. [Google Scholar] [CrossRef]
- Chern, J.C.; Yang, H.J.; Chen, H.W. Behavior of steel fiber reinforced concrete in multiaxial loading. Aci Mater. J. 1993, 89, 32–40. [Google Scholar]
- Lu, X.; Hsu, C. Behavior of high strength concrete with and without steel fiber reinforcement in triaxial compression. Cem. Concr. Res. 2006, 36, 1679–1685. [Google Scholar] [CrossRef]
- Farnam, Y.; Moosavi, M.; Shekarchi, M.; Babanajad, S.K.; Bagherzadeh, A. Behaviour of Slurry Infiltrated Fibre Concrete (SIFCON) under triaxial compression. Cem. Concr. Res. 2010, 40, 1571–1581. [Google Scholar] [CrossRef]
- Wang, Z.; Zhu, B. Strength and Toughness Characteristic of Steel Fiber Reinforced Concrete in Triaxial Compression. J. Build. Mater. 2012, 15, 301–305+311. [Google Scholar]
- Wang, Z.L.; Zhu, H.H.; Wang, J.G.; Zhu, B. Experimental Study on Macroscopic Mechanical Behavior of SFRC under Triaxial Compression. Mech. Adv. Mater. Struct. 2012, 19, 653–662. [Google Scholar] [CrossRef]
- The ISRM Suggested Methods for Rock Characterization, Testing and Monitoring: 2007–2014; International Society for Rock, Echanics, Commission on Testing Methods: Lisbon, Portugal, 2015.
- Wu, P.; Wu, C.; Liu, Z.; Xu, S.; Li, J.; Li, J. Triaxial strength and failure criterion of ultra-high performance concrete. Adv. Struct. Eng. 2022, 25, 1893–1906. [Google Scholar] [CrossRef]
- Malvar, L.J.; Crawford, J.E.; Wesevich, J.W.; Simons, D. A plasticity concrete material model for DYNA3D. Int. J. Impact Eng. 1997, 19, 847–873. [Google Scholar] [CrossRef]
- Crawford, J.E.; Wu, J.; Choi, H.J.; Magallanes, J.M.; Lan, S. Use and validation of the release III K&C concrete model in LS-DYNA; Karagozian & Case: Glendale, CA, USA, 2012. [Google Scholar]


| Steel Fiber | Elastic Modulus (MPa) | Tensile Strength (MPa) | Diameter (mm) | Length (mm) | Aspect Ratio |
|---|---|---|---|---|---|
| MF06 | 2.1 × 10⁵ | 4295 | 0.12 | 6 | 50 |
| MF10 | 2.1 × 10⁵ | 4295 | 0.12 | 10 | 83 |
| MF15 | 2.1 × 10⁵ | 4295 | 0.12 | 15 | 125 |
| Group | Steel Fiber | Steel Fiber Volume Fraction (%) | Cementitious | Basic Activator | Superplasticizer | |
|---|---|---|---|---|---|---|
| S0 | -- | 0 | 1292 | 950 | 699 | 9.8 |
| S1 | MF06 | 2.5 | 1292 | 950 | 699 | 9.8 |
| S2 | MF10 | 2.5 | 1292 | 950 | 699 | 9.8 |
| S3 | MF15 | 1.0 | 1292 | 950 | 699 | 9.8 |
| S4 | MF15 | 2.0 | 1292 | 950 | 699 | 9.8 |
| Steel Fiber | (%) | Confining Pressure (MPa) | Strength (MPa) | Peak Strain | Steel Fiber | (%) | Confining Pressure (MPa) | Strength (MPa) | Peak Strain |
|---|---|---|---|---|---|---|---|---|---|
| Without steel fiber | 0 | 0 | 68.33 | 0.0025 | MF06 | 2.5 | 0 | 82.96 | 0.0040 |
| 5 | 125.0 | 0.0055 | 5 | 166.32 | 0.0085 | ||||
| 10 | 146.87 | 0.0081 | 10 | 226.17 | 0.0101 | ||||
| 15 | 184.77 | 0.0145 | 15 | 264.20 | 0.0116 | ||||
| 20 | 222.39 | --- | 20 | 293.28 | --- | ||||
| 30 | 271.46 | --- | 30 | 330.17 | --- | ||||
| 40 | 323.75 | --- | 40 | 390.33 | --- | ||||
| MF15 | 1.0 | 0 | 78.63 | 0.0035 | MF10 | 2.5 | 0 | 87.32 | 0.0052 |
| 5 | 153.45 | 0.0058 | 5 | 197.72 | 0.0145 | ||||
| 10 | 192.11 | 0.0082 | 10 | 243.08 | 0.0147 | ||||
| 15 | 261.73 | --- | 15 | 312.96 | --- | ||||
| 20 | 320.46 | --- | 20 | 340.79 | --- | ||||
| 30 | 353.44 | --- | 30 | 423.97 | --- | ||||
| 40 | 398.99 | --- | 40 | 530.34 | --- | ||||
| MF15 | 2.0 | 0 | 83.95 | 0.0039 | |||||
| 5 | 158.47 | 0.0063 | |||||||
| 10 | 207.63 | 0.0084 | |||||||
| 15 | 256.59 | 0.0100 | |||||||
| 20 | 301.03 | --- | |||||||
| 30 | 327.59 | --- | |||||||
| 40 | 403.34 | --- |
| Vf (%) | Fiber Length (mm) | Confining Pressure (MPa) | σc (MPa) | Critical Stress (MPa) | Critical Strain | SOAB | ηc2 | ηc3 |
|---|---|---|---|---|---|---|---|---|
| 0 | 0 | 0 | 68.47 | 58.20 | 0.0020 | 0.0539 | 2.56 | 2.78 |
| 5 | 117.10 | 99.45 | 0.0031 | 0.152 | 3.30 | 5.34 | ||
| 10 | 143.85 | 122.27 | 0.0036 | 0.249 | 2.96 | 4.98 | ||
| 1.0 | 15 | 0 | 83.31 | 70.81 | 0.00278 | 0.0904 | 2.52 | 3.35 |
| 5 | 149.94 | 127.45 | 0.00371 | 0.187 | 2.91 | 4.51 | ||
| 10 | 188.16 | 159.93 | 0.00372 | 0.339 | 2.95 | 5.22 | ||
| 2.0 | 15 | 0 | 81.57 | 69.33 | 0.00283 | 0.108 | 2.81 | 3.15 |
| 5 | 158.95 | 135.11 | 0.0035 | 0.257 | 3.63 | 6.04 | ||
| 10 | 202.95 | 172.50 | 0.0059 | 0.481 | 3.39 | 5.79 | ||
| 2.5 | 6 | 0 | 86.71 | 73.70 | 0.0026 | 0.084 | --- | --- |
| 5 | 164.69 | 139.98 | 0.0043 | 0.374 | 2.81 | 4.63 | ||
| 10 | 226.30 | 192.35 | 0.0054 | 0.597 | 2.96 | 4.99 | ||
| 2.5 | 10 | 0 | 83.86 | 71.28 | 0.0037 | 0.157 | 2.51 | 3.36 |
| 5 | 202.58 | 172.19 | 0.0060 | 0.689 | 2.712 | 4.43 | ||
| 10 | 255.20 | 216.92 | 0.0086 | 1.117 | 2.88 | 4.84 |
| Density (kg/m3) | Poisson’s Ratio | (MPa) | (MPa) | Omega | |||
|---|---|---|---|---|---|---|---|
| 2400 | 0.19 | 87 | 5.45 | 0.85 | 2.89 | 1.88 | 0.75 |
Disclaimer/Publisher’s Note: The statements, opinions and data contained in all publications are solely those of the individual author(s) and contributor(s) and not of MDPI and/or the editor(s). MDPI and/or the editor(s) disclaim responsibility for any injury to people or property resulting from any ideas, methods, instructions or products referred to in the content. |
© 2024 by the authors. Licensee MDPI, Basel, Switzerland. This article is an open access article distributed under the terms and conditions of the Creative Commons Attribution (CC BY) license (https://creativecommons.org/licenses/by/4.0/).
Share and Cite
Wu, P.; Wan, X.; Lu, Q.; Zhang, Y. Study on Mechanical Properties of Steel Fiber-Reinforced Geopolymer Concrete under Multi-Axial Loads. Buildings 2024, 14, 2780. https://doi.org/10.3390/buildings14092780
Wu P, Wan X, Lu Q, Zhang Y. Study on Mechanical Properties of Steel Fiber-Reinforced Geopolymer Concrete under Multi-Axial Loads. Buildings. 2024; 14(9):2780. https://doi.org/10.3390/buildings14092780
Chicago/Turabian StyleWu, Pengtao, Xuan Wan, Qun Lu, and Yan Zhang. 2024. "Study on Mechanical Properties of Steel Fiber-Reinforced Geopolymer Concrete under Multi-Axial Loads" Buildings 14, no. 9: 2780. https://doi.org/10.3390/buildings14092780