Abstract
The arrangement of eccentric bracing has a significant impact on the seismic performance of structures. However, there is no further stipulation on different forms of eccentric bracing in the current Chinese code. At the same time, there is a lack of research on the seismic loss of eccentrically braced structures by Chinese domestic scholars. Therefore, this paper designs different forms of eccentrically braced frames and analyzes them according to the concept of seismic engineering based on performance, which provides some reference for the selection of the eccentrically braced steel frame structure layout in future engineering practice. In this paper, K-shaped, V-shaped, and D-shaped eccentrically braced steel frame structures with 3, 5, and 8 floors are designed, and the finite element analysis model is used for static napping and dynamic time history analysis. The results show that the K-shaped eccentrically braced structure has the best performance in bearing capacity and stiffness and has good seismic and collapse resistance performance. In the FEMA P-58 seismic assessment and vulnerability assessment, it is found that the V-shaped eccentrically braced structure has the smallest loss. However, it is necessary to fully consider the acceleration sensitivity of the non-structural components in the design. In general, the seismic performance of the eccentrically braced structure is improved by the energy dissipation beam yielding to consume energy, which provides a useful reference for structural design.
1. Introduction
With the rapid development of China’s economy, the sharp increase in steel production capacity has played an important role in driving China’s domestic GDP, which has made structural steel popular as a sustainable construction material. The steel structure system is widely used in high-rise and super high-rise buildings, including the bending steel frame, central braced steel frame, eccentrically braced steel frame, etc. The eccentrically braced structure can provide good ductility and seismic resistance and is considered an economical and effective choice for a wide range of applications. Eccentrically braced steel frame structures combine the advantages of pure steel frames to provide good ductility and sufficient energy dissipation capacity with the advantage of the high stiffness of centrally braced steel frames [1,2,3], sing the controllable energy dissipation beam yield to achieve seismic energy consumption [4]. In order to achieve good seismic performance of eccentrically braced structures, it is necessary to reasonably set up the form of eccentrically braced structures according to the characteristics of the structural system. In this regard, scholars at home and abroad have carried out a series of studies (Yu Anlin et al. [5]; Qian Jiaru et al. [6]; Bosco and Rossi et al. [7]; Wang Feng et al. [8]; Tian Xiaohong et al. [9,10]; Li Shen et al. [11]). Yasin O. Ozkılıc et al. [12,13,14,15,16] conducted a series of studies on the shear links of eccentrically supported frame structures. They performed a comprehensive numerical analysis and experimental exploration of shear links. The drift ability and service life of the shear links are improved, and the performance of the eccentric frame structure is optimized. These studies have deepened the understanding of the energy dissipation characteristics of different forms of eccentrically braced structures.
At the same time, in seismic design codes across various countries, the traditional design standard of “minor earthquakes do not cause damage, moderate earthquakes are reparable, and major earthquakes do not cause collapse” is widely adopted, showcasing a hierarchical approach to seismic design. For example, the “Code for Seismic Design of buildings” GB50011-2010 [17] and the American “International Building Code” IBC [18] are all based on this concept. Buildings designed according to the above approach can effectively mitigate overall structural collapse. They also minimize casualties during severe earthquakes within the building. However, it is powerless to the direct or indirect economic loss caused by the earthquake disaster. In recent years, several destructive earthquakes have revealed the limitations of conventional seismic design methods. Performance-based earthquake engineering (PBEE) has emerged in our field as a response to these challenges. Aslani et al. [19] took many factors as random variables and considered the influence of non-structural members on earthquake loss. Mitrani-Reiser et al. [20] and Ye Shanshan et al. [21] studied the seismic performance of the structure from the perspective of direct and indirect economic loss caused by the earthquake. Zareian et al. [22] and Ramirez et al. [23] all put forward a single building loss assessment method from the floor level. Gobbo et al. [24], Zeng Xiang et al. [25], Zhu Hanbo et al. [26], and Yandeng et al. [27] used the FEMA P-58 assessment method to assess the loss of different forms of structures.
The arrangement of eccentric bracing has a significant impact on the seismic performance of structures. However, there are no further regulations on different forms of eccentric bracing in current Chinese specifications [17,28,29]. Therefore, discussing the arrangement forms of eccentric bracing is necessary; it helps in finding more reasonable layouts, aiming to reduce the structural response and enhance the seismic performance of structures. At the same time, the research on the earthquake loss of eccentrically braced structures is also lacking. Therefore, different forms of eccentrically braced steel frames are designed in this paper. According to the concept of seismic engineering based on performance, a seismic loss analysis is carried out, which provides some reference for the selection of eccentrically braced steel frame structure layouts in future engineering practice.
2. Structural Design Modeling
2.1. Results of Structural Design
The seismic performance of eccentrically braced structures is investigated in this study, adhering strictly to the provisions outlined in Code for Seismic Design of buildings [17] and Steel structure Design Standard [28]. Three sets of examples are designed, consisting of buildings with three floors, five floors, and eight stories, respectively. Each group of examples includes K-shaped, V-shaped, and D-shaped eccentrically braced structures, for a total of nine structural models. It is assumed that all the structural models studied in this paper are office buildings.
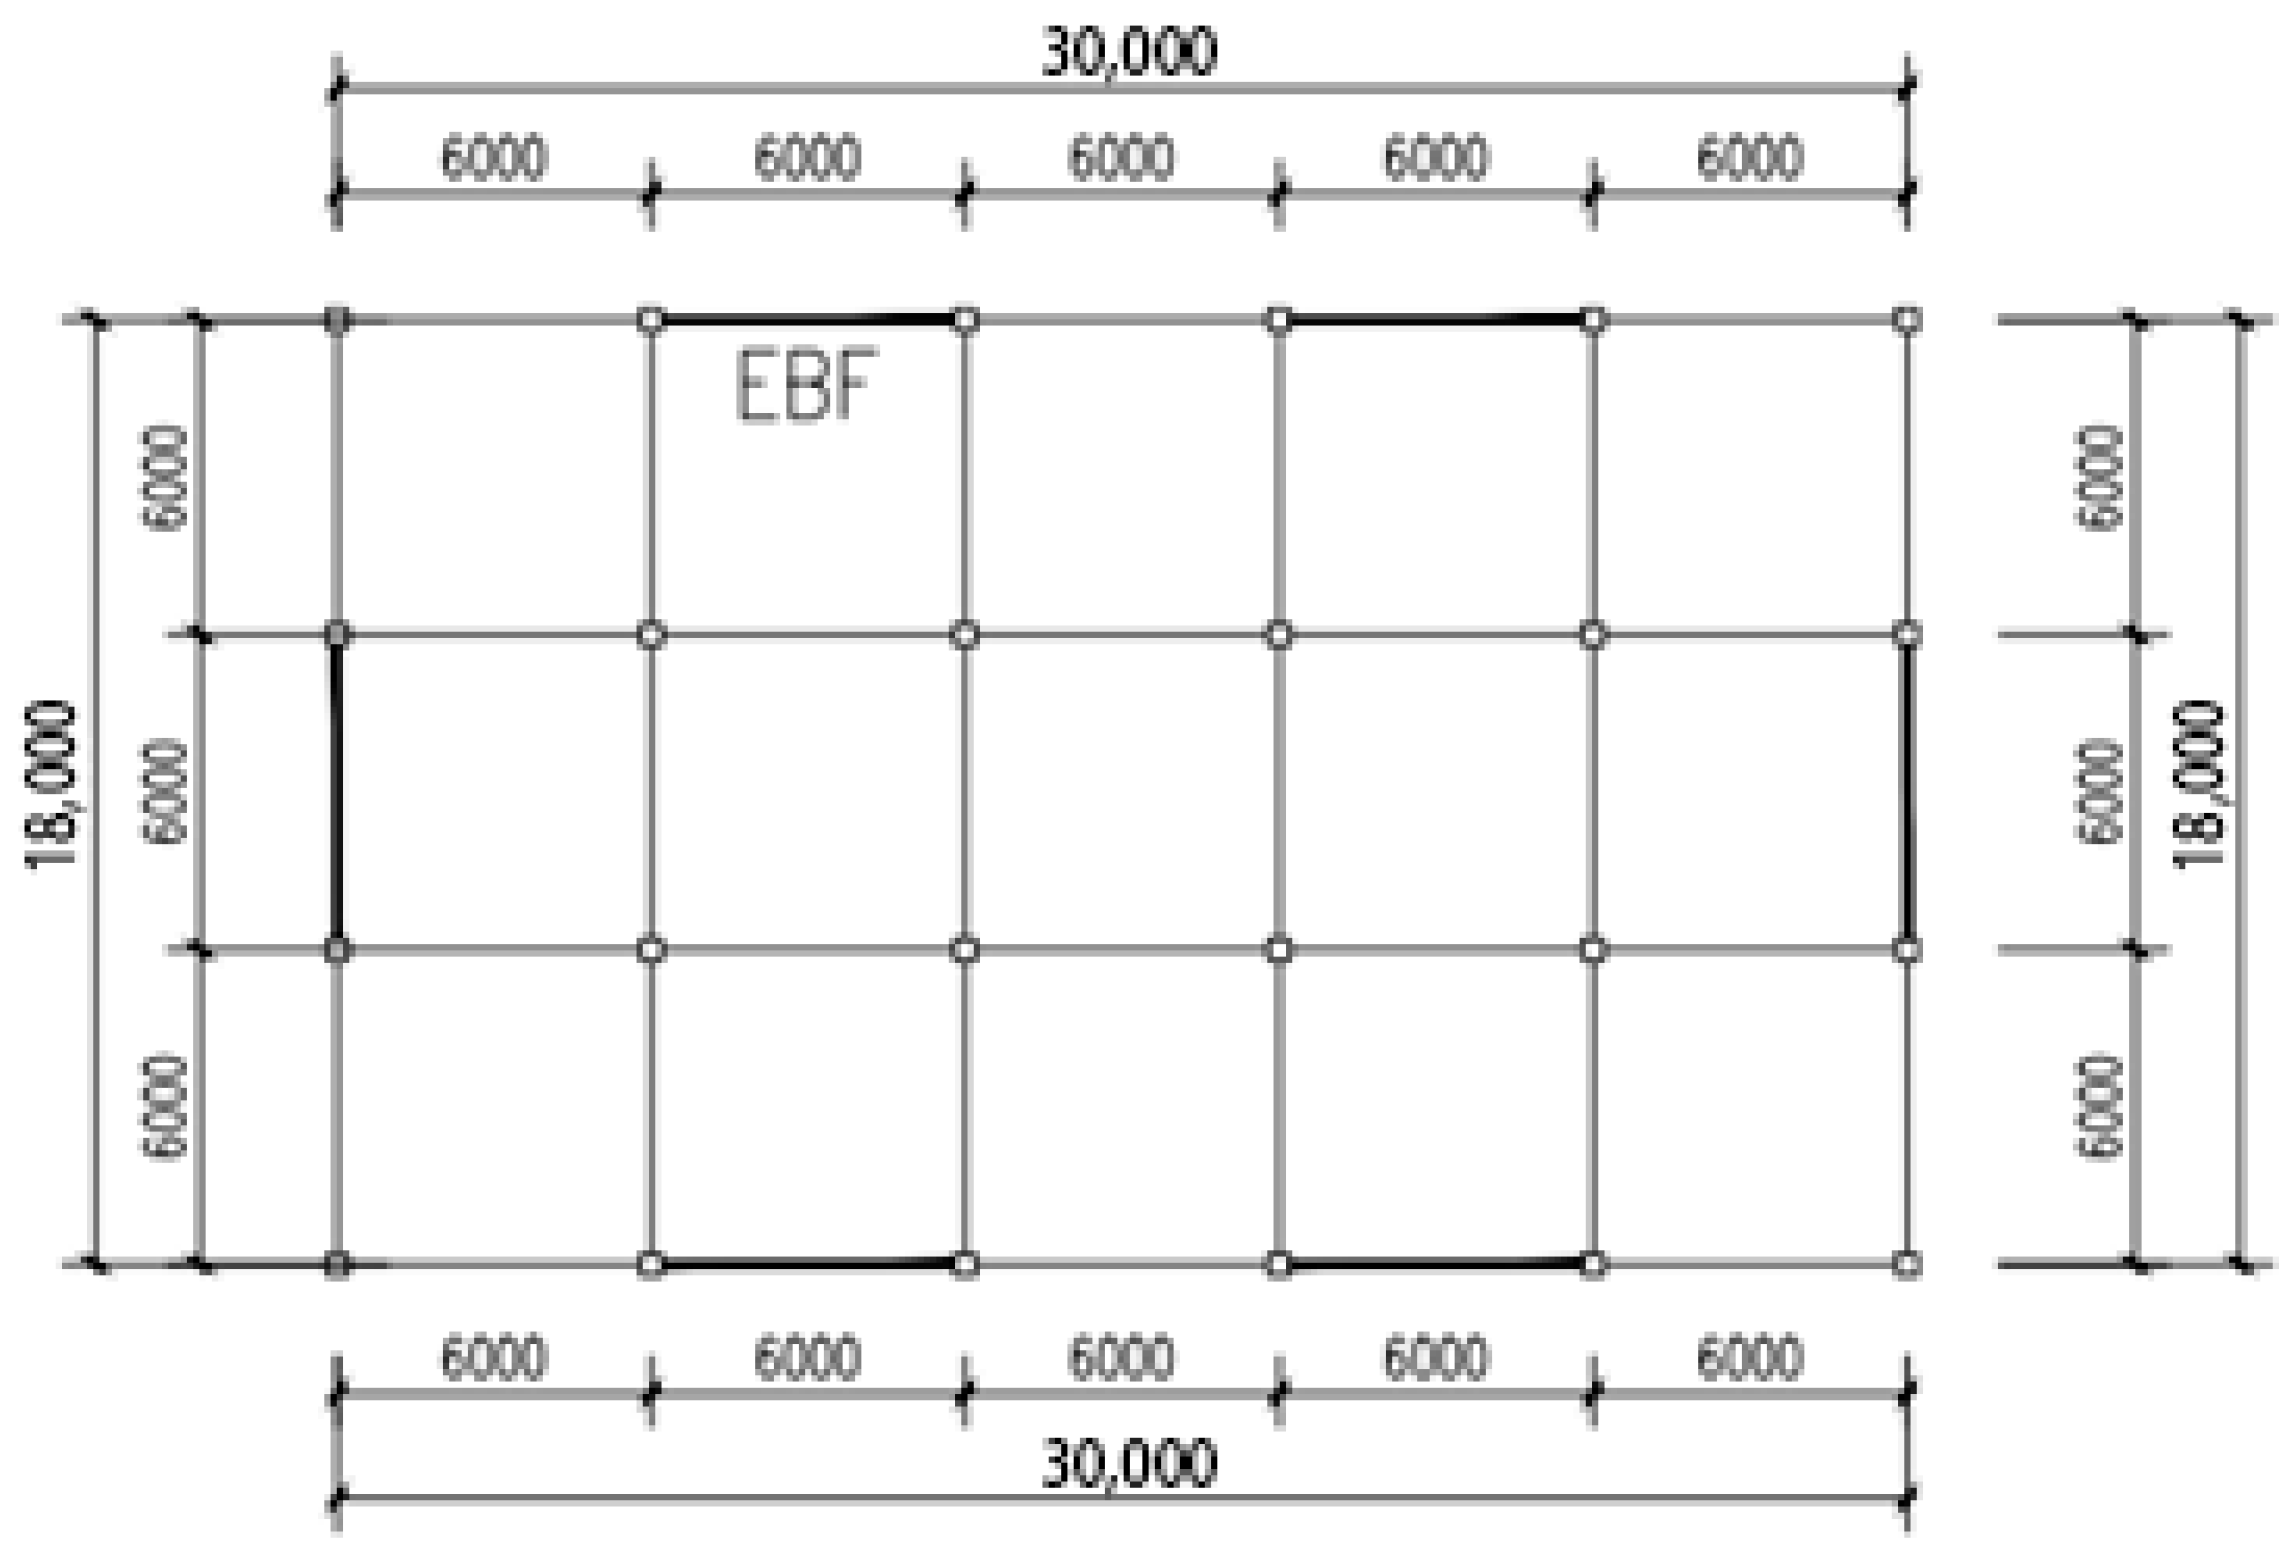
In each group of examples, the plane layout of the three eccentrically braced frames is the same, as shown in Figure 1. The structure name and elevation layout are shown in Figure 2 (taking the elevation layout of three types of models 3K, 5V, and 8D as an example, the different elevations of the same type of model are similar). The structural calculation example is classified as Class B for seismic fortification, with an importance factor of 1.1 and a design life of 50 years. It is fortified against an intensity of 8 degrees, with a design acceleration of 0.2 g, falling under Seismic Grade II and Site Soil Category II. The system incorporates a damping ratio of 0.04 and a period reduction coefficient of 0.85, categorized within the second seismic design group with a characteristic period of 0.4 s. Frame columns and frame beams are made of Q345 low-alloy steel. The energy dissipation beam section and the support section are made of Q235 low-alloy steel. The floor and roof panels are C30 concrete. According to building structure load code GB 50009-2012 [30], the permanent and live loads for roof and floor surface stories are both 5 kN/m2 and 2 kN/m2, respectively. Considering door and window openings and infill walls, the load on the beam is taken as 6 kN/m. The permanent and live loads are converted to loads on the beam, which are 36 kN/m and 14.4 kN/m, respectively. The floor is an ordinary concrete floor with a thickness of 120 mm. The uniform load on the beam is converted to 21 KN/m. The rough category of the site is Class B. The basic wind pressure is 0.45 KN/m2. The section dimensions of each component are shown in Table 1, Table 2 and Table 3.

Figure 1.
Structural layout plan (unit: mm).
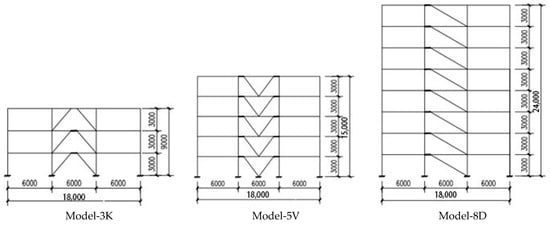
Figure 2.
Elevation layout of example structure (unit: mm).

Table 1.
Section size (mm) of each member of a 3-story example.
Table 2.
Section size (mm) of each member of a 5-story example.
Table 3.
Section size (mm) of each member of an 8-story example.
2.2. Establishment of SAP2000 Finite Element Model
The model of the example structure is established according to reference [31] in the finite element program SAP2000. When modeling, the beam and column are selected for beam unit simulation. As reported by FEMA 356 [32], for the frame column, considering the coupling between the axial force and the bending moment, the default P-M2-M3 hinge is adopted. Because the plastic area of the beam and column is mainly concentrated at the end of the member, the plastic hinges are arranged at 0.1 L and 0.9 L (L is the length of the beam and column member). For the braced, the default Axial-P hinge is defined in this paper, which is arranged at 0.5 L (L is the length of the inclined bar) at the midpoint of the inclined bar. When setting the specific parameters of the shear hinge in SAP2000, the yield strength is the shear yield strength of the material, the shear ultimate strength is 1.6 times the yield strength, and the corresponding plastic strain-strengthening section length is 18 times the yield displacement. Table 4, Table 5, Table 6, Table 7 and Table 8 present the initial three modal characteristics of Model-3K, Model-5K, Model-5V, Model-5D, and Model-8K.
Table 4.
Model-3K modal characteristics.
Table 5.
Model-5K modal characteristics.
Table 6.
Model-5D modal characteristics.
Table 7.
Model-5V modal characteristics.
Table 8.
Model-8K modal characteristics.
The ratio of the 1st torsional mode period to the 1st translational mode period for each structure is 0.63, 0.63, 0.65, 0.64, and 0.65, respectively. These values are all below the requirement specified in the technical specifications for the steel structures of tall buildings [29], which state that the ratio should not exceed 0.9. This indicates that the layout of each structure is reasonable and capable of effectively resisting lateral forces. From the structural modal period, it is known that the structural period varies with the change in structural form, but when the design parameters of the structure are the same, such as the length of the energy dissipation beam, beam–column bracing section, floor height, and number of floors, the periods of different forms of eccentrically braced structures are basically the same, indicating that the lateral stiffness is basically the same.
3. Pushover Analyses
A pushover analysis is a kind of static elastoplastic analysis combined with a response spectrum. In this method, a certain horizontal lateral load loading mode is adopted, and step-by-step increases in the horizontal lateral load are applied to the structure to push the structure to a target state or until the structure collapses. The deformation and internal forces of the structure are obtained, the elastic–plastic performance and lateral resistance of the structure are analyzed, and then the seismic performance is evaluated.
A pushover analysis is conducted on the designed structure. Horizontal loads are applied with an inverted triangle distribution during the analysis. Bi-directional analysis is used in this paper. The horizontal force is assumed to act in two orthogonal directions, the X-direction and the Y-direction. Because the stiffness of each eccentrically braced structure in the YZ plane is small and the longitudinal seismic capacity is weak, this paper only analyzes the unfavorable Y-direction. In the pushover analysis, the plastic hinge is rigid plastic and there is no elastic behavior. This is mainly because the pushover analysis aims to evaluate the structure’s performance under ultimate loads, rather than considering its elastic behavior. In this paper, the end of the straight phase on the pushover capacity curve is considered the yield point of the structure. Before this, the whole structure is in the elastic state; afterwards, the energy dissipation beam segment begins to enter the elastoplastic phase. When the deformation of the plastic hinge reaches the maximum, unloading begins immediately, the structural stiffness decreases, and a steep drop occurs in the pushover capacity curve. In China’s seismic code, the inter-story drift angle of the structure shall not be more than 1/50. Therefore, in this paper, the maximum inter-story drift angle of the structure of 0.02 is taken as the limit state of the pushover analysis.
3.1. Pushover Capacity Curve
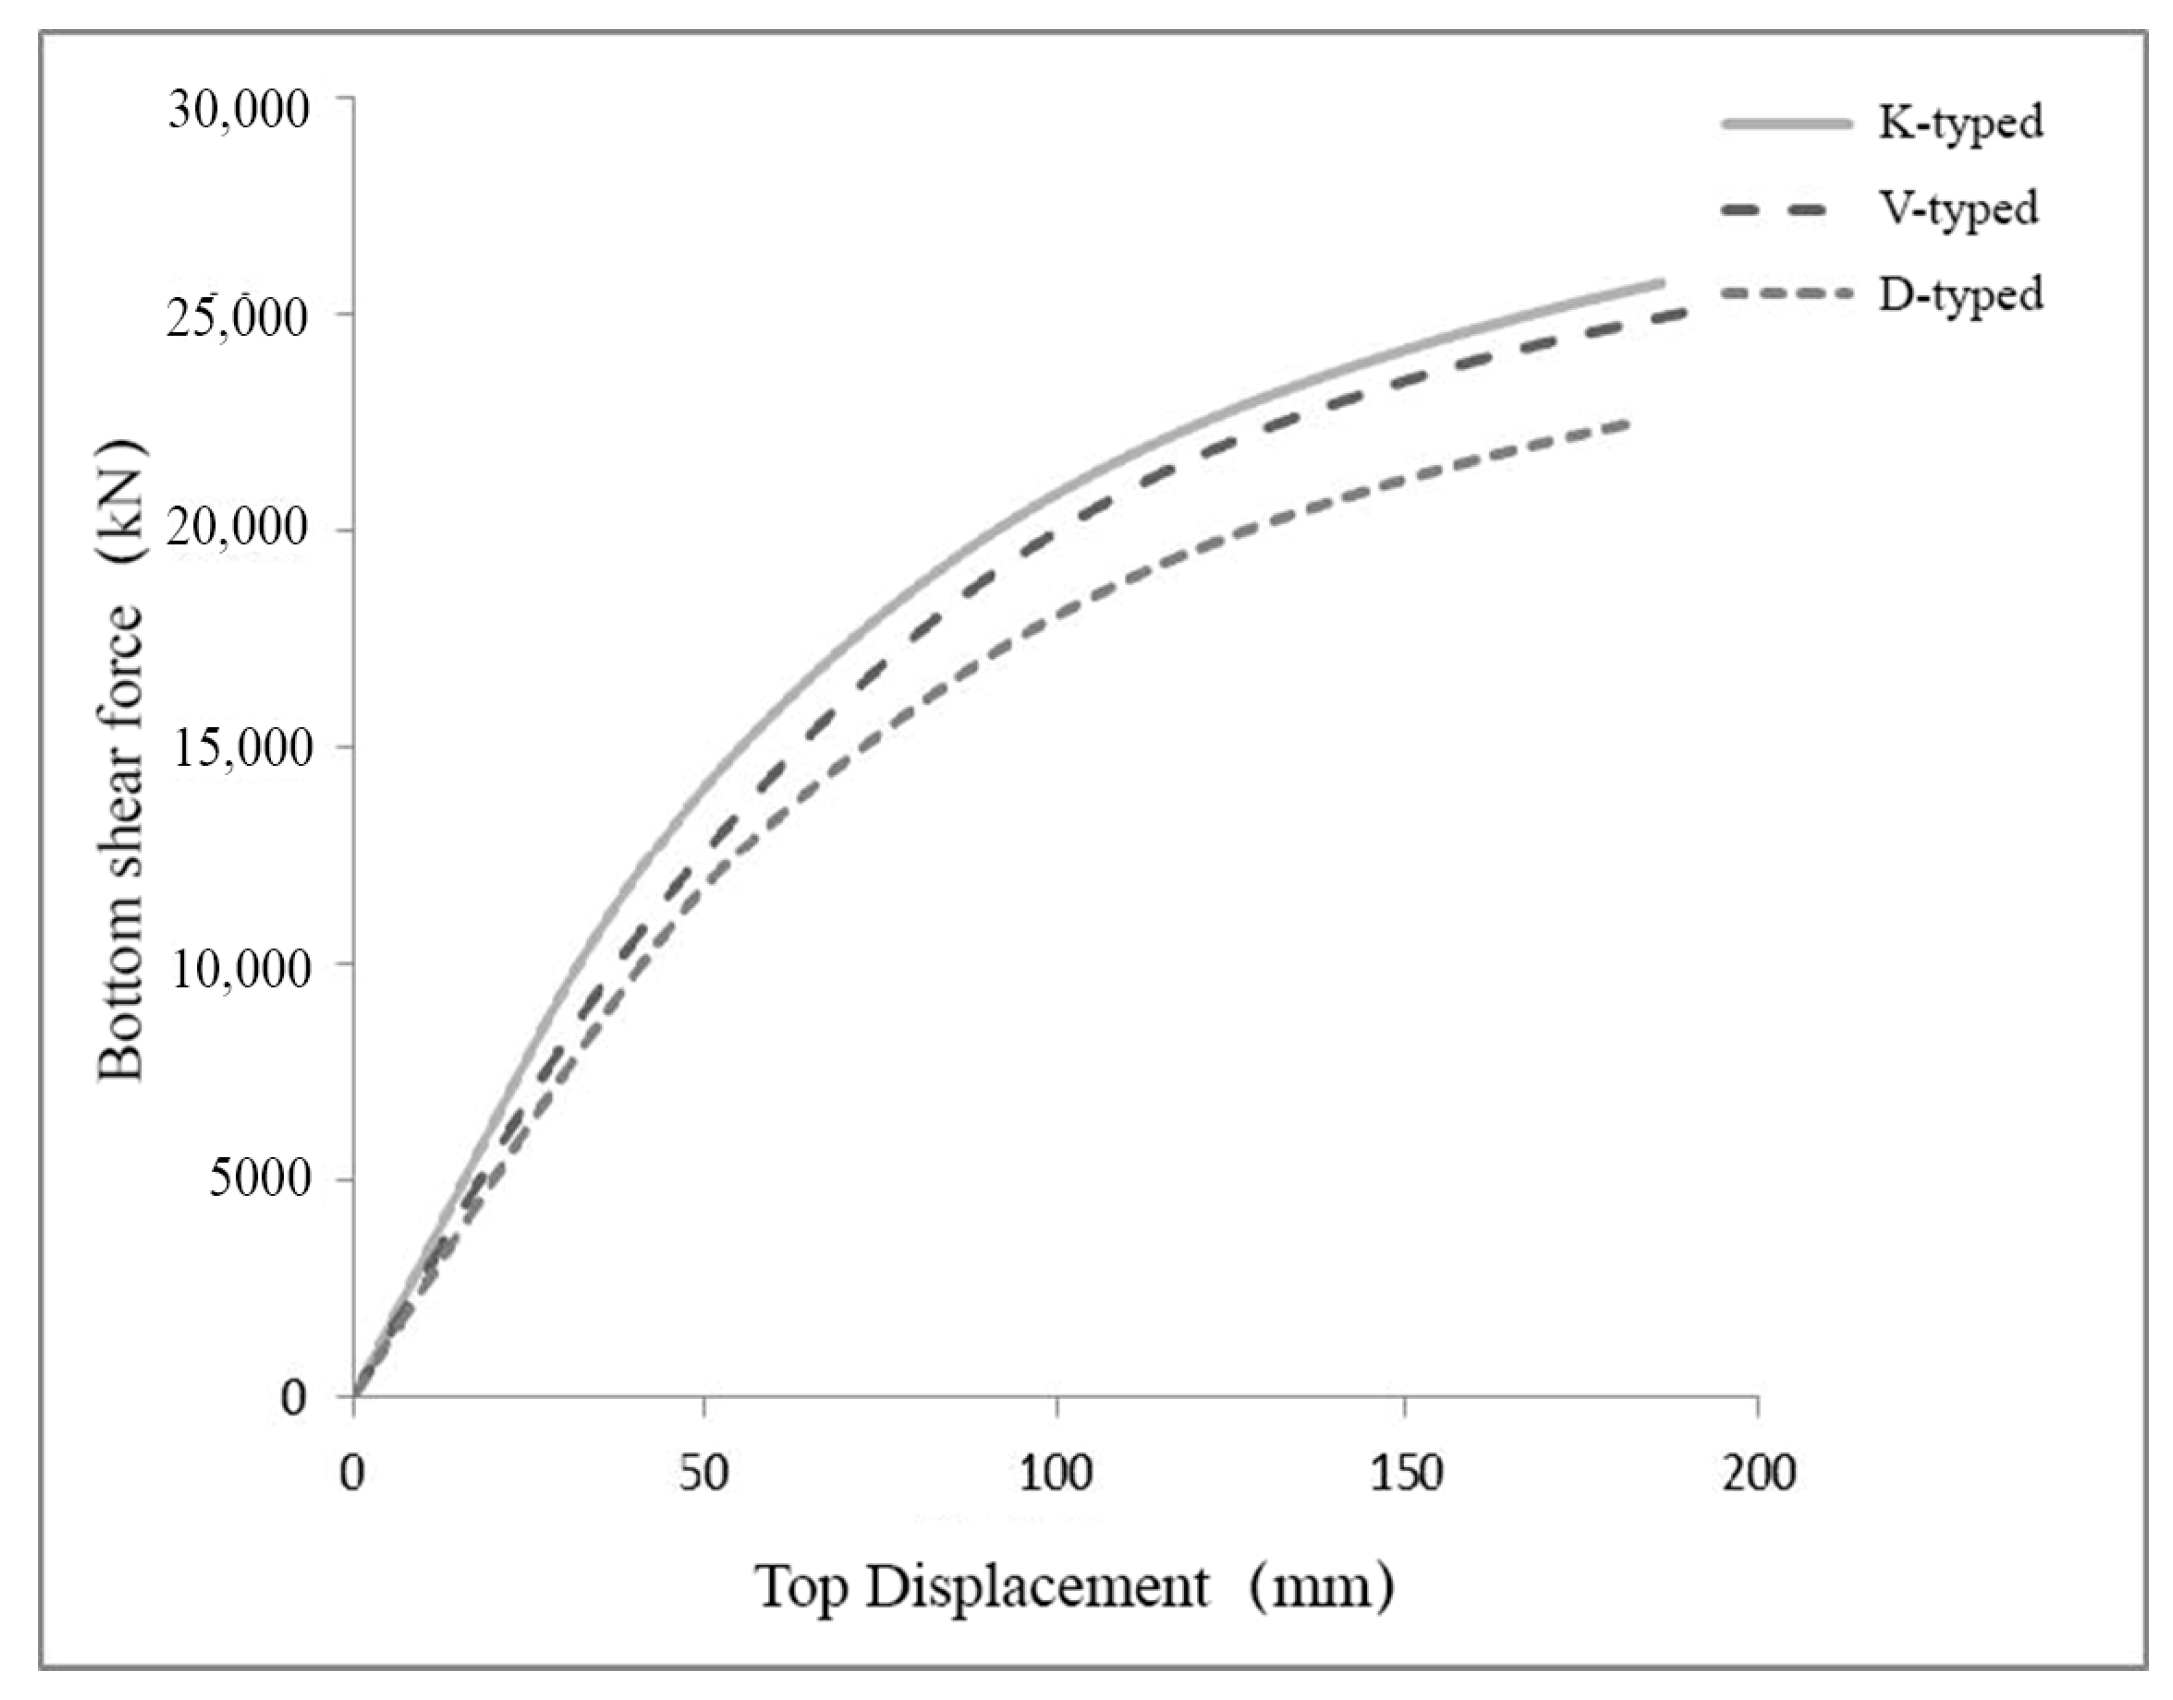
For the structural example, the horizontal load with an inverted triangle distribution is applied, and only the first vibration mode and the seismic action dominated by shear deformation are analyzed by pushover. The pushover capacity curve is shown in Figure 3, Figure 4 and Figure 5.
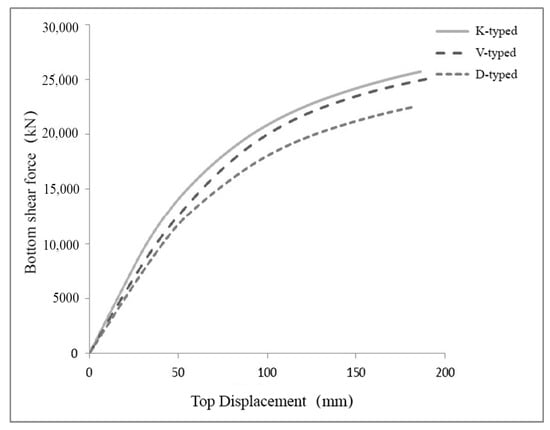
Figure 3.
3-story example pushover curve.
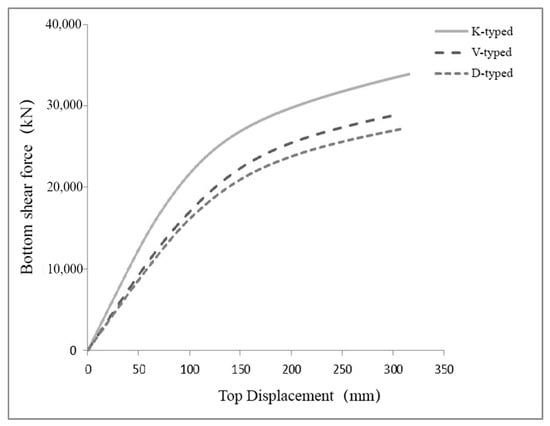
Figure 4.
5-story example pushover curve.

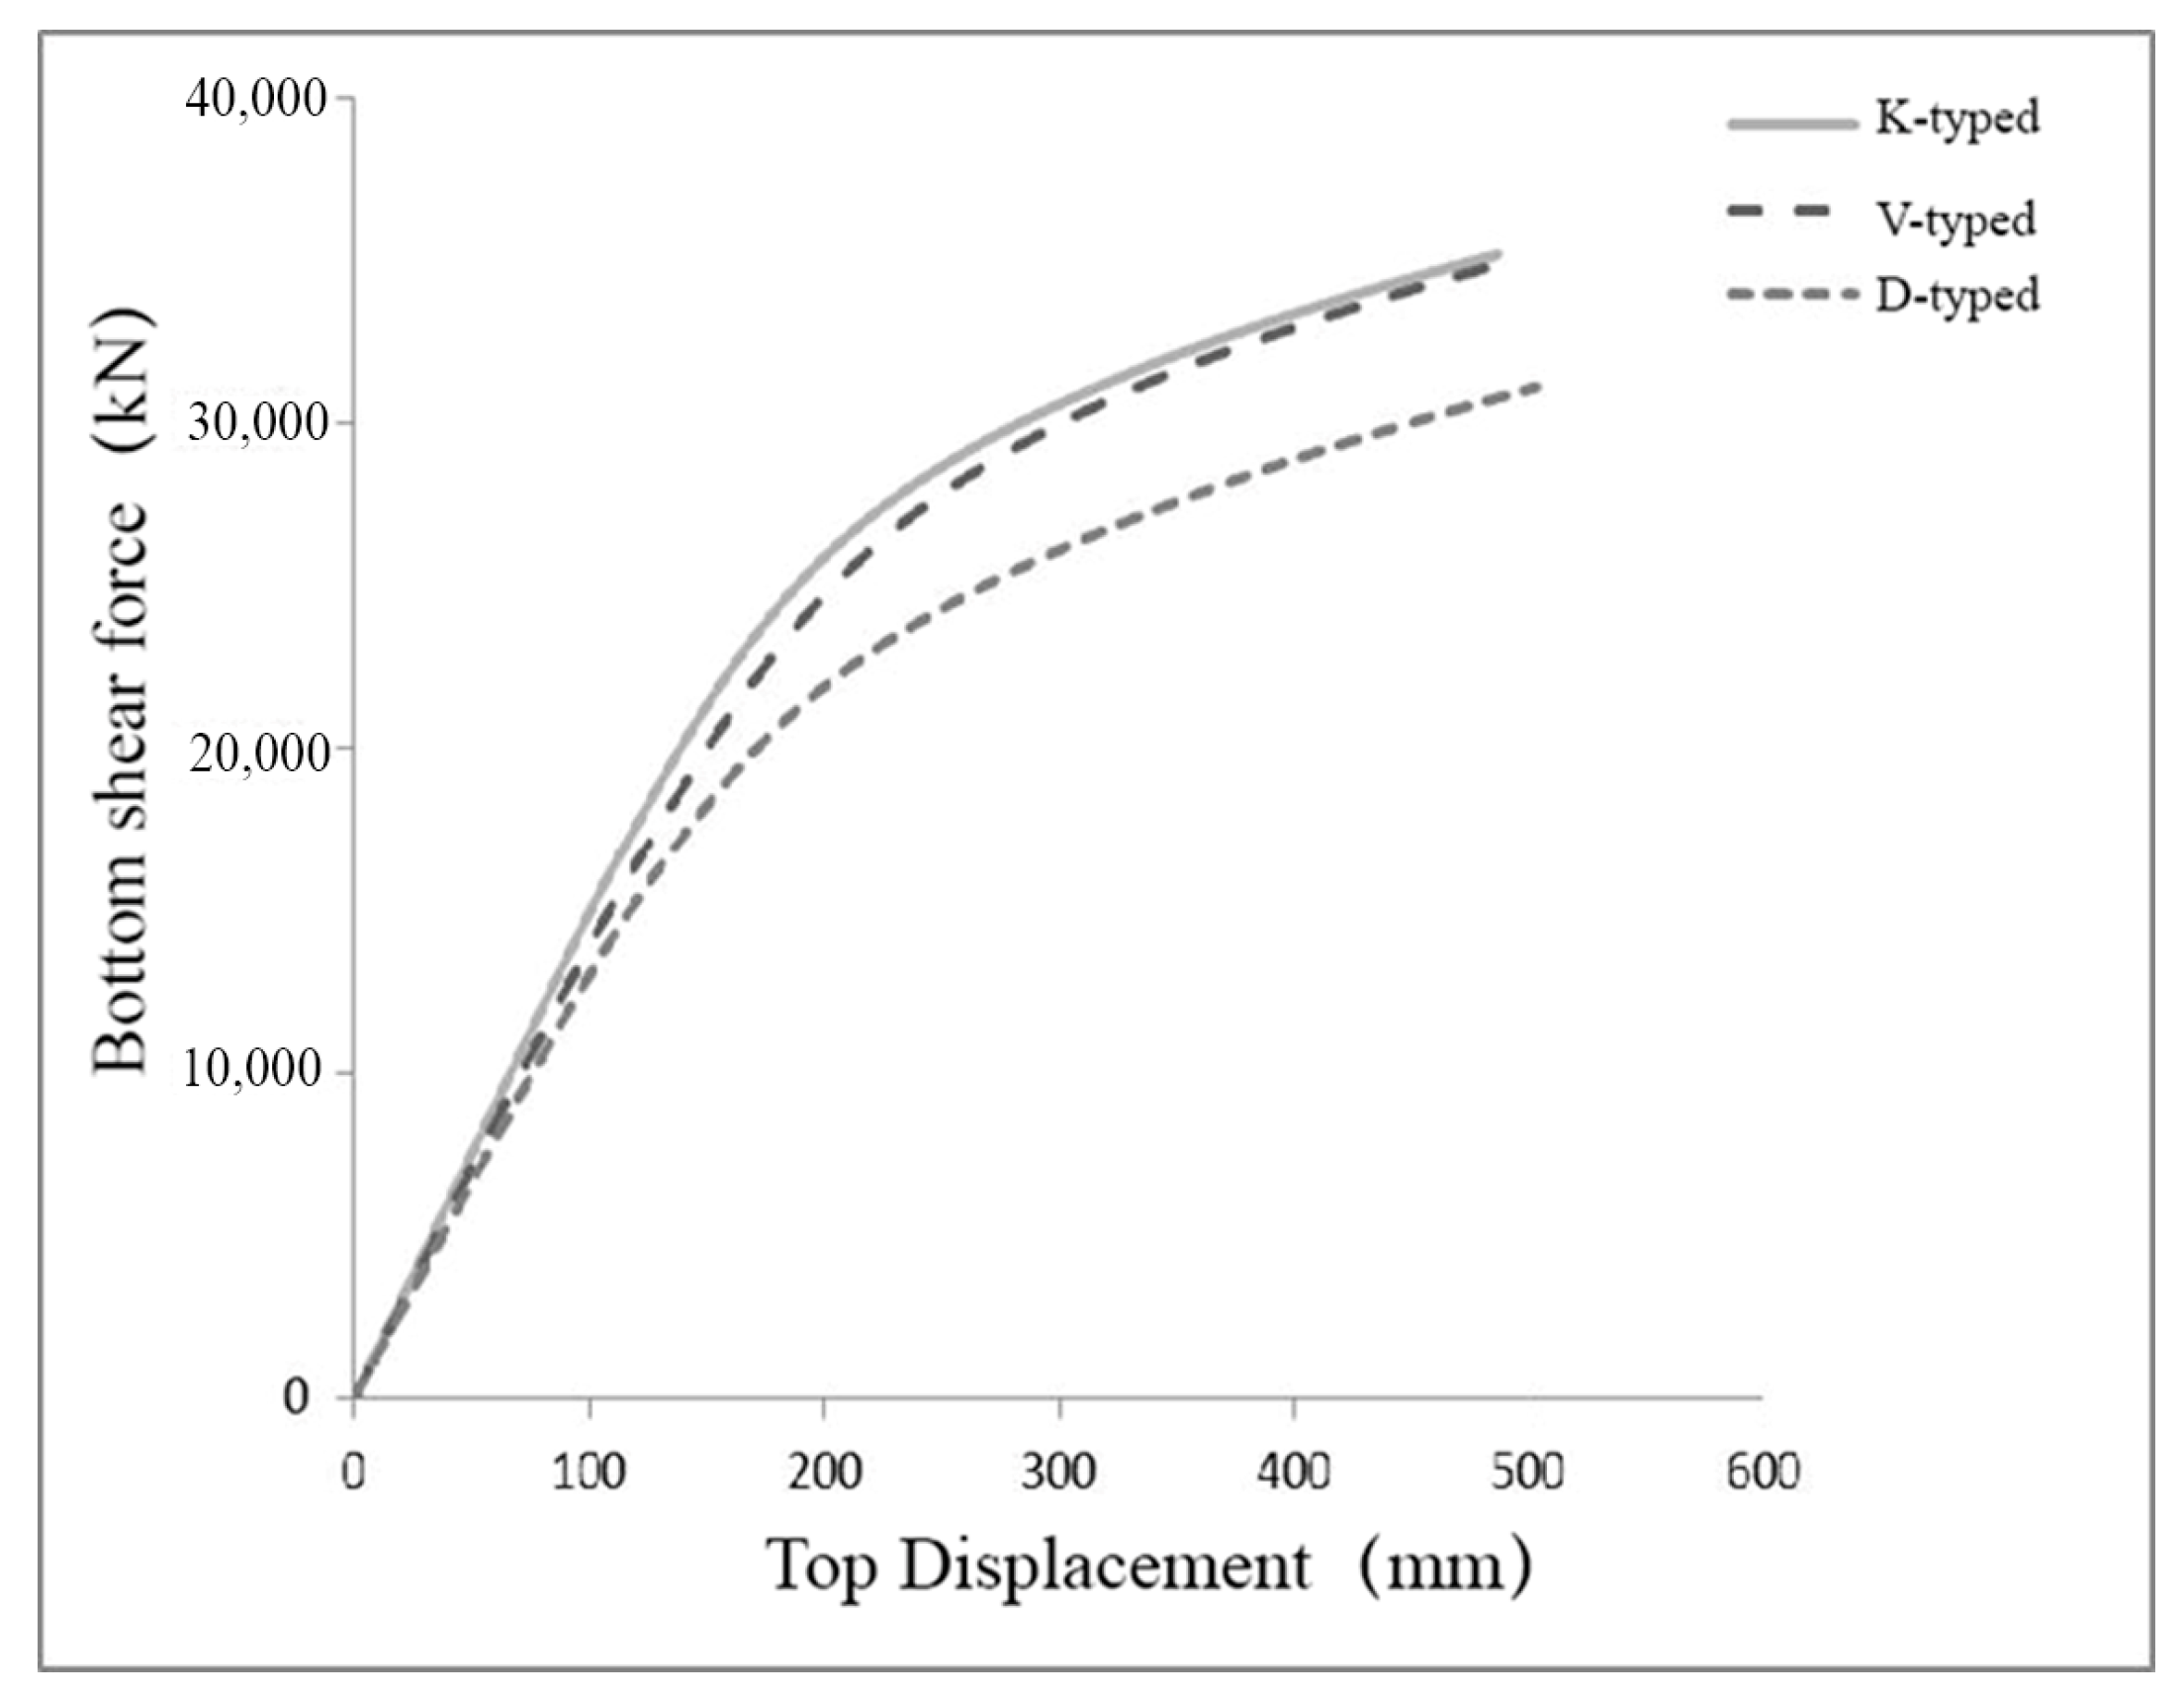
Figure 5.
8-story example pushover curve.
As can be seen from the pushover capacity curve, under the conditions of the same number of stories and component sections, the K-shaped eccentrically braced structure has the highest bearing capacity and stiffness. Followed by the V-shaped eccentrically braced structure, and with the increase in the number of floors, the difference becomes greater and greater. For the eccentrically braced structures of the same form, the bearing capacity and stiffness of the structure decrease with the increase in the number of floors. The trend of elastic–plastic development of each structure is basically the same. In the initial elastic phase, the bottom shear force and the top drift have a linear relationship. Subsequently, each structure goes into the elastoplastic stage, and the shear growth at the bottom slows down. Meanwhile, the top drift develops rapidly and eventually the structure reaches failure.
3.2. Structural Deformation Results
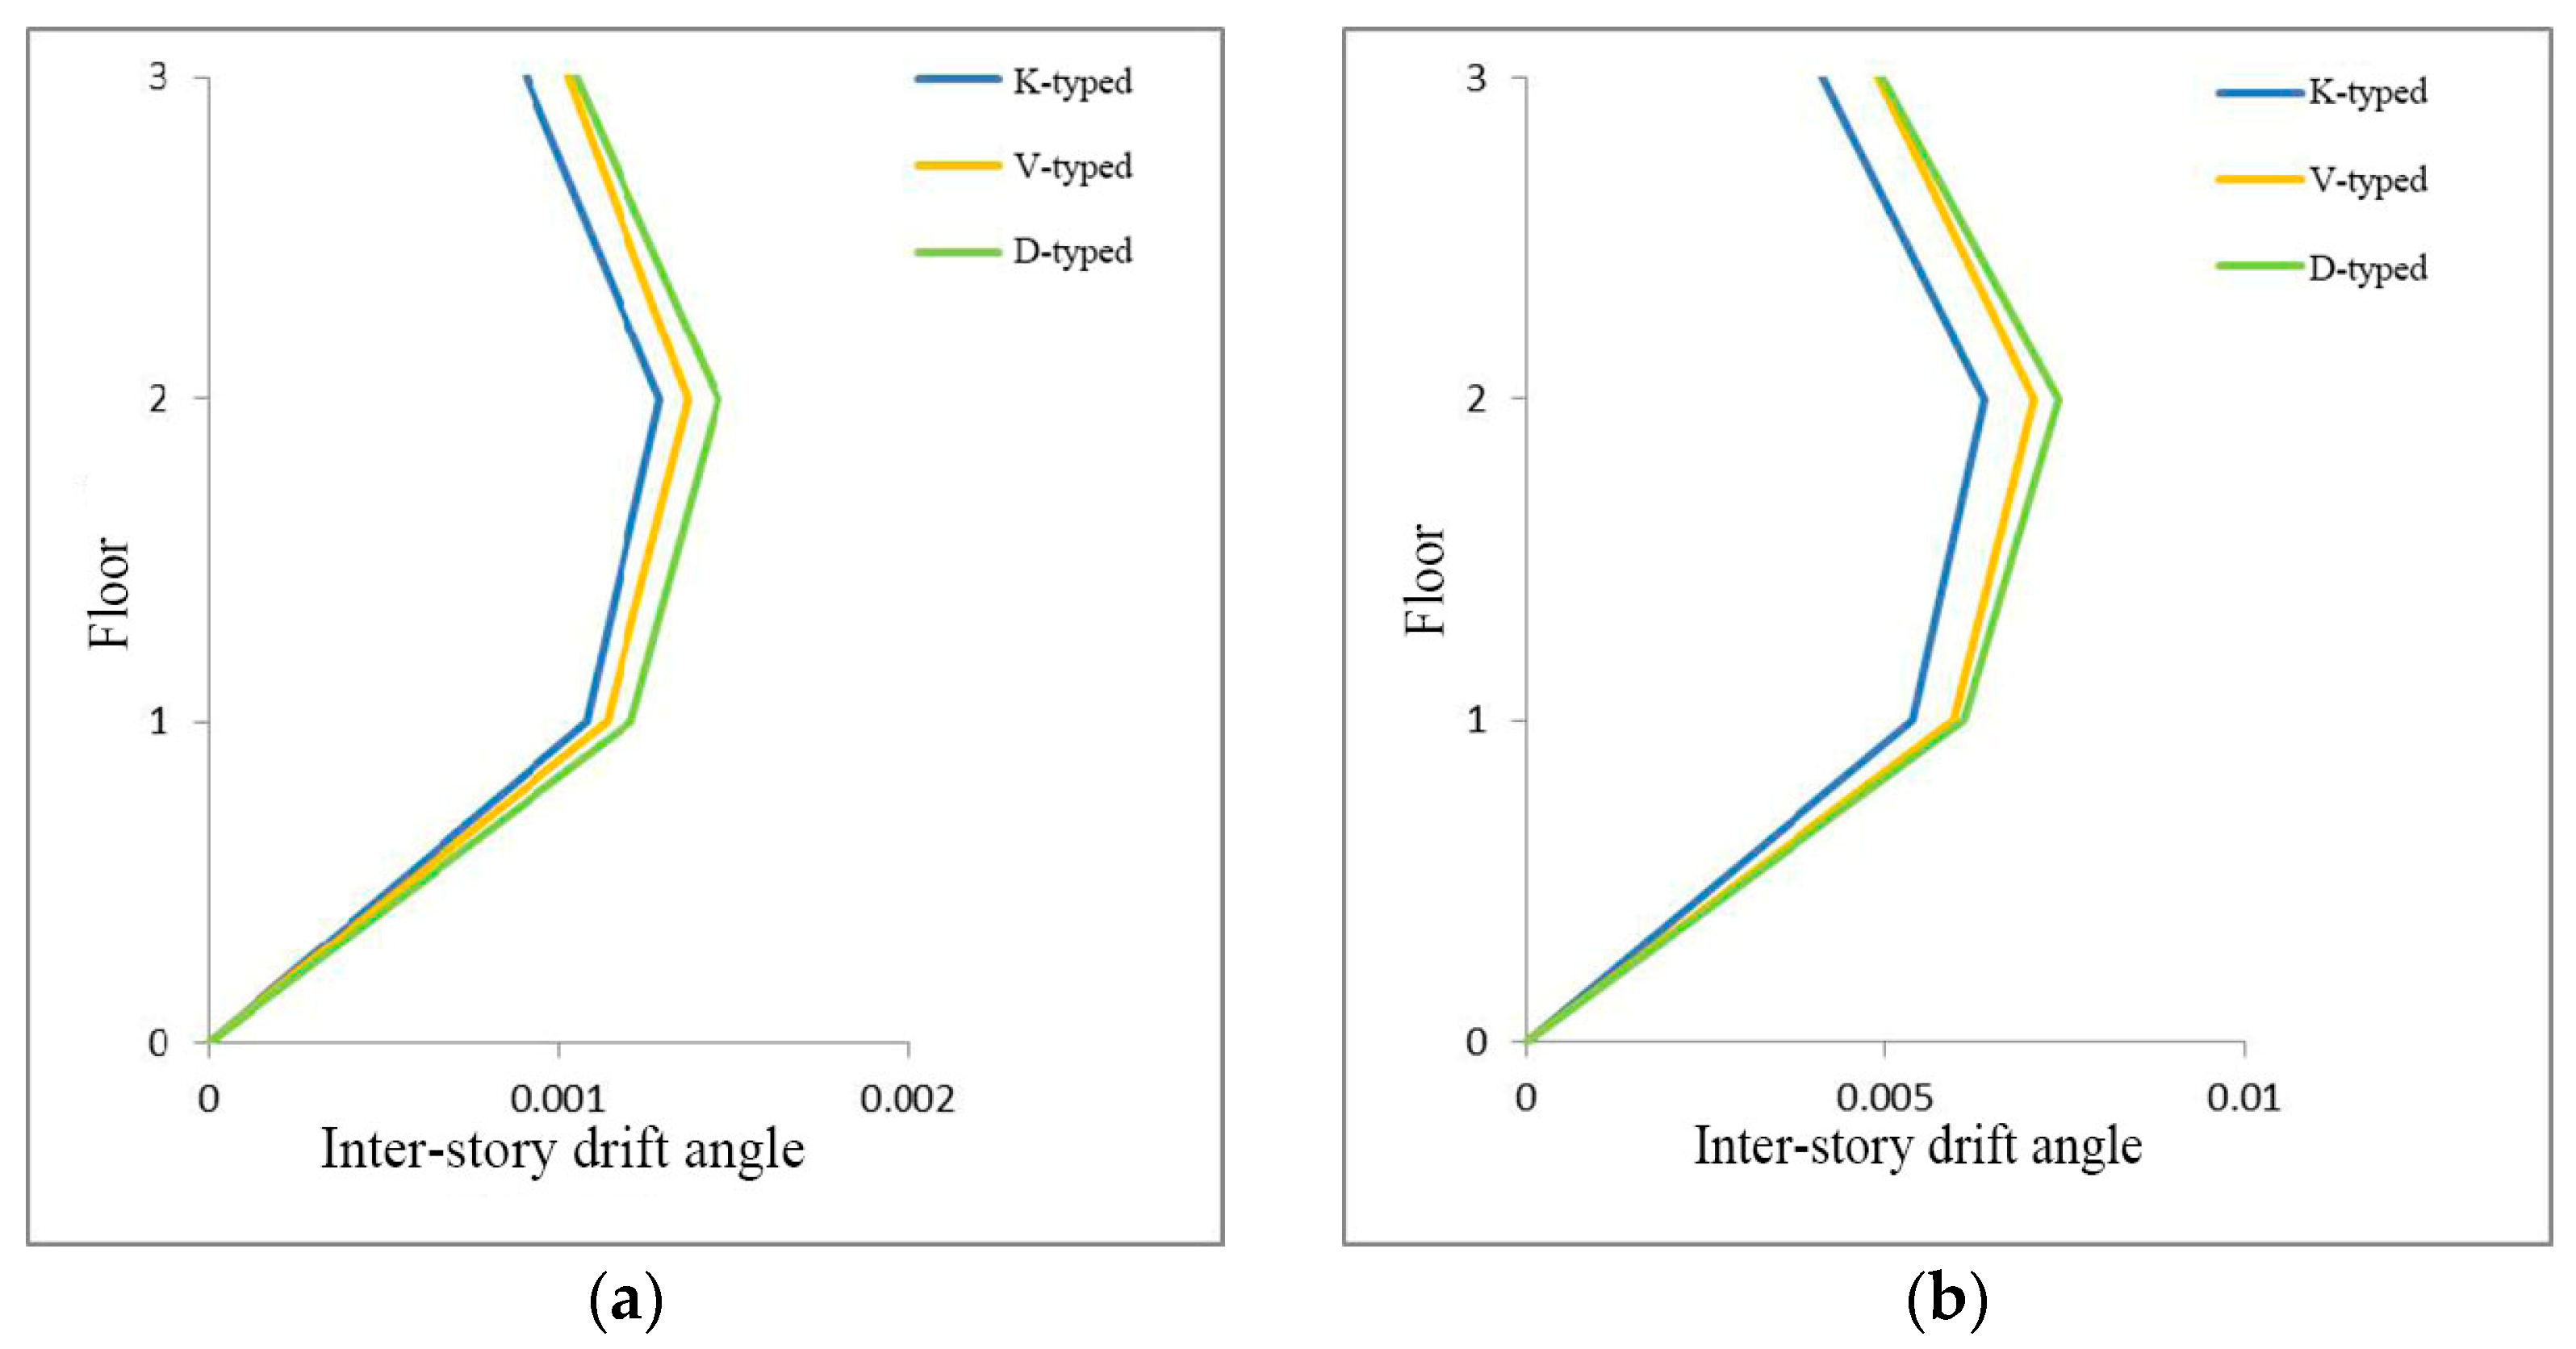
On the pushover capacity curve, we can obtain the corresponding performance points under small earthquakes and large earthquakes. Through the performance points and the deformation of different structures under different seismic strengths, we can judge whether the deformation of a structure under a particular seismic strength conforms to the provisions of the specifications. The inter-story drift angles of different structures under minor and major earthquakes are depicted in Figure 6, Figure 7 and Figure 8.
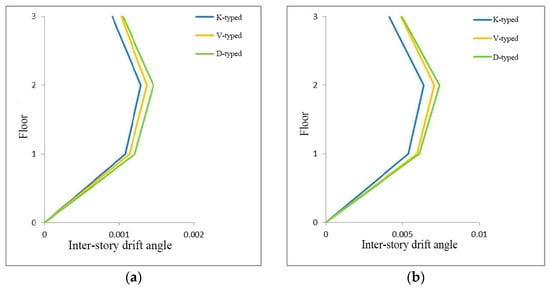
Figure 6.
Inter-story drift angle analysis of 3-story examples. (a) Minor earthquake; (b) Major earthquake.
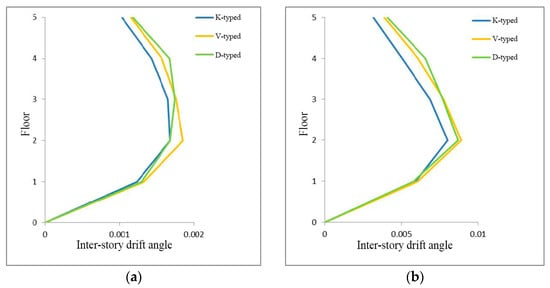
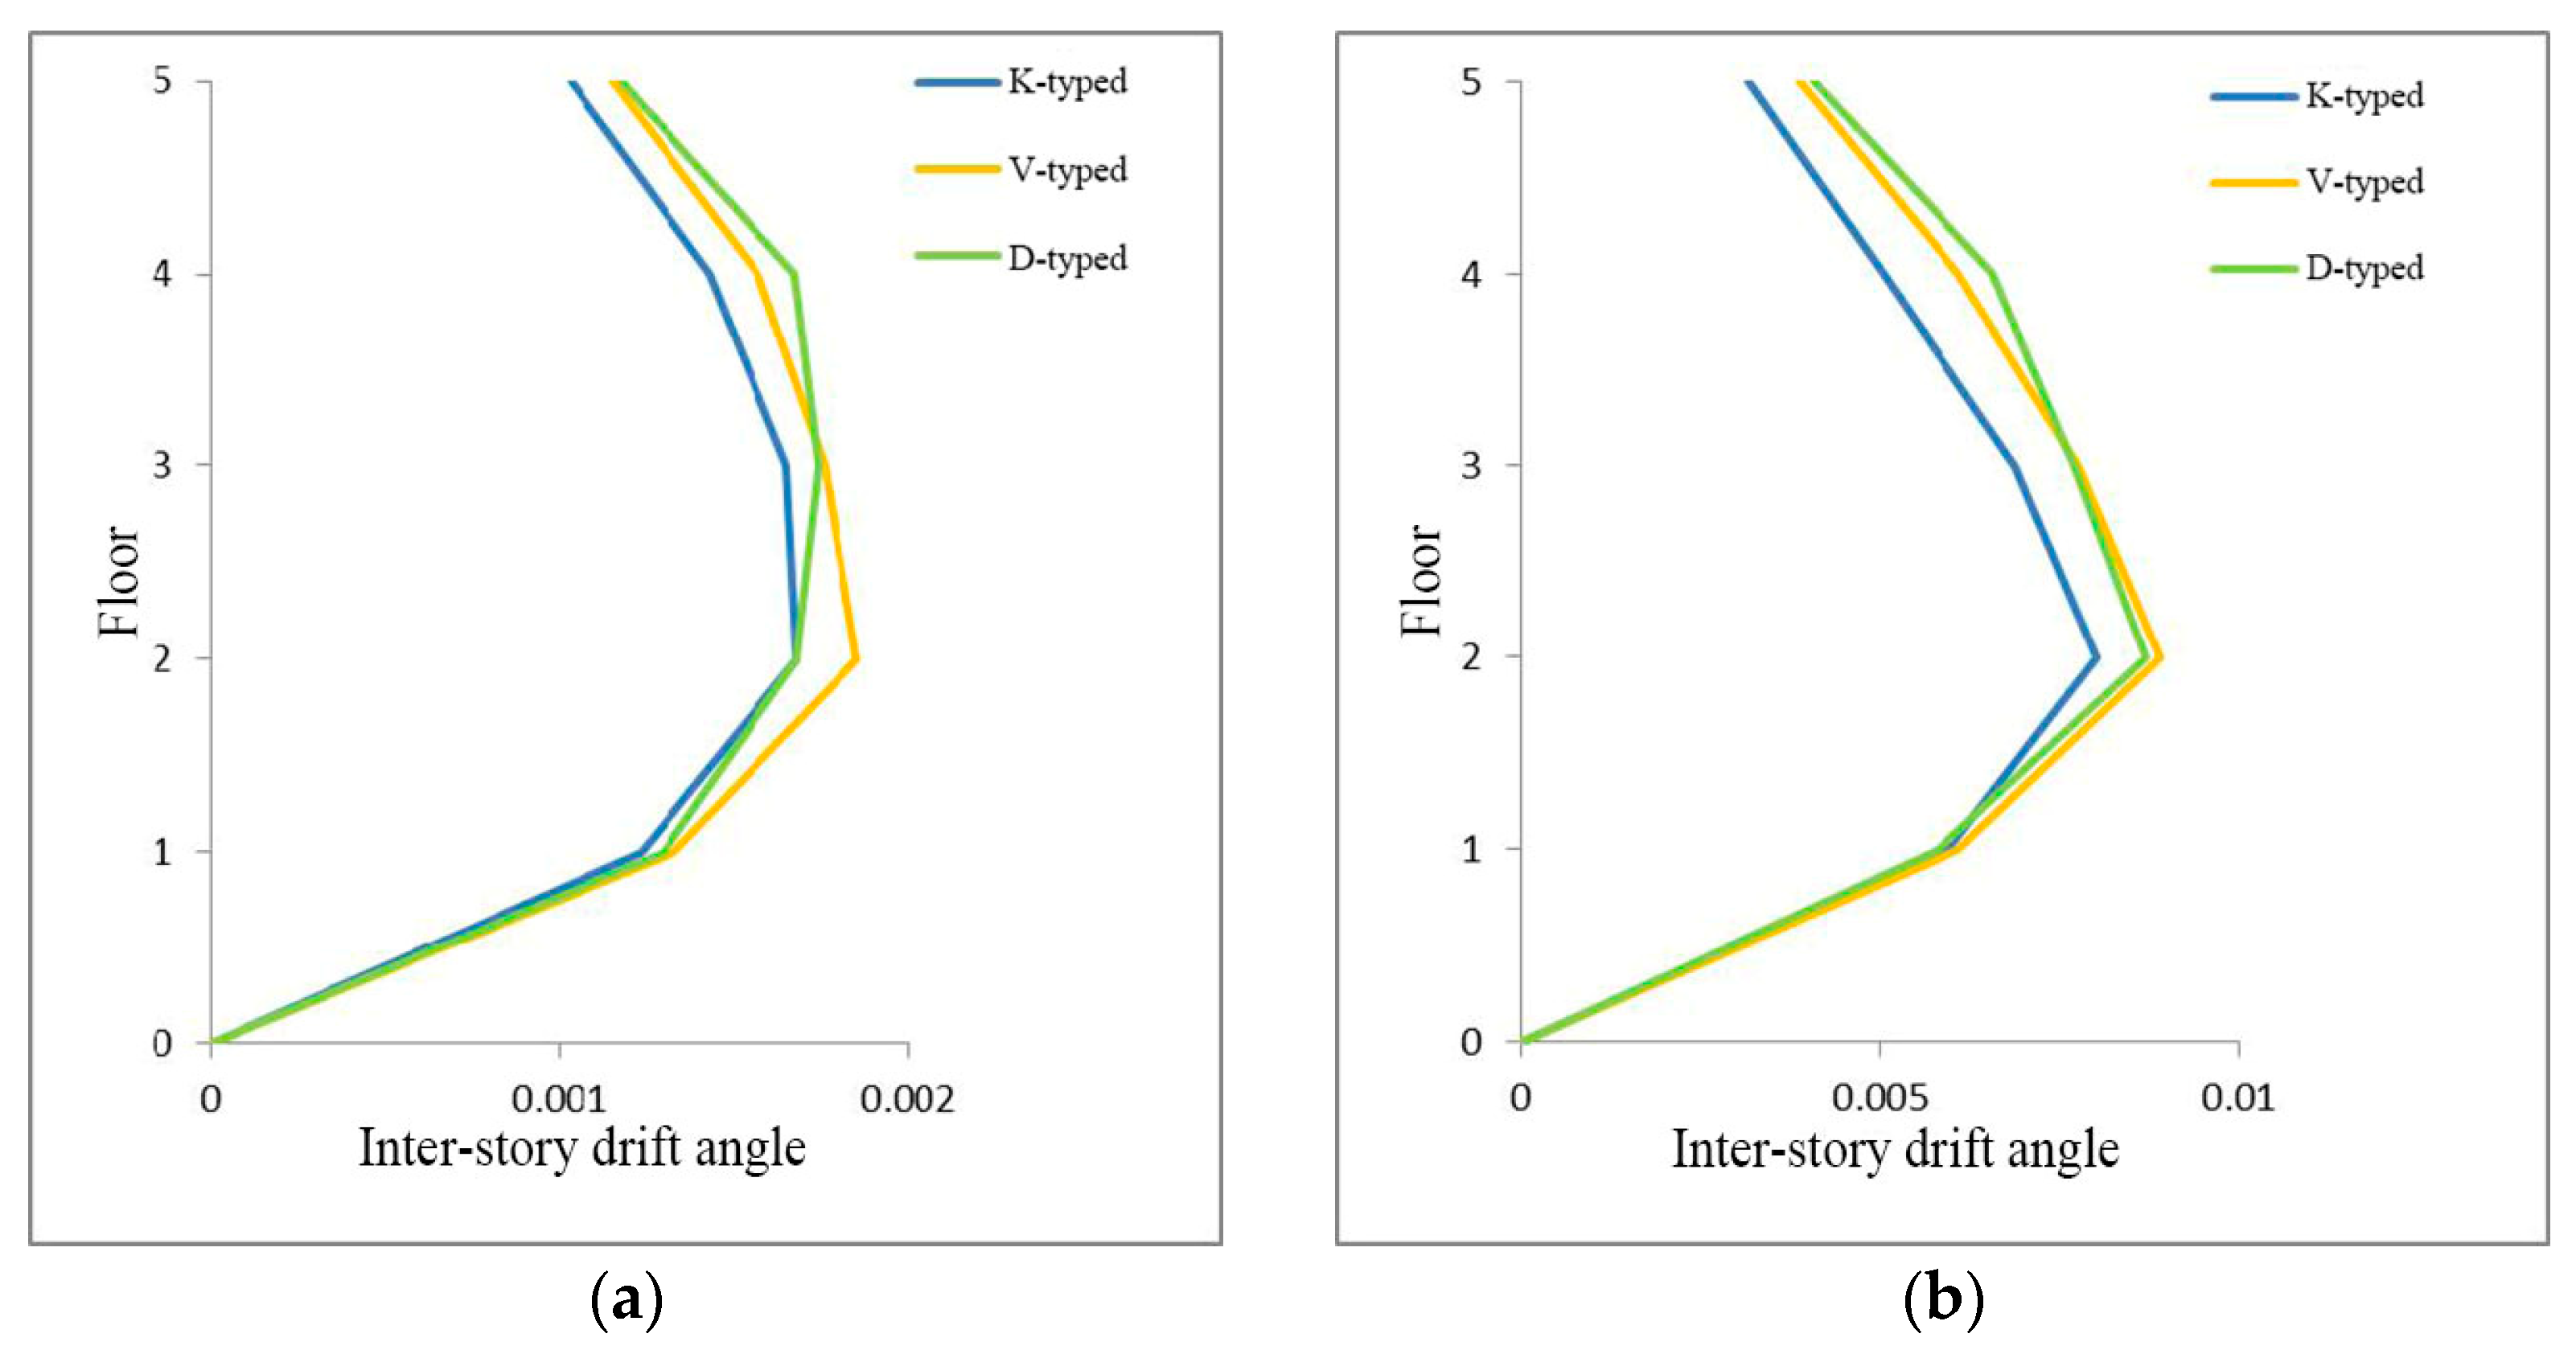
Figure 7.
Inter-story drift angle analysis of 5-story examples. (a) Minor earthquake; (b) Major earthquake.
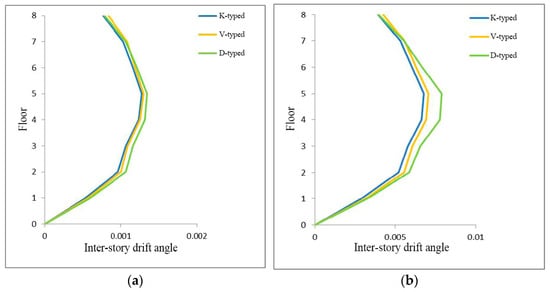
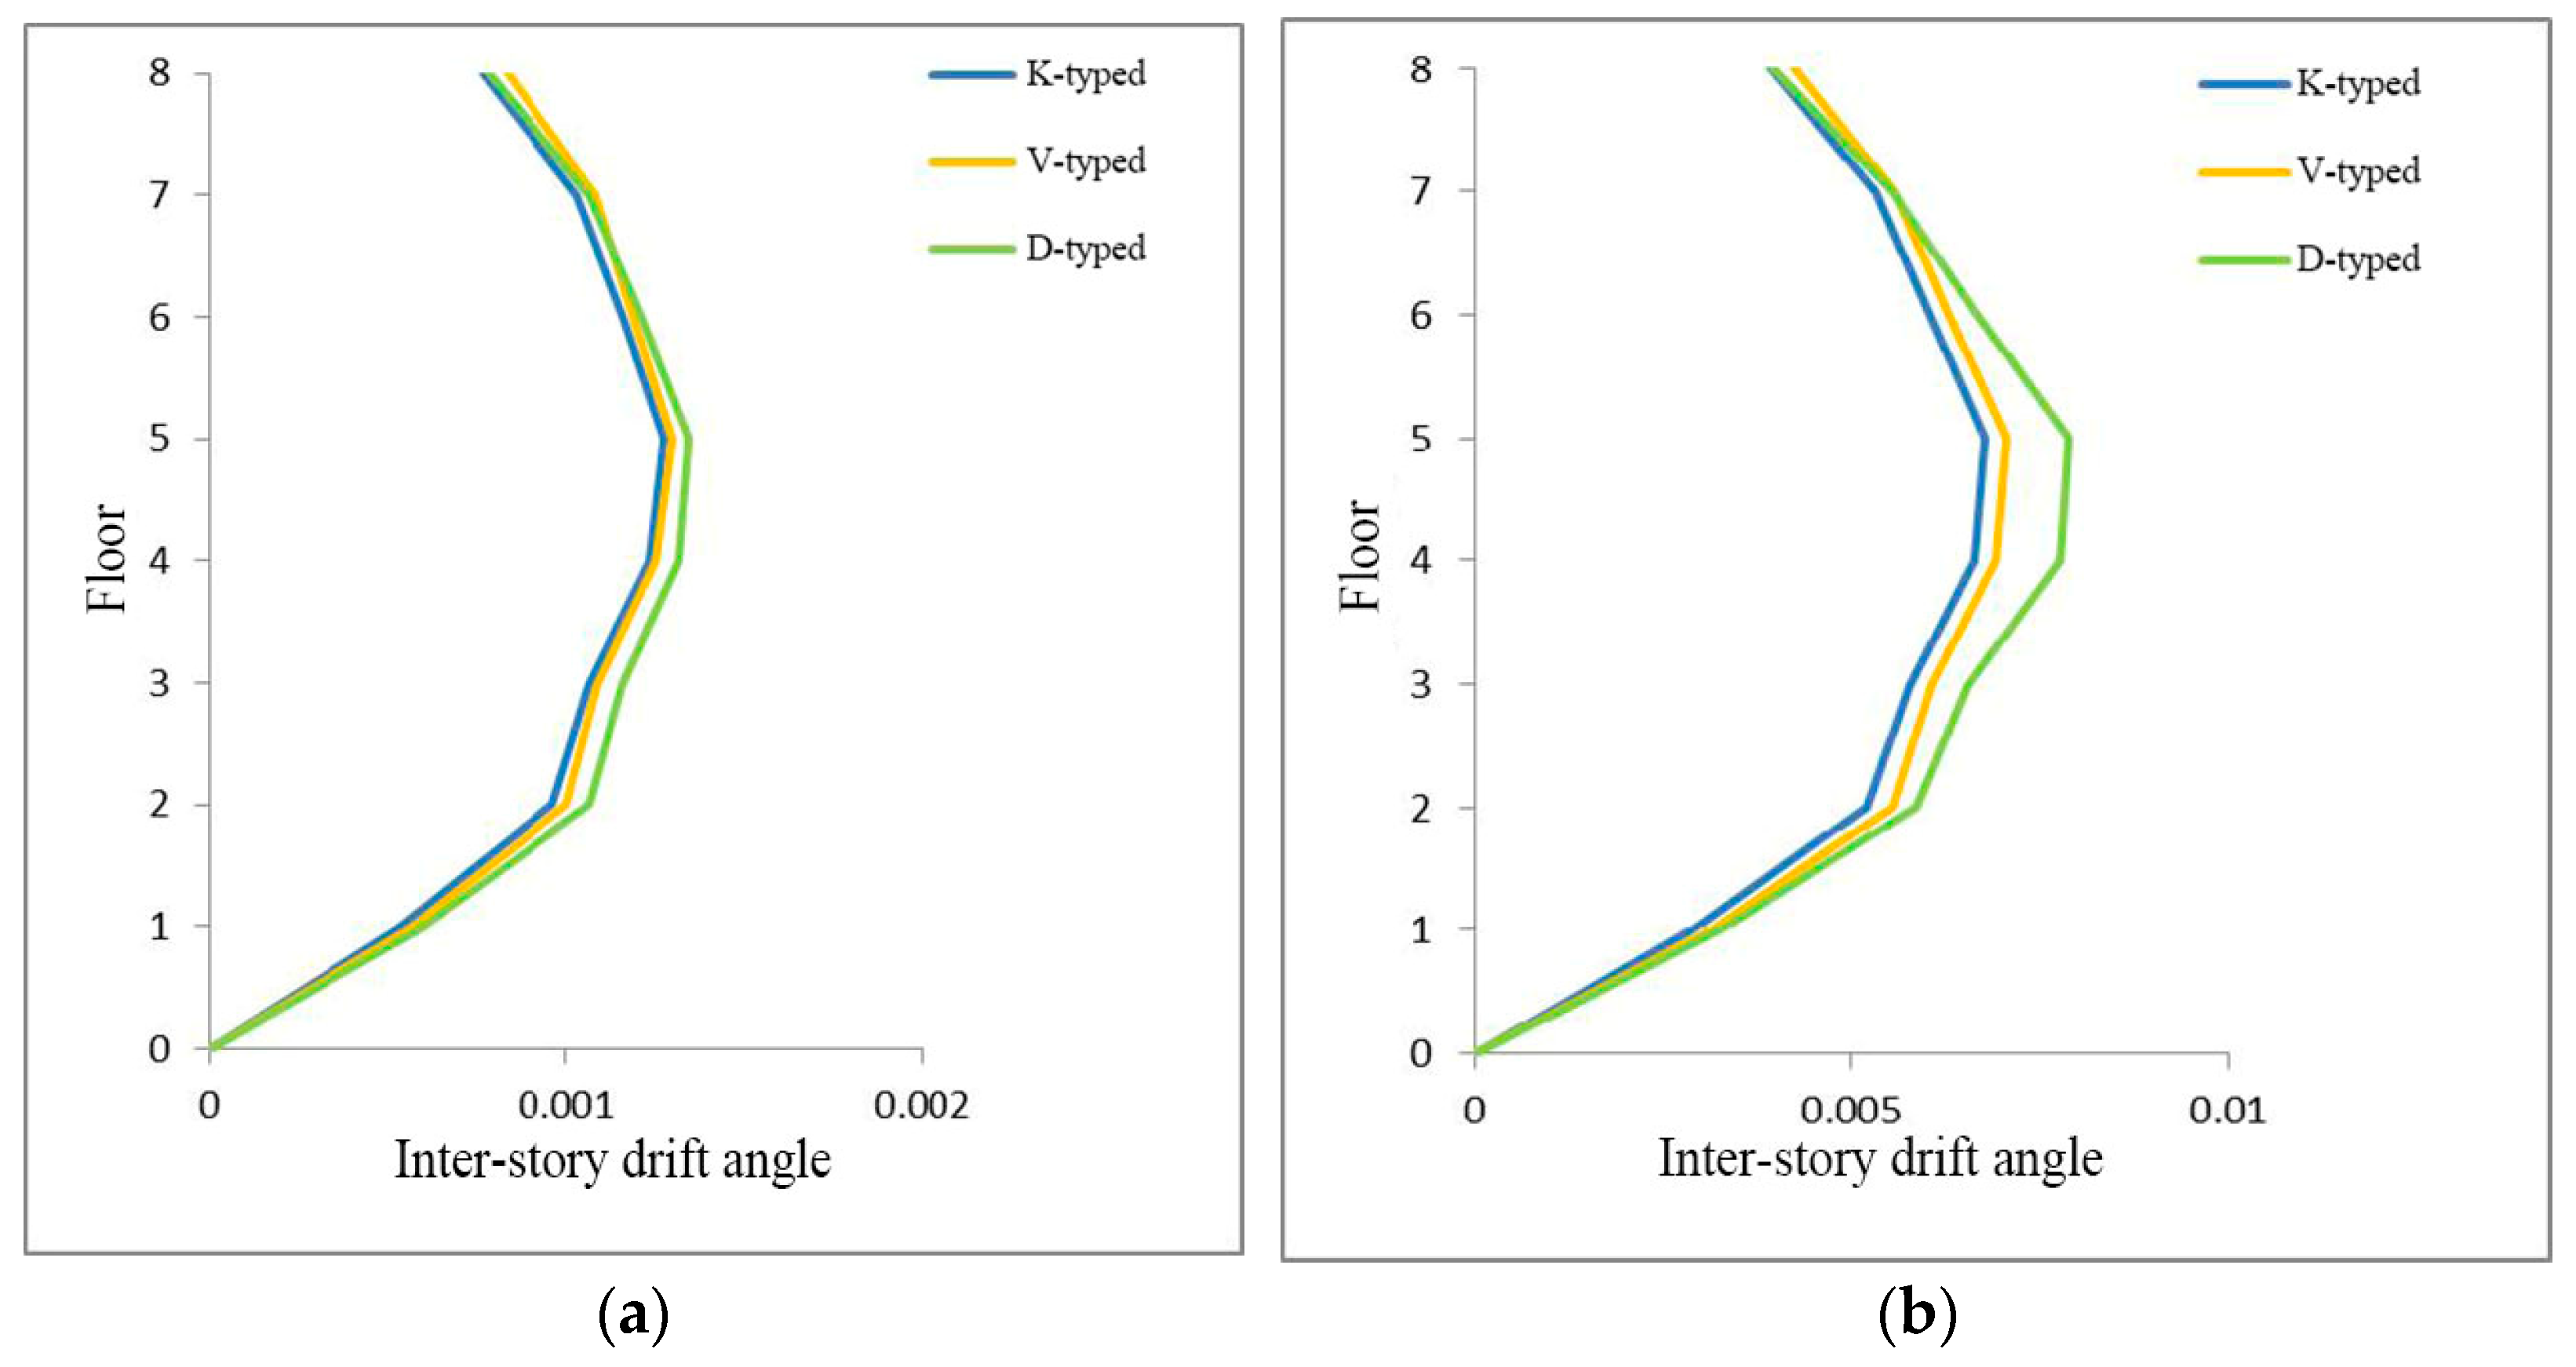
Figure 8.
Inter-story drift angle analysis of 8-story examples. (a) Minor earthquake; (b) Major earthquake.
In China, the limit of the inter-story drift angles of a steel structure under minor earthquakes is 1/250, and under major earthquakes is 1/50. As can be seen from the figure, the maximum inter-story drift angle of each structure under minor and major earthquakes meets the provisions of the Chinese resistance regulations and is far less than the specified limit requirements. Therefore, it can be proved that different forms of eccentrically braced structures have good seismic performance. Secondly, it can be seen that the largest inter-story drift angles of the K-shaped eccentrically braced structure are relatively small. This is also the reason why the pushover capacity curve of the K-shaped eccentric support structure is always located in the outermost story of the capacity curve of the three structural forms. At the same time, through the comparison of the results of the inter-story drift angle analysis, it can be clearly seen that the minimum inter-story drift angles of each structure appear in the bottom story of the structure. This shows that the bottom frame column of the structure has sufficient lateral stiffness, which can effectively prevent the appearance of a weak story at the bottom of the structure. The eccentric support structure can meet the expected goal of structural seismic design, has good seismic performance, and can be applied to engineering practice.
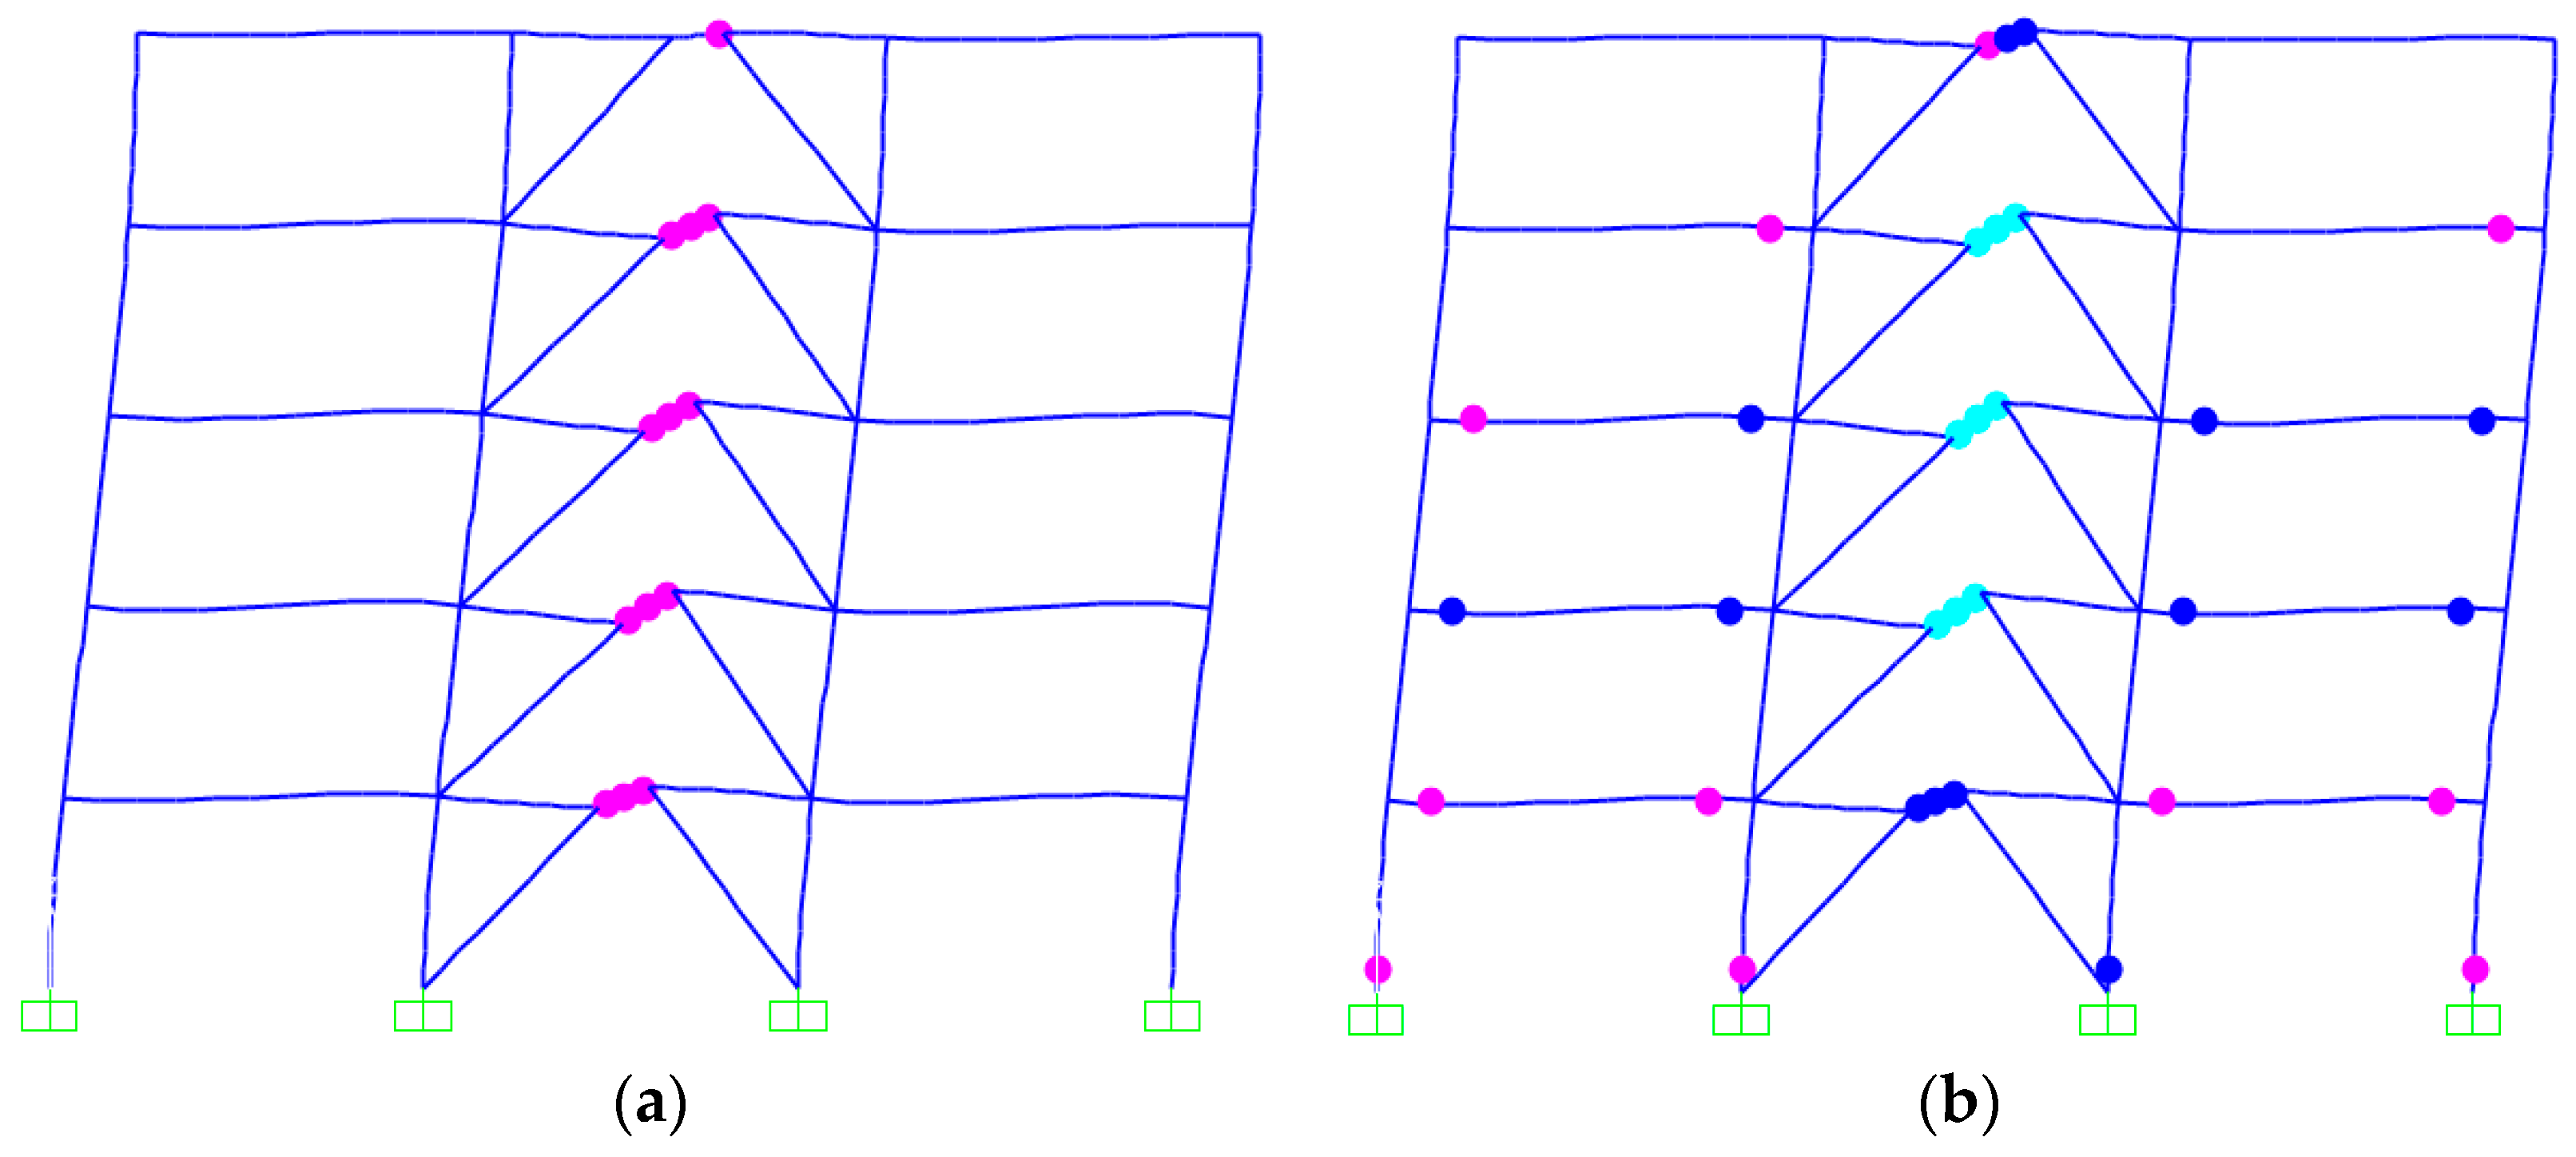
3.3. Development of Plastic Hinge under Pushover Analysis
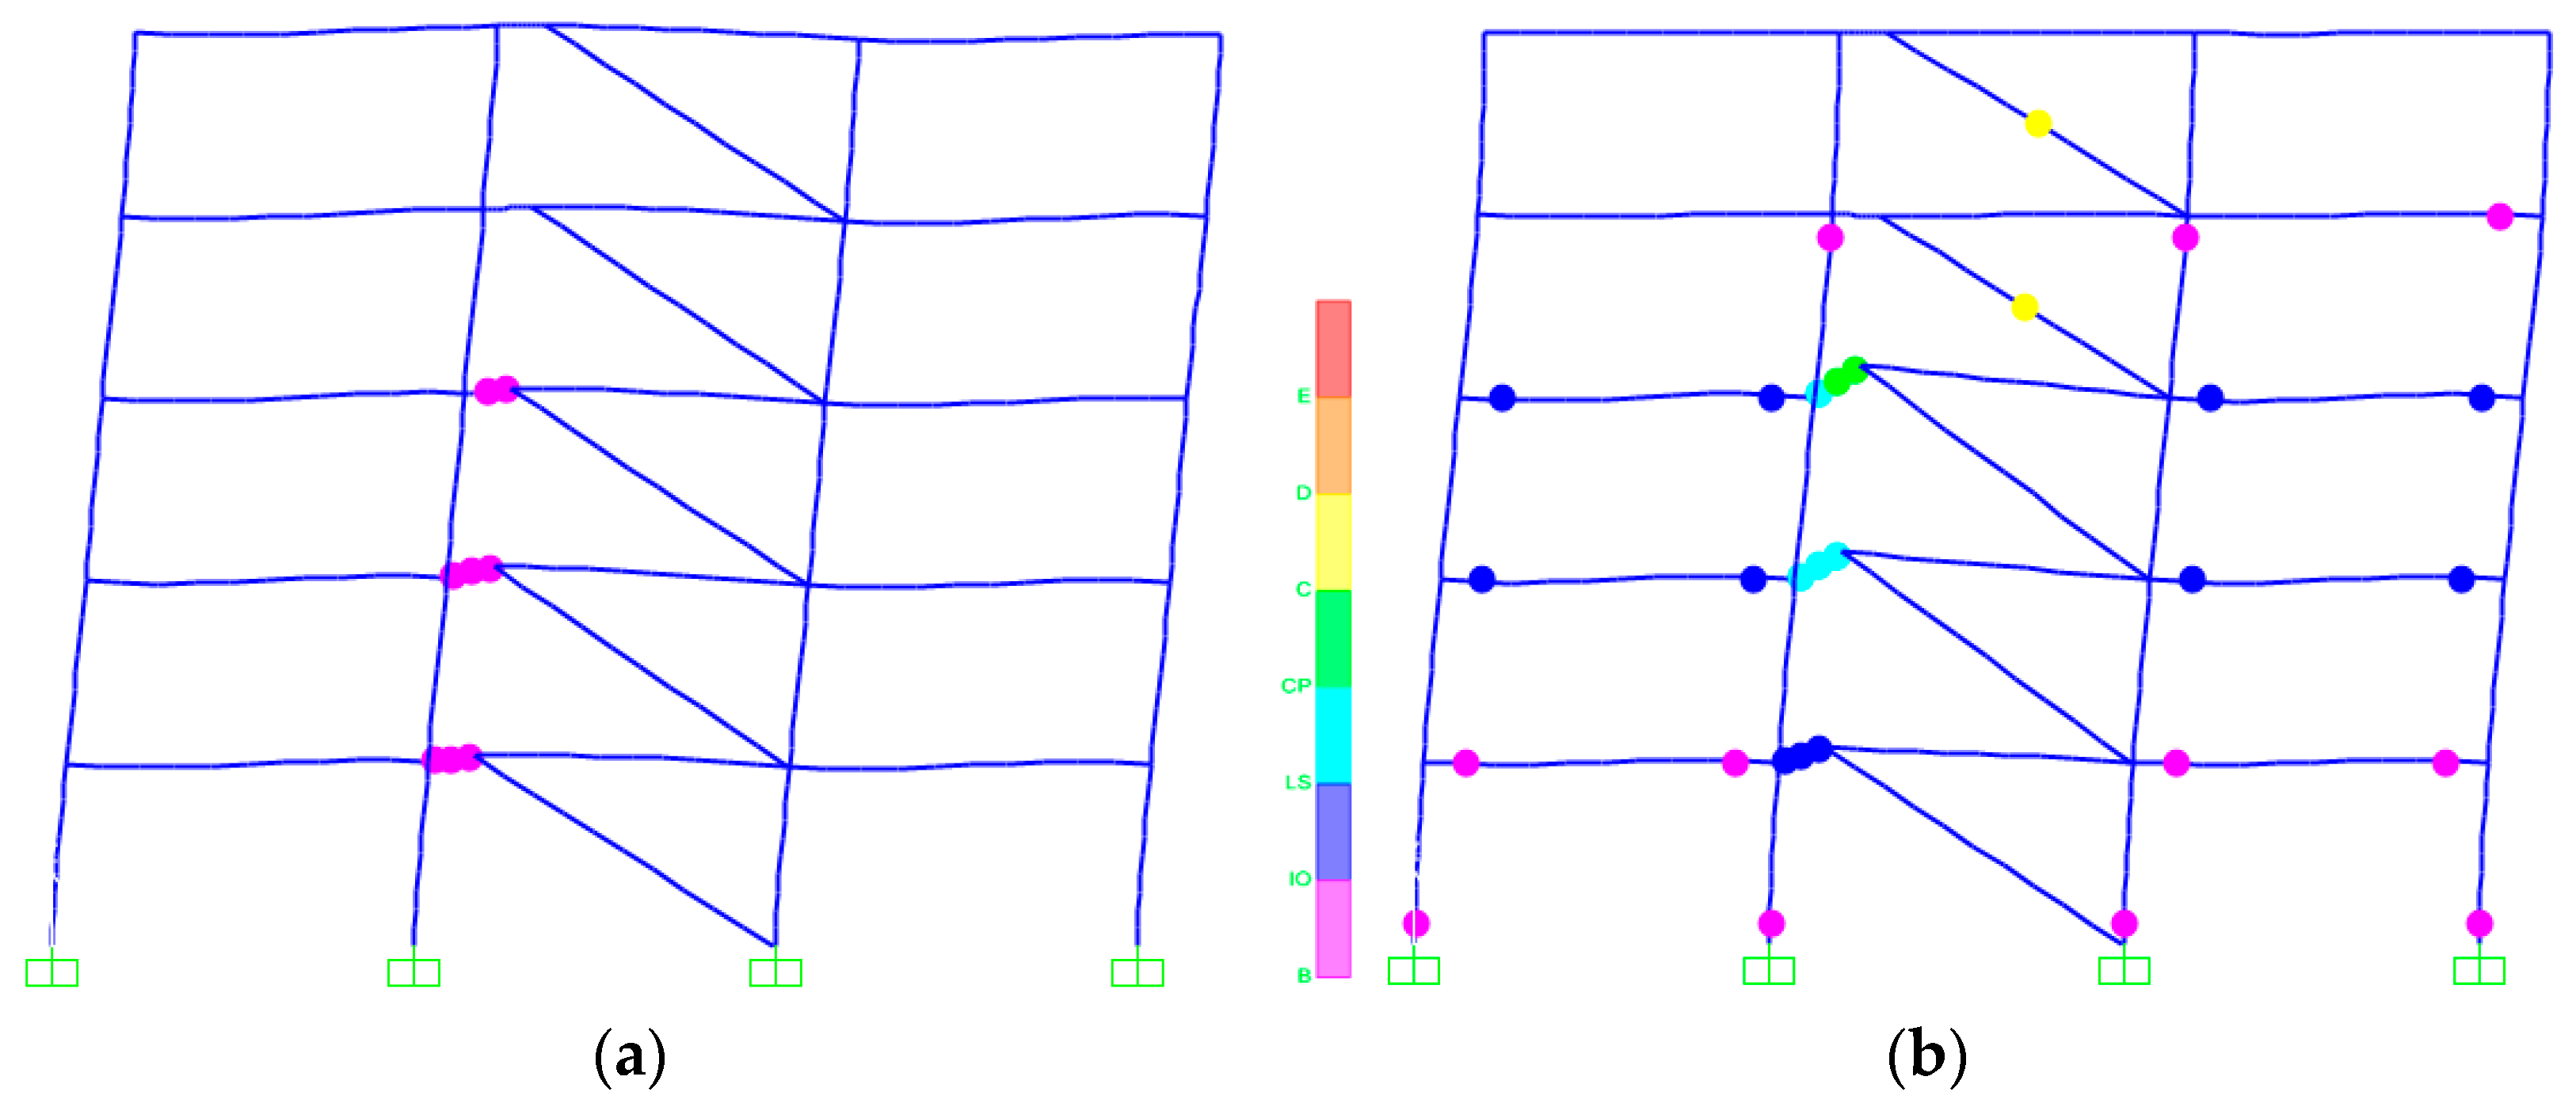
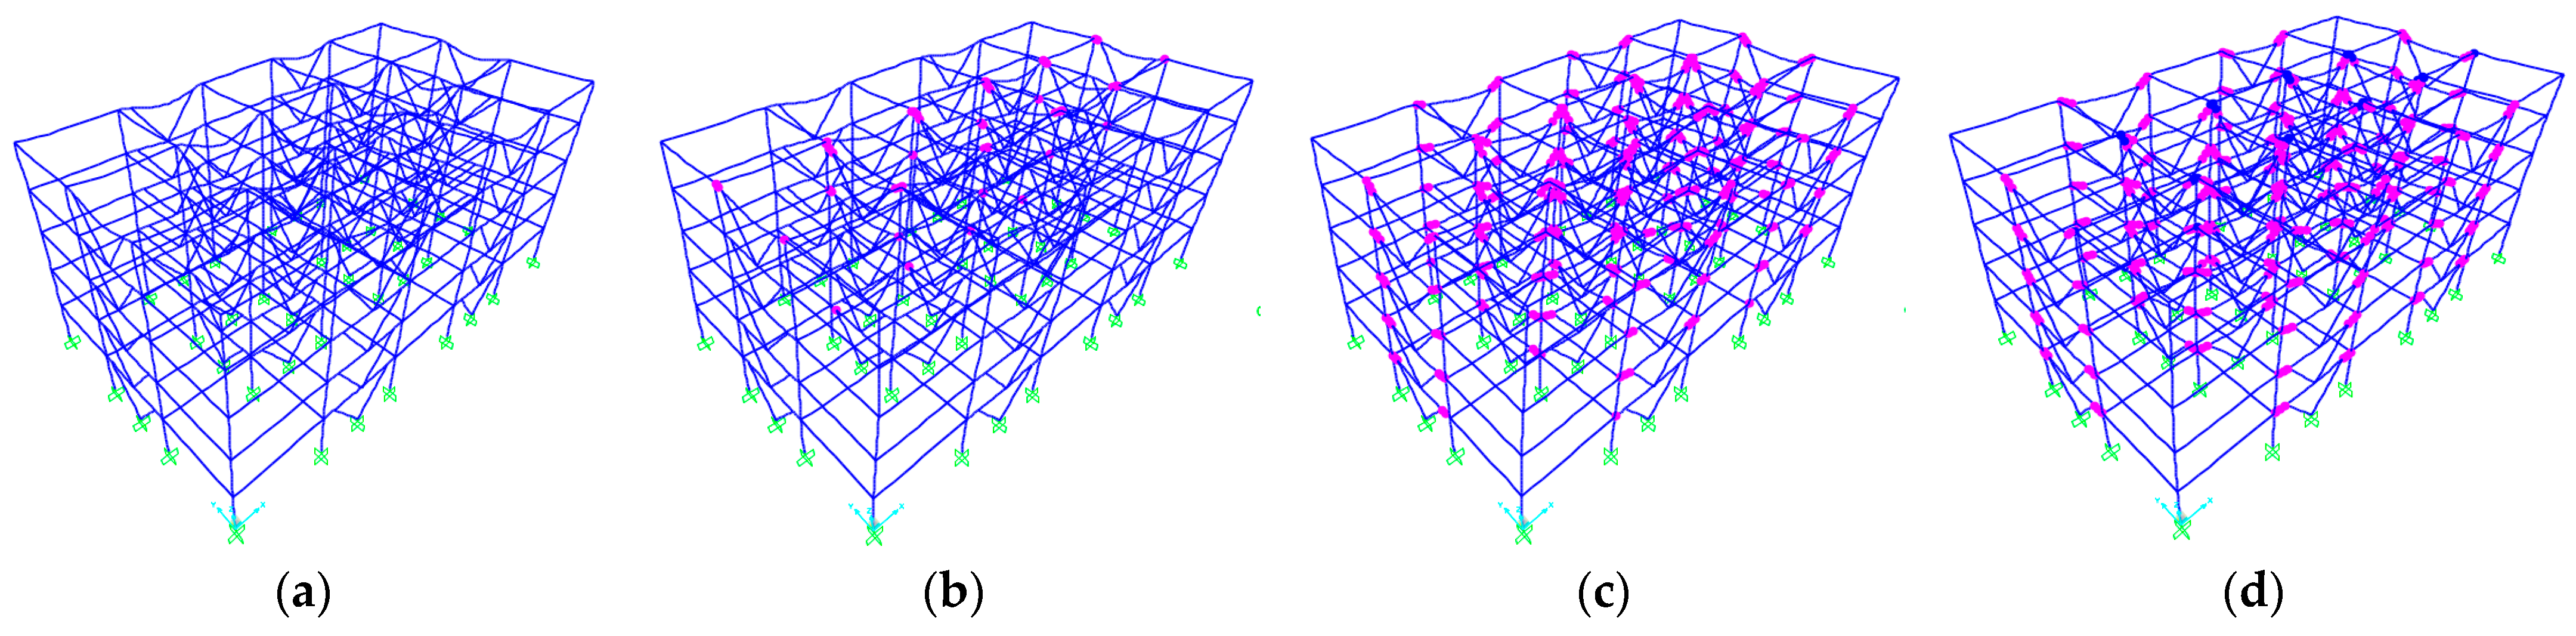
Under the action of minor earthquakes, the structures are still in the elastic state, and no plastic hinges appear. When pushing to the major earthquake and limit state, taking the eight-story structure model as an example, the plastic hinge development of different structures is shown in Figure 9, Figure 10 and Figure 11. B (pink) indicates the yield of the plastic hinge, C (yellow) indicates that the plastic hinge begins to lose its bearing capacity, and between B and C, IO (blue), LS (light blue), and CP (green) indicate the performance states of the plastic hinge for immediate occupancy, life safety, and collapse prevention, respectively.
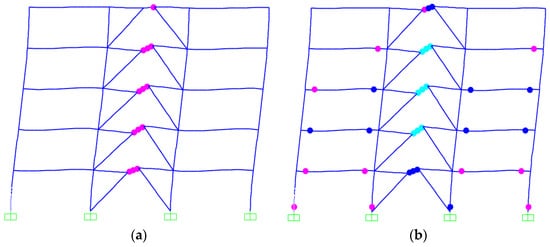
Figure 9.
Distribution of plastic hinges in 5-story K-shaped eccentrically braced structures. (a) Major earthquake; (b) Ultimate limit state.
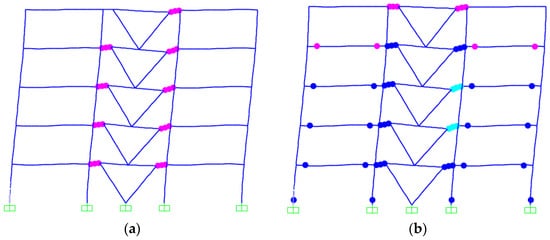
Figure 10.
Distribution of plastic hinges in 5-story V-shaped eccentrically braced structures. (a) Major earthquake; (b) Ultimate limit state.
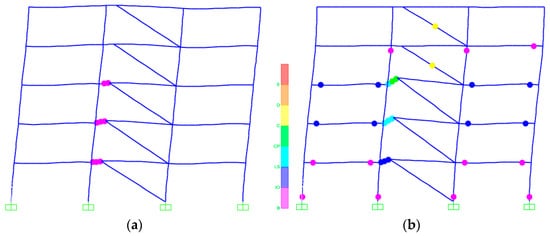
Figure 11.
Distribution of plastic hinges in 5-story D-shaped eccentrically braced structures. (a) Major earthquake; (b) Ultimate limit state.
From the pushover analysis, the plastic hinge development process of each structure is pushed to the rare earthquake and limit state, it can be seen that the plastic hinge development of different forms of eccentrically braced structures is basically the same. The energy dissipation beam section of the structure is the first line of defense against earthquakes. It first yields and enters the elastoplastic phase. In the process of structural yield, the energy dissipation beam section of each floor basically yields. The failure mode of the energy dissipation beam section is the shear yield type. In the shear yield of the web, the full section of the energy-consuming beam reaches the plastic state. Therefore, the plastic hinge development states of different positions of the energy dissipation beam section are the same. The frame beam of the structure is the second line of defense against earthquakes. The plastic hinge also begins to appear later, into the elastoplastic stage. When the structure is pushed to the limit state, the plastic hinge appears in the position of the structural column foot, which indicates that the structure has completed its yield. The whole yield process satisfies the traditional design concept of “strong column and weak beam”. At the same time, the failure mechanism of the structure is transformed into the energy dissipation beam segment to the frame beam, and then to the frame column. This is precisely due to the eccentric support structure. In this way, the overall yield mechanism is satisfied, and the desired failure mode is achieved. This shows that the eccentric support structure has reasonable multiple seismic defense lines, so it is appropriate to use the eccentric support frame system in strong earthquake areas.
4. Response Analysis of Structural Ground Motion
4.1. Quantification of Structural Performance Index
To evaluate the exceedance probability of the structure’s vulnerability in a damaged state, structural performance indicators must be established and quantified. In order to establish the performance index, it is essential to define a set of reference seismic fortification levels. Table 9 shows the fortification level of resistance in our country. In FEMA P-58 [33,34,35], the inter-story drift angle and inter-story drift acceleration are used to reflect the demand parameters of different components. Through experiment and theoretical analysis [36], it is found that the inter-story drift angle can reflect the deformation of inter-story members and the height of the floor well, and can reflect the damage state of the structure more intuitively. It is consistent with the checking calculation of the inter-story drift in the Code for Seismic Design of Buildings [17]. Therefore, the inter-story drift angle and floor acceleration are selected as the evaluation indexes of structural performance in this paper. The control target of the maximum inter-story drift angle of multi-story steel frame structures in China is shown in Table 10.
Table 9.
Seismic design ground motion level in Code for Seismic Design of Buildings.
Table 10.
Maximum inter-story drift angle limit in Code for Seismic Design of Buildings.
At present, there is no unified standard for quantifying the index of eccentrically braced steel structures. Therefore, the performance of the eccentric support structure can be quantified by referring to the relevant example in Appendix M in the Code for Seismic Design of Buildings [17]: “when it is necessary to determine the service performance according to the seismic residual deformation, the inter-story drift reference index with different performance requirements”. In this paper, the performance of eccentrically braced structures is divided into four levels: normal use (NO), immediate use (IO), life safety (LS), and collapse prevention (CP), as shown in Table 11. Taking the damage limit value of the performance level as the limit, the damage degree of the structure can be divided into five types. The five levels are intact, slightly damaged, moderately damaged, severely damaged, and collapsed.
Table 11.
Performance level and quantitative index of the structure.
4.2. Selection and Amplitude Modulation of Seismic Waves
The non-linear response of building structures is closely related to seismic waves, and different seismic records can cause significant variations in structural responses. Therefore, selecting the appropriate seismic waves is crucial. The Code for Seismic Design of Buildings [17] proposes that during the time history analysis, acceleration time history curves should be selected based on site type and design earthquake grouping. The number of natural waves should not be less than two-thirds of the total amount. refers to the damped spectral acceleration corresponding to the basic period of elasticity of the structure. Because it greatly reduces the discrete type of analysis, this paper uses as the strength index. According to the time history curve and its response spectrum in the Code for Seismic Design of Buildings in China, among the seismic waves given in the report of ATC-63 [36] in the USA, 11 seismic waves satisfying the criteria were selected (Table 12) and their acceleration response spectrum curves are shown in Figure 12.
Table 12.
Ground motion information selected.
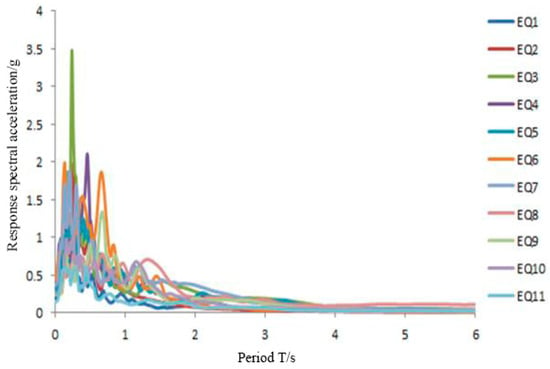
Figure 12.
Seismic wave acceleration response spectrum.
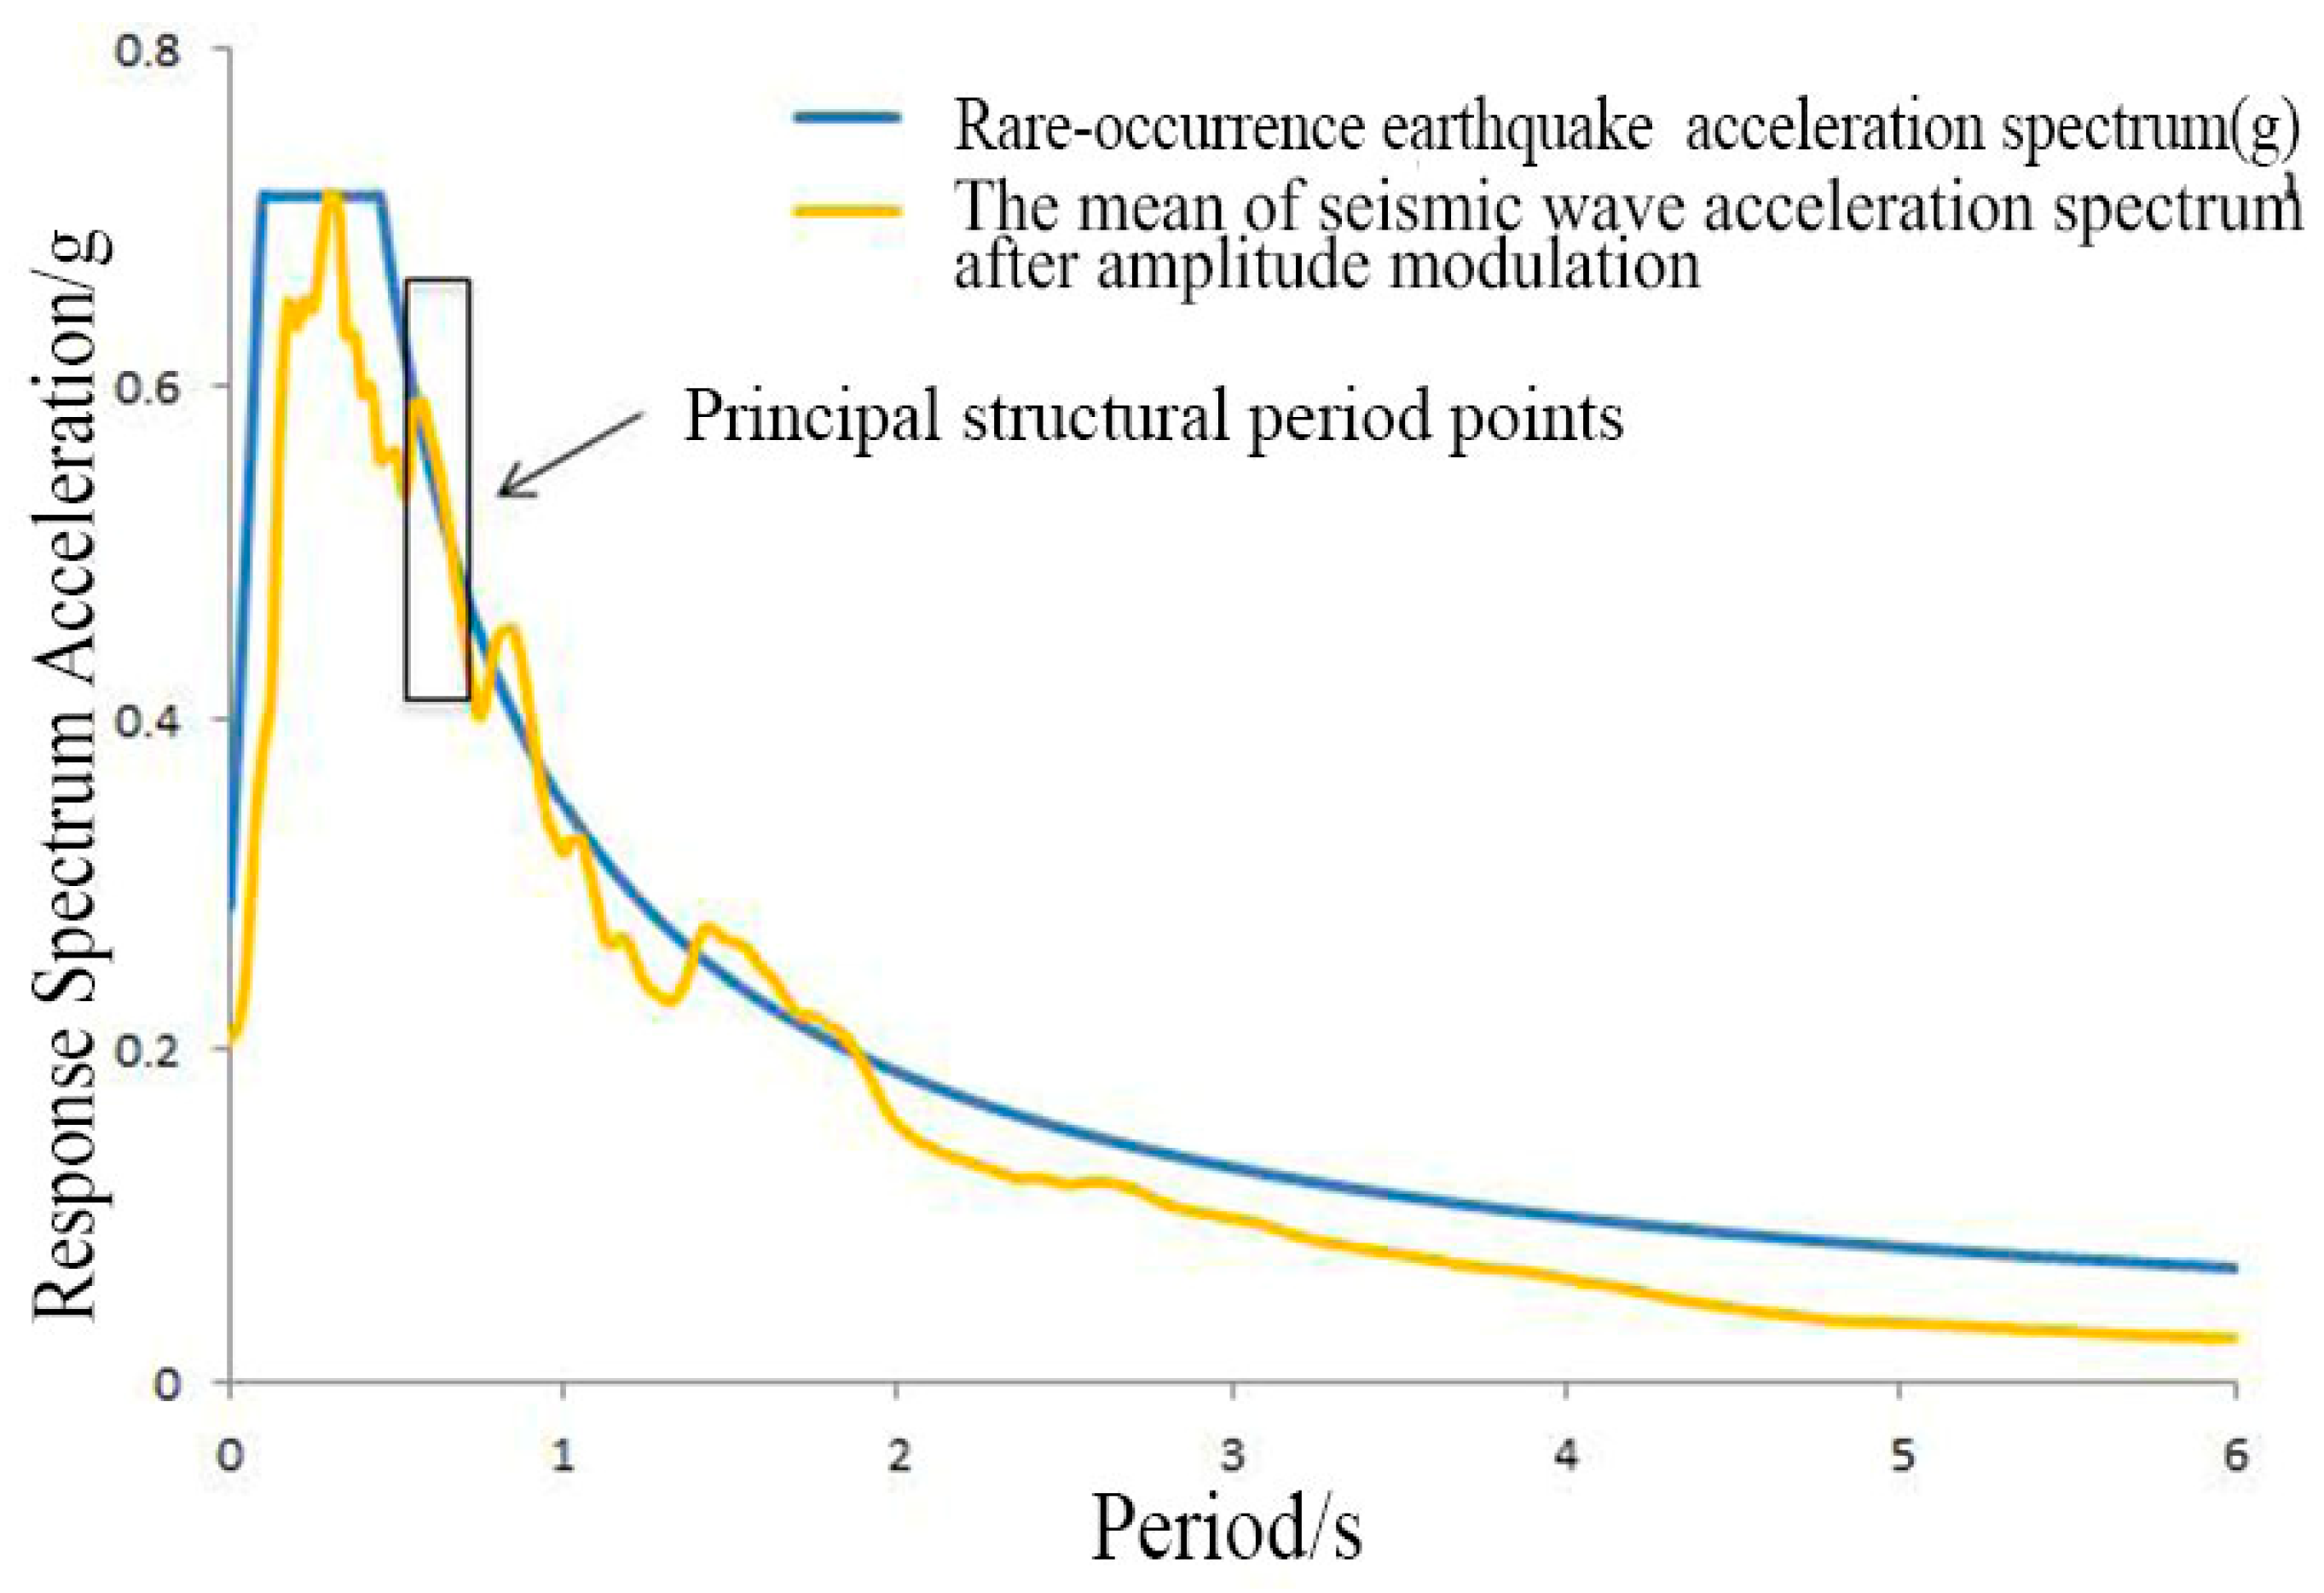
In order to test whether the selected seismic wave is reasonable, the average spectrum of the selected seismic wave is compared with the code response spectrum (Figure 13). Figure 14 shows that the two response spectra are closer at the main period point of the structure (0.65 s~0.72 s). The average spectrum of the selected seismic wave is closest to the canonical response spectrum. The selected seismic wave and the canonical response spectrum are within 35% and 20% of each other, which is in line with the code of resistance. This shows that the selected seismic wave is more reasonable.
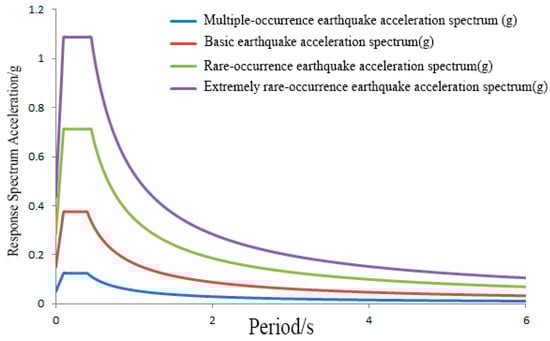
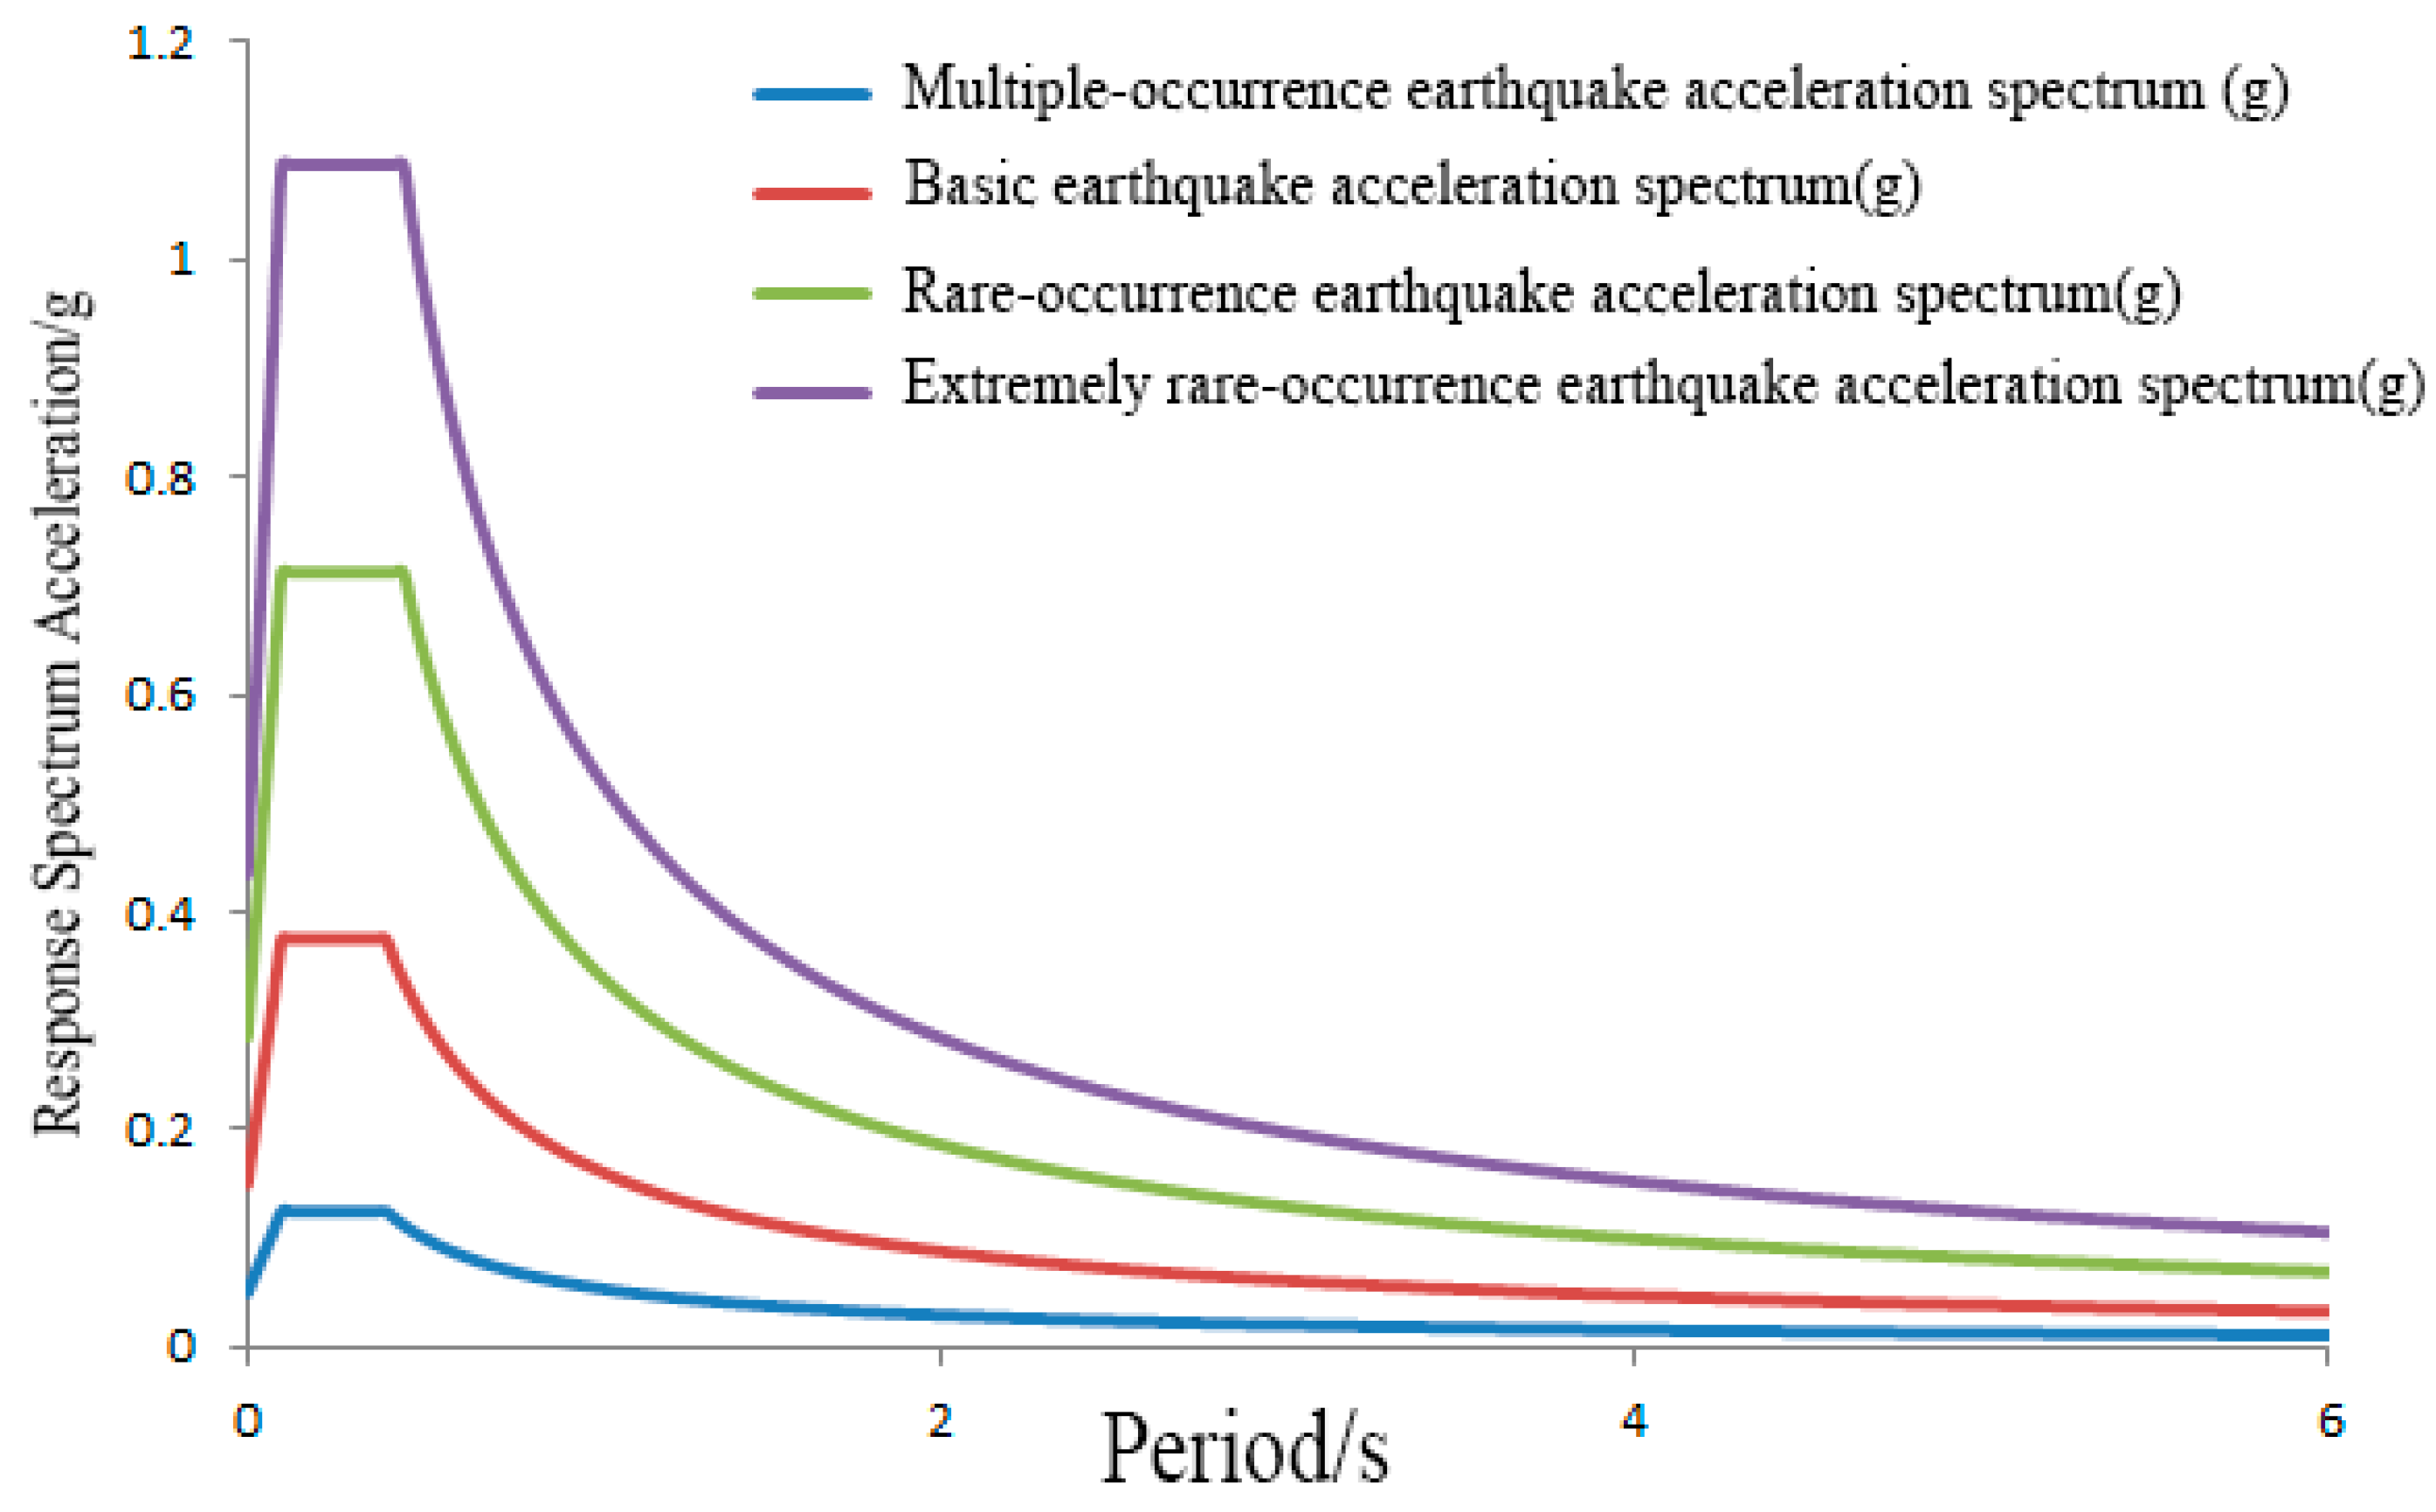
Figure 13.
Response spectrum of four intensity levels.
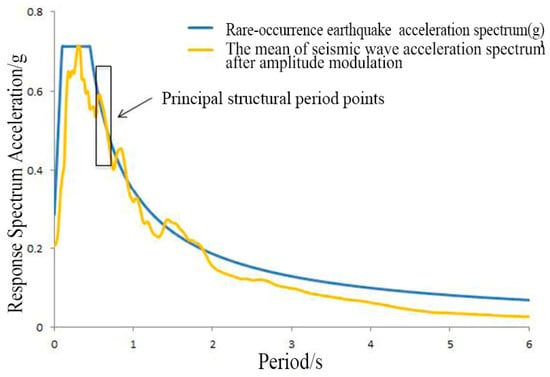
Figure 14.
Comparison between average spectrum and code spectrum.
The scaling of ground motion and the selection of seismic records have significant impacts on inter-story drift angles and damage probabilities [37,38]. The scaling of seismic motion significantly impacts the dynamic response of structures. The scaling may cause bias for the response of buildings if the spectral shape is not compatible with the target spectrum. Depending on the site conditions, four seismic intensities are defined: multiple-occurrence earthquake (minor earthquake), basic earthquake (moderate earthquake), rare-occurrence earthquake (major earthquake), and extremely rare-occurrence earthquake (extreme earthquake). The acceleration values are 0.17 g, 0.5 g, 0.95 g, and 1.45 g, respectively. Each seismic wave is modulated to these four intensity levels by using the “single point amplitude modulation method”, and the structural response is calculated by inputting the structure (Lu Dagang et al. [39]).
Taking the amplitude modulation of the five-story K-shaped eccentrically braced structure as an example, the amplitude modulation coefficients corresponding to the seismic waves in various places are shown in Table 13.
Table 13.
Ground motion amplitude modulation coefficients.
4.3. Results of Structural Analysis
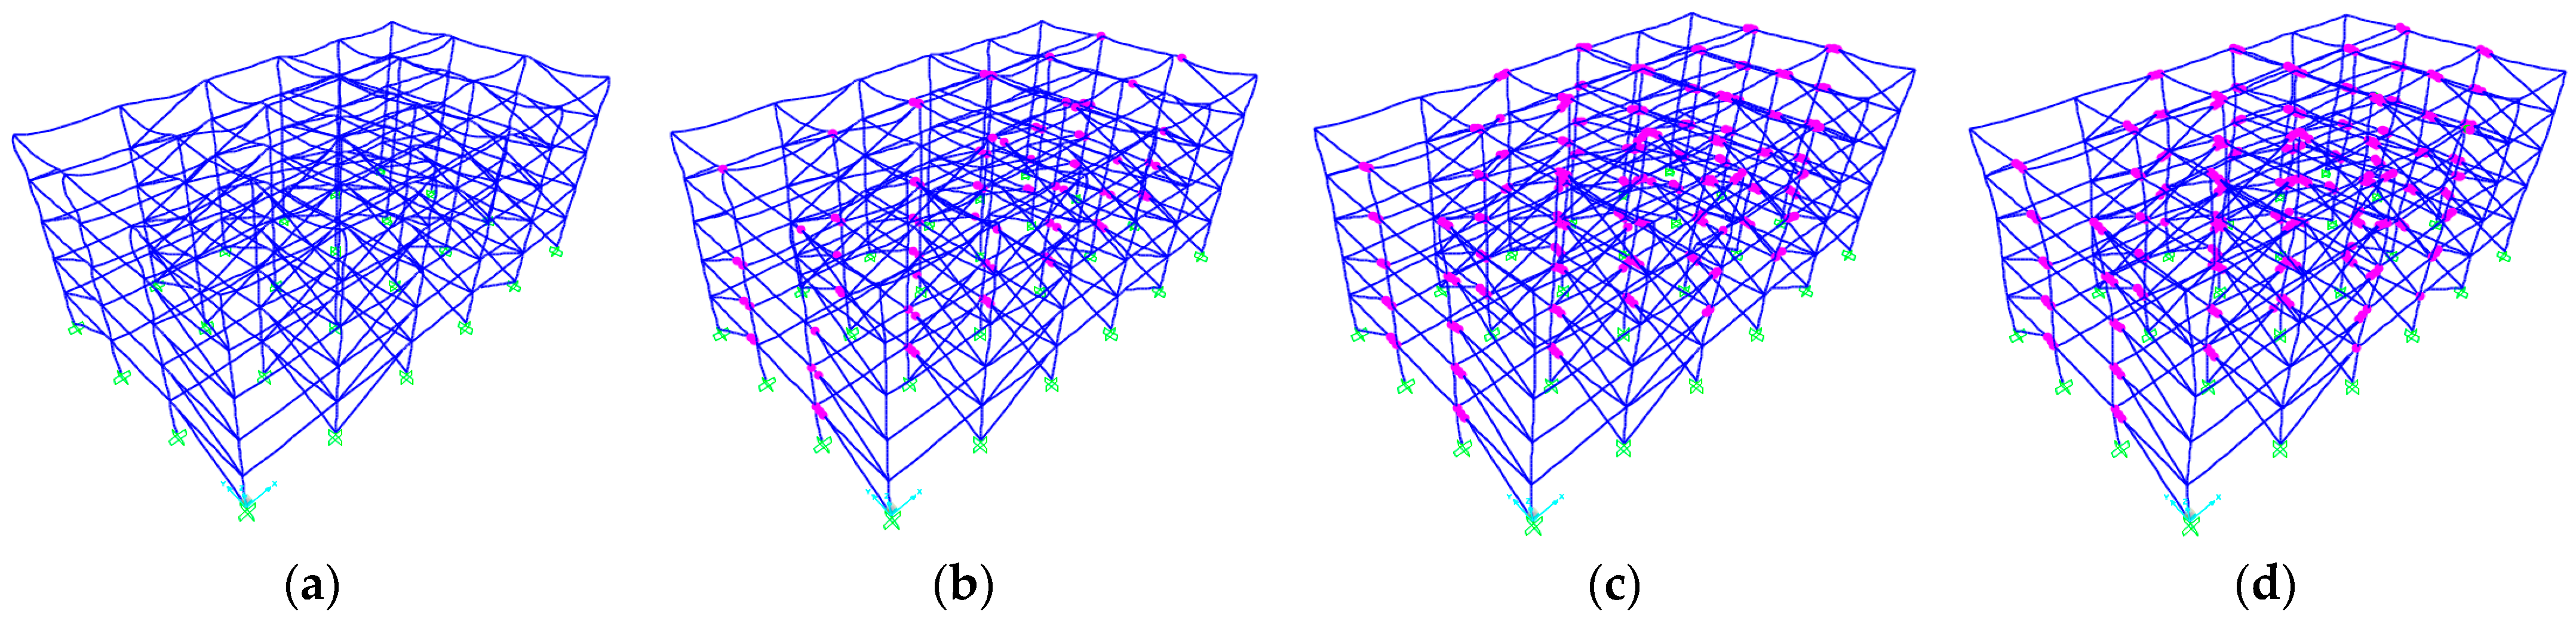
4.3.1. Structural Failure Form
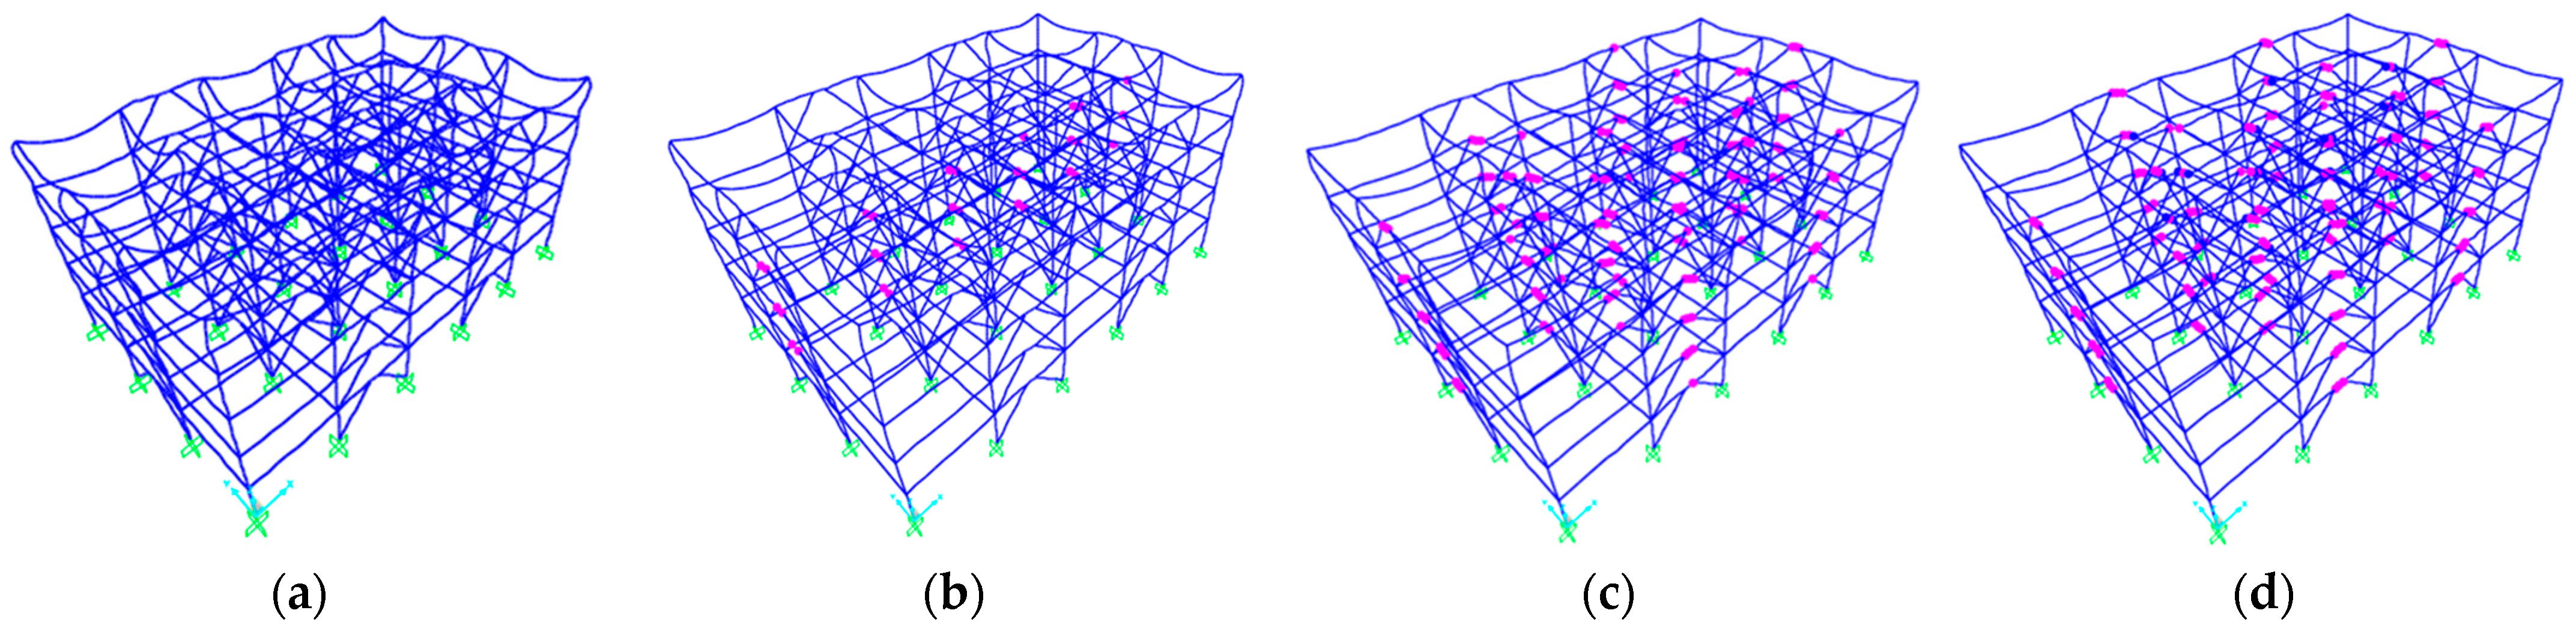
The failure forms of the plastic hinges of the three different types of structures under a minor earthquake, moderate earthquake, major earthquake, and maximum earthquake are shown in Figure 15, Figure 16 and Figure 17. In this paper, we use the elastic–plastic state of the structural model under the EQ1 seismic wave as a specific example for explanation. Under the action of minor earthquakes, no plastic hinges appeared in any model member. The structure was still in an elastic state, so it was not analyzed. Under the moderate earthquake, a small number of plastic hinges appeared in each structure, among which the number of plastic hinges in the K-shaped eccentric braces was the least, concentrated in the middle of the structure. The highest number of plastic hinges occurred in the D-shaped eccentric support, and the plastic hinges occurring throughout the structure were evenly distributed. For V-shaped eccentric braces, the number of plastic hinges was in the middle, and the position was concentrated in the upper position of the structure. Under the action of major earthquakes, the structure entered an elastic–plastic state, and the plastic hinges of each eccentric support structure appeared on the energy-consuming beams, and the plastic deformation of the energy-consuming beams was uniformly distributed along the height, which basically reached the ideal damage mode. For beams, columns, and braces, there were no plastic hinges and they were still in the elastic stage, so there was no need to require too much plastic deformation capacity. Steel with higher strength can be used to reduce the cross-sectional area. The number and degree of plastic hinges of all structures under major earthquakes were further developed compared with those under major earthquakes.
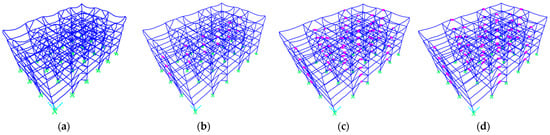
Figure 15.
Failure mode of K-shaped eccentrically braced structure. (a) Minor earthquake, (b) Moderate earthquake, (c) Major earthquake, and (d) Extreme earthquake.
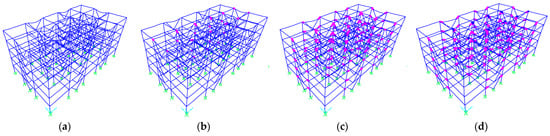
Figure 16.
Failure mode of V-shaped eccentrically braced structures. (a) Minor earthquake, (b) Moderate earthquake, (c) Major earthquake, and (d) Extreme earthquake.

Figure 17.
Failure mode of D-shaped eccentrically braced structures. (a) Minor earthquake, (b) Moderate earthquake, (c) Major earthquake, and (d) Extreme earthquake.
4.3.2. Structural IDA Curve
IDA (incremental dynamic analysis) is a performance-based seismic analysis method with wide application value. The IDA curve records the whole process of the structure from elasticity to plasticity to collapse under the action of gradually increasing seismic strength.
IDA analysis involves inputting one or more seismic records into a structural model, where each seismic wave is “amplified” to different seismic intensity levels. The “amplified” seismic motion is then used for the elastoplastic analysis of the structure, resulting in a series of structural elastoplastic seismic responses and generating IDA curves that relate the seismic intensity to the damage indicators. Finally, the seismic performance of the structure can be evaluated according to the character points on the IDA curve.
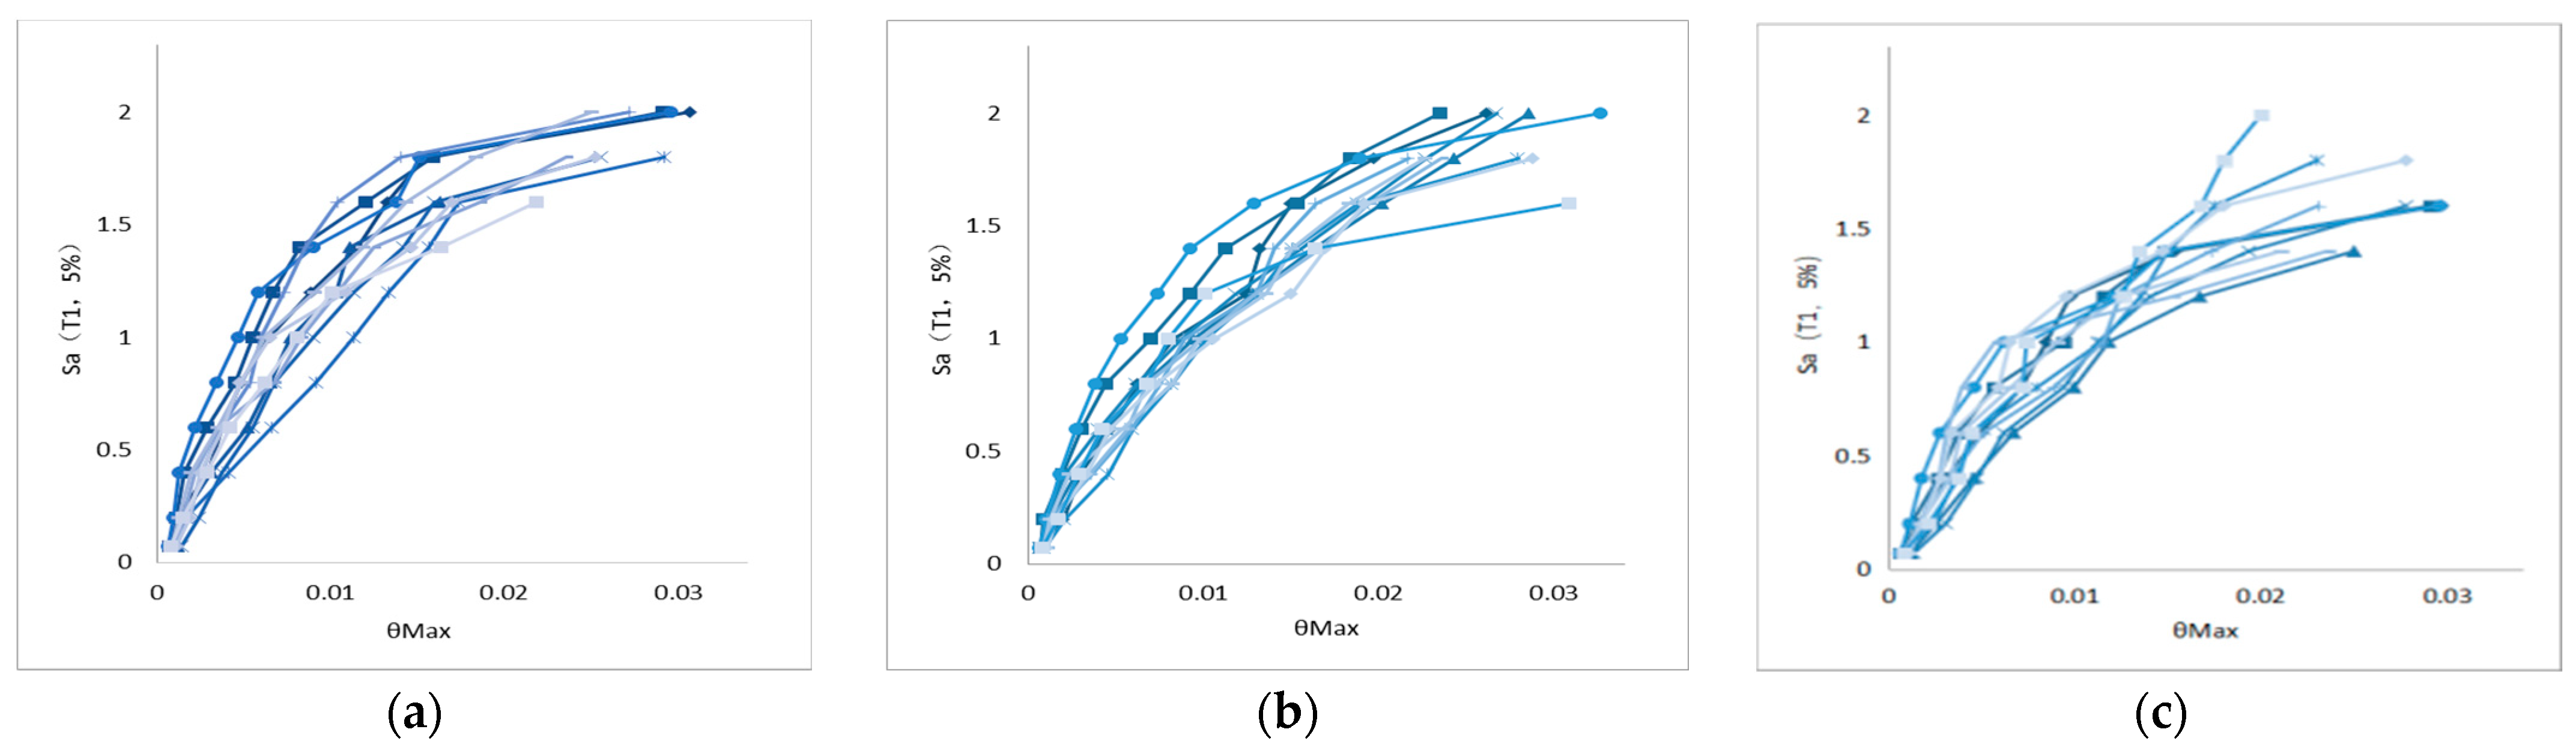
Eleven seismic waves in accordance with the site conditions of the structure are selected (Table 12), the peak value of inter-story drift is selected as the damage index, and the spectral acceleration is the intensity index. A series of ground shocks of different intensities are obtained after amplitude modulation and input into SAP2000 for a time range analysis to obtain the IDA curves. In this paper, three different forms of eccentrically braced structures are analyzed by non-linear time history, as shown in Figure 18. From the IDA curves of each frame structure, it can be seen that for small ranges of , the IDA curve is in a state of linear increase, indicating that the structure is in the elastic stage; when gradually increases, the slope of the IDA curve begins to decrease, indicating that the deformation of the structure is developing into the elastic–plastic stage; the slope at the end of the IDA curve is nearly 0, indicating that the structure finally collapses.
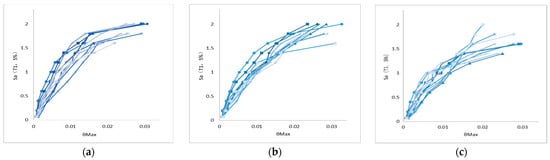
Figure 18.
IDA curves for various structures. (a) K-shaped, (b) V-shaped, and (c) D-shaped.
At the same time, it can be seen that the IDA curves of the three types of structures shift to the right in turn, indicating that the stiffness of the structure decreases, the damage occurs when the ground motion is smaller, and the seismic capacity of the structure gradually becomes worse.
4.3.3. Structural Vulnerability Curve
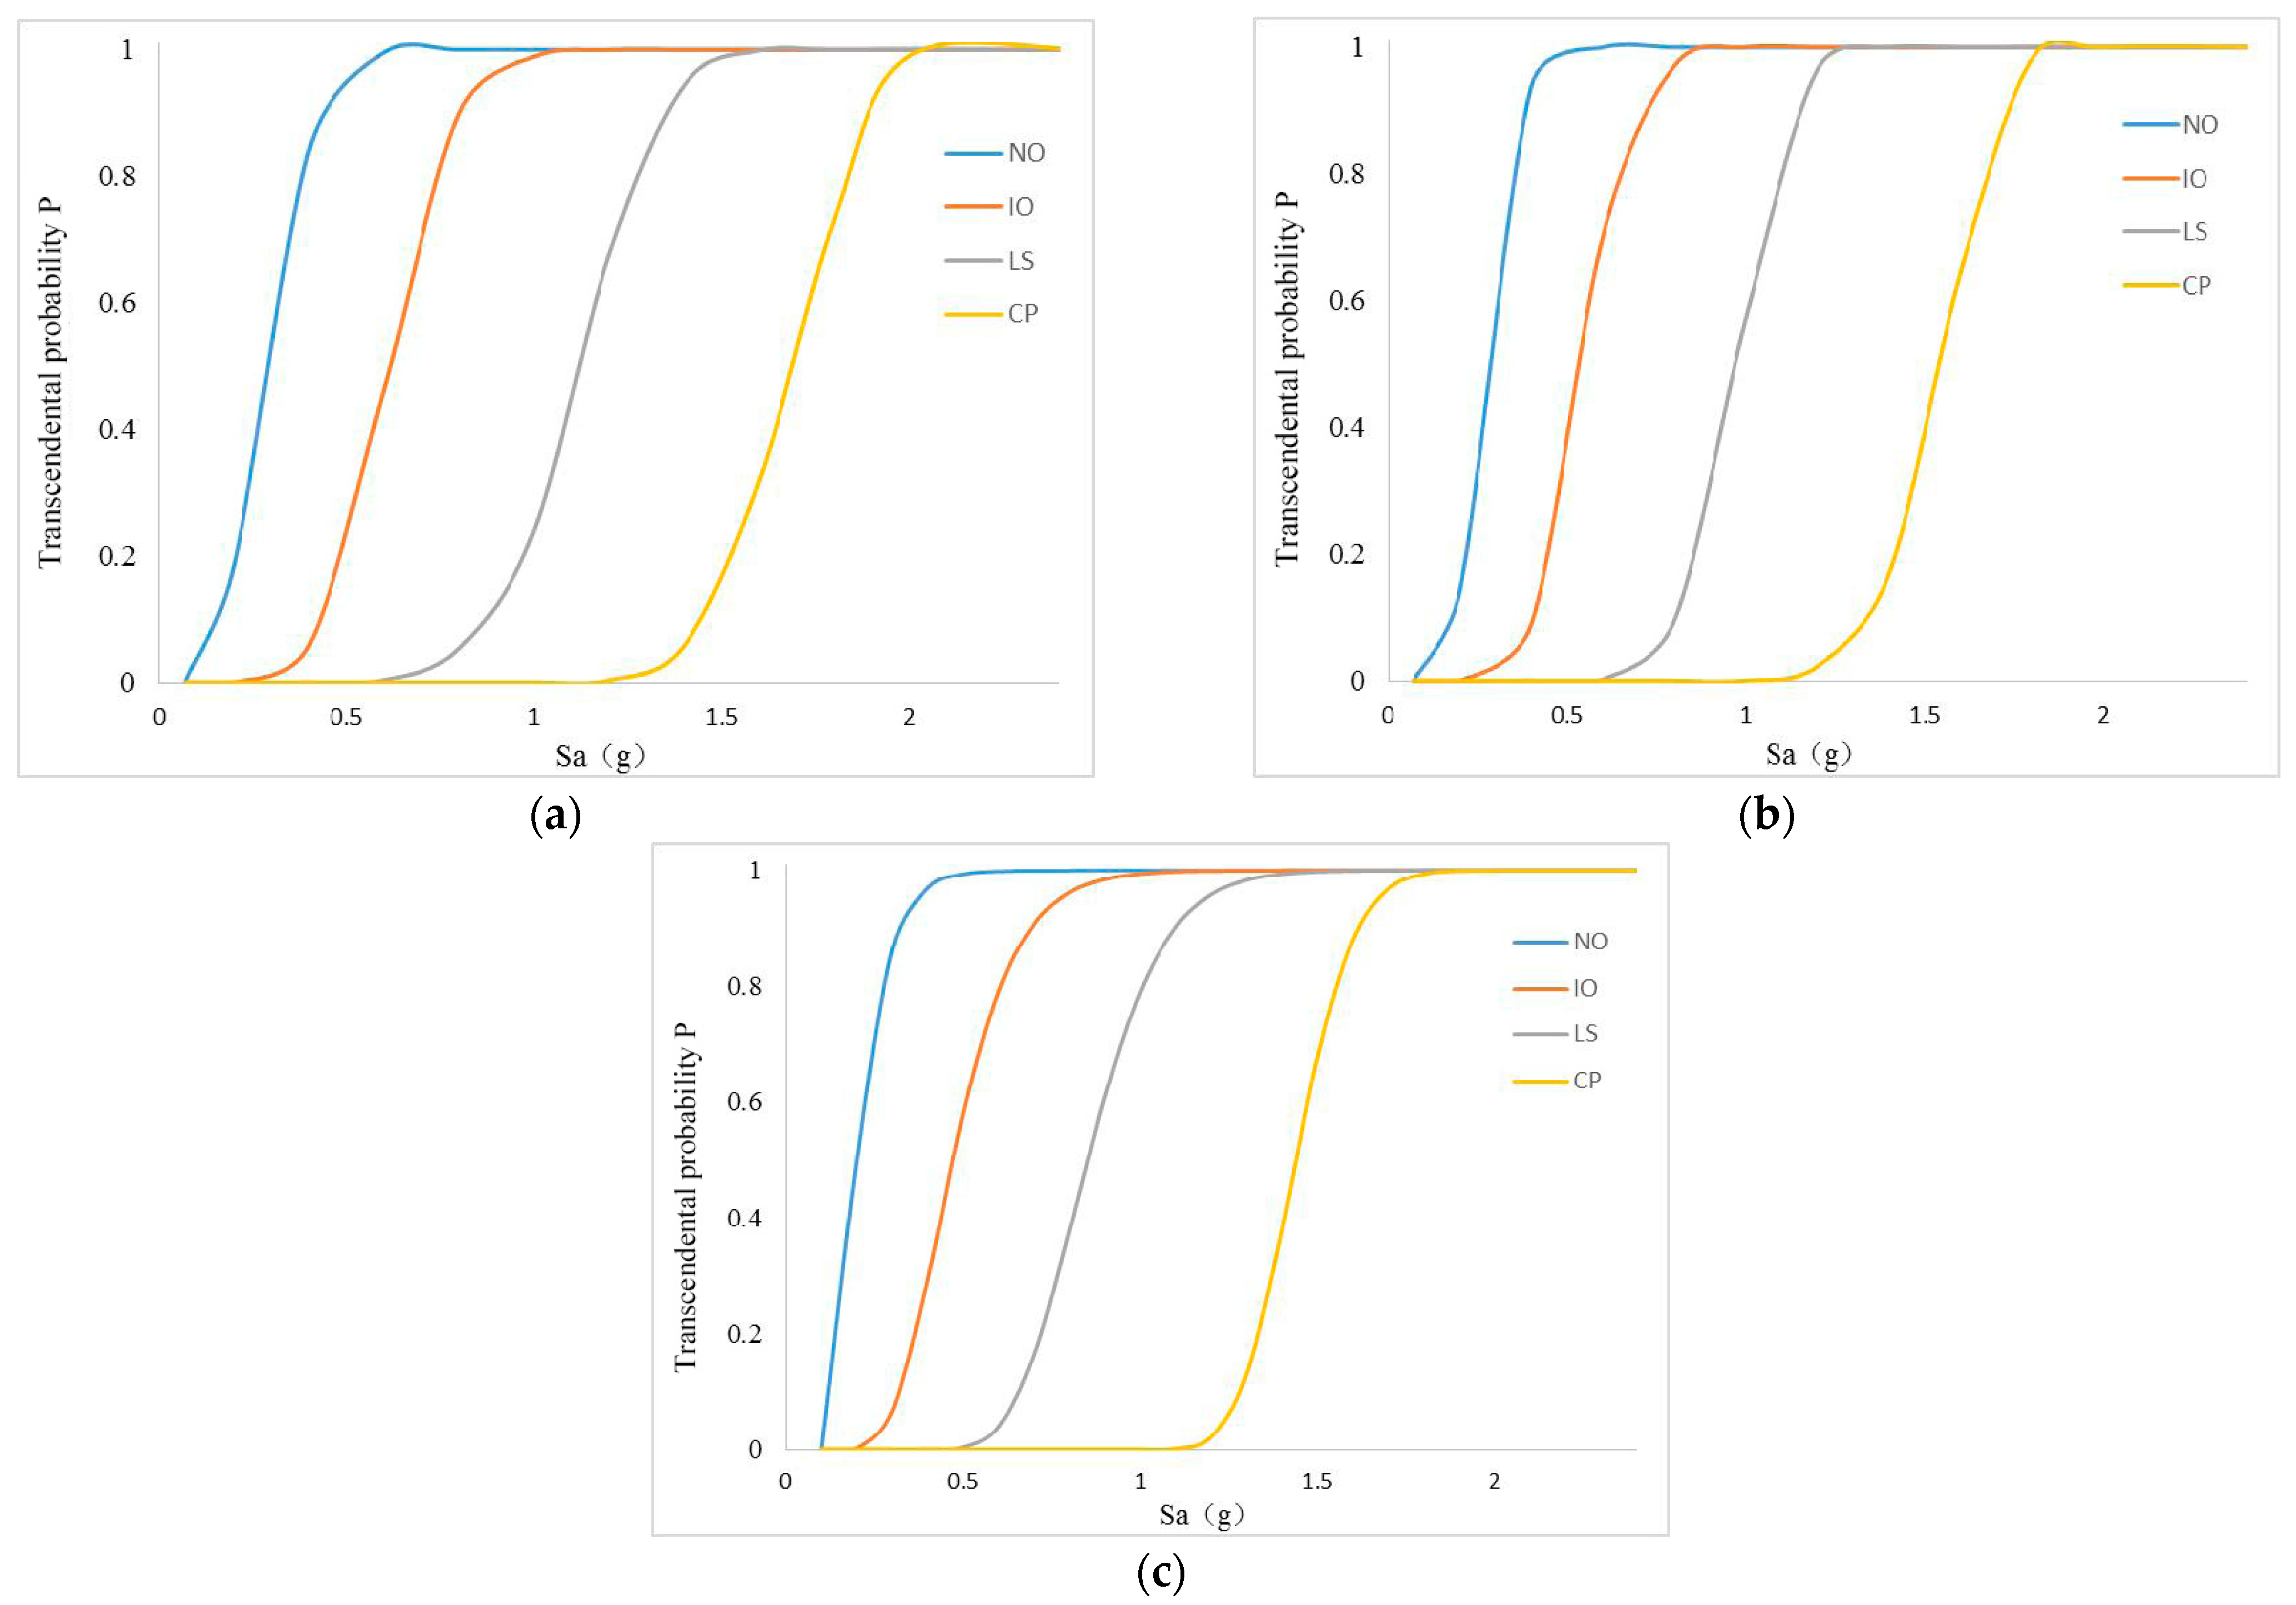
A lognormal fragility function is fitted to the results of the incremental dynamic analyses using the maximum likelihood procedure proposed by Baker [40]. Next, the corresponding vulnerability functions are fitted to the four performance states of the structure, namely normal use (NO), immediate use (IO), life safety (LS), and collapse prevention (CP). The control target of the maximum inter-story drift angle of multi-story and high-rise steel frame structures in China is shown in Table 10. Through the analysis and integration of the results of the IDA analysis, the vulnerability curves of three different forms of eccentrically braced structures are obtained as shown in Figure 19.
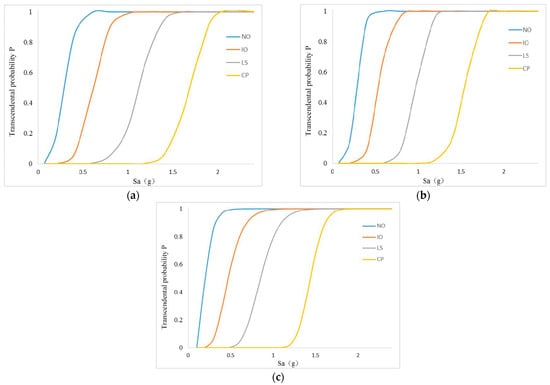
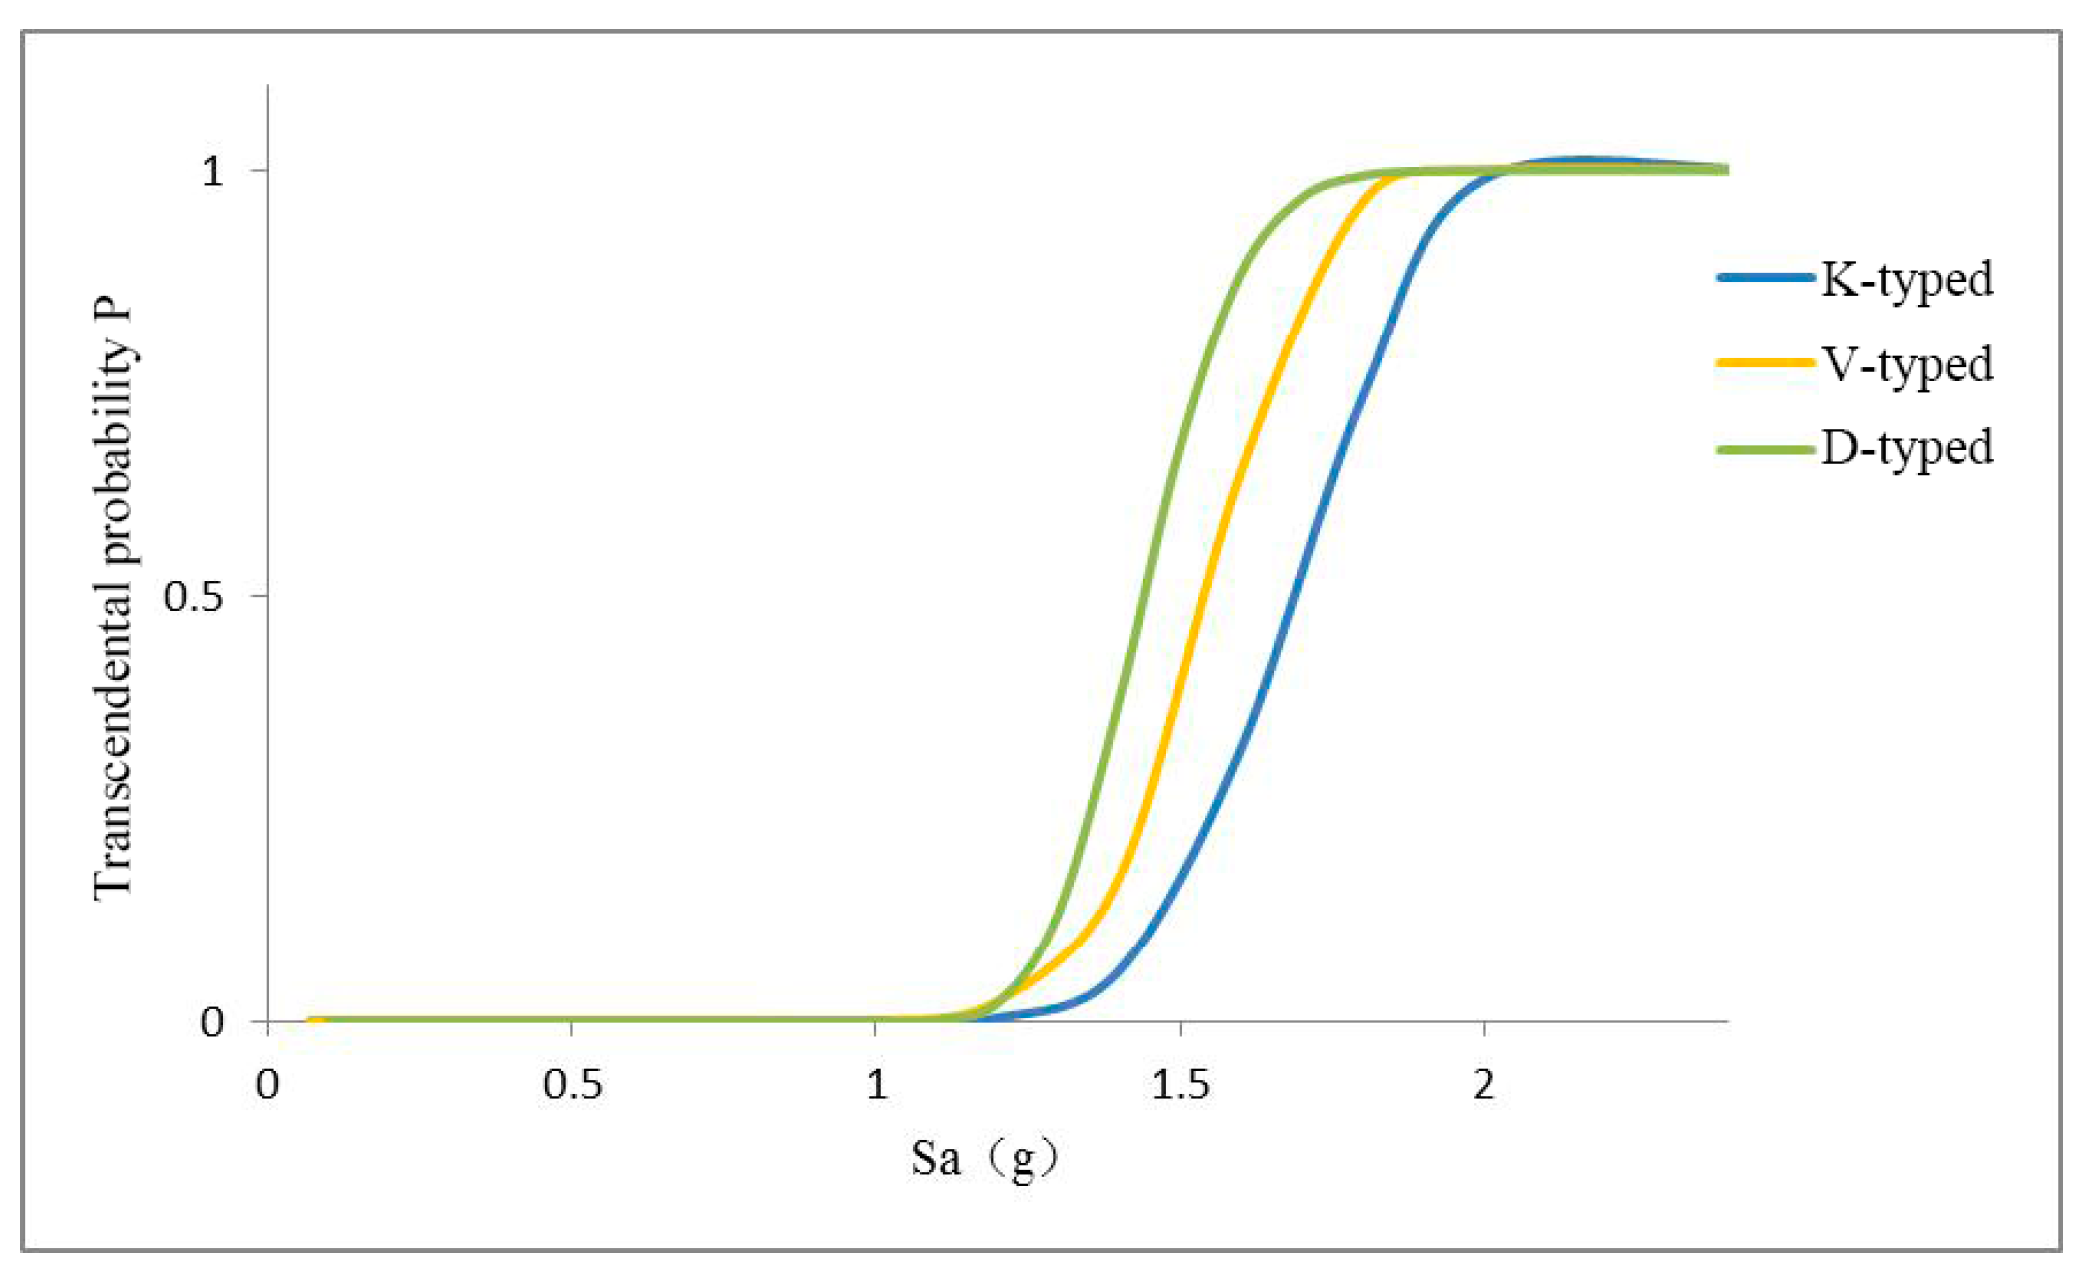
Figure 19.
Fragility curve of each structure. (a) K-shaped, (b) V-shaped, and (c) D-shaped.
From Figure 19, it can be seen that the vulnerability curve of the structure under the four performance levels changes from steep to smooth, which shows that, in general, the structure will have at least minor damage, that is, it is easy to exceed the limit of elastic inter-story drift angles. However, with the gradual increase in the degree of damage, the structure gradually enters plasticity. In order to achieve the complete destruction of the structure, it is necessary to undergo a large variation in earthquake intensity amplitude. For K-shaped eccentrically braced structures, when the probability of reaching the four performance levels of normal use (NO), immediate use (IO), life safety (LS), and collapse prevention (CP) is 50%, the corresponding is 0.30 g, 0.61 g, 1.12 g, and 1.68 g, respectively. For V-shaped eccentrically braced structures, when the probability of reaching the four performance levels is 50%, the corresponding is 0.28 g, 0.55 g, 0.97 g, and 1.54 g, respectively. Figure 20 shows the collapse vulnerability curves of the three structures. The seismic strength of the three structures when they reach the median probability of preventing collapse is counted, as shown in Table 14. The results of the overall collapse vulnerability analysis of the structure show that the collapse probability of the three structures increases sequentially under the same response spectrum acceleration, indicating that the anti-collapse performance of the K-shaped eccentrically braced structure is the best, and that of the D-shaped eccentrically braced structure is the worst. The median collapse score of the three structures is 1.69 g, 1.54 g, and 1.44 g.
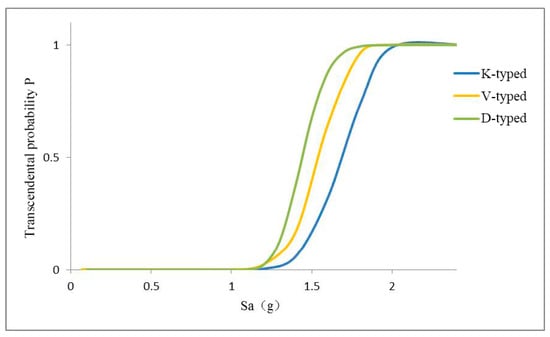
Figure 20.
Collapse fragility curve of each structure.
Table 14.
Fitting parameters of normal distribution of collapse fragility curve.
5. Seismic Loss Assessment of Structures
5.1. FEMA P-58 Performance-Based Seismic Evaluation Theory of Buildings
FEMA P-58’s structural seismic loss assessment utilizes the Monte Carlo method to randomly sample variables and compute structural loss outcomes, constituting an “implementation” process. Using this approach requires determining whether a structure collapses based on completing an IDA analysis. If collapse occurs, then repair costs and duration equal reconstruction costs and time. If no collapse happens, then the possibility of repair needs assessment. If irreparable, then the evaluation results match those described above; if repairable, then the damage extent is assessed based on fragility curves and response demand parameters, leading to loss assessment conclusions. FEMA P-58’s ultimate goal is to establish a function relating structural performance metrics to exceedance probabilities.
The performance evaluation software PACT (Performance Assessment Calculation Tool) based on FEMA P-58 theory is an important tool to calculate and analyze the seismic performance of building structures. The program uses the building performance model to convert the structural analysis results into seismic performance, and the seismic performance is expressed by the maintenance cost. The FEMA P-58 building performance model is a collection of data representing building assets at risk during an earthquake. Building assets include structural systems and non-structural systems. The absolute floor acceleration and inter-story drift ratio are utilized to characterize the requirements of both structural and non-structural systems. The peak structural response parameters in the time history analysis are combined with the vulnerability function to determine the damage state of the building components, and the maintenance cost function is used to calculate the corresponding maintenance cost. In FEMA P-58 theory, the Monte Carlo method is used to simulate the influence of different structural response parameters (EDPs) on the results of the structural performance calculation.
5.2. Analysis Results of Collapse Vulnerability and Structural Response
5.2.1. Analysis Results of Inter-Story Drift Angles
The average value of the inter-story drift angle is comparable in building height, while the calculation results of the peak value of the inter-story drift angle are omitted. Therefore, this paper focuses on the analysis of the average drift angle between the stories of each structure. The results of the three different structural forms are shown below.
According to the analysis results of the drift angle between each story of each structure, it can be concluded that for the eccentric steel frame structure with five floors, the maximum drift angle between floors generally appears at the position of the second floor. The minimum inter-story drift angle of the structure generally occurs at the position of the first story. The first story of the structure has the smallest inter-story drift angle, which may be due to the fact that the column feet are rigidly connected and have a high stiffness. The inter-story drift angle of each structure increases at first and then decreases from the bottom to the top, indicating that the layout of each structure is more reasonable. According to the code, the inter-story drift limits of steel structures under frequent earthquakes and rare earthquakes are 1/250 and 1/50, respectively. According to Figure 21, the inter-story drift limit of the three structures under different earthquakes does not exceed the prescribed limit. The design of these three eccentric support structures is reasonable. It is in line with the concept of “no damage in minor earthquakes, repairable in moderate earthquakes, and no collapse in major earthquakes”.
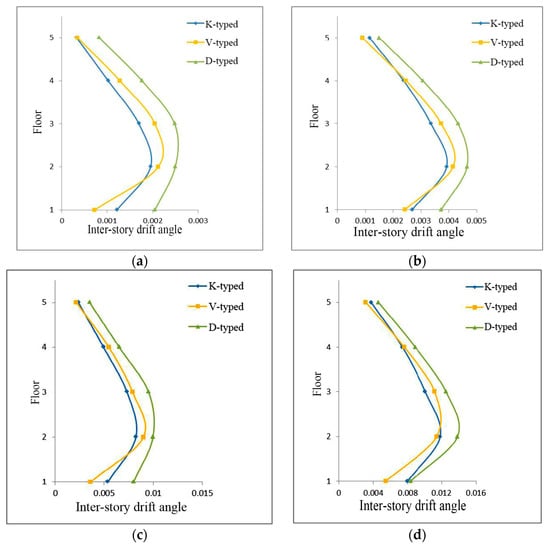
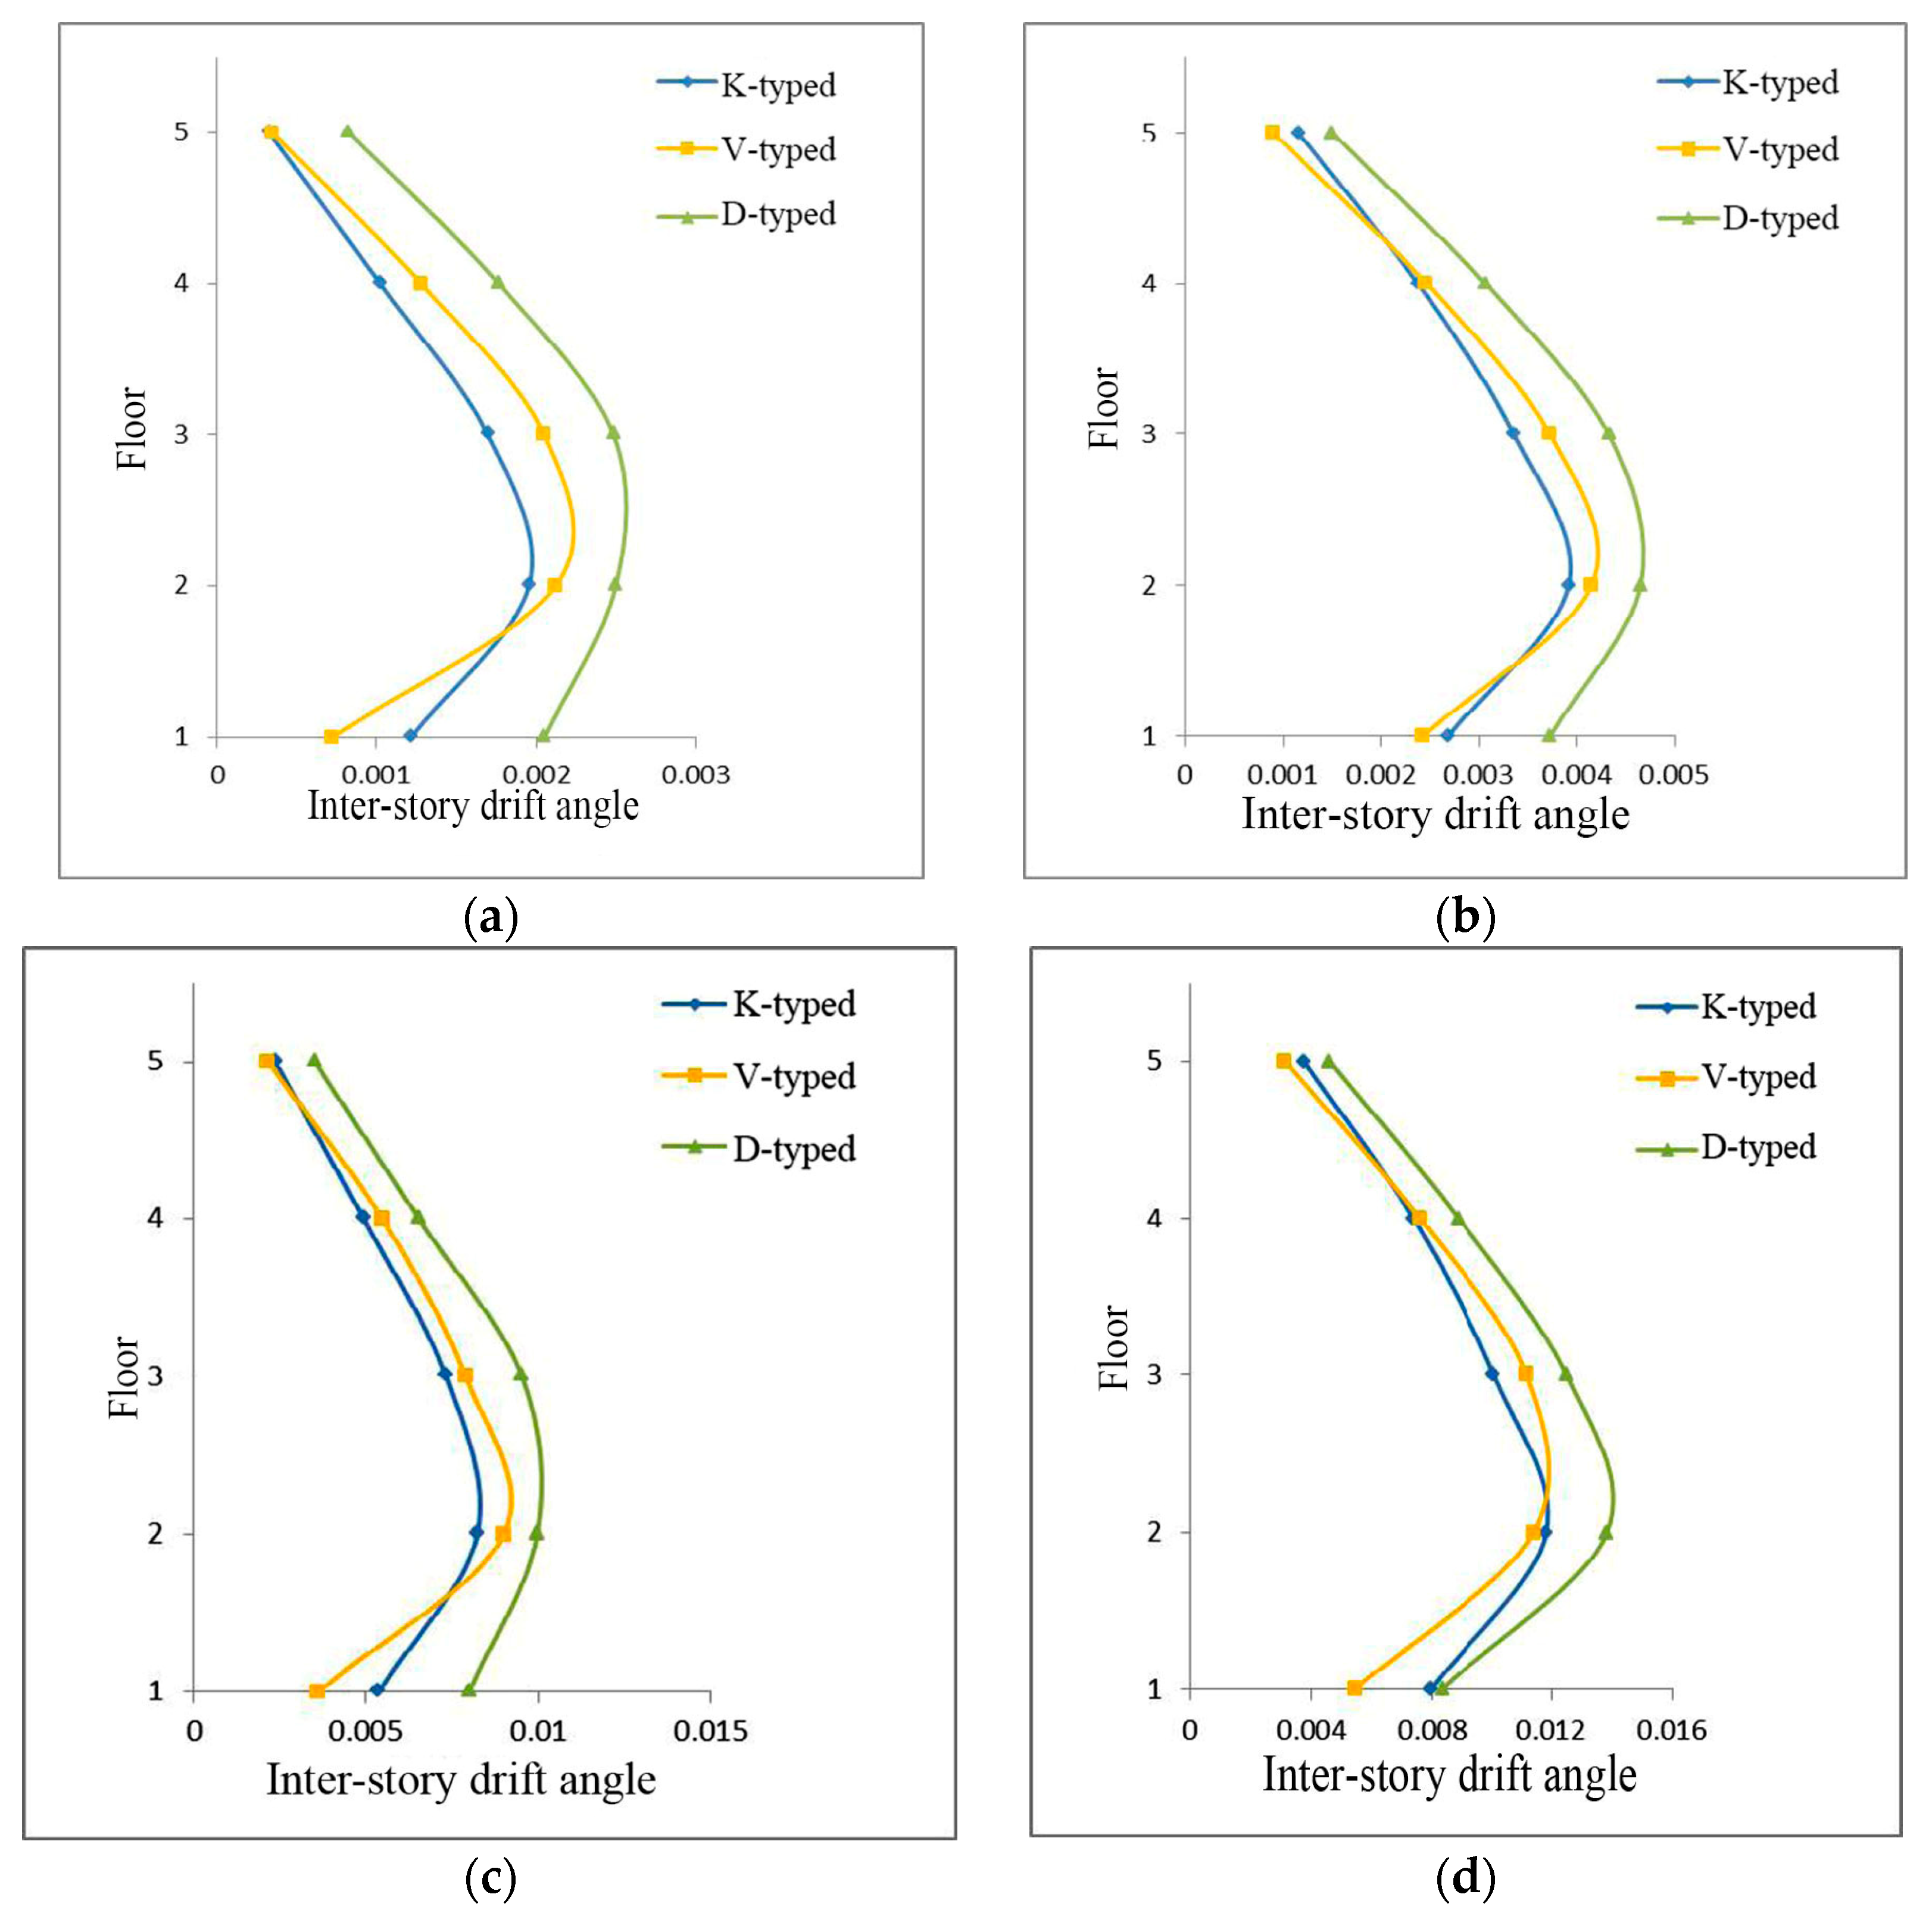
Figure 21.
Mean inter-story drift analysis results of each structure. (a) Minor earthquake, (b) moderate earthquake, (c) major earthquake, and (d) extreme earthquake.
From Figure 21, it can be observed that under various seismic intensities, the mean inter-story drift angles of K-shaped, V-shaped, and D-shaped eccentrically braced frames progressively shift to the right. This indicates that the stiffness of K-shaped eccentrically braced frames is the highest and that of D-shaped eccentrically braced frames is the lowest. However, there is little difference between the V-shaped eccentrically braced frames and the K-shaped braces, which proves that the arrangement of braces also has a certain influence on the stiffness of eccentrically braced steel structures.
5.2.2. Analysis Results of Floor Peak Acceleration
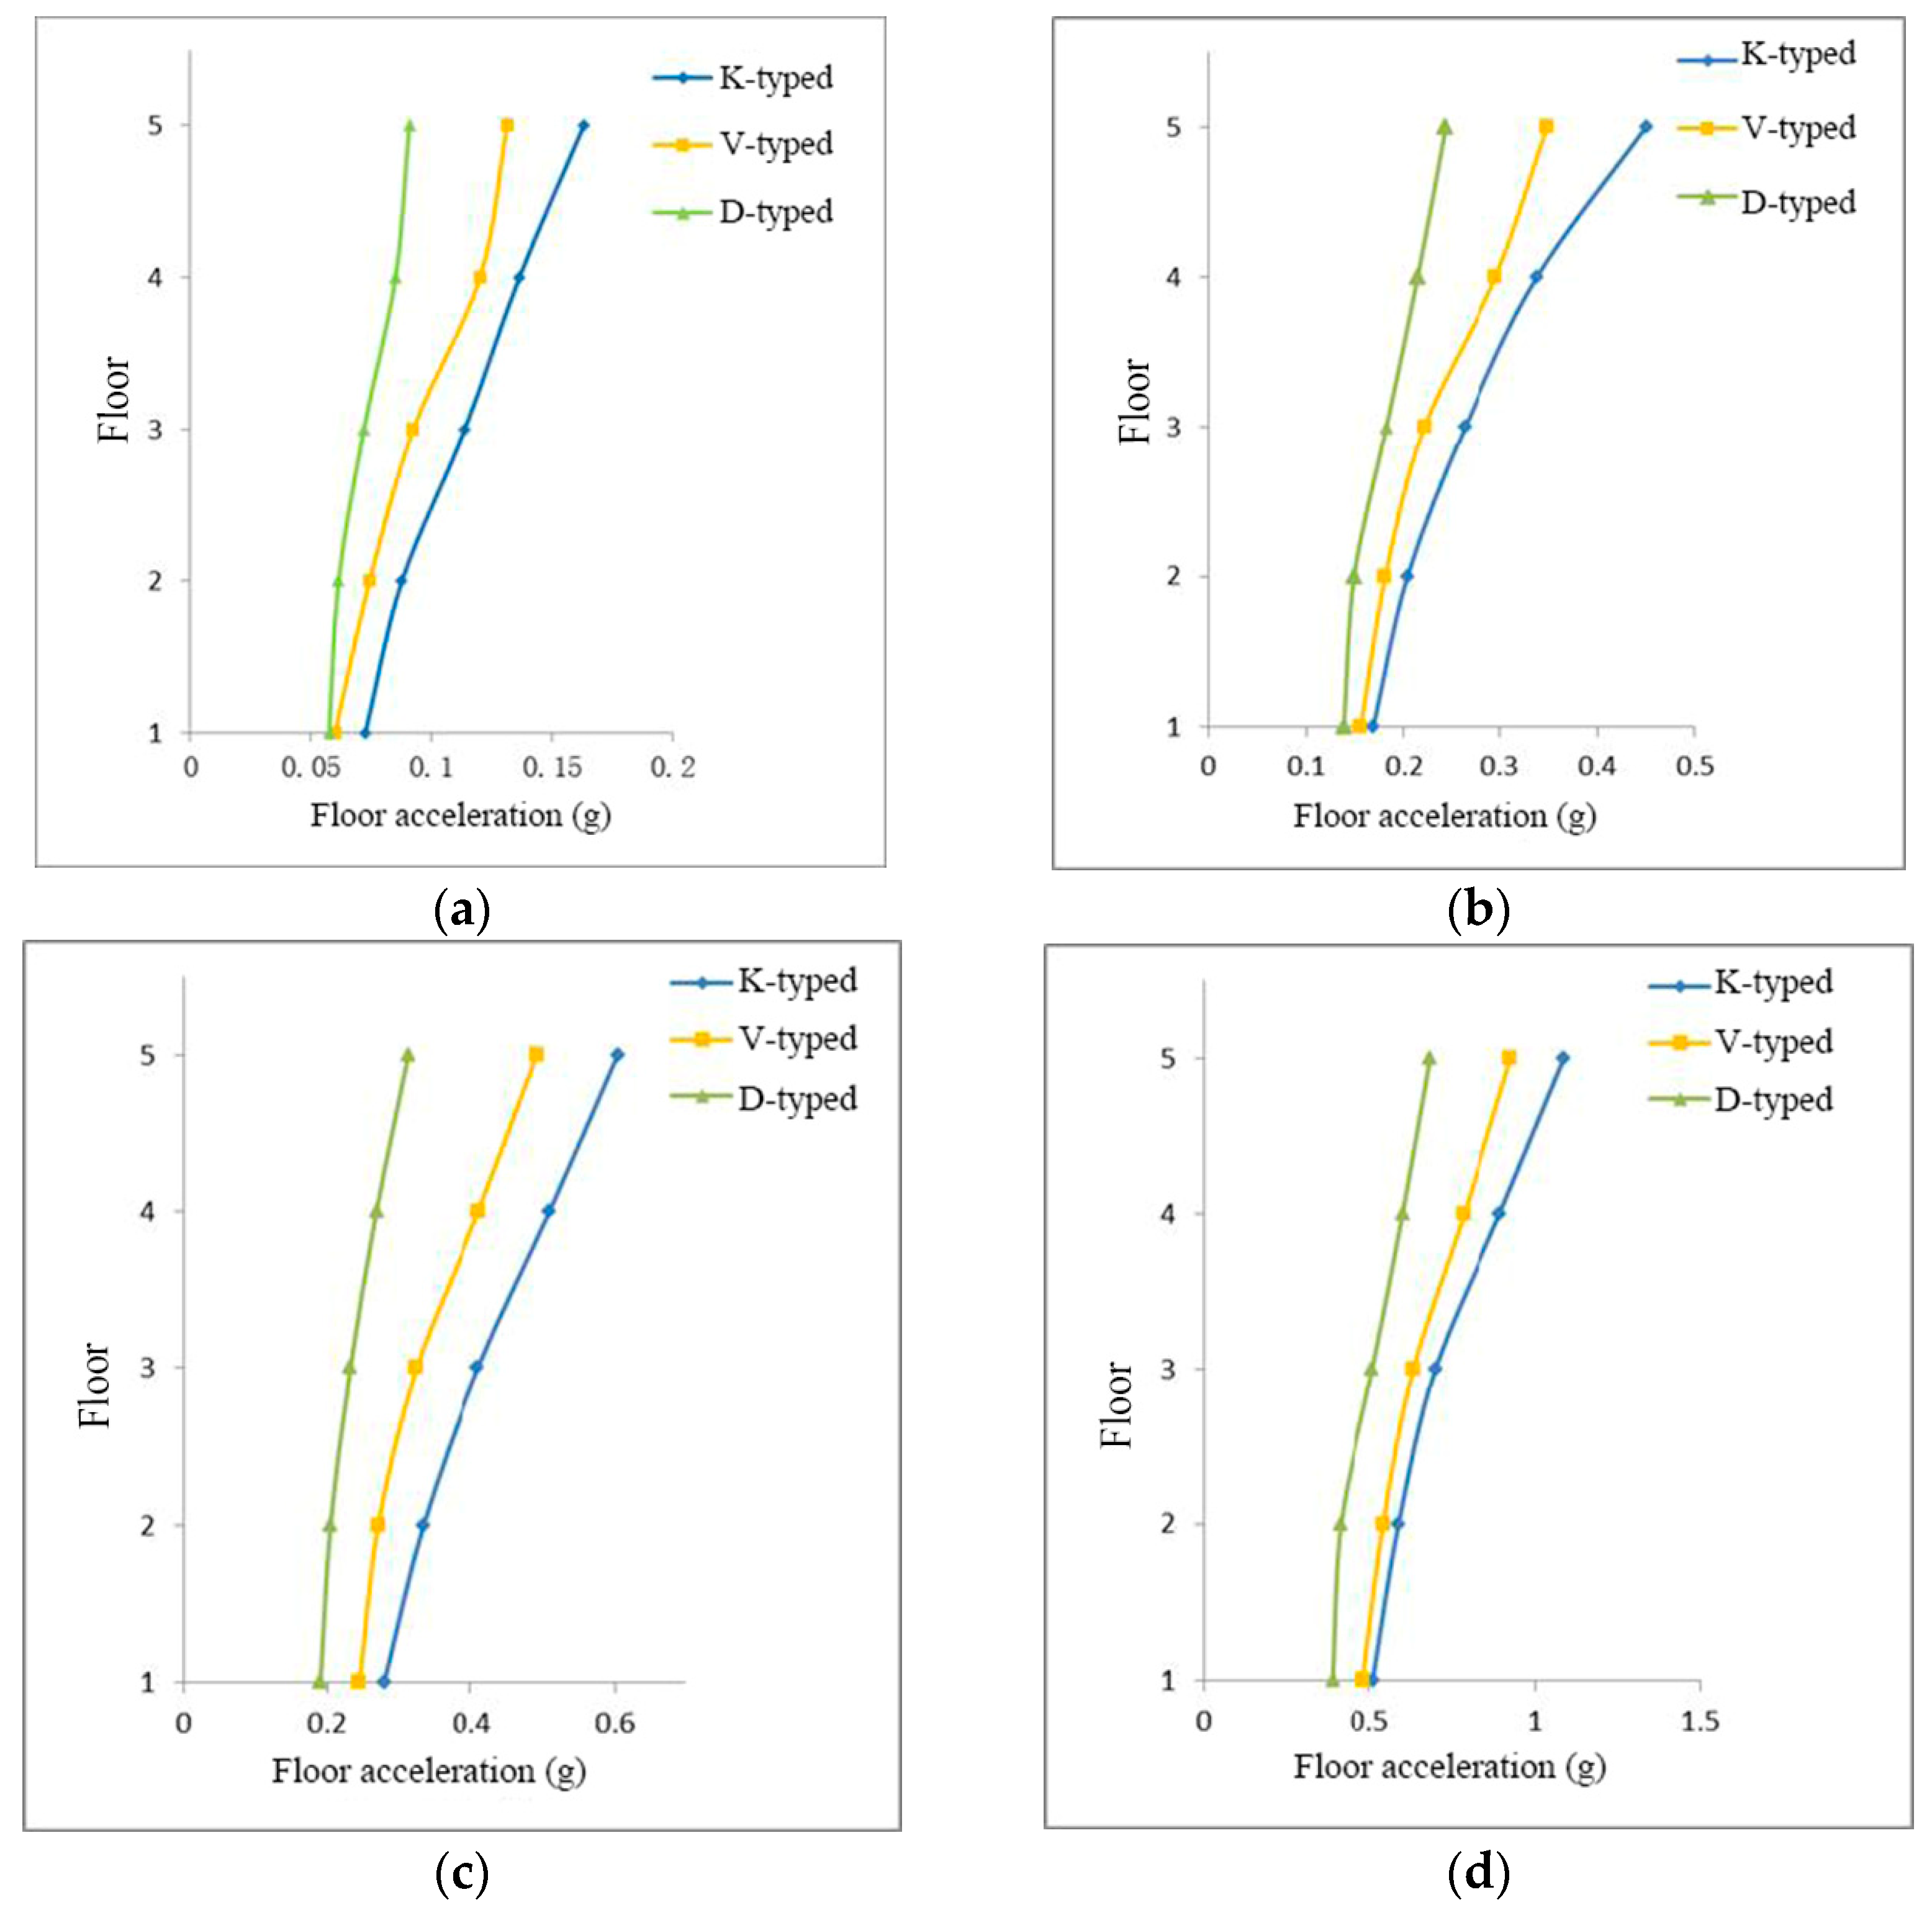
Figure 22 shows the results of the acceleration analysis of each floor level of the three structures. All structures exhibit a progressive increase in floor acceleration from low to high, with the highest floor acceleration occurring on the uppermost floor, as determined by analyzing the floor acceleration data of various structures under varying earthquake intensities. We note that all structures exhibit varying rates of increase in floor accelerations from lower to upper floors. The acceleration of the K-shaped, V-shaped, and D-shaped eccentrically braced frames decreases with increasing strength, as can be seen from the peak acceleration analysis results of each structural floor. The average top acceleration response under frequent earthquakes is 0.16 g, 0.13 g, and 0.09 g, while the average top acceleration response under rare earthquakes is 0.61 g, 0.50 g, and 0.31 g. This is because the modal periods of the three structures increase in turn, so under the action of earthquakes, the acceleration response decreases, which is in line with the trend of the response spectrum curve.
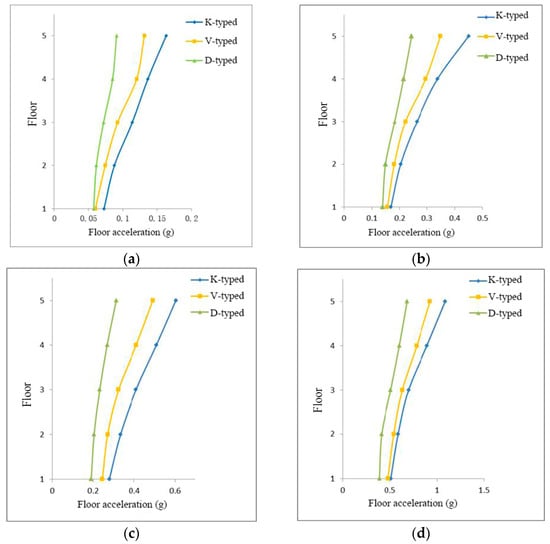
Figure 22.
Analysis results of mean acceleration of each structural floor. (a) Minor earthquake, (b) moderate earthquake, (c) major earthquake, and (d) extreme earthquake.
5.3. Results of Earthquake Loss Assessment
The FEMA P-58 program is used to carry out 500 Monte Carlo analyses of each seismic state. After consultation, the replacement cost of the five-story structural building is set to 4.5 million US dollars, the replacement time is 350 days, and the maximum number of workers per unit area is 0.02 per square meter. The overall loss threshold is 0.5. The occupancy of the building reflects the additional cost of ongoing building operations, equipment, and some of the building features. The building model designed in this paper is an office building. For office buildings, the adjustment coefficient can be 1.0 when unoccupied and 1.2 when occupied. The three structures designed in this paper are all five-story office buildings, and the default population flow model provided in PACT is selected. The default value is the peak population density of 4 people/1000 sf, and the difference value of the model distribution is 0.2.
In this paper, a single collapse mode was selected. If the building collapses, then the probability of collapse is 1, and the mortality and injury rates of the population take the default values of 0.9 and 0.1.
After entering the various parameters of the structure into PACT, you can click the Evaluate Performance of the PACT panel for calculation, and finally, view the results of seismic loss in Examine Results.
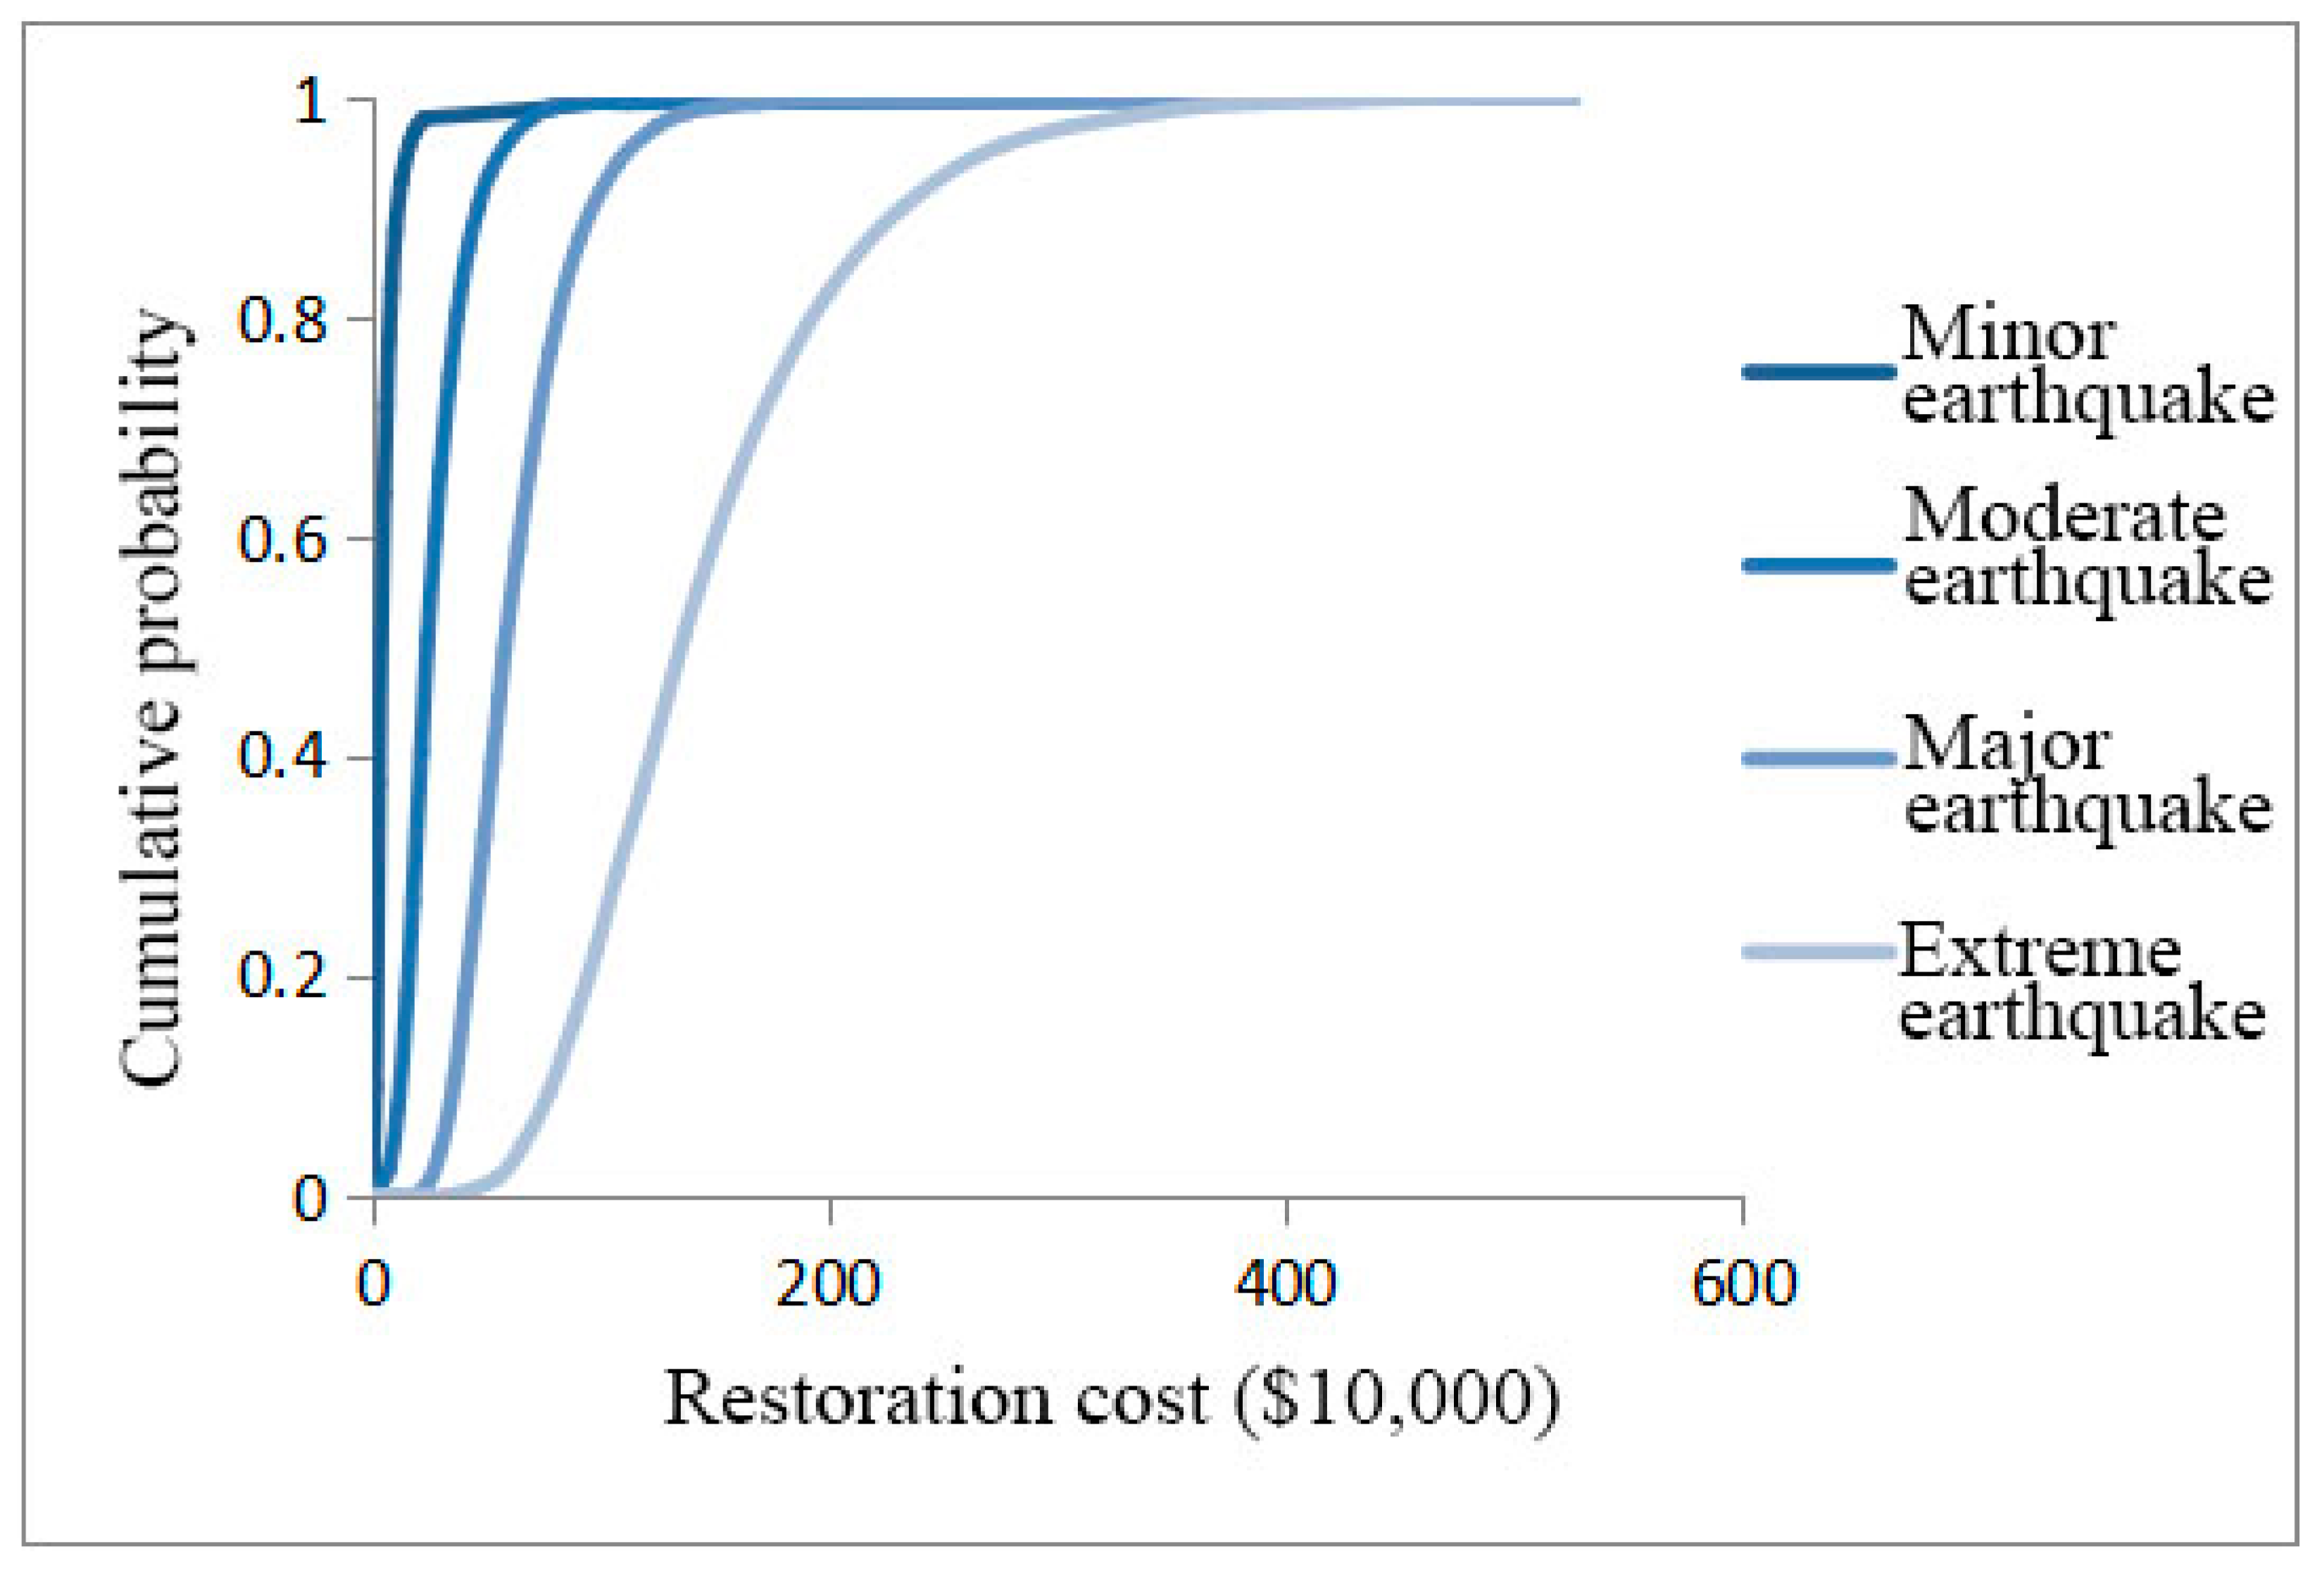
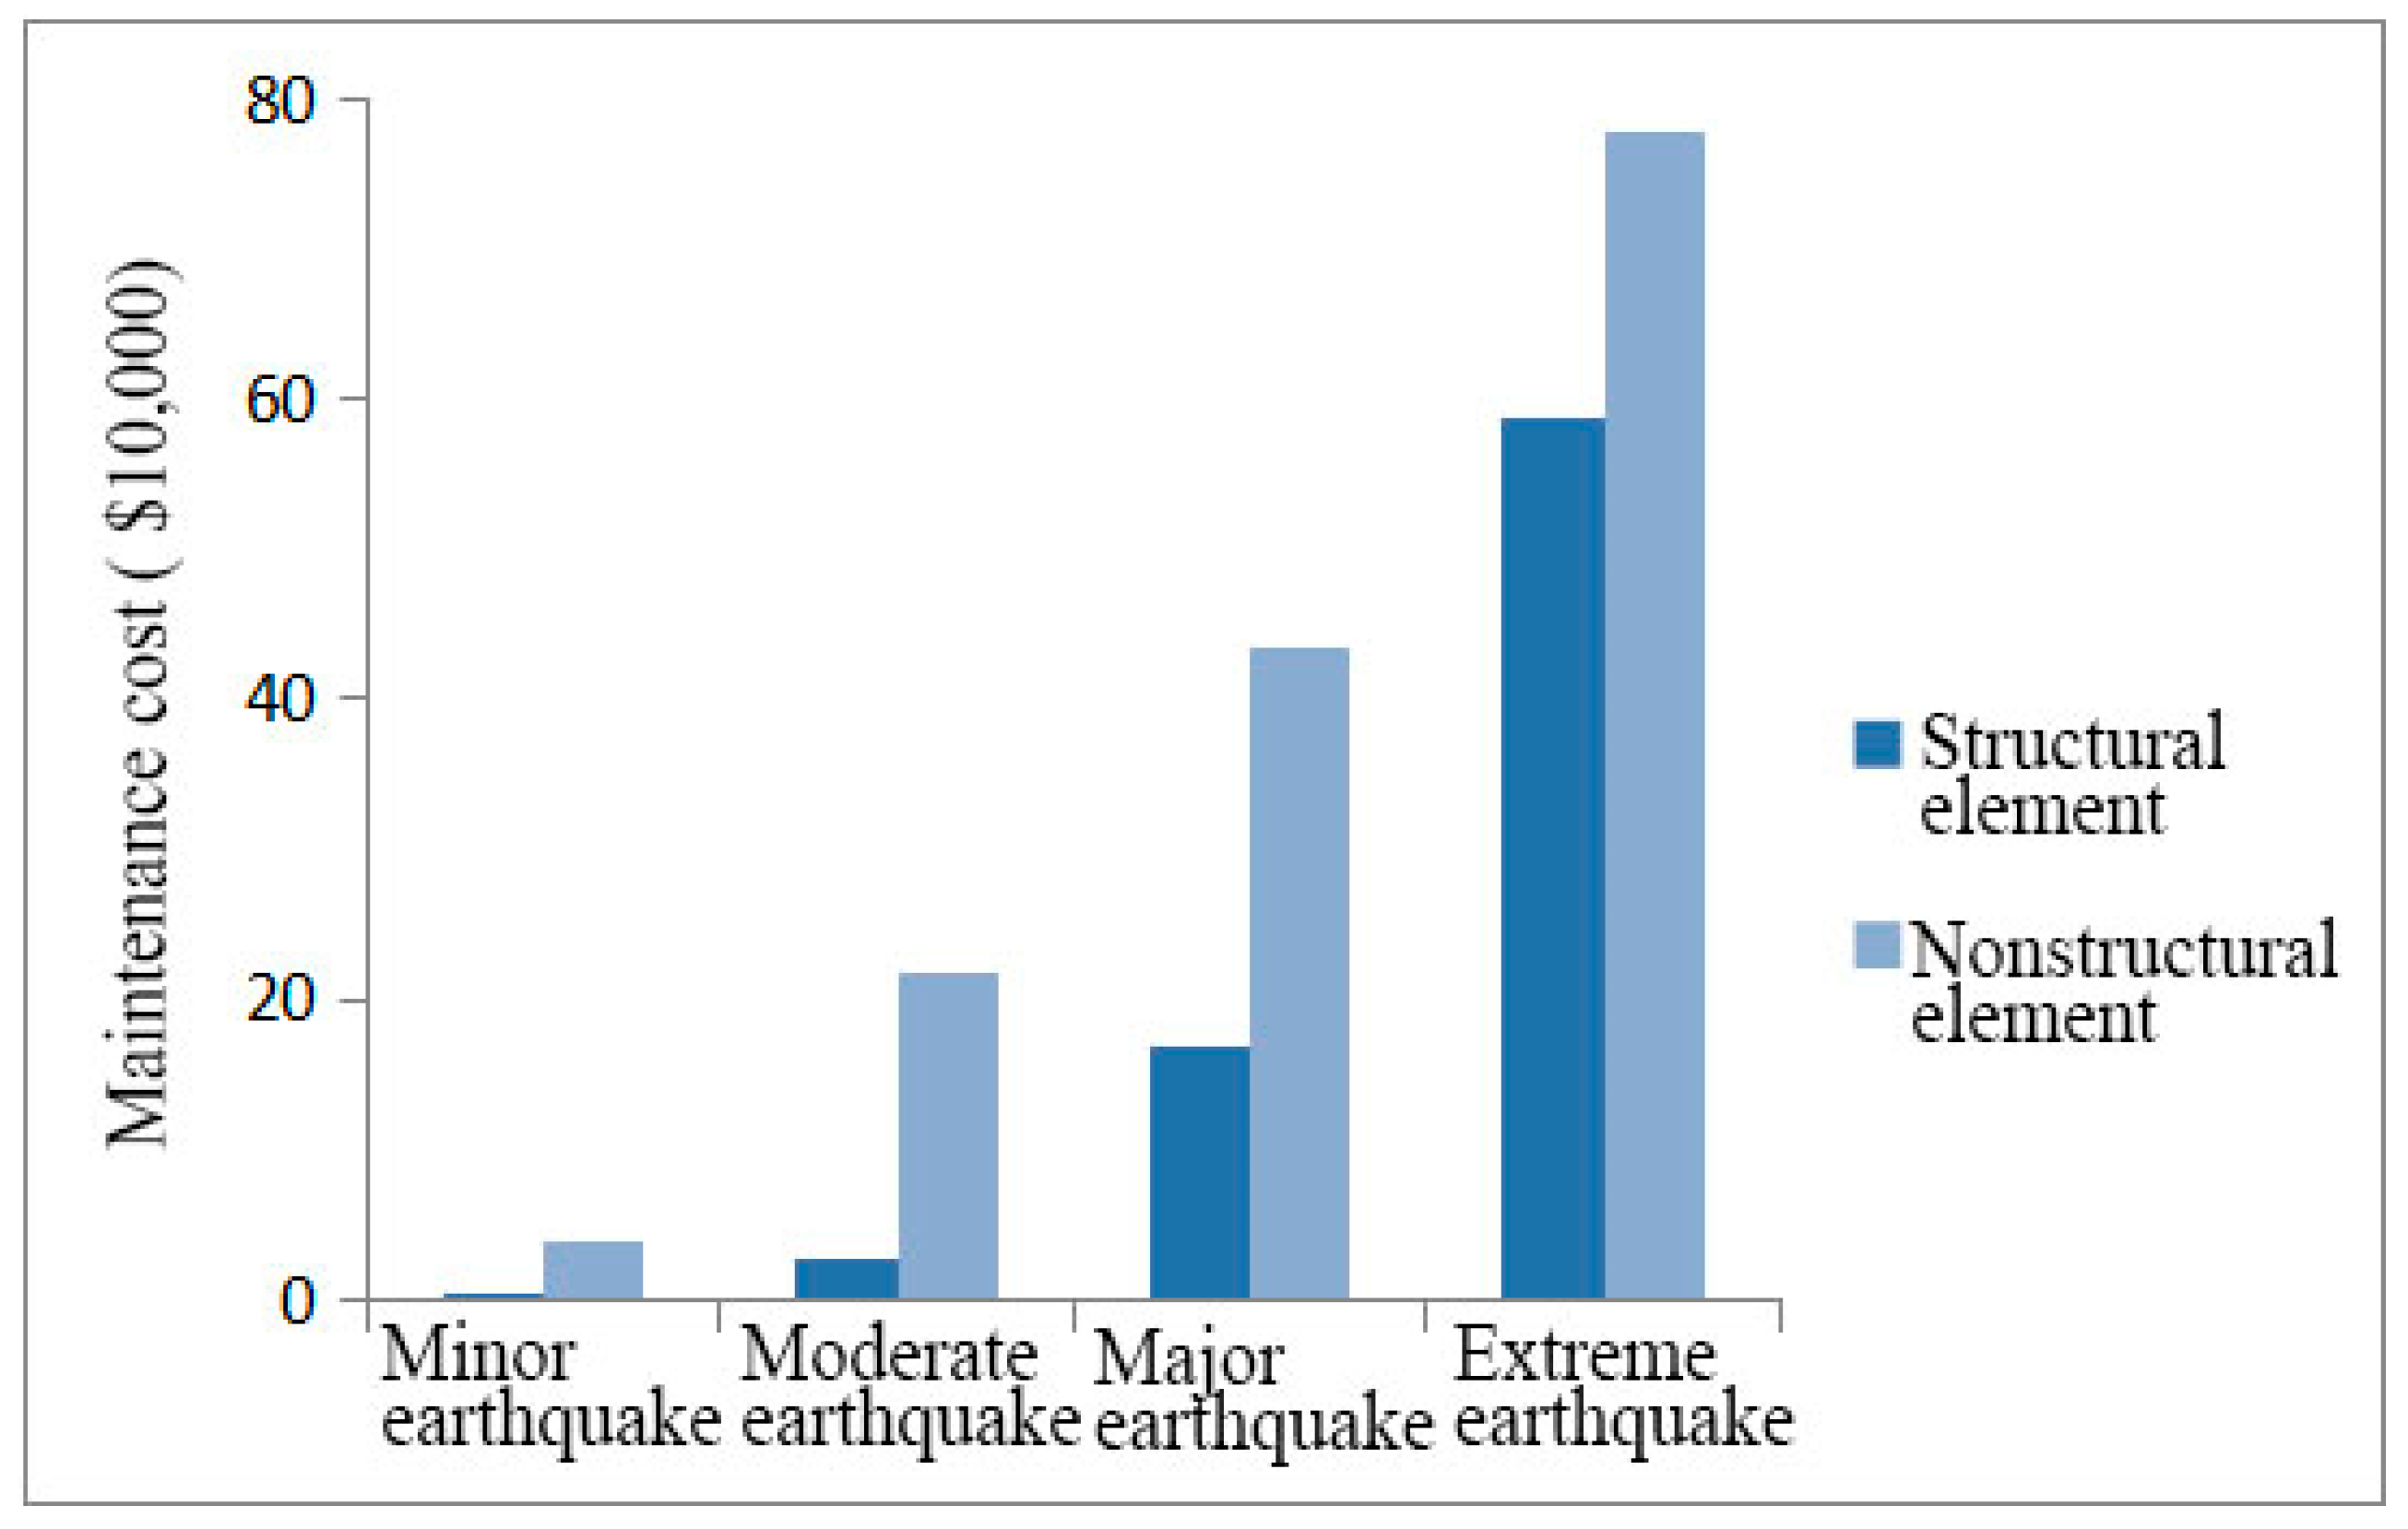
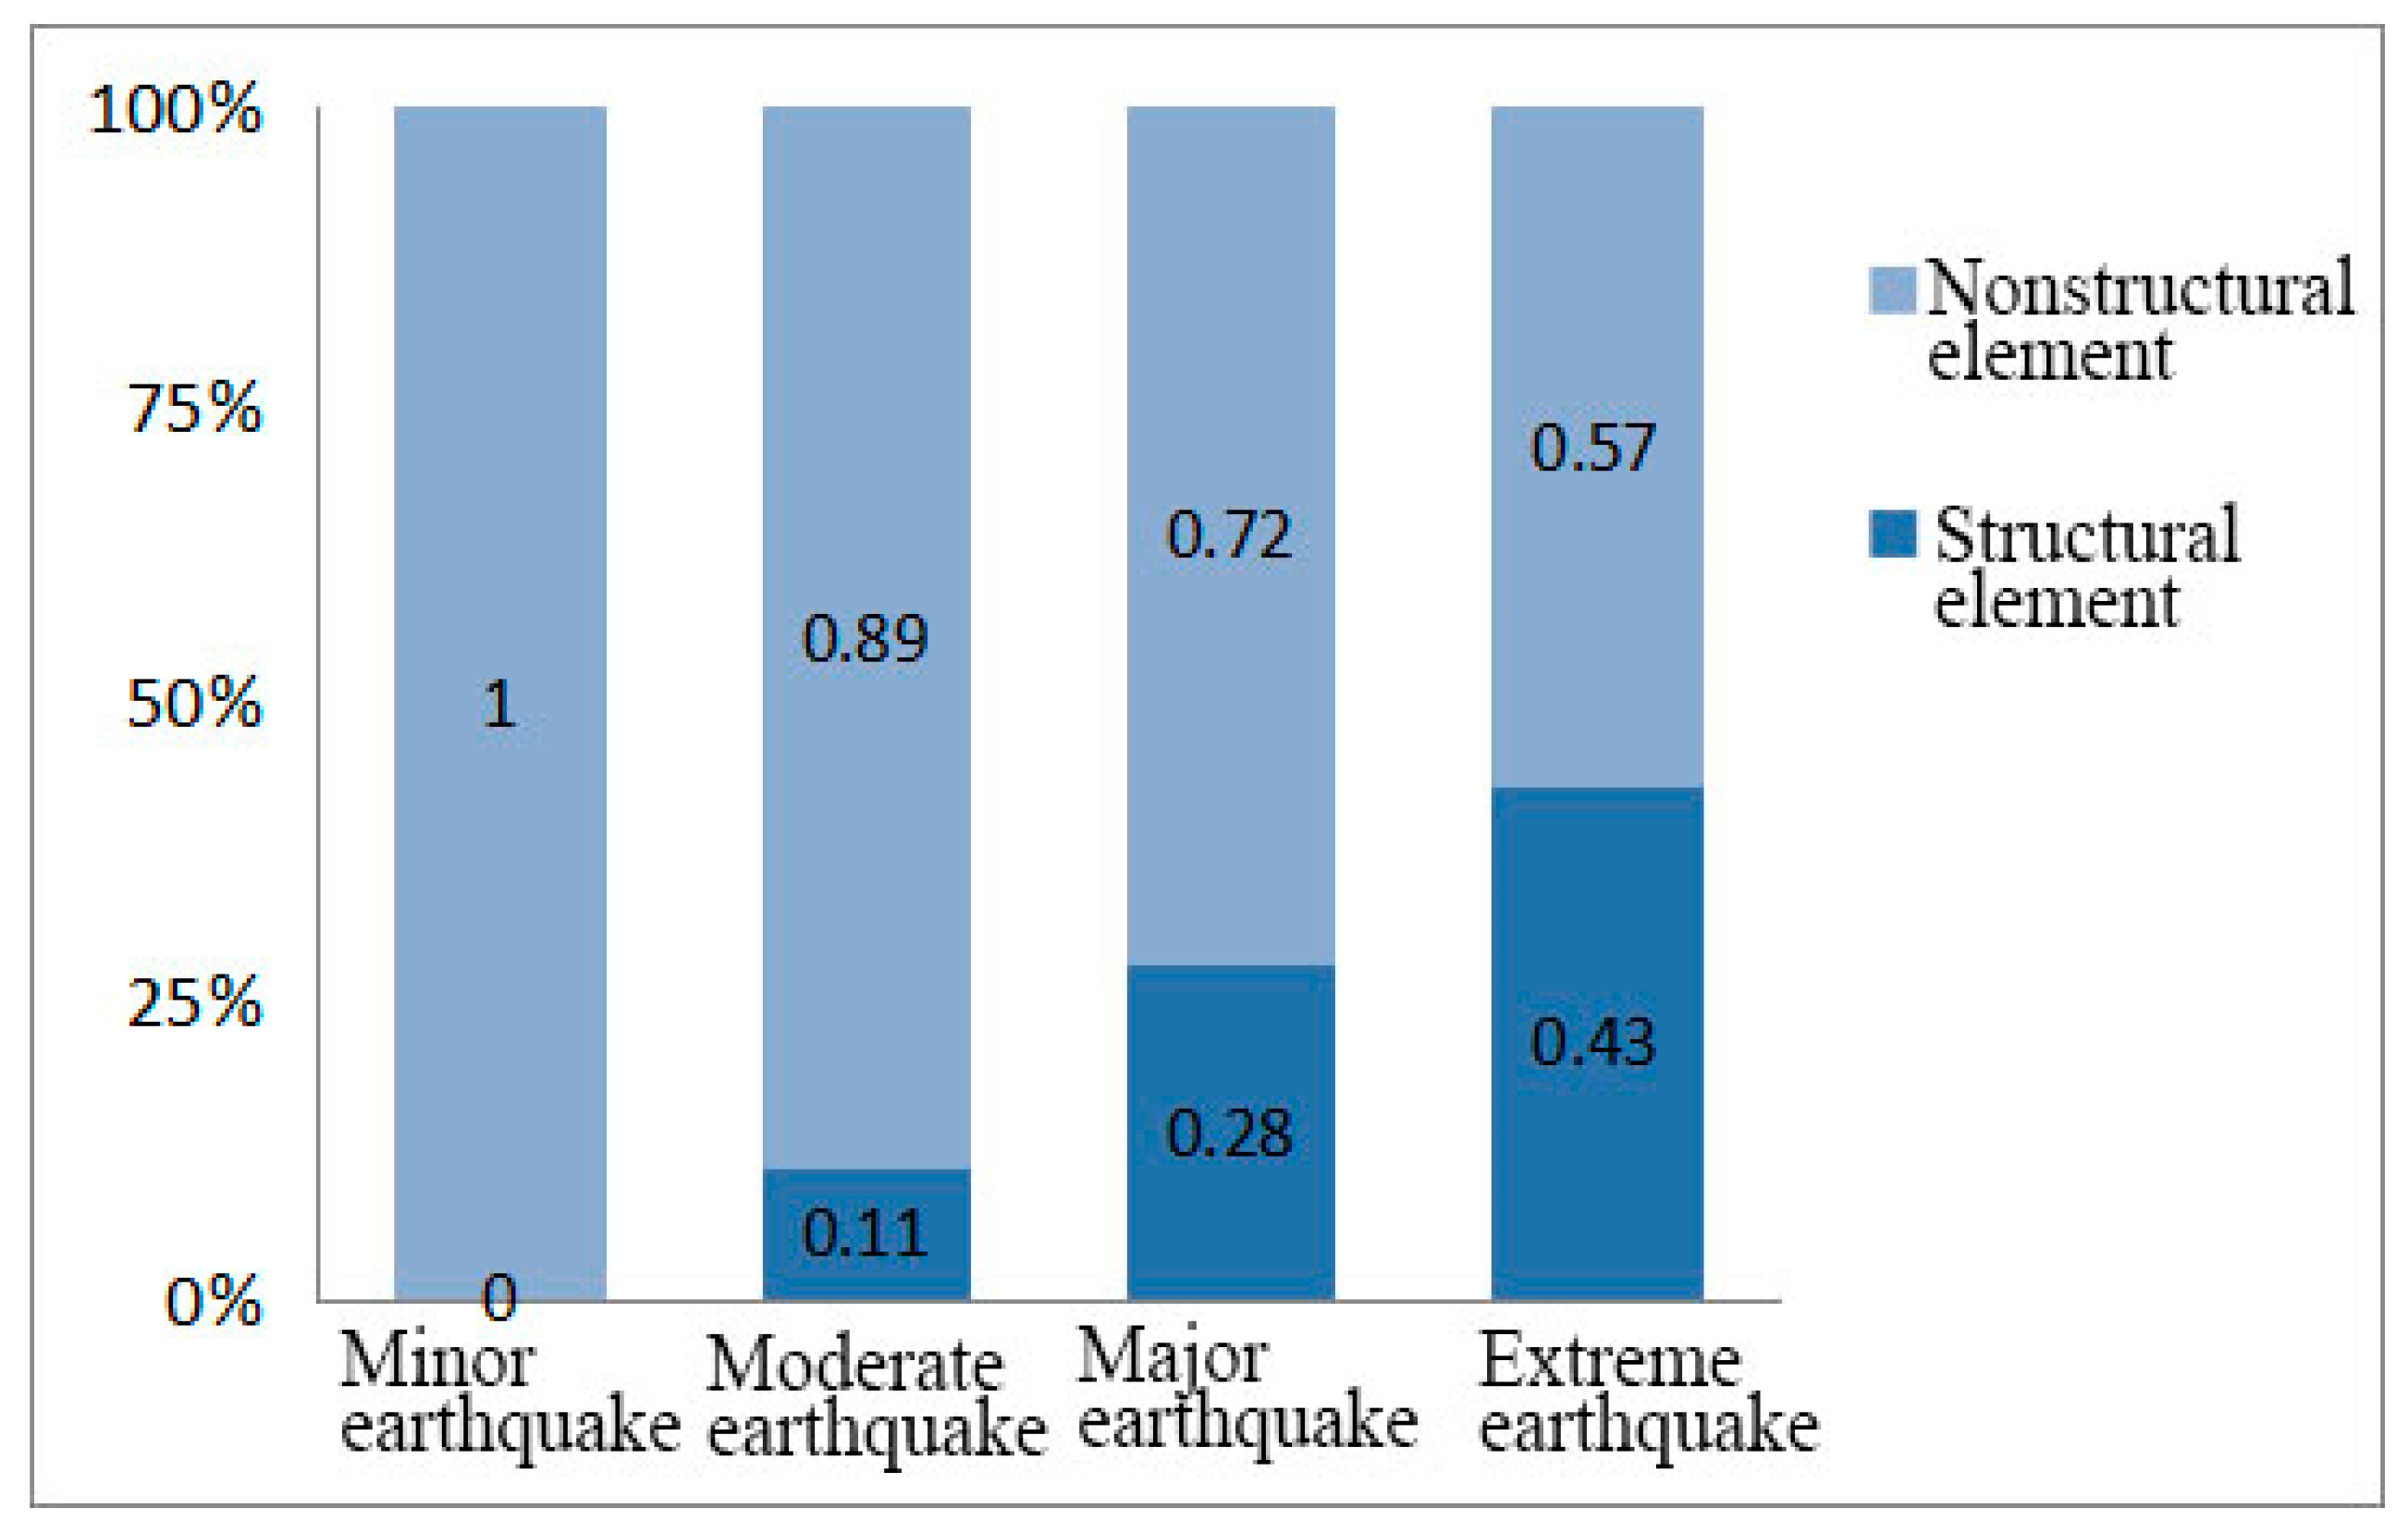
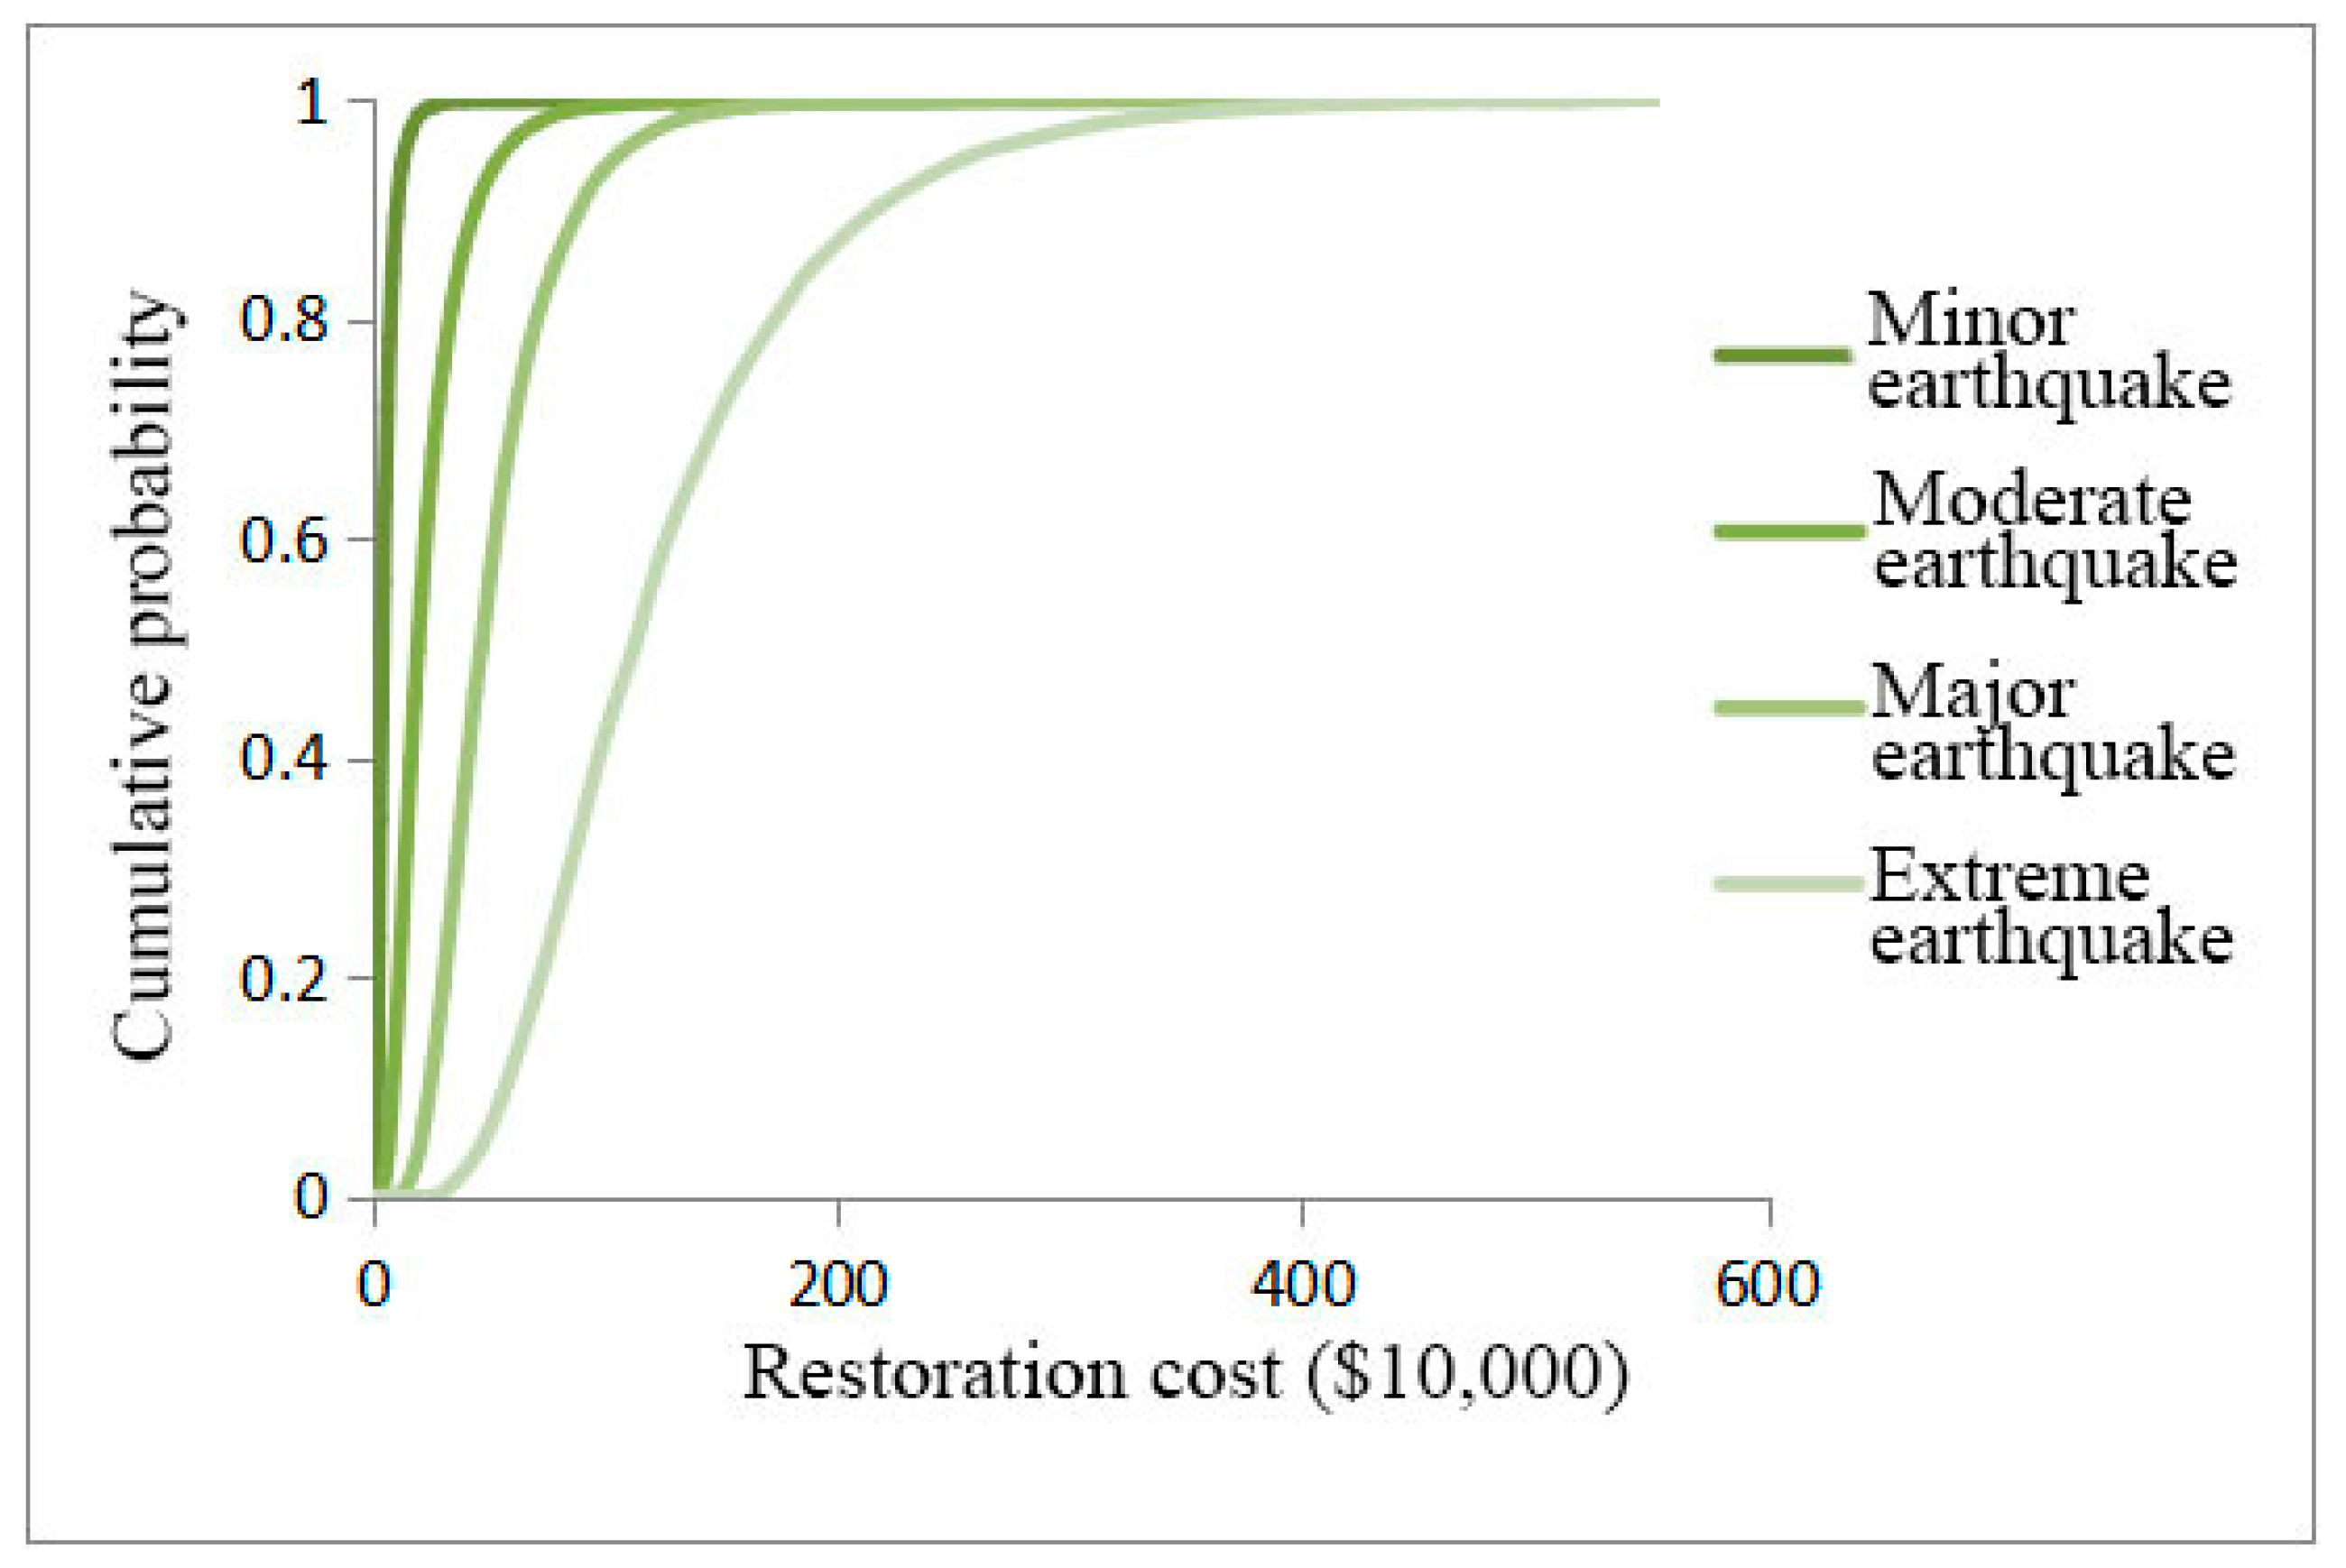
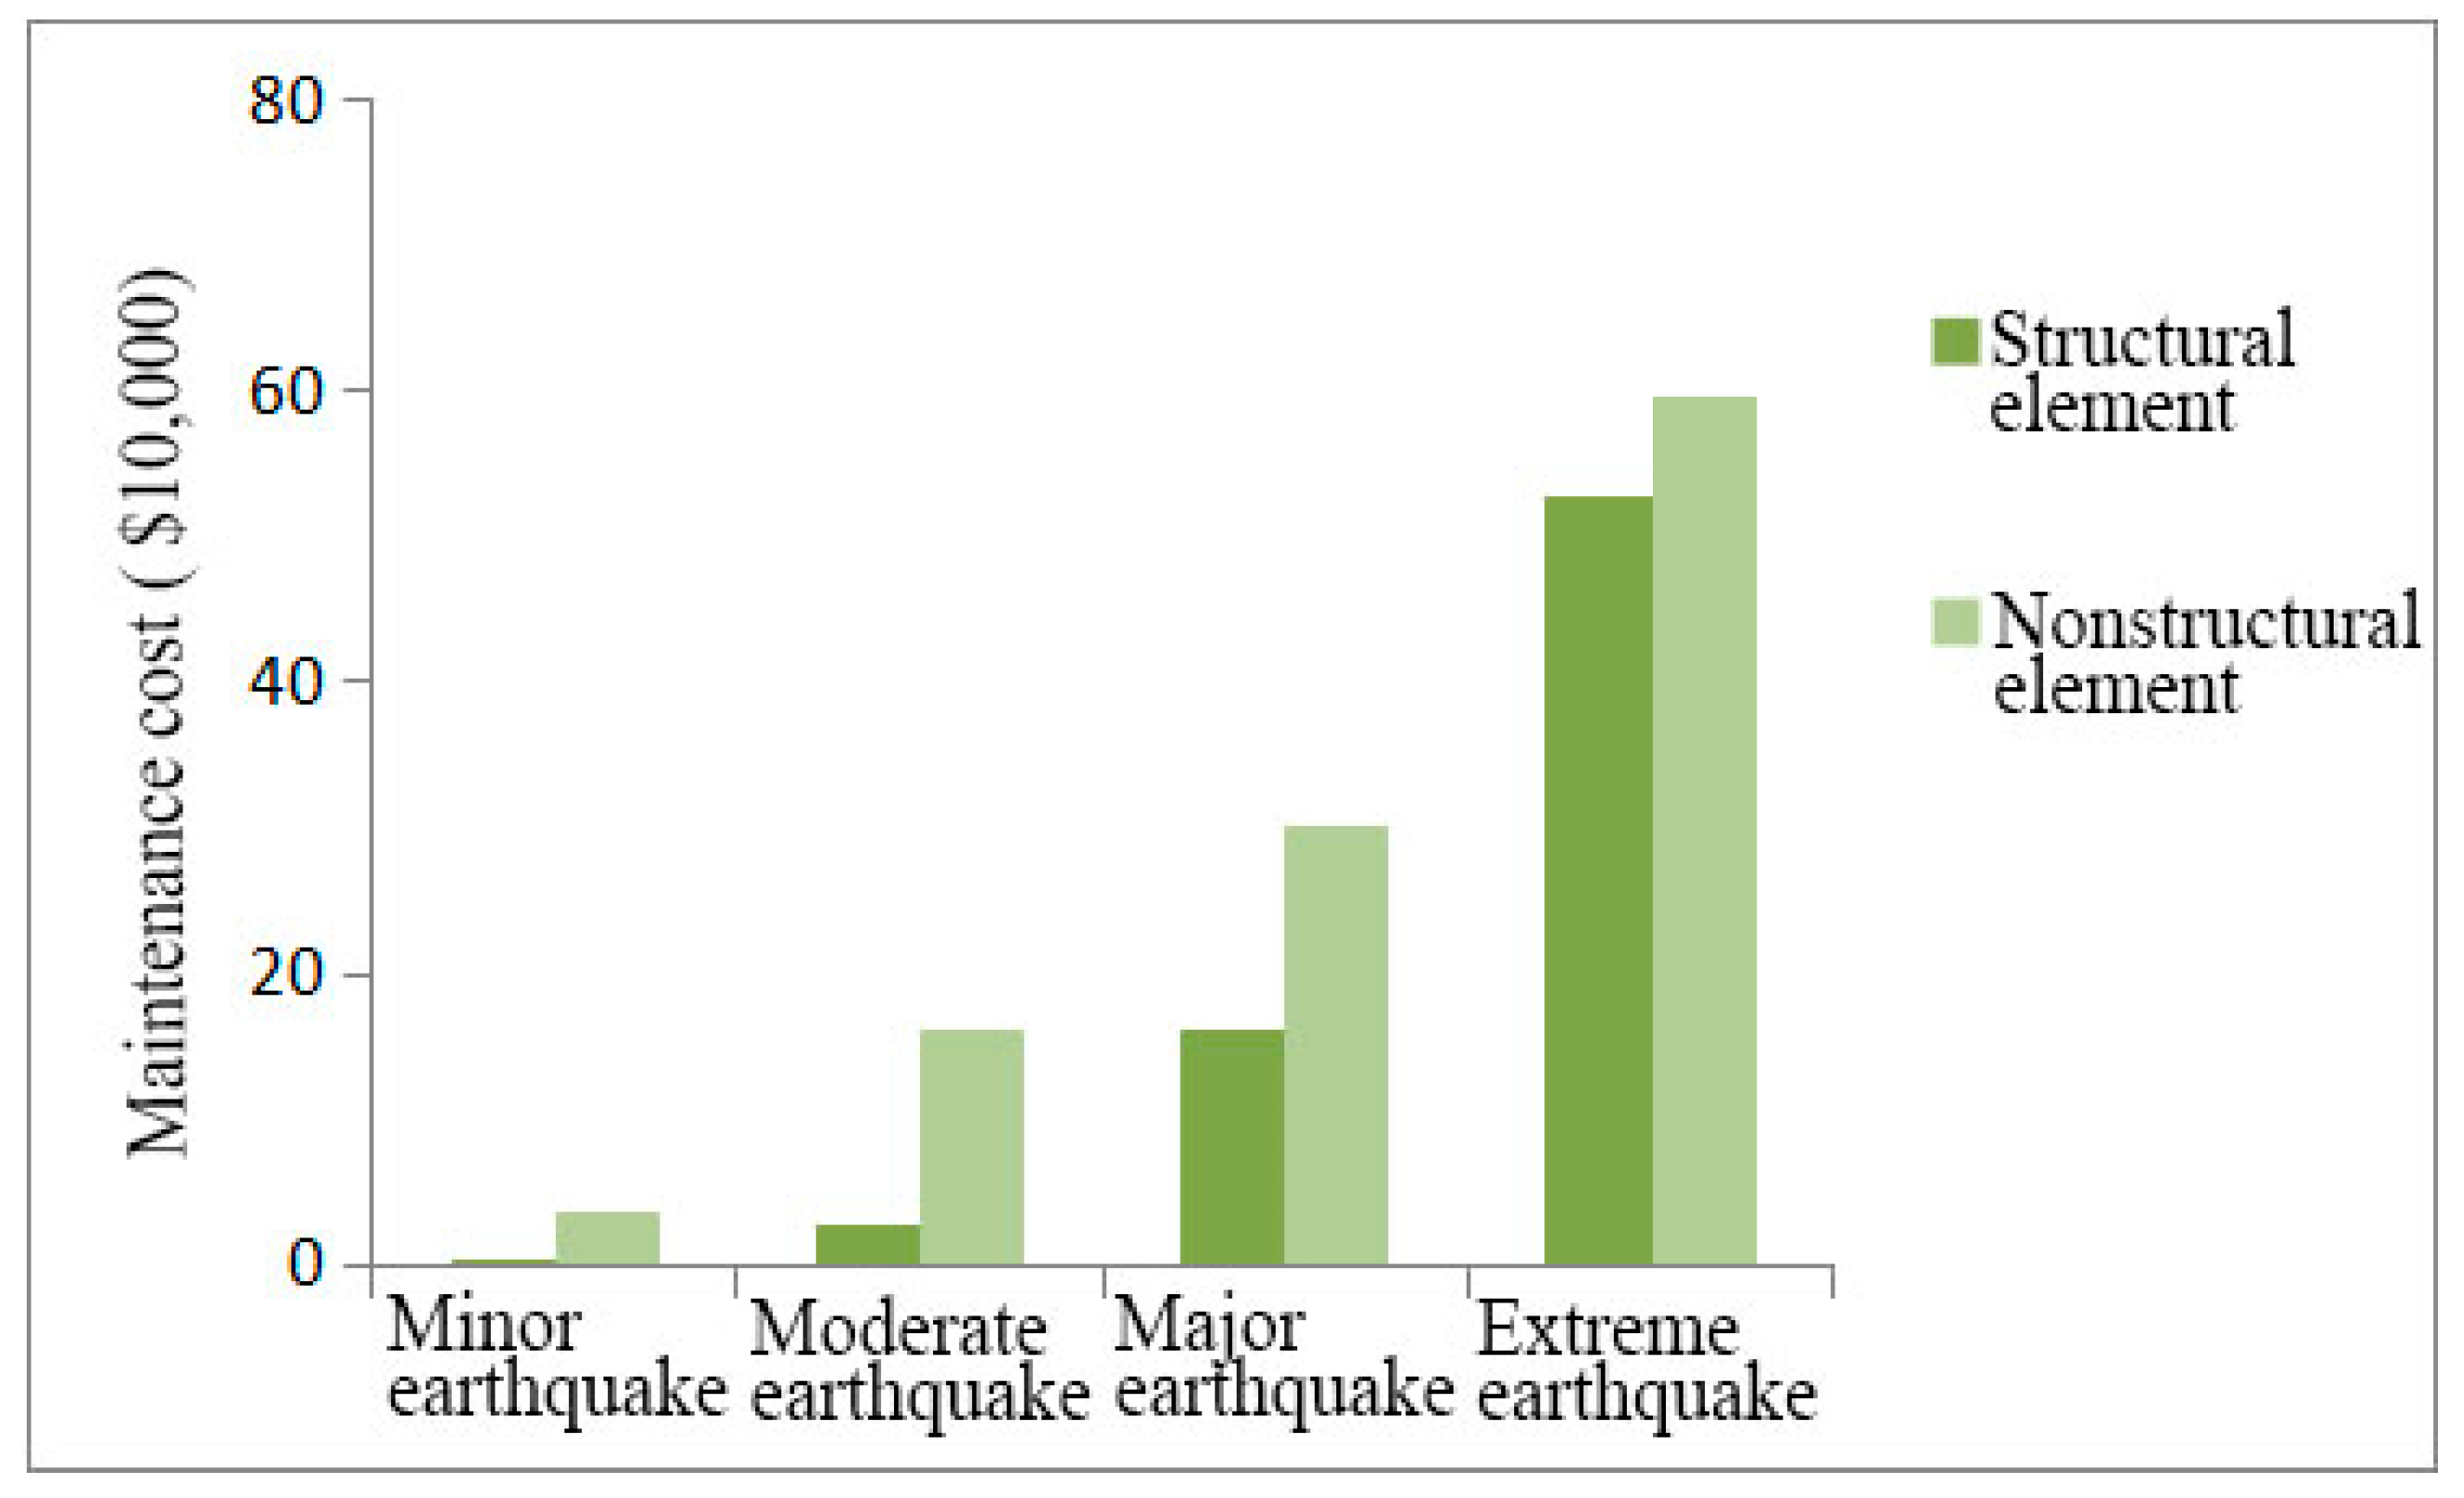
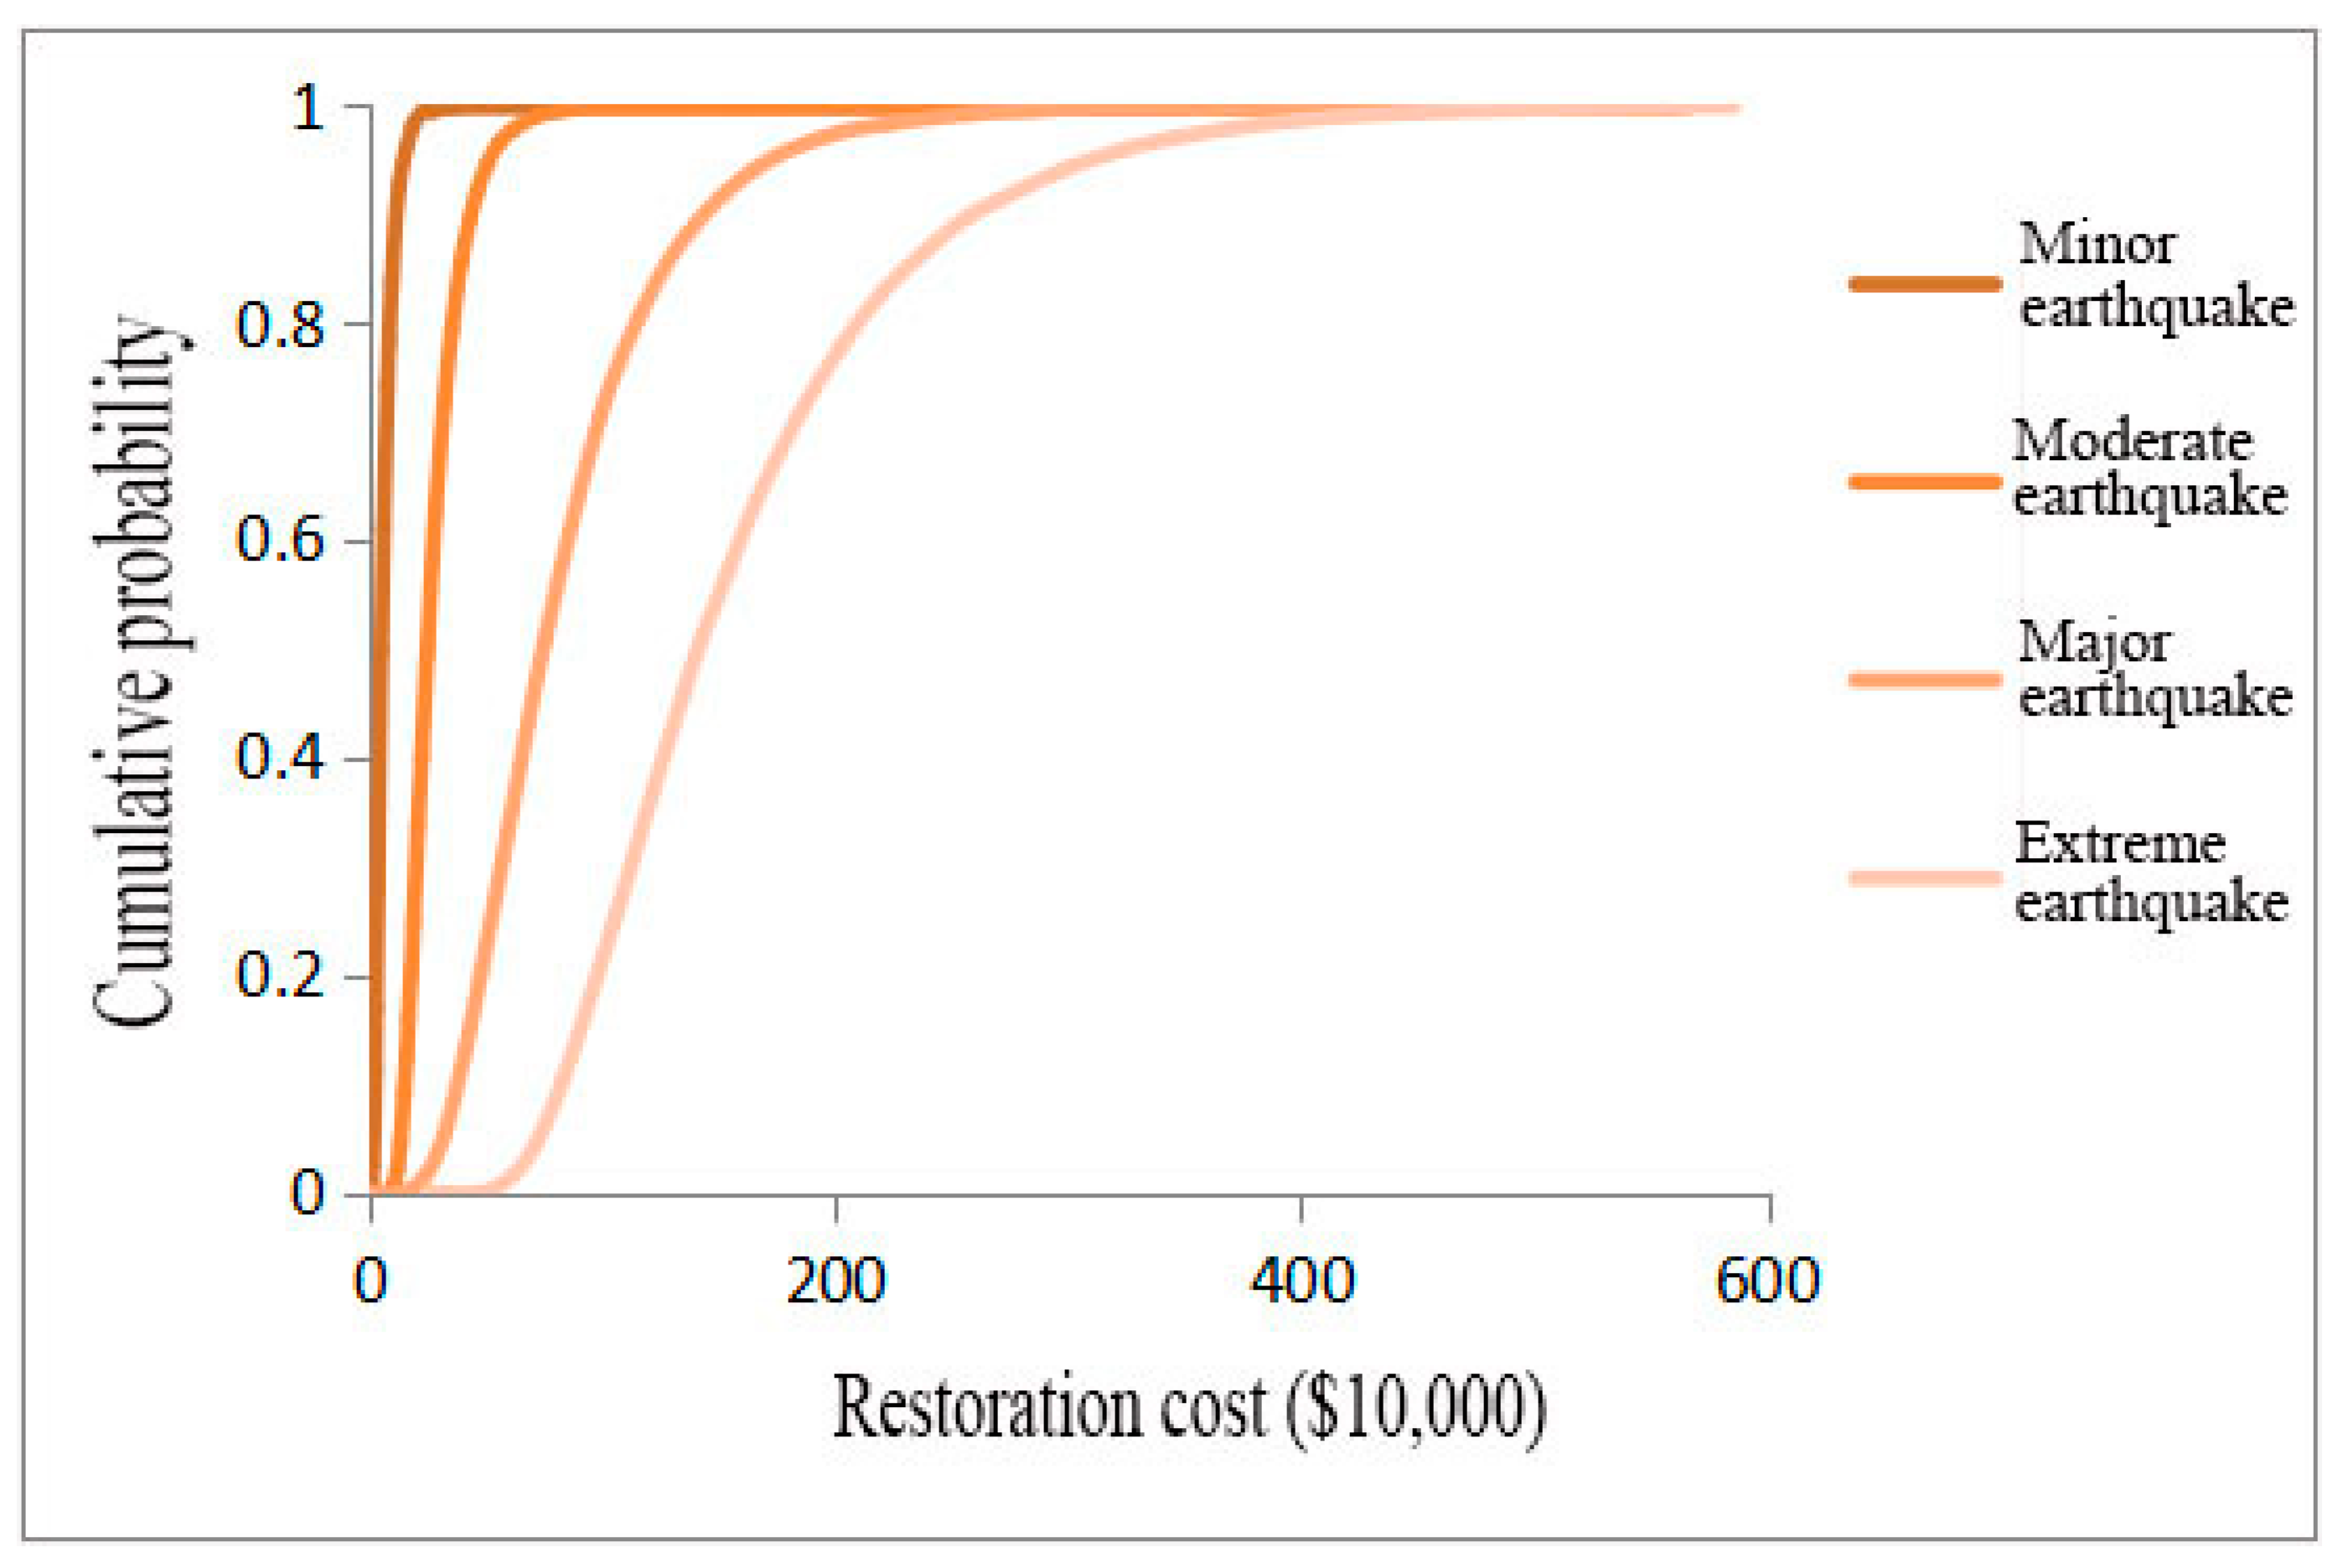
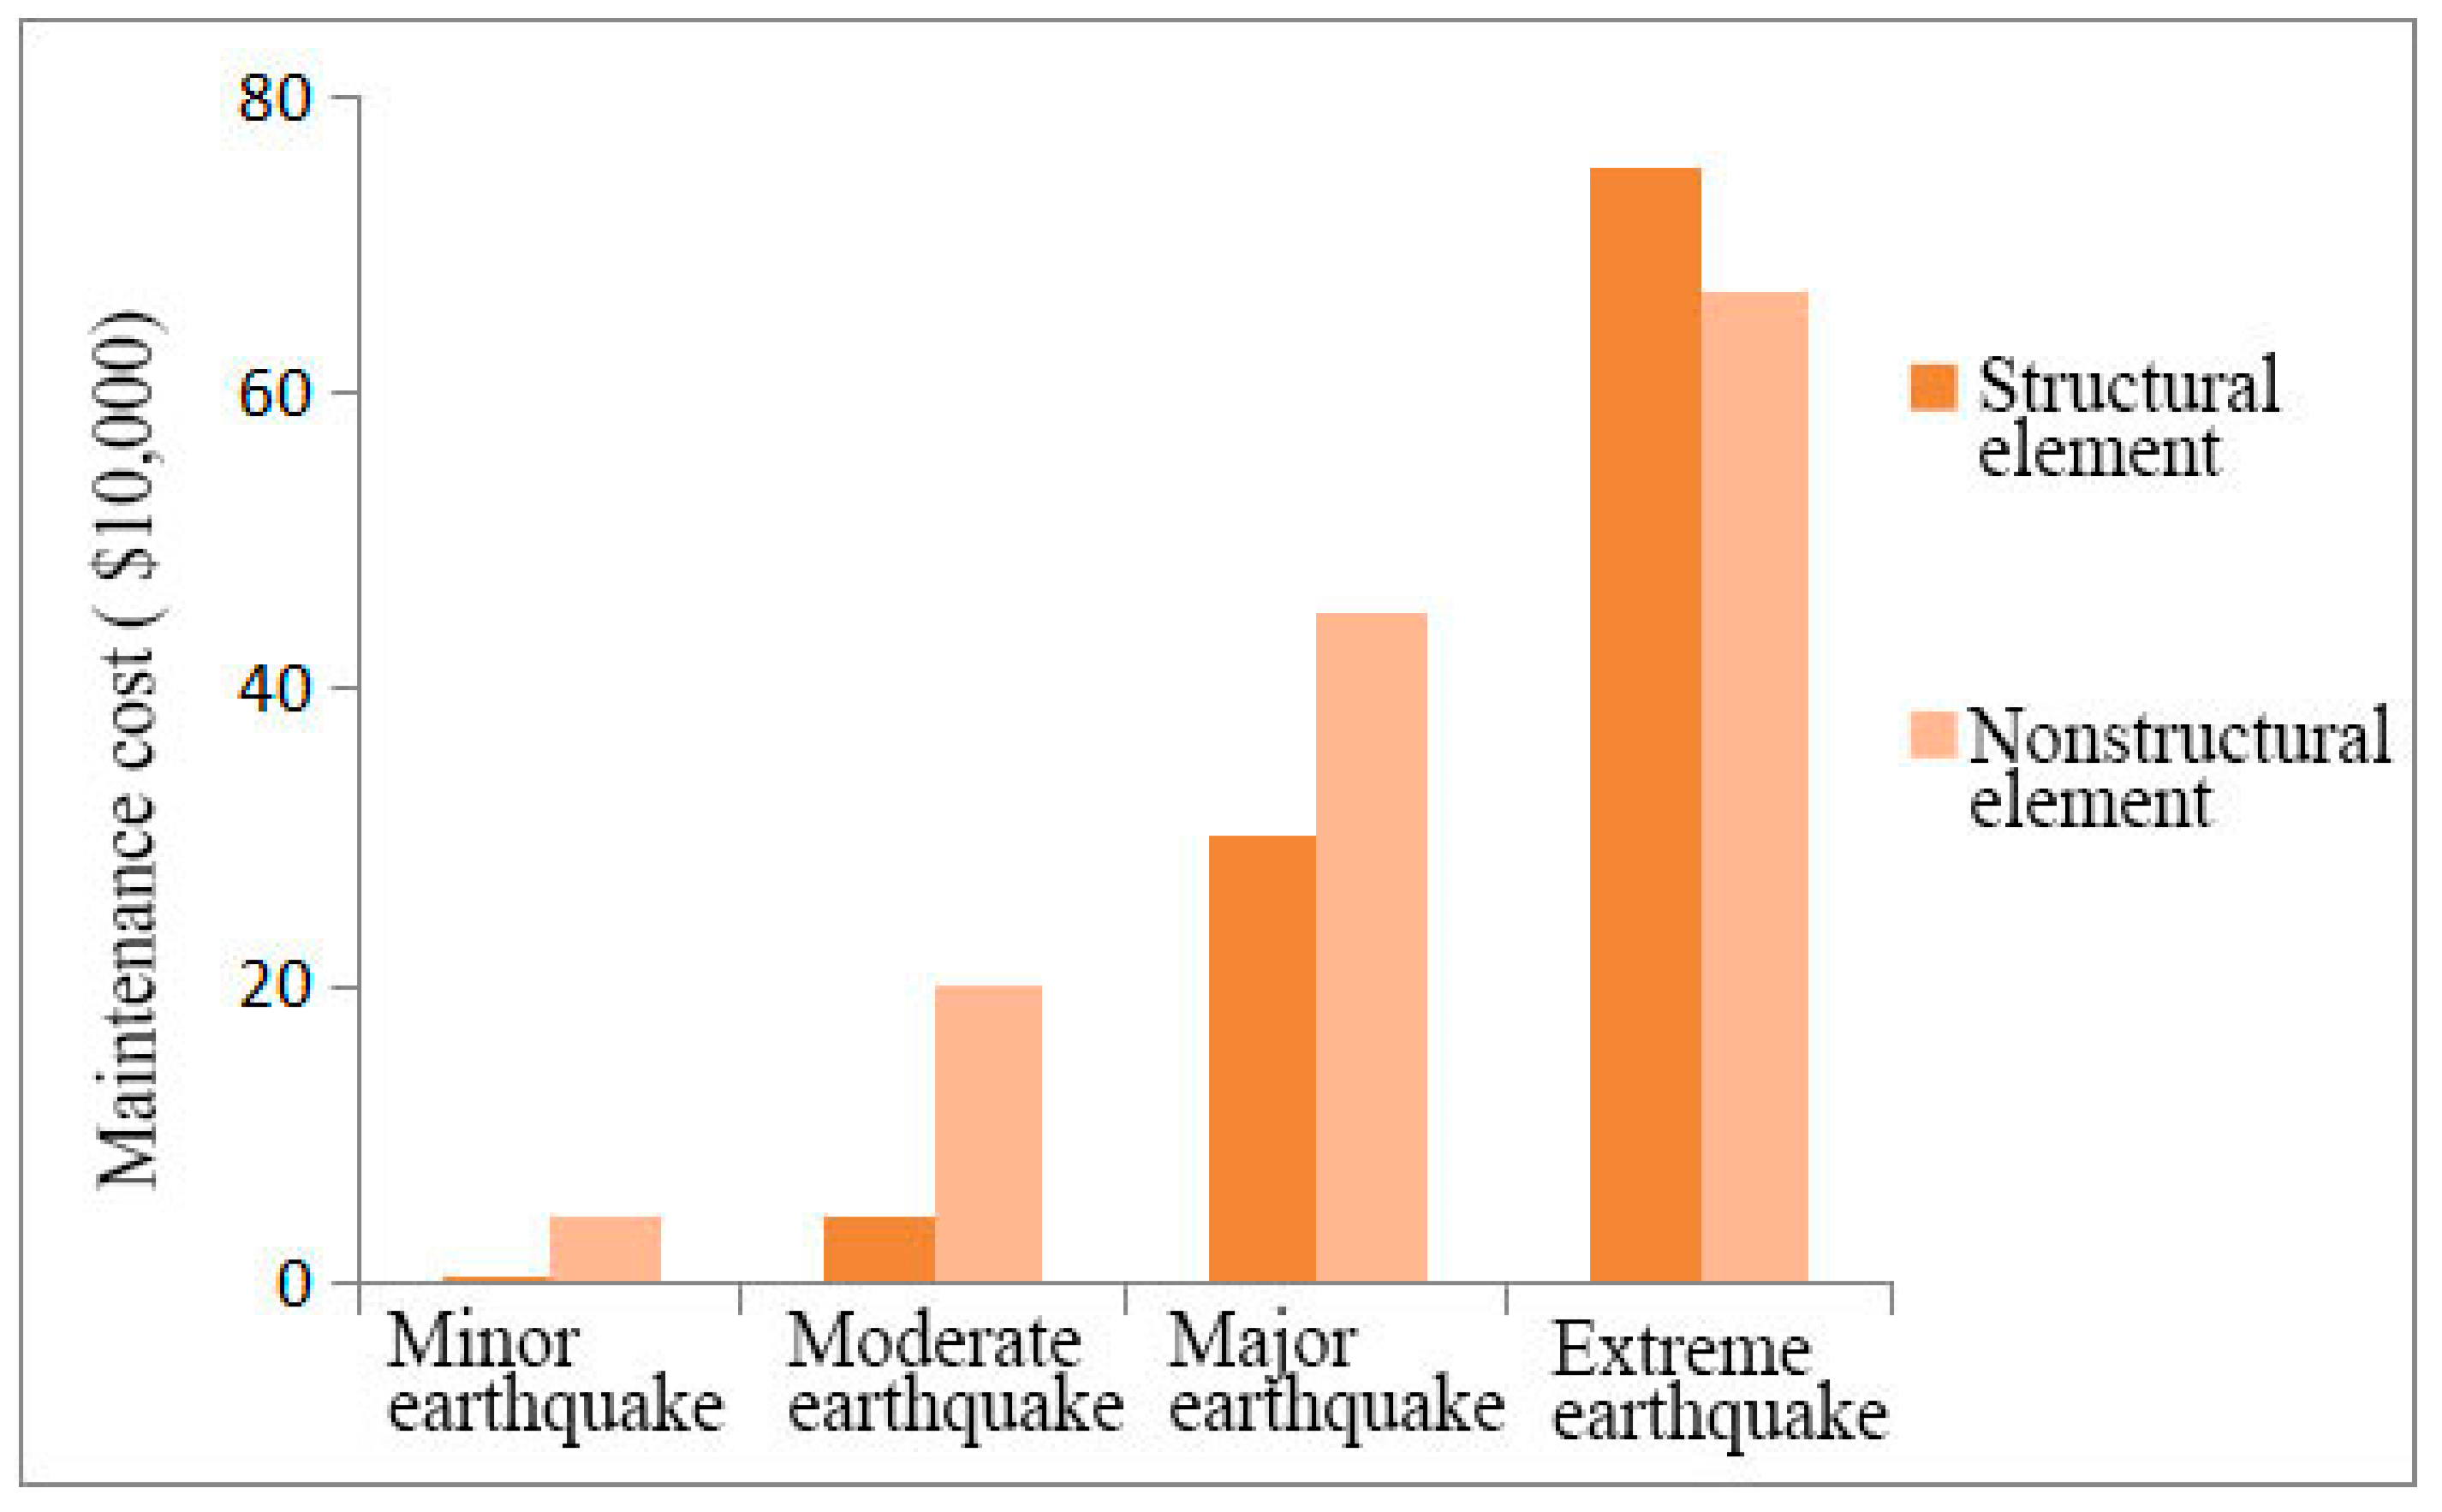
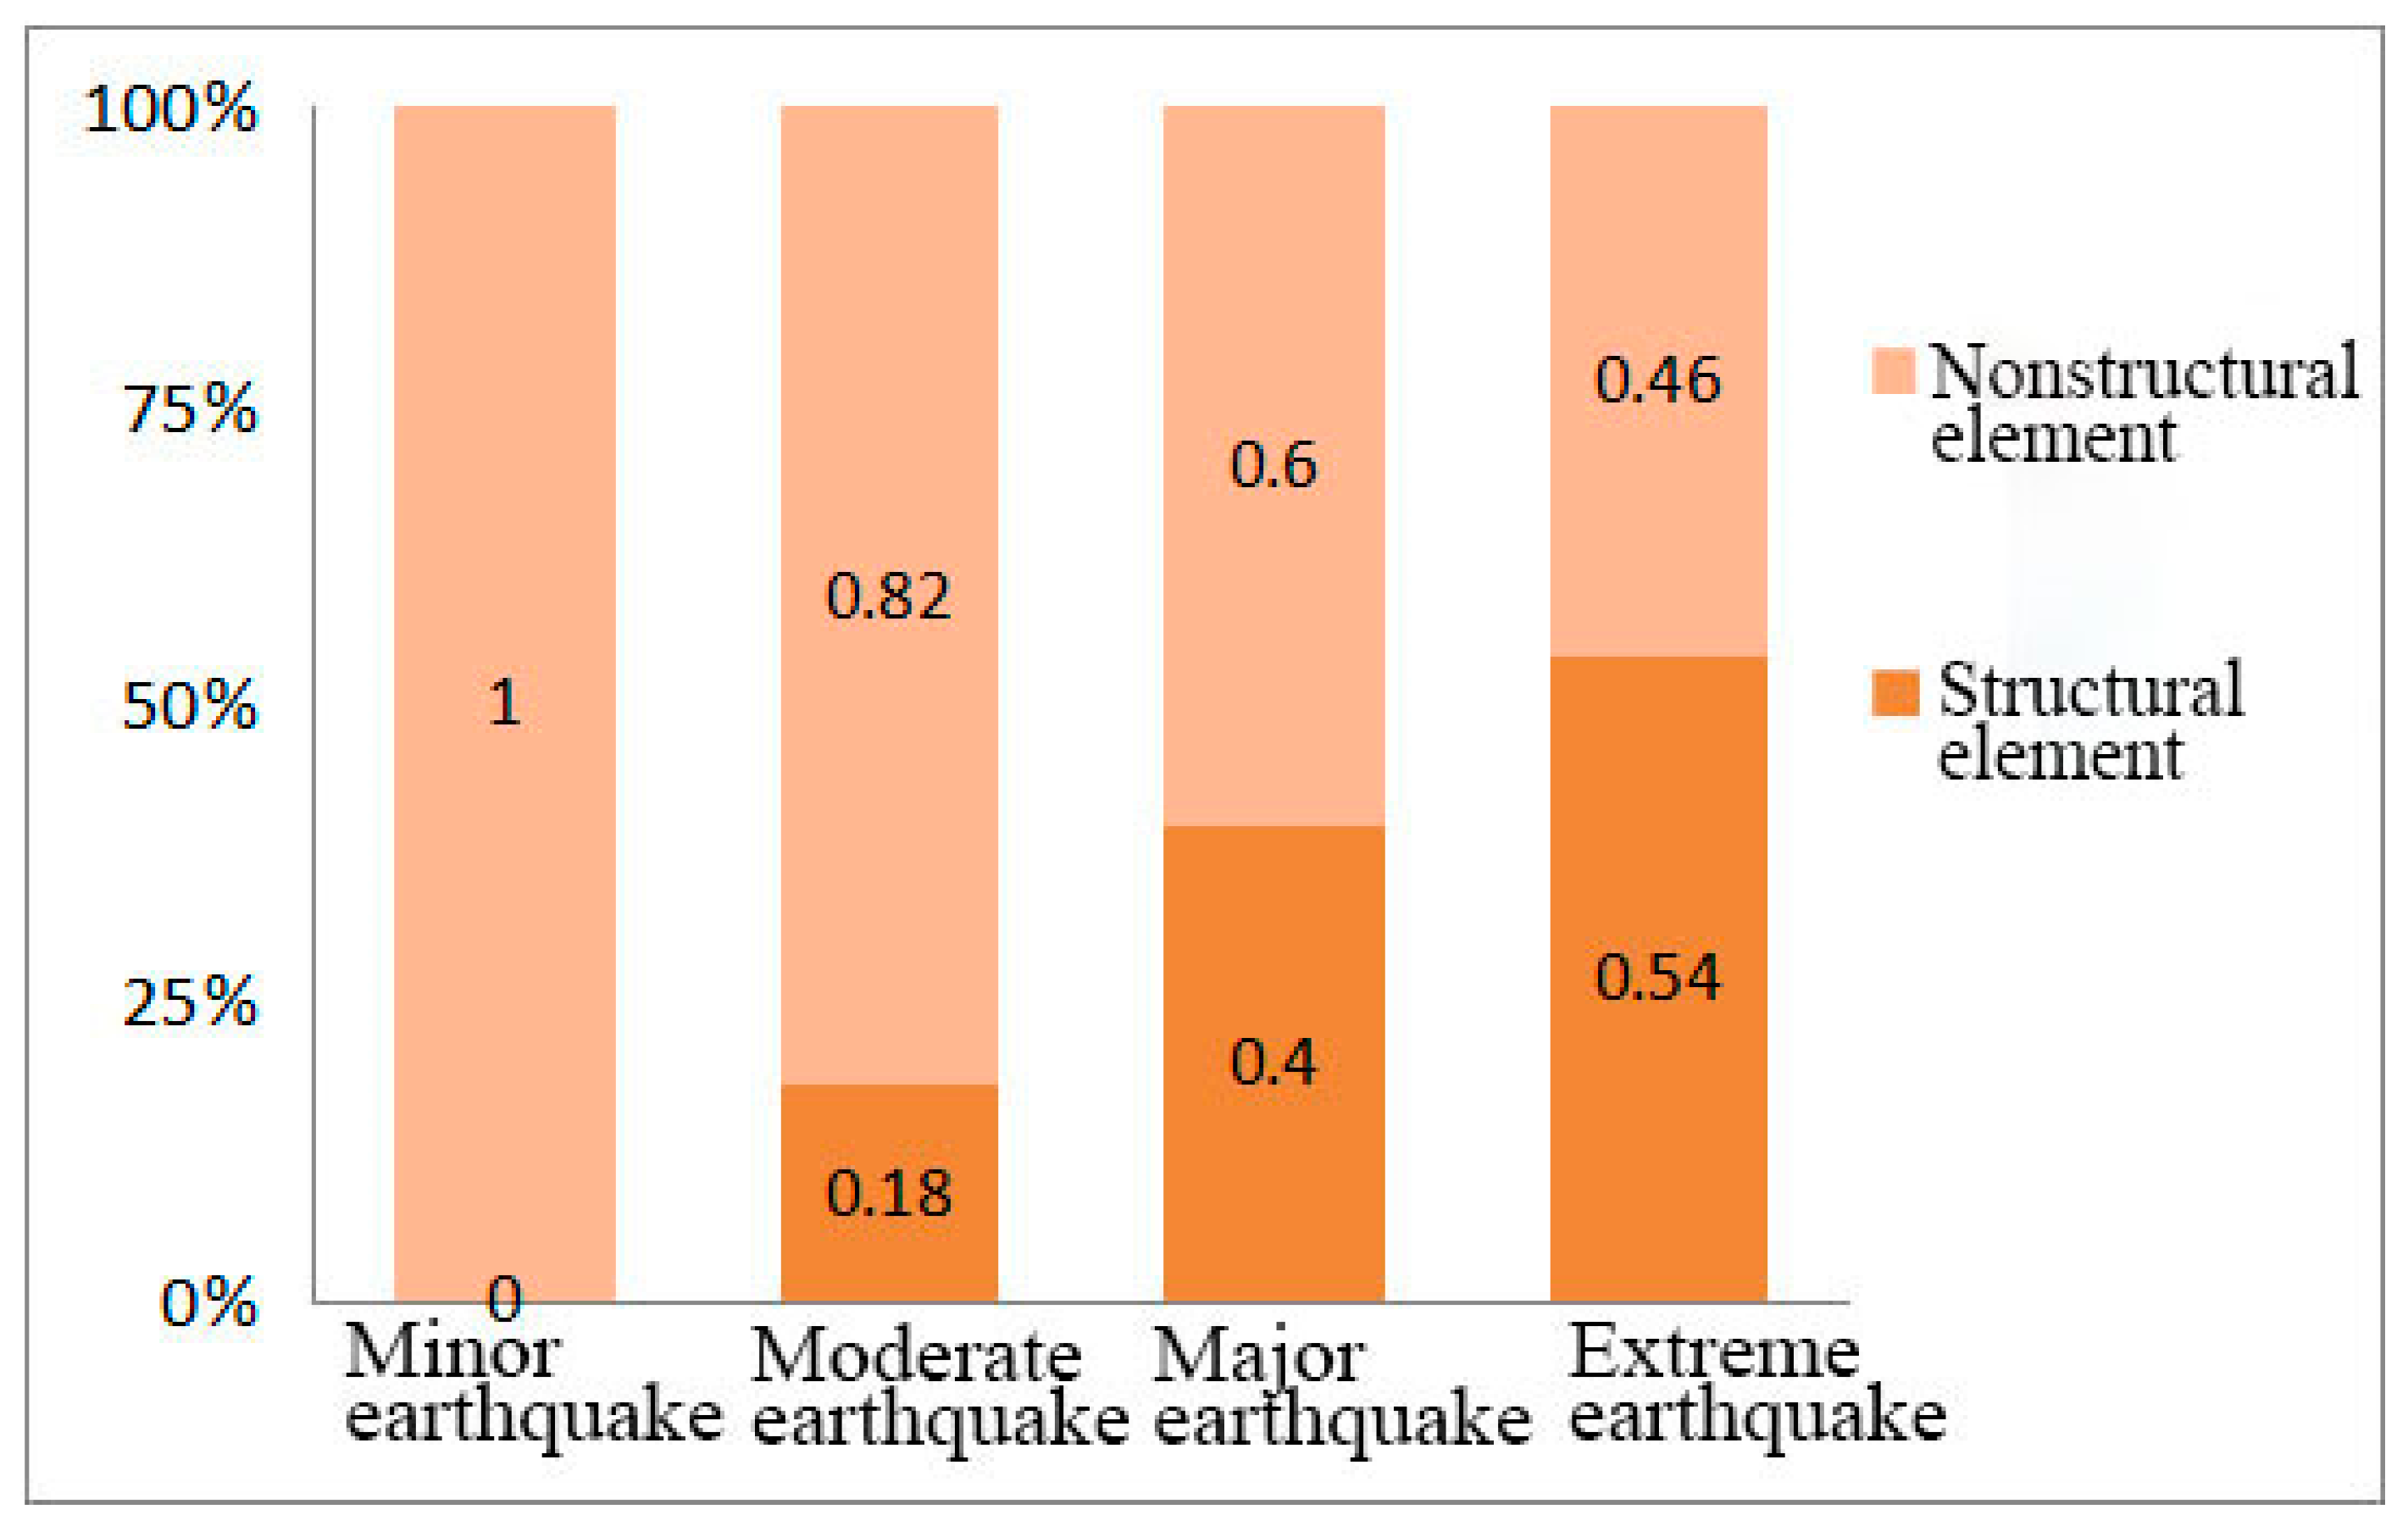
The repair cost distribution curve from the PACT analysis is checked (see the median cost of structural maintenance and statistics in Figure 23, Figure 24, Figure 25, Figure 26, Figure 27, Figure 28, Figure 29, Figure 30 and Figure 31). From Figure 23, Figure 24 and Figure 25, the median repair costs of K-shaped eccentrically braced structures under small, moderate, large, and maximum earthquakes are 3.98, 24.39, 58.01, and 136.46 ten thousand dollars, respectively. The expenses of repairing structural members and non-structural components during significant earthquakes are 16.82 and 43.51 ten thousand dollars, respectively. These amounts represent 28% and 75% of the overall maintenance expenditures.
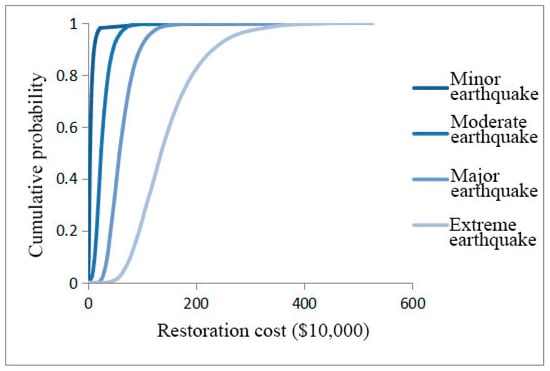
Figure 23.
Probability distribution of repair costs of K-shaped eccentrically braced structures.
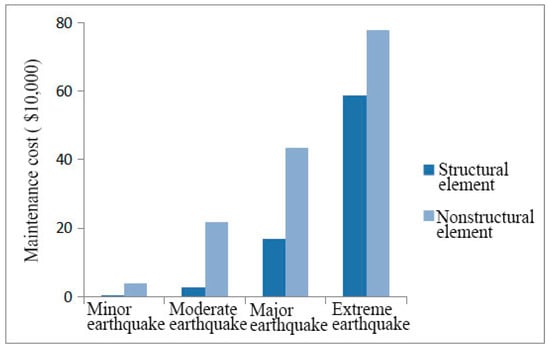
Figure 24.
Distribution of repair costs of components of K-shaped eccentrically braced structures.

Figure 25.
Proportion of repair costs of various components of K-shaped eccentrically braced structure.
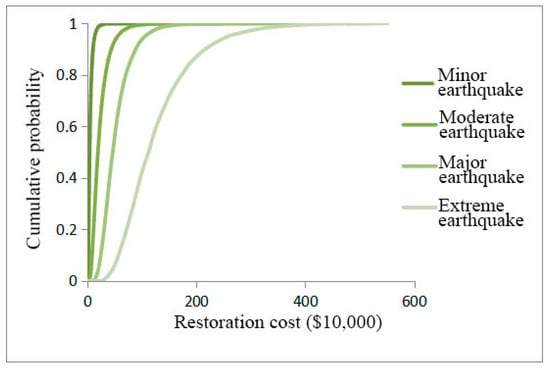
Figure 26.
Probability distribution of repair costs of V-shaped eccentrically braced structures.
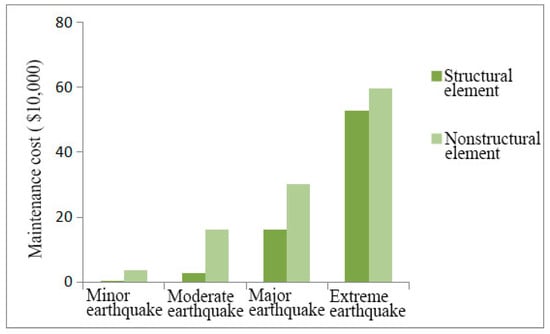
Figure 27.
Distribution of repair costs of components of V-shaped eccentrically braced structures.
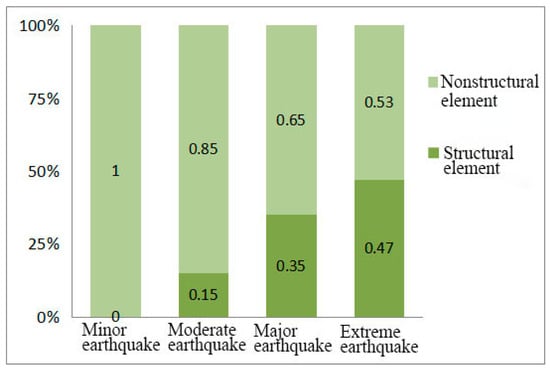
Figure 28.
Proportion of repair costs of various components of V-shaped eccentrically braced structures.

Figure 29.
Probability distribution of repair costs of D-shaped eccentrically braced structures.
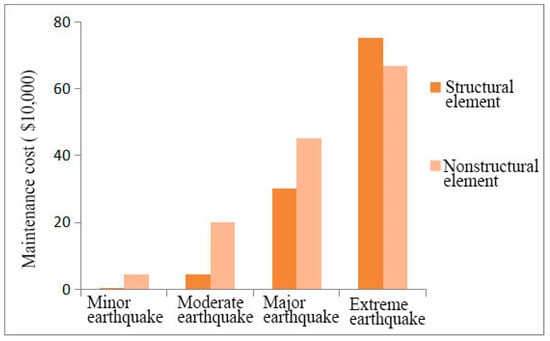
Figure 30.
Distribution of repair costs of components of D-shaped eccentrically braced structures.

Figure 31.
Proportion of repair costs of various components of D-shaped eccentrically braced structures.
From Figure 26, Figure 27 and Figure 28, the median repair costs of V-shaped eccentrically braced structures under small, moderate, large, and maximum earthquakes are 3.81, 19.03, 46.49, and 112.29 ten thousand dollars, respectively. Under major earthquakes, the repair costs of structural and non-structural components are 16.27 and 30.22 ten thousand dollars, accounting for 35% and 65% of the total maintenance costs, respectively.
From Figure 29, Figure 30 and Figure 31, the median repair costs of V-shaped eccentrically braced structures under small, moderate, large, and maximum earthquakes are 4.90, 24.63, 75.18, and 141.95 ten thousand dollars, respectively. Structural and non-structural component repair costs during major earthquakes are 30.07 and 45.11 ten thousand dollars, representing 40% and 60% of the overall maintenance expenses, respectively.
According to the above earthquake loss results of maintenance costs, it can be found that the loss of V-shaped eccentrically braced structures is the smallest under the four earthquake intensities. Although, according to the results of the vulnerability analysis, the anti-collapse performance of the K-shaped eccentric brace is the best, but the vulnerability only takes the inter-story drift angles as the index. The loss is not only related to the inter-story displacement angle, but also to the floor acceleration, because non-structural components such as ceilings, elevators, and various pipelines take acceleration as the demand parameter and are acceleration-sensitive components. The central parts of the V-shaped eccentric brace are the angles of acceleration and inter-story drift. Generally speaking, the seismic loss of the V-shaped eccentric brace is the smallest. At the same time, it has been discovered that only non-structural members are lost in minor earthquakes. The structural members gradually lose strength as a result. For this reason, future engineering practices should also give careful consideration to the loss of non-structural members.
6. Conclusions
According to the concept of performance-based seismic engineering, the seismic loss analysis of eccentrically braced steel frame structures is of great significance for the selection of the structural layout. In this paper, different forms of eccentrically braced steel frame structures are designed, which are K-shaped, V-shaped, and D-shaped, respectively, and the vulnerability of the structure and earthquake loss are studied. The main conclusions are as follows:
Different forms of eccentrically braced structures show good seismic performance under the action of major earthquakes, in line with the design concept of “strong column, weak beam”, and show a reasonable multi-seismic defense line.
The maximum inter-story drift angle of each structure under small earthquakes and large earthquakes is far less than the limit requirement stipulated in our country, which proves that different forms of eccentrically braced structures have good seismic performance. The whole yield process meets the design concept of “strong column and weak beam” in the traditional design, which reflects that the eccentrically braced structure has reasonable multi-seismic defense lines.
Different eccentrically braced structures show different plastic hinge failure modes under earthquake action, and the K-type structure has the best collapse resistance, the V-type structure is the second, and the D-type structure has the largest response. Using the energy-consuming capacity of energy-consuming beams can improve the overall seismic performance during structural yield.
Under different earthquake intensities, the failure modes of plastic hinges in each eccentrically braced model are also different. Under the action of minor earthquakes, plastic hinges do not appear in any member of the model, and the structure is still in an elastic state; under the action of major earthquakes, the plastic hinges of each model are mainly concentrated in the energy dissipation beam section of the structure, thus realizing the ideal failure mode of eccentrically braced structures. In the yield process of the structure, the energy dissipation capacity of the energy dissipation beam can be fully utilized, so that the seismic performance of the whole structure can be improved. From the collapse vulnerability curve, it can be concluded that the anti-collapse performance of the K-shaped eccentrically braced structure is the best, followed by the V-shaped. Among the three kinds of eccentric support structures, the D-type eccentric support structure has the most severe seismic response, and it has the worst collapse resistance. This is due to the poor symmetry of the D-type eccentric support structure.
Future designs should pay more attention to the impact of non-structural components and balance the engineering practice of different forms of eccentrically-braced structures.
From the vulnerability evaluation results, it is concluded that the anti-collapse performance of the K-shaped eccentrically braced steel frame is better, but from the point of view of earthquake loss, the loss of the V-shaped eccentrically braced structure is the smallest. This is because the earthquake loss is not only related to the inter-story drift angle, but also to the floor acceleration. In the process of earthquake loss calculation, non-structural components such as acceleration-sensitive components are also taken into account. This shows us that the loss of non-structural components should also be paid full attention to in the future design process. At the same time, we also need to realize that these three forms of eccentrically braced structures have their own advantages and disadvantages. How to choose designers in engineering practice needs to be considered with respect to the actual situation.
This paper evaluates the seismic performance of eccentrically braced steel frames from the perspectives of vulnerability and earthquake loss. However, there are areas where the considerations in this study are not comprehensive enough, and there are also difficulties in calculation and analysis. Some issues require further exploration:
This article only conducts earthquake loss analysis on eccentrically braced structures with five stories and three specific forms. It does not consider the effects of more structural forms, variations in material strength, or the length of energy dissipation beams on the structural response. These influencing factors require further exploration.
The vulnerability group and personnel mobility database in the PACT software are based on local conditions in California, USA. Using them to assess earthquake losses for structures designed according to Chinese standards may lead to significant limitations in the results. Therefore, substantial efforts are needed in collecting vulnerability component and population mobility data across China’s provinces and municipalities. This is crucial for the development of earthquake loss assessment in China.
Author Contributions
Conceptualization, B.L.; Methodology, B.L.; Software, Y.L. and W.L.; Validation, J.L.; Formal analysis, J.Z.; Investigation, S.W.; Resources, G.N.; Data curation, Q.M.; Writing—original draft, B.L.; Writing—review & editing, Y.L. and J.Z. All authors have read and agreed to the published version of the manuscript.
Funding
This research received no external funding.
Data Availability Statement
The original contributions presented in the study are included in the article, further inquiries can be directed to the corresponding authors.
Conflicts of Interest
The authors declare that they have no known competing financial interests or personal relationships that could have appeared to influence the work reported in this paper.
References
- Fujimoto, M.; Aoyagi, T.; Ukai, K.; Wada, A.; Saito, K. Structural characteristics of eccentric k-braced frames. Trans. Archit. Inst. Jpn. 1972, 195, 39–49. [Google Scholar] [CrossRef] [PubMed]
- Roeder, C.; Popov, E.P. Eccentrically Braced Steel Frames for Earthquakes. J. Struct. Div. 1978, 104, 391–412. [Google Scholar] [CrossRef]
- Hjelmstad, K.; Popov, E.P. Characteristics of Eccentrically Braced Frames. J. Struct. Eng. 1984, 110, 340–353. [Google Scholar] [CrossRef]
- Tavakoli, H.R.; Afrapoli, M.M. Robustness analysis of steel structures with various lateral load resisting systems under the seismic progressive collapse. Eng. Fail. Anal. 2018, 83, 88–101. [Google Scholar] [CrossRef]
- Yu, A. Experimental study on seismic behavior of EK and Y-shaped braces. J. Xi’an Univ. Archit. Sci. Technol. (Nat. Sci. Ed.) 1990, 22, 253–260. [Google Scholar]
- Qian, J.; Chen, M.; Zhang, T. Experimental study and limit analysis of eccentrically braced steel frame under horizontal force. Build. Struct. 1993, 4, 3–9. [Google Scholar]
- Bosco, M.; Rossi, P.P. Seismic behaviour of eccentrically braced frames. Eng. Struct. 2009, 31, 664–674. [Google Scholar] [CrossRef]
- Wang, F.; Su, M.; Li, S.; Lian, M.; Zheng, X.; Tian, X.; Hong, M. Experimental study on seismic behavior of multi-story high-strength steel composite Y-shaped eccentrically braced steel frames. J. Civ. Eng. 2016, 49, 64–71. [Google Scholar]
- Tian, X.; Su, M.; Li, S.; Yang, S. Parameter analysis of seismic performance of high-strength steel composite K-shaped eccentrically braced frames (Ⅰ). J. Guangxi Univ. (Nat. Sci. Ed.) 2019, 44, 1542–1551. [Google Scholar]
- Tian, X.; Su, M.; Li, S.; Yang, S. Parameter analysis of seismic performance of high-strength steel composite K-shaped eccentrically braced frames (Ⅱ). J. Guangxi Univ. (Nat. Sci. Ed.) 2020, 45, 129–137. [Google Scholar]
- Li, S.; Wang, Z.; Tian, J.; Li, X. Study on structural influence coefficient and displacement magnification factor of high-strength steel composite K-shaped eccentrically braced structure. Prog. Build. Steel Struct. 2022, 24, 31–40. [Google Scholar]
- Özkılıç, Y.O.; Ün, E.M.; Topkaya, C. Frictional mid-spliced shear links for eccentrically braced frames. Earthq. Eng. Struct. Dyn. 2023, 52, 15. [Google Scholar] [CrossRef]
- Özkılıç, Y.O. Optimized stiffener detailing for shear links in eccentrically braced frames. Steel Compos. Struct. 2021, 39, 35–50. [Google Scholar]
- Özkılıç, Y.O.; Topkaya, C. Extended end-plate connections for replaceable shear links. Eng. Struct. 2021, 240, 112385. [Google Scholar] [CrossRef]
- Özkılıç, Y.O.; Bozkurt, M.B.; Topkaya, C. Mid-spliced end-plated replaceable links for eccentrically braced frames. Eng. Struct. 2021, 237, 112225. [Google Scholar] [CrossRef]
- Özkılıç, Y.O.; Zeybek, Ö.; Topkaya, C. Stability of laterally unsupported shear links in eccentrically braced frames. Earthq. Eng. Struct. Dyn. 2021, 51, 832–852. [Google Scholar] [CrossRef]
- GB 50011-2010; Code for Seismic Design of Buildings. China Construction Industry Press: Beijing, China, 2016.
- ICC-IBC-2006; International Building Code 2006. International Code Council INC: Country Club Hills, IL, USA, 2006.
- Aslani, H.; Miranda, E. Probabilistic Earthquake Loss Estimation and Loss Disaggregation in Buildings; Report No., 157; John A. Blume Earthquake Engineering Center, Stanford University: Stanford, CA, USA, 2005. [Google Scholar]
- Mitrani-Reiser, J. An Ounce of Prevention: Probabilistic Loss Estimation for Performance-Based Earthquake Engineering. Ph.D. Thesis, California Institute of Technology, Pasadena, CA, USA, 2007. [Google Scholar]
- Ye, S.; Zhai, G. A summary of research on earthquake economic loss assessment. Adv. Geogr. 2010, 29, 684–692. [Google Scholar]
- Zareian, F. Simplified Performance-Based Earthquake Engineering; Stanford University: Stanford, CA, USA, 2006. [Google Scholar]
- Ramirez, C.M.; Miranda, E. Building-Specific Loss Estimation Methods & Tools for Simplified Performance-Based Earthquake Engineering; Report No. 157; John A. Blume Earthquake Engineering Center, Stanford University: Stanford, CA, USA, 2009. [Google Scholar]
- Gobbo, G.D.; Williams, M.S.; Blakeborough, A. Seismic performance assessment of Eurocode 8-compliant concentric braced frame buildings using FEMA P-58. Eng. Struct. 2018, 155, 192–208. [Google Scholar] [CrossRef]
- Zeng, X.; Liu, S.; Xu, Z.; Lu, X. Case study of earthquake economic loss prediction of campus buildings based on FEMA-P58 method. Eng. Mech. 2016, 33 (Suppl. 1), 113–118. [Google Scholar]
- Zhu, H.; Liang, X.; Dang, Y. Study on a new generation of seismic performance evaluation method of frame-shear wall structure based on seismic strength. Vib. Shock 2017, 36, 140148. [Google Scholar]
- Yan, D. Seismic and Isolation Performance Evaluation of Reinforced Concrete Frame Structures Based on FEMA P58. Bachelor’s Thesis, Institute of Engineering Mechanics, China Seismological Bureau, Beijing, China, 2019. [Google Scholar]
- GB 50017-2017; Steel Structure Design Standard. China Construction Industry Press: Beijing, China, 2017.
- JGJ 99-2015; Technical Specification for Steel Structure of Tall Buildings. China Construction Industry Press: Beijing, China, 2015.
- GB 50009-2012; Code for Load of Building Structures. China Construction Industry Press: Beijing, China, 2012.
- Beijing Zhuxinda Engineering Consulting Co., Ltd. Chinese Version of SAP2000 Technical Guide and Engineering Application; Renjiaotong Publishing House Co., Ltd.: Beijing, China, 2018. [Google Scholar]
- American Society of Civil Engineers: Prestandard and Commentary for Seismic Rehabilitation of Buildings; Report No. FEMA 356; Federal Emergency Management Agency: Washington, DC, USA, 2002.
- FEMA P-58-1; Seismic Performance Assessment of Buildings: Volume 1—Methodology. Federal Emergency Management Agency: Washington, DC, USA, 2012.
- FEMA P-58-2; Seismic Performance Assessment of Buildings: Volume 2—Implementation Guide. Federal Emergency Management Agency: Washington, DC, USA, 2012.
- FEMA P-58-3; Seismic Performance Assessment of Buildings: Volume 3—Provided Fragility Data. Federal Emergency Management Agency: Washington, DC, USA, 2012.
- ATC-63; Quantification of Building Seismic Performance Factors, ATC-63 Project Report (90% Draft). FEMA P695/April 2008. Federal Emergency Management Agency: Washington, DC, USA, 2008.
- Demir, A.; Kayhan, A.H.; Palanci, M. Response- and probability-based evaluation of spectrally matched ground motion selection strategies for bi-directional dynamic analysis of low- to mid-rise RC buildings. Structures 2023, 58, 105533. [Google Scholar] [CrossRef]
- Demir, A.; Palanci, M.; Kayhan, A.H. Evaluation the effect of amplitude scaling of real ground motions on seismic demands accounting different structural characteristics and soil classes. Bull. Earthq. Eng. 2024, 22, 365–393. [Google Scholar] [CrossRef]
- Lu, D.; Liu, T.; Li, S.; Yu, X. Analysis of the influence of target spectrum and amplitude modulation method on ground motion selection. Earthq. Eng. Eng. Vib. 2018, 38, 21–28. [Google Scholar]
- Baker, J.W. Efficient analytical fragility function fitting using dynamic structural analysis. Earthq. Spectra 2015, 31, 579–599. [Google Scholar] [CrossRef]


Disclaimer/Publisher’s Note: The statements, opinions and data contained in all publications are solely those of the individual author(s) and contributor(s) and not of MDPI and/or the editor(s). MDPI and/or the editor(s) disclaim responsibility for any injury to people or property resulting from any ideas, methods, instructions or products referred to in the content. |
© 2024 by the authors. Licensee MDPI, Basel, Switzerland. This article is an open access article distributed under the terms and conditions of the Creative Commons Attribution (CC BY) license (https://creativecommons.org/licenses/by/4.0/).