Article

Indoor Air Quality Management in Dubai: Assessing the Efficacy of Air Purifiers, Photocatalysts, and Window Ventilation in Reducing HCHO

by
Chuloh Jung
* and
Shams Mohammed Alshamasi
Department of Architecture, College of Architecture and Design, Prince Mohammad Bin Fahd University, Dhahran 34754, Saudi Arabia
*
Author to whom correspondence should be addressed.
Buildings 2024, 14(9), 2815; https://doi.org/10.3390/buildings14092815 (registering DOI)
Submission received: 28 July 2024 / Revised: 30 August 2024 / Accepted: 2 September 2024 / Published: 7 September 2024
(This article belongs to the Special Issue Indoor Environmental Quality and Human Wellbeing)

Abstract

:
This study investigates the characteristics of formaldehyde (HCHO) concentration and its reduction in newly constructed apartment buildings in Dubai. It addresses the significant health risks of high HCHO levels due to poor ventilation and extensive use of VOC-emitting materials. The research explores the effectiveness of various mitigation strategies, including air purifiers, photocatalyst applications, and window ventilation, in the living room, master bedroom (MBR), Room 1, and Room 2. HCHO concentrations were measured under different conditions: sealed windows, operation of an air purifier with a VOCs filter, and the application of a photocatalyst. The study followed a quantitative approach, recording real-time HCHO levels over 24 h. Results indicated that sealing windows led to HCHO concentrations surpassing the domestic standard of 0.1 ppm, with the MBR recording the highest concentration at 0.73 ppm. The air purifier showed minimal impact within the first 8 h but achieved an 18% reduction after 24 h of operation. Applying a photocatalyst to room surfaces resulted in a 50% reduction in HCHO levels. Ventilation through window openings significantly improved air exchange rates, with the air exchange per hour (ACH) increasing proportionally with window opening size. Smaller rooms with larger window-to-volume ratios, such as Room 1 and Room 2, maintained HCHO concentrations below the WHO standard of 0.1 ppm with partial window openings. The study concludes that window ventilation is the most effective strategy for reducing HCHO concentrations, highlighting the importance of integrating comprehensive ventilation designs in modern residential buildings to ensure healthier indoor environments in Dubai.

1. Introduction

The Indoor Air Quality (IAQ) in Dubai, a city known for its rapid urbanization and modern architectural marvels, presents urgent and unique challenges due to a combination of environmental factors and building practices that intensify indoor air pollution risks [1,2,3]. The convergence of advanced energy-efficient construction practices has inadvertently led to more airtight buildings, which, while optimizing energy usage, significantly hinder natural ventilation [4,5]. This lack of ventilation results in the entrapment of pollutants, leading to elevated concentrations of hazardous substances indoors [6,7]. The extensive use of construction materials that emit volatile organic compounds (VOCs), including formaldehyde (HCHO), further exacerbates the problem, posing immediate health risks to inhabitants due to their continuous release into the indoor environment [8,9].
Dubai’s extreme climate, characterized by high temperatures, necessitates continuous air conditioning systems, which, if not properly maintained, can become breeding grounds for biological contaminants such as mold and fungi [10]. The maintenance of these systems is crucial, as any lapse can lead to the accumulation of mold, fungi, and other biological contaminants that further degrade indoor air quality [11,12]. Additionally, the arid environment contributes to the presence of dust and particulate matter, which can easily infiltrate indoor spaces and accumulate over time [13]. The city’s rapid development and industrial activities also significantly compromise IAQ, with construction dust and outdoor pollutants entering buildings through inadequately sealed openings and ventilation systems [14].
Sick Building Syndrome (SBS) has increasingly gained attention in Dubai, where building occupants experience various health issues closely linked to prolonged exposure to poor indoor air quality. SBS is particularly concerning because it not only affects the physical health of occupants but also significantly impacts their well-being, mental health, and productivity. Studies have shown that symptoms associated with SBS, such as headaches, dizziness, fatigue, and respiratory problems, can lead to decreased work performance and overall life satisfaction, making it a critical issue in environments where people spend a significant amount of time indoors [15,16]. This issue underscores the importance of addressing IAQ as a public health priority. Furthermore, the lifestyle in Dubai, which involves spending considerable time indoors due to the hot climate, increases residents’ exposure to indoor pollutants and magnifies the health risks associated with poor IAQ [17,18]. As a result, addressing SBS in Dubai’s urban settings is vital for improving individual health outcomes and enhancing the population’s overall productivity and quality of life. Despite the growing recognition of these issues, the regulatory framework surrounding IAQ in Dubai is still evolving, with current regulations often lagging behind the latest scientific findings on air quality standards [19]. Public awareness and education on the impact of IAQ on health are also areas that require attention to drive better compliance with IAQ standards and improve overall public health [20].
Numerous researchers have extensively studied the concentration of HCHO in building materials, with a significant body of research emerging from various international contexts [21]. These studies have primarily focused on the emission characteristics of HCHO and other VOCs in different construction materials [22,23]. However, the specificity of construction practices and interior design choices in various regions, such as the prevalent use of carpets in indoor spaces in many countries as opposed to the preference for wallpaper, ceiling paper, or wood flooring in Dubai, introduces distinct variables in the emission characteristics of HCHO [24]. This variance underscores the need for region-specific research, particularly in Dubai, where numerous construction companies employ interior finishing materials [25,26].
In Dubai, targeted studies have examined the emission characteristics of HCHO. For instance, research has been conducted on the emission characteristics of VOCs from flooring materials, the potential for HCHO decomposition using TiO2-coated wallpaper, and the emission characteristics of HCHO from various indoor building materials [27]. However, there appears to be a gap in the comprehensive analysis of HCHO concentration in indoor ventilation [28]. This study aims to bridge that gap by concurrently measuring and analyzing HCHO concentration and indoor air quality factors, such as ventilation, to provide a more holistic understanding of indoor air quality in Dubai’s residential buildings. This approach is critical to developing effective strategies for improving IAQ and mitigating health risks associated with HCHO emissions in apartment units across the city [29].
Additionally, global environmental changes, including climate change, indirectly influence the indoor air environment in Dubai, affecting the types and concentrations of pollutants through altered atmospheric conditions that can increase the prevalence of specific airborne contaminants [30,31]. Addressing IAQ in Dubai thus necessitates a comprehensive approach encompassing improved building standards, diligent maintenance of HVAC systems, public awareness initiatives, and continuous research into sustainable and health-conscious building practices to adapt to the evolving environmental challenges [32]. This deteriorating IAQ is increasingly problematic, as harmful gases released from building materials, including interior finishes, persistently compromise the health of inhabitants over long-term exposure [33]. These emissions have contributed to the emergence of SBS, a phenomenon gaining recognition for its health implications and prevalence in modern, energy-efficient buildings [34].
This study aims to fill a critical gap in understanding how modern construction practices impact IAQ by investigating the concentration characteristics of HCHO, a prevalent volatile organic solvent, and primary air pollutant, in newly constructed apartment buildings at City Walk Residences by Meraas. This research is crucial for developing effective strategies to mitigate the adverse effects of poor IAQ on resident health and well-being in urban environments like Dubai.

2. Materials and Methods

2.1. IAQ Standards

Table 1 in the referenced study delineates the international standards for Indoor Air Quality (IAQ) established in various advanced nations. The World Health Organization (WHO) has set guidelines for non-occupational settings, such as residential homes and educational institutions [35]. These guidelines serve as a scientific foundation upon which many countries base their legally enforceable standards [36]. The standards for IAQ are exceptionally detailed in Europe, under WHO guidelines, and South Korea, reflecting a heightened focus on indoor air quality in these regions [37]. The latest iteration of these standards, revised and expanded in 2019, specifies minimum ventilation rates and outlines various strategies to mitigate the adverse health impacts of poor IAQ [38].

2.2. Research Methods

This study focused on analyzing the frequency and characteristics of VOC emissions, particularly HCHO, which is recognized as highly detrimental to human health [39]. The research involved 24 h monitoring of VOCs and HCHO at hourly intervals in the City Walk Residences, a newly constructed apartment complex [40]. During the monitoring period, each room’s windows were sealed to establish a baseline for HCHO concentration levels, ensuring that no external factors influenced the indoor air quality measurements [41].
To ensure the accuracy and reliability of the data, all measurements were conducted using calibrated equipment, and the environmental conditions were controlled as much as possible. The raw data collected were then processed using statistical software to identify trends, calculate averages, and assess the significance of the observed variations. The results were compiled into tables to present a clear and concise summary of the findings. The tables were designed to include key metrics such as mean concentrations, standard deviations, and percentage reductions in HCHO levels, allowing for an easy comparison of different conditions.
After this initial assessment, the study explored the impact of varying window openings on reducing HCHO concentration [42]. For this part of the study, the windows in each room were adjusted to specific openings of 10 cm, 20 cm, 30 cm, and fully open configurations. The resulting HCHO concentrations were then recorded and analyzed to determine the relationship between window opening size and ventilation effectiveness [43]. The data were treated by calculating the air change per hour (ACH) for each scenario, which was then used to evaluate the ventilation efficiency of each window configuration. The results were summarized in tables that show the ACH values alongside the corresponding HCHO concentrations, highlighting the impact of different ventilation strategies.
Additionally, the effectiveness of a VOC-specific air purifier and a photocatalyst in mitigating VOC levels was examined [44]. In these experiments, the air purifier was operated continuously for 24 h, and the HCHO concentrations were measured before and after using the purifier. Similarly, the photocatalyst was applied to various surfaces, and HCHO levels were monitored under different lighting conditions to assess its effectiveness. The data were analyzed to determine the percentage reduction in HCHO levels and were presented in tables that compare the effectiveness of the air purifier and photocatalyst under various conditions. These tables were constructed to facilitate the understanding of how different purification methods perform in real-world scenarios.
This research aimed to provide foundational data that could contribute to ensuring a comfortable and healthy indoor air environment by understanding how ventilation and purification methods affect indoor air quality, especially in reducing harmful VOCs like HCHO. The study presented practical insights for improving air quality in residential settings.

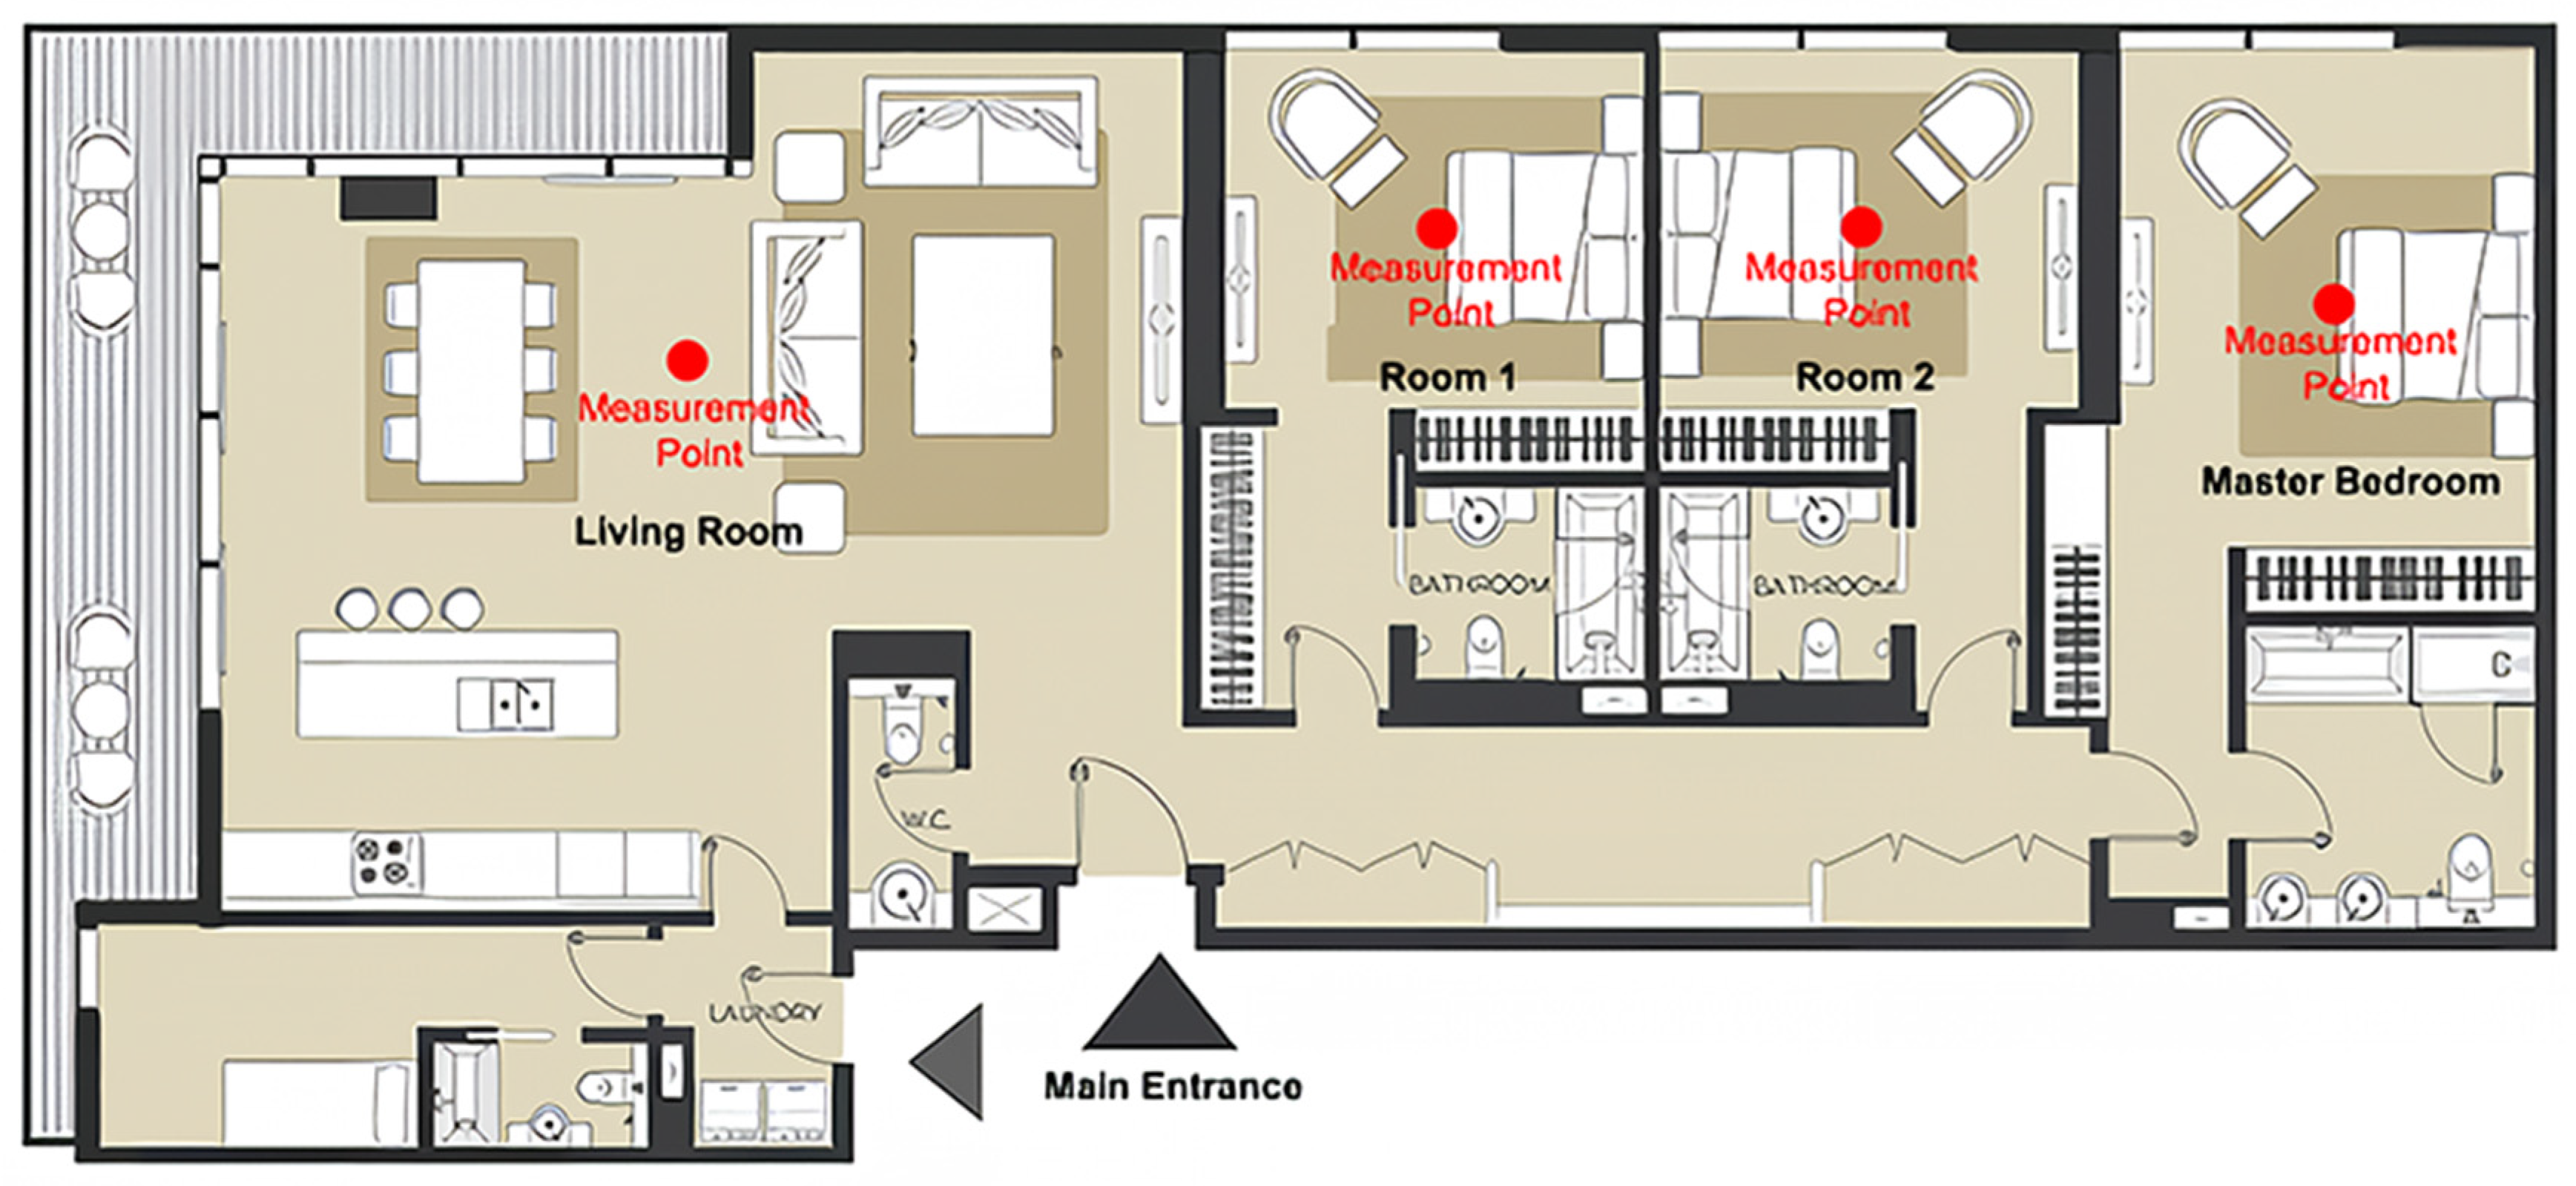
2.2.1. Measurement Overview

City Walk Residences by Meraas, from an architectural planning perspective, is a unique and meticulously planned development in Dubai (Figure 1) [45]. Developed and managed by Meraas, City Walk was conceptualized as a ‘city within a city’, offering a blend of residential and commercial spaces that stand out for their distinctiveness and design but also presenting unique challenges for IAQ management due to its mixed-use nature. The development is structured to encompass a variety of elements, including shopping, entertainment, hospitality, wellness, and living options, all integrated into a single, harmonious space, which can complicate efforts to control and monitor IAQ across different environments [46]. This approach aims to provide residents and visitors an ideal place for socializing, dining, shopping, and spending quality time in a serene and sophisticated ambiance (Figure 2).
City Walk features 34 five- and six-story low-rise buildings, each architecturally designed to foster a unique urban community feel. These buildings house a variety of apartment types and sizes, including 1-, 2-, 3-, and 4-bedroom units, catering to a diverse range of needs and preferences. However, the diversity in building types and uses poses challenges in maintaining consistent IAQ standards across the development. The architectural design is focused on creating a unique destination that embraces various values, ethnicities, cultures, and aesthetics, reflecting the cosmopolitan nature of Dubai. In addition to residential spaces, City Walk includes innovative leisure and entertainment options like Hub Zero, an entertainment park, the Green Planet, a bio-dome, Mattel Play Town, and Reel Cinema. These features contribute to the project’s vibrant and dynamic community appeal. Furthermore, the development incorporates wellness and healthcare components, ensuring comprehensive diagnostic and wellness services focusing on preventive care, adding another layer of convenience and quality of life for its residents.
The research was conducted in a fourth-floor apartment (Unit #410) of City Walk Residences, a newly constructed complex in Dubai as of February 2019. This unit, featuring a three-bedroom layout, encompasses an area of 180 m2, as detailed in Figure 3.
Table 2 presents the volumetric analysis of the apartment’s rooms [47]. The living room, being the largest, occupies a volume of 80.59 m3, followed by the master bedroom at 45.67 m3 and rooms 1 and 2, each at 28.34 m3. Furthermore, the study hypothesizes that the indoor concentration of HCHO is influenced by the type of interior finishing materials used and the construction methods employed. Mainly, when windows in each room are closed, the reduction in HCHO concentration is attributed to the extent of air infiltration through window gaps. Consequently, the ratio of the balcony window area to the room’s volume is considered a critical factor. It indicates the proportional window area to the room volume. The findings show that the living room has the smallest ratio at 0.118 m−1, whereas the master bedroom and Room 2 each have a higher ratio of 0.121 m−1. Room 1 exhibits the most significant ratio at 0.155 m−1. This information underpins the study’s focus on how building design and ventilation affect indoor air quality, specifically concerning HCHO concentration.
This study systematically measured HCHO concentration, temperature, and humidity within a residential setting [48]. The measurement period spanned from 0:00 a.m. to 00:00 a.m. the following day, covering an entire 24 h cycle [49]. These observations were conducted simultaneously in the living room and bedroom of unoccupied rental units to avoid the different results from the time gap from 19 November to 5 January 2022. To ensure the precision and consistency of the data, measurements were recorded at hourly intervals in rooms 1, 2, and the master bedroom, utilizing the equipment detailed in Table 3. This methodology facilitated a comprehensive understanding of IAQ over an extended time frame in different areas of the residential units.
In the study’s observed apartment units, the interior finishing materials varied across different rooms, significantly contributing to the indoor HCHO concentration [50]. In the living room, the finishing materials included a wood veneer adhered to medium-density fiberboard (MDF), decorative veneer around the ceiling lights, and veneer flooring [51]. These elements, particularly the bonding agents used for flooring materials and wallpaper application on walls and ceilings, are presumed to be primary sources of HCHO emission [52]. Furthermore, the master bedroom’s interior features veneer flooring and wallpapered bathroom doors, walls, and ceiling. Room 1 is similarly appointed with veneer flooring and wallpaper on the walls and ceiling. In Room 2, the built-in closet and floor are finished with veneer, and the walls and ceiling are wallpapered. These materials and their application methods in each room are thought to contribute to the indoor HCHO concentration, likely due to the release of formaldehyde from the adhesive substances used in these finishing processes.

2.2.2. Concentration of Formaldehyde (HCHO)

This study employed various methods for analyzing HCHO concentration, notably DNPH derivatization analysis and chemiluminescence photometry [53]. The chosen method was chemiluminescence photometry, a globally recognized on-site measurement technique [54]. This approach aligns with the IAQ process test method recommended by the Dubai Municipality [55].
The sensitivity of HCHO concentration to temperature variations necessitated particular attention to maintaining consistent temperature conditions during measurements. To ensure accuracy, the measuring device was placed in the room an hour before the commencement of measurements. This protocol was followed to equilibrate the internal temperature of the measuring device with that of the room [56]. Before the actual measurement, the device was calibrated using standard gas. The HCHO measuring and monitoring devices were positioned 1.2 m above the floor level. Data sampling occurred once per minute for 60 min, with the subsequent calculation of the average concentration. For a comprehensive analysis, the monitoring of HCHO concentration was scheduled to span 24 h, starting around 0:00 at night and concluding at 0:00 the following day. This time frame was chosen to capture the diurnal variations in HCHO levels within the indoor environment.

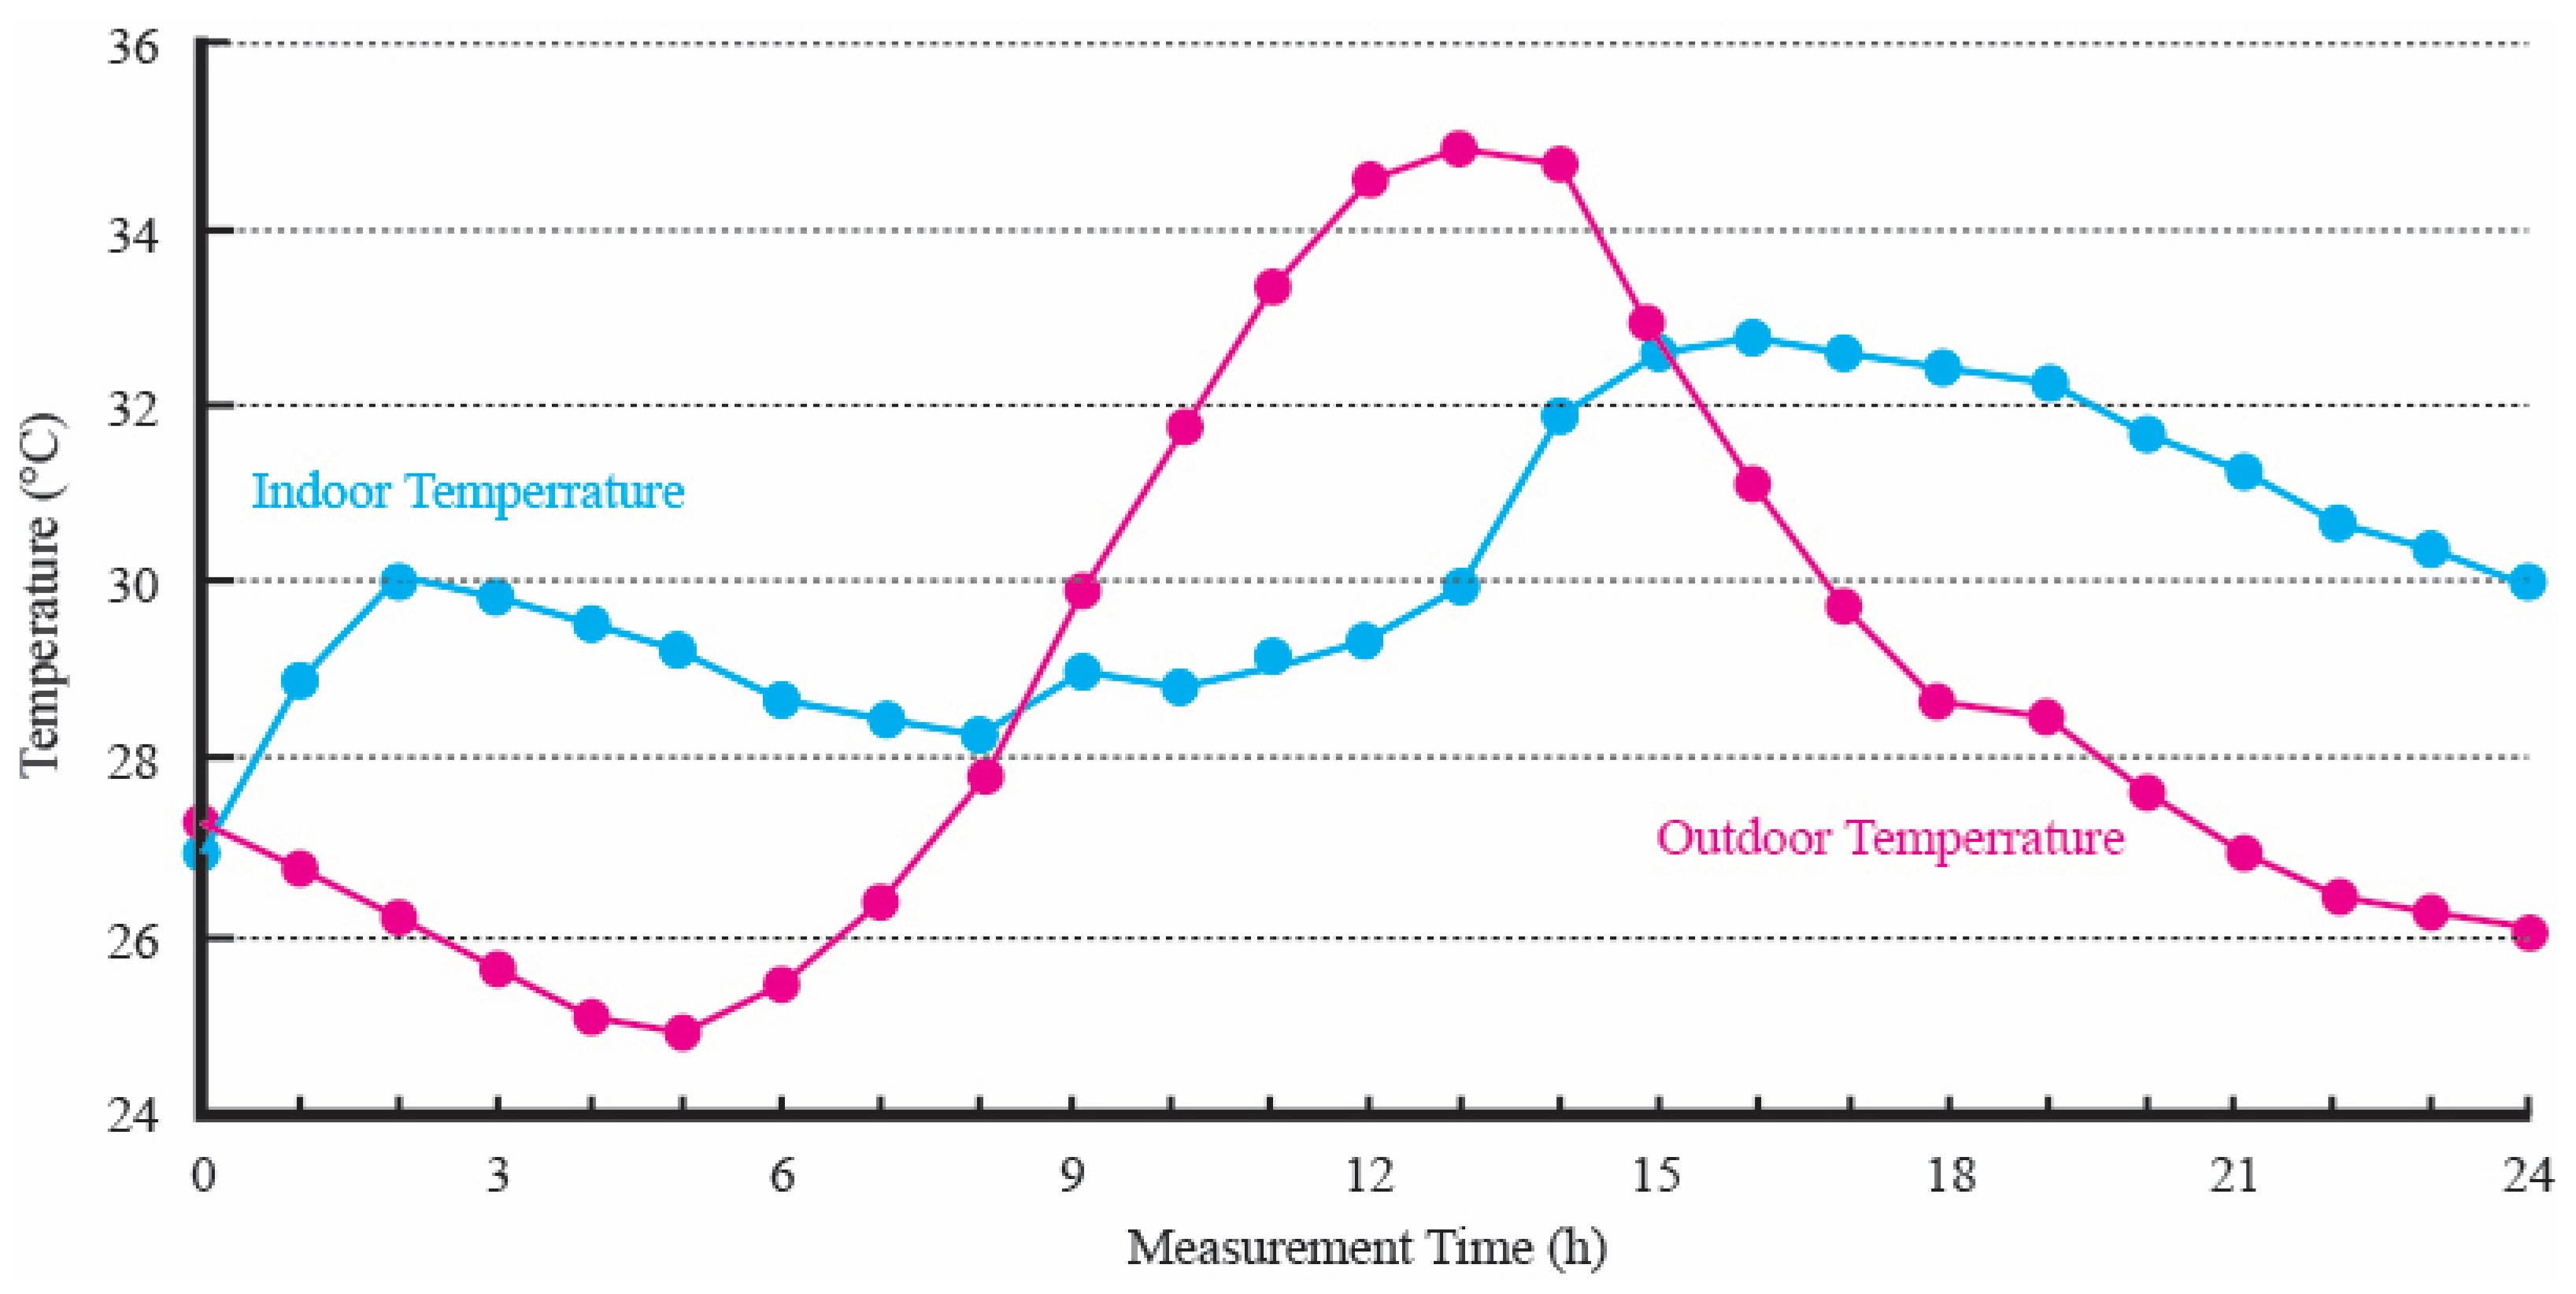
2.2.3. Indoor/Outdoor Temperature and Humidity

In this study, monitoring indoor temperature and humidity was also crucial. A digital thermohygrometer was mounted on a tripod and positioned 1.2 m above the floor [57]. This setup facilitated continuous temperature and humidity data recording with hourly readings. Notably, the temperature and humidity measurement schedule was synchronized with the HCHO concentration measurements, ensuring that all data were collected over the same 24 h period. This alignment was essential for accurately correlating changes in temperature and humidity with variations in HCHO concentration levels.

2.2.4. CO2 Concentration for Measuring Ventilation

In this study, recognizing that the concentration of HCHO emitted from indoor finishing materials can be mitigated by fresh outdoor air, it was crucial to determine the amount of ventilation corresponding to various degrees of window openings in each room [58]. This determination was essential to evaluate the efficacy of reducing HCHO concentration through window ventilation [59].
The Tracer Gas Method’s gas concentration decay technique measured the ventilation rate. This method involves releasing a specified amount of tracer gas into the indoor environment where ventilation measurement is required. A fan ensures uniform dispersion of the gas concentration throughout the space. Concurrent with the ventilation process, the temporal variation in the gas concentration is monitored to ascertain the ventilation rate [60]. The estimation of the ventilation rate was carried out using Equation (2). This equation is a solution to Equation (1), a differential equation that models the change in gas concentration over time. By applying this mathematical approach, the study quantified the number of air changes per hour, precisely evaluating the ventilation effectiveness of window openings. This methodological approach was critical for understanding how natural ventilation impacts indoor air quality, particularly in reducing harmful HCHO concentrations.
V d C = M d t + C o Q d t C r o Q d t = M + C o Q C r o Q d t
N = 2.303 t   l o g   C r o C o C r t C o
Co: CO2 Concentration in Outdoor Air (ppm)
Cro: Indoor CO2 Concentration (ppm) at time t = 0
Crt: Indoor CO2 Concentration (ppm) at time t
N: Ventilation Frequency (times/h)
V: Room Volume (m3)
Q: Ventilation Volume (m3/h), Q = NV
M: Indoor CO2 Generation Amount (ppm)
To accurately measure the ventilation rate corresponding to different window opening sizes in the living room, master bedroom, Room 1, and Room 2, this study employed a meticulous approach involving carbon dioxide (CO2) as a tracer gas. Initially, CO2 was released from a gas cylinder into each room to achieve an indoor concentration level of approximately 4500 ppm. A fan was then used to distribute the gas evenly throughout the room, and the concentration of CO2 was monitored until it decreased to around 3500 ppm. Once the indoor CO2 concentration had stabilized, the fan was turned off. The study then measured the ventilation amount under various conditions: with all windows closed and each room opened to 10 cm, 20 cm, 30 cm, and fully open, respectively.
The decay method was performed multiple times for each room and window opening configuration to ensure the accuracy and reliability of the ACH estimations. The R² values for the decay curve fittings were calculated to assess the goodness of fit, with values consistently above 0.95, indicating strong correlations between the observed data and the model. This ensures that the decay method accurately represents the ventilation rates under different conditions. The outdoor CO2 concentration was also assumed to be 400 ppm, a typical baseline for outdoor air in urban environments.
Sampling of the gas concentration was strategically conducted at three locations in the center of each room to represent the average concentration accurately [61]. These locations were 10 cm and 110 cm above the floor and 10 cm below the ceiling. An RS-232C connection between the gas analyzer and a computer was also used to facilitate precise data acquisition and analysis. This setup allowed for the reception of concentration output data from the gas analyzer, which was then outputted to a printer at 10 s intervals. The data were analyzed to ensure that the wind velocity and direction had minimal impact on the results. Since Dubai’s shoreline runs in a single line and the wind direction is predominantly from the northwest, we have decided not to include wind velocity and direction data. Given the consistency of wind patterns in the region, this decision was made to focus on more relevant factors. Given the consistent wind patterns in Dubai, it was determined that these factors would not significantly alter the ACH measurements under the controlled conditions of this study. This method ensured a detailed and time-accurate tracking of CO2 concentration changes, which is crucial for calculating the ventilation rate effectively under varying window opening scenarios.

3. Results

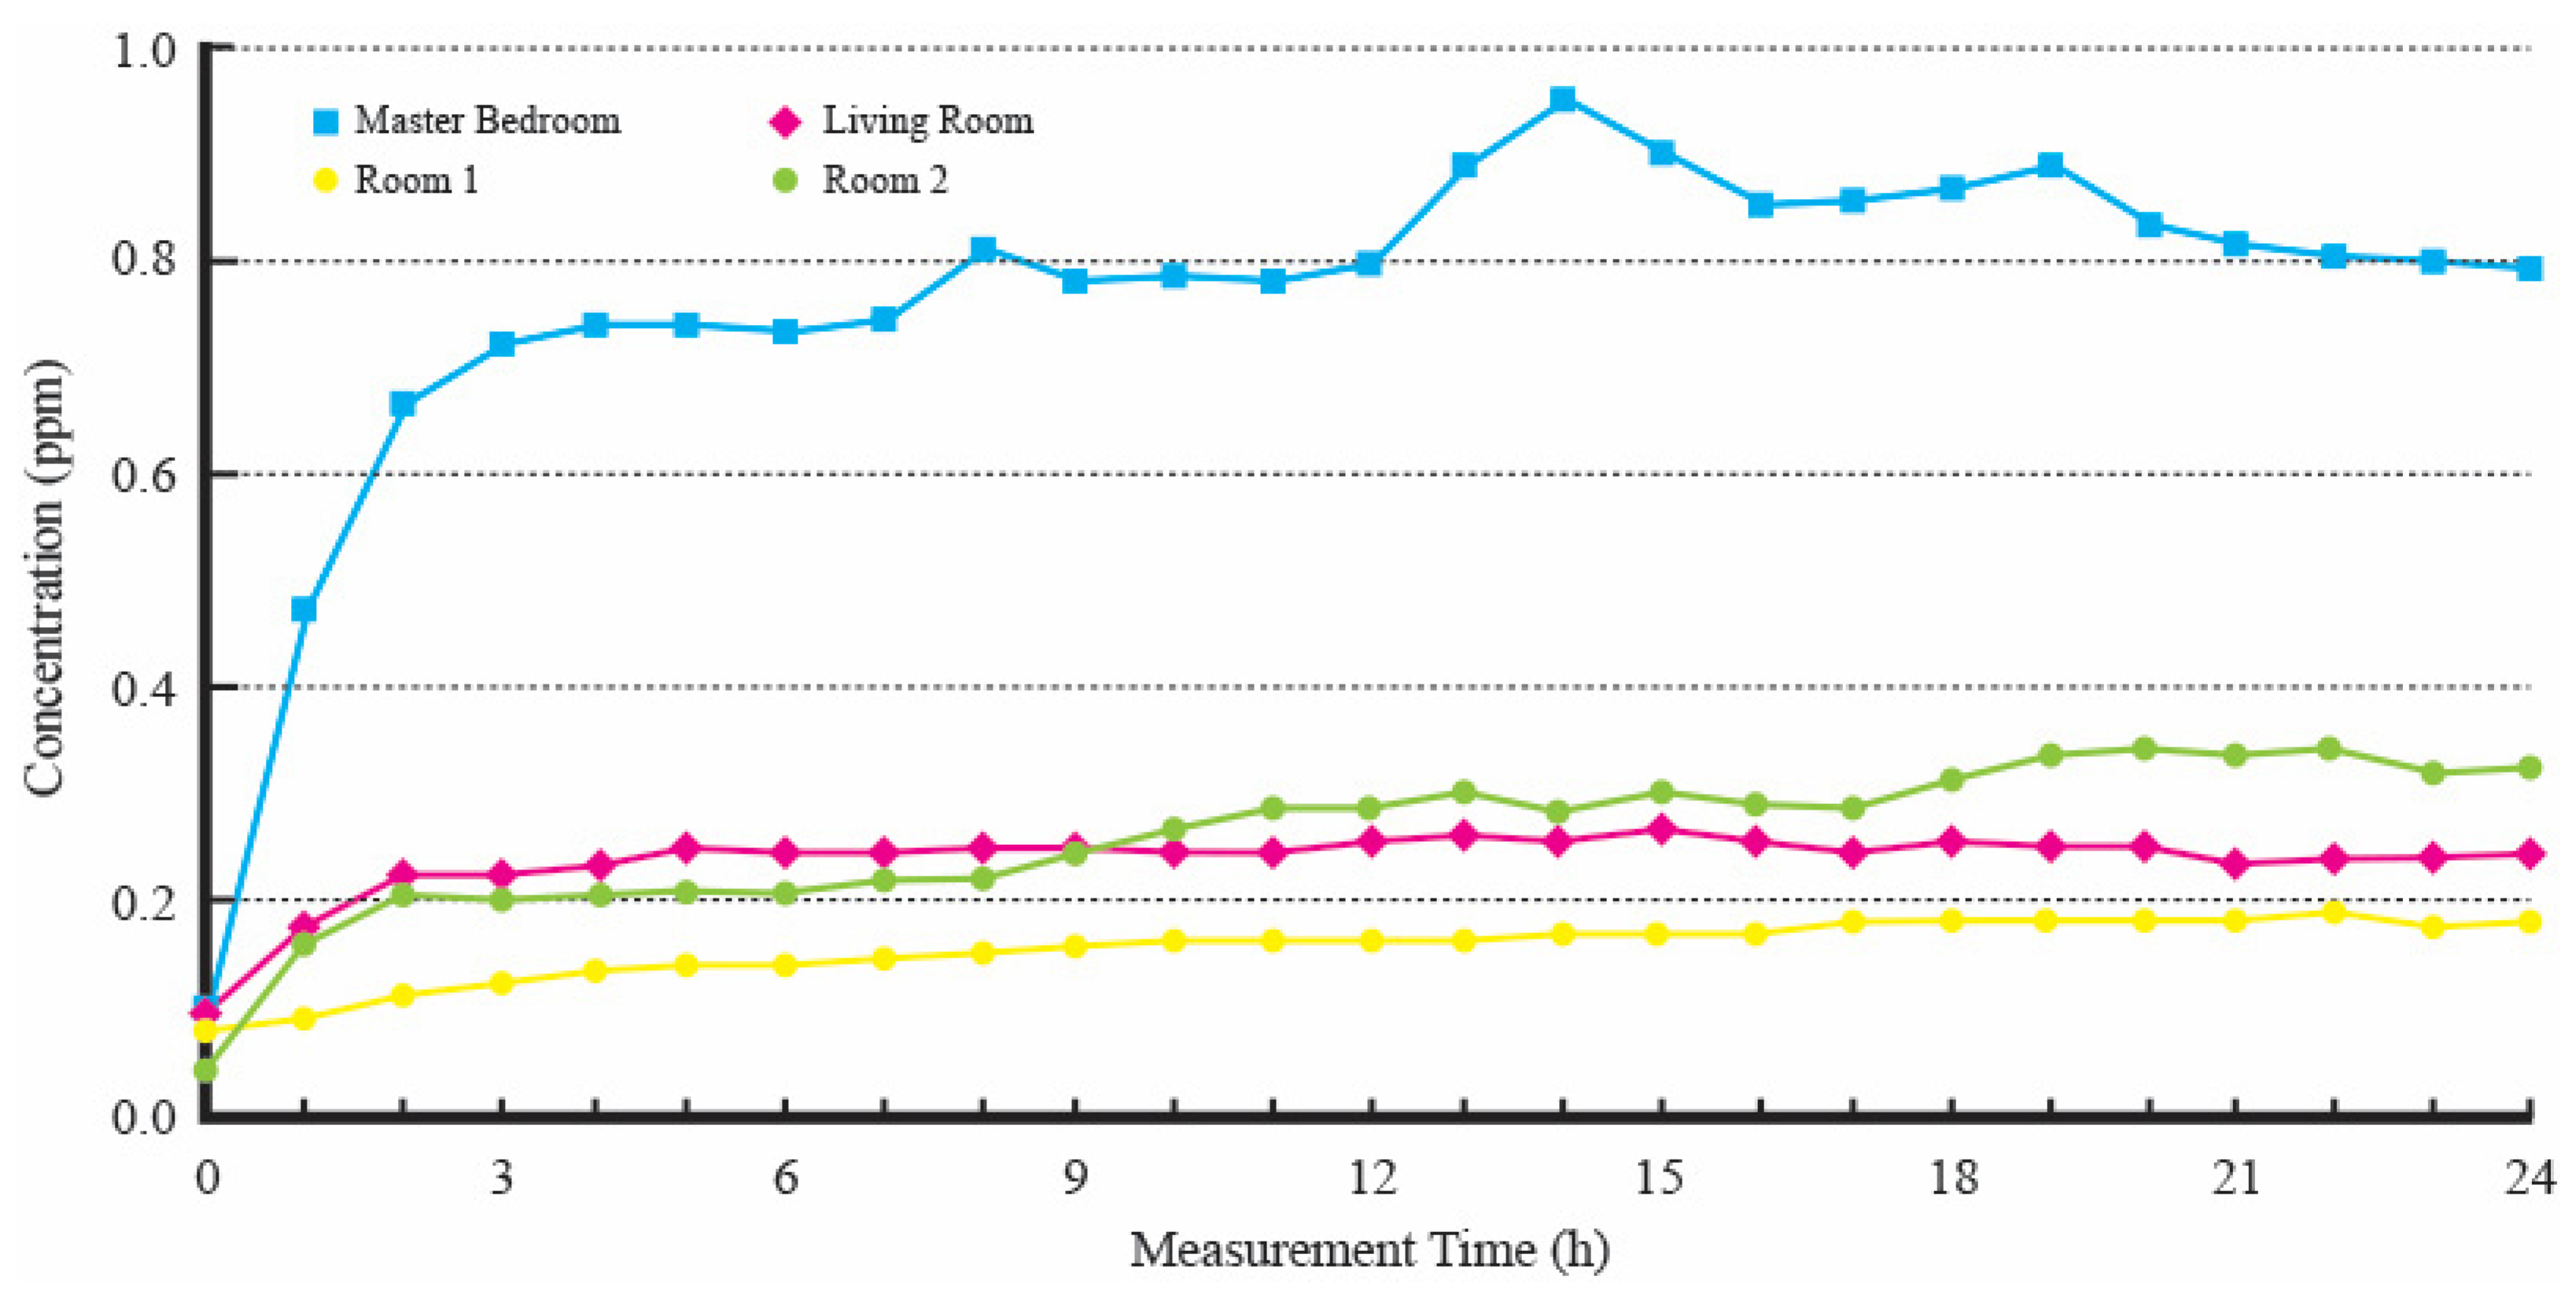
3.1. HCHO Concentration in Each Room with the Windows Closed

Figure 4 in the study illustrates the variations in HCHO concentration over 24 h in a sealed indoor environment following an initial ventilation phase. The procedure involved opening all windows and doors in each room for over 30 min until the indoor HCHO concentration approached nearly 0 ppm. Subsequently, HCHO levels were recorded hourly with the windows and doors sealed.
The World Health Organization (WHO) prescribes a specific procedure for measuring indoor HCHO concentration, which the study adheres to. This method entails ventilating the space for a minimum of 30 min, sealing the windows for 5 h, and then calculating the average HCHO concentration over the next 30 min. The concentration measured 6 h from the beginning of the process is deemed to align with the WHO’s indoor air quality process test method.
This study measured the living room’s initial HCHO concentration at 0.09 ppm. After 6 h, in line with the WHO method, the concentration increased to 0.25 ppm, approximately 2.5 times higher than the Dubai Municipality’s environmental standard of 0.1 ppm. The peak concentration, 0.26 ppm, was observed around noon, and a similar level was recorded at 19:00. Conversely, the master bedroom started with a higher HCHO concentration of 0.10 ppm. Six hours into the measurement, the level escalated to 0.73 ppm, significantly exceeding the Dubai Municipality’s environmental standard by 7.3 times. The highest concentration of 0.944 ppm was noted around 14:00, coinciding with the day’s highest temperature, and eventually decreased to 0.80 ppm after 24 h.
The observed higher HCHO concentration in the master bedroom, compared to other rooms, is attributed to several factors. Key among these is the presence of additional furniture and fixtures, such as a king-size bed made of medium-density fiberboard (MDF) finished with veneer film and a large wall screen made of plywood, measuring 1.5 m × 2.5 m. These materials are estimated to be significant sources of HCHO emission.
In Room 1, the initial HCHO concentration was recorded at 0.08 ppm. According to the indoor air quality process test method, the concentration at 6 o’clock rose to 0.14 ppm, slightly surpassing the Dubai Municipality HCHO environmental standard of 0.1 ppm. The concentration showed an upward trend, peaking at 0.19 ppm at 19:00, around sunset, before gradually decreasing. This peak concentration was approximately 1.9 times the standard set by the Dubai Municipality. The relatively lower HCHO concentration in Room 1 is presumed to be due to using less chemical-intensive interior finishing materials. The room was finished with silk wallpaper on the ceiling and walls, and the flooring was made of veneer. Additionally, as indicated in Table 2, the proportionally larger size of the window and balcony window relative to the room volume, compared to other rooms, is believed to contribute to reduced HCHO concentration, owing to increased air infiltration when the windows are sealed. In Room 2, the starting HCHO concentration was 0.04 ppm, lower than in Room 1. However, the concentration increased to 0.21 ppm at the 6 o’clock measurement and rose to 0.29 ppm at noon, approximately 2.9 times the environmental standard set by the Dubai Municipality. This increase suggests a significant presence of HCHO-emitting materials or fixtures in Room 2.
Consequently, in light of the factors above, it is anticipated that sleeping in rooms 1, 2, and the master bedroom between midnight and 8 am, with the windows and doors closed, will result in exposure to pollutant concentrations approximately 1.5 to 8 times higher than the environmental standards set by the Dubai Municipality. This exposure is expected to affect human health, necessitating suitable mitigation strategies significantly.

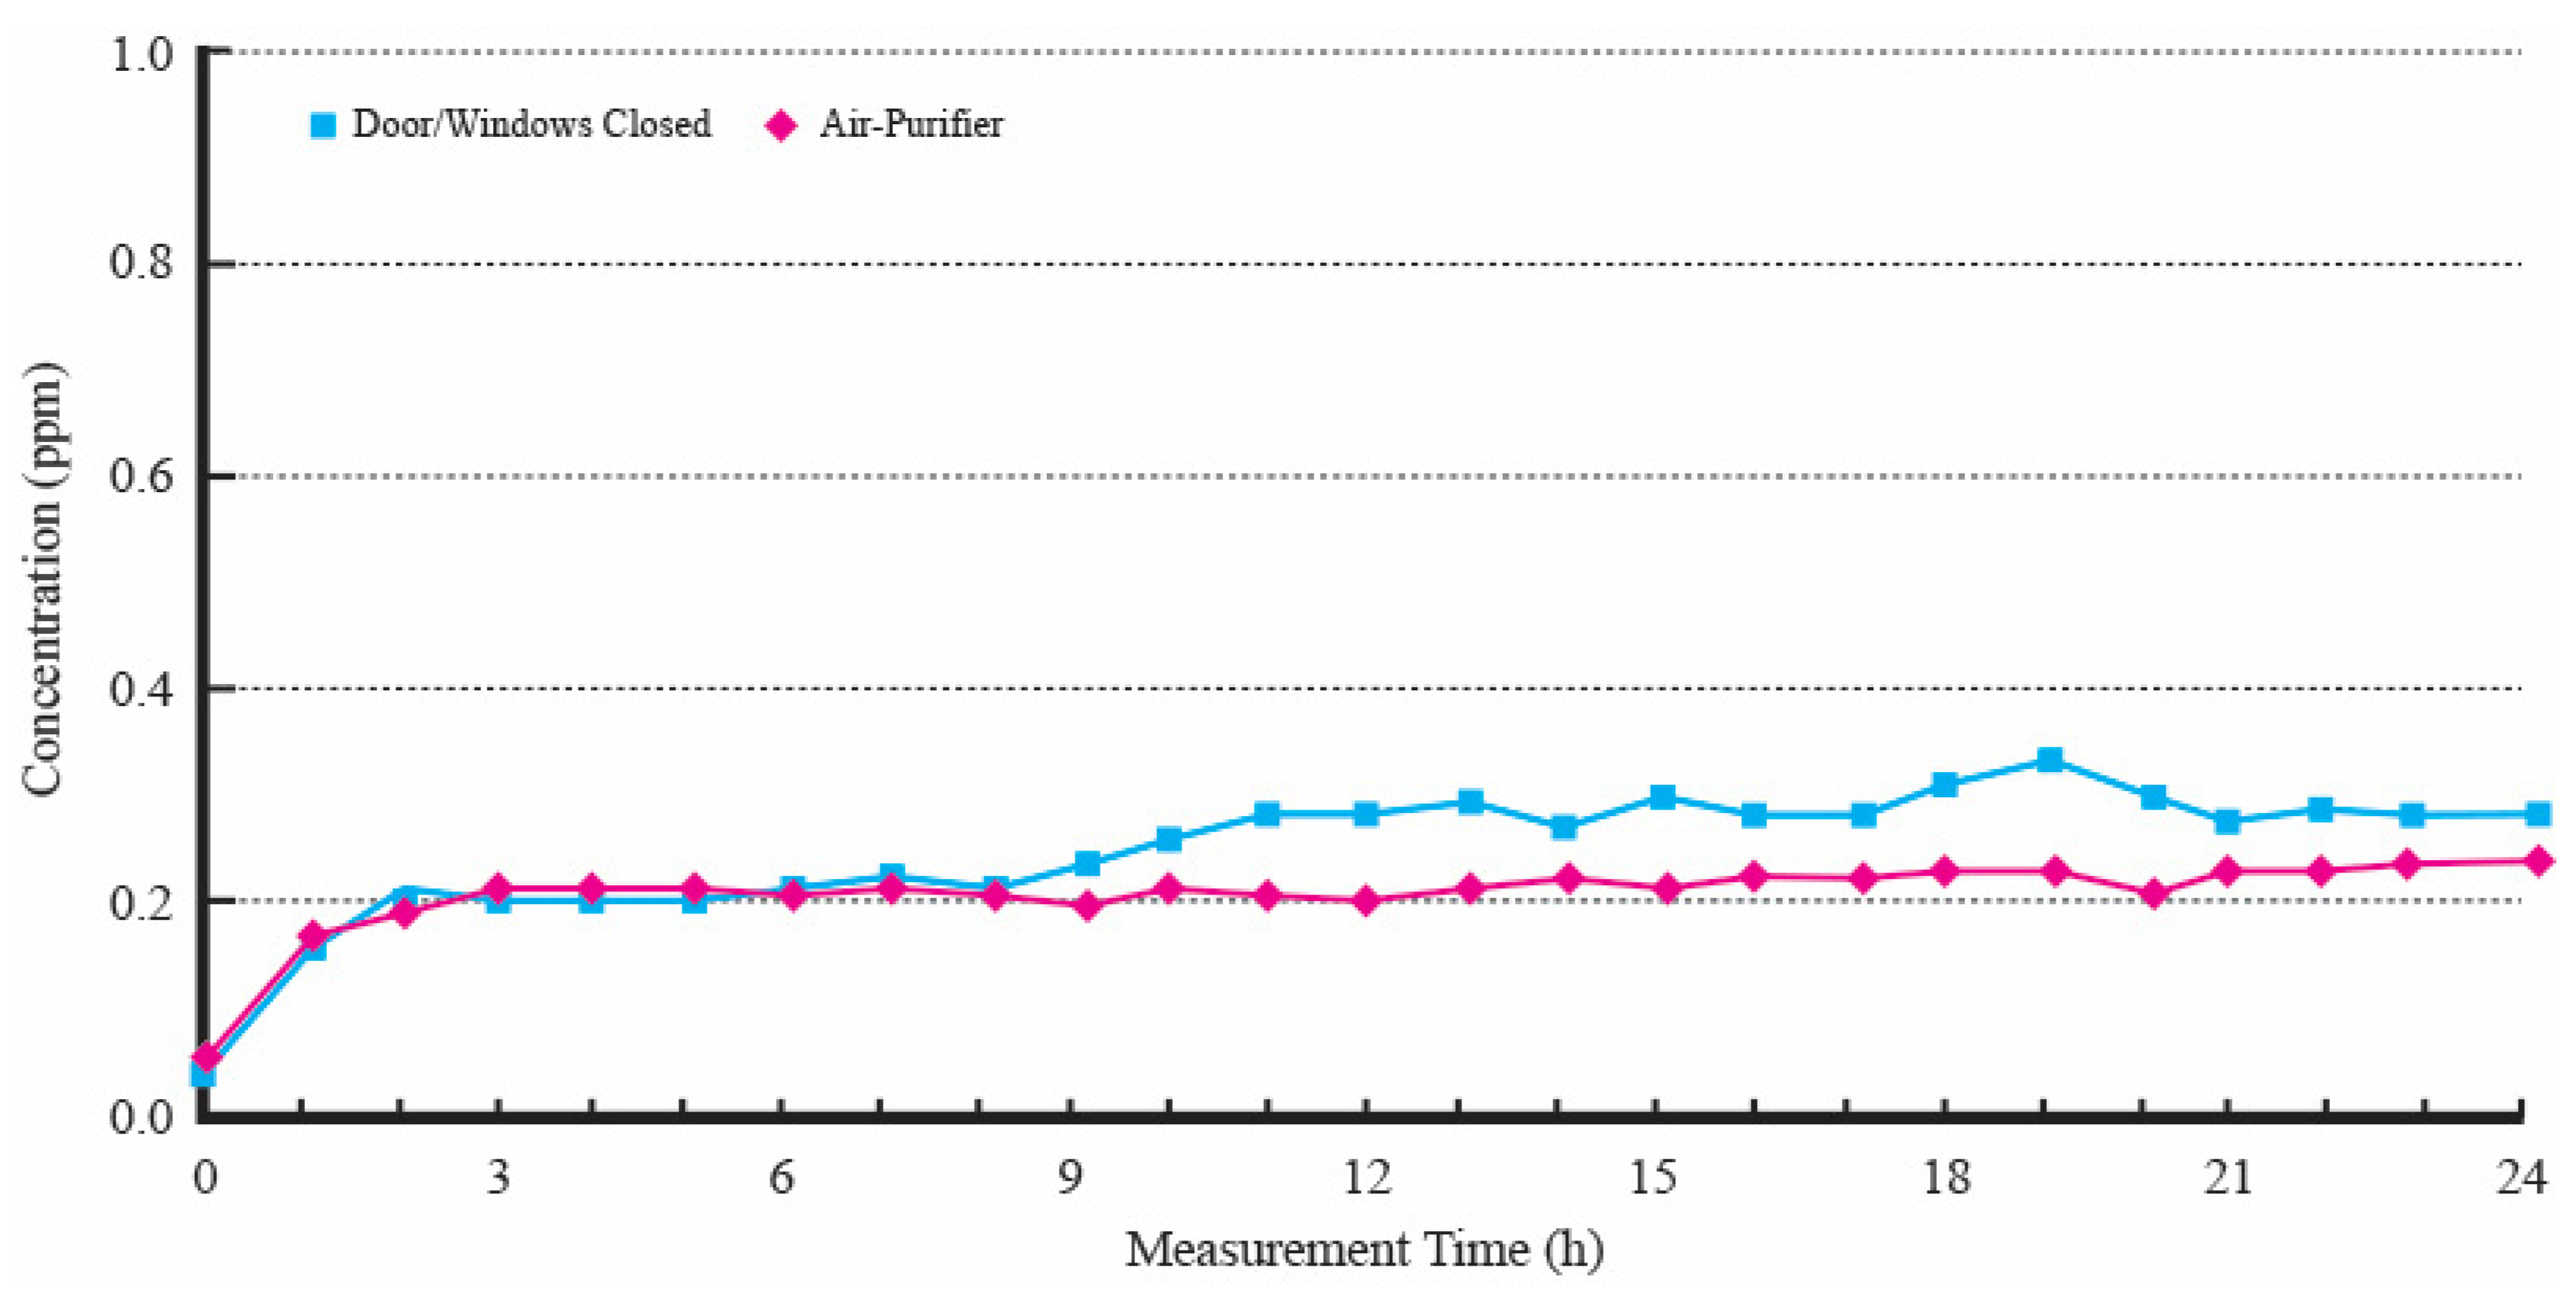
3.2. Effect of Reducing HCHO Concentration by Air Purifier

Figure 5 illustrates the variation in HCHO concentration under different conditions. It compares the change in HCHO concentration when an air purifier with a dedicated VOC filter (manufactured by S, designed for two-bedroom use) was operated at high capacity with windows and doors closed in Room 2, which features a built-in wardrobe. The HCHO concentration was also measured by sealing the windows and turning off the air purifier.
Initially, up to 8 h after measurements commenced at sunrise, the HCHO concentration was recorded at 0.22 ppm, closely matching the concentration observed without the air purifier in operation. This suggests that while the air purifier operated during the first 8 h, it had a negligible impact on reducing HCHO concentration. The lack of immediate effectiveness could be attributed to several factors, such as the initial high levels of HCHO, the room size relative to the purifier’s capacity, or the time required for the purifier to achieve a significant reduction in HCHO levels.
However, from 8 h post-measurement onward, the air purifier began to have a more noticeable impact, reducing the HCHO concentration slightly compared to when it was not used. After 24 h, the HCHO concentration was 0.29 ppm without the air purifier. In contrast, it was 0.24 ppm with the air purifier in operation, representing an approximate 18% reduction in HCHO levels due to its usage.

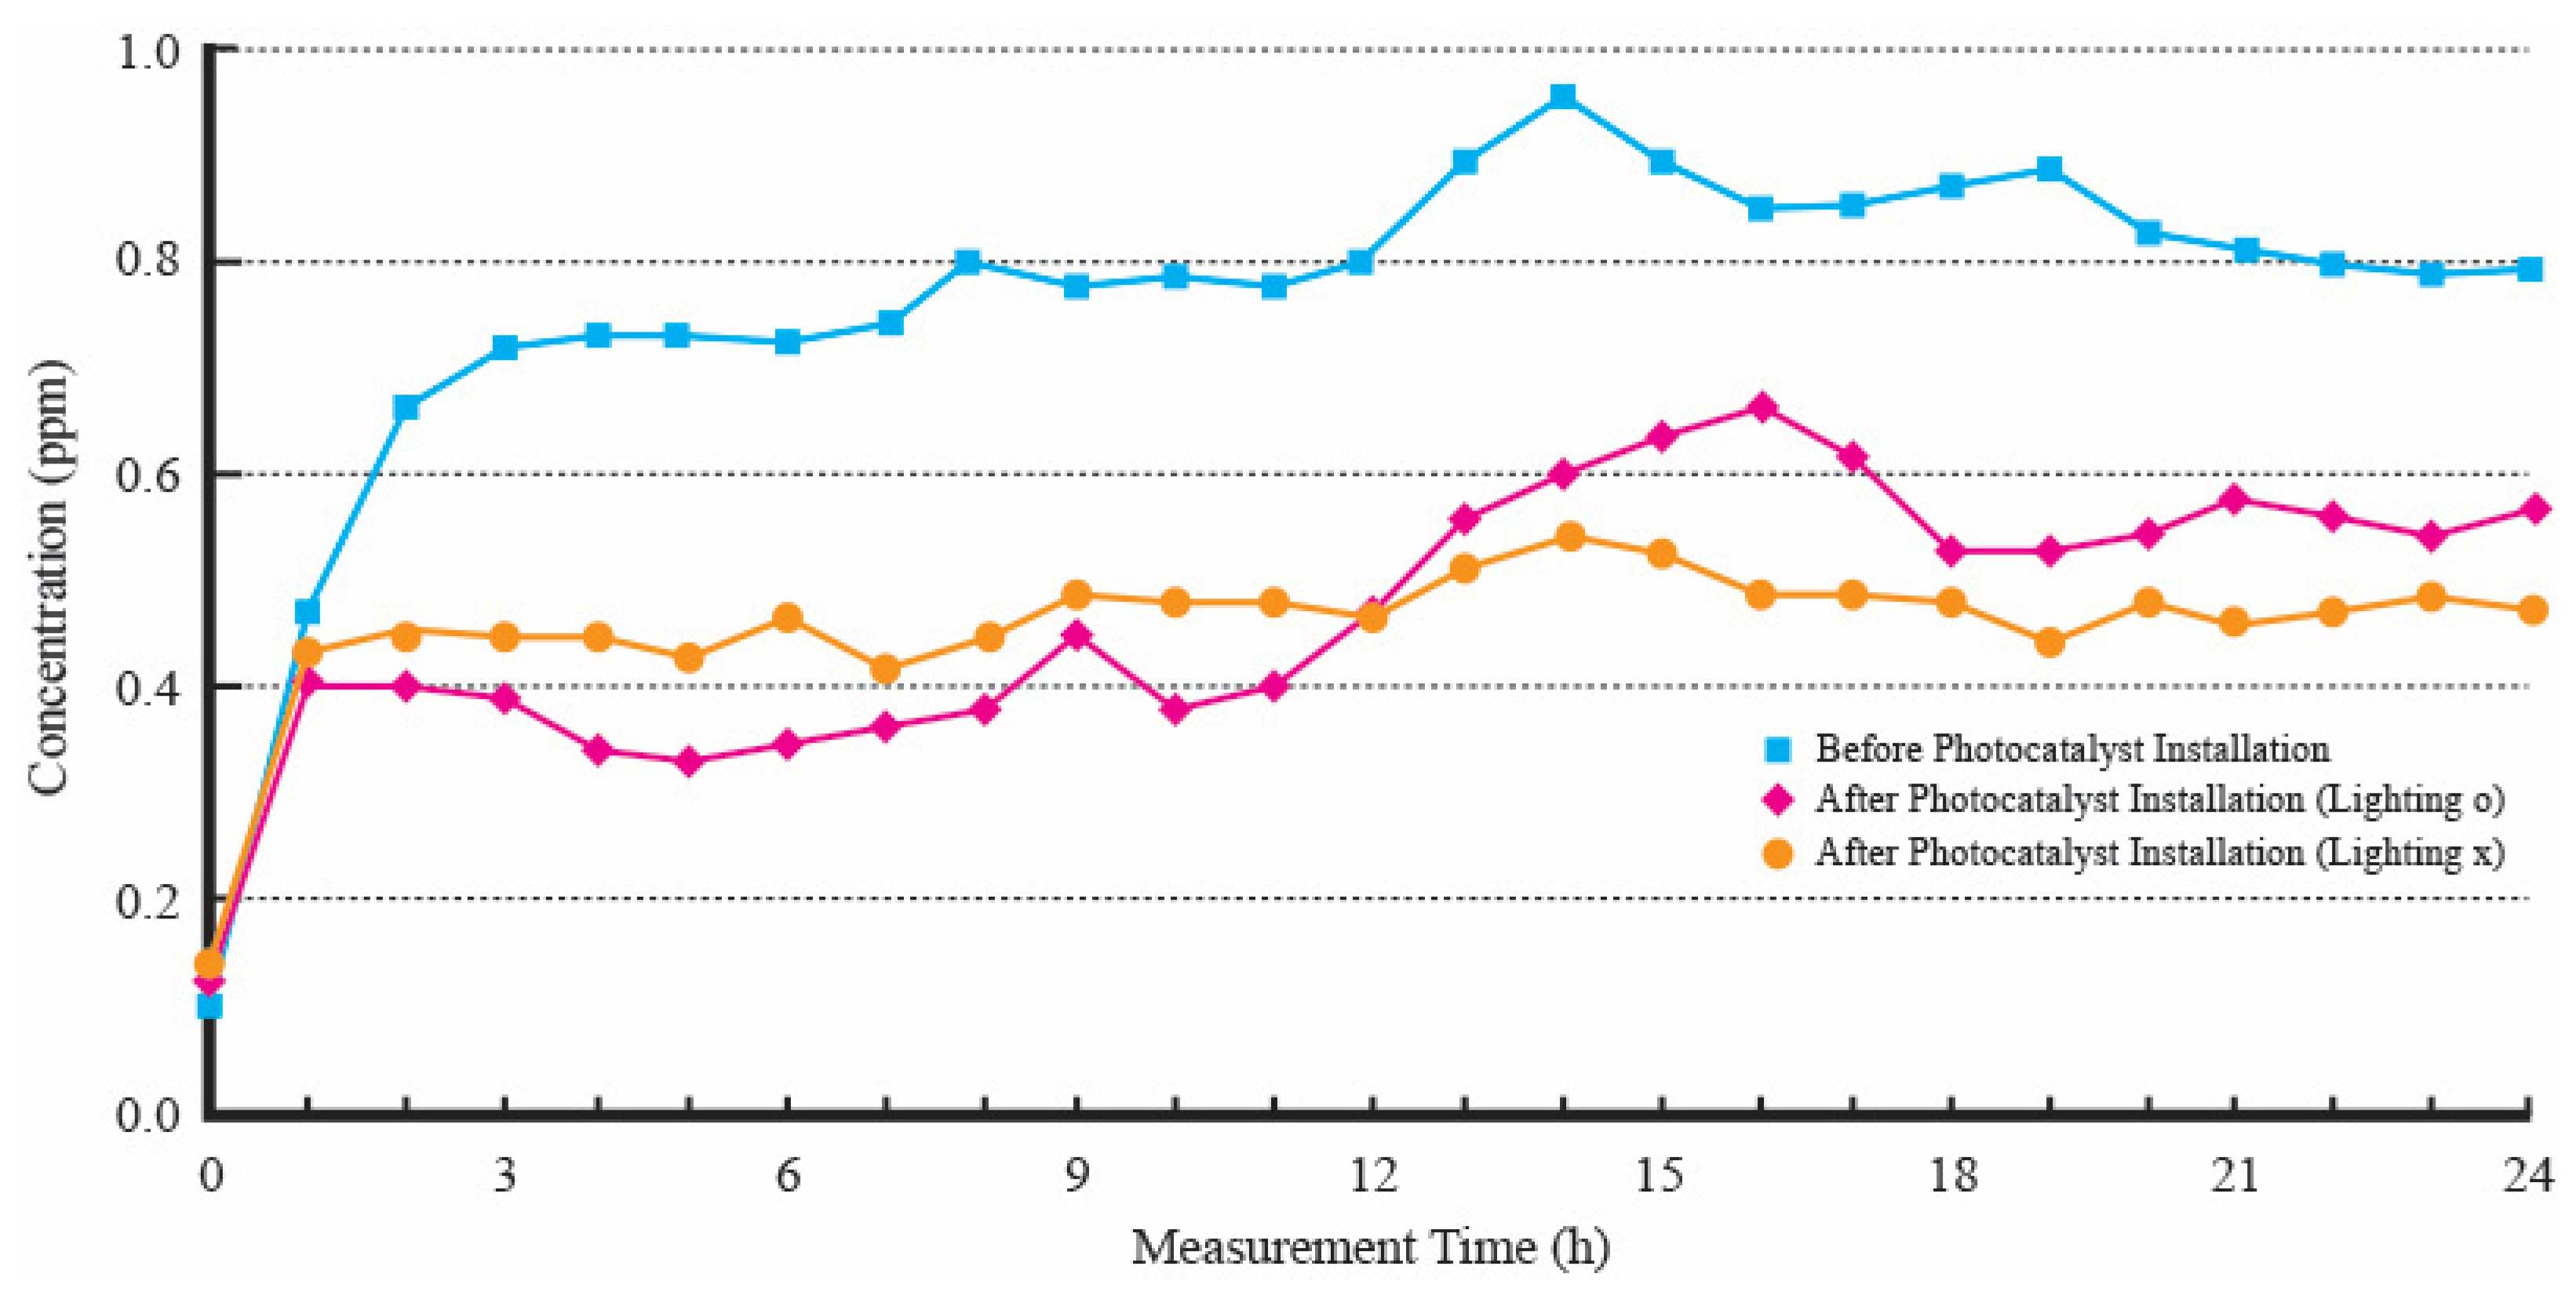
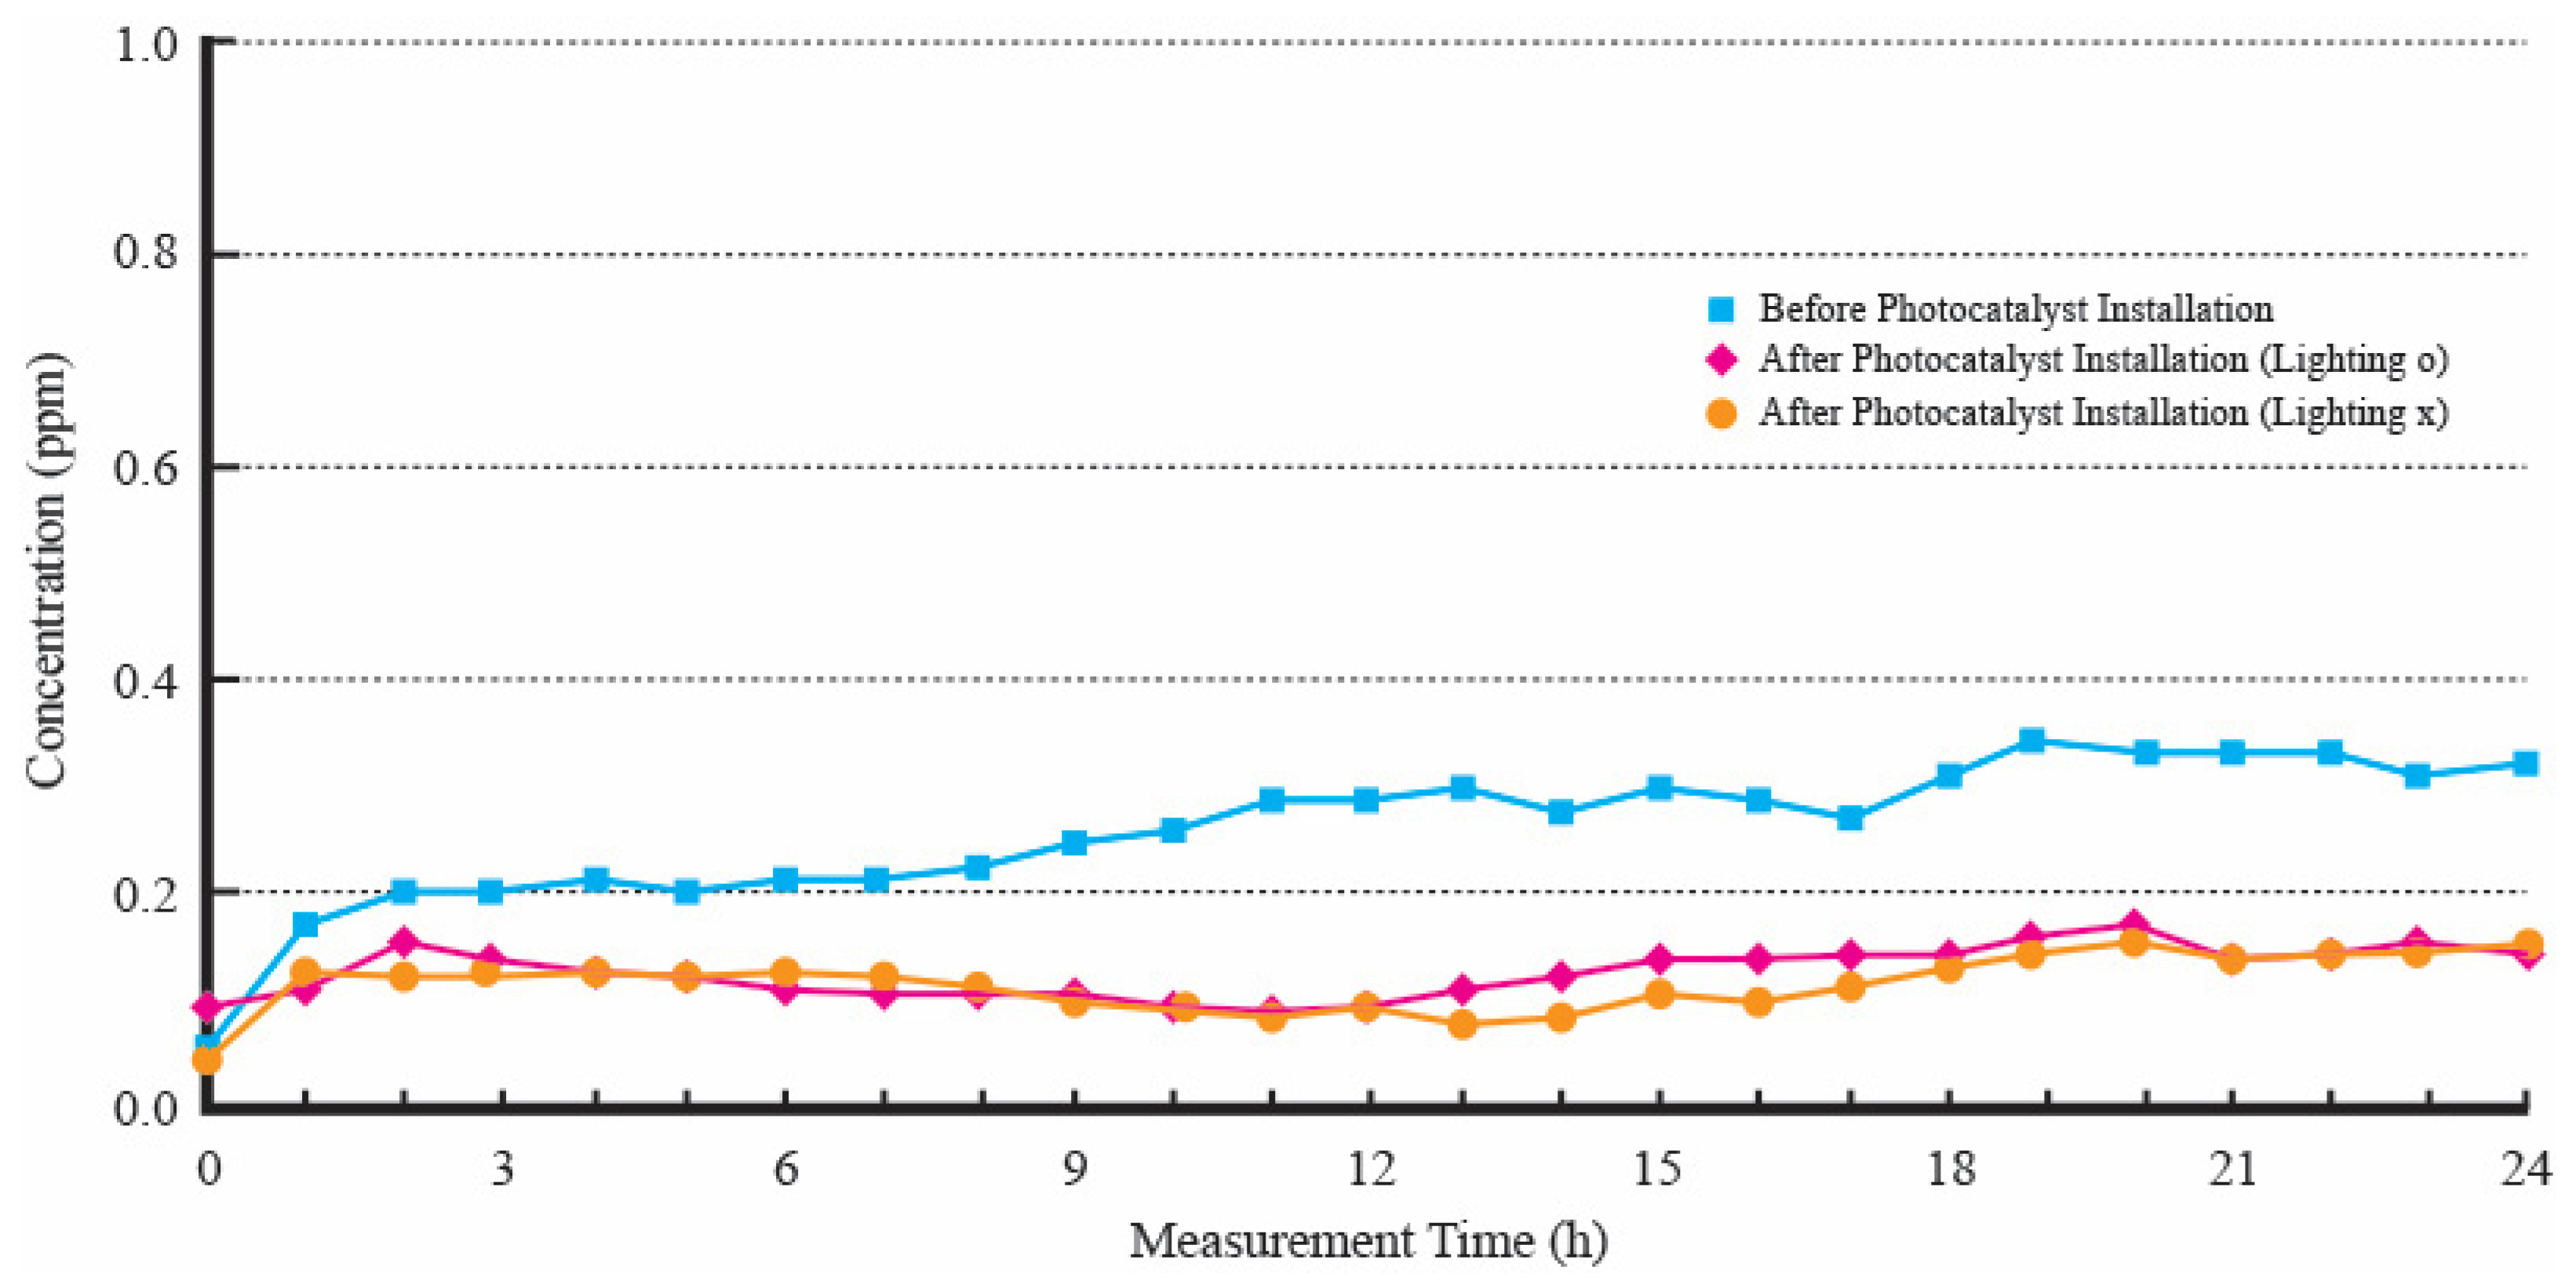
3.3. Effect of Reducing HCHO Concentration by Photocatalyst Construction

The reduction characteristics of HCHO concentration were examined by spraying a photocatalyst containing titanium dioxide on indoor walls, floors, and ceilings. When the surface of titanium dioxide (TiO2) is irradiated with UV light (λ < 400 nm) with energy exceeding the band gap, electrons on the TiO2 surface transition from the valence band to the conduction band, resulting in the creation of holes in the valence band. The electrons and holes created in this manner diffuse and migrate to the TiO2 surface, where the water or OH adsorbed on the TiO2 surface reacts with the hole to generate OH radicals. Oxygen in water reacts with electrons to generate O22− radicals, which then produce additional OH radicals, decomposing organic substances on the surface of TiO2 through a photocatalytic reaction.
Figure 6 and Figure 7 show the HCHO concentration reduction characteristics when a photocatalyst containing TiO2 was evenly sprayed and applied to the floor, walls, ceiling, and door of the MBR and Room 2. As photocatalysts react with ultraviolet rays around 400 nm, the HCHO concentration was continuously measured for 12 h with indoor fluorescent lights turned on (followed by 12 h with the lights turned off) and 24 h with the fluorescent lights turned off. A comparison of HCHO concentrations was conducted under these conditions. Measurements of HCHO concentration were taken before the installation of the photocatalyst and 48 h after it had been applied to the floor, walls, and ceiling. The fluorescent lights were turned off for 24 h (denoted as ×) and then turned on for 12 h before being turned off again for another 12 h (denoted as ) to compare the HCHO concentrations under these lighting conditions.
As a result, the HCHO concentration was found to be 0.8 ppm before the photocatalyst application. After the photocatalyst application, the concentration was reduced to approximately 0.40 ppm. When the fluorescent light was turned on, the concentration was lower than the measurements taken with the light turned off, indicating that turning on the fluorescent light contributes to a reduction in HCHO concentration. In Room 2, Figure 7 shows that the HCHO concentration was around 0.30 ppm before the photocatalyst installation. After the installation, the concentration was measured to be approximately 0.15 ppm, regardless of whether the lighting was turned on. This reduction, like the results observed indoors, suggests that the photocatalyst application effectively reduces the HCHO concentration by about half.

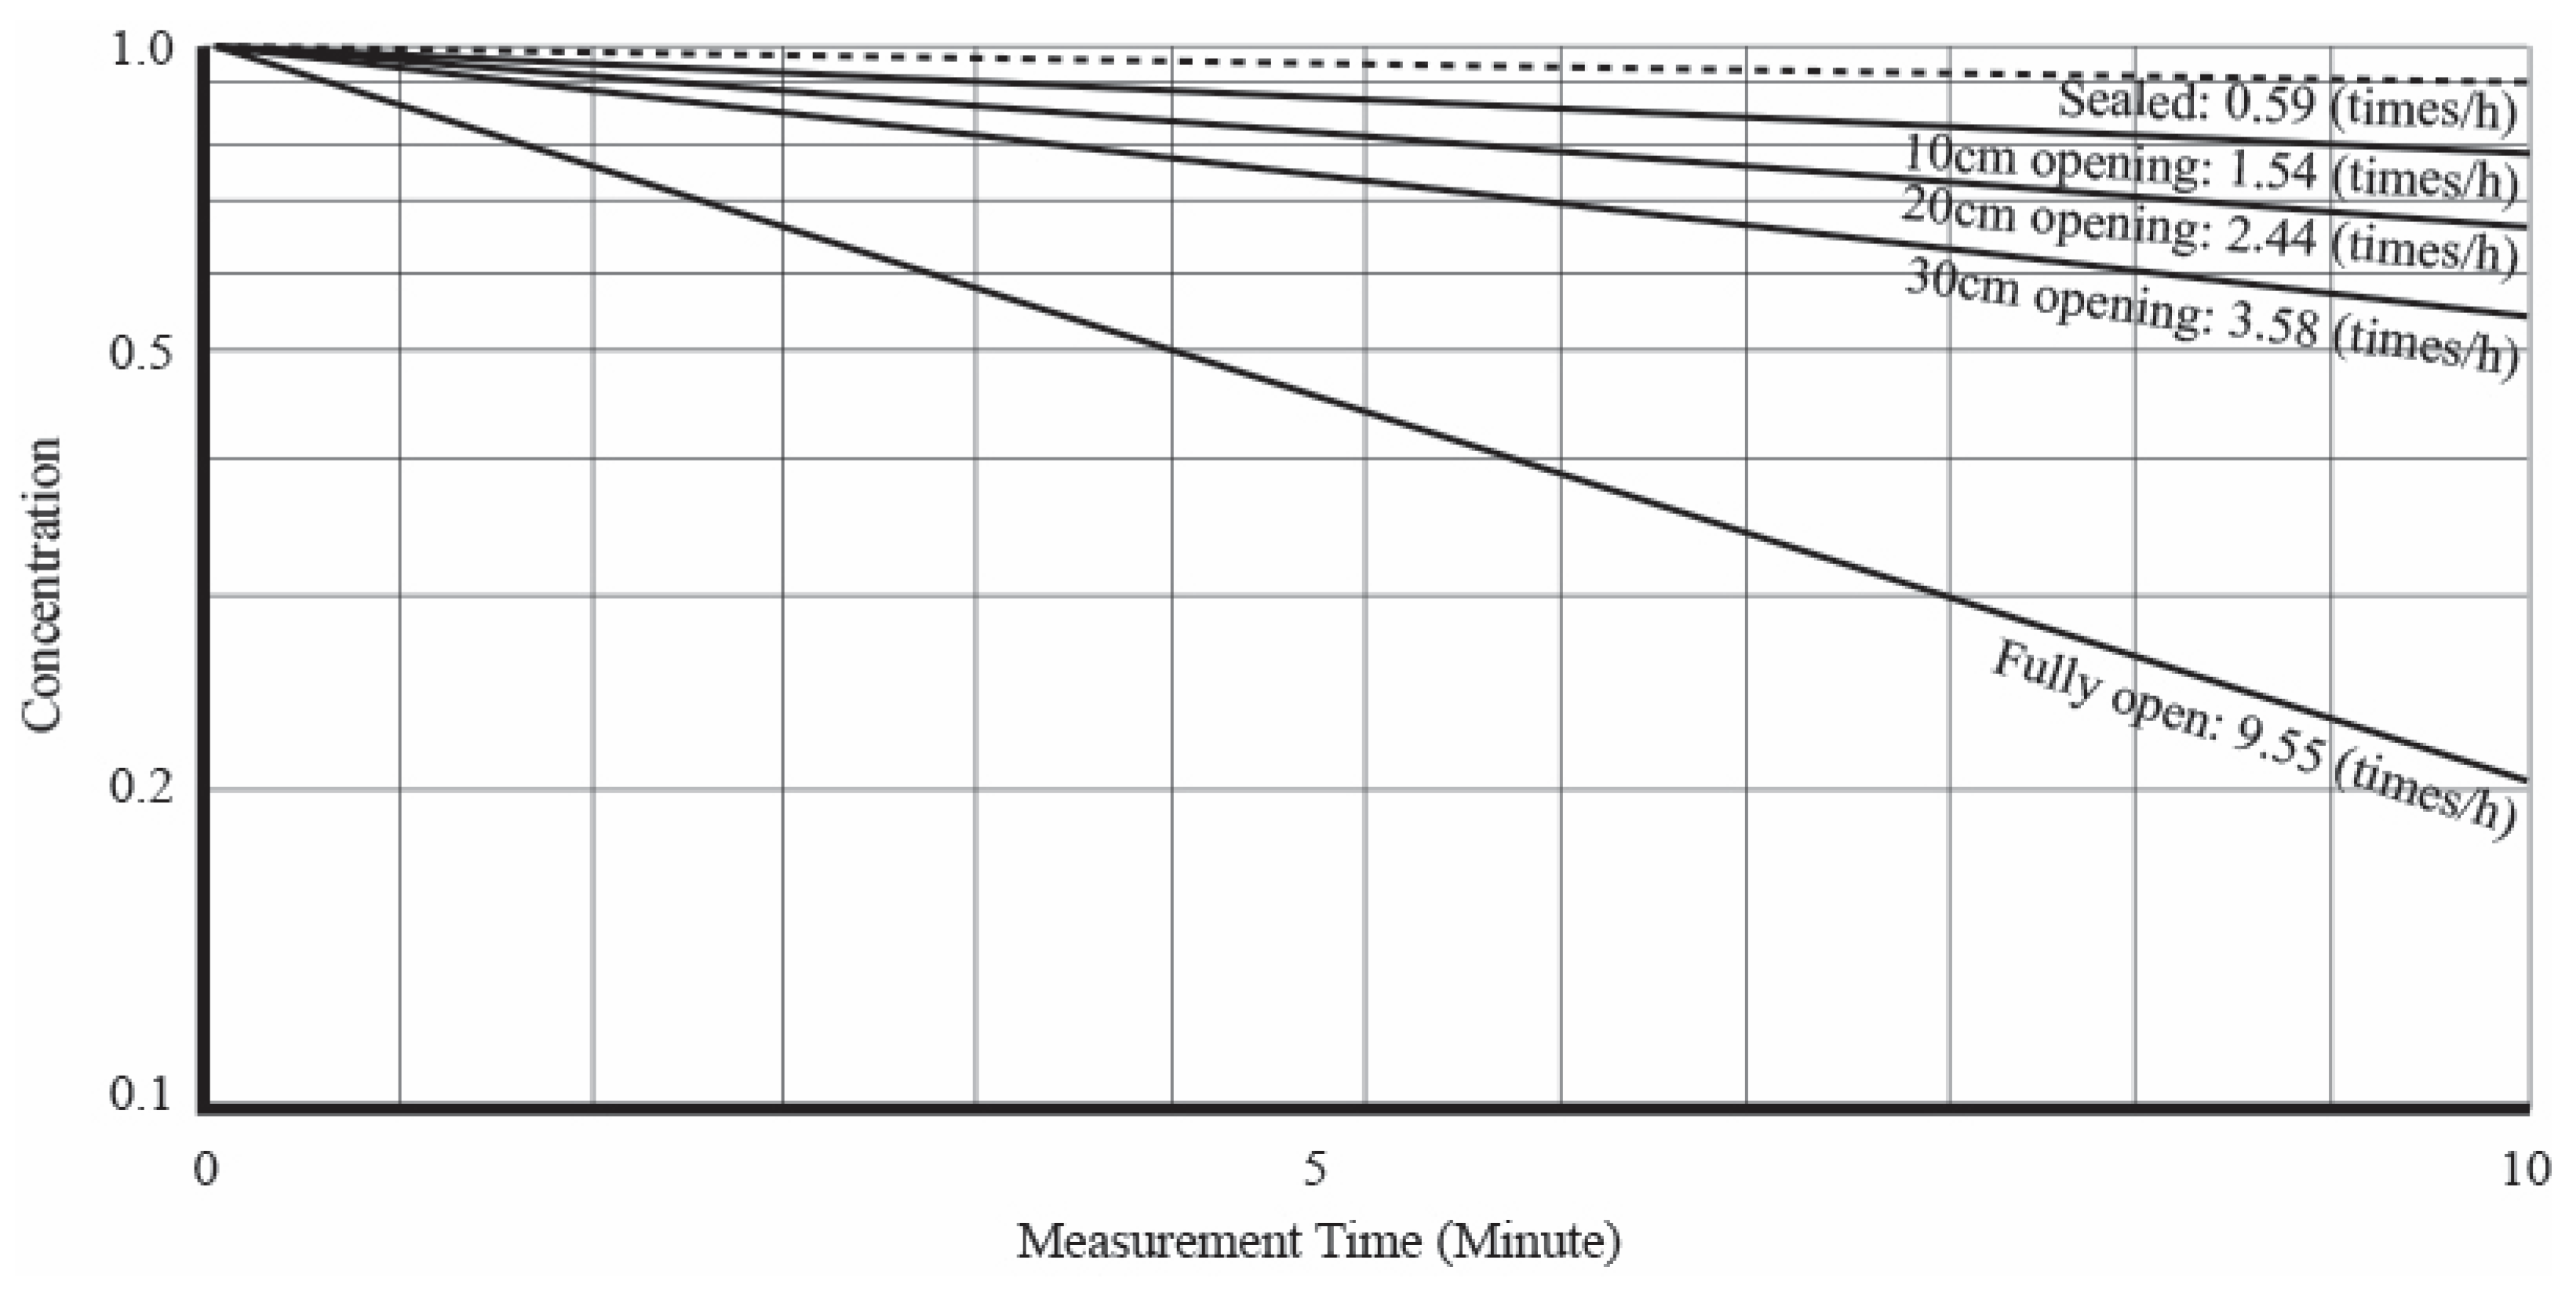
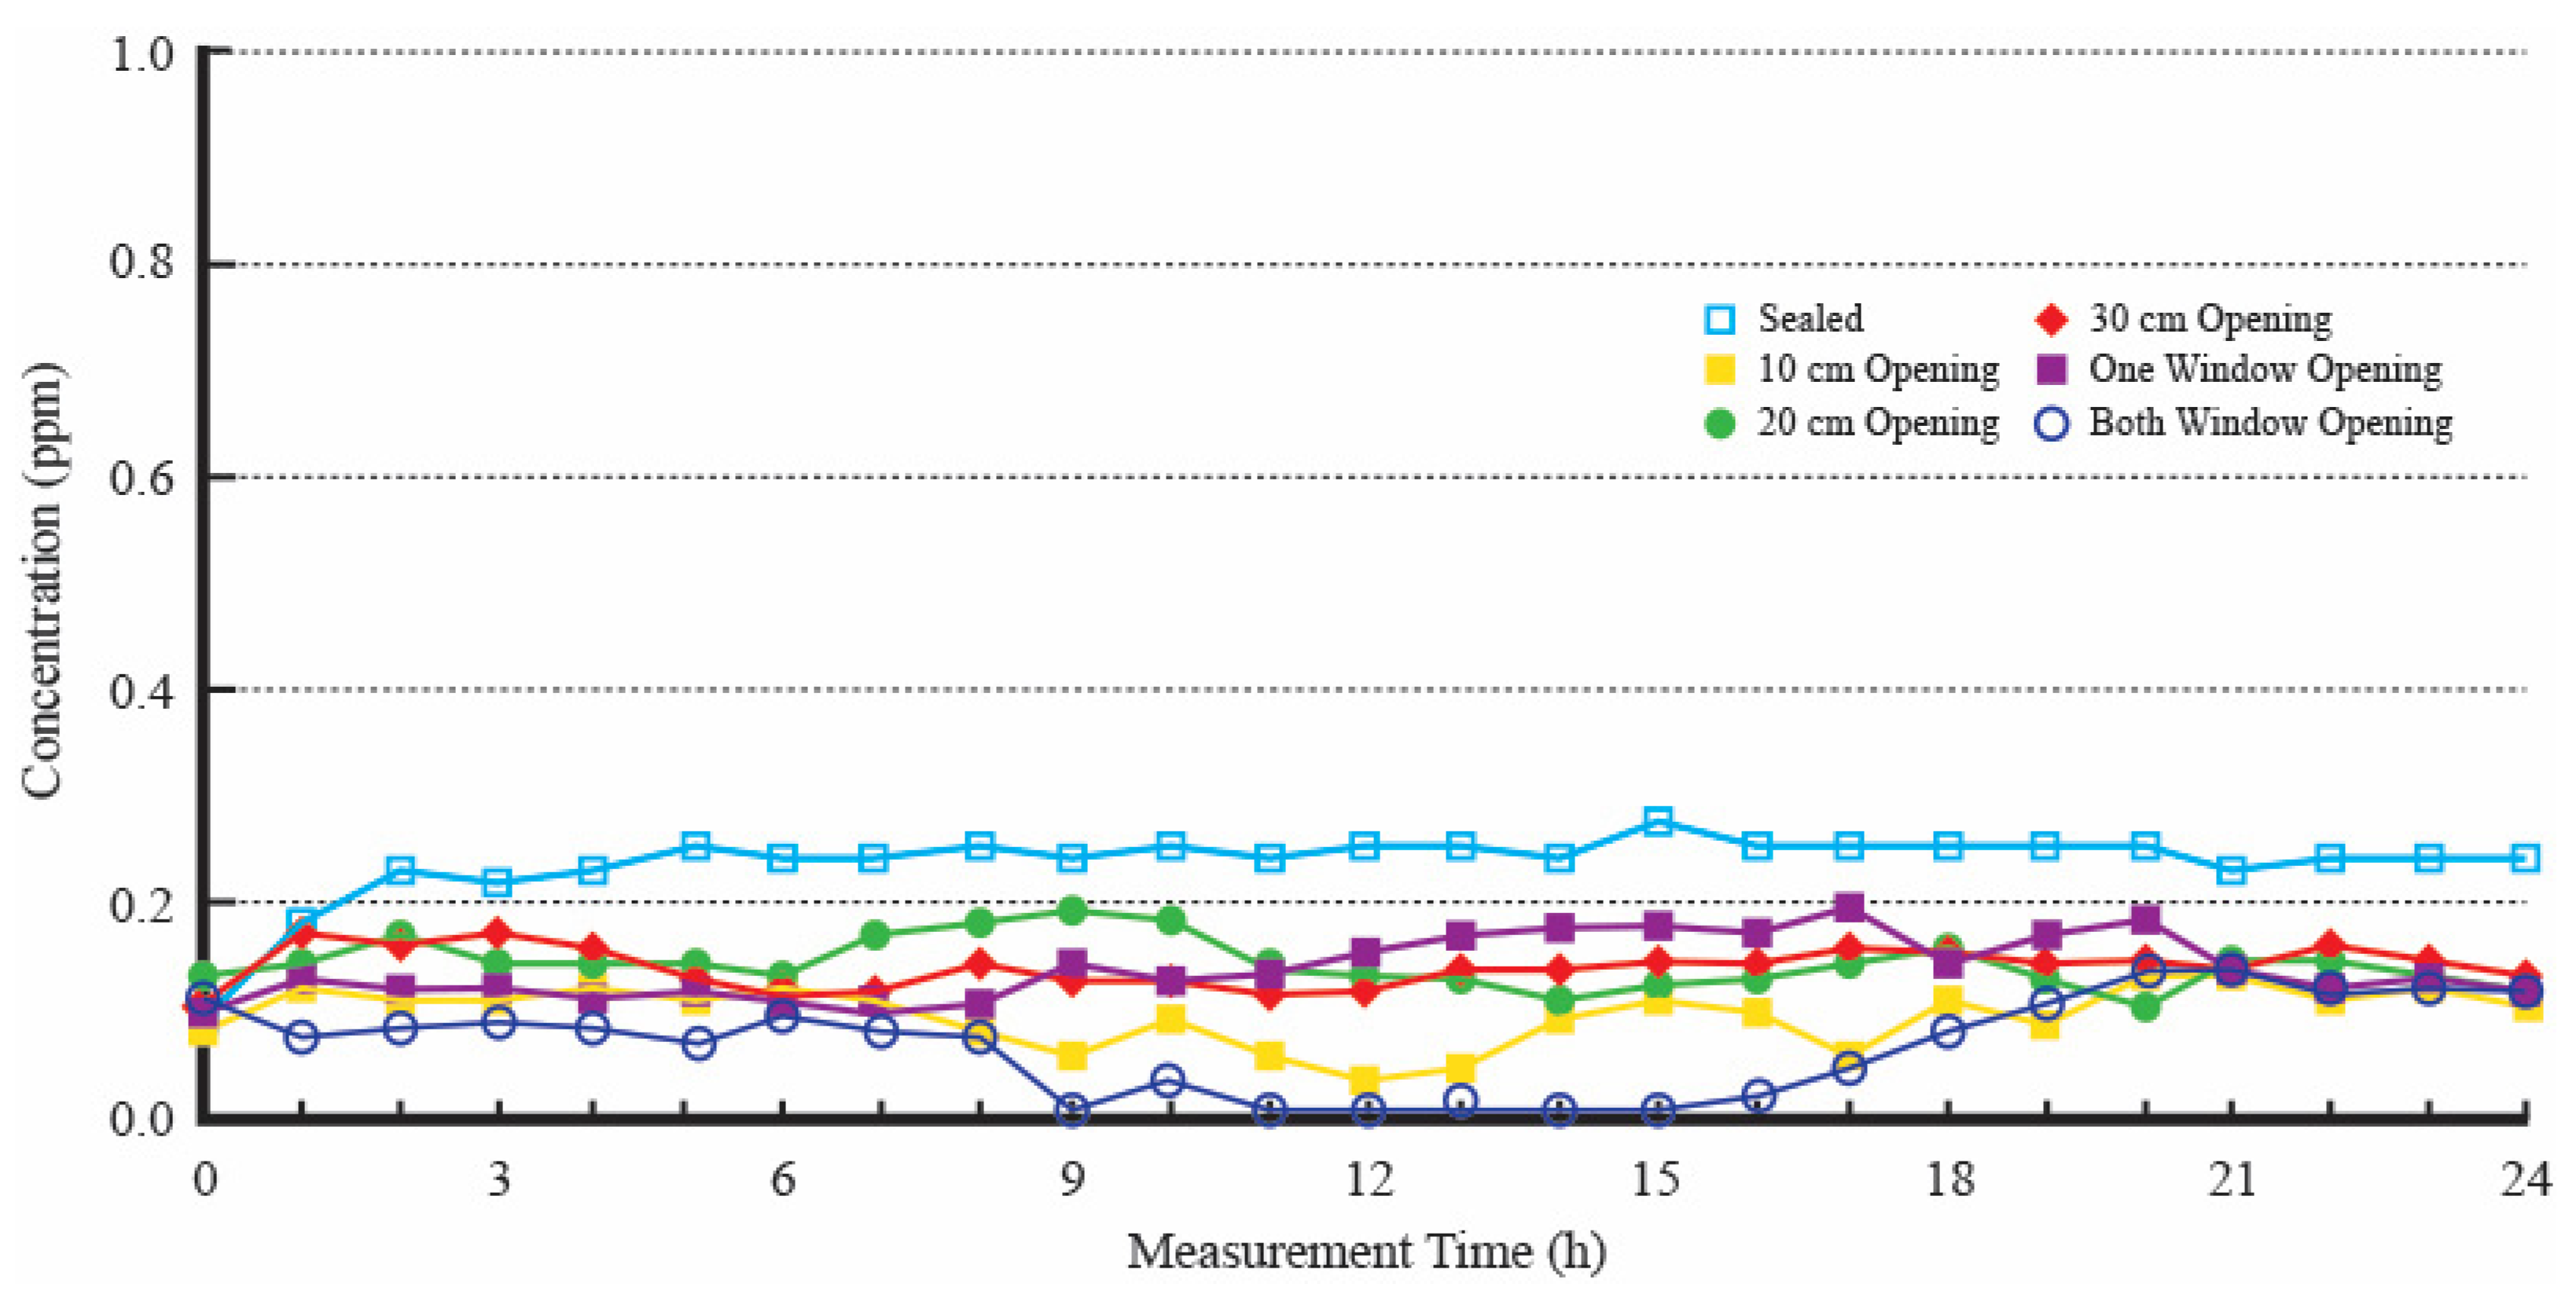
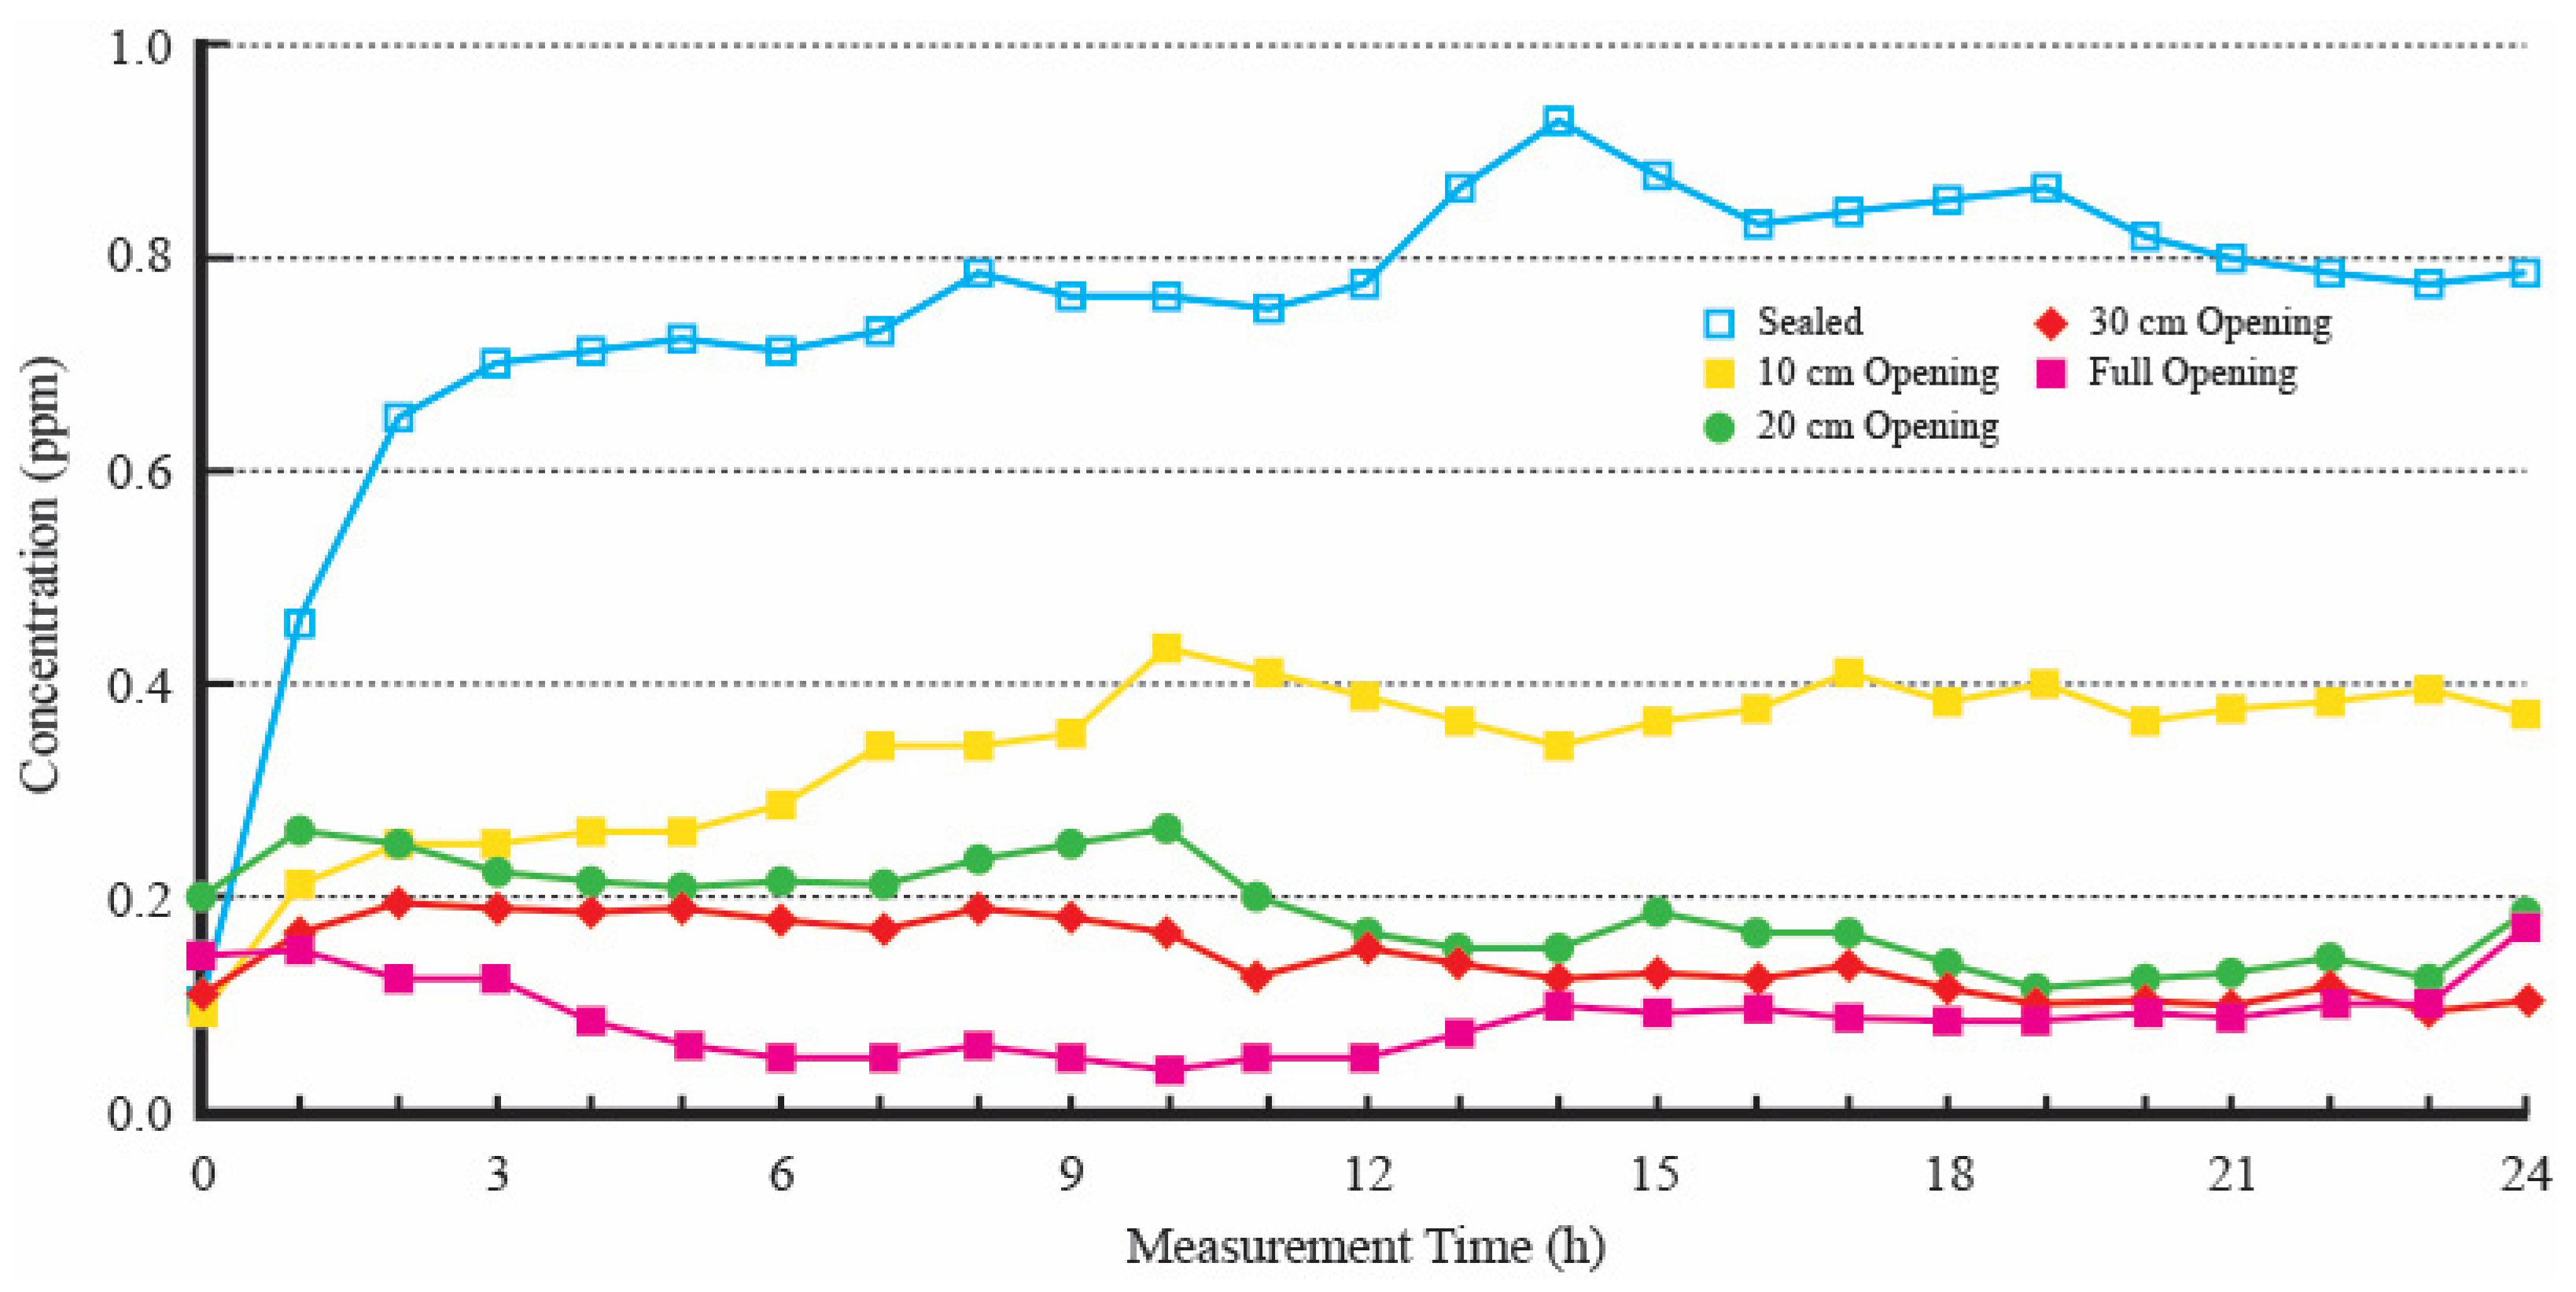
3.4. HCHO Concentration According to Window Opening Conditions

Figure 8 illustrates the gas concentration results using the Tracer Gas Method under varying window opening conditions in MBR. The conditions include fully open veranda windows with sealed indoor windows, indoor windows opened by 10 cm, 20 cm, and 30 cm, and fully opened windows. The number of air changes per hour (ACH) was calculated using the attenuation method. As shown in Figure 8, the ventilation rate was determined from the CO2 concentration within the interior room. All measured CO2 concentration data were used and approximated using the least squares method to calculate the ACH. The dotted line represents the measured CO2 concentration, while the solid line represents the ventilation rate computed using the least squares method. When the indoor window was sealed, the ACH was 0.59 times per hour. When the window was opened by 10 cm, the ACH increased to 1.54 times per hour, and for a 20 cm opening, the ACH was 2.44 times per hour. With a 30 cm opening, the ACH was 3.58 times per hour, and with the entire window fully opened, the ACH was measured at 9.55 times per hour.
For sealed indoor windows in each room, the ACH was measured as follows: 0.52 times per hour in the living room, 0.59 times per hour in the interior room, 1.06 times per hour in Room 1, and 20.27 times per hour in Room 2. Room 1, which had the most significant indoor window size relative to its volume, exhibited the highest ventilation rate. Additionally, with a 10 cm opening of indoor windows in each room, the ACH was 1.99 times per hour in the living room, 1.54 times per hour in the MBR, 5.66 times per hour in Room 1, and 4.03 times per hour in Room 2. This demonstrates that the ACH is proportional to the size of the window opening area in each room. This trend indicates that the ventilation rate is directly proportional to the window opening area, even if the window opening width is the same, due to the differing open areas of the indoor windows in each room.
Figure 9 presents the reduction characteristics of formaldehyde (HCHO) concentration under various window opening conditions in the living room. When the indoor window was sealed, the HCHO concentration was approximately 0.25 ppm. Although the concentration varied slightly with different window opening areas, it generally decreased. However, except when both windows were fully opened, the concentration typically exceeded the WHO standard of 0.1 ppm.
The HCHO concentration did not fall below the WHO standard of 0.1 ppm, even with the open window, because of the large volume of the living room. The ratio of the window area to the room volume is small, resulting in insufficient ventilation to reduce the concentration significantly.
Figure 10 shows the HCHO concentration reduction in the Master Bedroom (MBR) under various window opening conditions. The concentration was higher with the window closed compared to other rooms. Although partially opening the window reduced the HCHO levels, it did not fall below the WHO standard of 0.1 ppm unless the windows were fully opened. Interestingly, an increase in HCHO concentration after 15:00 suggests the possibility of outdoor pollutants infiltrating the indoor environment, especially in urban areas where outdoor air quality can vary due to traffic or industrial activity.
While the measurement meters were accurate within standard calibration limits, the observed pattern across multiple readings indicates that the increase in HCHO concentration is likely due to actual changes in air quality rather than measurement error. This highlights the need for air quality management strategies that consider indoor and outdoor pollution sources to maintain healthy indoor environments effectively.
In Room 1 and Room 2, the HCHO concentration could be maintained below the WHO standard of 0.1 ppm, regardless of the window opening width. This is likely due to the relatively simple interior finishing, which results in lower HCHO generation and a higher ventilation frequency due to the small room volume and large window area.

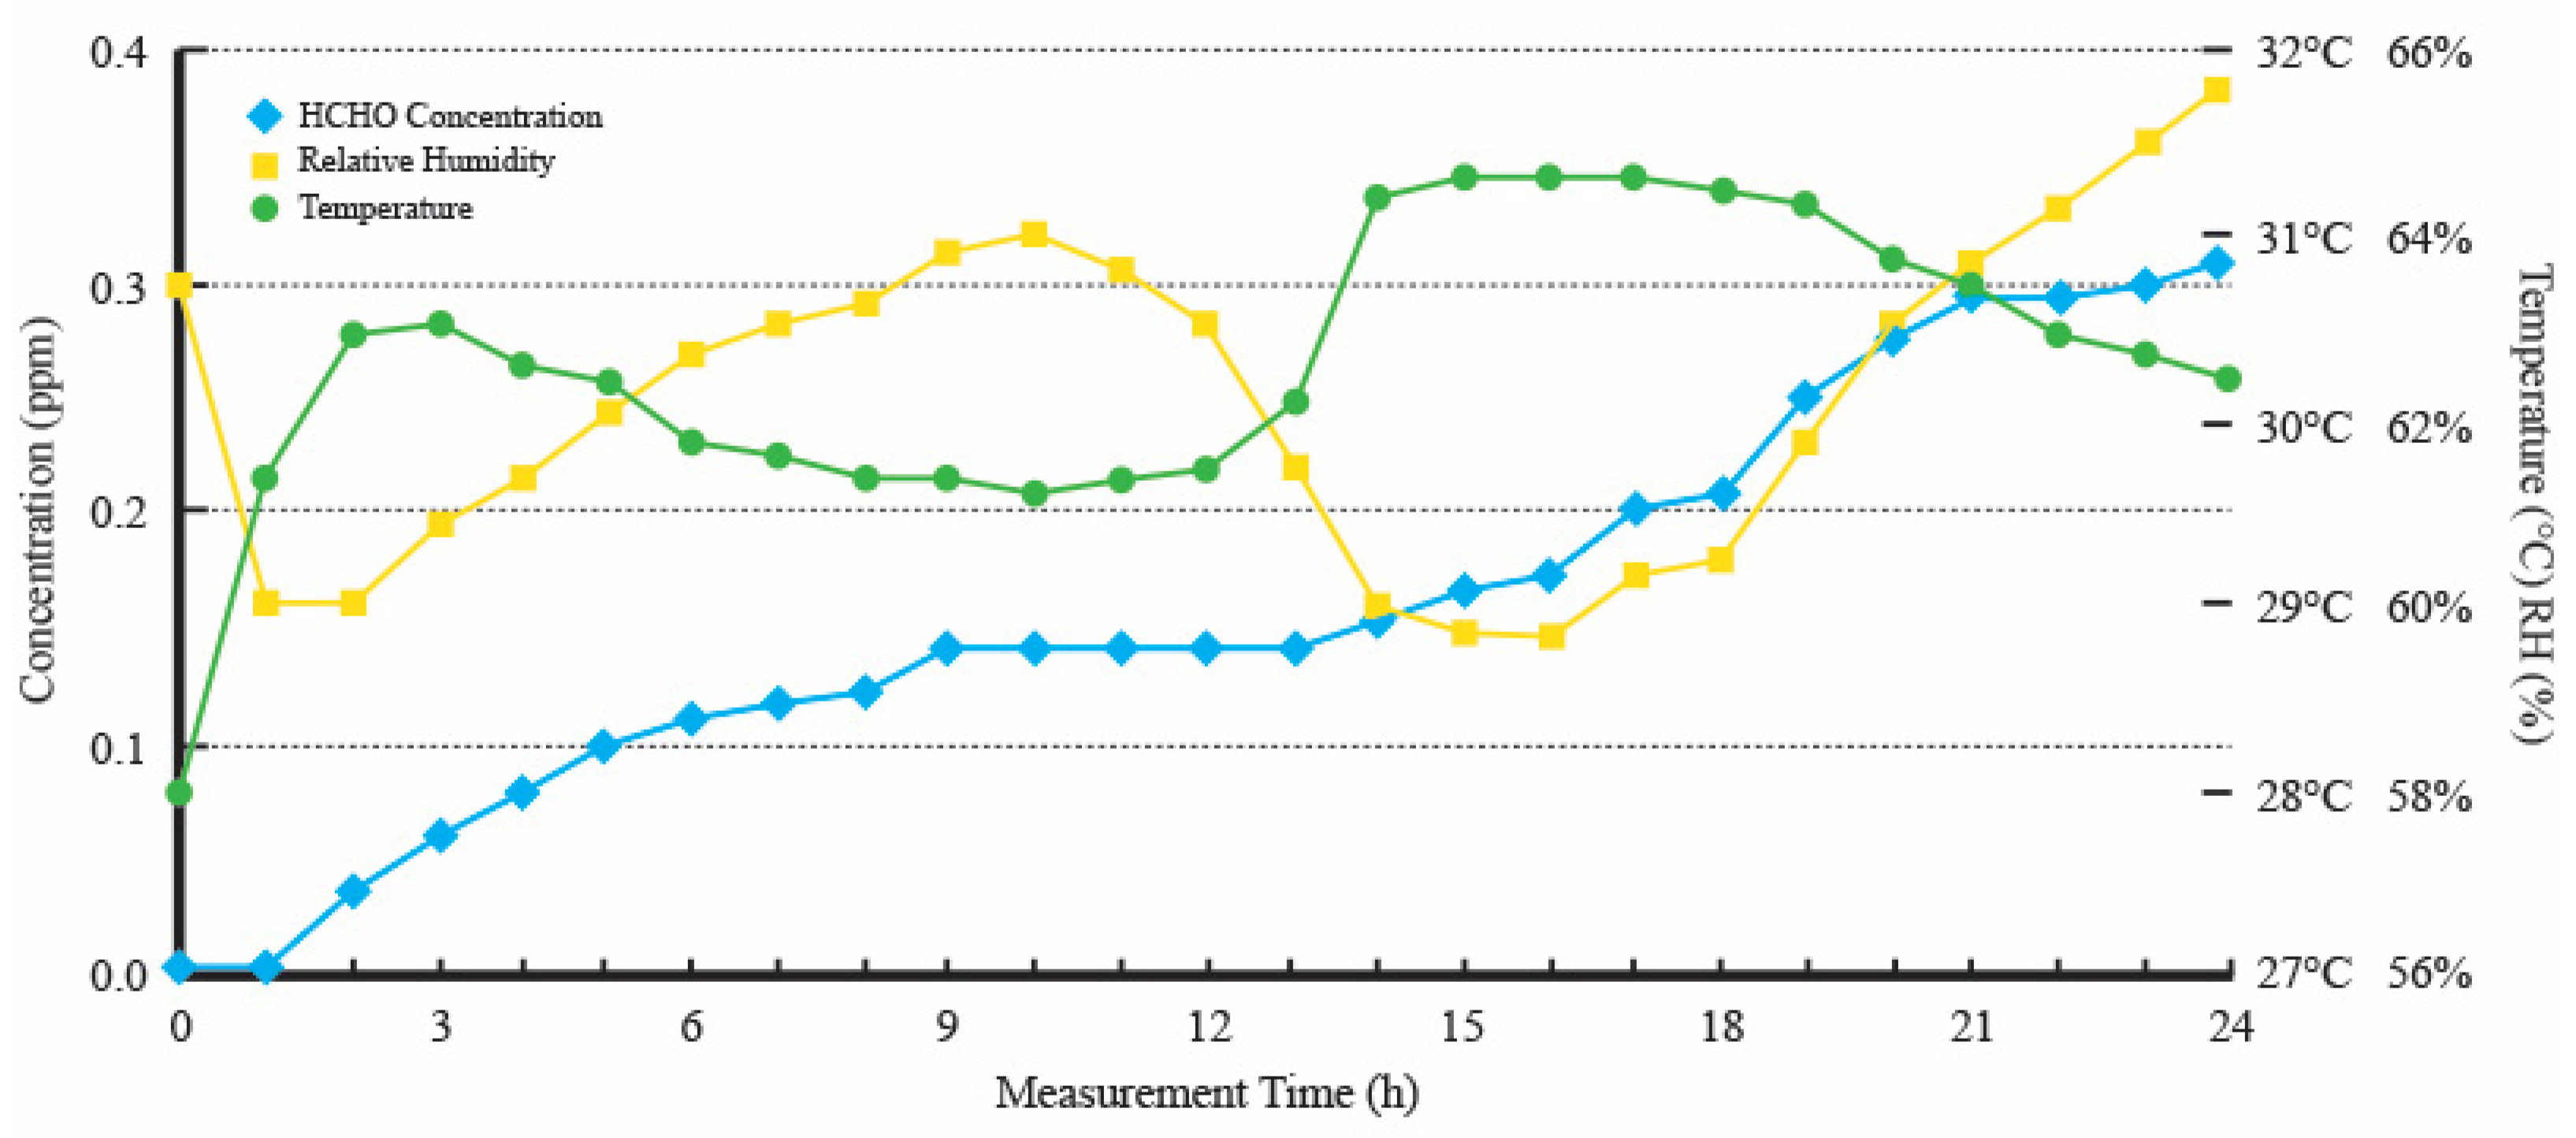
3.5. Relationship between HCHO Concentration and Temperature and Humidity

The relationship between HCHO concentration and temperature and humidity environmental factors is critical to understanding indoor air quality dynamics, especially in sealed environments. This section explores how these variables interact over 24 h, using data collected in Room 2 under controlled conditions.
Figure 11 illustrates the changes in both outdoor and indoor temperatures. The outdoor temperature reached its lowest point of 24 °C around 5:00, just before sunrise, and peaked at 35 °C around 13:00, decreasing gradually. This pattern is typical for the diurnal temperature cycle in the region, where cooler night temperatures give way to warmer daytime conditions due to solar radiation. These fluctuations are reflected indoors, though with some differences in magnitude and timing.
Conversely, the indoor temperature rose rapidly as soon as the measurement began. This rapid increase can be attributed to the heat transfer from the external environment through the building envelope, especially given that the measurement was conducted during winter when the relatively low outdoor temperature contrasts sharply with the indoor environment once ventilation is minimized. The indoor temperature rose to approximately 27 °C. This increase is believed to be influenced by the heat accumulated in the exterior walls, such as concrete, which are slow to release stored heat, thereby contributing to a gradual rise in indoor temperature even after external temperatures begin to drop.
Following this, the indoor temperature continued to rise until 3:00 due to the heat stored in the concrete exterior walls. Concrete and similar materials have a high thermal mass, meaning they absorb and retain heat during the day and release it slowly at night, which explains the continuous rise in indoor temperature even as outdoor temperatures fall. The indoor temperature decreased around 5:00, just before sunrise, when the outdoor temperature was at its lowest. The indoor temperature gradually decreased until 11:00 and then sharply rose again from noon until 14:00, in line with the rising outdoor temperature. This midday rise is a response to increasing solar radiation, which heats the building envelope and, in turn, the indoor environment, even when direct ventilation is limited. Subsequently, the indoor temperature gradually rose until sunset at 19:00 and then decreased with the sunset, measuring 30.2 °C at the end of the measurement, fluctuating within the range of 27 °C to 31.3 °C.
Figure 12 also presents the results of simultaneously measuring HCHO concentration, temperature, and humidity over 24 h in a sealed state in Room 2. The indoor temperature increase corresponded with a decrease in humidity, demonstrating the inverse relationship between these two variables. Temperature and humidity showed opposite patterns, fluctuating within the range of 59.2% to 65.4%. This inverse relationship occurs because warmer air can hold more moisture, which results in lower relative humidity as the temperature rises, assuming the absolute moisture content remains constant.
The indoor HCHO concentration was 0 ppm at midnight at the start of the measurement, but it gradually increased as the indoor temperature rose. This correlation indicates that HCHO emissions are temperature-dependent, as higher temperatures accelerate the off-gassing of formaldehyde from building materials and furnishings. The concentration increased sharply until 9:00, reaching 0.14 ppm. This sharp rise corresponds with the rapid temperature increase observed earlier, suggesting that materials within the room release HCHO more readily as they warm up. Between 9:00 and 12:00, the rate of increase slowed slightly. This slowdown could be due to the diminishing rate of temperature rise during this period, leading to a more stable rate of HCHO release. It rose again from 13:00 to 21:00, albeit slower, indicating sensitivity to temperature fluctuations. This continued increase throughout the day highlights the cumulative effect of sustained elevated temperatures on HCHO concentrations, even as the rate of temperature rise moderates. The overall trend of HCHO concentration mirrored the fluctuations in room temperature but with a slight lag, showing that the HCHO concentration did not immediately respond to temperature changes but followed them with a time delay. This lag suggests that the materials within the room take time to adjust to temperature changes, with the release of HCHO being a gradual process rather than an instantaneous response.
The relationship between HCHO concentration and environmental factors such as temperature and humidity is complex, with temperature being the primary driver of HCHO emissions. The time-lagged response of HCHO levels to temperature changes indicates the importance of continuous monitoring and adaptive management strategies to control indoor air quality effectively. Understanding these dynamics is essential for designing interventions that mitigate the health risks associated with prolonged exposure to elevated HCHO levels.

4. Discussion

The results of this study provide significant insights into the factors affecting indoor HCHO concentration and the efficacy of various mitigation strategies in newly constructed residential units. Other studies have reported similar findings, reinforcing the importance of proper ventilation and air quality management. For example, a study by Zhang et al. (2020) [54] examined the impact of ventilation and air purifiers on HCHO concentrations in urban office buildings. The study found that increasing the air change per hour (ACH) through enhanced ventilation could significantly reduce HCHO levels, with results comparable to the findings in this study. Specifically, Zhang et al. reported that increasing the ACH from 0.5 to 8 times per hour led to a substantial decrease in HCHO concentrations, similar to the ACH increase from 0.59 to 9.55 times per hour observed in this study when windows were fully opened [62]. This comparison highlights the consistency of ventilation as a critical factor in managing indoor air quality across different building types.
The air change per hour (ACH) increased proportionally with the window opening size, demonstrating that even small increases in window opening can significantly enhance indoor air quality. For instance, the ACH values rose from 0.59 times per hour with sealed windows to 9.55 times per hour with fully opened windows. This trend underscores the importance of adequate ventilation in mitigating indoor air pollutants. However, the living room’s more extensive volume and smaller window-to-volume ratio resulted in higher HCHO concentrations despite increased ventilation, suggesting that the room’s structural and volumetric characteristics play a pivotal role in air quality management. This finding aligns with another study by Liu et al. (2019) [63], which explored HCHO concentrations in residential buildings with different room sizes and window-to-volume ratios. Liu et al. found that larger rooms with smaller window-to-volume ratios had higher residual HCHO levels even with ventilation, which supports the observations in this study. Their research emphasized the need for room-specific ventilation strategies to effectively reduce indoor air pollutants, mirroring the recommendations provided in this paper [63].
The study also evaluated the effectiveness of air purifiers and photocatalyst coatings in reducing HCHO concentrations. The air purifier showed a modest impact, reducing HCHO levels by approximately 18% after 24 h. This limited effectiveness could be attributed to the air purifier’s capacity relative to the room size and the initial HCHO levels [64]. Comparatively, the study by Zhang et al. (2020) [54] also noted that while air purifiers could reduce VOCs and HCHO levels, their effectiveness was limited by factors such as room size and initial pollutant concentration, suggesting that air purifiers alone may not be sufficient in larger spaces or cases of high initial pollutant levels.
In contrast, applying a photocatalyst containing titanium dioxide (TiO2) demonstrated a more substantial reduction in HCHO concentrations. Post-application measurements indicated a 50% reduction in HCHO levels, from 0.8 ppm to approximately 0.4 ppm in the master bedroom and from 0.3 ppm to 0.15 ppm in Room 2. The results of this study are consistent with the findings of Liu et al. (2019) [63], who reported similar reductions in HCHO concentrations following the application of photocatalytic coatings in residential spaces. The study observed a decrease of approximately 48% in HCHO levels, mainly when UV light was used to activate the photocatalytic process, reinforcing the potential of TiO2-based coatings as an effective IAQ improvement strategy [65].
The relationship between temperature, humidity, and HCHO concentration was evident, with HCHO levels increasing with rising temperatures and decreasing humidity. This inverse relationship suggests that temperature control is crucial for indoor HCHO levels. The lag in HCHO concentration changes in response to temperature fluctuations indicates the need for continuous monitoring and adaptive control systems to maintain optimal indoor air quality. These findings align with the results reported by Zhang et al. (2020) [54], who also observed that HCHO emissions were highly temperature-dependent, with concentrations rising sharply as temperatures increased. Both studies underscore the necessity of integrating temperature control into IAQ management practices.
Limitations of this study include the controlled environment in which the measurements were taken, which may not fully capture the variability of real-world conditions, such as fluctuating outdoor air quality, occupant behavior, and varying building materials. Additionally, the study was limited to a single apartment complex, which may restrict the generalizability of the findings to other building types or geographic locations. Future research should aim to include a broader range of building environments and consider longer-term monitoring to assess the persistence of HCHO reductions over time.

5. Conclusions

This study comprehensively examined the dynamics of formaldehyde (HCHO) concentration and its mitigation through air purifier operation, photocatalyst application, and window ventilation in various rooms of a newly constructed apartment. The key findings are as follows:
  • Health Risks from Sealed Rooms: When windows were sealed, HCHO concentrations in all rooms exceeded the domestic environmental standard of 0.1 ppm, posing potential health risks, particularly in the Master Bedroom (MBR), where levels reached 0.73 ppm. This underscores the need for effective measures to reduce HCHO levels to safeguard occupant health.
  • Effectiveness of Air Purifiers: The air purifier equipped with a VOCs-only filter demonstrated limited immediate impact on HCHO levels, with a significant reduction observed only after 24 h of continuous operation. This suggests that while air purifiers can contribute to lowering HCHO concentrations, their efficacy is gradual and may require extended use.
  • Impact of Photocatalysts: The application of a photocatalyst on various surfaces within the MBR and Room 2 resulted in a substantial 50% reduction in HCHO concentrations, regardless of lighting conditions. This highlights the potential of photocatalysts as an effective strategy for mitigating HCHO emissions from indoor finishes.
  • Role of Ventilation: Ventilation rates were found to be critically low with sealed windows but increased dramatically when windows were opened, with the air change rate (ACH) reaching as high as 9.55 per hour. This finding emphasizes the importance of proper ventilation in maintaining indoor air quality.
  • Window-to-Room Ratio Considerations: Despite increased ventilation, HCHO concentrations in the living room and MBR remained above the WHO standard of 0.1 ppm. However, in smaller rooms like Room 1 and Room 2, with a larger window-to-volume ratio, HCHO levels were maintained at or below the WHO standard with minimal window openings, highlighting the significance of room size and window area in ventilation effectiveness.
  • Comparative Effectiveness of Mitigation Strategies: Among the strategies tested, ventilation by opening windows proved to be the most effective in reducing HCHO concentrations across all rooms. This finding advocates for implementing robust ventilation practices in newly constructed residential buildings to ensure healthy indoor environments.
The primary contribution of this study is its detailed analysis of HCHO concentration management in a newly constructed residential setting. The findings offer valuable insights into the effectiveness of various mitigation strategies and provide practical recommendations for improving indoor air quality, particularly in regions with similar climatic conditions and construction practices.

Author Contributions

Conceptualization, C.J. and S.M.A.; methodology, C.J.; software, S.M.A.; validation, C.J. and S.M.A.; formal analysis, S.M.A.; investigation, C.J.; resources, S.M.A.; data curation, S.M.A.; writing—original draft preparation, C.J.; writing—review and editing, S.M.A.; visualization, C.J.; supervision, C.J.; project administration, C.J. All authors have read and agreed to the published version of the manuscript.

Funding

This research received no external funding.

Data Availability Statement

New data were created or analyzed in this study. Data will be shared upon request and consideration of the authors.

Acknowledgments

The authors would like to express their gratitude to Prince Mohamad bin Fahd University for their generous APC support in publishing this paper.

Conflicts of Interest

The authors declare no conflicts of interest.

Abbreviations

IAQIndoor Air Quality
HCHOFormaldehyde
VOCVolatile Organic Compounds
MBRMaster Bedroom
ACHAir Change per Hour
MDFMedium-Density Fiberboard
TiO2Titanium Dioxide
UVUltraviolet
CO2Carbon Dioxide
SBSSick Building Syndrome
ppmParts Per Million
WHOWorld Health Organization
ASHRAEAmerican Society of Heating, Refrigerating, and Air-Conditioning Engineers
JBSAJapan Building Standard Act
MOEMinistry of the Environment (South Korea)
NAAQSNational Ambient Air Quality Standards (USA)
FISIAQFinnish Society of Indoor Air Quality and Climate
EPAEnvironmental Protection Agency (USA)

References

  1. Arar, M.; Jung, C. Analyzing the perception of indoor air quality (IAQ) from a survey of new townhouse residents in Dubai. Sustainability 2022, 14, 15042. [Google Scholar] [CrossRef]
  2. Awad, J.; Jung, C. Evaluating the indoor air quality after renovation at the Greens in Dubai, United Arab Emirates. Buildings 2021, 11, 353. [Google Scholar] [CrossRef]
  3. Jung, C.; Awad, J. The improvement of indoor air quality in residential buildings in Dubai, UAE. Buildings 2021, 11, 250. [Google Scholar] [CrossRef]
  4. Nair, G.; Verde, L.; Olofsson, T. A review on technical challenges and possibilities on energy efficient retrofit measures in heritage buildings. Energies 2022, 15, 7472. [Google Scholar] [CrossRef]
  5. Collins, M.; Dempsey, S. Residential energy efficiency retrofits: Potential unintended consequences. J. Environ. Plan. Manag. 2019, 62, 2010–2025. [Google Scholar] [CrossRef]
  6. Martins, N.R.; da Graça, G.C. Simulation of the effect of fine particle pollution on the potential for natural ventilation of non-domestic buildings in European cities. Build. Environ. 2017, 115, 236–250. [Google Scholar] [CrossRef]
  7. Pei, J.; Yin, Y.; Liu, J. Long-term indoor gas pollutant monitor of new dormitories with natural ventilation. Energy Build. 2016, 129, 514–523. [Google Scholar] [CrossRef]
  8. Jung, C.; Mahmoud, N.S.A.; Alqassimi, N. Identifying the relationship between VOCs emission and temperature/humidity changes in new apartments in the hot desert climate. Front. Built Environ. 2022, 8, 1018395. [Google Scholar] [CrossRef]
  9. Jung, C.; Al Qassimi, N.; Arar, M.; Awad, J. The analysis of indoor air pollutants from finishing material of new apartments at business Bay, Dubai. Front. Built Environ. 2021, 7, 765689. [Google Scholar] [CrossRef]
  10. Salimi, M.; Al-Ghamdi, S.G. Climate change impacts on critical urban infrastructure and urban resiliency strategies for the Middle East. Sustain. Cities Soc. 2020, 54, 101948. [Google Scholar] [CrossRef]
  11. Nevalainen, A.; Täubel, M.; Hyvärinen, A. Indoor fungi: Companions and contaminants. Indoor Air 2015, 25, 125–156. [Google Scholar] [CrossRef] [PubMed]
  12. Jung, C.; Mahmoud, N.S.A. Extracting the critical points of formaldehyde (HCHO) emission model in hot desert climate. Air Soil Water Res. 2022, 15, 11786221221105082. [Google Scholar] [CrossRef]
  13. Jung, C.; Abdelaziz Mahmoud, N.S. Navigating dust storms and urban living: An analysis of particulate matter infiltration in Dubai’s residences. Front. Built Environ. 2023, 9, 1297520. [Google Scholar] [CrossRef]
  14. Leung, D.Y. Outdoor-indoor air pollution in urban environment: Challenges and opportunity. Front. Environ. Sci. 2015, 2, 69. [Google Scholar] [CrossRef]
  15. Sherzad, M.; Jung, C. Evaluating the emission of VOCs and HCHO from furniture based on the surface finish methods and retention periods. Front. Built Environ. 2022, 8, 1062255. [Google Scholar] [CrossRef]
  16. Niza, I.L.; de Souza, M.P.; da Luz, I.M.; Broday, E.E. Sick building syndrome and its impacts on health, well-being and productivity: A systematic literature review. Indoor Built Environ. 2024, 33, 218–236. [Google Scholar] [CrossRef]
  17. Abdelaziz Mahmoud, N.S.; Jung, C. Analyzing the bake-out effect in winter for the enhancement of indoor air quality at new apartments in UAE. Buildings 2023, 13, 846. [Google Scholar] [CrossRef]
  18. Amoatey, P.; Omidvarborna, H.; Baawain, M.S.; Al-Mamun, A. Indoor air pollution and exposure assessment of the gulf cooperation council countries: A critical review. Environ. Int. 2018, 121, 491–506. [Google Scholar] [CrossRef]
  19. Jung, C.; El Samanoudy, G. Mitigating indoor air pollution in university dormitory: The need for better ventilation and resident awareness. Buildings 2023, 13, 1144. [Google Scholar] [CrossRef]
  20. Sadrizadeh, S.; Yao, R.; Yuan, F.; Awbi, H.; Bahnfleth, W.; Bi, Y.; Cao, G.; Croitoru, C.; de Dear, R.; Haghighat, F.; et al. Indoor air quality and health in schools: A critical review for developing the roadmap for the future school environment. J. Build. Eng. 2022, 57, 104908. [Google Scholar] [CrossRef]
  21. Campagnolo, D.; Saraga, D.E.; Cattaneo, A.; Spinazzè, A.; Mandin, C.; Mabilia, R.; Perreca, E.; Sakellaris, I.; Canha, N.; Mihucz, V.G.; et al. VOCs and aldehydes source identification in European office buildings-The OFFICAIR study. Build. Environ. 2017, 115, 18–24. [Google Scholar] [CrossRef]
  22. Zhu, Y.; Guo, S.; Liang, W. A literature review investigating the impact of temperature and humidity on volatile organic compound emissions from building materials. Build. Environ. 2024, 262, 111845. [Google Scholar] [CrossRef]
  23. Wang, H.; Xiong, J.; Wei, W. Measurement methods and impact factors for the key parameters of VOC/SVOC emissions from materials in indoor and vehicular environments: A review. Environ. Int. 2022, 168, 107451. [Google Scholar] [CrossRef]
  24. Jung, C.; Abdelaziz Mahmoud, N.S.; Al Qassimi, N.; Elsamanoudy, G. Preliminary study on the emission dynamics of TVOC and formaldehyde in homes with eco-friendly materials: Beyond green building. Buildings 2023, 13, 2847. [Google Scholar] [CrossRef]
  25. Arar, M.; Jung, C.; Qassimi, N.A. Investigating the influence of the building material on the indoor air quality in apartment in Dubai. Front. Built Environ. 2022, 7, 804216. [Google Scholar] [CrossRef]
  26. Jung, C.; Ismail, M.A.; Arar, M.; AlQassimi, N. Mitigating indoor air pollution in UAE’s high-rise apartment buildings: A study on eco-friendly materials and adsorbents. Smart Sustain. Built Environ. 2024. [Google Scholar] [CrossRef]
  27. Lim, J.; Kim, S.; Kim, A.; Lee, W.; Han, J.; Cha, J.S. Behavior of VOCs and carbonyl compounds emission from different types of wallpapers in Korea. Int. J. Environ. Res. Public Health 2014, 11, 4326–4339. [Google Scholar] [CrossRef]
  28. Zhang, X.; Li, X.; Wang, Z.; Deng, G.; Wang, Z. Exposure level and influential factors of HCHO, BTX and TVOC from the interior redecoration of residences. Build. Environ. 2020, 168, 106494. [Google Scholar] [CrossRef]
  29. Jung, C.; Abdelaziz Mahmoud, N.S.; Alqassimi, N. Enhancing indoor air quality and sustainable living in newly constructed apartments: Insights from Dubai. Front. Built Environ. 2023, 9, 1292531. [Google Scholar] [CrossRef]
  30. Akasha, H.; Ghaffarpasand, O.; Pope, F.D. Climate change, air pollution and the associated burden of disease in the Arabian peninsula and neighbouring regions: A critical review of the literature. Sustainability 2023, 15, 3766. [Google Scholar] [CrossRef]
  31. El Samanoudy, G.; Mahmoud, N.S.A.; Jung, C. Analyzing the effectiveness of building integrated Photovoltaics (BIPV) to reduce the energy consumption in Dubai. Ain Shams Eng. J. 2024, 15, 102682. [Google Scholar] [CrossRef]
  32. Jung, C.; Awad, J.; Ismail, M.A.; Chohan, A.H. Correlating Temperature, Airtightness, and Pollutant Concentrations: Insights into Indoor Air Quality in Ajman Apartment Buildings. Future Cities Environ. 2024, 10, 3. [Google Scholar] [CrossRef]
  33. Webb, S. Implications of persistent environmental toxins prevalent in interior building materials and furnishings. In Sustainability and Toxicity of Building Materials; Woodhead Publishing: Cambridge, UK, 2024; pp. 367–387. [Google Scholar]
  34. Ghaffarianhoseini, A.; AlWaer, H.; Omrany, H.; Ghaffarianhoseini, A.; Alalouch, C.; Clements-Croome, D.; Tookey, J. Sick building syndrome: Are we doing enough? Archit. Sci. Rev. 2018, 61, 99–121. [Google Scholar] [CrossRef]
  35. Huangfu, Y.; Lima, N.M.; O’Keeffe, P.T.; Kirk, W.M.; Lamb, B.K.; Pressley, S.N.; Lin, B.; Cook, D.J.; Walden, V.P.; Jobson, B.T. Diel variation of formaldehyde levels and other VOCs in homes driven by temperature dependent infiltration and emission rates. Build. Environ. 2019, 159, 106153. [Google Scholar] [CrossRef]
  36. Haddad, S.; Synnefa, A.; Marcos, M.Á.P.; Paolini, R.; Delrue, S.; Prasad, D.; Santamouris, M. On the potential of demand-controlled ventilation system to enhance indoor air quality and thermal condition in Australian school classrooms. Energy Build. 2021, 238, 110838. [Google Scholar] [CrossRef]
  37. Jeon, J.; Park, J.H.; Wi, S.; Yun, B.Y.; Kim, T.; Kim, S. Field study on the improvement of indoor air quality with toluene adsorption finishing materials in an urban residential apartment. Environ. Pollut. 2020, 261, 114137. [Google Scholar] [CrossRef] [PubMed]
  38. Sandberg, D. Additives in wood products—Today and future development. In Environmental Impacts of Traditional and Innovative Forest-Based Bioproducts; Springer: Singapore, 2016; pp. 105–172. [Google Scholar] [CrossRef]
  39. Pibiri, E.; Omelan, A.; Uhde, E.; Salthammer, T. Effect of surface covering on the release of formaldehyde, acetaldehyde, formic acid and acetic acid from particleboard. Build. Environ. 2020, 178, 106947. [Google Scholar] [CrossRef]
  40. Sukharev, S.; Mariychuk, R.; Onysko, M.; Sukhareva, O.; Delegan-Kokaiko, S. Fast determination of total aldehydes in rainwaters in the presence of interfering compounds. Environ. Chem. Lett. 2019, 17, 1405–1411. [Google Scholar] [CrossRef]
  41. He, Y.; Liu, J.; Duan, Y.; Yuan, X.; Ma, L.; Dhar, R.; Zheng, Y. A critical review of on-site inorganic arsenic screening methods. J. Environ. Sci. 2023, 125, 453–469. [Google Scholar] [CrossRef]
  42. Rakhshan, K.; Friess, W.A. Effectiveness and viability of residential building energy retrofits in Dubai. J. Build. Eng. 2017, 13, 116–126. [Google Scholar] [CrossRef]
  43. Jung, C.; Alqassimi, N.; El Samanoudy, G. The comparative analysis of the indoor air pollutants in occupied apartments at residential area and industrial area in Dubai, United Arab Emirates. Front. Built Environ. 2022, 8, 998858. [Google Scholar] [CrossRef]
  44. Yadeta, C.; Indraganti, M.; Tucho, G.T.; Alemayehu, E. Study on adaptive thermal comfort model and behavioral adaptation in naturally ventilated residential buildings, Jimma Town, Ethiopia. Energy Build. 2023, 298, 113483. [Google Scholar] [CrossRef]
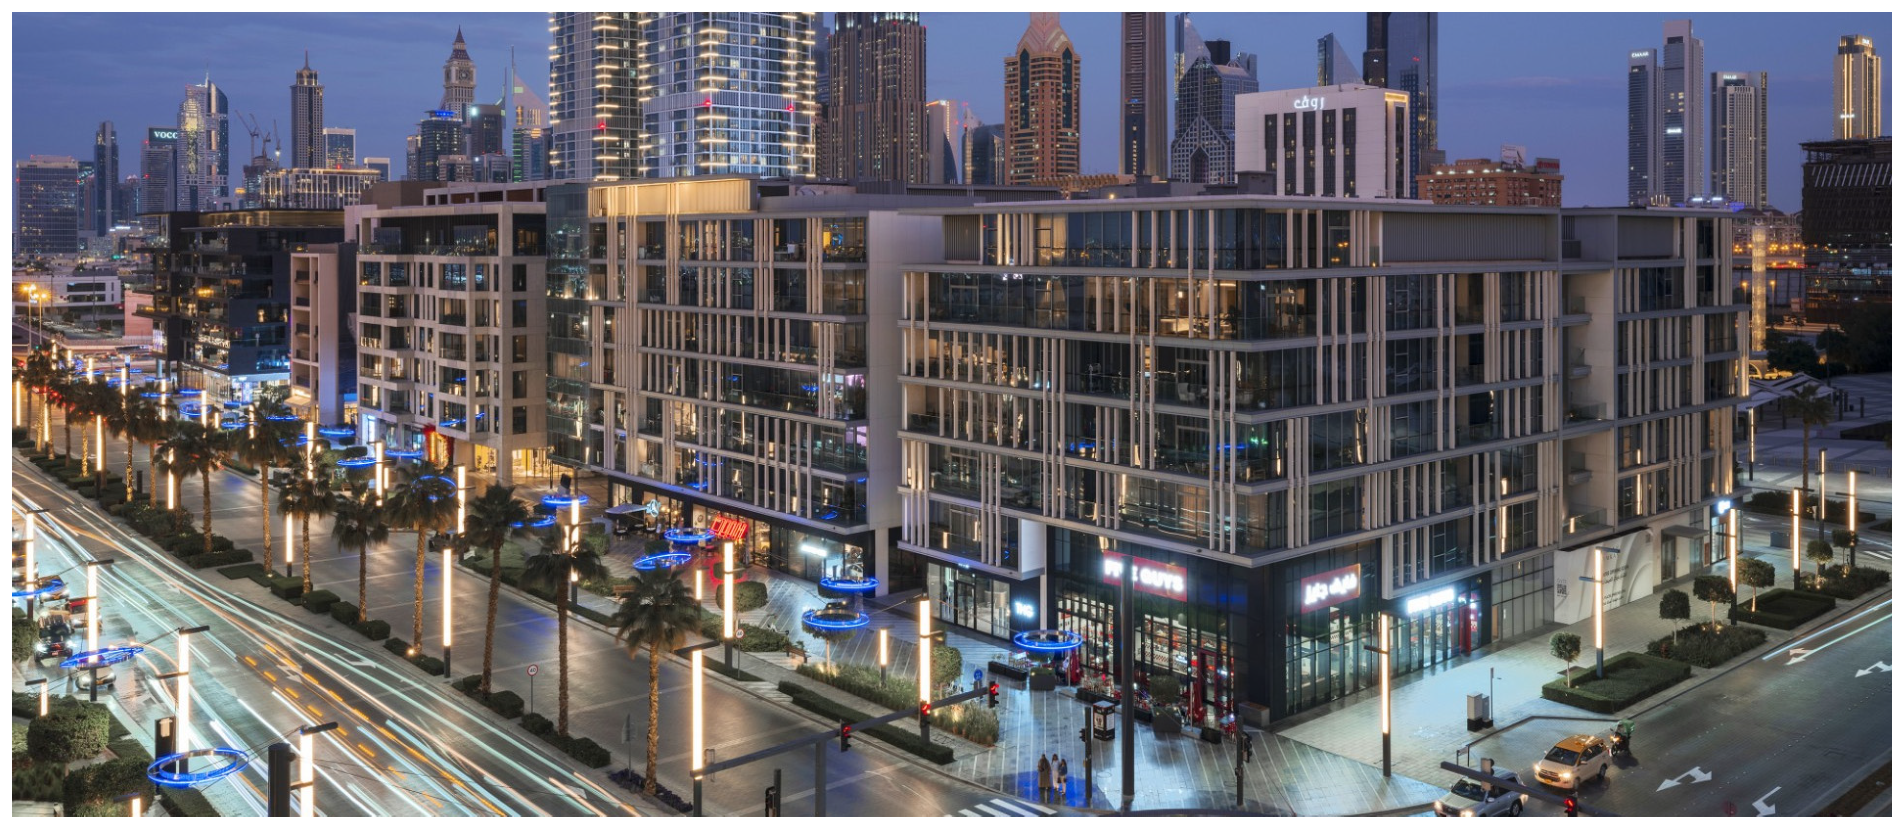
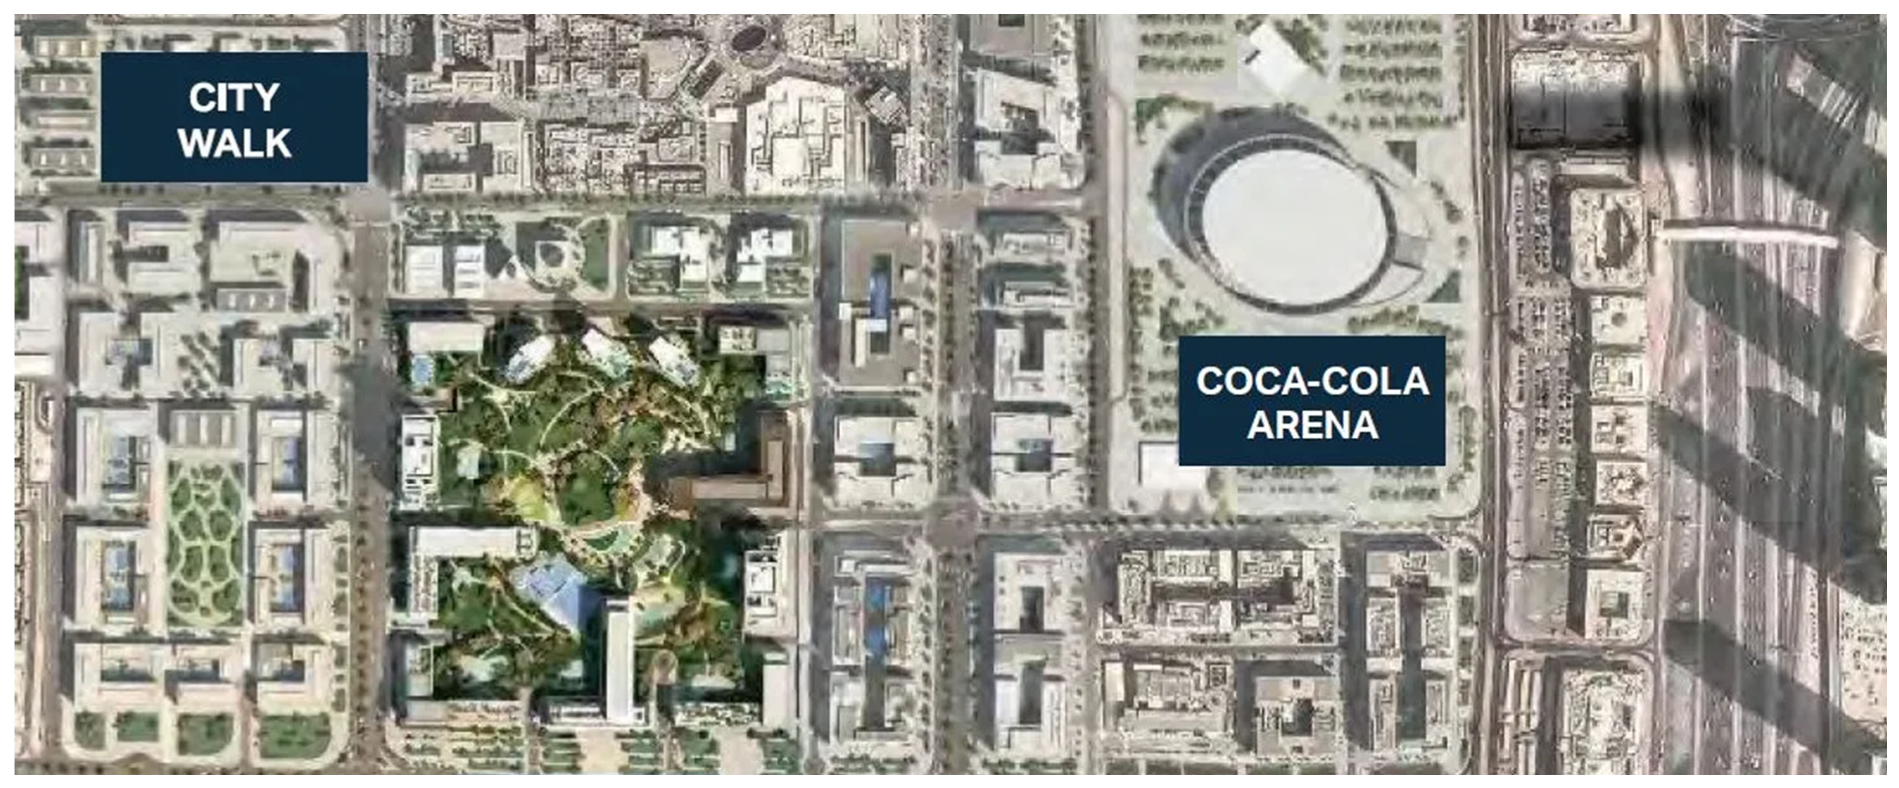
  45. Meeras. Meraas City Walk, Features and Amenities. 2024. Available online: https://www.meraascitywalk.com/features.php (accessed on 12 April 2024).
  46. Khaleej Times. City Walk: Dubai’s Trendiest Neighbourhood. 2024. Available online: https://www.khaleejtimes.com/community/city-walk-dubais-trendiest-neighbourhood (accessed on 10 March 2024).
  47. Paulo, M.S.; Adam, B.; Akagwu, C.; Akparibo, I.; Al-Rifai, R.H.; Bazrafshan, S.; Gobba, F.; Green, A.C.; Ivanov, I.; Kezic, S.; et al. WHO/ILO work-related burden of disease and injury: Protocol for systematic reviews of occupational exposure to solar ultraviolet radiation and of the effect of occupational exposure to solar ultraviolet radiation on melanoma and non-melanoma skin cancer. Environ. Int. 2019, 126, 804–815. [Google Scholar] [CrossRef]
  48. Al-Hemoud, A.; Al-Awadi, L.; Al-Khayat, A.; Behbehani, W. Streamlining IAQ guidelines and investigating the effect of door opening/closing on concentrations of VOCs, formaldehyde, and NO2 in office buildings. Build. Environ. 2018, 137, 127–137. [Google Scholar] [CrossRef]
  49. Jia, L.R.; Han, J.; Chen, X.; Li, Q.Y.; Lee, C.C.; Fung, Y.H. Interaction between thermal comfort, indoor air quality and ventilation energy consumption of educational buildings: A comprehensive review. Buildings 2021, 11, 591. [Google Scholar] [CrossRef]
  50. Abdul-Wahab, S.A.; En, S.C.F.; Elkamel, A.; Ahmadi, L.; Yetilmezsoy, K. A review of standards and guidelines set by international bodies for the parameters of indoor air quality. Atmos. Pollut. Res. 2015, 6, 751–767. [Google Scholar] [CrossRef]
  51. Xiong, J.; Zhang, P.; Huang, S.; Zhang, Y. Comprehensive influence of environmental factors on the emission rate of formaldehyde and VOCs in building materials: Correlation development and exposure assessment. Environ. Res. 2016, 151, 734–741. [Google Scholar] [CrossRef] [PubMed]
  52. Duan, C.; Liao, H.; Wang, K.; Ren, Y. The research hotspots and trends of volatile organic compound emissions from anthropogenic and natural sources: A systematic quantitative review. Environ. Res. 2023, 216, 114386. [Google Scholar] [CrossRef] [PubMed]
  53. Lui, K.H.; Ho, S.S.H.; Louie, P.K.K.; Chan, C.S.; Hu, D.; Chan, P.W.; Lee, J.C.W.; Ho, K.F. Seasonal behavior of carbonyls and source characterization of formaldehyde (HCHO) in ambient air. Atmos. Environ. 2017, 152, 51–60. [Google Scholar] [CrossRef]
  54. Zhang, T.; Li, X.; Rao, Y.; Liu, Y.; Zhao, Q. Removal of formaldehyde in urban office building by the integration of ventilation and photocatalyst-coated window. Sustain. Cities Soc. 2020, 55, 102050. [Google Scholar] [CrossRef]
  55. Heide, V.; Georges, L.; Breesch, H. Characterizing indoor air quality, thermal environment and window opening in natural-ventilated Norwegian bedrooms: An extensive field study. Build. Environ. 2023, 246, 110975. [Google Scholar] [CrossRef]
  56. Brun, R.; Verriele, M.; Romanias, M.N.; Chenal, M.; Soisson, A.; Maier, W.; Thevenet, F. Uptake and reactivity of formaldehyde on lime-cement-plaster under typical indoor air conditions. Build. Environ. 2023, 229, 109948. [Google Scholar] [CrossRef]
  57. Stamp, S.; Burman, E.; Shrubsole, C.; Chatzidiakou, L.; Mumovic, D.; Davies, M. Seasonal variations and the influence of ventilation rates on IAQ: A case study of five low-energy London apartments. Indoor Built Environ. 2022, 31, 607–623. [Google Scholar] [CrossRef]
  58. Yin, H.; Liu, C.; Zhang, L.; Li, A.; Ma, Z. Measurement and evaluation of indoor air quality in naturally ventilated residential buildings. Indoor Built Environ. 2019, 28, 1307–1323. [Google Scholar] [CrossRef]
  59. Huangfu, Y.; Lima, N.M.; O’Keeffe, P.T.; Kirk, W.M.; Lamb, B.K.; Walden, V.P.; Jobson, B.T. Whole-house emission rates and loss coefficients of formaldehyde and other volatile organic compounds as a function of the air change rate. Environ. Sci. Technol. 2020, 54, 2143–2151. [Google Scholar] [CrossRef] [PubMed]
  60. Gougha, H.L.; Luob, Z.; Haliosa, C.H.; Kingc, M.; Noakesc, C.J.; Grimmonda, C.S.B.; Barlowa, J.F.; Hoxeyd, R.; Quinnd, A.D. Field measurement of natural ventilation rate in an idealised full-scale building located in a staggered urban array: Comparison between tracer gas and pressure-based methods. Build. Environ. 2018, 137, 246–256. [Google Scholar] [CrossRef]
  61. Liu, Y.; Misztal, P.K.; Xiong, J.; Tian, Y.; Arata, C.; Weber, R.J.; Nazaroff, W.W.; Goldstein, A.H. Characterizing sources and emissions of volatile organic compounds in a northern California residence using space-and time-resolved measurements. Indoor Air 2019, 29, 630–644. [Google Scholar] [CrossRef]
  62. Jung, C.; Sami Abdelaziz Mahmoud, N.; El Samanoudy, G. Overcooling in UAE homes: Health issues and implications for learning efficiency. Archit. Sci. Rev. 2024, 1–14. [Google Scholar] [CrossRef]
  63. Liu, J.; Yang, C.; Li, X.; Zhao, Z. Impact of room size and window-to-volume ratio on HCHO concentration in residential buildings. Build. Environ. 2019, 148, 437–445. [Google Scholar]
  64. Xiao, R.; Mo, J.; Zhang, Y.; Gao, D. An in-situ thermally regenerated air purifier for indoor formaldehyde removal. Indoor Air 2018, 28, 266–275. [Google Scholar] [CrossRef]
  65. Park, H.E.; Go, S.; Song, Y.H. Airflow and Pressure Design Review of Modular Negative Pressure Wards. Buildings 2024, 14, 1623. [Google Scholar] [CrossRef]
Figure 1. City Walk Residences by Meraas.
Buildings 14 02815 g001
Figure 2. Master Plan of City Walk Residences by Meraas.
Buildings 14 02815 g002
Figure 3. Concentration Measurement and Window Opening Locations.
Buildings 14 02815 g003
Figure 4. HCHO Concentration in Each Room when Window Closed.
Buildings 14 02815 g004
Figure 5. HCHO Concentration before and after Operating the Air Purifier.
Buildings 14 02815 g005
Figure 6. HCHO Concentration before and after Photocatalyst Construction of MBR.
Buildings 14 02815 g006
Figure 7. HCHO Concentration before and after Photocatalyst Construction of Room 2.
Buildings 14 02815 g007
Figure 8. MBR Ventilation Frequency According to Window Opening Conditions.
Buildings 14 02815 g008
Figure 9. HCHO Concentration according to Open Windows in Living Room.
Buildings 14 02815 g009
Figure 10. HCHO Concentration according to Open Windows in Master Bedroom.
Buildings 14 02815 g010
Figure 11. Indoor and Outdoor Temperature Change.
Buildings 14 02815 g011
Figure 12. Relationship between HCHO Concentration and Temperature and Humidity.
Buildings 14 02815 g012
Table 1. Global Standards for Indoor Air Quality.
Hazardous SubstancesUnited StatesEurope
(WHO)
JapanSouth
Korea
UAE
(Dubai)
Formaldehyde (HCHO)0.1 ppm
(ASHRAE)
100 µg/m3
(30 min)
100 µg/m3
(JSHS)
100 µg/m3
(MOE)
0.08 ppm
(Municipality)
Carbon Dioxide (CO2)1000 ppm
(ASHRAE)
920 ppm
(24 h)
1000 ppm
(JBSA)
(JSHS)
1000 ppm
(MOE)
N/A
Carbon Monoxide (CO)25 ppm
(EPA)
(8 h)
10 ppm
(8 h)
10 ppm
(JBSA)
(JSHS)
10–25 ppm
(MOE)
(MOHW)
N/A
Nitrogen Dioxide (NO2)0.053 ppm
(NAAQS)
40 µg/m3
(1 year)
N/A0.05–0.03 ppm
(MOE)
N/A
Ozone (O3)N/A120 µg/m3
(8 h)
N/A0.06–0.08 ppm
(MOE)
N/A
Radon4.0 pCi/L
(EPA)
2.7 pCi/LN/A4.0 pCi/L
(MOE)
N/A
Total Suspended Particles (TSPs)25 µg/m3
(24 h)
100–120 µg/m3
(8 h)
0.1 mg/m3
(JSHS)
150 µg/m3
(MOE)
(MOHW)
150 µg/m3
(Municipality)
Volatile Organic Components (VOCs)N/A0.2–0.6
mg/m3 (FISIAQ)
0.5 mg/m3
(JSHS)
400–1000
µg/m3
(MOE)
300 µg/m3
(Municipality)
N/A: Not Available.
Table 2. Size and Window Area of Each Measurement Room and Area.
Measurement ContentsLiving RoomMBRRoom 1Room 2
Area (m2)34.4416.2410.5610.56
Volume (m3)80.5945.6728.3428.34
Door area (m2)2.102.101.891.89
Window area (m2)9.543.845.946.60
Window area/Actual volume0.1180.0840.210.23
Window at Balcony area (m2)6.65.544.43.66
Window at Balcony area/Actual volume0.0820.1210.1550.129
Indoor window area/Actual volume0.1180.0840.210.23
Area when opened by 10 cm (m2)0.220.160.220.22
Area when opened by 20 cm (m2)0.440.320.440.44
Area when opened by 30 cm (m2)0.660.480.660.66
Area when fully open (m2)1.981.921.981.98
Table 3. Measuring Equipment Specifications.
Equipment NameModel Name
Formaldehyde MeterFormaldemeter 400, Measurement range: 0~50 ppm, Accuracy: 2 ppm ± 10%,
Recording: AMS-2
Temperature and Humidity MeterTesto 451 Digital Temperature and Humidity
Temperature MeasurementYokogawa LR 8100E, T type Thermocouple
Air PurifierAir volume: 5.3 m3/min, Dust collection rate: 99.5%,
Rated gas removal capacity: 3200 mL, Power consumption: 65 W
Removable Gases: NH3, VOCs, SO2, etc.
PhotocatalystTitanium dioxide (TIO2), Milky liquid type
Disclaimer/Publisher’s Note: The statements, opinions and data contained in all publications are solely those of the individual author(s) and contributor(s) and not of MDPI and/or the editor(s). MDPI and/or the editor(s) disclaim responsibility for any injury to people or property resulting from any ideas, methods, instructions or products referred to in the content.

