
Optimization Strategy for Thermal Comfort in Railway Stations above Ground Level in Beijing


Abstract
1. Introduction
2. Methods
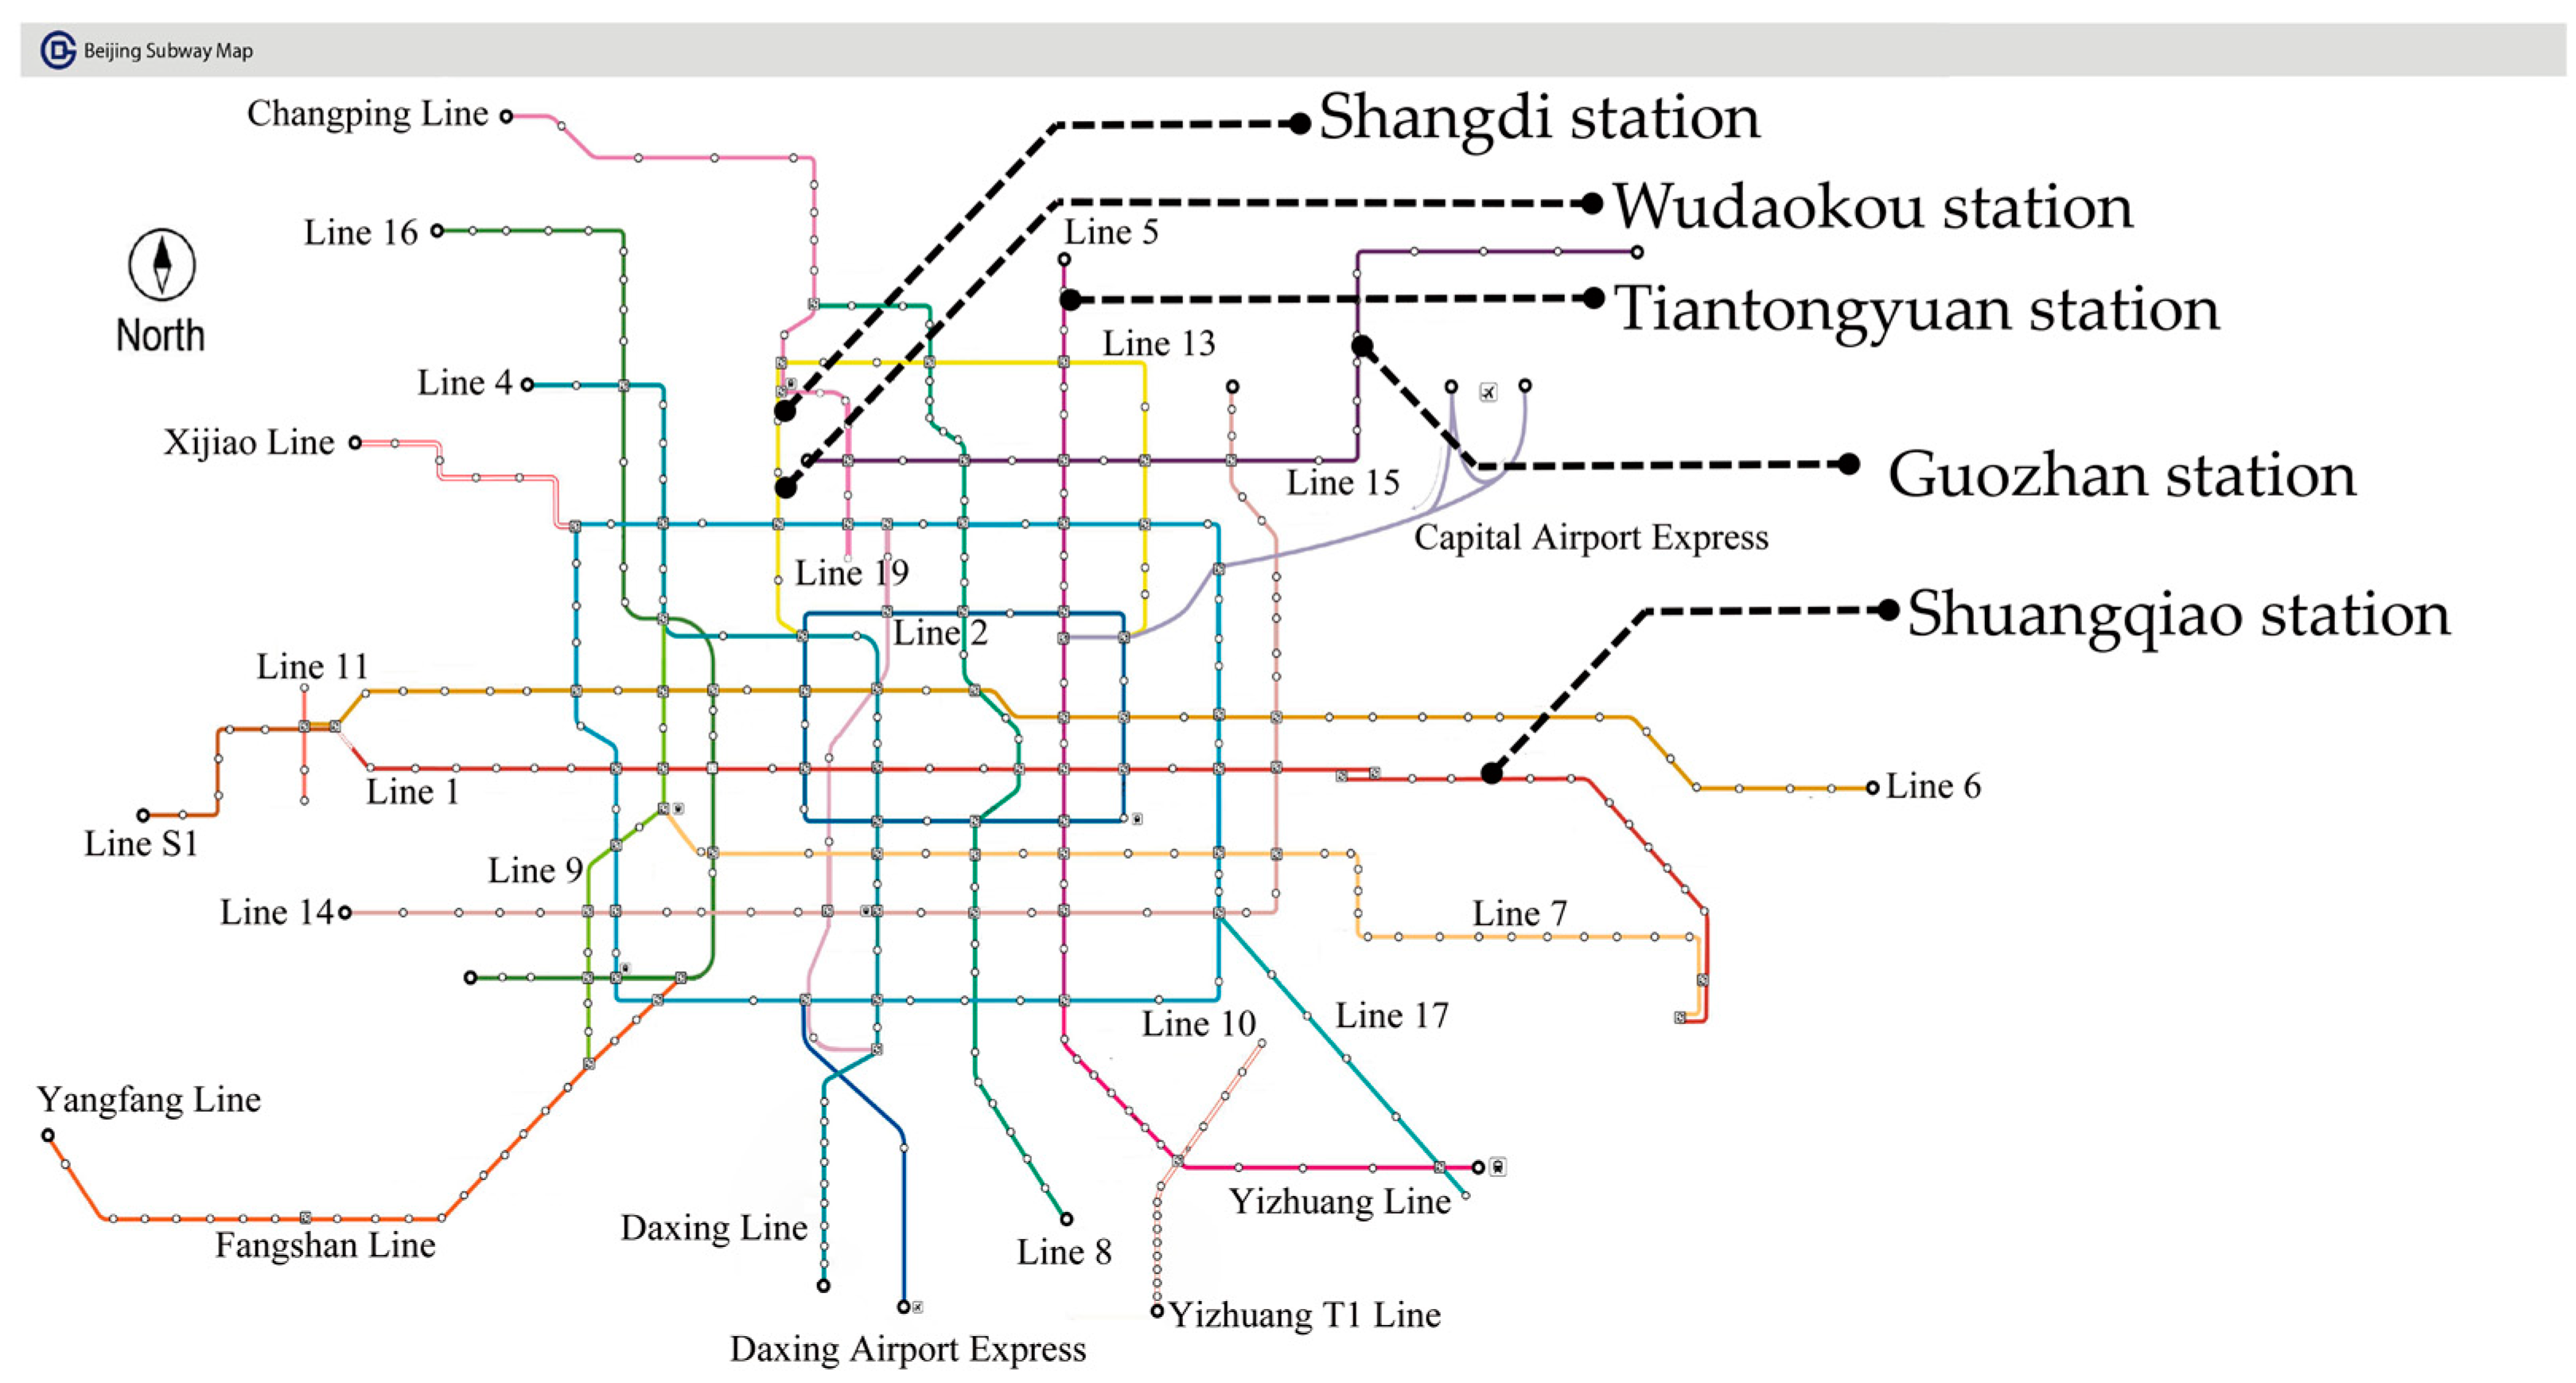
2.1. Beijing Subway Lines and Stations
2.2. Thermal Environmental Parameters
2.3. Questionnaire Survey
2.4. Building Energy Efficiency Simulation Optimization
2.4.1. Design of Skylights
2.4.2. Design of the Platform’s Side Windows
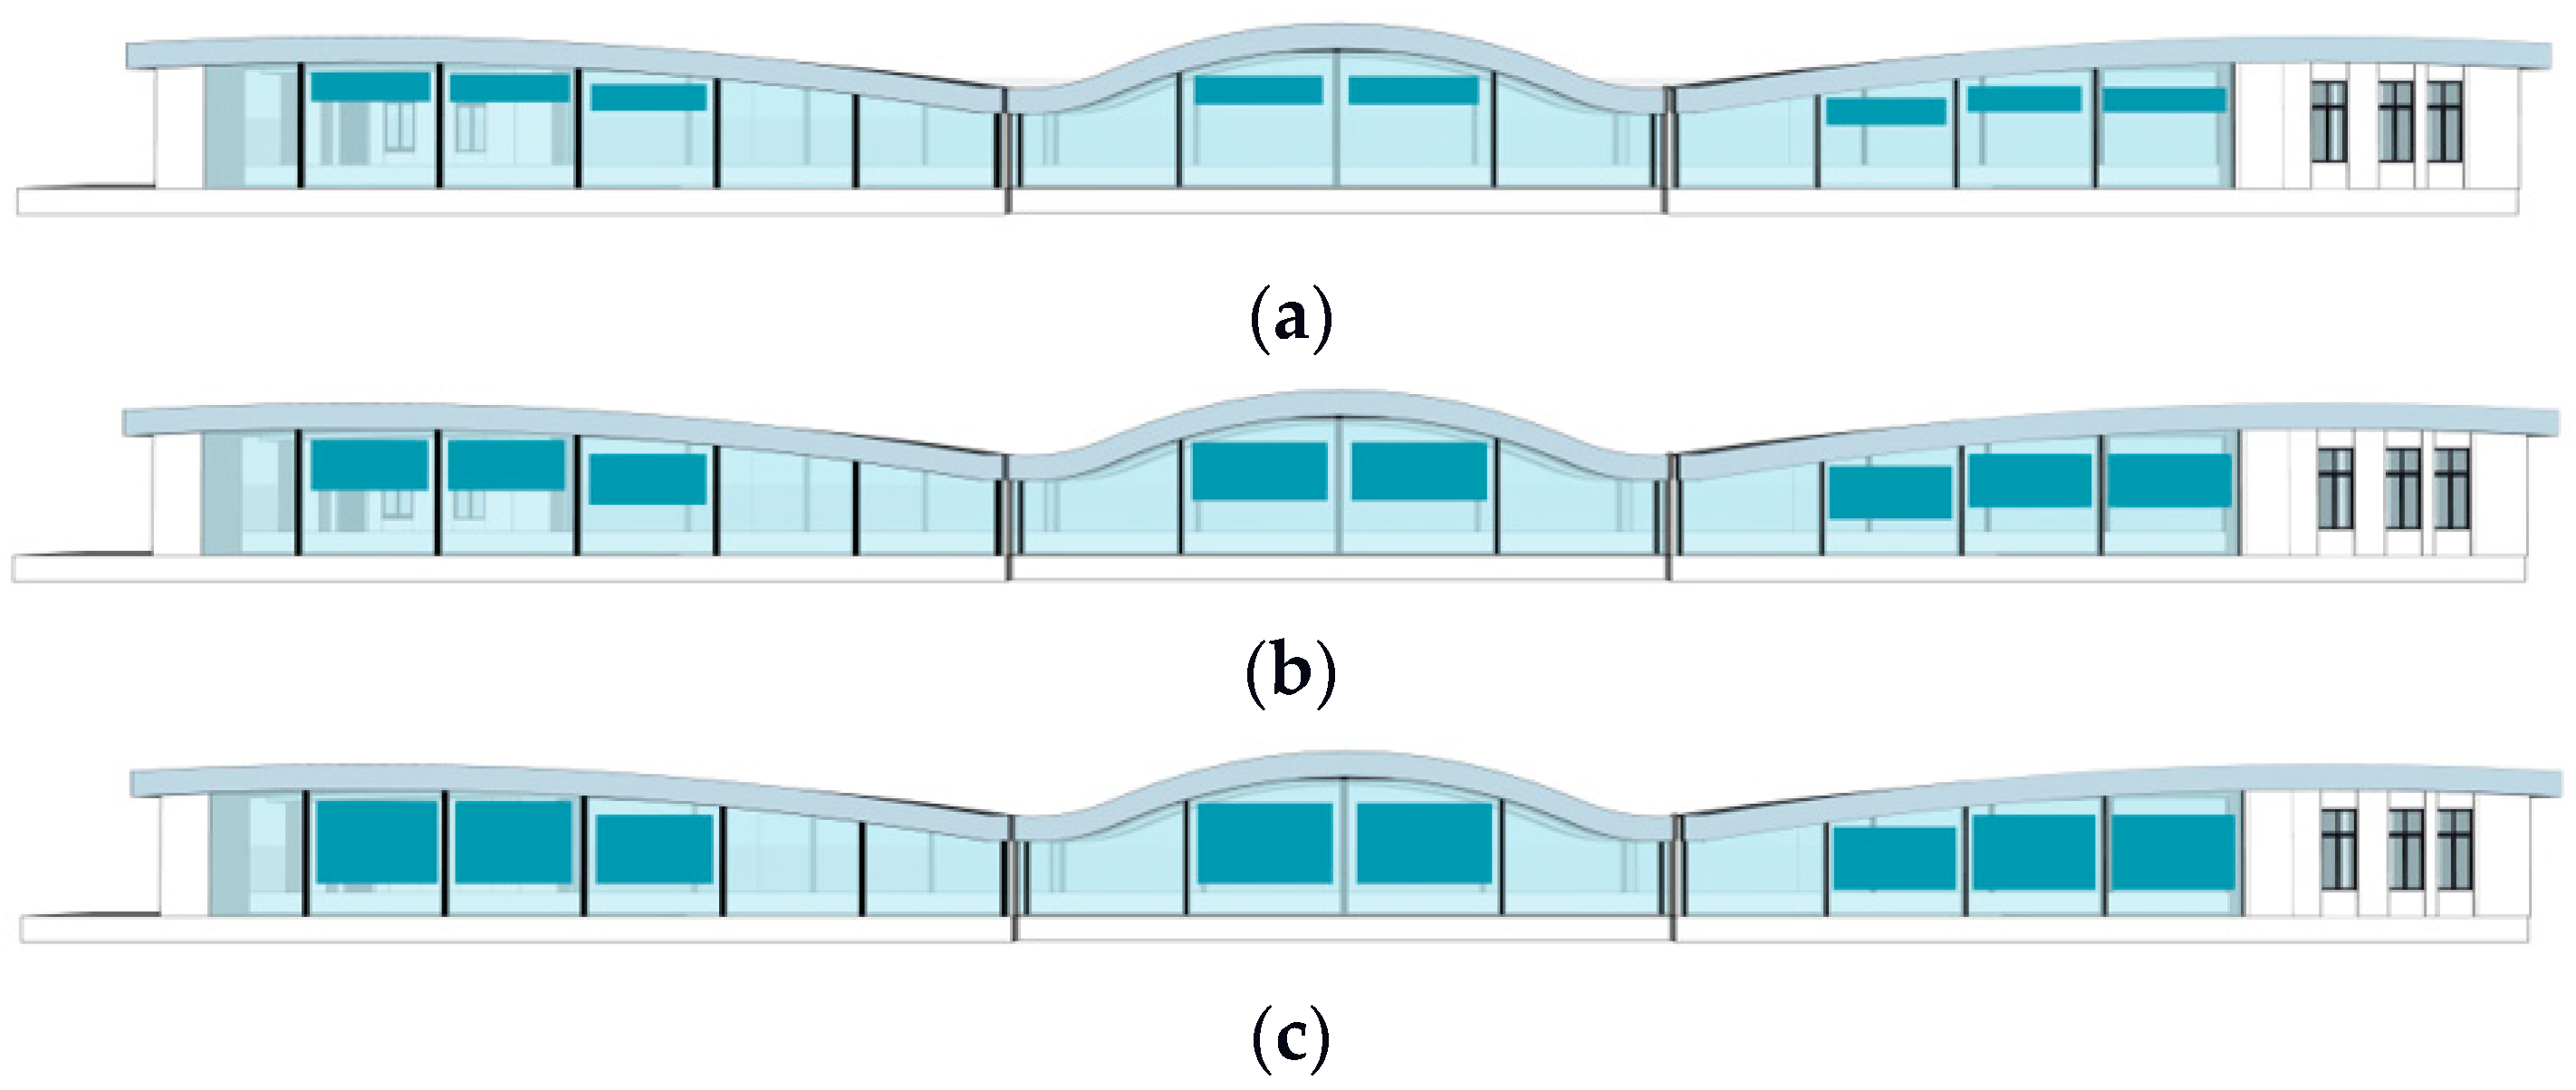
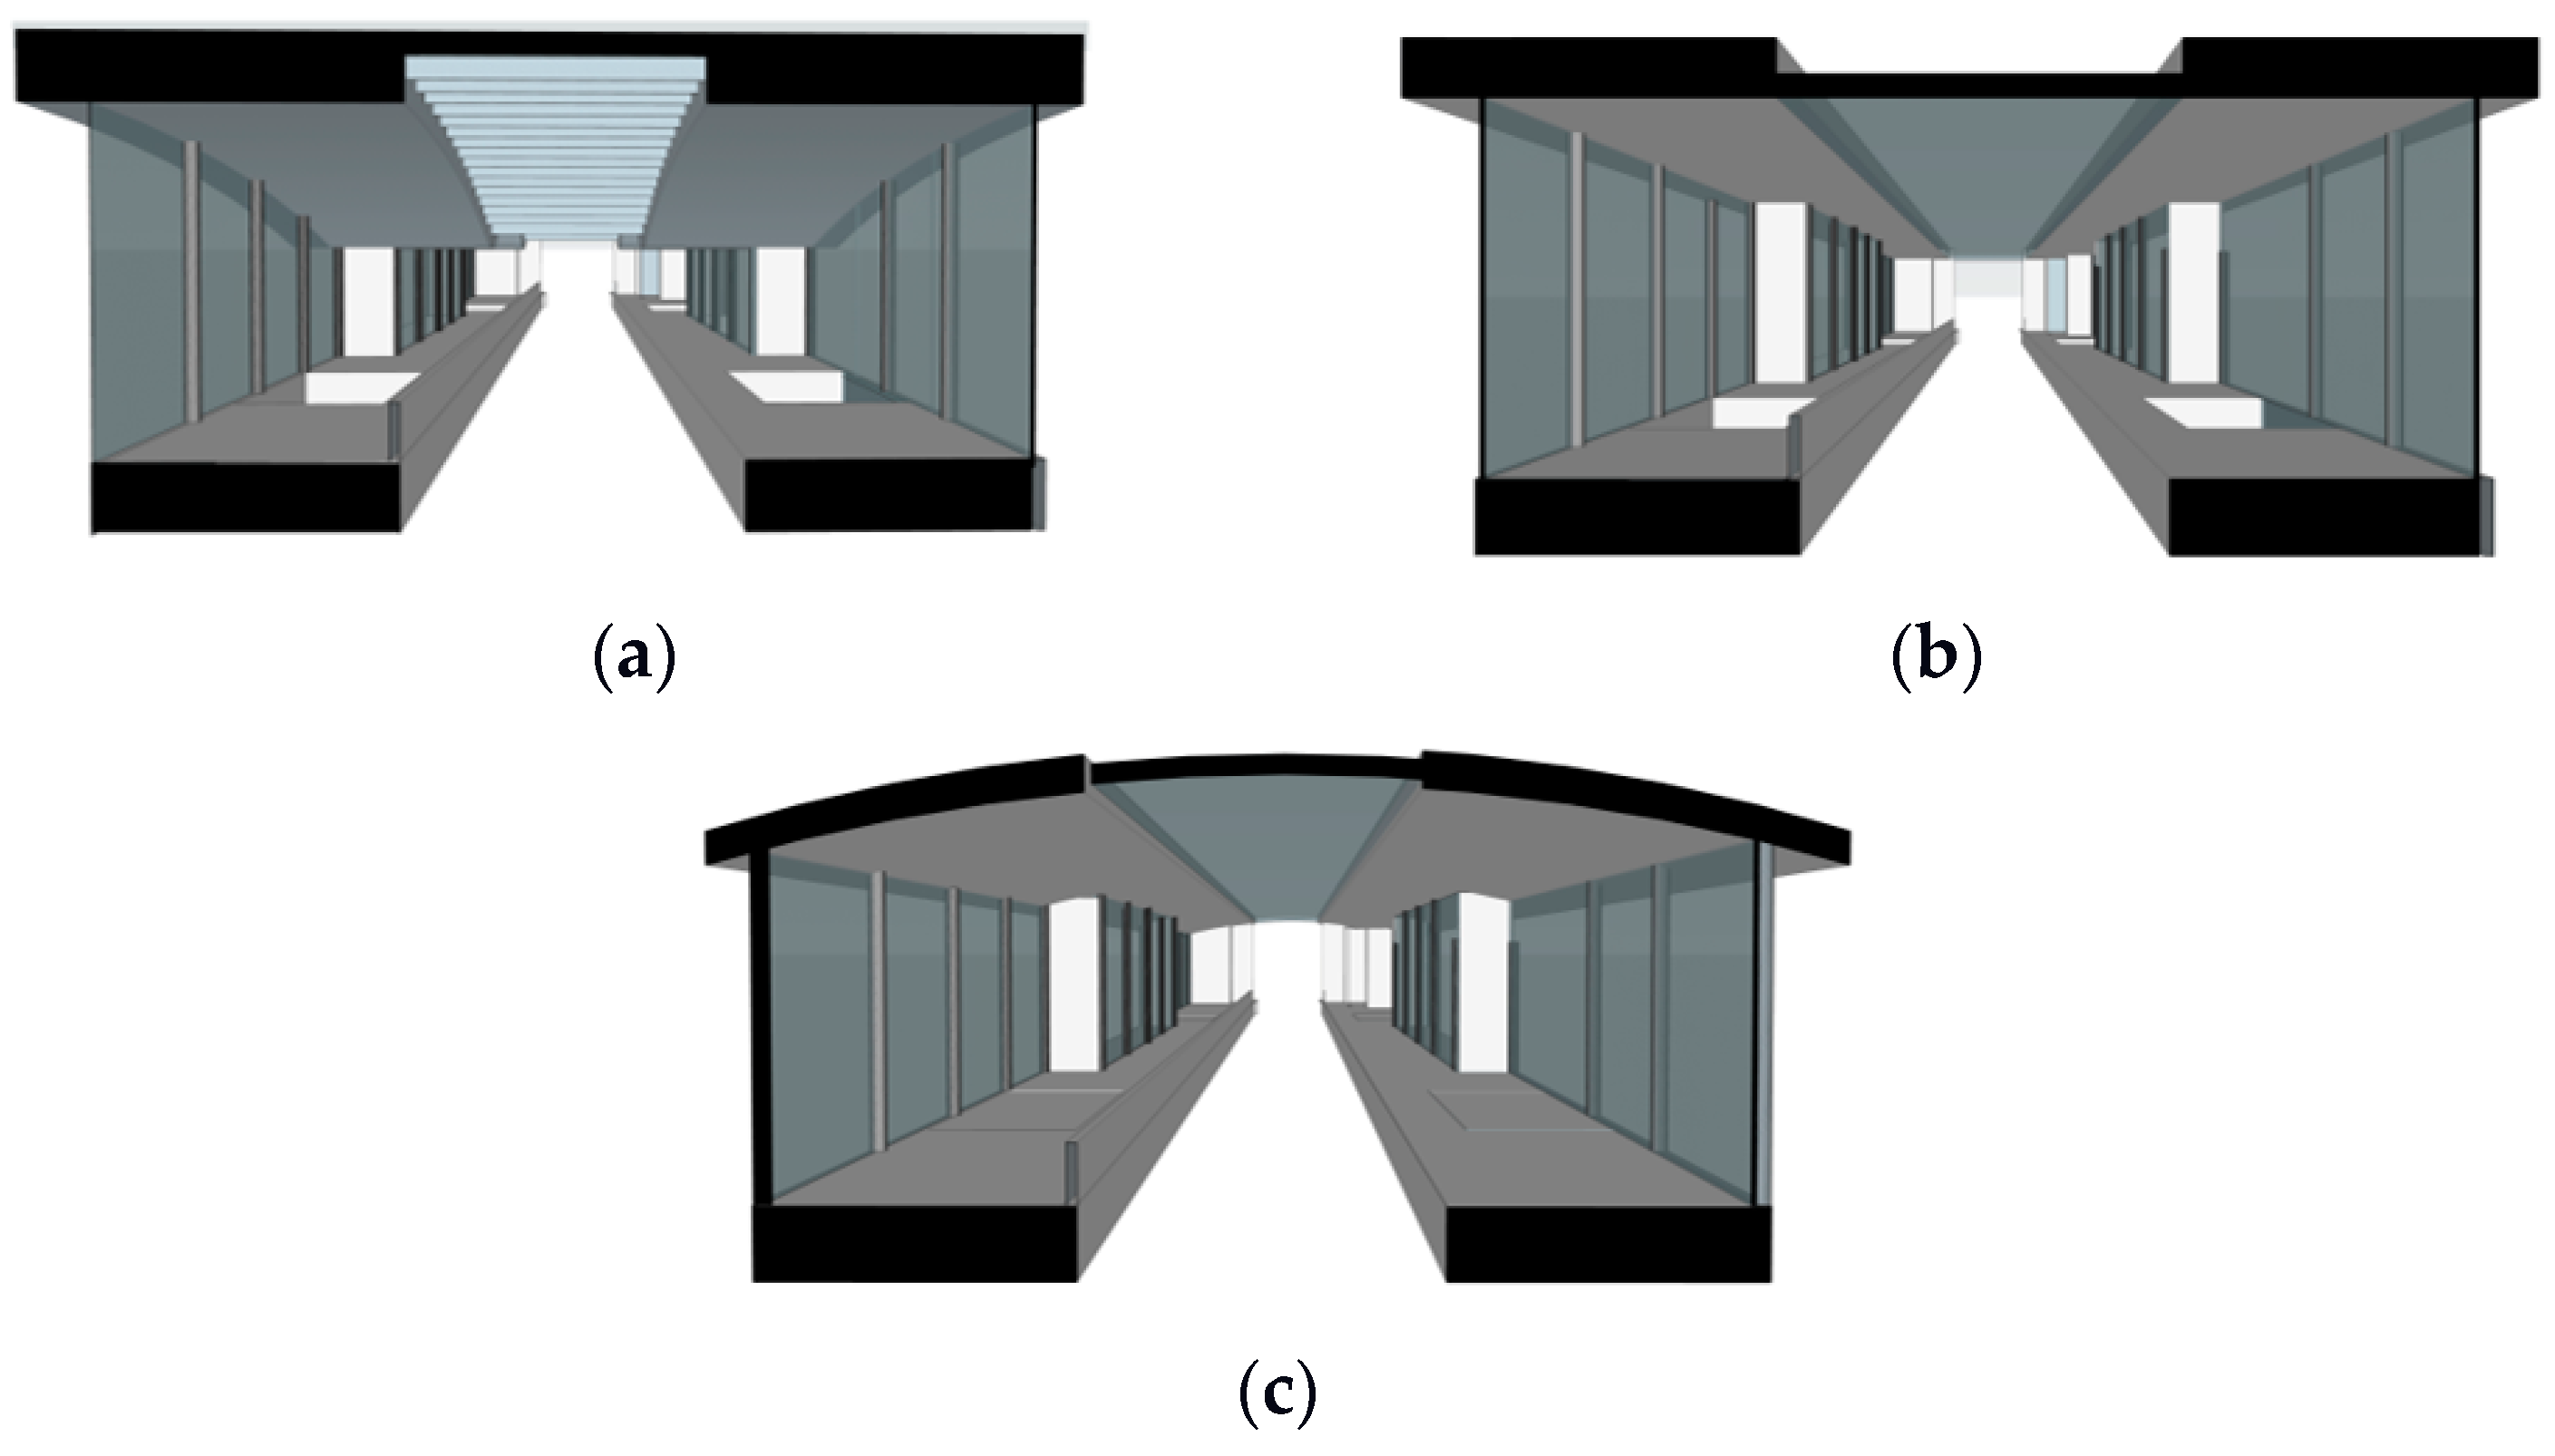
2.4.3. Design of Platform Cross-Section Shape
3. Results
3.1. Thermal Environment
3.2. Design for Thermal Comfort Improvement
- (1)
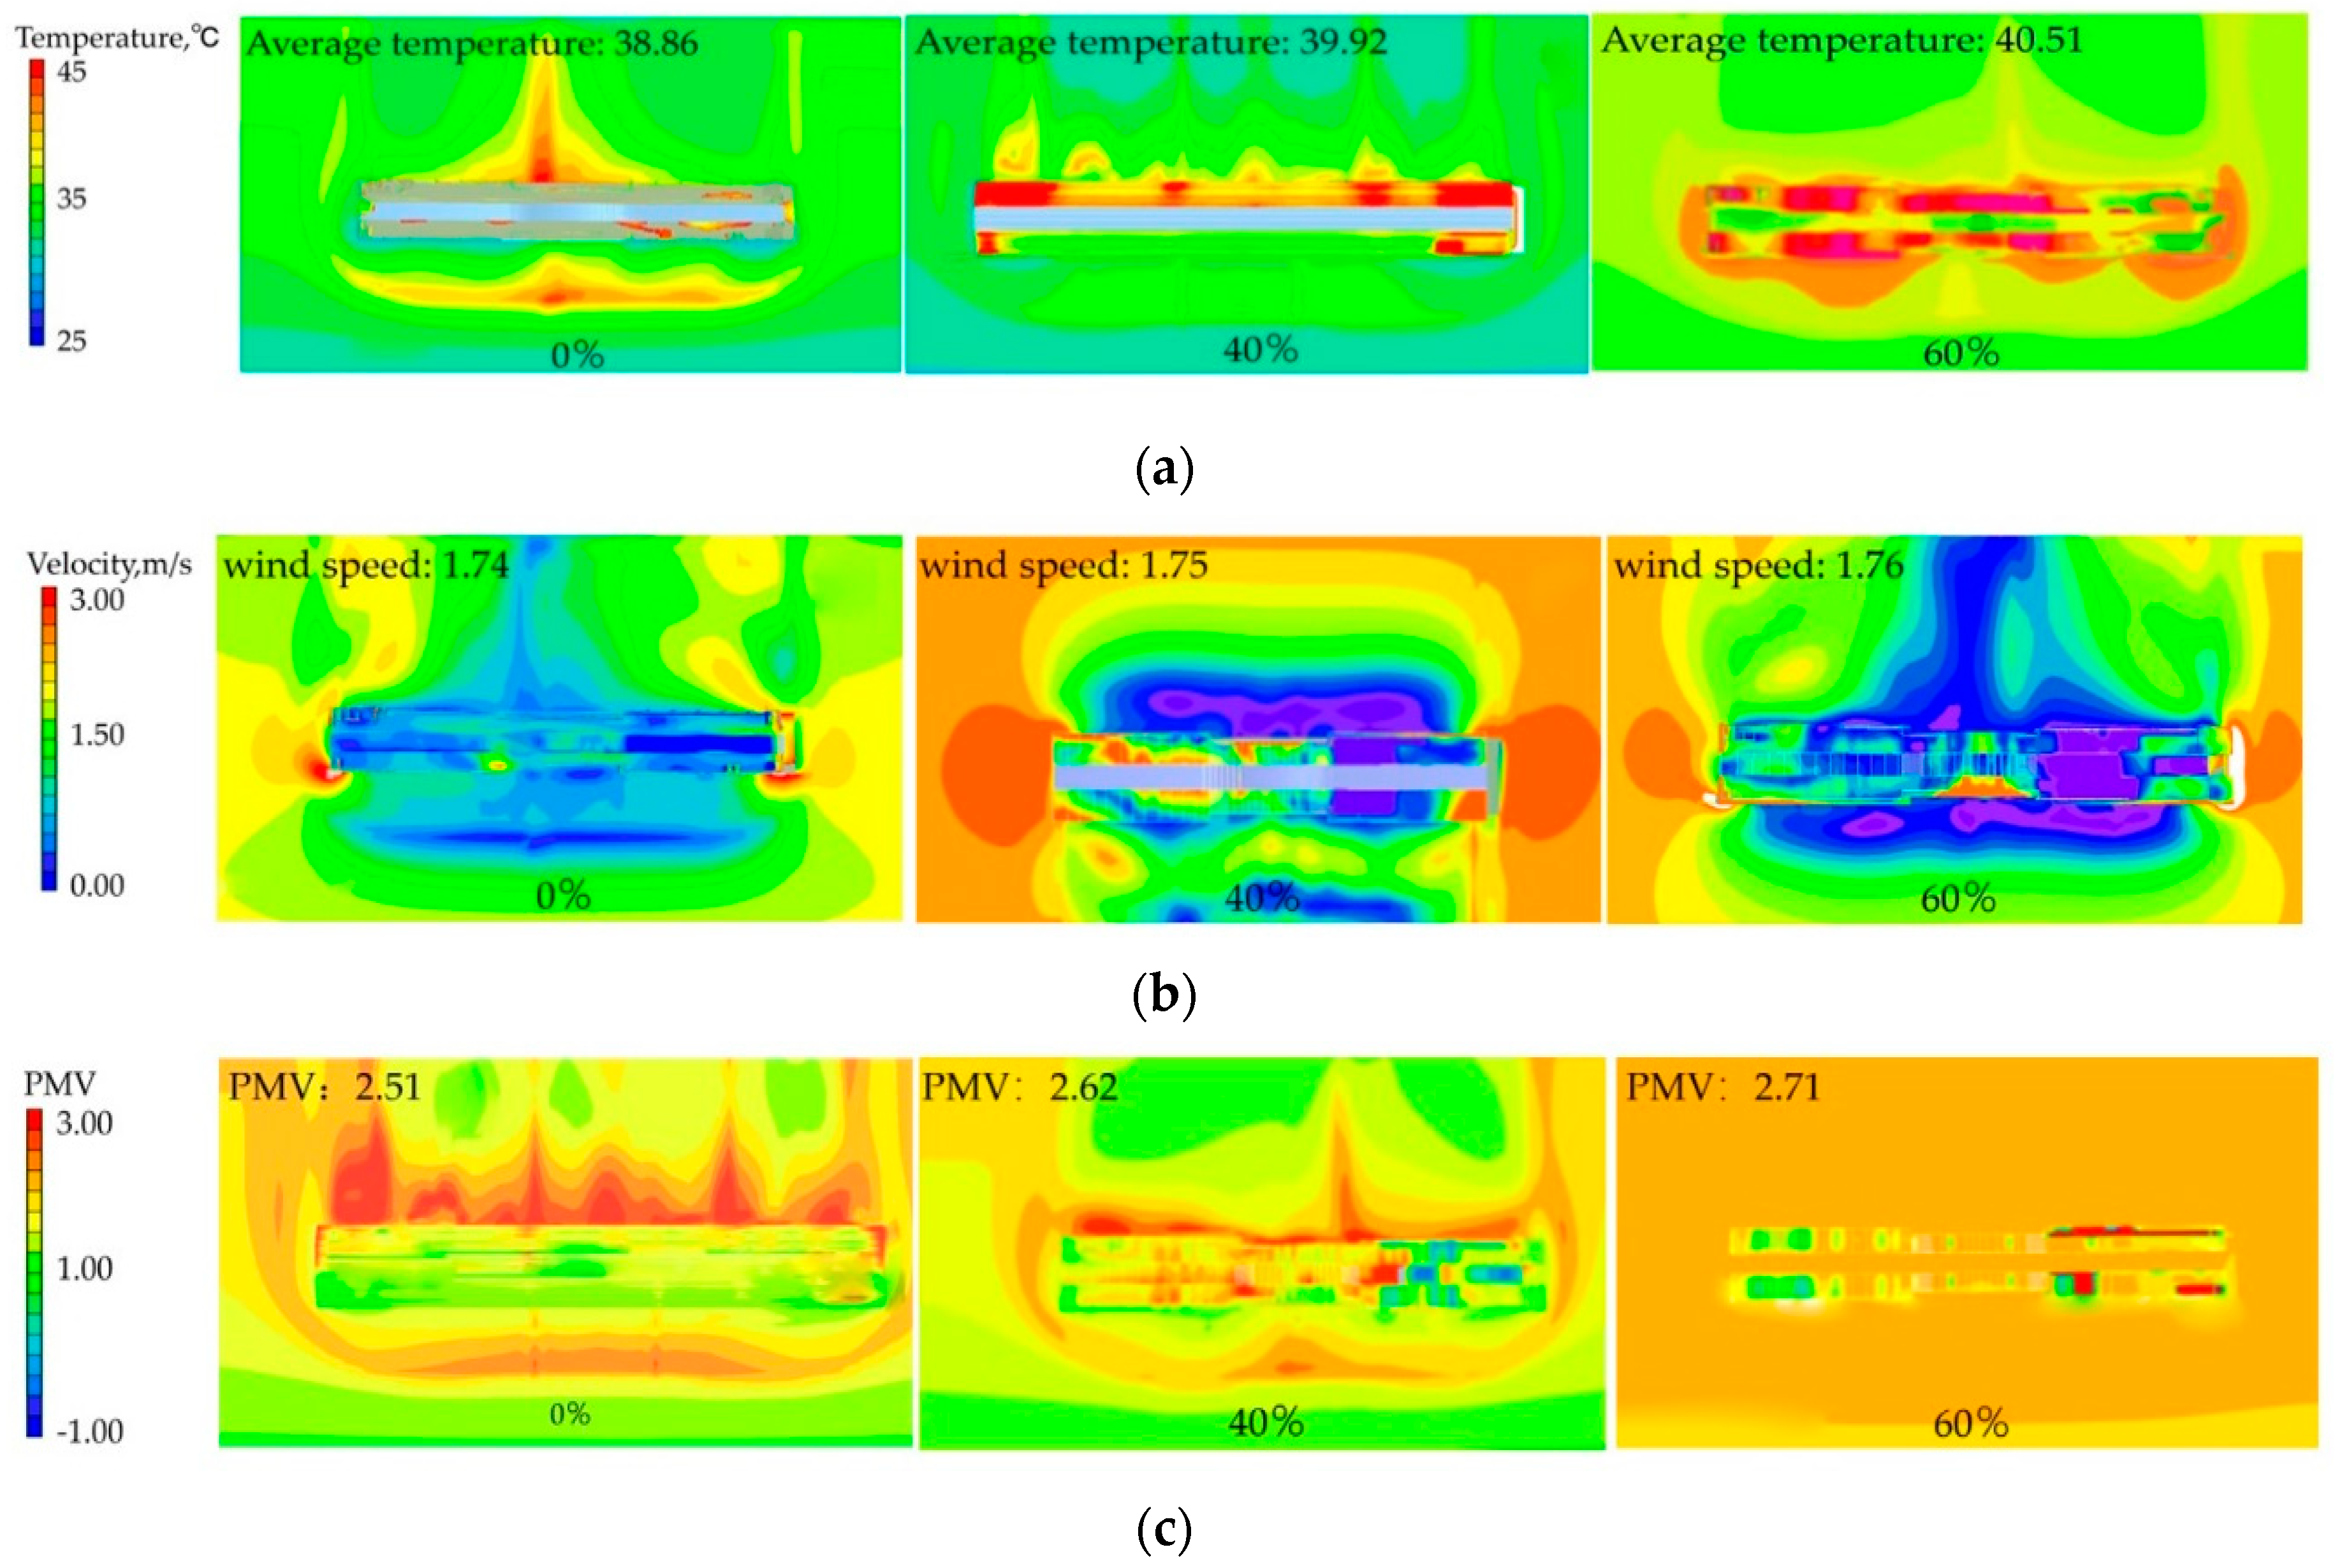
- Skylight opening rate
- (2)
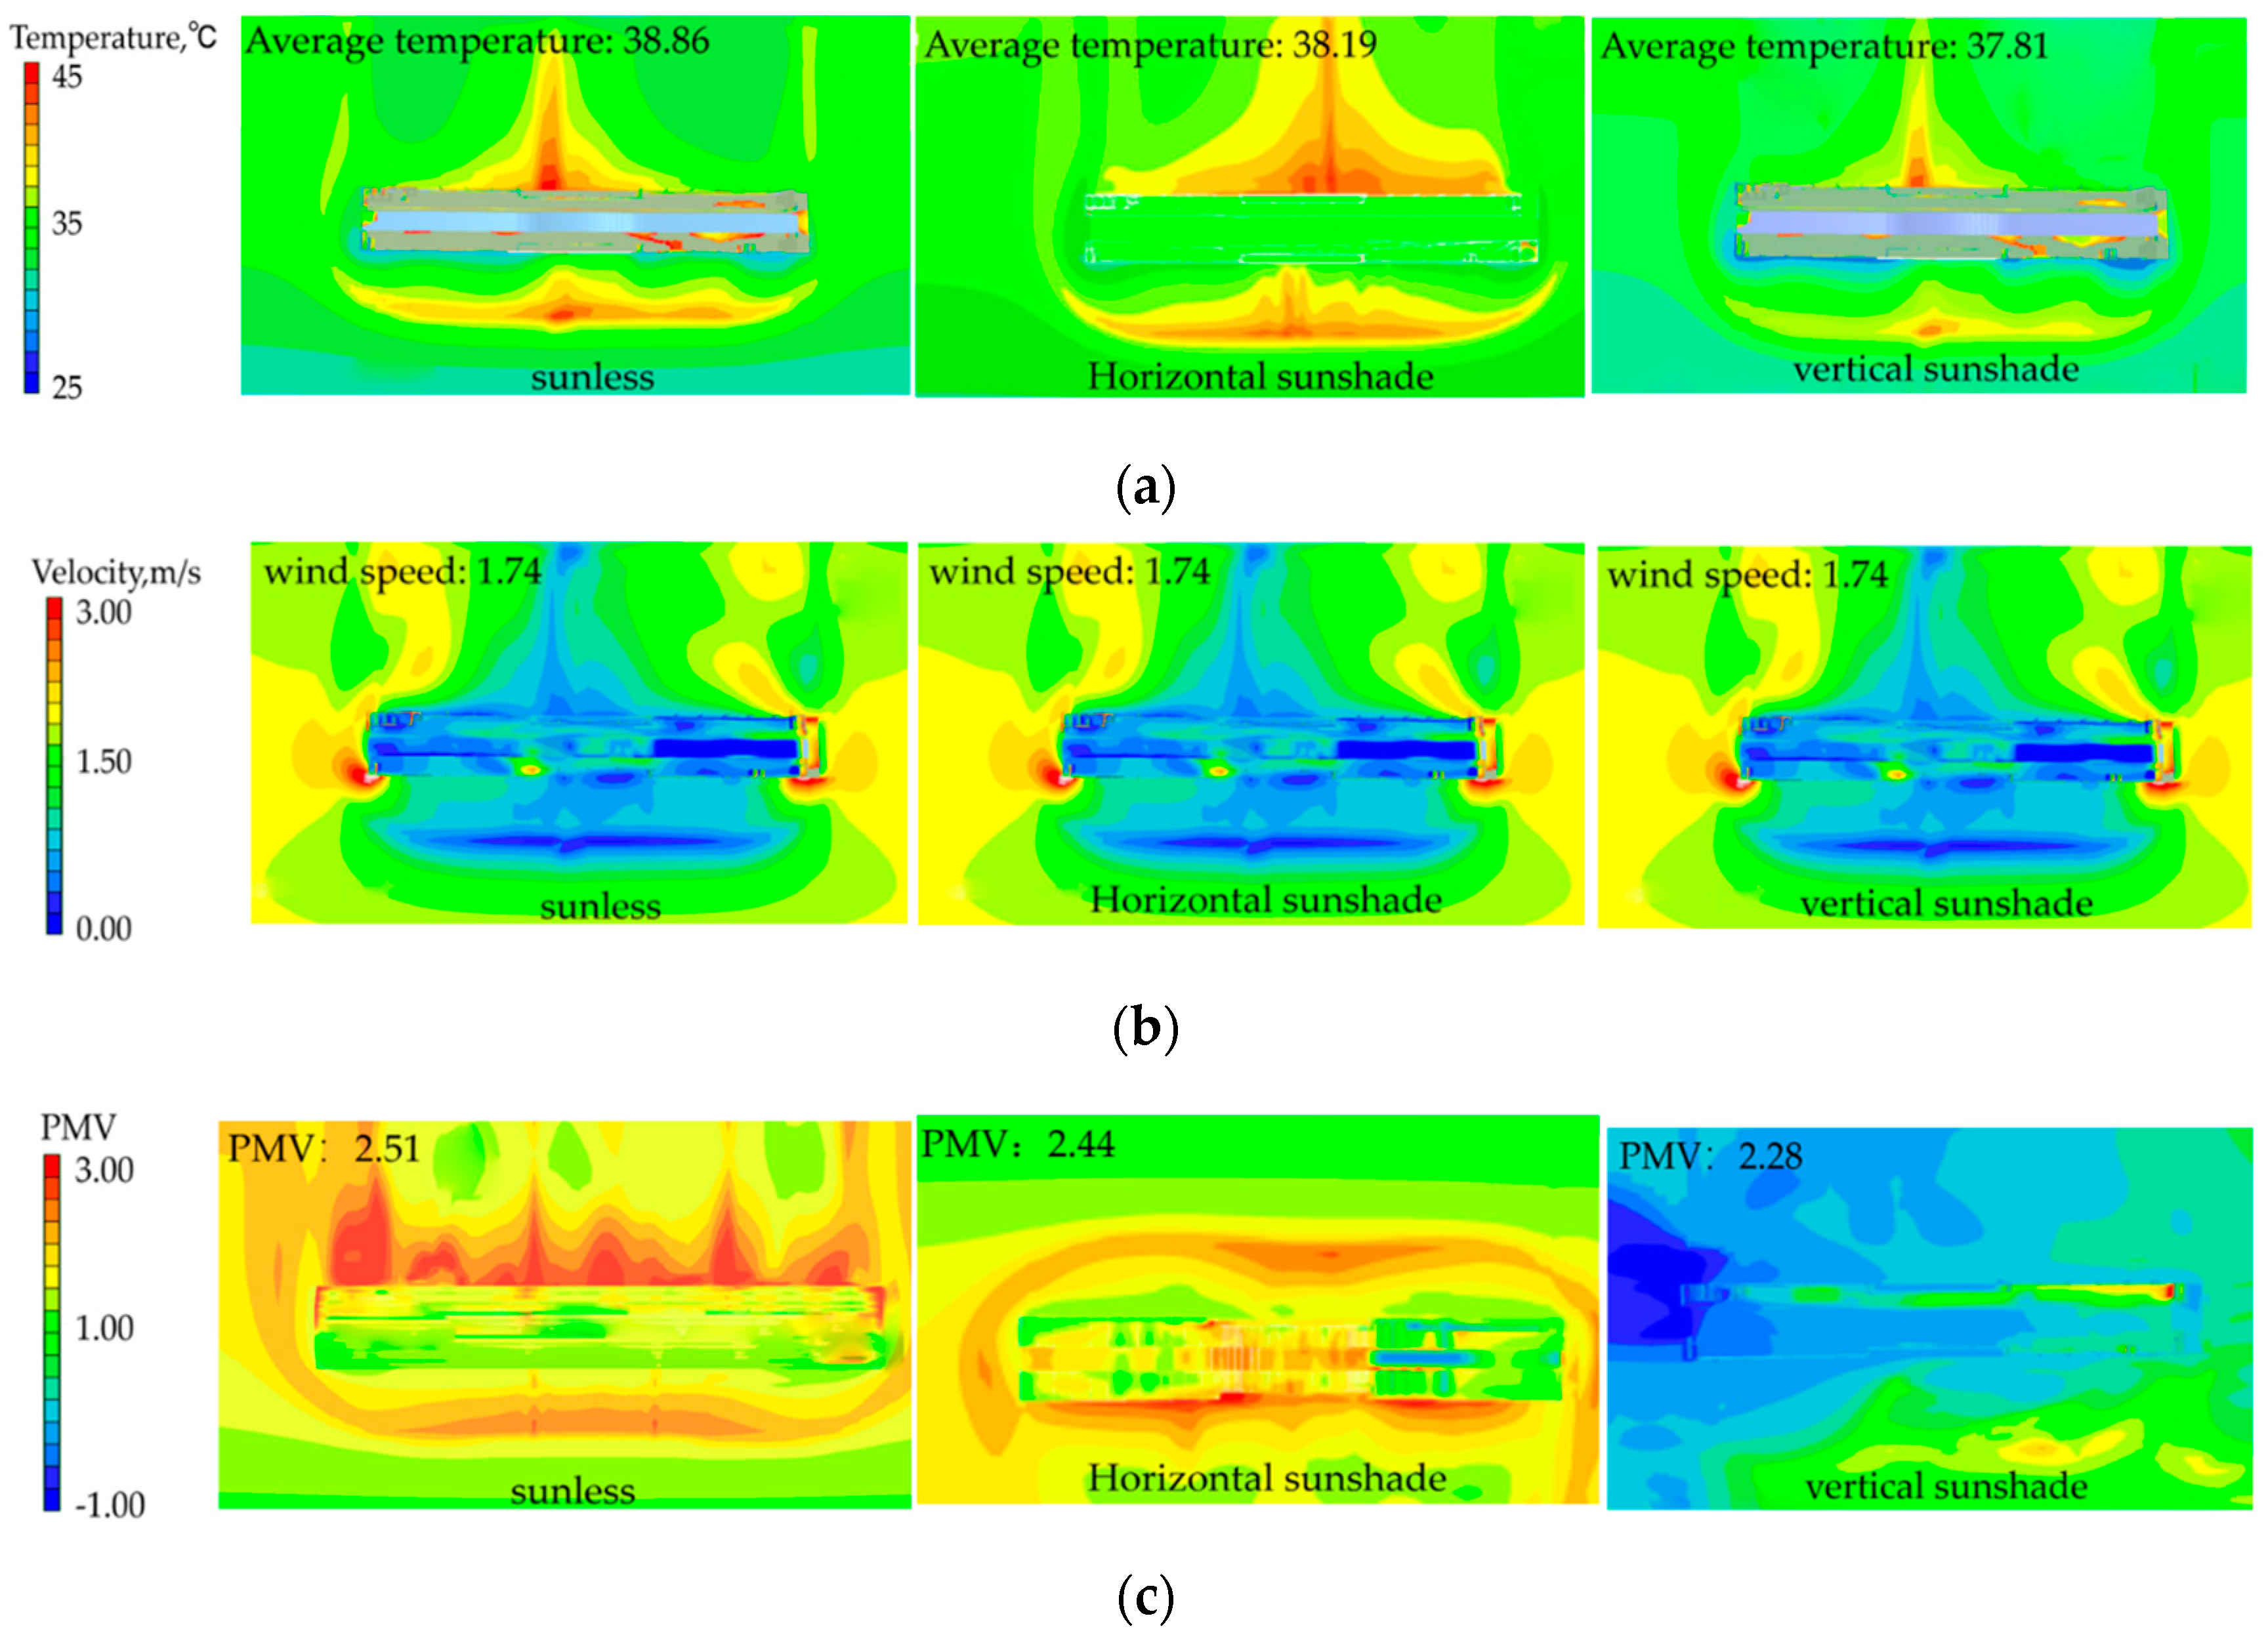
- Sunshade
- (3)
- Opening rate of side window
- (4)
- Sunshades on side windows
- (5)
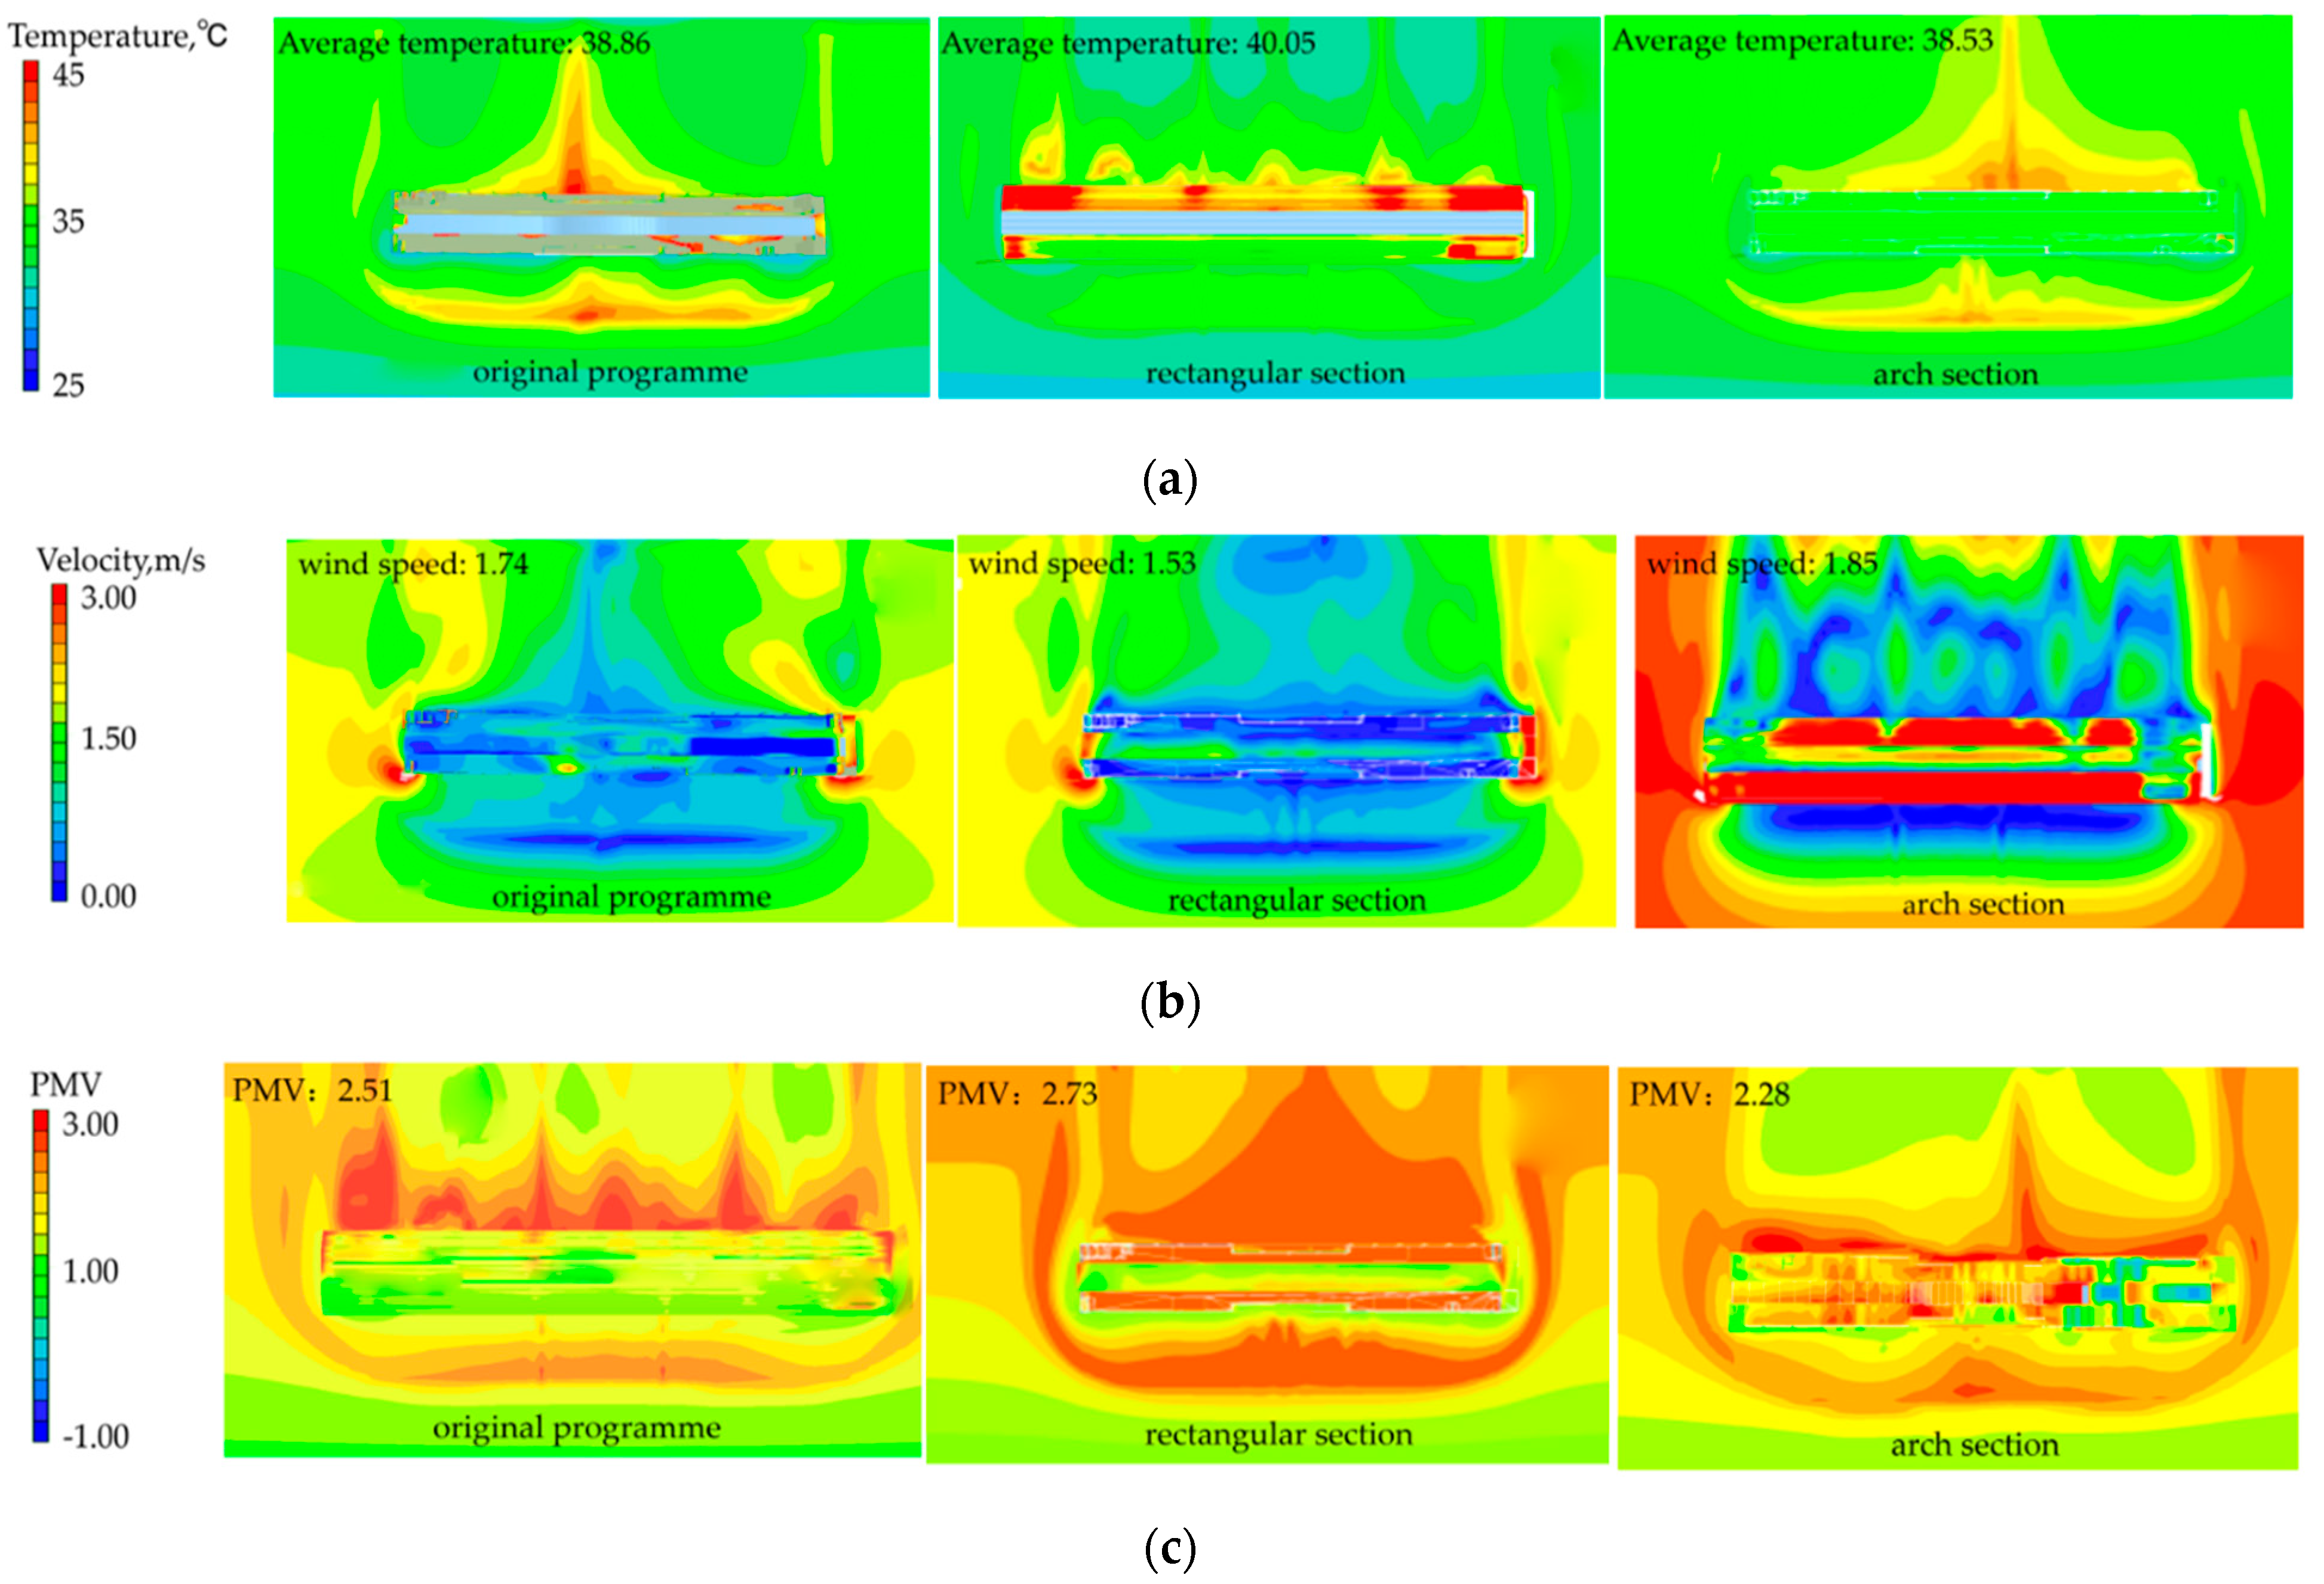
- The cross-section shape of the station
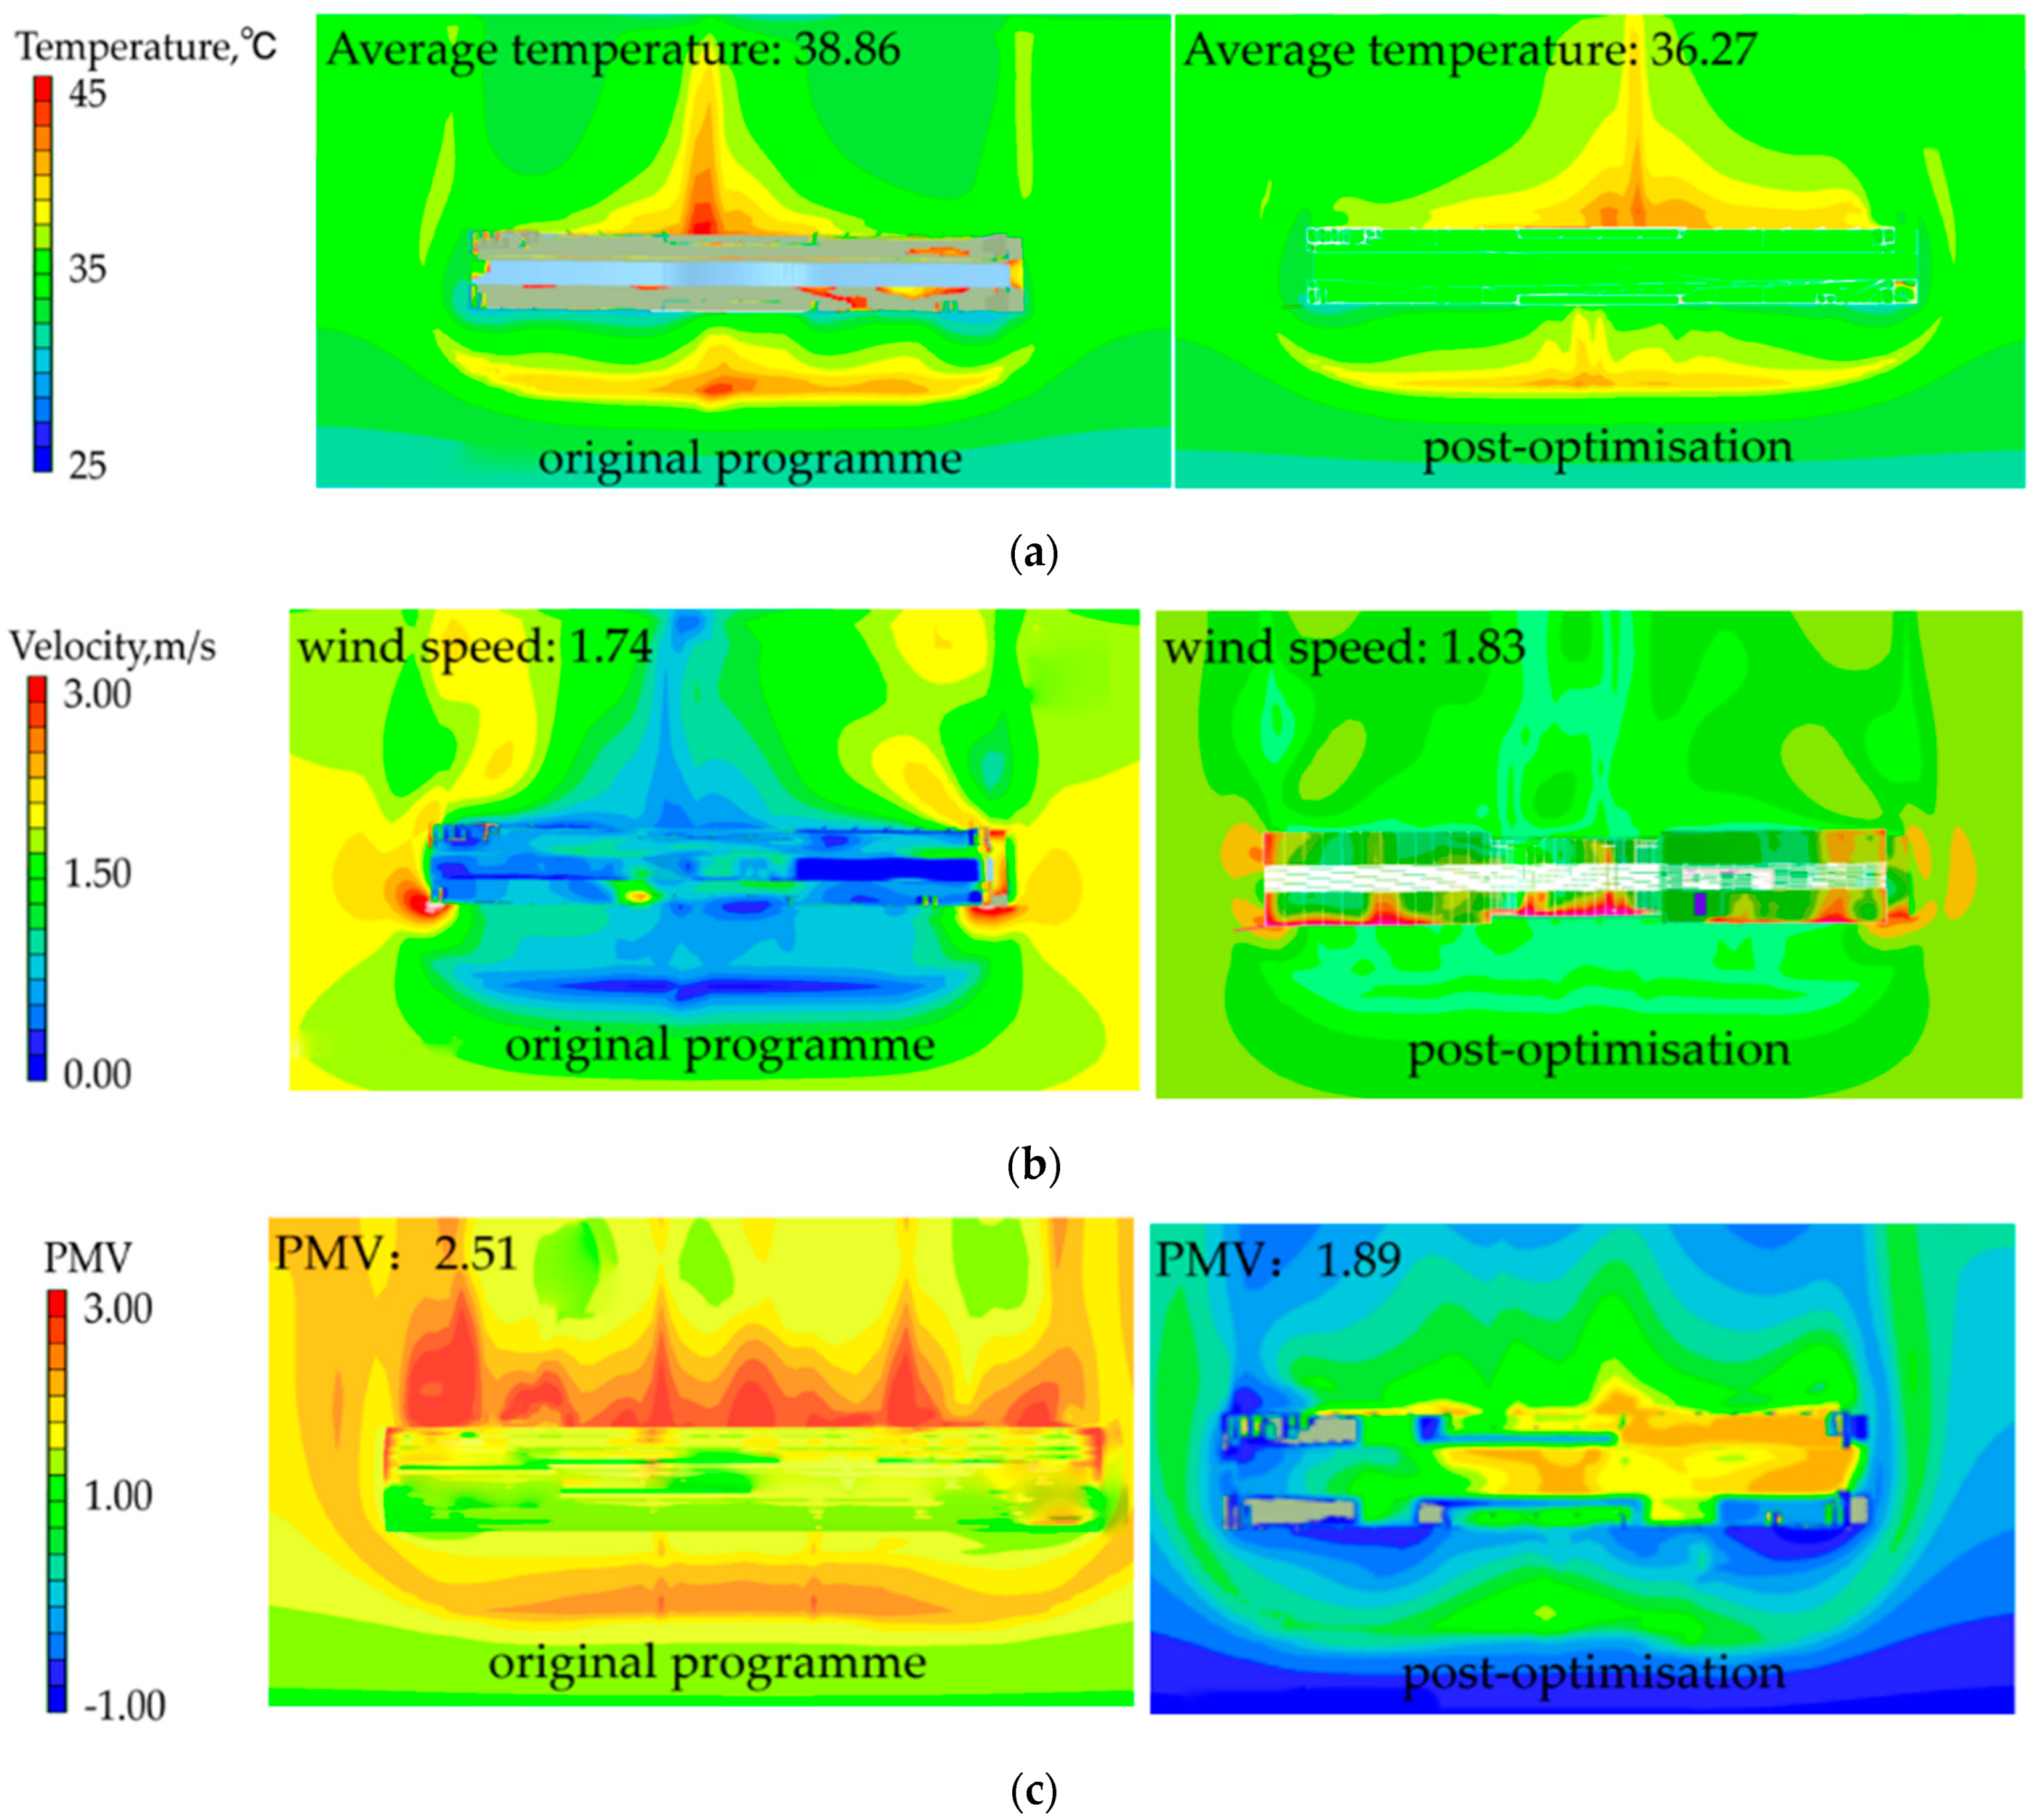
3.3. The Application of Design Optimization: A Case Study of Wudaokou Station
4. Discussion
5. Conclusions
- The installation of sunshading louvers to station skylights can improve thermal comfort. Adding longitudinal louvers to sunshading facilities can reduce the average temperature inside the station by 1.05 °C and decrease the PMV value by 0.23, effectively improving thermal comfort. Adding longitudinal louvers to the skylight is a low-cost and effective measure. However, increasing the skylight opening rate raises the average temperature inside the station, which is not conducive to maintaining thermal comfort.
- The effect is significant when the opening rate of the enclosed glass curtain of the platform side window is set to 20%: the average wind speed increases by 2.8%, the average temperature decreases by 1.14 °C, and the PMV value decreases by 0.23. Further increasing the opening rate is not efficient. Therefore, maintaining a reasonable opening rate of the side windows can effectively improve thermal comfort. Adding louver shading to the side windows further decreases the average temperature by 1.34 °C and the PMV value by 0.4, which also enhances thermal comfort.
- The platform cross-section shape affects thermal comfort. The wind speed is higher and the temperature is lower if the platform profile is arched, high, and large. In the winter, lowering the roof height can reduce air intake and help maintain the temperature inside the station.
- Installing additional longitudinal inner skylight shading facilities and platform side window shading facilities and increasing the opening rate of side windows to 20% can effectively improve thermal comfort. After optimization, the average indoor temperature in the station could be decreased by 2.56 °C, the average wind speed could be increased by 4.7%, and the PMV value could be decreased by 0.62.
Author Contributions
Funding
Data Availability Statement
Conflicts of Interest
Appendix A. Questionnaire on Thermal Comfort in Beijing Metro above Ground Stations
- Your age:
- Less than 18 years
- 18–30 years
- 30–40 years
- 40–50 years
- 50–60 years
- Greater than 60 years
- 2.
- Your most common choice of transportation for travel is (multiple choice):
- Private cars
- Taxis
- Subways
- uses
- Bicycles
- Electric vehicles
- 3.
- The average number of times you ride the subway per week:
- Less than 2 times
- 2 to 5 times
- 5 to 10 times
- More than 10 times
- 4.
- What do you think is the ideal temperature in a subway station during the summer months?
- 20–22 °C
- 23–25 °C
- 26–28 °C
- 29–30 °C
- Above 30 °C
- 5.
- In the winter, what do you think is the ideal temperature in a subway station?
- 18–20 °C
- 21–23 °C
- 24–26 °C
- 27–29 °C
- Above 29 °C
- 6.
- Describe your current heat sensation:
- Very hot
- Hot
- Slightly warm
- Neutral
- Slightly cool
- Cold
- 7.
- What changes would you like to see in each of the following factors at this time:
- -
- Wind speed: □ Increase □ Maintain status □ Decrease
- -
- Temperature: □ Increase □ Maintain status □ Decrease
- -
- Humidity: □ Increase □ Maintain status □ Decrease
- 8.
- Your overall assessment of the thermal environment you are in at the moment is:
- -
- Level of comfort:
- Comfortable
- Slightly uncomfortable
- Uncomfortable
- Very uncomfortable
- 9.
- What areas of the Metro station do you think need the most thermal improvements?
- Station entrances
- Platform waiting areas
- Transfer lanes
- Commercial areas
- Other (please provide a brief description): ___________
- 10.
- How effective do you think the fans set up on the platforms of this station are in cooling the air?
- Very effective
- Fairly effective
- Not very effective
- 11.
- What cooling measures do you think should be taken at this station platform:
- Continued use of fans is sufficient, no other cooling measures are required
- One to two air-conditioned waiting rooms are provided in the platform section
- Fully air-conditioned station sections
- Other (please briefly describe): ___________
- 12.
- What do you think of the ambient air quality at this time?
- Very good
- Fair
- Not good
- 13.
- For this station, while waiting on the platform, you are less satisfied with (multiple choice):
- Excessive heat at the platforms
- Darkness inside the platforms during the day
- Lack of seating
- Low wind and stuffy air
- Strong sunlight, too sunny
- Other (please describe briefly): ___________
- 14.
- What methods do you think could be used to improve thermal comfort in metro stations? (Multiple choice)
- Increase ventilation
- Optimize air conditioning systems
- Use shading to reduce direct sunlight
- Introduce natural light to improve lighting
- Provide more sitting areas
- Other (please provide a brief description): __________
- 15.
- Which area do you usually choose when waiting for a train in a subway station?
- Near fans/air conditioners
- Away from direct air sources
- Near windows/open areas
- Not specific, depending on circumstances
- Other (please briefly describe): ___________
- 16.
- What suggestions do you have for improving the thermal environment at Metro stations?
References
- ANSI/ASHRAE 55-1992; Thermal Environmental Conditions for Human Occupancy. American Society of Heating, Refrigerating and Air Conditioning Engineers, Inc.: Atlanta, GA, USA, 1992.
- ISO 7730:1994; Moderate Thermal Environments-Determination of the PMV and PPD Indices and Specification of the Conditions for Thermal Comfort. International Standards Organization: Geneva, Switzerland, 1984.
- Huizenga, C.; Zhang, H.; Arens, E.; Wang, D. Skin and core temperature response to partial-and whole-body heating and cooling. J. Therm. Biol. 2004, 29, 549–558. [Google Scholar] [CrossRef]
- Humphreys, M. Outdoor temperature and comfort indoors. Batim. Int. Build. Res. Pract. 1978, 6, 92–105. [Google Scholar] [CrossRef]
- Tanabe, S.; Kimura, K.; Hara, T. Thermal comfort requirements during the summer season in Japan. ASHRAE Trans. 1987, 93, 564–577. [Google Scholar]
- Misawa, K.; Nakano, J.; Tanabe, S. Field survey of thermal environment and occupancy condition of passengers in railway station. Cytopathology 2007, 27, 297–299. [Google Scholar]
- Sakamoto, K. Research on the thermal comfort zone of railway stations with air-conditioned spaces. JR East Tech. Rev. 2012, 23, 33–36. [Google Scholar]
- Ampofo, F.; Maidment, G.; Missenden, J. Underground railway environment in the UK Part 1: Review of thermal comfort. Appl. Therm. Eng. 2004, 6, 611–631. [Google Scholar] [CrossRef]
- Mortada, A.; Choudharya, R.; Soga, K. Thermal modeling and parametric analysis of underground rail systems. Energy Procedia 2015, 2262–2267. [Google Scholar] [CrossRef]
- Han, Y.; He, L.; Wang, J. Analysis of the comfort of air supply on platforms of elevated metro stations. J. Metro Express Transp. 2006, 19, 88–90,94. (In Chinese) [Google Scholar]
- Qiao, X. Application of direct evaporative cooling ventilation cooling in elevated metro stations. J. Railw. Stand. Des. 2011, 9, 116–119. (In Chinese) [Google Scholar]
- Berglund, L.G. Comfort and humidity. ASHRAE J. 1998, 9, 428. [Google Scholar]
- Cui, L.; Zhu, J.; Mao, J. Numerical simulation analysis of the thermal environment in subway interchange stations. In Proceedings of the 21st Annual Conference of the Beijing Mechanics Society and the 22nd Annual Conference of the Beijing Vibration Engineering Society, Beijing, China, 1 January 2015; Volume 5, p. I-172. (In Chinese). [Google Scholar]
- Liu, Y. Research on measurement methods of the metro thermal environment. In Proceedings of the National HVACR 2004 Annual Conference Abstracts Collection, Beijing, China, 14–16 September 2004; Volume 1, p. 295. [Google Scholar]
- Yin, K.; Yu, S. Discussion on the temperature control of air-conditioning operation in Tianjin metro station. J. Shandong Univ. Arch. 2008, 23, 466–470. (In Chinese) [Google Scholar]
- Li, W.; Feng, H.; Wang, L.; Li, L. Research on the evaluation and control strategy of thermal comfort in metro stations. J. Clean and Air Cond. Technol. 2014, 3, 25–28. (In Chinese) [Google Scholar]
- Fanger, P.O. Thermal Comfort: Analysis and Application in Environmental Engineering; McGraw-Hill: New York, NY, USA, 1970. [Google Scholar]
- Dear, R.; Brager, G. Developing an adaptive model of thermal comfort and preference. ASHRAE Trans. 1998, 104, 145–167. [Google Scholar]
- Abbaspour, M.; Jafari, M.J.; Mansouri, N.; Moattar, F.; Nouri, N.; Allahyari, M. Thermal comfort evaluation in Tehran metro using relative warmth index. Int. J. Environ. Sci. Technol. 2008, 5, 297–304. [Google Scholar] [CrossRef]
- Bai, X. Research on the Thermal Environment of Elevated Station Platforms of Urban Rail Transit in Hot Summer and Warm Winter Areas. Master’s Thesis, South China University of Technology, Guangzhou, China, 2017; pp. 86–87. (In Chinese). [Google Scholar]
- Wang, L.; Wang, Z.; Yuan, J. Analysis of thermal comfort optimization strategy for Tianjin metro elevated station in summer. J. Build. Energy. Sav. 2019, 47, 89–92. (In Chinese) [Google Scholar]
- Akira, H. Climatological Uses of Plants for Solar Control and the Effects on the Thermal Environment of a Building. Energy Build. 1988, 11, 81–199. [Google Scholar]
- Takeshi, H. A New System for Roof-top Planting and its Thermal Characteristics. In A Collection of Academic Lectures at the Congress of the Architectural Institute of Japan (AIJ); Architectural Institute of Japan (AIJ): Tokyo, Japan, 1993; Volume 2, p. 9. [Google Scholar]
- Kenji, M. Experimental Study on Effect of a Turf Roof, An Examination on Thermal Characteristics and Method of Turf Test-Model. In A Collection of Academic Lectures at the Congress of the Architectural Institute of Japan (AIJ); Architectural Institute of Japan (AIJ): Tokyo, Japan, 1993; Volume 1, p. 9. [Google Scholar]
- Sadayuki, O. A Study on Evaporative Cooling Effect by Roof Lawn Garden, Wind Tunnel Test and Analysis. In A Collection of Academic Lectures at the Congress of the Architectural Institute of Japan (AIJ); Architectural Institute of Japan (AIJ): Tokyo, Japan, 1993; Volume 2, p. 9. [Google Scholar]
- Hoyano, A.; He, J.; Horiguchi, T.; Wang, G. Experimental Study of Heat Budget for Foliage layer of Lawn-Planting, Effect of Rooftop Lawn-Planting on Thermal Environment Part I. J. Archit. Plan. Environ. Eng. 1994, 462, 31–39. [Google Scholar]
- Ishino, H.; Tanimoto, J.; Yanagi, M. Study on the Evaporation from Foliage Plant in Indoor Environment. J. Archit. Plan. Environ. Eng. 1994, 457, 40–42. [Google Scholar]
- Kuper, R. Preference and restorative potential for landscape models that depict diverse arrangements of defoliated, foliated, and evergreen plants. Urban For. Urban Green. 2020, 48, 65–70. [Google Scholar] [CrossRef]


| Metro Line | Line 5 | Line 13 | Line 15 | Batong Line | |
|---|---|---|---|---|---|
| MRT station | Tiantongyuan | Wudaokou | Shangdi | Guozhan | Shuangqiao |
| Sunlight | None | Vertical Strip Casement | Vertical Strip Casement | None | None |
| Side window | Semi-Open Side | Enclosed Glass Curtain | Enclosed Glass Curtain | Enclosed Glass Curtain | Enclosed Glass Curtain |
| Section form | Rectangles | Atypical | Bins | Rectangles | Bins |
| Parameter | Model | Range | Resolution |
|---|---|---|---|
| Temperature | TES-1361C | −20~60 °C | 0.1 °C |
| Relative humidity | TES-1361C | 10~95% RH | 0.1% RH |
| Wind speed | Anemometer testo405-V1 | 0–10 m/s | 0.01 m/s |
| Thermal Comfort Grading | −3 | −2 | −1 | 0 | +1 | +2 | +3 |
|---|---|---|---|---|---|---|---|
| Heat sensation | Cold | Cool | A bit cool | Comfortable | A bit warm | Warm | Hot |
| Wet sensation | Very humid | Humid | A bit humid | Comfortable | A bit dry | Dry | Very dry |
| Wind sensation | Very stuffy | Stuffy | A bit stuffy | Comfortable | A bit windy | Windy | Very windy |
| Overall acceptability | Totally unacceptable | Moderately unacceptable | A bit unacceptable | / | A bit acceptable | Moderately acceptable | Totally acceptable |
| Abbreviation | Full Name | Description or Definition |
|---|---|---|
| PMV | Predicted Mean Vote | The Predicted Mean Vote is a metric used to assess human thermal comfort. |
| PPD | Predicted Percentage Dissatisfied | This is a prediction of the number of people in a group who are uncomfortable with a given thermal environment on an average scale of thermal sensation as a percentage of the total number of people in the group. |
| SU 2019 | Sketch Up 2019 | Models created with Sketch up, is primarily a software for creating, sharing, and presenting 3D models. |
| RH | Relative Humidity | The relative humidity expresses the ratio of the water vapor content of the air to the saturated water vapor content. |
| ASHRAE | American Society of Heating, Refrigerating and Air-Conditioning Engineers | The American Society of Heating, Refrigerating, and Air-Conditioning Engineers is an international organization with more than 50,000 members and chapters worldwide. |
| ISO | International Organization for Standardization | The International Organization for Standardization (ISO) is a non-governmental international standardization body formed by a multinational coalition. |
| ET | Effective Temperature | A new thermal comfort indicator established by studying the effect of humidity on human thermal comfort in the laboratory. |
| Station | Temperature (°C) Average (min, max) | Relative Humidity (%) Average (min, max) | Wind Speed (m/s) Average (min, max) |
|---|---|---|---|
| Tiantongyuan | 37.2 (32.2, 40.3) | 45.3 (41.5, 52.6) | 0.69 (0.09, 1.17) |
| Wudaokou | 37.6 (30.5, 42.8) | 48.7 (38.6, 61.6) | 0.65 (0.05, 1.13) |
| Shangdi | 38.7 (31.7, 40.9) | 47.8 (41.4, 56.4) | 0.64 (0.10, 1.09) |
| Guozhan | 37.5 (31.9, 41.7) | 57.8 (52.9, 64.4) | 0.54 (0.06, 1.05) |
| Shuangqiao | 36.4 (30.8, 41.6) | 49.3 (37.6, 75.5) | 0.56 (0.08, 0.96) |
Disclaimer/Publisher’s Note: The statements, opinions and data contained in all publications are solely those of the individual author(s) and contributor(s) and not of MDPI and/or the editor(s). MDPI and/or the editor(s) disclaim responsibility for any injury to people or property resulting from any ideas, methods, instructions or products referred to in the content. |
© 2024 by the authors. Licensee MDPI, Basel, Switzerland. This article is an open access article distributed under the terms and conditions of the Creative Commons Attribution (CC BY) license (https://creativecommons.org/licenses/by/4.0/).
Share and Cite
Li, X.; Shi, W.; Liu, Y.; Zhang, N. Optimization Strategy for Thermal Comfort in Railway Stations above Ground Level in Beijing. Buildings 2024, 14, 2843. https://doi.org/10.3390/buildings14092843
Li X, Shi W, Liu Y, Zhang N. Optimization Strategy for Thermal Comfort in Railway Stations above Ground Level in Beijing. Buildings. 2024; 14(9):2843. https://doi.org/10.3390/buildings14092843
Chicago/Turabian StyleLi, Xiangyu, Wenxi Shi, Yixuan Liu, and Nan Zhang. 2024. "Optimization Strategy for Thermal Comfort in Railway Stations above Ground Level in Beijing" Buildings 14, no. 9: 2843. https://doi.org/10.3390/buildings14092843
APA StyleLi, X., Shi, W., Liu, Y., & Zhang, N. (2024). Optimization Strategy for Thermal Comfort in Railway Stations above Ground Level in Beijing. Buildings, 14(9), 2843. https://doi.org/10.3390/buildings14092843