Abstract
This study examines the thermal performance of building walls under full sunlight conditions using various insulation strategies. Specifically, it evaluates: (1) the effects of heat on building walls and indoor spaces; (2) the impact of groundwater cooling systems on thermal environments; (3) the influence of phenolic aldehyde insulation layers on heat transfer; and (4) the combined effects of groundwater cooling and phenolic aldehyde thermal insulation. Fluent–CFD (Computational Fluid Dynamics) was used in the study to simulate temperature transmission between the sun, the groundwater cooling system, and both indoor and outdoor spaces. Experimental analysis and simulations reveal that both the phenolic aldehyde insulation layer and the groundwater cooling system effectively reduce heat transfer, with the groundwater cooling system demonstrating the most significant impact. The phenolic aldehyde layer decreases the temperature difference between inner and outer walls by approximately 8 °C. The groundwater cooling system further reduces both inner and outer wall temperatures, helping to maintain cooler indoor environments. Simulation results indicate that, while the phenolic aldehyde layer effectively prevents external heat from penetrating into the room, it does not eliminate heat accumulation. In contrast, the groundwater cooling system efficiently dissipates heat, mitigating this issue. Groundwater analysis shows that maximum temperature differences occur at specific times of the day, with water flow effectively cooling the space. The combined use of the phenolic aldehyde insulation layer and the groundwater cooling system offers superior thermal performance. The phenolic layer provides effective heat blocking, while the groundwater system facilitates heat dissipation, optimizing indoor temperature and reducing air conditioning loads. This combination enhances overall comfort and energy efficiency, with the groundwater cooling system benefiting from reduced flow velocity and lower energy consumption.
1. Introduction
In the 21st century, the effects of global warming have significantly increased the focus on renewable energy solutions [1,2,3,4,5,6]. The distribution of underground temperature serves as a valuable tool for evaluating historical climate changes, with groundwater temperature being influenced by both conduction and convection with surface water. Although groundwater temperature generally remains stable, studies have shown that it can vary due to factors such as deforestation, urbanization, and climate change [1].
To collect groundwater temperature data, boreholes or deep wells are typically used. In Taiwan, the Water Resources Agency under the Ministry of Economic Affairs has established a network of deep and shallow wells across various locations to survey hydrogeological information.
Recent literature suggests that geothermal and underground cooling systems are viable alternative energy sources [7,8,9,10,11,12,13,14]. While existing buildings often rely on mechanical air conditioners, integrating low-energy cooling solutions into building designs can save energy and significantly enhance overall cooling efficiency [15,16,17]. Groundwater temperatures deeper than 5 m below the surface remain nearly constant year-round. As depth increases, the groundwater temperature becomes cooler than the air temperature during summer, making it a viable option for cooling buildings, and warm enough to heat buildings during winter.
One effective method of utilizing groundwater is through a recirculation system that returns used groundwater after it has passed through a heat exchanger. For instance, Modern Building Services in the UK utilizes groundwater coupled with heat pumps to regulate indoor temperatures. Oldmeadow et al. provide recent examples of geothermal energy applications in high-profile public buildings within urban settings. There are two primary applications for low-temperature geothermal resources: using them as a heating source and utilizing ambient temperature groundwater for cooling building systems in the UK [18].
General geothermal systems can be categorized into open and confined types, utilizing stable groundwater temperatures to heat or cool buildings or other targeted objects [19,20,21]. Proper use of underground “cold” and “heat” resources can facilitate the development of thermal circulation indoor temperature control systems, enhancing both cooling and thermal insulation [6].
This study is conducted in central Taiwan, where the effects of global warming are evident. In central Taichung, summer temperatures can reach as high as 35.3 °C, with relative humidity averaging between 74.1% and 89.7%, resulting in hot and humid weather. During the summer, the average daily sunshine duration can range from 5 to 8 h. Field studies of the experimental site show that the ground strata consist of sand, gravel, and rock. The aquifers, which are 10–180 m thick, are composed of alternating sandstone and shale layers, providing a rich groundwater source. In this area, groundwater is confined within 1 to 5 layers of aquifers, sandwiched between 2 to 4 impervious layers, at depths ranging from 3 to 40 m below the surface. The aquifer temperature remains relatively constant, varying between 19 °C and 20 °C, with minimal daily variation. Therefore, this stable and low groundwater temperature is ideal for operating the proposed groundwater cooling system for walls.
This study analyzes the thermal effects on building walls under full sunlight conditions using different insulation strategies. The research objectives include evaluating: (1) the effect of heat on building walls and indoor spaces; (2) the impact of groundwater cooling systems on thermal environments; (3) the influence of phenolic aldehyde insulation layers on heat transfer; and (4) the combined effects of groundwater cooling and phenolic aldehyde thermal insulation.
2. Research Methodology
In recent years, advancements in computational arithmetic capabilities have significantly enhanced the use of computer simulation programs, such as Fluent-CFD (Computational Fluid Dynamics), for simulating thermal environments and predicting the effects of sunlight on buildings [22,23]. This study employs the finite difference control volume method to approximate numerical solutions, using an assumed computational mesh to analyze the distribution of velocity and temperature fields in a given space. The overall structure is set up based on the dimensions of experimental houses, and the thermal environment simulation is evaluated using three different wall configurations. The simulation conditions include:
- Assessing the thermal environmental impact of buildings with concrete walls under full sunlight.
- Evaluating the impact of integrating concrete walls with a groundwater cooling system.
- Analyzing the effect of adding a phenolic insulation layer to concrete walls.
- Assessing the combined benefits of a groundwater cooling system and a phenolic aldehyde insulation layer.
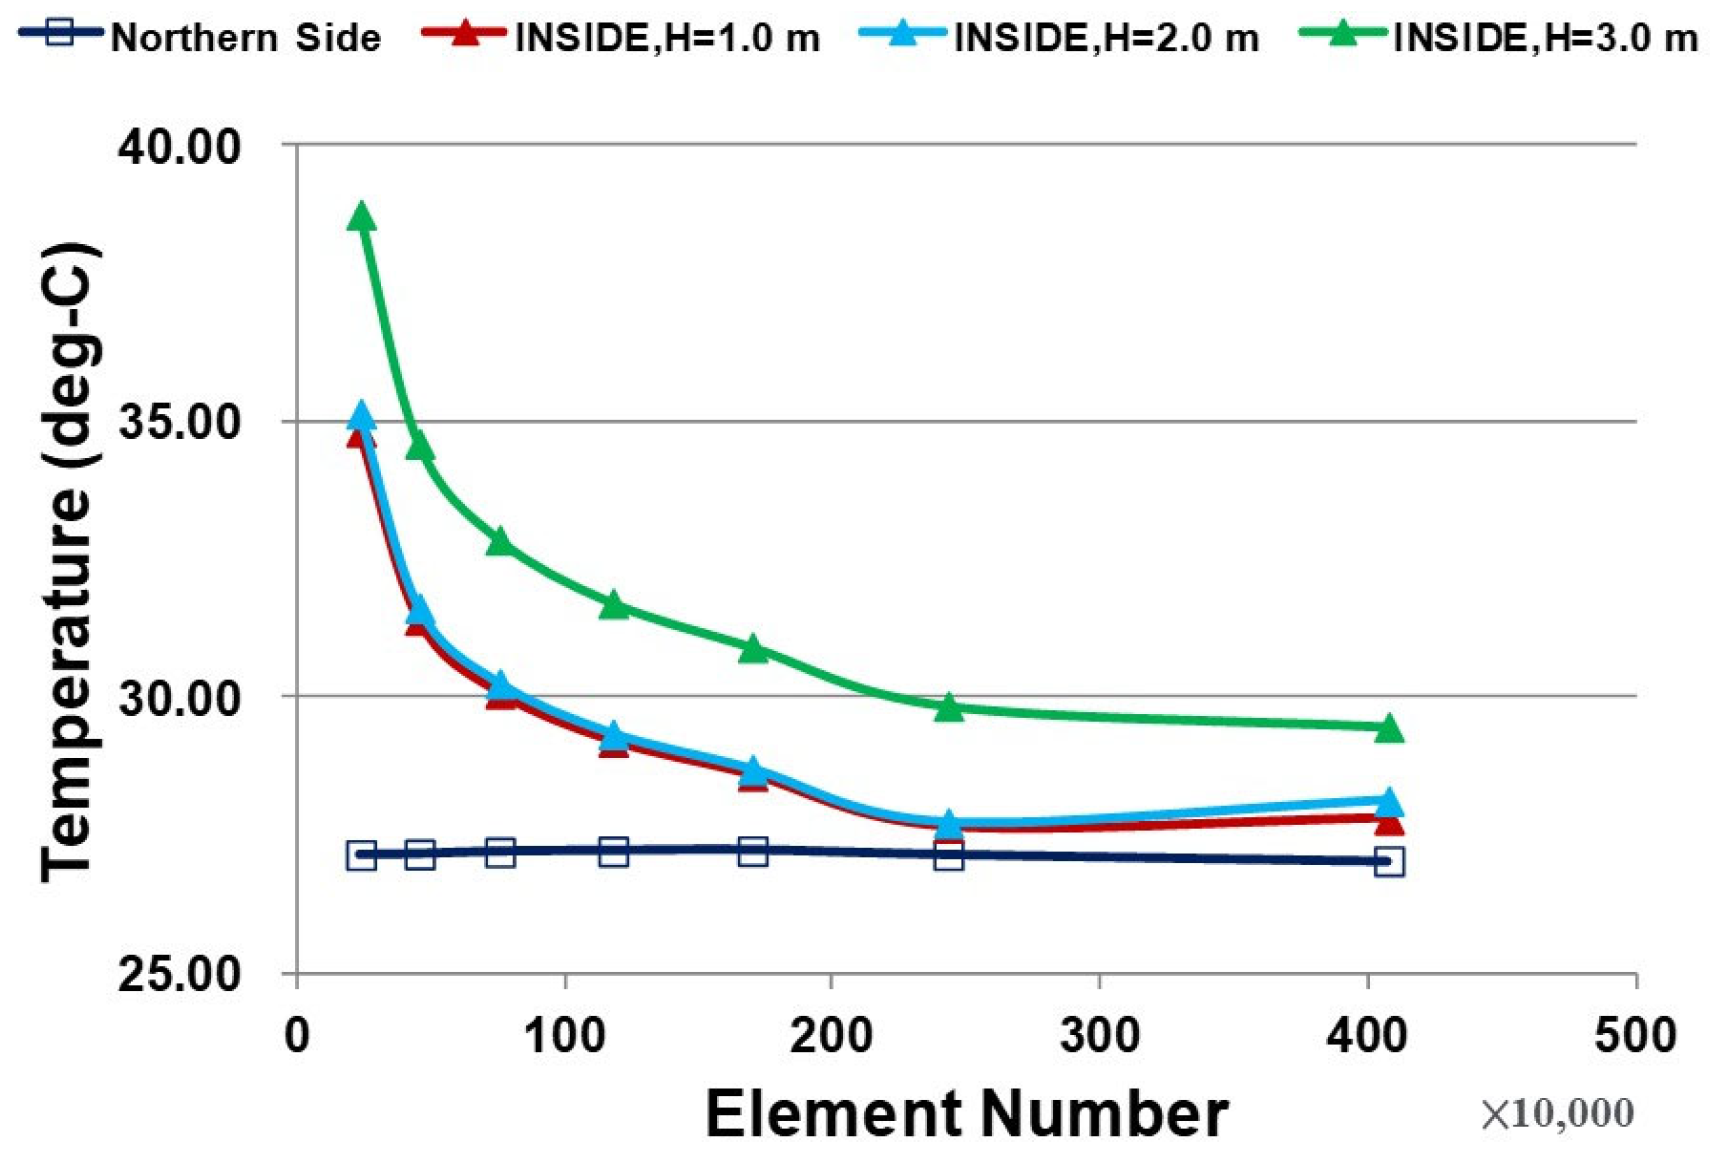
Different grids are utilized for grid independence tests during the simulation process. A reference point in the model (as shown in Figure 1) is selected, with different heights chosen for grid test analysis. Seven groups are analyzed using five different cell numbers, ranging from 300,000 to 2.5 million cells. The grid with 1.5 million cells exhibits stable and convergent results, indicating a good analytical effect. Consequently, this cell number is used for the simulations (Figure 2). The construction of the building grid is illustrated in Figure 3. This study simulates convective heat transfer using a quasi-static process for instantaneous computation.
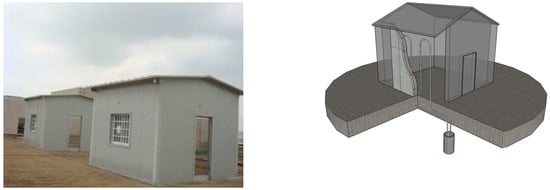
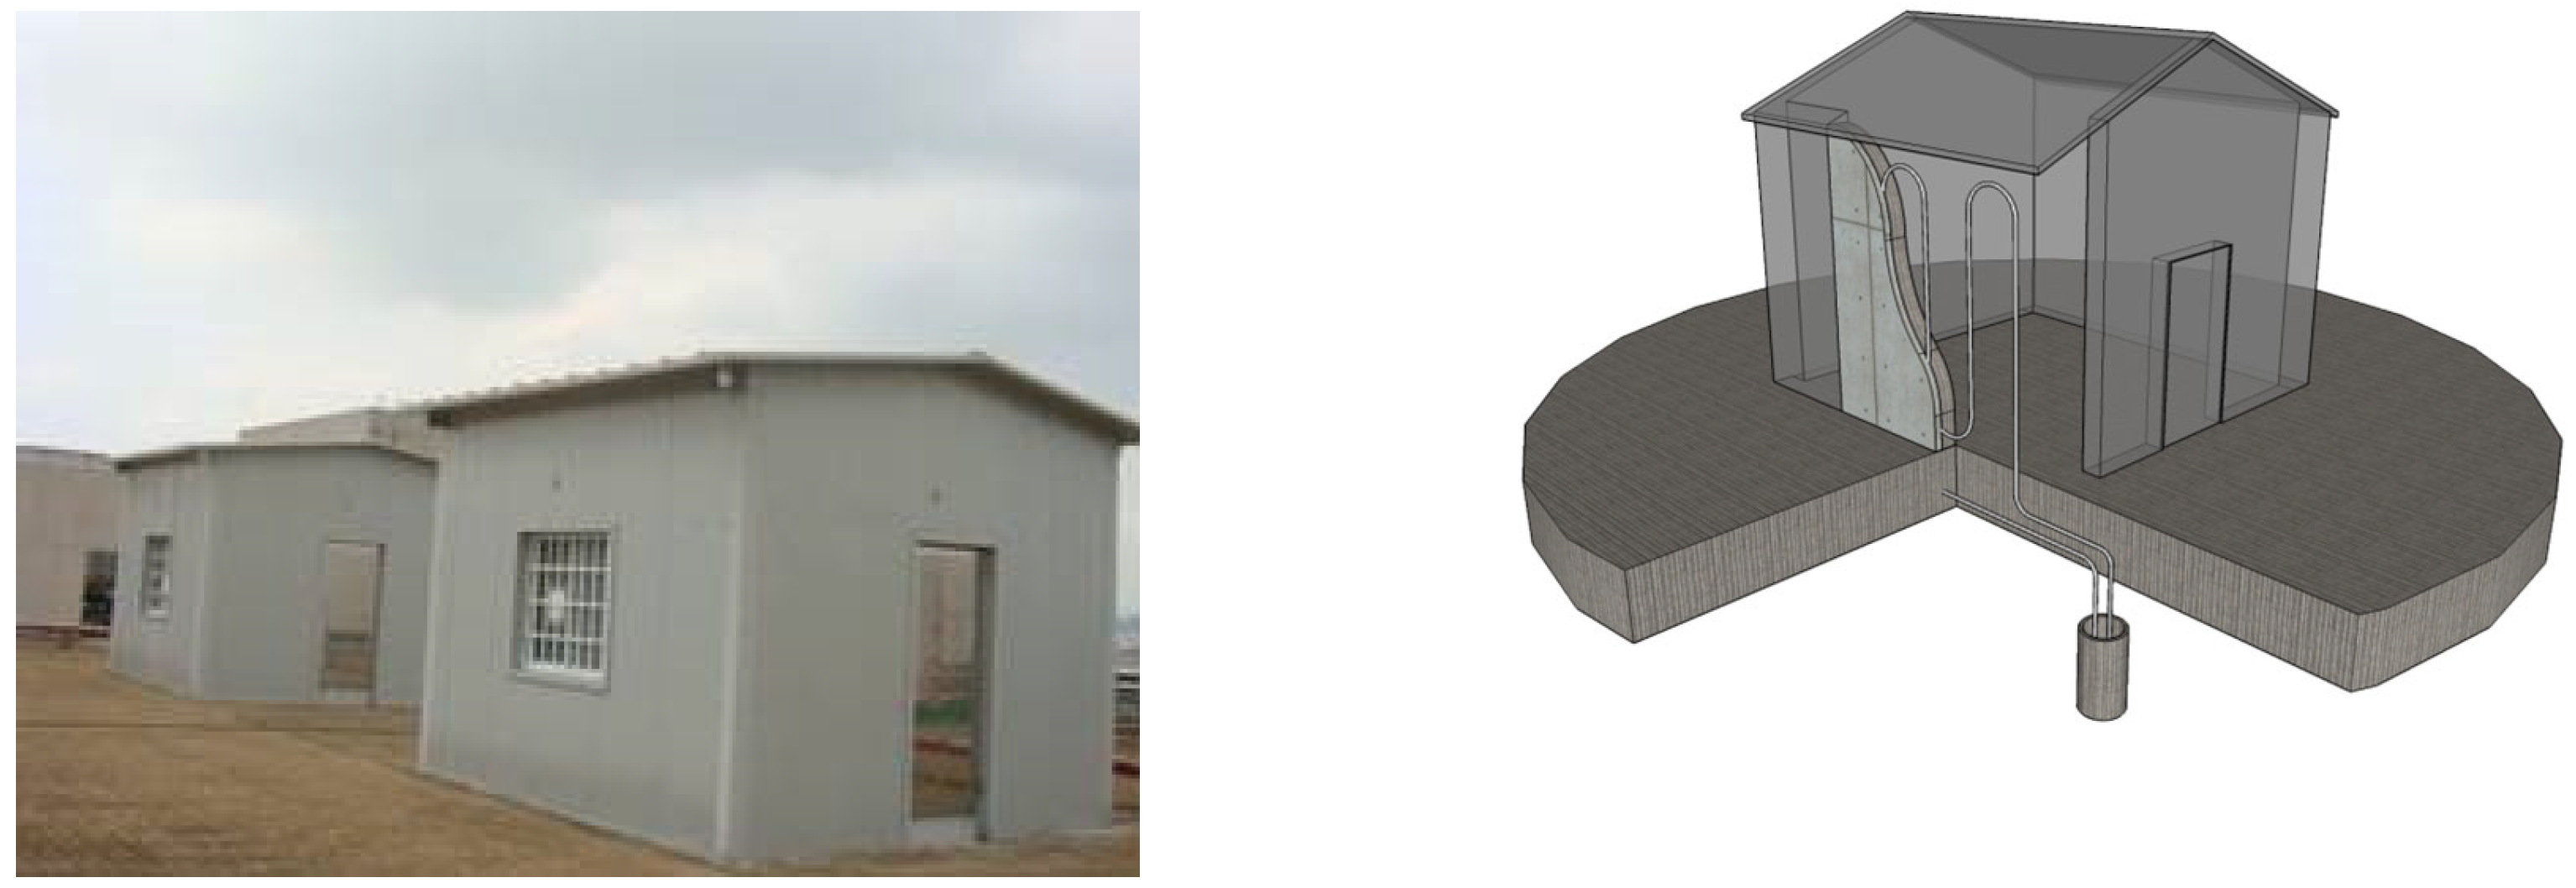
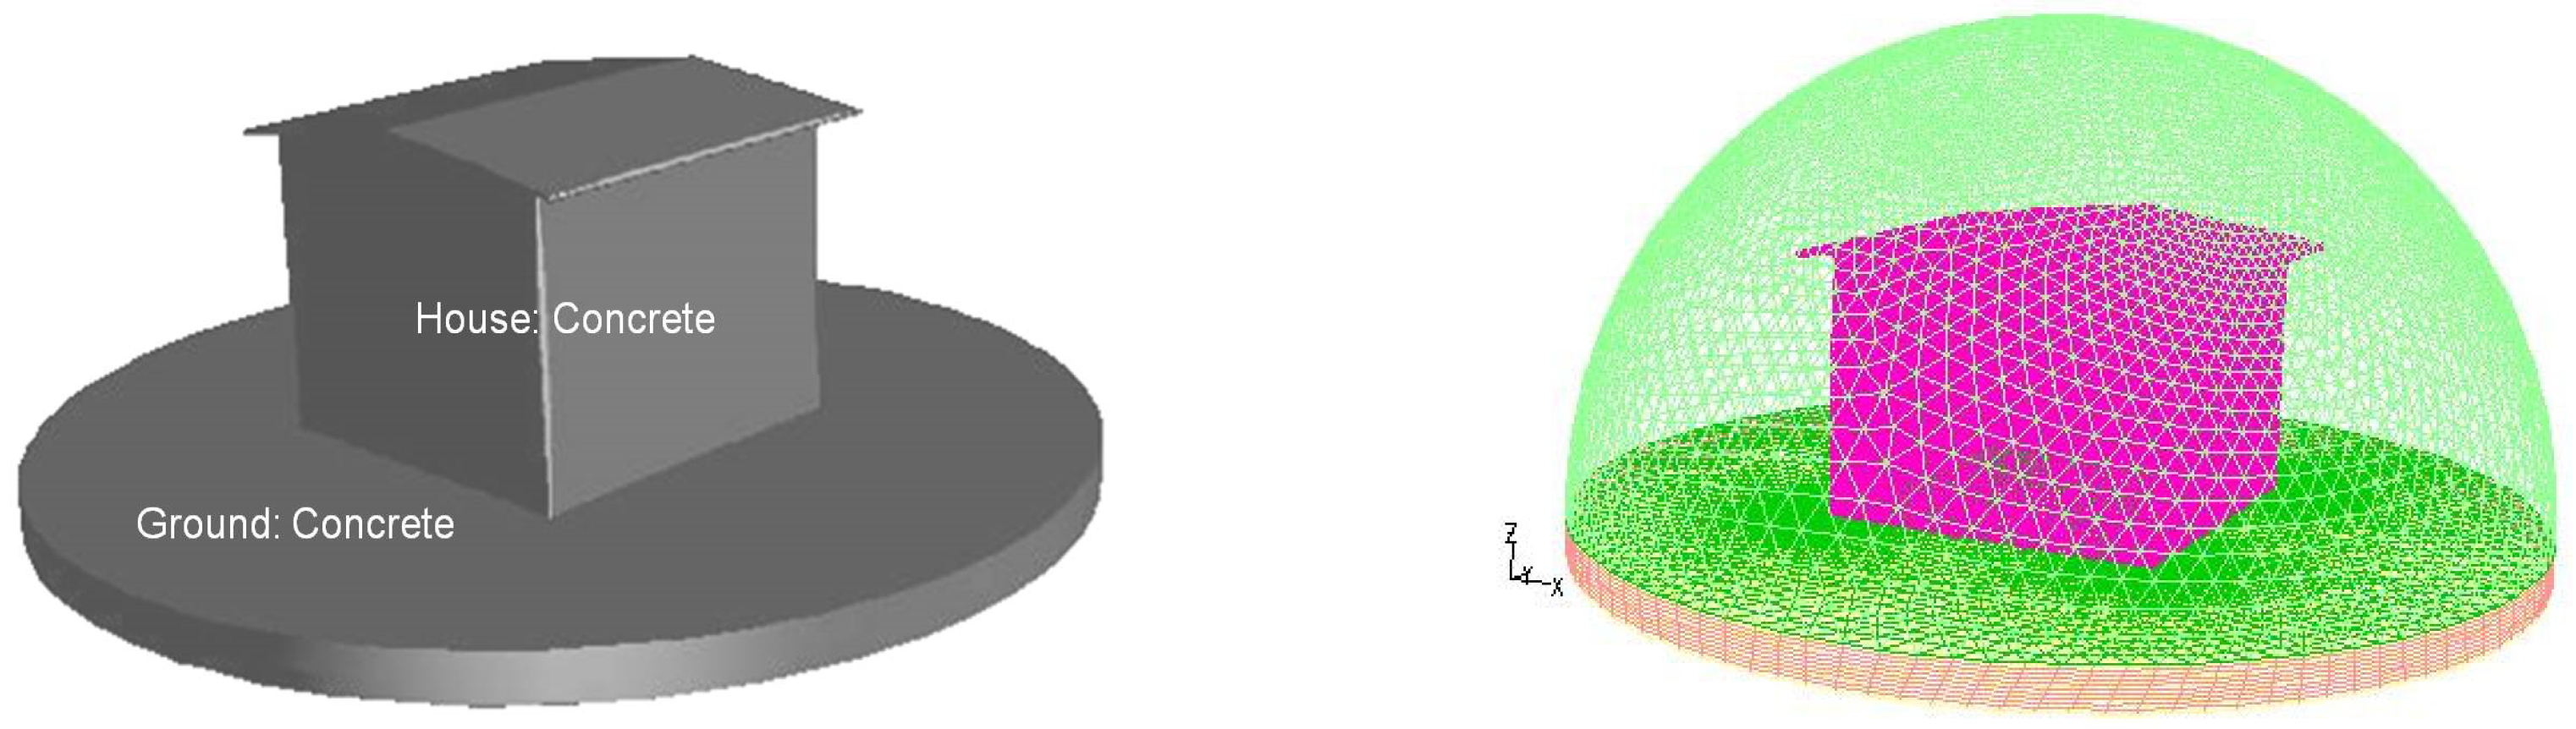
Figure 1.
The experimental houses and reference point.
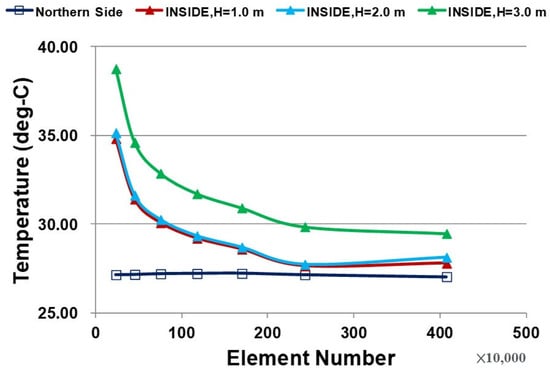
Figure 2.
The grid test uses different cell numbers.

Figure 3.
The building grid construction.
To analyze changes in groundwater temperature, temperature sensors were installed every 10 m below the aquifer in the groundwater wells at the site. These sensors continuously monitored water temperature variations. On-site pumping tests and slug tests were conducted to measure groundwater flow rates. According to the pilot test, the annual mean groundwater temperature ranged from 19 to 21 °C.
The thermal insulating material used in this simulation study is phenolic resin, chosen for its high environmental friendliness, cost-effectiveness, low toxicity, and excellent thermal insulation properties. Based on pilot tests, the density of the phenolic material is 1.071 kg/m3, and its thermal conductivity is 0.035 W/m·K. Phenolic resin offers outstanding thermal insulation and its expanded form is easy to mold. The combination of wallboard and phenolic resin can effectively prevent heat transfer. However, care must be taken to manage the material’s moisture exposure to avoid shortening its service life. The parameters required for the simulation are shown in Table 1.

Table 1.
Environmental and material parameters.
2.1. Energy Equation for Multiphysics CFD Modeling
Office staff. The underlying equations for this multiphysics CFD modeling are the energy equations, which are shown in Equations (1)–(3). These energy equations take into account the effects of convection in fluids, conduction in solids, solar radiation, and external heat gains.
T: Temperature; ρ: Density; Cp: Specific Heat; q: Heat source (mean solar radiation); R: Gas constant; MW: molecular weight of gas.
Where is the pressure force; is the gravity force; is the shearing force; is the conduction dissipation; is the Viscous dissipation; and is the Heat generation.
2.2. Operative Temperature in Thermal Climate Analysis
While air temperature is the most commonly used parameter to define the thermal climate, it should not be the only one. In this paper, the operative temperature (Equation (4)) is calculated, which includes the ambient air temperature (Ta), air velocity (v), and the mean radiant temperature (Equation (5)), the latter being a function of the radiation intensity from each surface (Daniel and Mikael, 2016 [22]).
M.R.T: Means radiation temperature (Ta); Ta: Ambient air temperature (°C); Top: Operative temperature (°C); v: Velocity (m/s); σ: Stefan Boltzmann constant (kg/(s3 K4)); Irad: radiation intensity (W/(m2 sr)).
3. Results and Discussion
3.1. Thermal Environmental Impact of Buildings with Concrete Walls in Full Sunlight
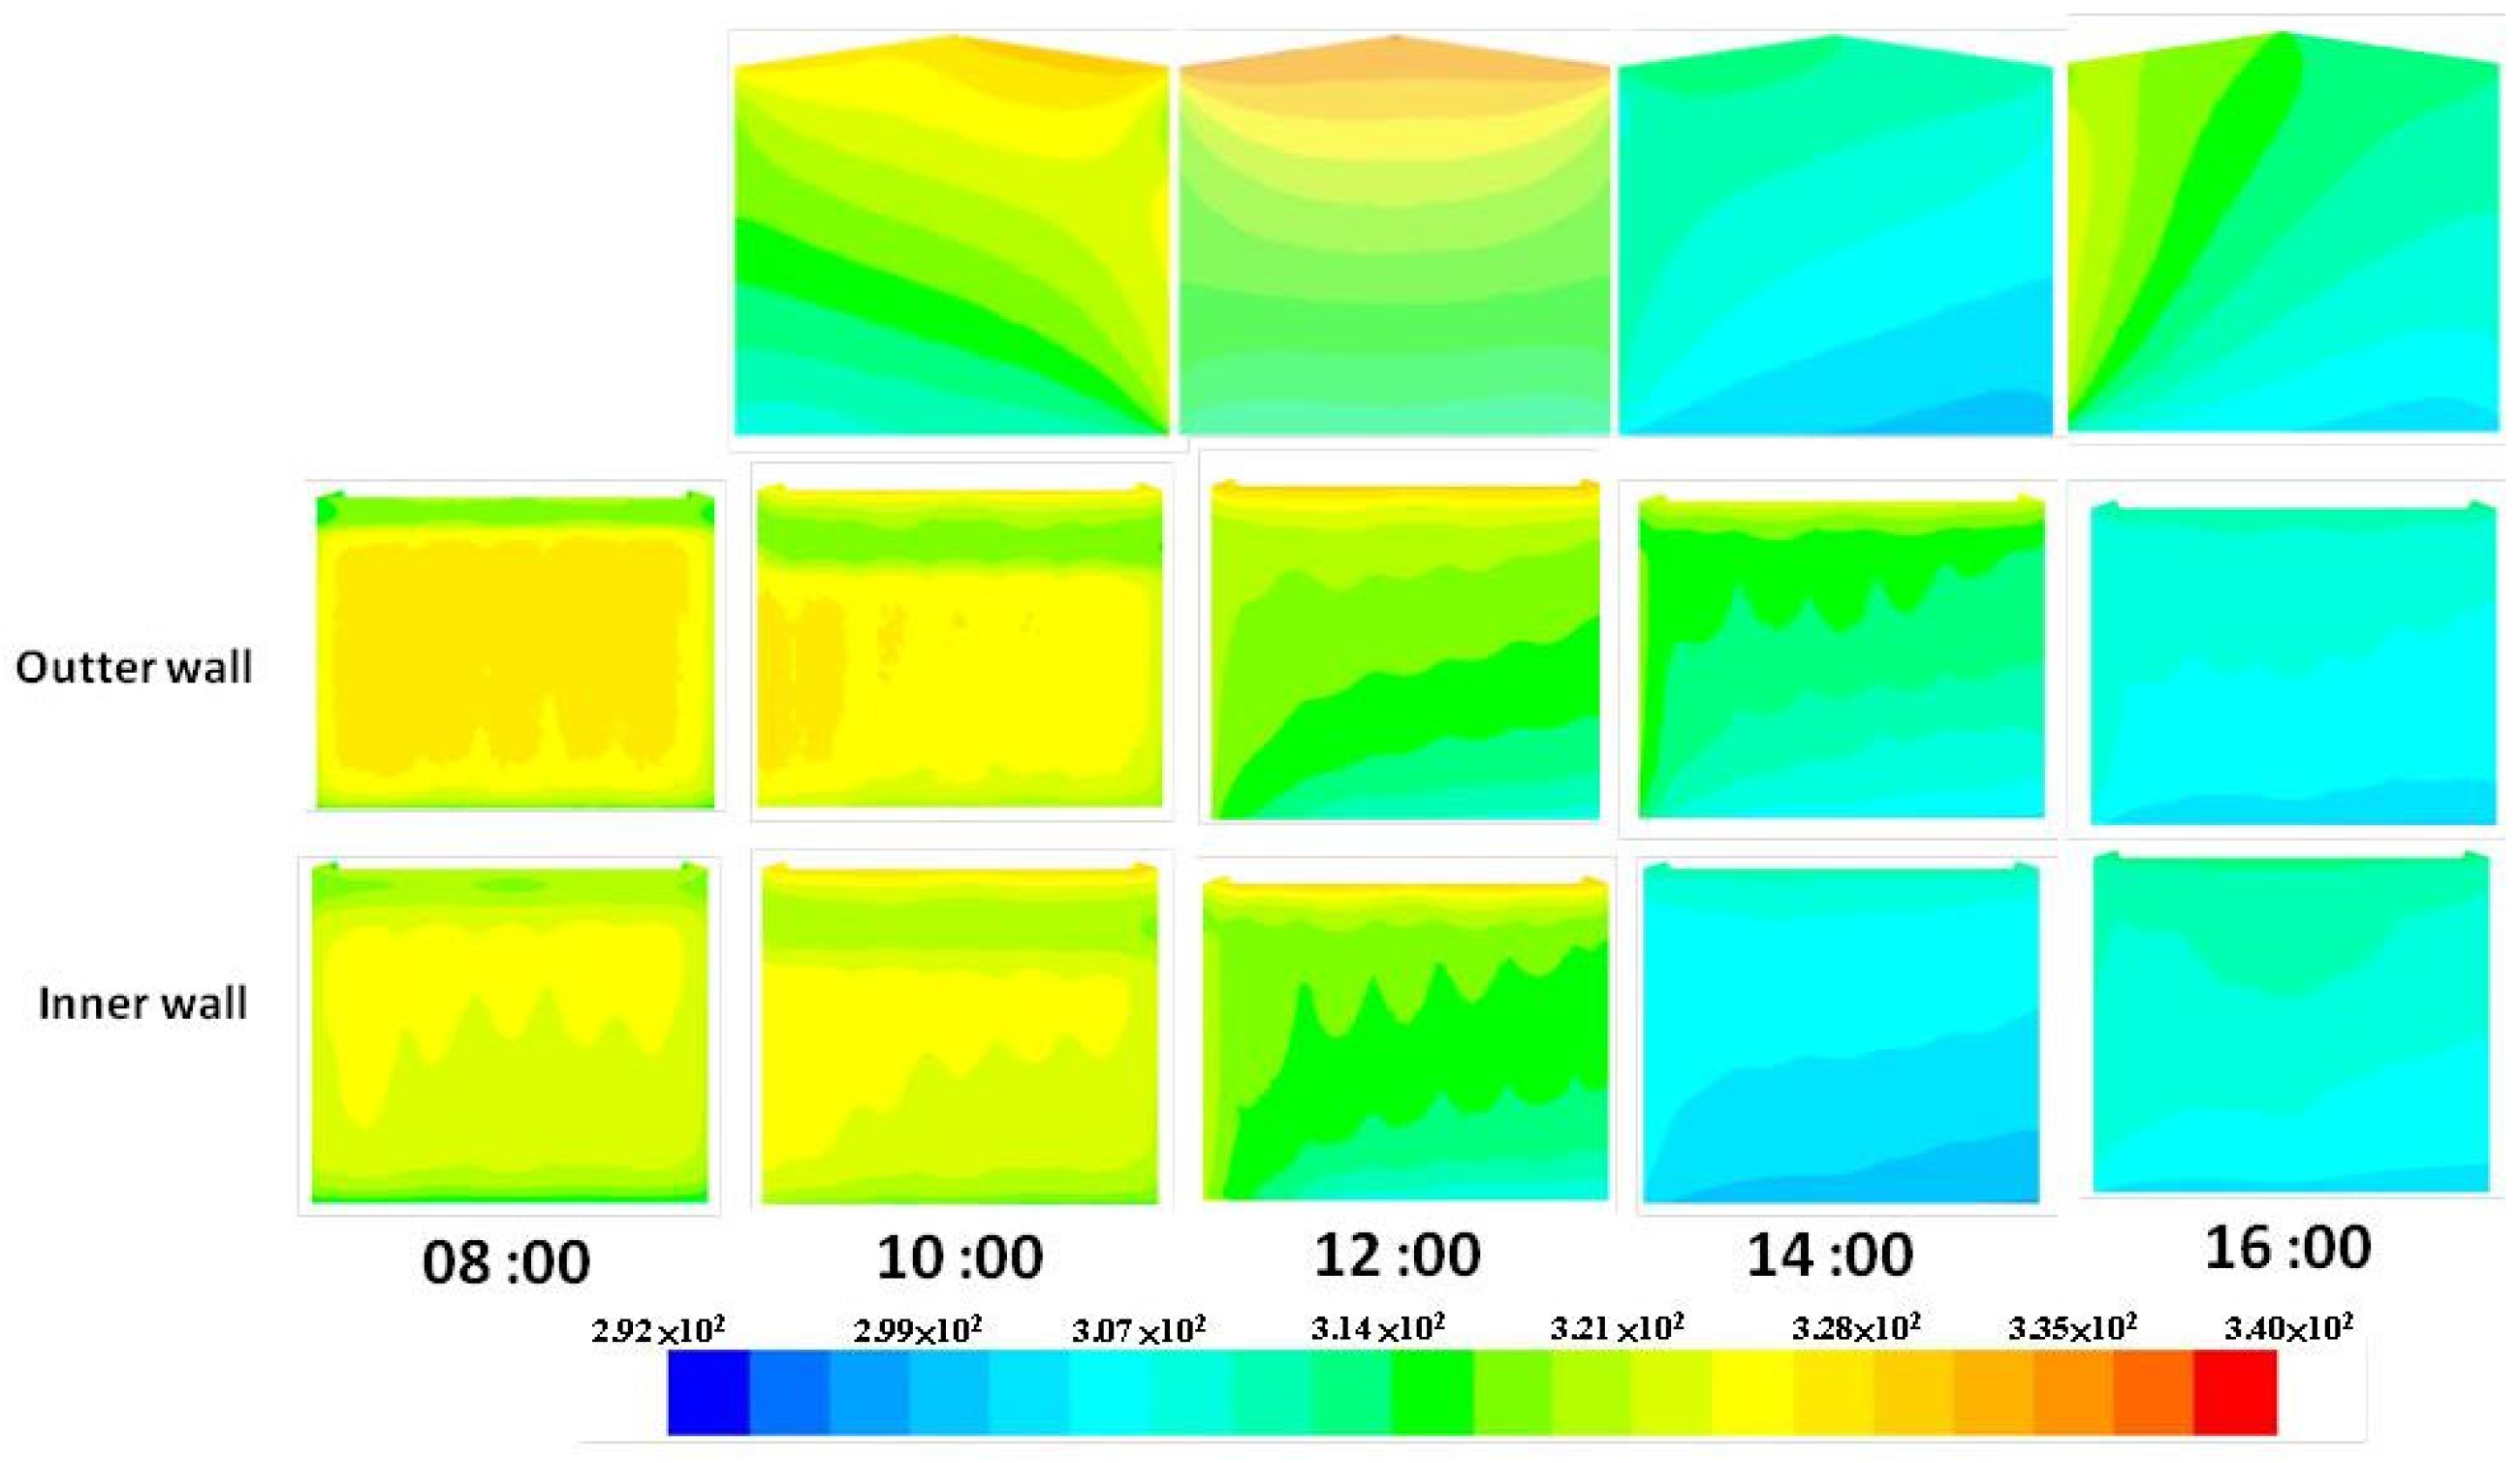
In the initial scenario, the building walls were constructed with 15 cm thick concrete. Figure 4 illustrates the temperature distribution of these walls under full sunlight conditions. Data were collected and analyzed at five different time points throughout the day: 8:00, 10:00, 12:00, 14:00, and 16:00. The primary heat sources impacting the interior space were identified as the east wall in the morning, the roof at midday, and the west wall in the afternoon.
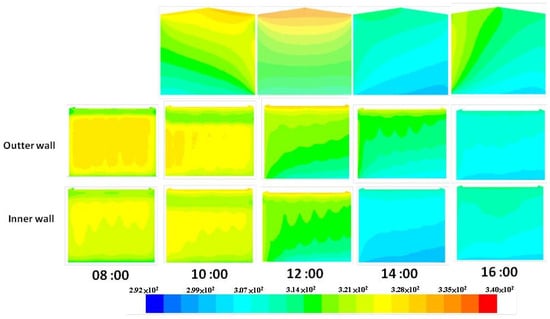
Figure 4.
The building grid construction. The cross-section temperature of the buildings in the original conditions and the temperature of the interior and exterior walls.
According to the simulation results, the temperature of the east wall began to rise at 8:00 a.m., reaching a peak of approximately 50 °C by 10:00 a.m. This heat was then transferred from the exterior walls into the interior space. The temperature of the east wall decreased from 50 °C to 42 °C by noon, further declining to 40 °C in the afternoon, and finally reaching its lowest level of 32 °C at 4:00 p.m.
Conversely, the west wall exhibited its lowest temperatures (34 °C to 35 °C) at 8:00 a.m., as shown in Figure 5. The temperature increased to 42 °C at noon and peaked at around 50 °C by 2:00 p.m. After reaching this peak, the temperature gradually declined to 48 °C by 4:00 p.m.
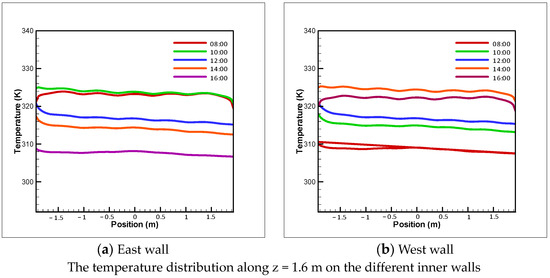
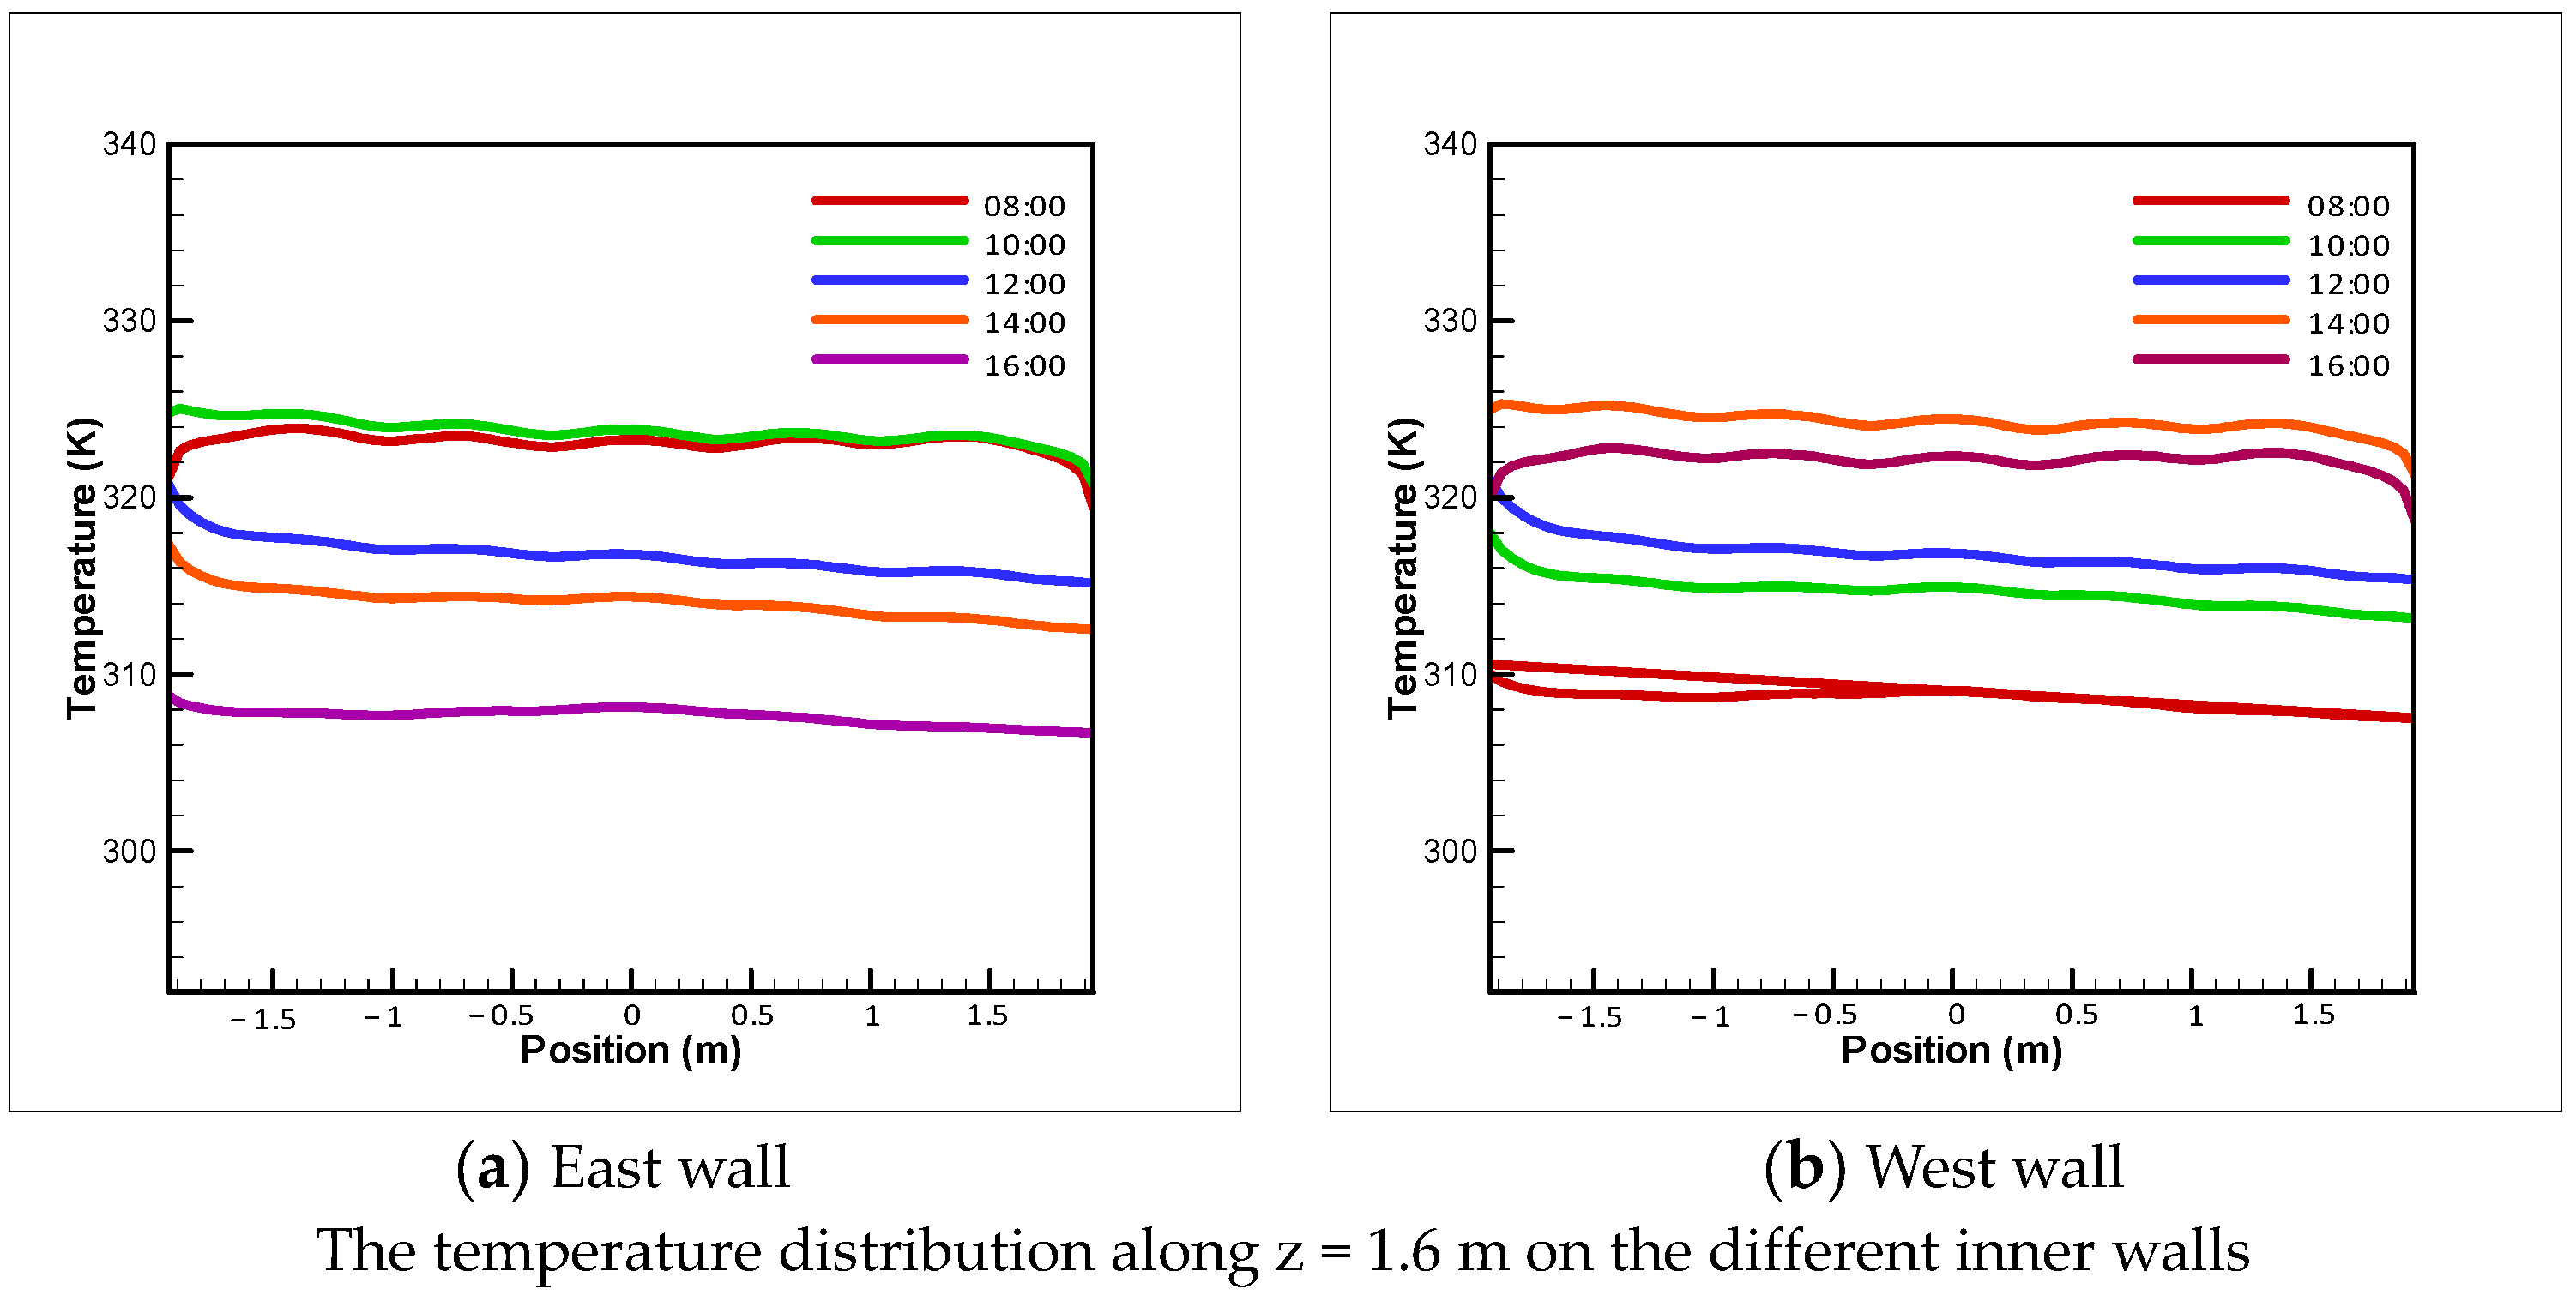
Figure 5.
The curve of temperature on the inner wall of east and west walls.
3.2. Implementation of an Underground Water Cooling System in the Walls
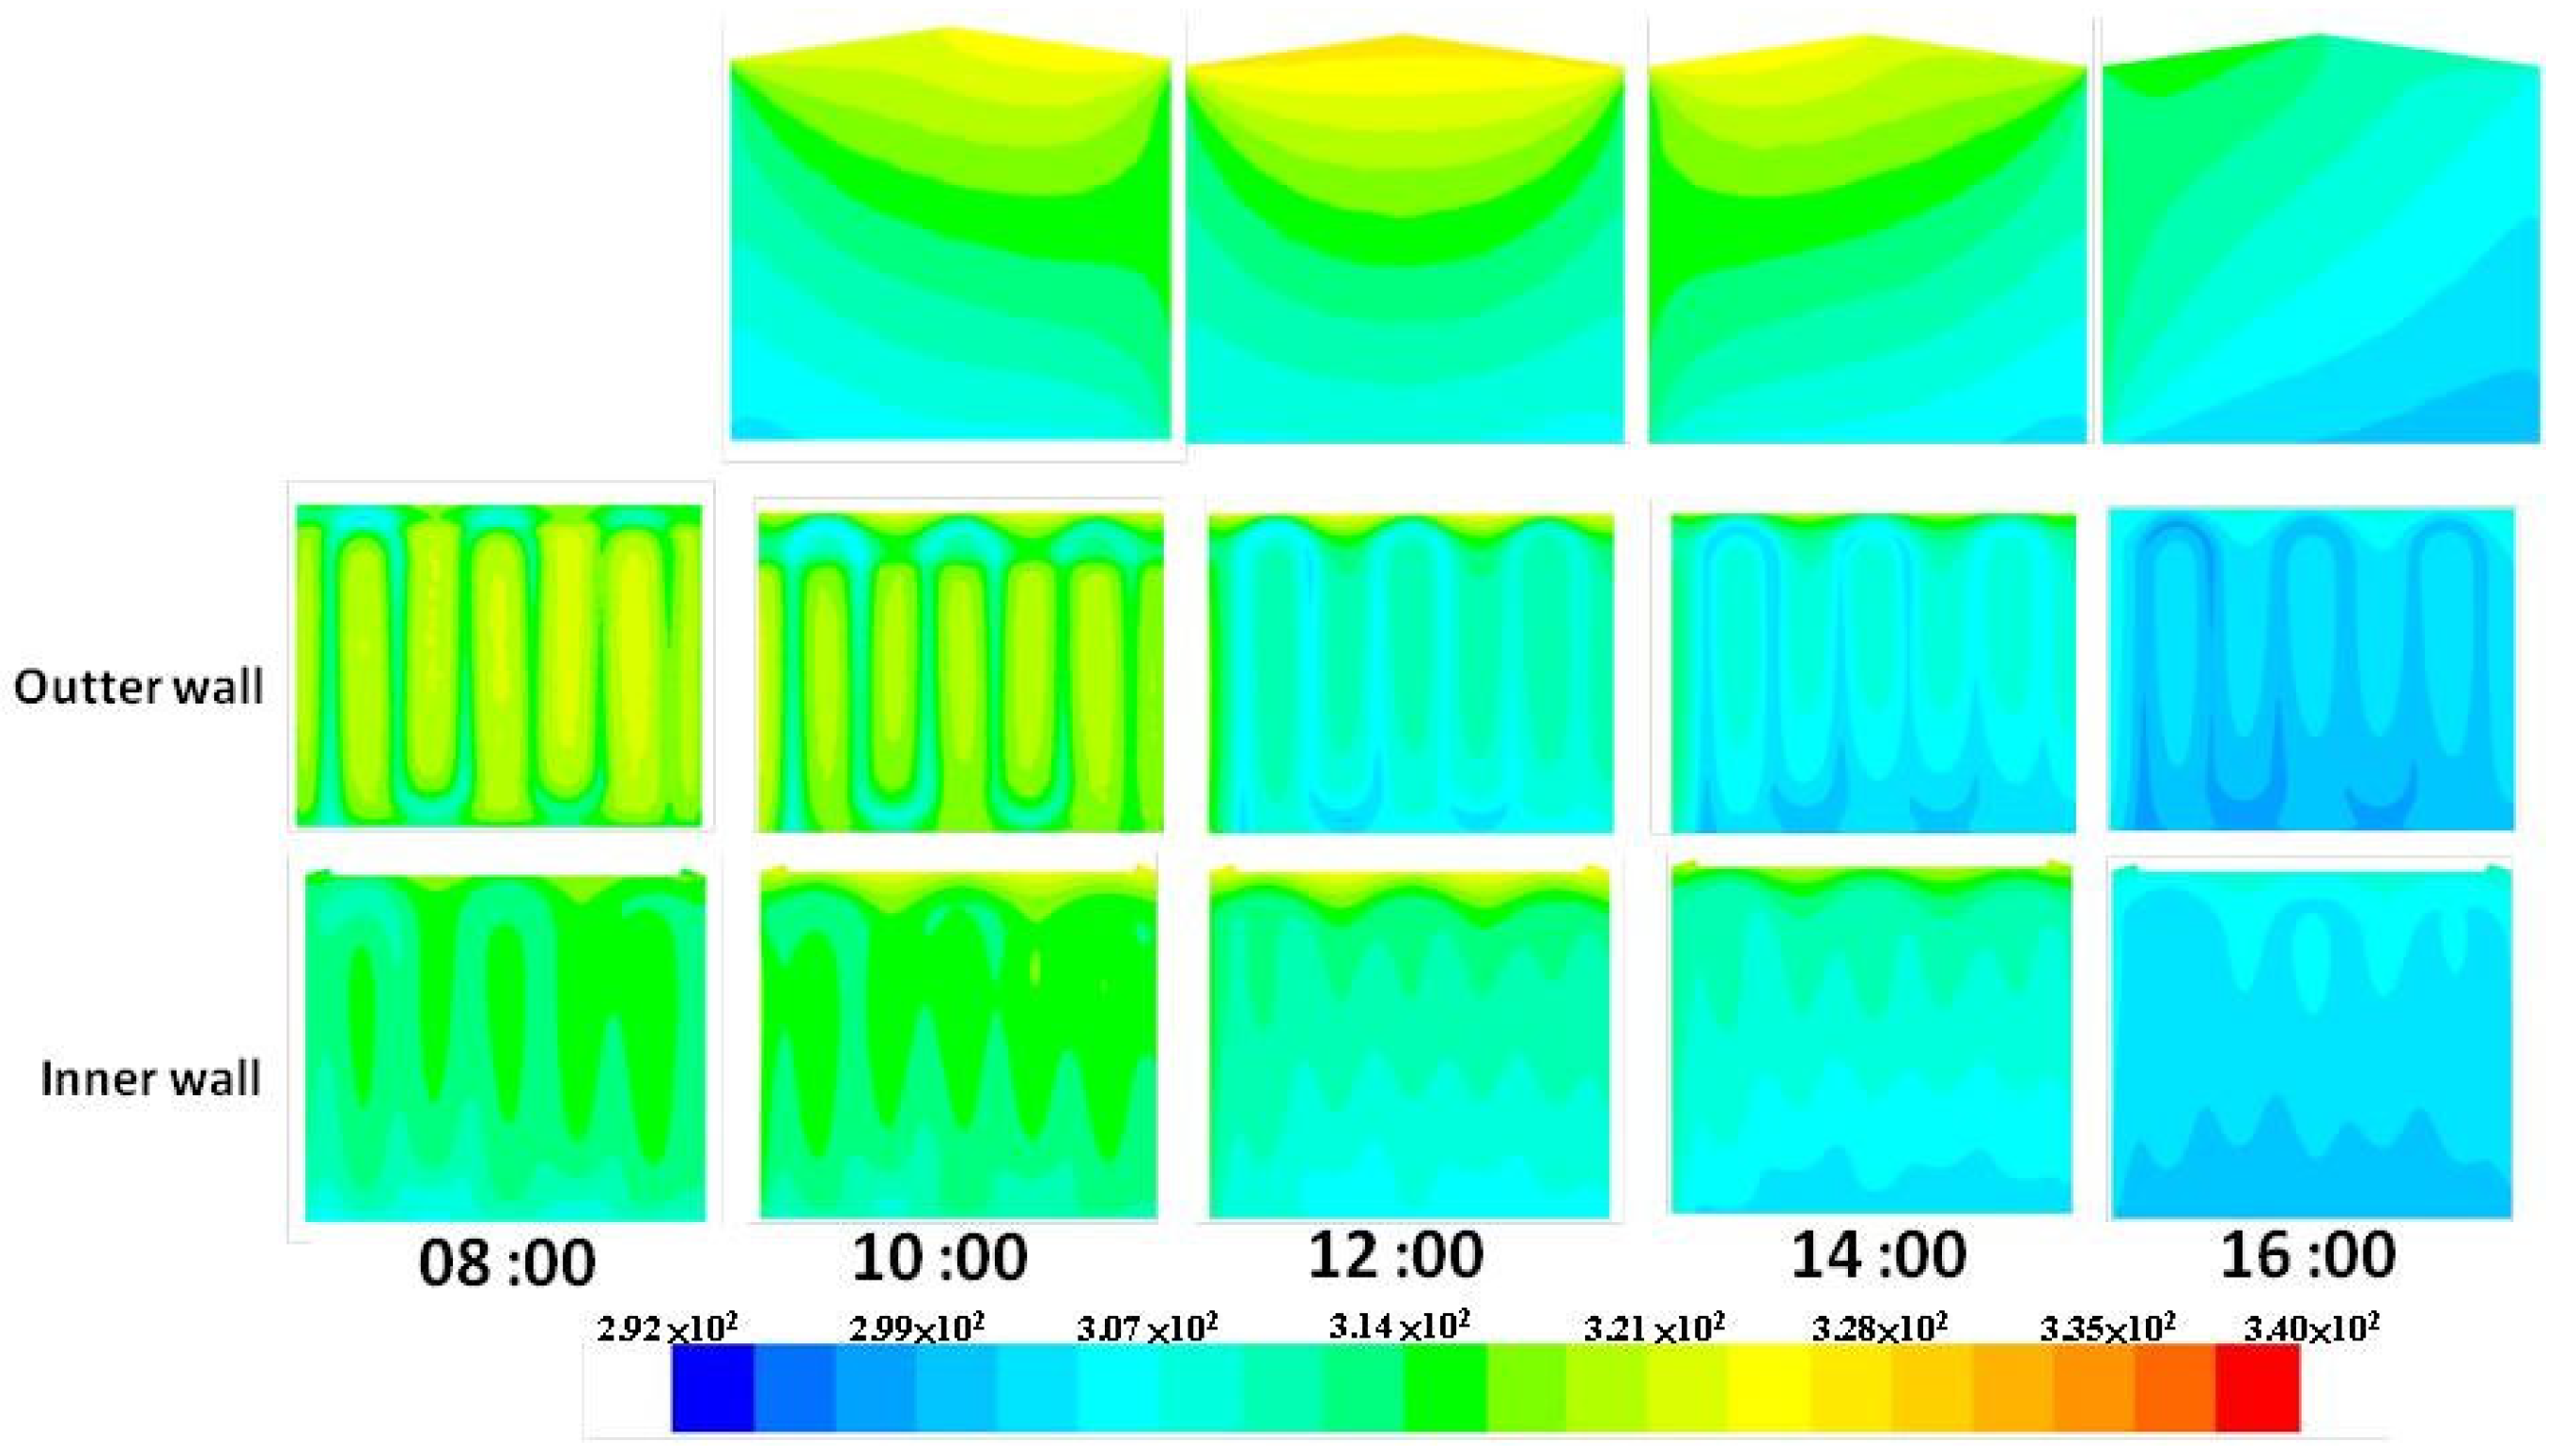
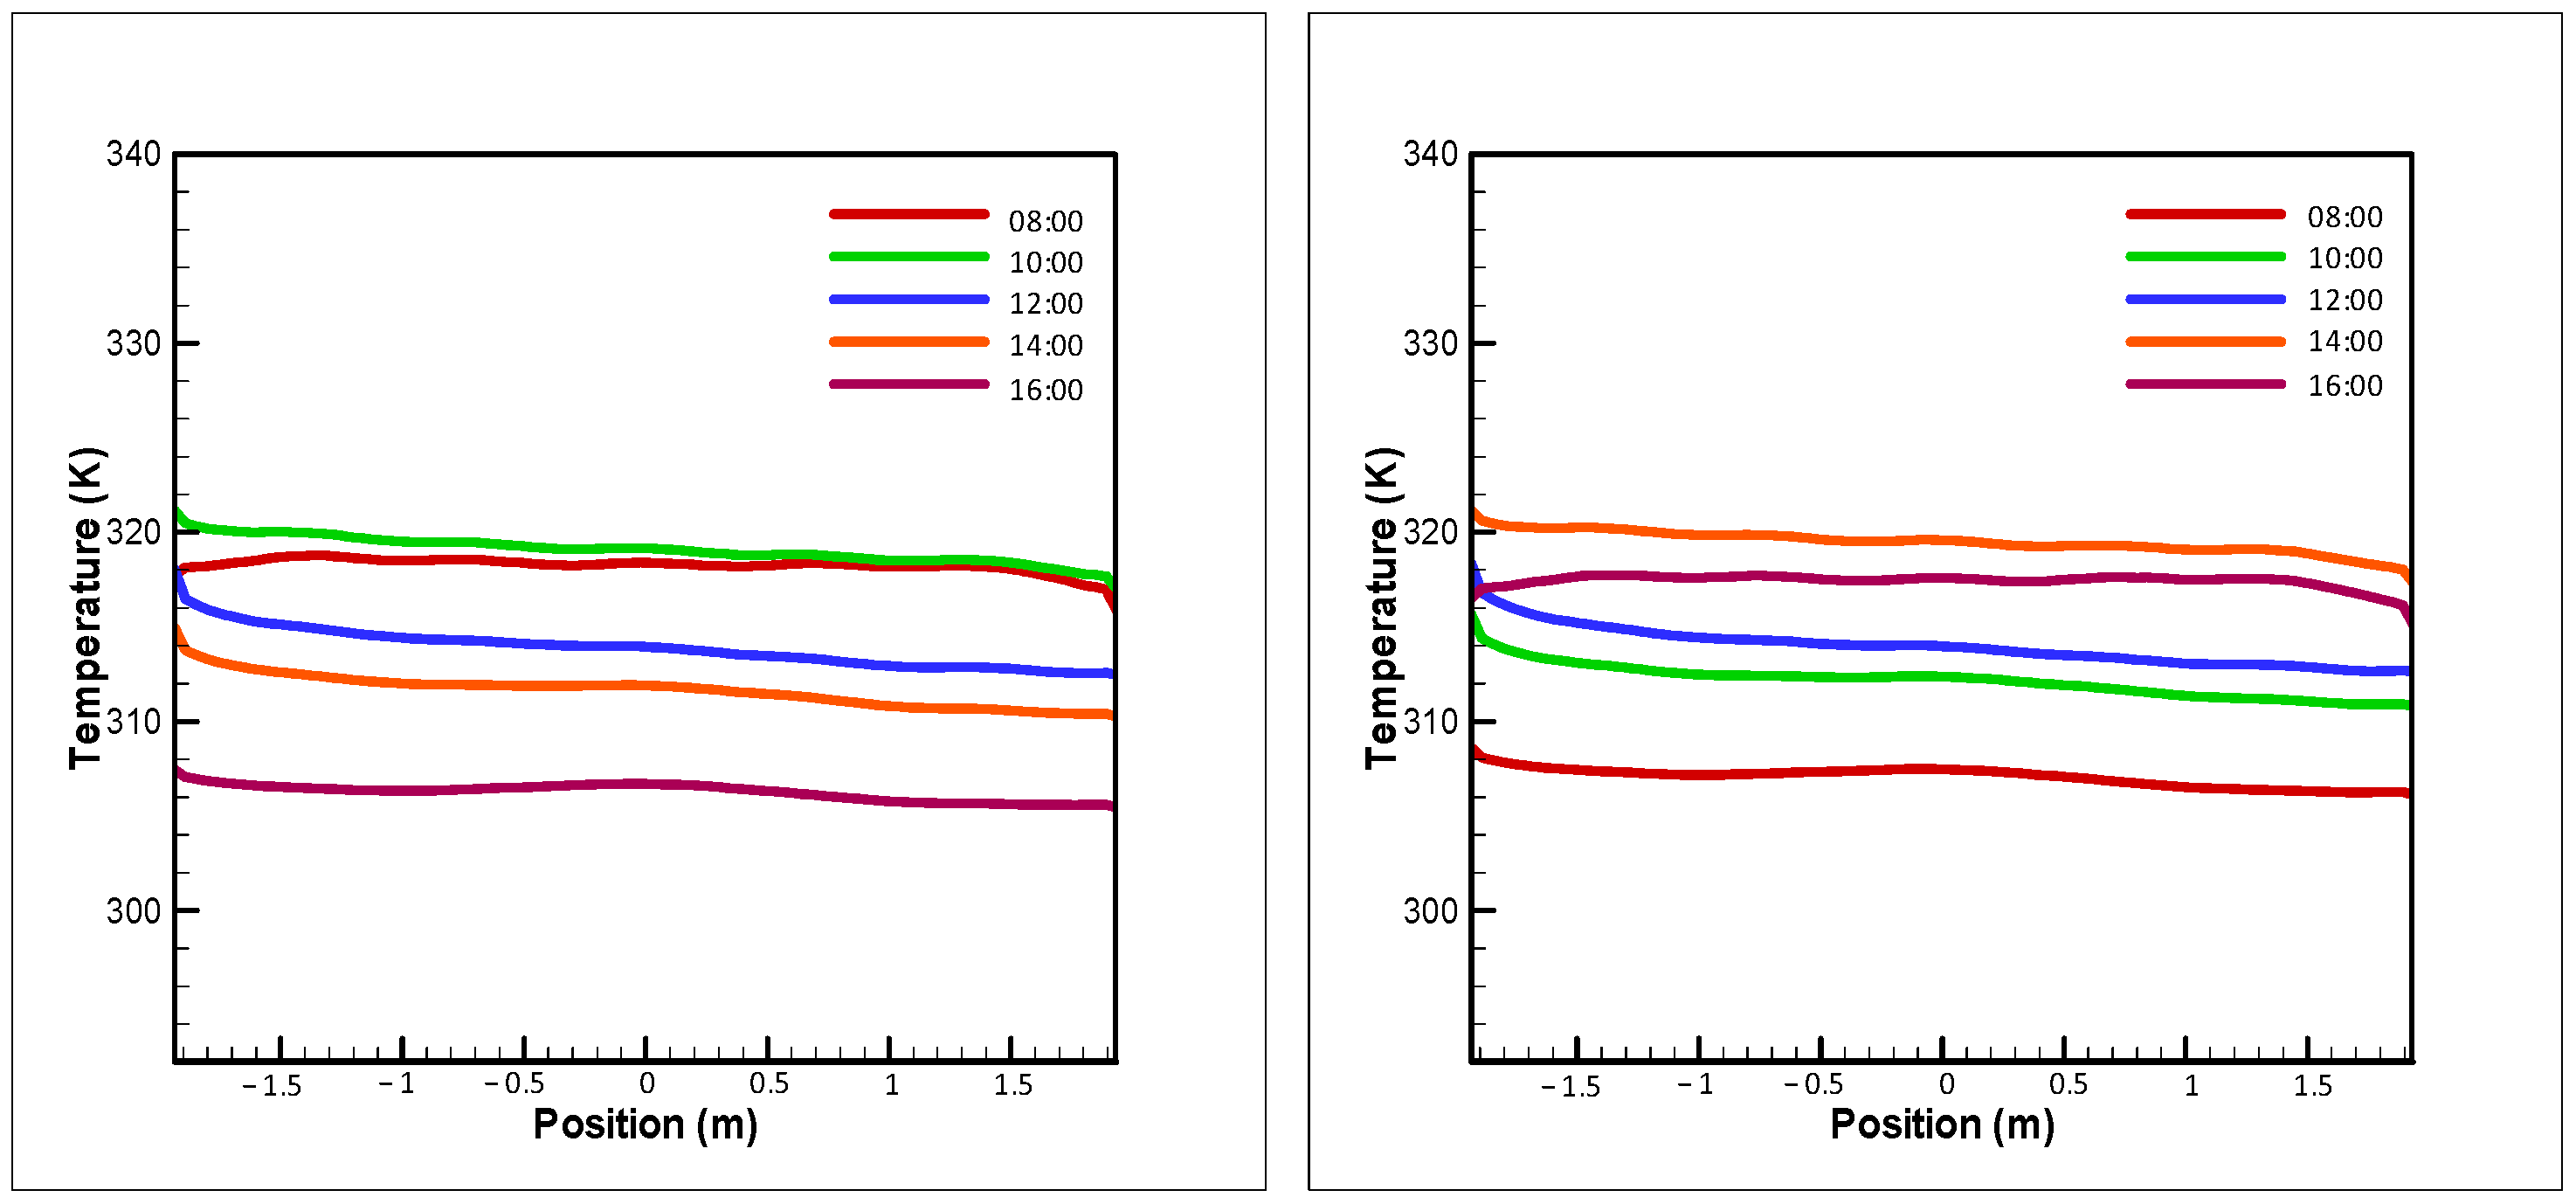
After integrating cooling pipelines into the 15 cm thick concrete walls, as depicted in Figure 6, the primary source of interior heat shifted from the east and west walls to the roof at midday. According to the simulation results, the temperature of the interior walls remained steady at around 40 °C from 8:00 a.m. to 10:00 a.m. Compared to the control group discussed in Section 3.1, the east wall with the cooling system exhibited a 10 °C lower temperature than the wall without the cooling system. The east wall’s lowest recorded temperature was approximately 30 °C at 4:00 p.m. Figure 6 illustrates a significant temperature difference between the interior and exterior walls, suggesting that the cooling pipelines effectively dissipated heat and mitigated thermal effects. Despite this, a minimal amount of heat still transferred through the walls into the interior space, as observed in the analysis results from 8:00 a.m. to 10:00 a.m.

Figure 6.
The temperature of the cross-section of the cooling system and the temperature of the Interior and exterior walls on the east side.
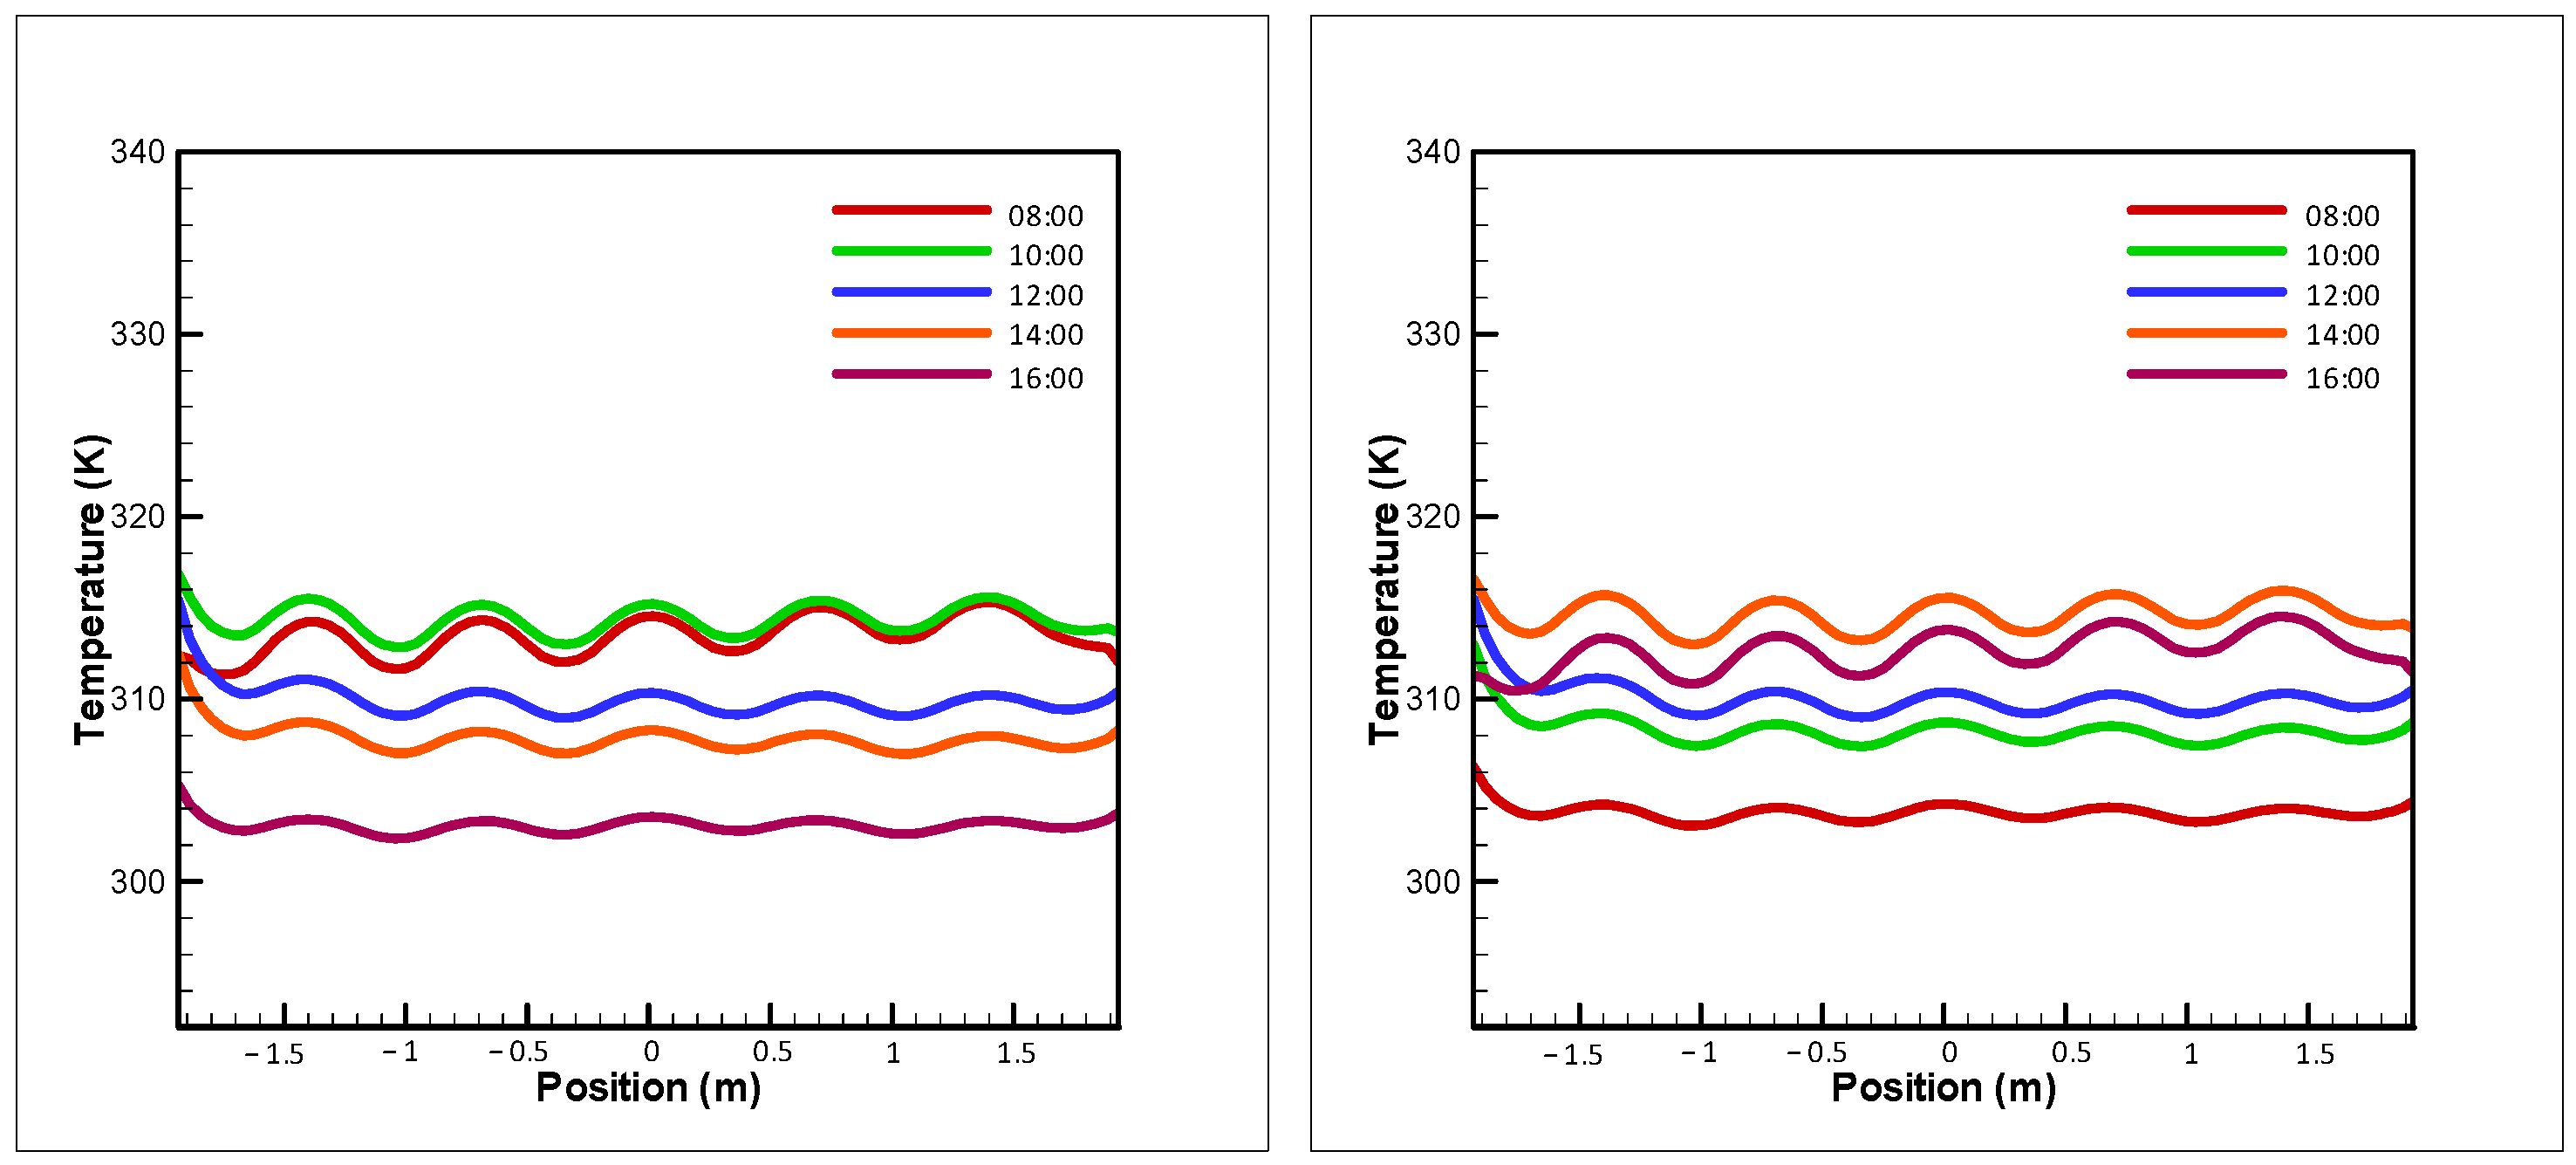
For the west wall, the highest temperature recorded was 42 °C at 2:00 p.m., indicating an 8 °C reduction compared to the wall without the cooling system. These results highlight the effectiveness of the cooling system in providing both cooling and heat insulation. Analysis of the temperatures of the interior and exterior walls on the east and west sides revealed significant temperature differences between the exterior walls equipped with the cooling system and the areas surrounding the pipelines. The temperature of the east wall ranged from 38 °C to 46 °C from 8:00 a.m. to 10:00 a.m., while the west wall exhibited the same range from 2:00 p.m. to 4:00 p.m. (Figure 7 and Figure 8). The largest temperature difference between the interior and exterior walls was between 4 °C and 5 °C.
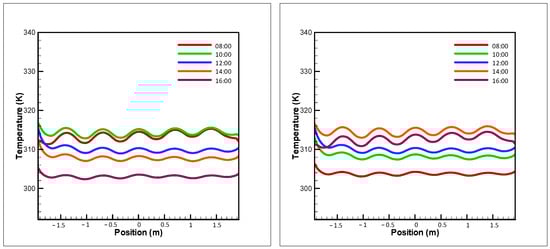
Figure 7.
Temperature curves of the inner walls during the cooling pipeline test.
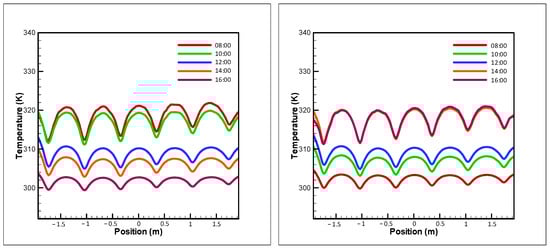
Figure 8.
Temperature curves of the outside walls during the cooling pipeline test.
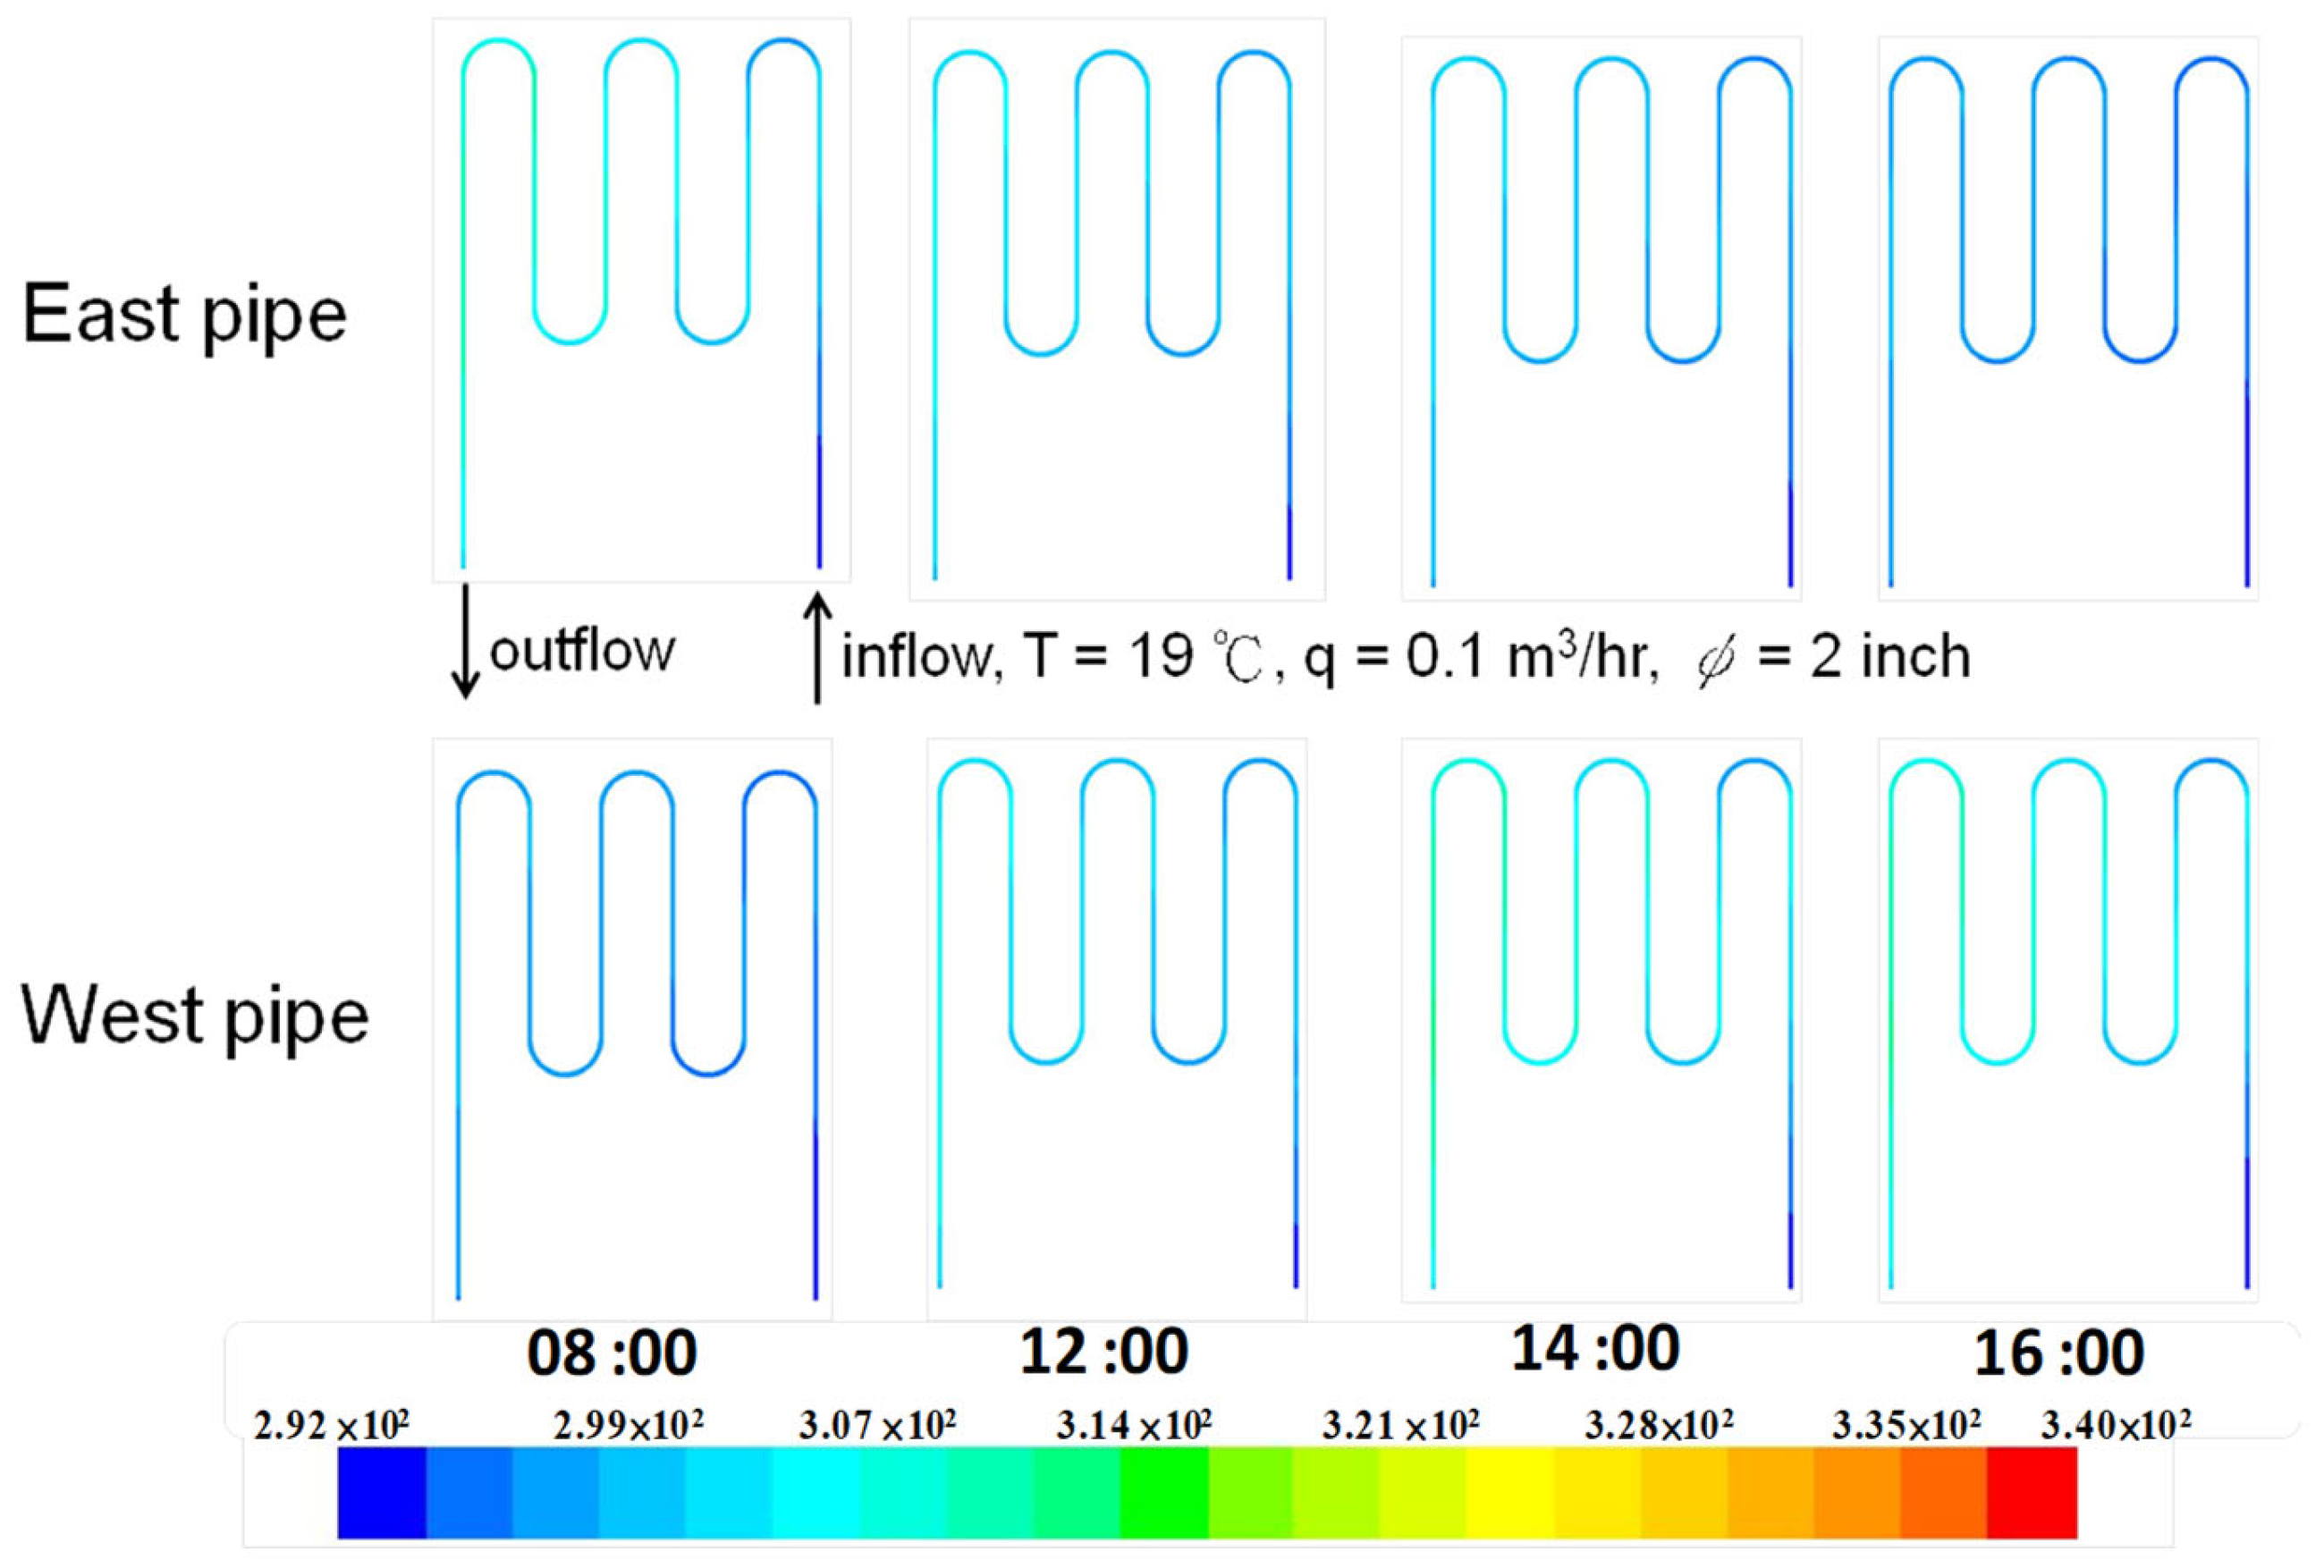
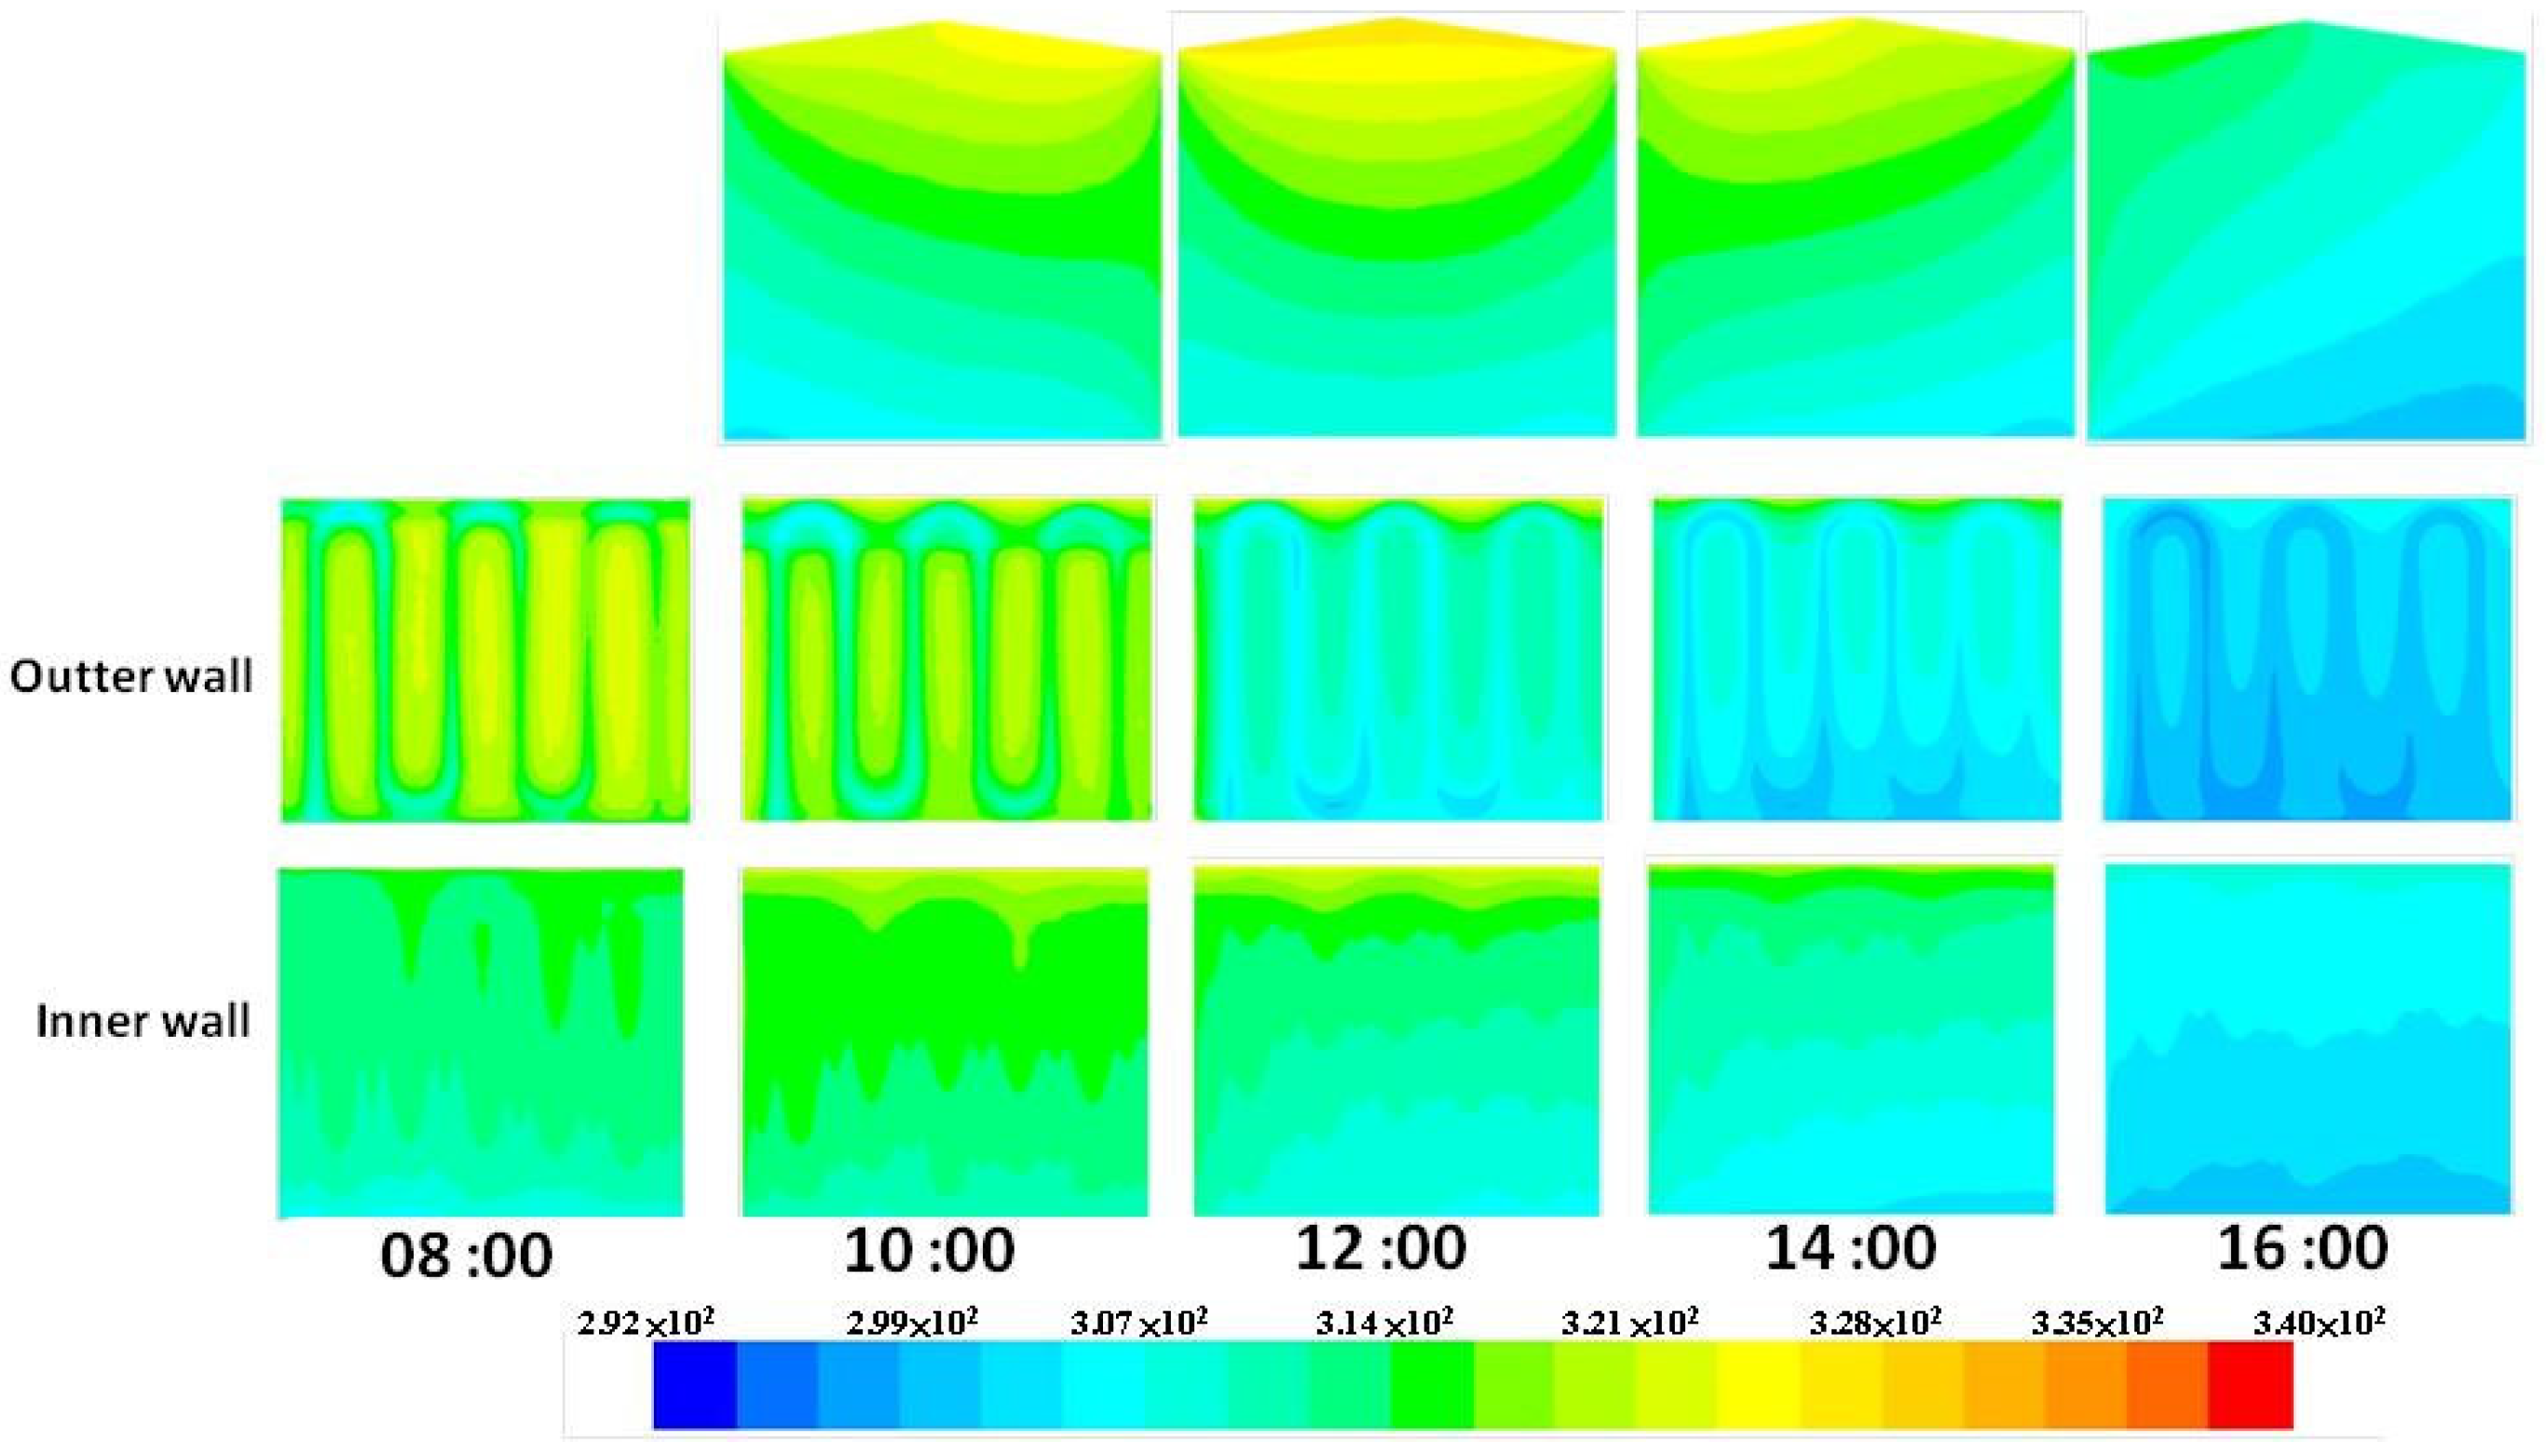
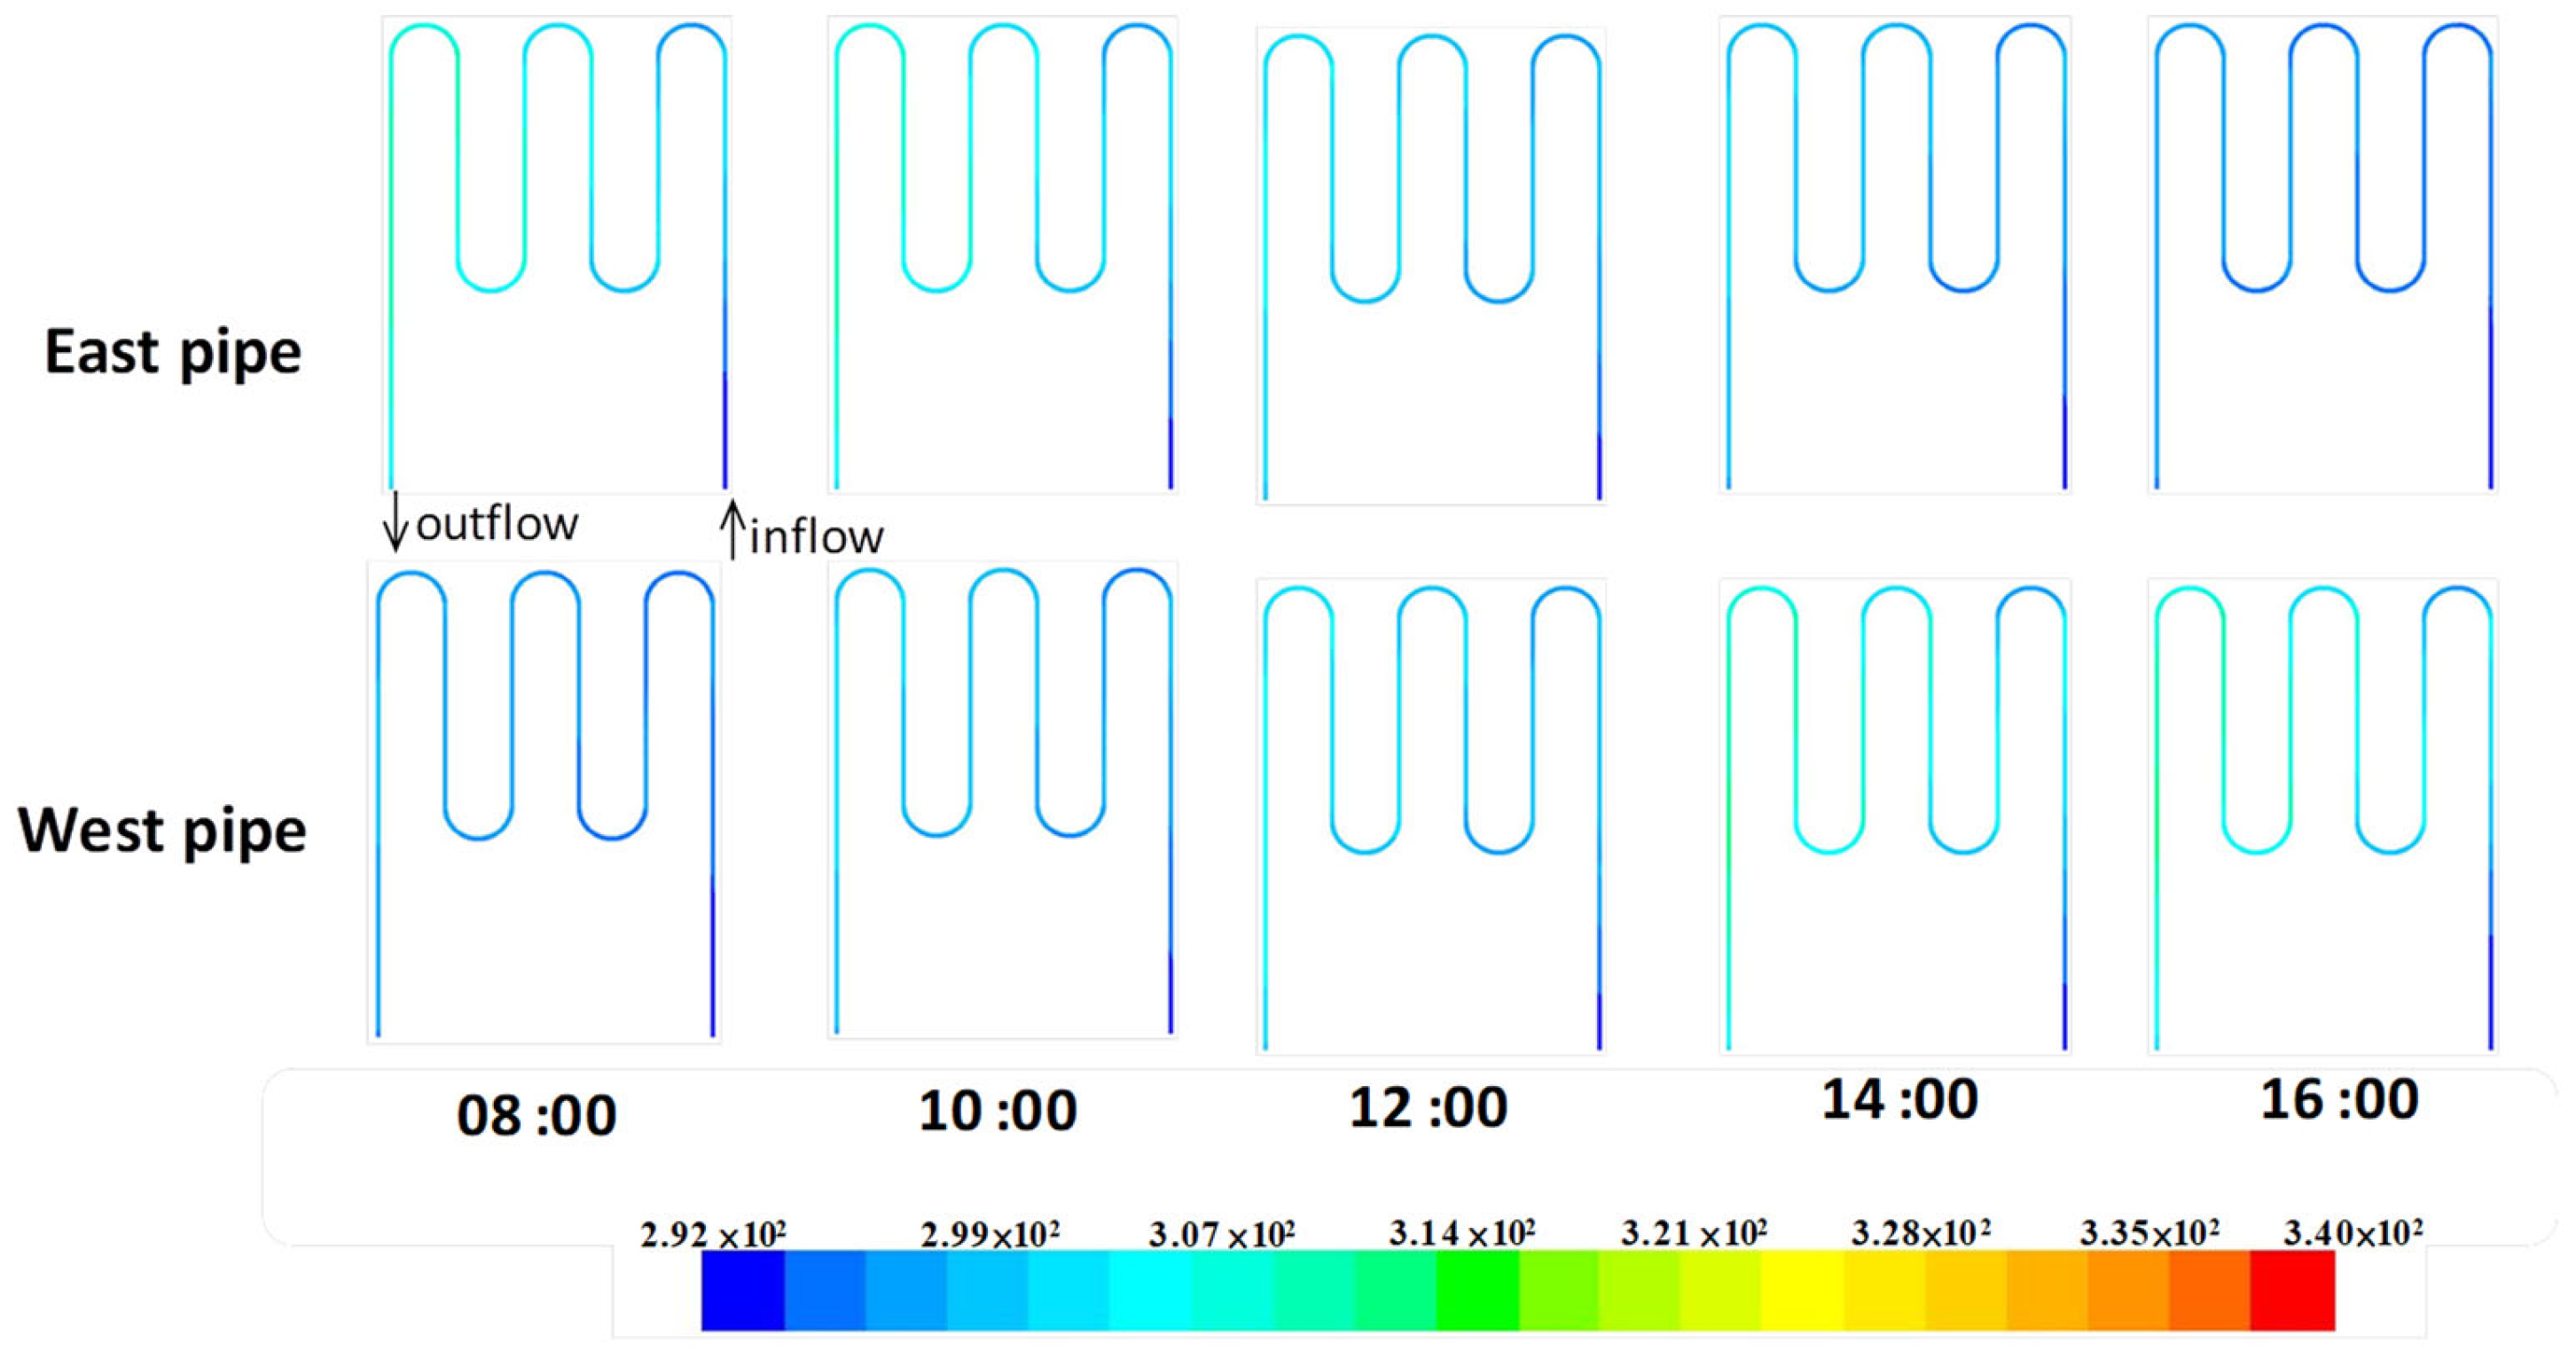
Further analysis of the cooling pipelines within the walls, as shown in Figure 9, indicated that water entered the east wall at 19 °C between 8:00 a.m. and 10:00 a.m. and exited at temperatures ranging from 35 °C to 37 °C. Similarly, water exited the west wall at temperatures between 34 °C and 37 °C from 2:00 p.m. to 4:00 p.m. Figure 10 highlights the periods of the greatest temperature difference in the water: 8:00 a.m. to 10:00 a.m. for the east wall and 2:00 p.m. to 4:00 p.m. for the west wall. These findings demonstrate that both the east and west walls were significantly impacted by temperature increases and that the cooling system effectively removed some of the heat.

Figure 9.
Temperature variations of the cooling pipeline.
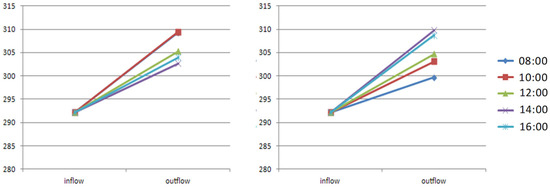
Figure 10.
The temperature variation of the groundwater cooling test between the inflow and outflow.
3.3. Wall with Phenolic Aldehyde Resin Layer
The wall, which is 15 cm thick, is enhanced with an additional 5 cm layer of phenolic aldehyde resin, as shown in Figure 11. Evaluations of the building’s transverse section indicate that the upper heat source has a more significant impact from 10 a.m. to 2 p.m. At 10 a.m., the main heat source affects the entire indoor space, primarily from the east rooftop, leading to higher temperatures on the east side of the building. By 2 p.m., the heat shifts to affect the west side. The highest temperatures are observed in the upper part of the building during these time intervals and at noon. This demonstrates that the phenolic aldehyde insulation layer added to the east and west walls effectively blocks external heat from entering the room during periods of sun exposure.
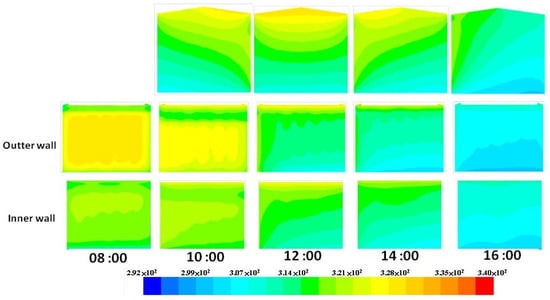
Figure 11.
The temperature of the cross-section of the wall with phenolic layer and the temperature of the Interior and exterior walls on the east side.
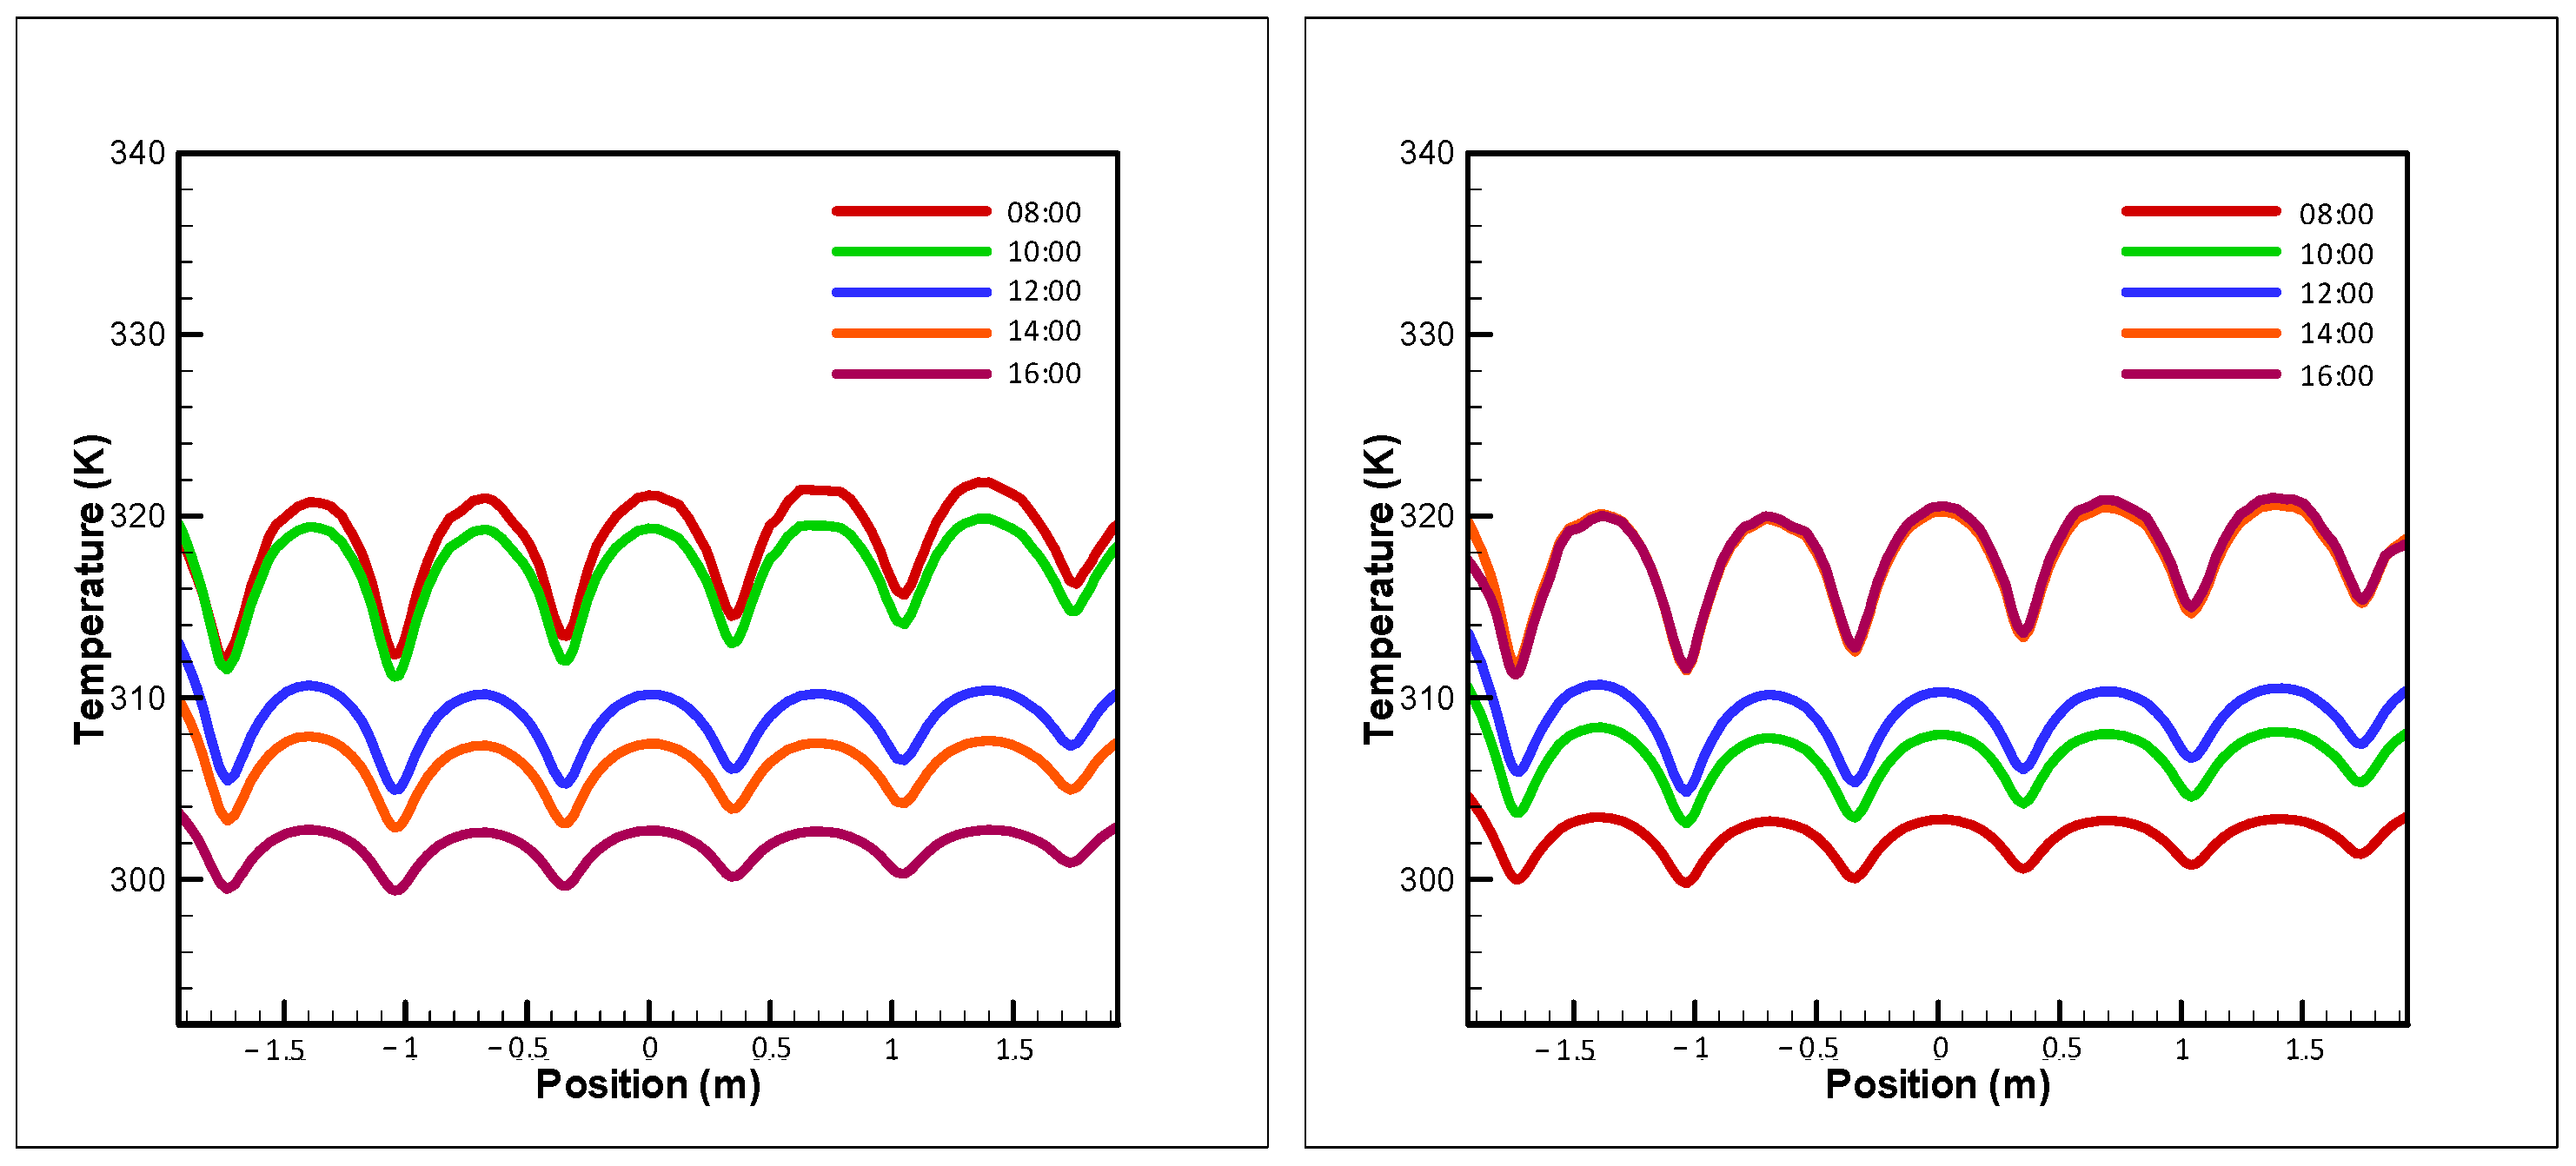
Simulation results indicate that the inner wall temperature of the east wall remains between 41 °C and 42 °C from 8 a.m. to 10 a.m. Meanwhile, the outer wall, exposed to direct sunlight, rises to approximately 50 °C. Compared to the scenario without the phenolic aldehyde insulation layer, as discussed in Section 3.1, there is a temperature difference of about 8 °C to 10 °C. The temperature analysis results for the inner and outer walls of both the east and west sides are presented in Figure 12 and Figure 13. The daily maximum temperature of the east outer wall occurs at 8 a.m., with a mean temperature of around 50 °C, while the minimum temperature occurs at 4 p.m., at approximately 32 °C. Figure 12 shows that the east and west inner walls maintain more stable temperatures compared to the outer walls. The maximum temperature difference for the east inner and outer walls is observed between 8 a.m. and 10 a.m., while the maximum difference on the west side occurs between 2 p.m. and 4 p.m.
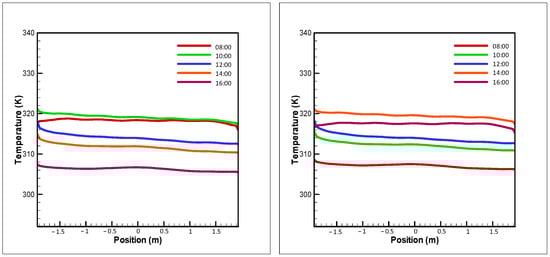
Figure 12.
Temperature curves of the inner walls during the test with insulation materials.
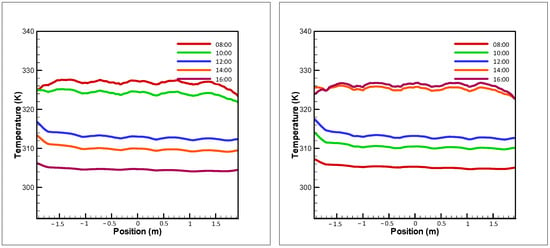
Figure 13.
Temperature curves of the outside walls during the test with insulation materials.
Compared to Section 3.2, the phenolic aldehyde insulation layer provides a more consistent thermal insulation effect than the cooling pipeline thermal insulation wall. The phenolic board is mounted seamlessly on the wall, preventing heat transfer through gaps, and its lightweight nature eliminates the need to account for additional wall load. In terms of thermal insulation, the phenolic aldehyde insulation layer outperforms the cooling pipeline by about 2 °C to 3 °C, based on the temperature difference between the inner and outer walls. This advantage arises because the cooling pipeline’s carrier (groundwater) removes the heat transferred from the outside to the building wall or space, whereas the phenolic aldehyde insulation layer solely prevents heat transfer from the outer walls.
3.4. Wall with Phenolic Aldehyde Resin Layer and Groundwater Cooling System
Building on the findings from Section 3.2 and Section 3.3, where both the phenolic aldehyde resin layer and the groundwater cooling system effectively insulated heat, this study combines these two methods to evaluate their combined benefits. As shown in Figure 14, the east and west walls are minimally affected by heat sources within the building. When the sun irradiates the wall, most of the heat is carried away by the groundwater cooling system, while a small portion of the heat that transfers to the inner wall is blocked by the phenolic aldehyde insulation layer.

Figure 14.
The temperature of the cross-section of the wall with two systems.
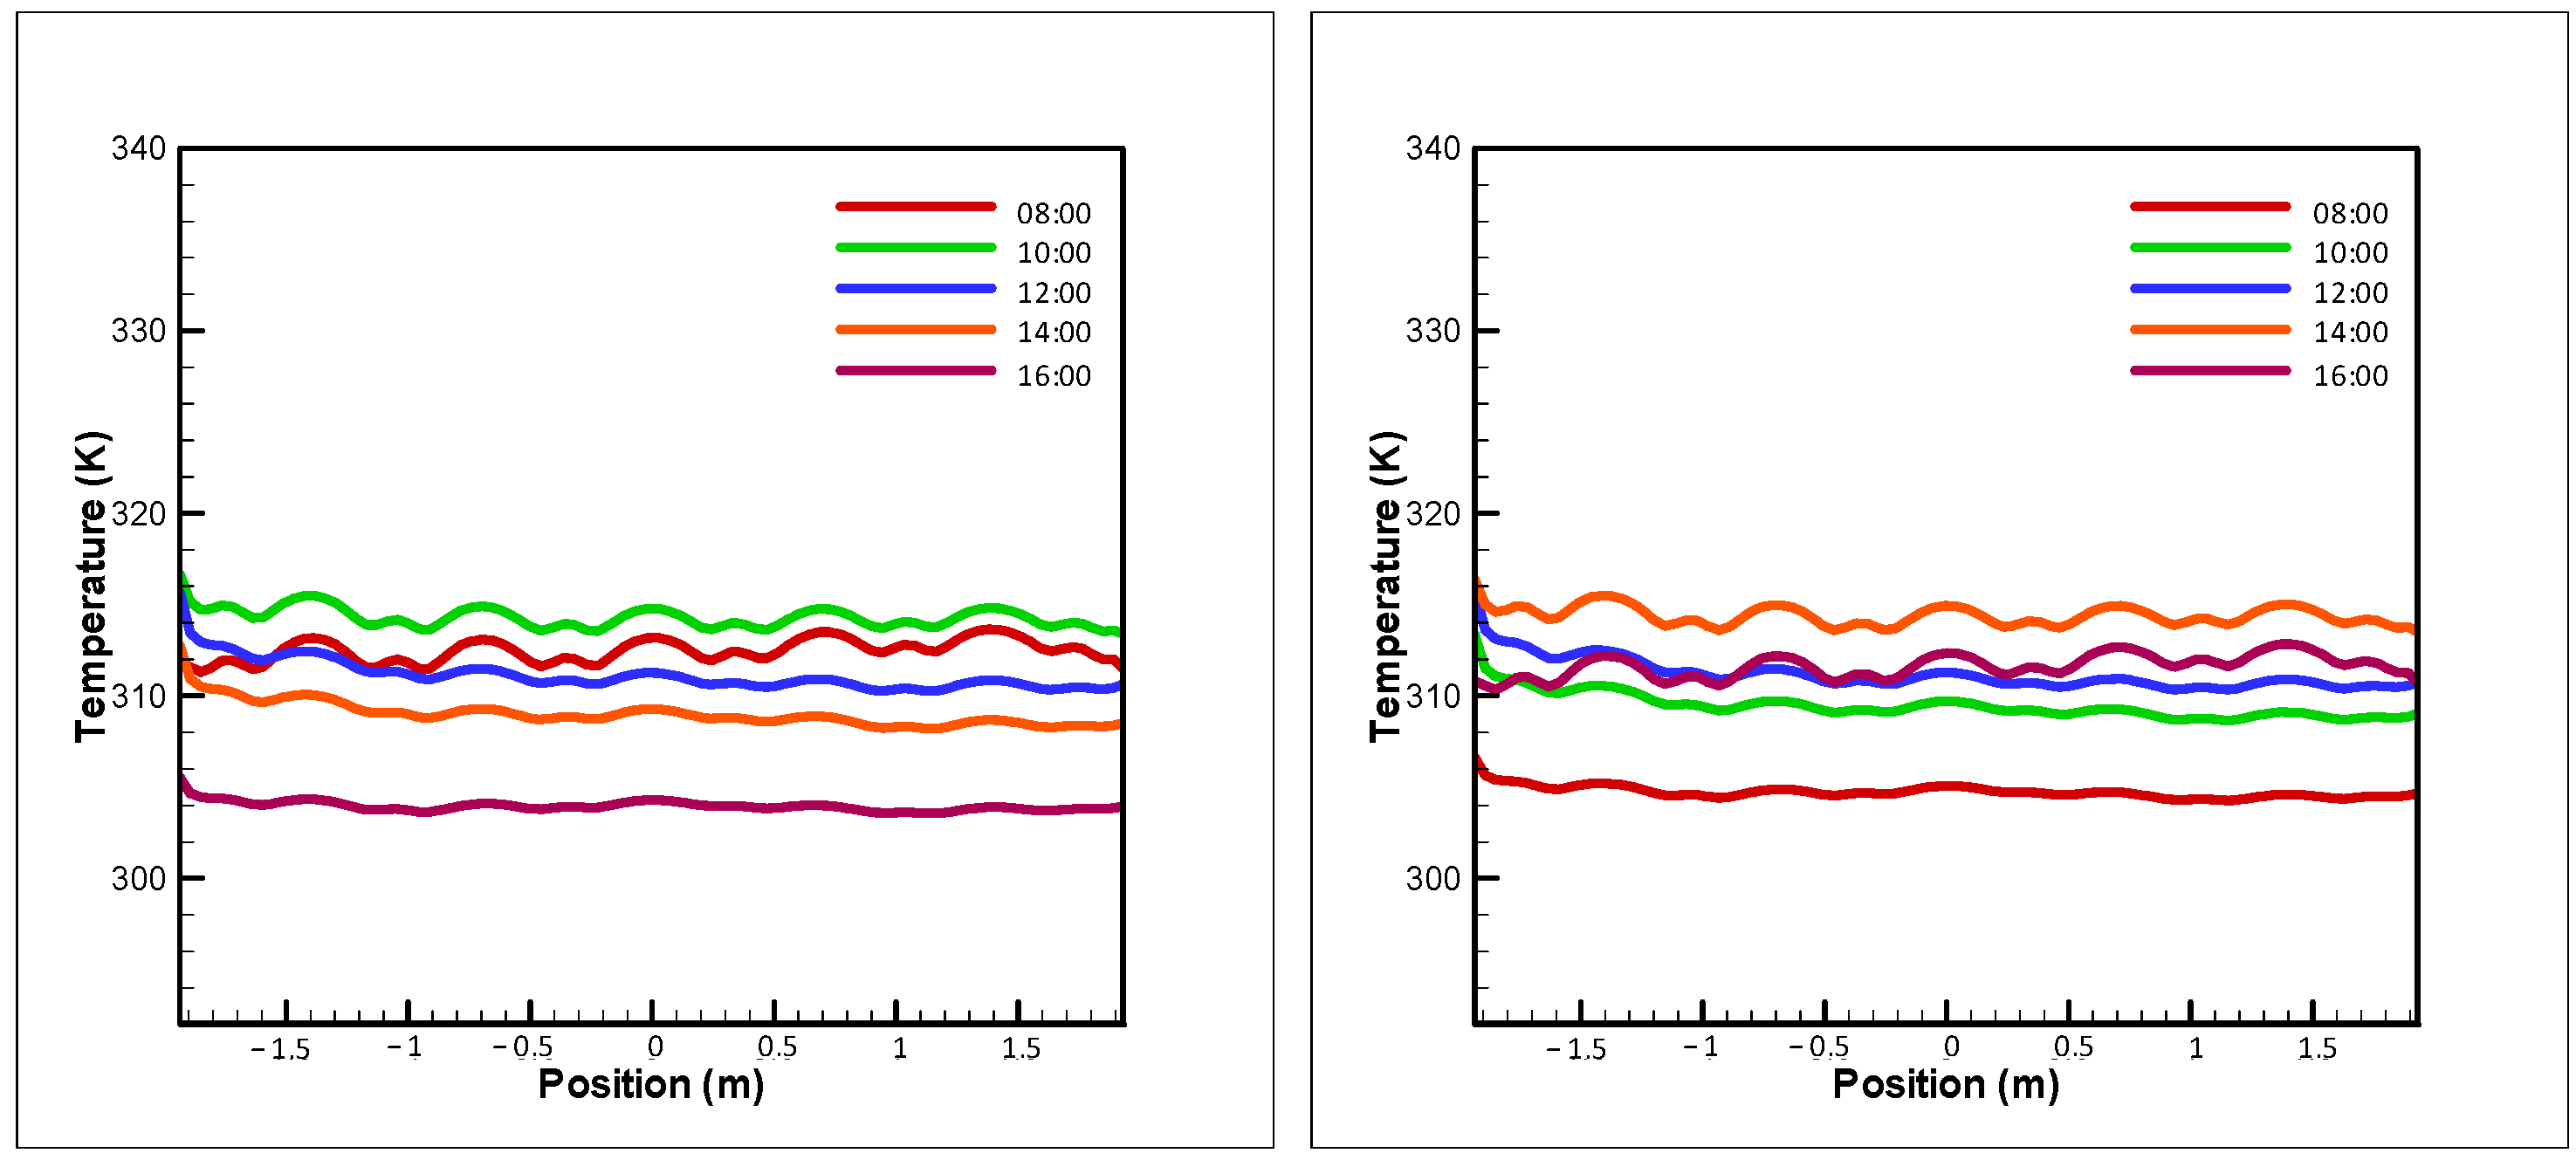
Simulation results indicate that the main heat source originates from the upper rooftop at noon. The combination of the insulation layer and the cooling system results in the lowest overall indoor temperature among the three analyzed conditions. The temperature fluctuations of the east and west inner and outer walls are depicted in Figure 15 and Figure 16. The outer wall temperature varies due to the cooling pipe temperature, resulting in noticeable temperature jumps. The east wall experiences higher temperatures from 8 a.m. to 10 a.m., with the outer wall temperature ranging from 39 °C to 47 °C. In contrast, areas where the cooling pipeline passes through show lower temperatures. The west wall’s temperature fluctuates between 38 °C and 47 °C from 2 p.m. to 4 p.m. The maximum temperature difference between the inner and outer walls ranges from 4 °C to 5 °C.
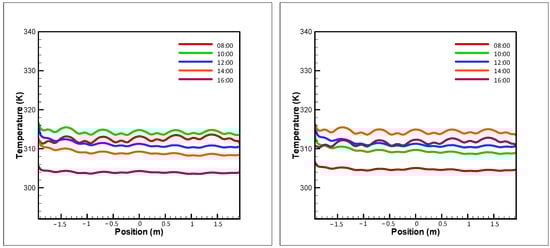
Figure 15.
Temperature variations of the east and west inner walls in the integration test.
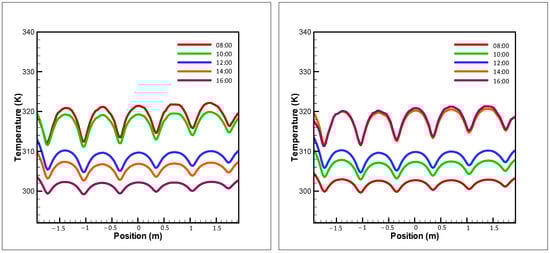
Figure 16.
The curve of temperature on the outside wall of east and west.
Compared to Section 3.2, the temperature of the east and west inner walls shows slight fluctuations. Even when the outside temperature rises above 50 °C, the inner wall temperature remains around 40 °C to 41 °C, with the indoor wall temperature being approximately 1 °C lower compared to the simple cooling pipeline thermal insulation system. When compared to Section 3.3, the maximum temperature difference for the east and west inner walls (east wall at 8 a.m., west wall at 2 p.m.) is 4 °C.
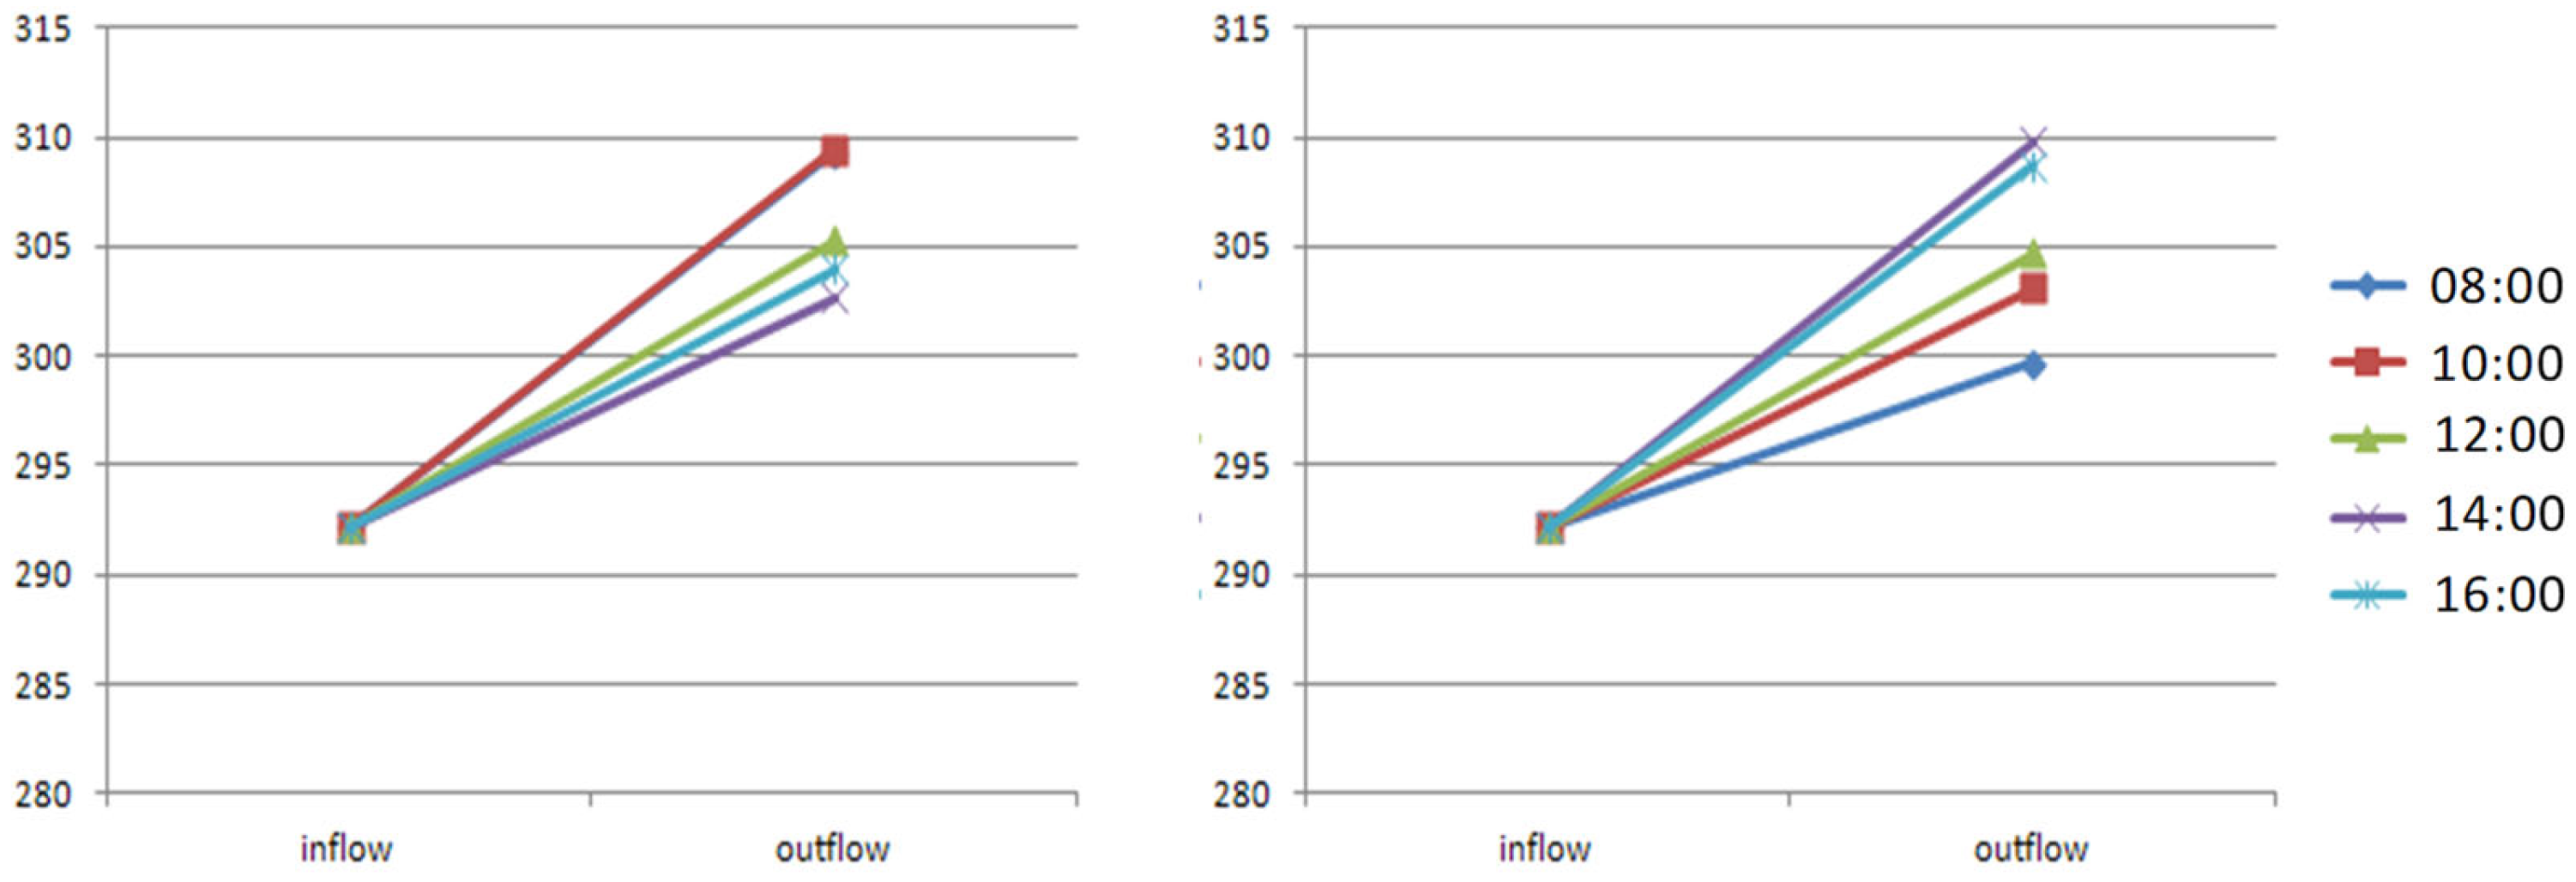
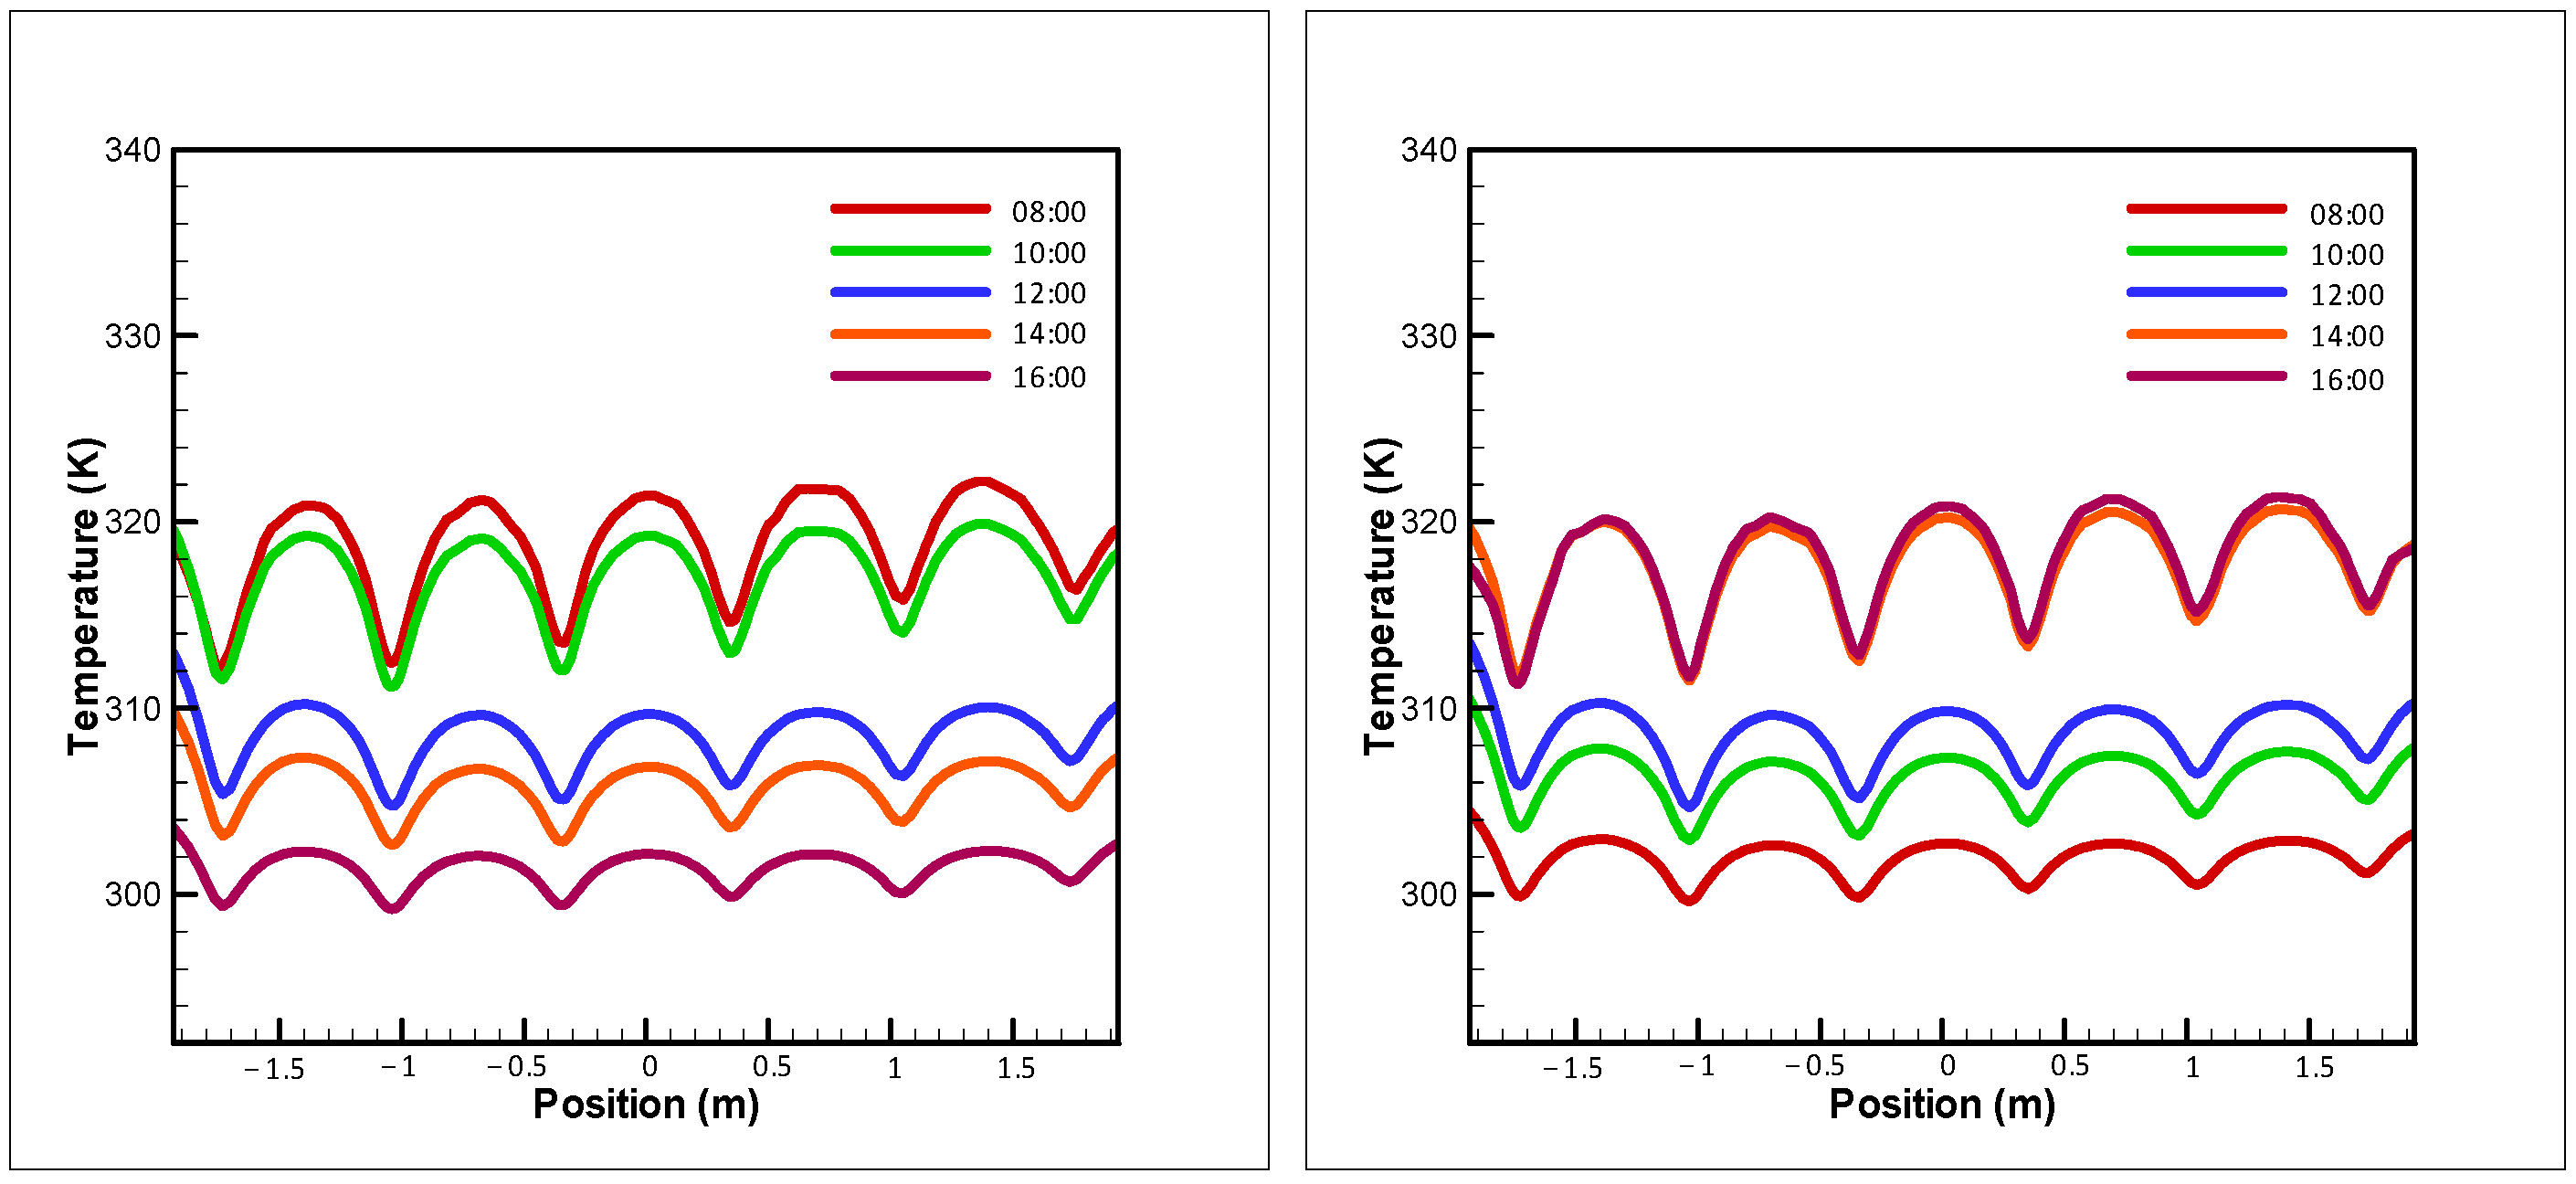
Figure 17 presents the wall cooling pipeline analysis. From 8 a.m. to 10 a.m., water enters the east wall at 19 °C and exits at temperatures between 35 °C and 37 °C. From 2 p.m. to 4 p.m., the water exiting the west wall ranges from 34 °C to 37 °C. Figure 18 indicates that the maximum difference between the outlet and inlet water temperatures for the east wall occurs between 8 a.m. and 10 a.m., and for the west wall between 2 p.m. and 4 p.m. This suggests that, as the temperature of the east and west walls rises, the water flow effectively carries heat away, similar to the performance of the single cooling pipe thermal insulation system.
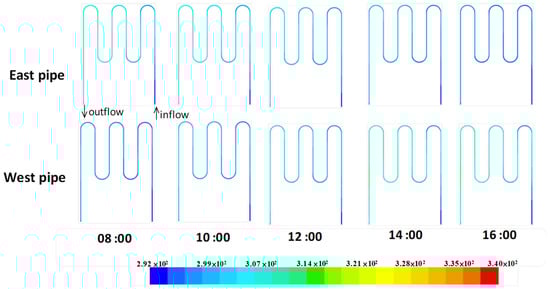
Figure 17.
Temperature variations of the cooling pipeline in the integration test.
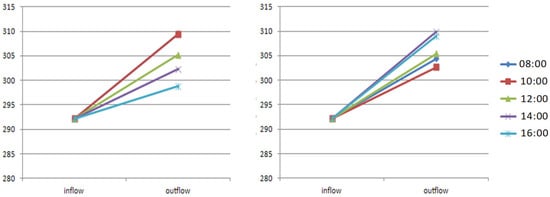
Figure 18.
The temperature variation of the integration test between the inflow and outflow.
Regarding indoor temperature, the combination of the phenolic aldehyde insulation layer and the groundwater cooling system provides effective heat insulation and cooling. The phenolic aldehyde insulation layer serves as a secondary protective barrier, preventing heat from penetrating through the cooling pipe system into the interior space. As a result, the flow velocity of the groundwater cooling system can be reduced, decreasing the frequency of water circulation and the energy usage of the driving motor. This approach prolongs the groundwater heat dissipation time, maintains the groundwater temperature at 19 °C, and optimizes the system’s operational efficiency.
4. Conclusions
Based on the experimental analysis and simulations, this study evaluates the following under full sun conditions:
- The effect of heat on the building wall and indoor space.
- The impact of the groundwater cooling system on the building wall’s thermal environment.
- The influence of the phenolic aldehyde insulation layer on wall heat transfer.
- A comprehensive analysis of the combined effects of groundwater cooling and phenolic aldehyde thermal insulation.
The conclusions drawn from the study are outlined below:
- Effectiveness of Insulation Methods: Both the phenolic aldehyde insulation layer and the groundwater cooling system demonstrate significant thermal insulation effects, with the groundwater cooling system proving to be the most effective.
- Heat Transfer Reduction: The phenolic aldehyde insulation layer effectively reduces heat transfer through the wall into the room. Evaluations show that the temperature difference between the inner and outer walls is approximately 8 °C. The groundwater cooling system further lowers the inner wall temperature compared to other conditions and also reduces the outer wall temperature more effectively.
- Heat Source Analysis: Simulations indicate that the primary heat source at noon is the building’s roof. While the phenolic aldehyde insulation layer can block external heat from entering the room, it cannot dissipate the heat, leading to heat accumulation indoors, as shown in thermal analyses from 12:00 p.m. to 2:00 p.m. This issue does not occur with the groundwater cooling system.
- Groundwater Temperature Analysis: The maximum inlet–outlet temperature difference for the groundwater system occurs between 8:00 a.m. and 10:00 a.m. for the east wall, and between 2:00 p.m. and 4:00 p.m. for the west wall. The water flow effectively carries away heat from the walls and surrounding areas, causing the water temperature to rise gradually and contributing to space cooling.
- Combined Insulation Approach: By combining the groundwater cooling system with the phenolic aldehyde insulation layer, heat is removed externally while the internal phenolic aldehyde thermal barrier prevents heat transfer through the wall. This dual approach maintains a stable indoor temperature, significantly reducing the air conditioning load and ensuring a comfortable indoor environment.
- Optimal Heat Insulation Strategy: The combination of the phenolic aldehyde insulation layer and the groundwater cooling system offers effective heat insulation and cooling. The phenolic aldehyde insulation layer acts as a secondary barrier, preventing heat from penetrating through the cooling pipe system into the room. This allows for a reduction in groundwater flow velocity, decreased frequency of water circulation, and lower energy consumption by the driving motor, thereby maintaining groundwater temperature near 19 °C and optimizing the system’s operational efficiency.
- Considerations for System Efficiency: While the groundwater system effectively dissipates heat from the walls, careful attention must be paid to the heat exchange within the underground aquifer. Faster groundwater flow rates improve the system’s cooling efficiency. However, if the wall pipeline spacing is too wide, heat can easily transfer into the interior. Conversely, a higher pipeline density increases costs and adds weight to the walls, potentially impacting the building’s structural integrity. Using insulation materials in conjunction with the cooling system is optimal, but these materials have a finite lifespan and must be replaced upon expiration to maintain their functionality.
Author Contributions
Conceptualization, T.-Y.C. and W.-P.S.; methodology, T.-Y.C. and W.-P.S.; software, T.-Y.C.; formal analysis, W.-P.S.; data curation, T.-Y.C. and W.-P.S.; writing—original draft preparation, T.-Y.C. and W.-P.S.; writing—review and editing, T.-Y.C. and W.-P.S.; visualization, T.-Y.C. and W.-P.S.; project administration, W.-P.S.; funding acquisition, T.-Y.C. All authors have read and agreed to the published version of the manuscript.
Funding
This study was funded by the National of Science and Technology Council (NSTC), Taiwan, for financially supporting this research under Grant No. NSTC 112-2637-H-167-001.
Institutional Review Board Statement
This study did not require ethical approval.
Informed Consent Statement
Not applicable for this study not involving humans.
Data Availability Statement
All data are available within the article and also from the corresponding author upon request.
Conflicts of Interest
The authors declare that there is no conflict of interests regarding the publication of this paper.
References
- Taniguchi, M.; Uemura, T. Effects of Urbanization and Groundwater Flow on the Subsurface Temperature in Osaka, Japan. Phys. Earth Planet. Inter. 2005, 152, 305–313. [Google Scholar] [CrossRef]
- Arif, H.; Tolga, M. A Study on Modeling and Performance Assessment of a Heat Pump System for Utilizing Low Temperature Geothermal Resources in Buildings. Build. Environ. 2007, 42, 3747–3756. [Google Scholar]
- Hadi, F.A.; Hikari, F.; Hiroyuki, K. Cooling Tests, Numerical Modeling, and Economic Analysis of Semi-Open Loop Ground Source Heat Pump System. Geothermics 2018, 71, 34–45. [Google Scholar]
- Rowe, J.M.; Paul, J.D. Cooling the London Underground: Evaluating the use of groundwater and subterranean river water. Sustain. Cities Soc. 2022, 76, 103531. [Google Scholar] [CrossRef]
- Huang, Z.K.; Cheng, Y.; Zhang, D.; Yan, D. Seismic fragility and resilience assessment of shallowly buried large-section underground civil defense structure in soft soils: Framework and application. Tunn. Undergr. Space Technol. 2024, 146, 105640. [Google Scholar] [CrossRef]
- Yang, J.; Song, W.; Wang, Z.; Dong, J.; Zhang, H. Direct/indirect optimal use of shallow geothermal energy in floor radiant cooling system coupled with air-handling system. J. Build. Eng. 2024, 89, 109206. [Google Scholar] [CrossRef]
- Grant, F. Characterizing Uncertainty in Groundwater-Source Heating and Cooling Projects in Manitoba, Canada. Energy 2012, 37, 201–206. [Google Scholar]
- Antonio, G.; Matteo, C. Thermal Short Circuit on Groundwater Heat Pump. Appl. Therm. Eng. 2013, 57, 107–115. [Google Scholar]
- Ampofo, F.; Maidment, G.G.; Missenden, J.F. Application of Groundwater Cooling Scheme for London Underground Network. Int. J. Refrig. 2011, 34, 2042–2049. [Google Scholar] [CrossRef]
- Issam, M.; Hind, D.R. Enhancement of Evaporative Cooling System in a Greenhouse Using Geothermal Energy. Renew. Energy 2017, 111, 321–331. [Google Scholar]
- Bricker, S.H.; Banks, V.J.; Galik, G.; Tapete, D.; Jones, R. Accounting for Groundwater in Future City Visions. Land Use Policy 2017, 69, 618–630. [Google Scholar] [CrossRef]
- Gerhard, R.; Hans, K. 3D Modeling of Groundwater Heat Transport in the Shallow Westliches Leibnitzer Feld Aquifer, Austria. J. Hydrol. 2018, 557, 668–678. [Google Scholar]
- Luo, J.; Xue, W.; Shao, H. Thermo-economic comparison of coal-fired boiler-based and groundwater-heat-pump based heating and cooling solution—A case study on a greenhouse in Hubei, China. Energy Build. 2020, 223, 110214. [Google Scholar] [CrossRef]
- Ihoume, I.; Tadili, R.; Arbaoui, N.; Bazgaou, A.; Idrissi, A.; Benchrifa, M.; Fatnassi, H. Performance study of a sustainable solar heating system based on a copper coil water to air heat exchanger for greenhouse heating. Sol. Energy 2022, 232, 128–138. [Google Scholar] [CrossRef]
- Zhou, M.; Cai, F.; Arai, K. Cyclic use of groundwater: An innovative way to improve performance of a groundwater source heat pump system during a cooling period. J. Build. Eng. 2022, 51, 104325. [Google Scholar] [CrossRef]
- Boughanmi, H.; Khaldi, N.; Lazaar, M.; Guizani, A. Enhancing nocturnal microclimate in Tunisian greenhouses: Experimental study on integrating an innovative conic helicoidally heat exchanger with a geothermal heat pump system. Geothermics 2024, 123, 103127. [Google Scholar] [CrossRef]
- Cavazzini, G.; Zanetti, G.; Benato, A. Analysis of a domestic air heat pump integrated with an air-geothermal heat exchanger in real operating conditions: The case study of a single-family building. Energy Build. 2024, 315, 114302. [Google Scholar] [CrossRef]
- Oldmeadow, E.; Marinova, D.; Birks, D.; Whittall, S.; Brown, S. Low Temperature Geothermal Applications as Enablers of Sustainable Development: Practical Case Studies from Australia and UK. Water Resour. Manag. 2011, 25, 3053–3071. [Google Scholar] [CrossRef]
- Zyoud, S.; Rühaak, W.; Sass, I. Dynamic Numerical Modeling of the Usage of Groundwater for Cooling in North East Jordan–A Geothermal Case Study. Renew. Energy 2014, 62, 63–72. [Google Scholar] [CrossRef]
- Petr, B.; Anatolijs, S.; Ksenia, S. Utilization Potential of Low Temperature Hydronic Space Heating Systems: A Comparative Review. Build. Environ. 2017, 112, 88–98. [Google Scholar]
- Wang, H.; Xu, Y.; Yuan, L.; Sun, Y.; Cai, Y. Analysis of geothermal heat recovery from abandoned coal mine water for clean heating and cooling: A case from Shandong, China. Renew. Energy 2024, 228, 120659. [Google Scholar] [CrossRef]
- Daniel, R.; Mikael, R.; Lars, W. CFD Modelling of Radiators in Buildings with User-Defined Wall Functions. Appl. Therm. Eng. 2016, 94, 266–273. [Google Scholar]
- Mahmoud, M.; Abdelkareem, M.A.; Olabi, A.G. Chapter 2.6—Modeling and simulation of geothermal energy systems. Renew. Energy 2024, 2, 197–211. [Google Scholar]


Disclaimer/Publisher’s Note: The statements, opinions and data contained in all publications are solely those of the individual author(s) and contributor(s) and not of MDPI and/or the editor(s). MDPI and/or the editor(s) disclaim responsibility for any injury to people or property resulting from any ideas, methods, instructions or products referred to in the content. |
© 2024 by the authors. Licensee MDPI, Basel, Switzerland. This article is an open access article distributed under the terms and conditions of the Creative Commons Attribution (CC BY) license (https://creativecommons.org/licenses/by/4.0/).