Article

Influence of Fine Content and Mean Diameter Ratio on the Minimum and Maximum Void Ratios of Sand–Fine Mixtures: A Discrete Element Method Study

School of Civil Engineering, Shanghai Normal University, Shanghai 201418, China
*
Author to whom correspondence should be addressed.
Buildings 2024, 14(9), 2877; https://doi.org/10.3390/buildings14092877
Submission received: 14 August 2024 / Revised: 7 September 2024 / Accepted: 10 September 2024 / Published: 11 September 2024

Abstract

:
As urbanization accelerates and surface space becomes increasingly scarce, the development and utilization of urban underground space have become more critical. The sand–fine mixture soils commonly found in river-adjacent and coastal areas pose significant challenges to the design and construction of underground structures due to their unique mechanical properties. In soil mechanics, the minimum and maximum void ratios are crucial indicators for assessing soil compressibility, permeability, and shear strength. This study employed the discrete element method (DEM) to simulate the minimum and maximum void ratios of sand–fine mixtures under various conditions by setting six fine contents and three mean diameter ratios. The results indicate that as the fine content increases, these void ratios exhibit a trend of initially decreasing and then increasing, which can be effectively modelled using a single-parameter quadratic function. Additionally, the initial shear modulus was closely related to the uniformity of contact distribution at the microscopic level within the specimens. This study also introduced a dimensionless parameter that simultaneously described changes in contact distribution and initial shear modulus.

1. Introduction

With the rapid pace of urbanization and the growing shortage of surface space, the development and utilization of urban underground space have become increasingly important. As an effective solution to address surface space limitations, underground space development offers new opportunities for sustainable urban growth. In river-adjacent or coastal areas, the prevalent sand–fine mixture soils present challenges to the design and construction of underground structures due to their unique mechanical properties [1]. In soil mechanics, the minimum and maximum void ratios, which define the densest and loosest states of the soil, are crucial indicators of compressibility, permeability, and shear strength. Therefore, understanding the influence of fine content and mean diameter ratio on these void ratios is essential for the future utilization of urban underground space.
Previous studies have identified several factors influencing the minimum and maximum void ratios [2], such as grain-size distribution [3,4], particle shape [5,6], and fine content [5,7,8,9,10,11]. Among these, the fine content ( F C ) and the mean diameter ratio ( D / d ) are considered the most important. To describe the evolution of these void ratios, Chang et al. [12,13] proposed a bilinear model and provided empirical formulas for calibrating the model’s fitting parameters. Polite [14] later improved this approach by incorporating the influence of the mean diameter ratio into the empirical formulas. Larrard [15] proposed the “loosening function” and “wall function” for computing the packing density of mixtures and subsequently determined the void ratio of the mixture. Similarly, Shen et al. [16] used random close packing theory to estimate the void ratios for both the densest and loosest packings. The minimum and maximum void ratios are also essential for predicting soil mechanical behaviour. Cubrinovski and Ishihara [2] highlighted the importance of the void ratio range ( e m a x e m i n ) in normalizing Standard Penetration Test (SPT) blow counts and determining the position of the critical state line. Belkhatir et al. [17] conducted undrained shear tests on sand–fine mixtures with varying fine contents, revealing that a strong correlation exists between the void ratios and peak undrained shear strength. Chaney et al. [7] examined the impact of varying fine contents on the minimum and maximum void ratios of sand–fine mixtures, indicating a correlation between the void ratio and the static liquefaction potential of sand. Hang et al. [11] analysed the initial shear modulus of sand–fine mixtures through bender element tests and found that the normalized initial shear modulus exhibited a negative power-law correlation with both e m i n and e m a x .
Although the aforementioned studies have produced successful outcomes, they primarily relied on experimental methods. In experimental research, different researchers often test their own materials, leading to inconsistencies in particle shape and material properties. Moreover, the use of various testing standards [18,19,20] also contributes to increased data variability, complicating related research efforts. Additionally, it is challenging for soil specimens to truly reach the minimum and maximum void ratios in triaxial conditions. As a result, the relationship between the minimum and maximum void ratios and the mechanical strength of sand containing varying fine content remains underexplored in the literature. To overcome these limitations, the discrete element method (DEM) was adopted in this study. In recent years, the DEM has been widely used in geotechnical engineering, especially due to its ability to preserve geometrical characteristics and control experimental conditions [4,21,22,23,24]. More importantly, the DEM can serve as a bridge, coupling microscopic fabric parameters with corresponding mechanical properties. Several successful applications highlight the potential of this method. For instance, Zhou et al. [25] used the DEM to optimize the grading of cement-stabilized laterite granules in West Africa, reducing the need for extensive laboratory testing. Tan et al. [26] adopted the DEM to establish the relationship between grain morphology and mechanical properties in artificially crushed stones with varying shapes and gradations, revealing that the internal friction angle and cohesion increased with the enhancement of angularities and the curvature coefficient. Zhao et al. [24] acquired the fabric of sand during liquefaction via the DEM and expounded the liquefaction mechanism of sand from the viewpoints of fabric and microstructure. Barnett et al. [27] conducted undrained triaxial shear tests on sand–fine mixtures using the DEM to determine the critical state line of the mixture and explored the relationship between the parameter “b” and the critical state of the mixture. Zhang et al. [28] employed the DEM to study the failure process of a shallow shield cross-river tunnel face in saturated silty fine sand, analysed the failure mechanism of the cross-river tunnel face, and developed a new failure model for shallow shield cross-river tunnels in saturated silty fine sand. Gu et al. [29,30] employed the DEM to study the mechanical behaviour of soil under both static and dynamic loading, linking it to the contact model and describing the soil’s behaviour from a microscopic perspective. They found that the coordination number (CN) and the mechanical coordination number (MCN) can serve as evaluation indicators for soil liquefaction and critical states, respectively.
This study employed the discrete element method (DEM) to create models of sand–fine mixtures with varying fine contents, simulating their minimum and maximum void ratios according to Chinese standards. Based on the simulation results, a physically meaningful model was proposed to effectively estimate the evolution of these void ratios. To further investigate the relationship between void ratios and mechanical strength, this study developed numerical sand–fines specimens under triaxial conditions to analyse the corresponding initial shear modulus. Finally, the relationship between soil fabric characteristics and the evolution of the initial shear modulus was established.

2. DEM Simulation

The PFC6.0 3D developed by Itasca was employed to conduct numerical simulations on the minimum and maximum void ratios using spherical particles and the rolling resistance linear model. Compared to other shapes of particles, spherical particles can greatly reduce the needed computing power, especially when there is a large difference in particle size between coarse grains and fine particles. By setting the correct parameters with the rolling resistance model, previous studies have already demonstrated that the utilization of spherical particles and the rolling resistance linear model can effectively simulate and replicate the mechanical behaviour of different soils [22,24].
To ensure the consistency and reliability of all DEM simulation results, the numerical simulations of the minimum and maximum void ratios were performed using the same set of contact model parameters, as listed in Table 1. In this study, three sand–fine mixtures were simulated by fixing the diameter of large grains ( D = 3 mm) and gradually decreasing the diameter of small particles ( d = 1.5 mm, 1 mm, and 0.5 mm). The grain-size distribution curves for the studied specimens with different fine contents and mean diameter ratios are depicted in Figure 1.
For these sand–fine mixtures, we also performed DEM triaxial drained tests to establish the relationship between the initial shear modulus and the evolution of the minimum and maximum void ratios.

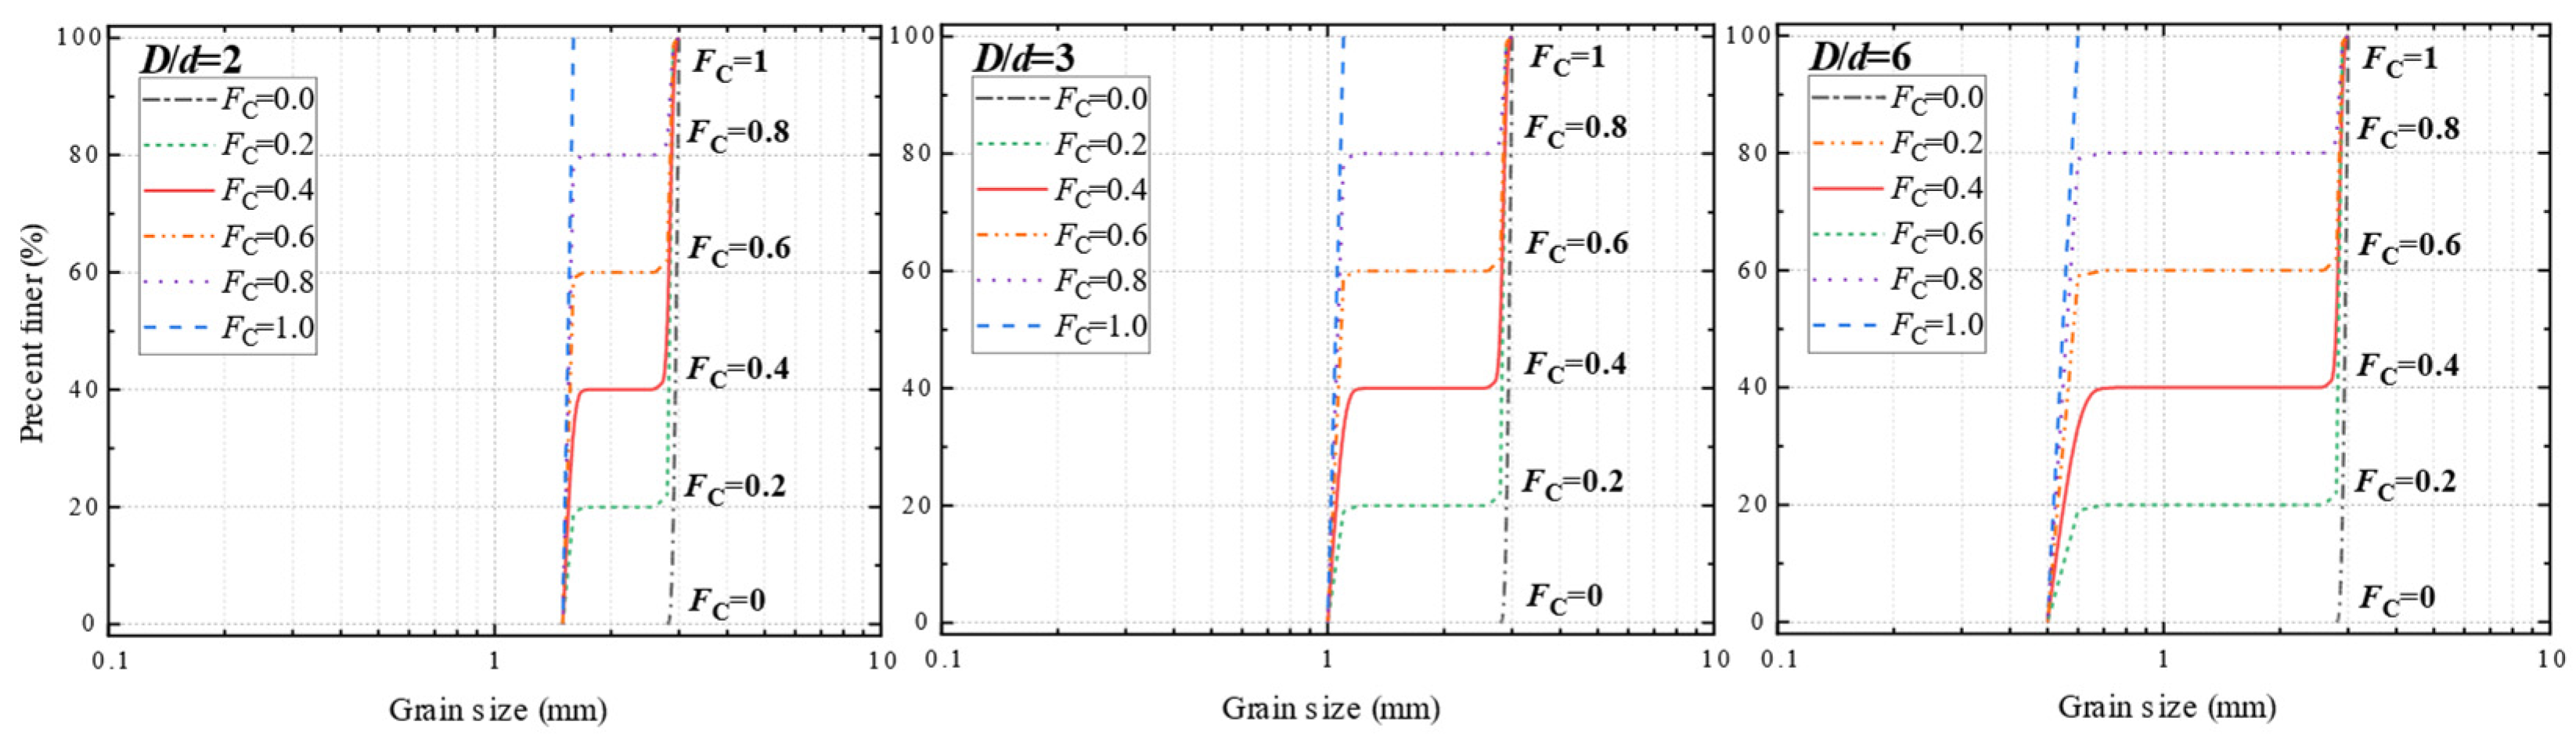
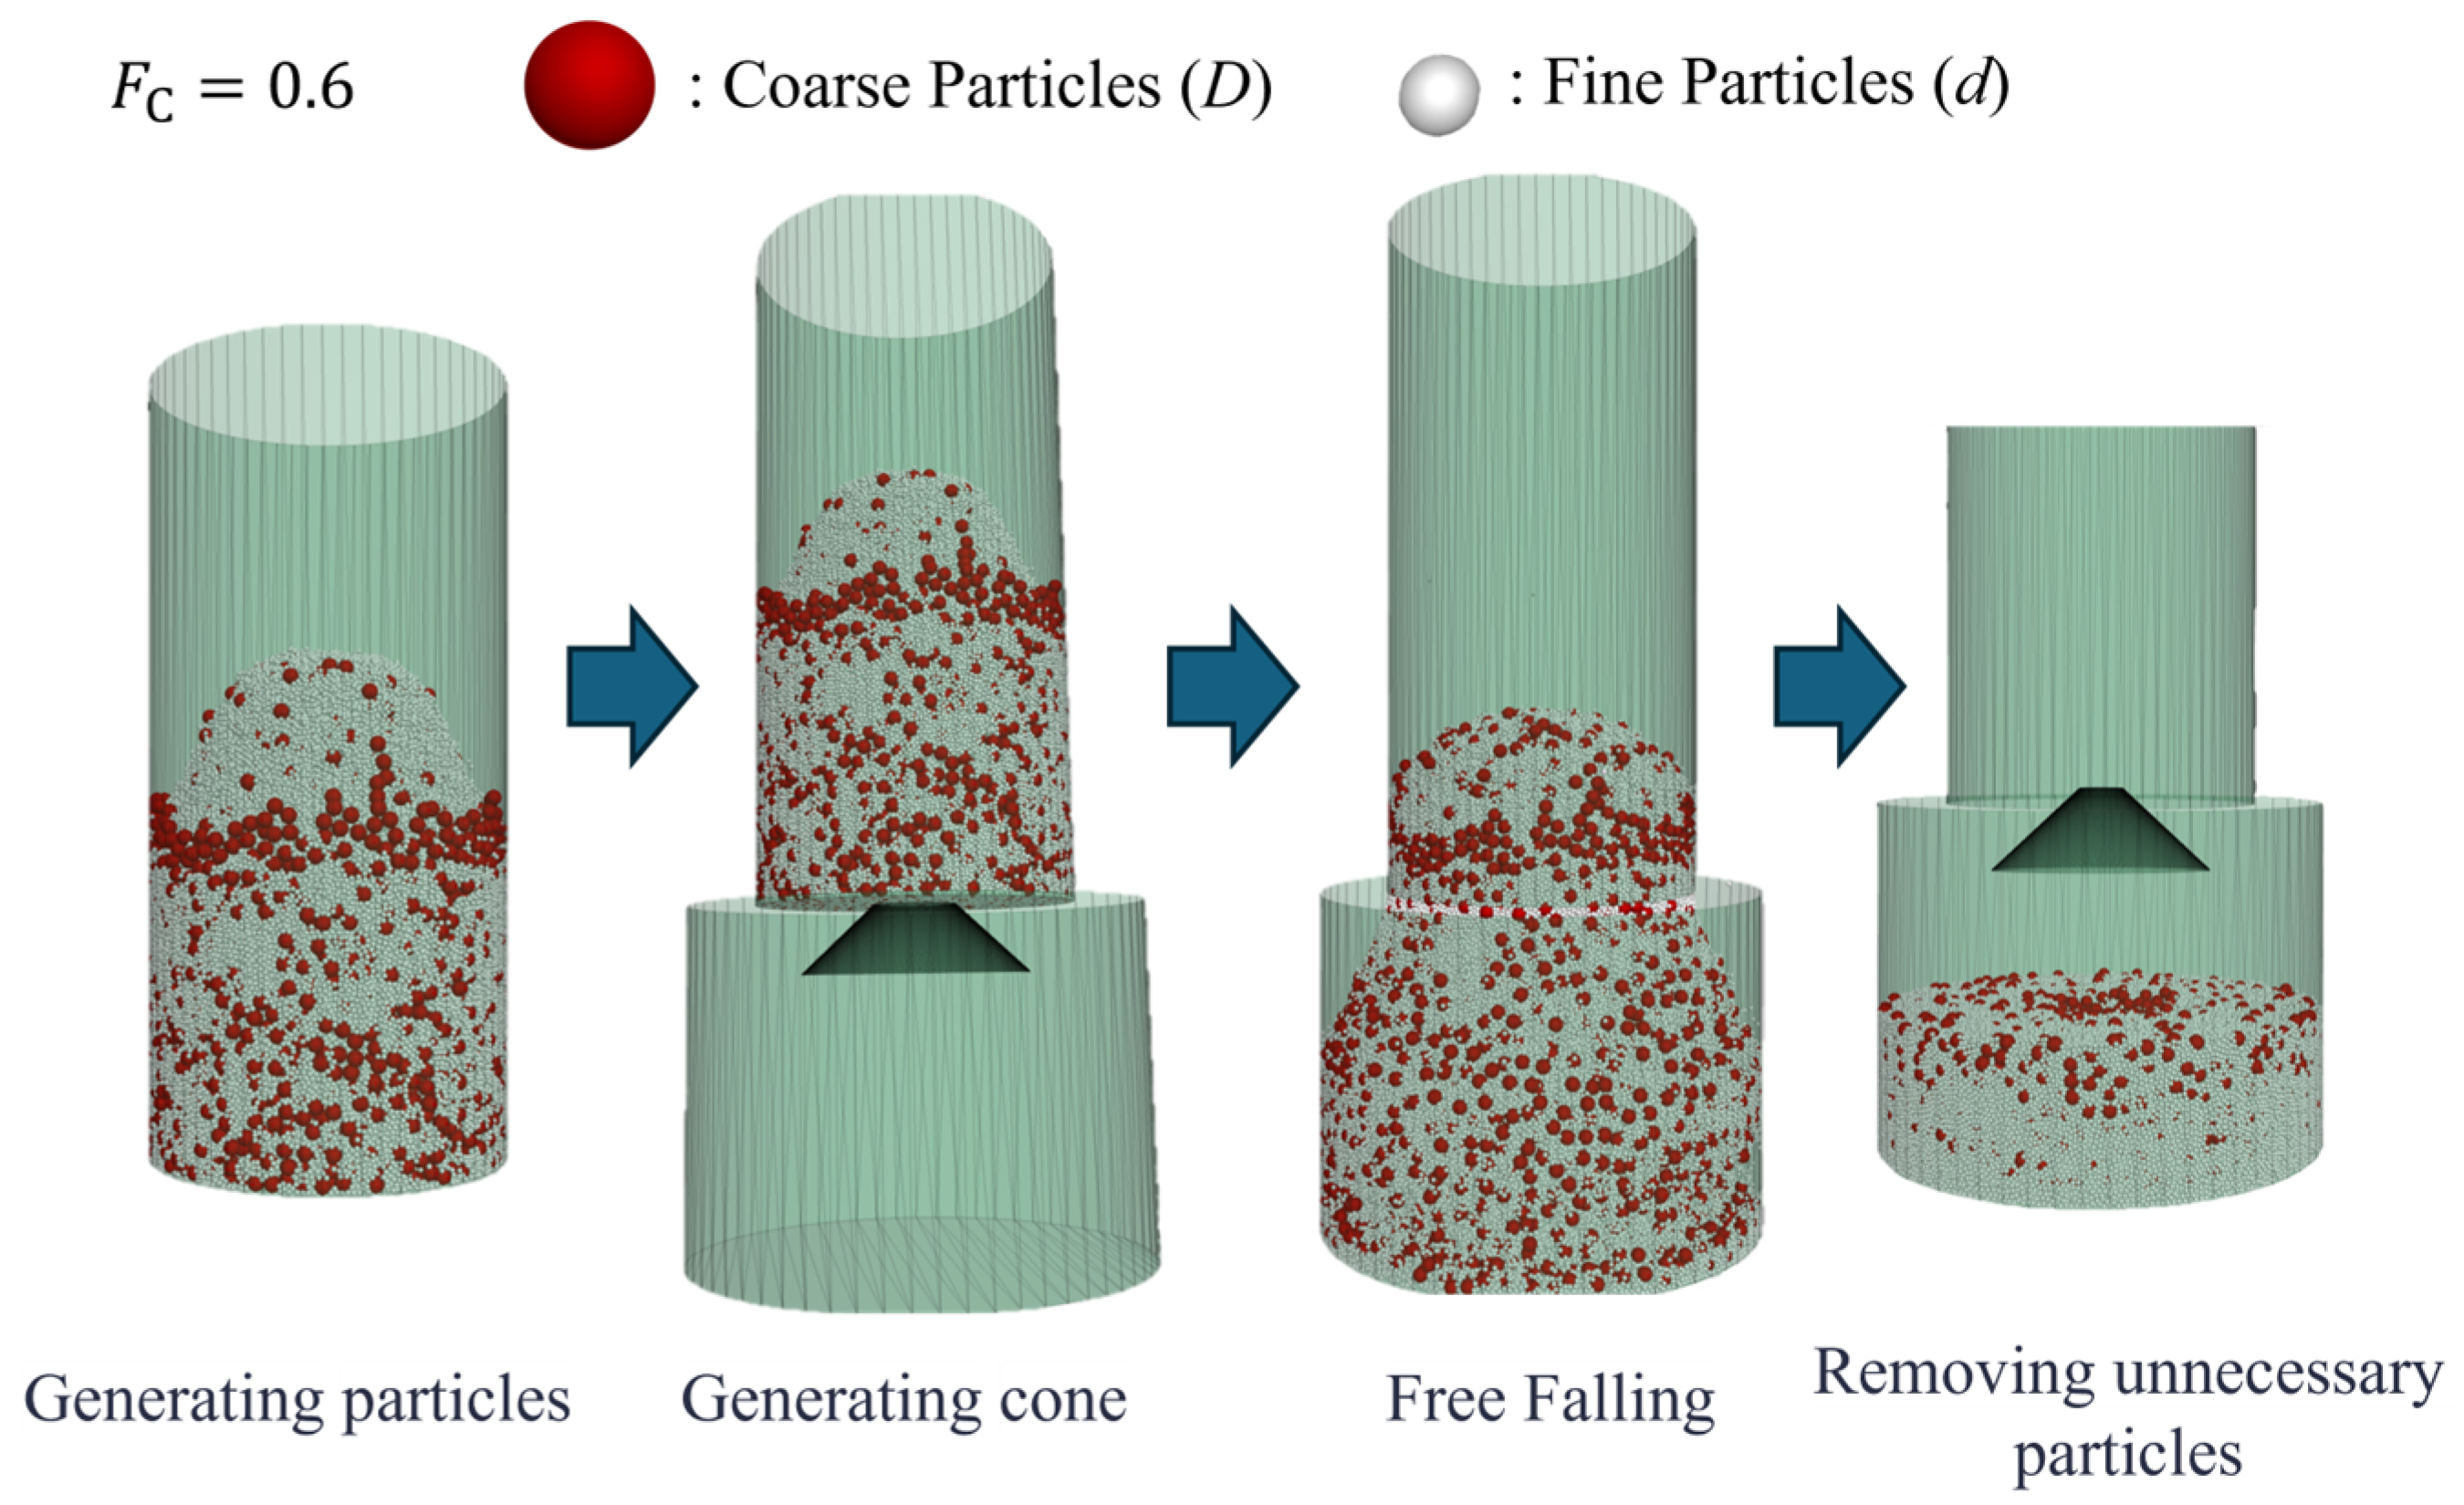
2.1. Minimum Void Ratio Test Simulation

The numerical simulation for the minimum void ratio was designed based on the main principles outlined in the Chinese national standard GB/T 2015 50123 [20]. Particles with the specified fine content F C were initially generated with overlaps inside a cylindrical container measuring 437 mm in height and 100 mm in radius. The dimensions of this container significantly exceed ten times the maximum particle size ( D = 3 mm), thereby avoiding the consideration of any boundary effects. Due to the initial overlaps, the particles were uniformly dispersed throughout the container and subsequently settled to the bottom under a low gravity of g = 3 m/s2. Once the particles reached an initial equilibrium at the bottom, a top cover was placed to apply an axial stress of 950 kPa. Under the maintenance of this load, the container with the whole particles was subjected to cyclic vibration (as shown in Figure 2). This forced the particles to continuously consolidate until the densest state was reached. At this state, the total volume and the particles’ volume were measured, allowing the value of the minimum void ratio to be calculated.

2.2. Maximum Void Ratio Test Simulation

As for the maximum void ratio, the sand–fine mixtures were first prepared inside a bottom-sealed container. Once the initial equilibrium was achieved, the container’s bottom was substituted with a cylindrical diffuser (see Figure 3). This change allowed the particles to commence free fall with a real gravity of g = 9.81 m/s2. In this step, the purpose of the diffuser was to minimize the kinetic energy during free fall for the achievement of the loosest state. After the free fall ended, the particles in the upper layer that formed a cone owing to friction were removed. The remaining portion was thus used to determine the corresponding maximum void ratio.

2.3. Initial Shear Modulus DEM Test

In this study, the initial shear modulus G 0 was determined by simulating small-strain triaxial shear tests. As shown in Figure 4, the sand–fine mixture was generated with overlaps and later uniformly distributed inside a square container equipped with six servo-controlled walls. This configuration permitted precise control over the boundary conditions. The velocities of the upper and lower side walls were precisely adjusted to continuously apply the shear strain (10⁶/s). At the same time, the two pairs of lateral walls exerted a constant confining pressure of 200.5 kPa on the mixture to establish a triaxial loading condition. During the shearing process, the axial strain was limited to a very small range ( ε a ≤ 10−5), ensuring that the specimen remained within its elastic deformation regime to accurately determine its initial shear modulus G 0 [21,31,32,33,34,35,36]. The following equations were used to measure the initial shear modulus G 0 :
G = 1 3   ×   d q d ε q
d ε q = 2 3 d ε 1 d ε 3
q = d σ 1 d σ 3
where q is the deviator stress; σ 1 is the axial stress; σ 3 is the horizontal stress; ε q is the shear strain; and ε 1 , ε 3 are the axial and horizontal strains, respectively.

2.4. Validation of Contact Model Parameters

The contact model governs the mechanical interactions between particles, so any changes to the contact model parameters can result in significantly different mechanical behaviours of the entire specimen. Therefore, setting and validating the parameters within the contact model is essential. To ensure the reliability of the simulation data and that the results accurately reflect real-world conditions, we implemented a rigorous validation programme for the contact model parameters. Using the rolling resistance model and spherical particles specified in Table 1, we simulated the mechanical behaviour of a reference silica sand Hostun 31 (HN31) under cyclic triaxial shear conditions [37].
The whole validation process can be decomposed into three steps [24]:
(i)
Spherical particles were generated within a cubic domain measuring 0.2 m × 0.2 m × 0.2 m, maintaining a uniform void ratio. The generated particle size distribution strictly followed the actual grain-size distribution curve of the HN31 sand. At the same time, the contact model was established between particle–particle and particle–facet interactions, and the unbalanced forces between particles were eliminated.
(ii)
When the particle generation was completed, confining pressure was applied to the specimen by controlling the velocity of the walls, which was calculated by measuring the stress on all walls at each time step. Based on the difference between the measured value and the target value, the velocity and direction of each wall were adjusted to ensure precise servo control. Once the consolidation stress reached 200.5 kPa, it was maintained for a period until the void ratio stabilized.
(iii)
After consolidation, a stress-controlled constant-volume cyclic triaxial shear test was performed on the specimen using a sine wave consistent with that used in the laboratory tests. The sine wave had a frequency of 0.1 Hz with a cyclic stress ratio (CSR) of 0.22 (the amplitude of shear stress divided by the consolidation stress). During the application of shear stress, both the shear stress and the effective mean stress were recorded. After the sample failed, the effective stress path was plotted and compared with the results obtained from laboratory tests on the HN31 sand.
As seen in Figure 5, with the application of cyclic shear stress, the mechanical behaviour exhibited by the DEM simulation aligns well with the indoor test: both started from the point (200,0) and gradually moved towards (0,0), eventually forming a butterfly orbit near (0,0). Additionally, the amplitude of the shear stress was precisely controlled at 105 kPa, with the curve remaining smooth and exhibiting minimal fluctuation, indicating the precision and reliability of the servo system. Based on these validation results, it can be concluded that the contact model and parameters used in this study can accurately reflect the mechanical properties of sandy soil.

3. Results and Discussion

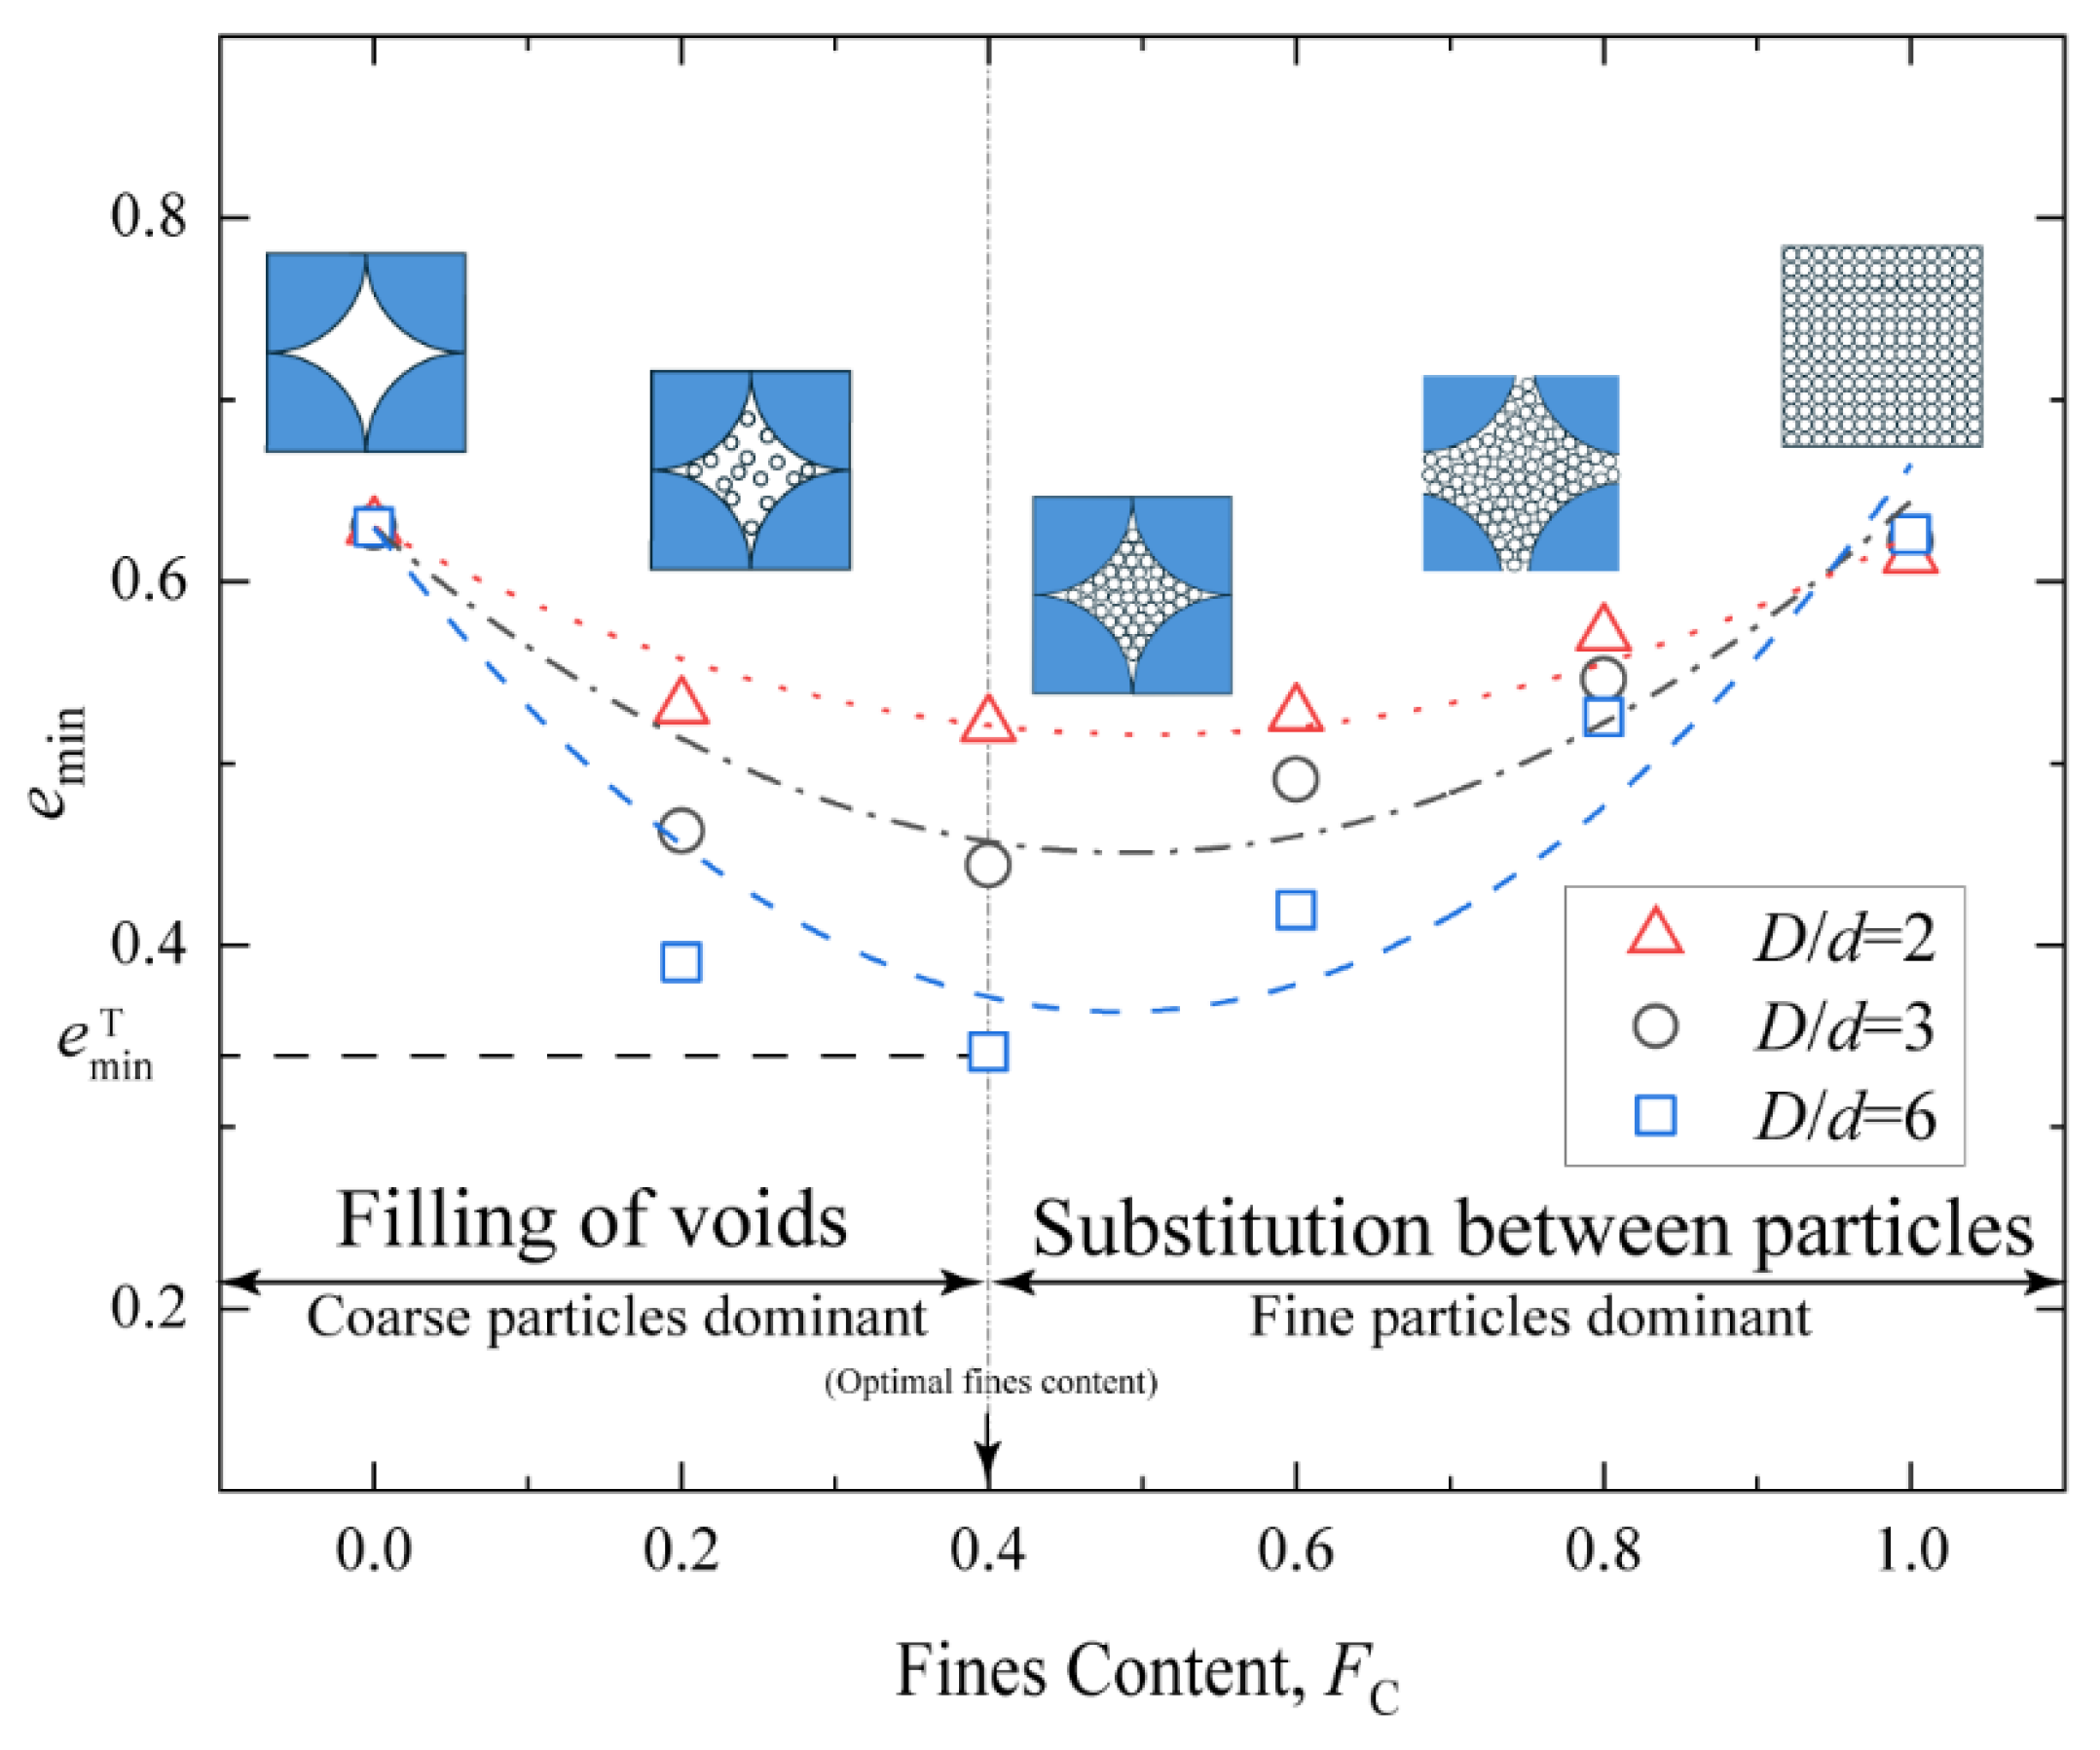
3.1. Minimum and Maximum Void Ratio

The variation in the minimum void ratio with different fine contents and mean diameter ratios is illustrated in Figure 6. This figure demonstrates that the minimum void ratio initially decreases as the fine content increases until reaching a transitional fine content. After passing this transitional point, the minimum void ratio begins to rise in conjunction with the fine content reaching 1.0. This inflexion trend reflects the transformation in the predominance of the main skeleton within sand–fine mixtures. Prior to the transition point e m i n T , as shown in Figure 6, coarse grains build the main soil matrix, and the fine particles primarily fill the voids between coarse particles [2,8,9]. This phenomenon causes the sand–fine mixture to become denser and thus results in a decrease in the minimum void ratio. On the contrary, beyond the transition point, as the fine content increases, fine particles gradually replace the coarse grains and construct their own skeleton. In general, fine particles have a larger surface area as compared to coarse grains, which increases the number of contact points between them. This hinders the particles from arranging closely with one another, thereby increasing the void ratio.
The relationship of the transitional minimum void ratio ( e m i n T ) with the mean diameter ratio D / d is displayed in Figure 7. It can be observed that the transition fine content and e m i n T steadily decreases as the mean diameter ratio increases and gradually converges to a constant. When the size difference between coarse grains and fine particles becomes more pronounced, fine particles are more likely to be accommodated within the voids created by the coarse grains. This enhances the filling effect of fine particles, thereby decreasing the value of the transitional minimum void ratio [2,7,39].
To establish the functional relationship between e m i n and F C , a quadratic function ( y = a x 2 + b x + c ) was employed to fit the numerical results at various mean diameter ratios. As shown in Figure 6 and Table 2, the clear benefit of choosing such a function is that it is smooth in form without any cusps, and it can be easily controlled with only three fitting parameters. First, in the quadratic function, the fitting parameter “ c ” represents the intercept on the y -axis, which refers to the clean sand composed of only coarse grains without fine particles ( F C = 0 ). This value was directly set as the minimum void ratio of the provided coarse grains with D = 3 mm, regardless of the mean diameter ratio. Second, since the quadratic function attains its minimum point at x = b / 2 a (the e m i n T mentioned earlier), the fitting parameter “ a ” and “ b ” must satisfy a specific relationship with e m i n T . By combining the above two arguments, the fitting parameters “ b ” and “ c ” are expressed in the following form:
e m i n = a   ×   ( F C ) 2 + 2 a   ×   e m i n T   ×   F C + e min F C = 0
Regarding the functional relationship between the fitting parameter “ a ” and the mean diameter ratio D / d , two special cases can be hereinafter discussed. In scenarios where the mean diameter ratio equals one, the two materials in a binary sand–fine mixture are exactly the same size, and the mixture can be considered uniform soil. In this case, the fitting parameter “ a ” should equal zero to maintain a constant minimum void ratio, regardless of the variation in fine content. On the other hand, when the mean diameter ratio approaches infinity, fine particles are notably smaller than coarse grains. The addition of fine particles with very small volume in the soil theoretically leads to limited changes in the minimum void ratio. Combining the above arguments, the function curve between the fitting parameter “ a ” and the mean diameter ratio should satisfy the following two conditions: (i) the curve passes through the point (1,0); (ii) the curve converges to a fixed value as the mean diameter ratio approaches infinity.
For this purpose, a modified inverse proportional function y = 1.198 * ( x 1 ) / x was used to fit the scatter points displayed in Figure 8. The function theoretically passes through the point (1,0) and exhibits a horizontal asymptote as the x -coordinate tends to infinity. Both the aforementioned requirements can be satisfied with this function. In conclusion, this study proposes a methodology that uses only a single intermediate fitting parameter “ a ” to establish the relationship between the minimum void ratio and the mean diameter ratio. As a dimensionless indicator, the mean diameter ratio measures the size disparity between coarse grains and fine particles, which is the key physical characteristic to understanding the evolution of binary soil–fine mixtures. Hence, the consideration of the mean diameter ratio (Equations (5) and (6)) offers explicit physical meaning for the selection of the fitting parameters and avoids the constraints associated with a reliance on any specific empirical equation.
Combined with Equation (4), the following can be obtained:
e m i n = a   ×   ( F C ) 2 + 2 a   ×   e m i n T   ×   F C + e min F C = 0
a = 1.198   ×   ( D d 1 ) D d
Figure 9 displays the maximum void ratio ( e m a x ) with varying mean diameter ratios and fine contents. Similar to the minimum void ratio, the maximum void ratio exhibits the same trend. As the fine content increases, the maximum void ratio initially decreases and then increases after a transitional point of about 0.4. Consequently, the quadratic function can continue to be used here to describe the evolution of the maximum void ratio. Following the same logic, the fitting parameter “ c ” was set the same (see Table 3) for different mean diameter ratios, corresponding to the maximum void ratio of pure coarse grains. The fitting parameter “ b ” was coupled with the fitting parameter “ a ” through the transitional fine content. Finally, the fitting parameter “ a ” was determined in relation to the mean diameter ratio, providing a clear physical interpretation for the description of the maximum void ratio.
Figure 10 shows the correlation between the minimum and maximum void ratio of the investigated sand–fine mixtures. For the provided mean diameter ratio, a strong linear correlation exists between the minimum and maximum void ratio. In particular, despite changes in fine content, both the minimum and maximum void ratios exhibit a consistent trend. The phenomena indicate that the introduction of particles of different sizes into a uniform soil effectively creates a new mixture. Consequently, both the minimum and maximum void ratios automatically adjust in response to changes in fine content. Furthermore, in any specific type of sand–fine mixtures, the minimum and maximum void ratios are highly correlated. This strong correlation reinforces the notion that these ratios should be considered the intrinsic properties of the new material.

3.2. Initial Shear Modulus

As the fine content increases, the primary load-bearing structure within a sand–fine mixture gradually shifts from a matrix of coarse grains to one dominated by fine particles. This transition leads to a significant change in its mechanical properties. For granular material, the initial shear modulus G 0 is one of the most important indicators for characterizing the shear strength. Figure 11 displays the initial shear modulus G 0 of different sand–fine mixtures subjected to a confining pressure of 200 kPa, using small-strain DEM triaxial shear tests. It is evident from the figure that G 0 likewise exhibits an initial decreasing trend followed by an increasing trend. This is in line with the variations in the minimum and maximum void ratios. However, no obvious correlation is observed between the G 0 and fine content as the mean diameter ratio increases. Interestingly, the initial shear modulus for the specimens, with mean diameter ratios of three and six, exhibits a striking similarity when the fine content is below 0.8; however, both curves exceed that curvewith a mean diameter ratio of two.
In general, the mobility of fine particles is much greater than that of coarse grains. Therefore, as fine particles are introduced, the number of coarse grains that can form the global load-bearing structure against external load decreases. This results in a reduction in the initial shear modulus. On the contrary, once the transitional fine content is exceeded, fine particles begin to form their own structure while coarse particles become loosely distributed. Consequently, the overall load-bearing structure is enhanced with the addition of fine particles, leading to a gradual increase in the initial shear modulus.
The DEM triaxial shear tests were equally used to capture the force chain structures with varying fine contents, as depicted in Figure 12 and Figure 13. Each force chain is represented as a “bar” connecting the centre of each particle, where the thickness and colour indicate the magnitude of the force. A thicker bar signifies a greater transmitted force, while a thinner bar denotes a lower force. Additionally, the magnitudes of all the contact forces were collected to compute the coefficient of variation (CV) for the entire specimen. As a dimensionless indicator, the CV is derived from the standard deviation (S) and the mean value (AVG), serving as an indicator of force chain dispersion. In this study, the CV reflects the homogeneity of the force chain system. A higher CV suggests that contact forces are more concentrated on a limited number of contacts, resulting in less uniformity across the entire force chain. The CV, S, and AVG can be calculated using Equations (7)–(9), respectively.
C V = S A V G
S = 1 n i = 1 n x i A V G 2
A V G = 1 n i = 1 n x i
where n is the number of contacts in the specimen and x i is the magnitude of the contact force. The coefficient of variation of contact force with varying fine contents is illustrated in Figure 12.
In the case of a clean specimen with a uniform particle size ( F C = 0) in Figure 12, the entire force chain is evenly distributed, and the small CV indicates less stress concentration in the main soil skeleton. With the initial addition of fines (i.e., 0 < F C < 0.4), the original structure, primarily supported by coarse grains, the stress concentration becomes prevailing, as evidenced by the increase in CV in Figure 12. This indicates a pronounced stress concentration with only a few contact points responsible for the transmission of external load. Meanwhile, many other contact points remain inactivated, contributing minimally to the structural integrity. This likely accounts for the observed reduction in the initial shear modulus up to e m i n T in Figure 11. Beyond this point (i.e., F C > 0.4), the force chain formed by fine particles becomes prevailing. According to Figure 13, the stress concentration within this structure gradually decreases, leading to a more uniformly distributed load across the specimen. Consequently, a larger number of contact points are engaged, enhancing the structure’s ability to withstand external loads. This shift is responsible for the increase in the initial shear modulus observed after reaching e m i n T .
The influence of the mean diameter ratio on the force chain is illustrated in both Figure 12 and Figure 14. In the overall trend, the increase in the mean diameter ratio amplifies the concentration of the contact force, further accentuating the disparity between the main and branch force chains. Meanwhile, this impact becomes increasingly pronounced as the fine content approaches the transitional state. When reaching the transitional fine content, the main soil skeleton is in a critical transitional state, dominated by both coarse grains and fine particles. Therefore, for the particle skeleton formed by the sand–fine mixture, an increase in the mean diameter ratio leads to a more pronounced force concentration at limited contacts.
To correlate the physical characteristics of sand–fine mixtures with their mechanical properties, it is necessary to establish a connection between the initial shear modulus and a physical parameter that can aptly reflect the strength of either the force chains or the main soil skeleton. The minimum void ratio, indicative of the densest state, serves as a direct measurement of the potential compactness under external stresses. As long as the introduction of fine particles alters the value of the minimum void ratio, the overall force chain certainly undergoes a remarkable change. Consequently, the minimum void ratio measured when F C = 0 can be used as a reference baseline, and the deviation from this baseline e m i n can be recorded at various F C values. This leads to the establishment of a functional relationship between them, as displayed in Figure 15. It is evident from the graph that there exists an obvious linear relation between G 0 and e m i n . The three functions all originate from the point F C = 0, and the magnitude of the slope increases as the mean diameter ratio becomes greater. The e m i n signifies the transformation of dominant particles within the skeleton. From the microscopic perspective, the increase in mean diameter ratio enhances the stress concentration with fewer activated contact points, amplifying its impact on G 0 . Combining Formula 5 and 6, the e m i n can be obtained by determining its mean diameter ratio, fine content, and minimum void ratio when F C = 0. Thus, it is feasible to determine the initial shear modulus through limited minimum void ratio tests and a grading curve.

4. Summary and Conclusions

This paper employed the DEM to investigate the influence of the fine content and mean diameter ratio on the minimum and maximum void ratios by using the rolling resistance linear model. The quadratic function was employed to describe the relationship between the minimum/maximum void ratios and fine content. By conducting small-strain triaxial shear DEM tests, the initial shear modulus of the sand–fine mixtures was analysed with the evolution of the minimum void ratio to establish the relationship between the mechanical and physical characteristics. The main findings are summarized as follows:
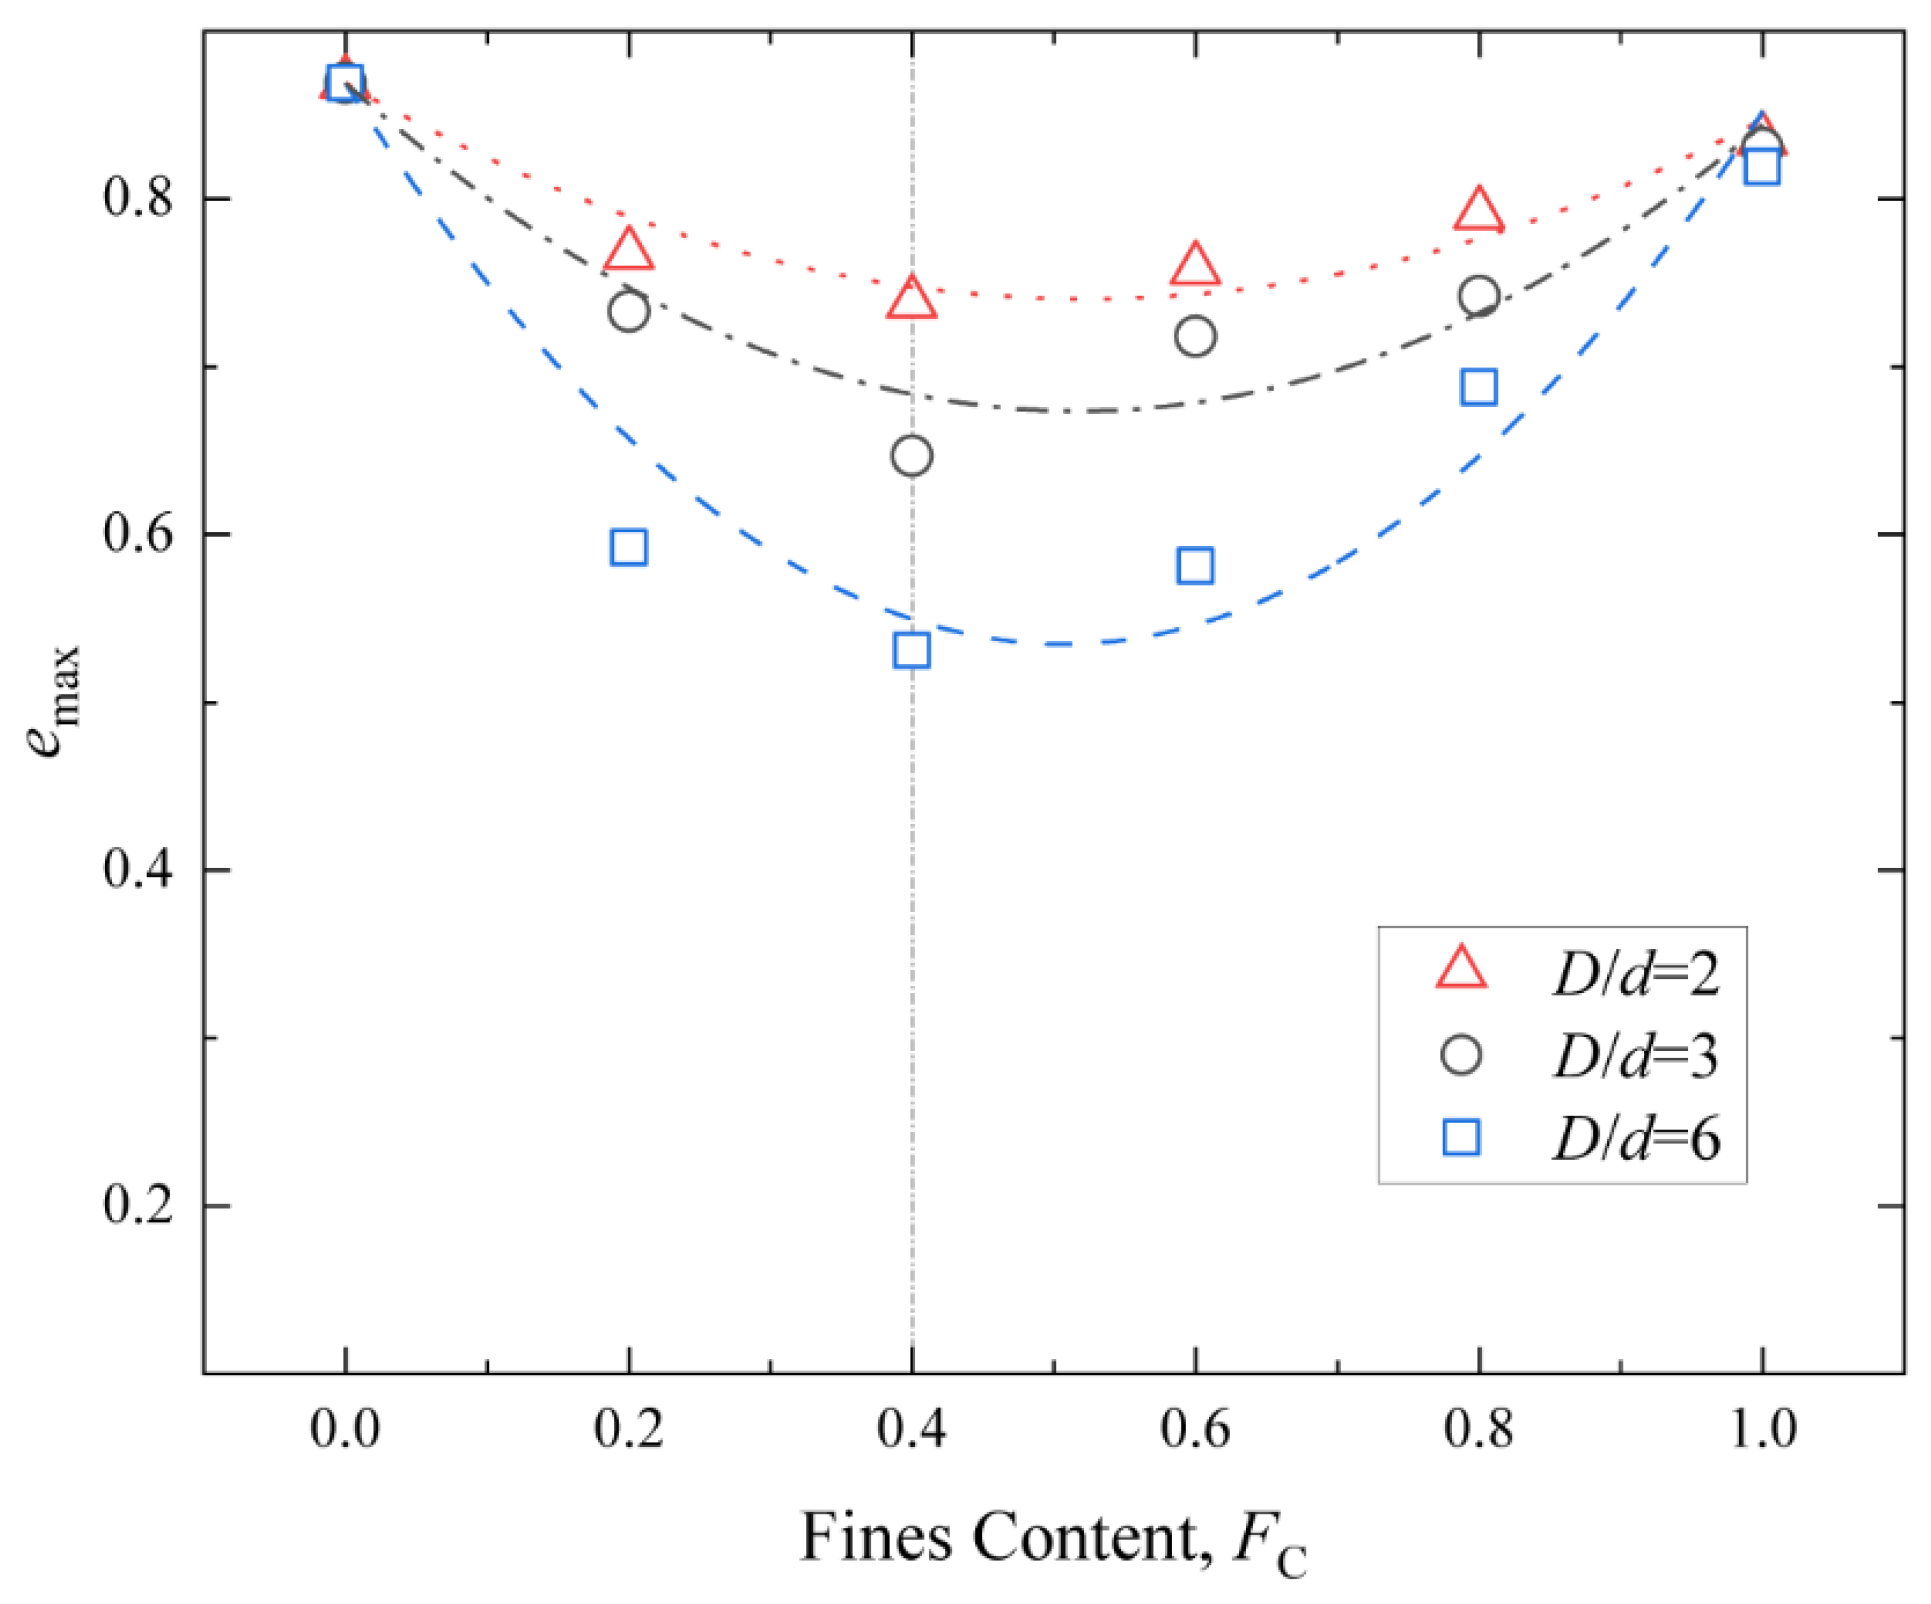
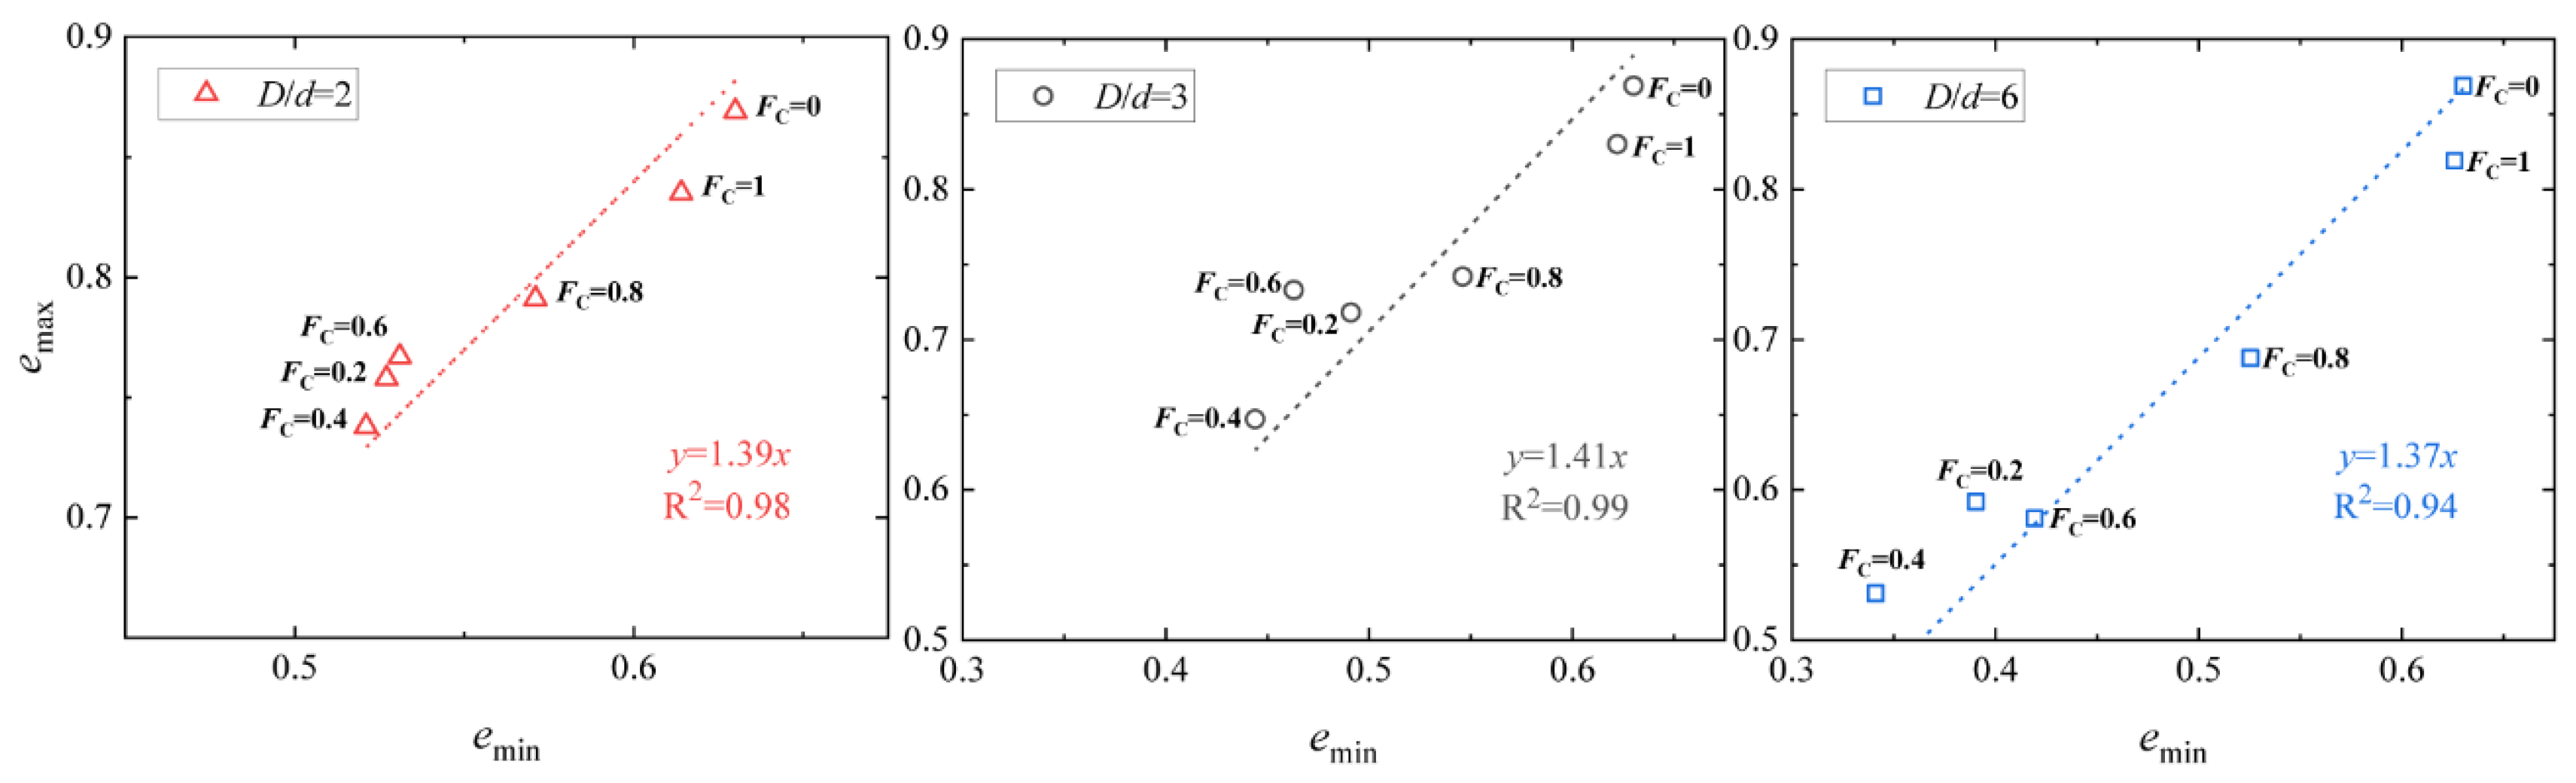
  • Both the minimum and maximum void ratios initially decrease as the fine content increases until they reach a transitional fine content. The relationship between maximum and minimum void ratios exhibits an obvious linear pattern regardless of the fine content and mean diameter ratio.
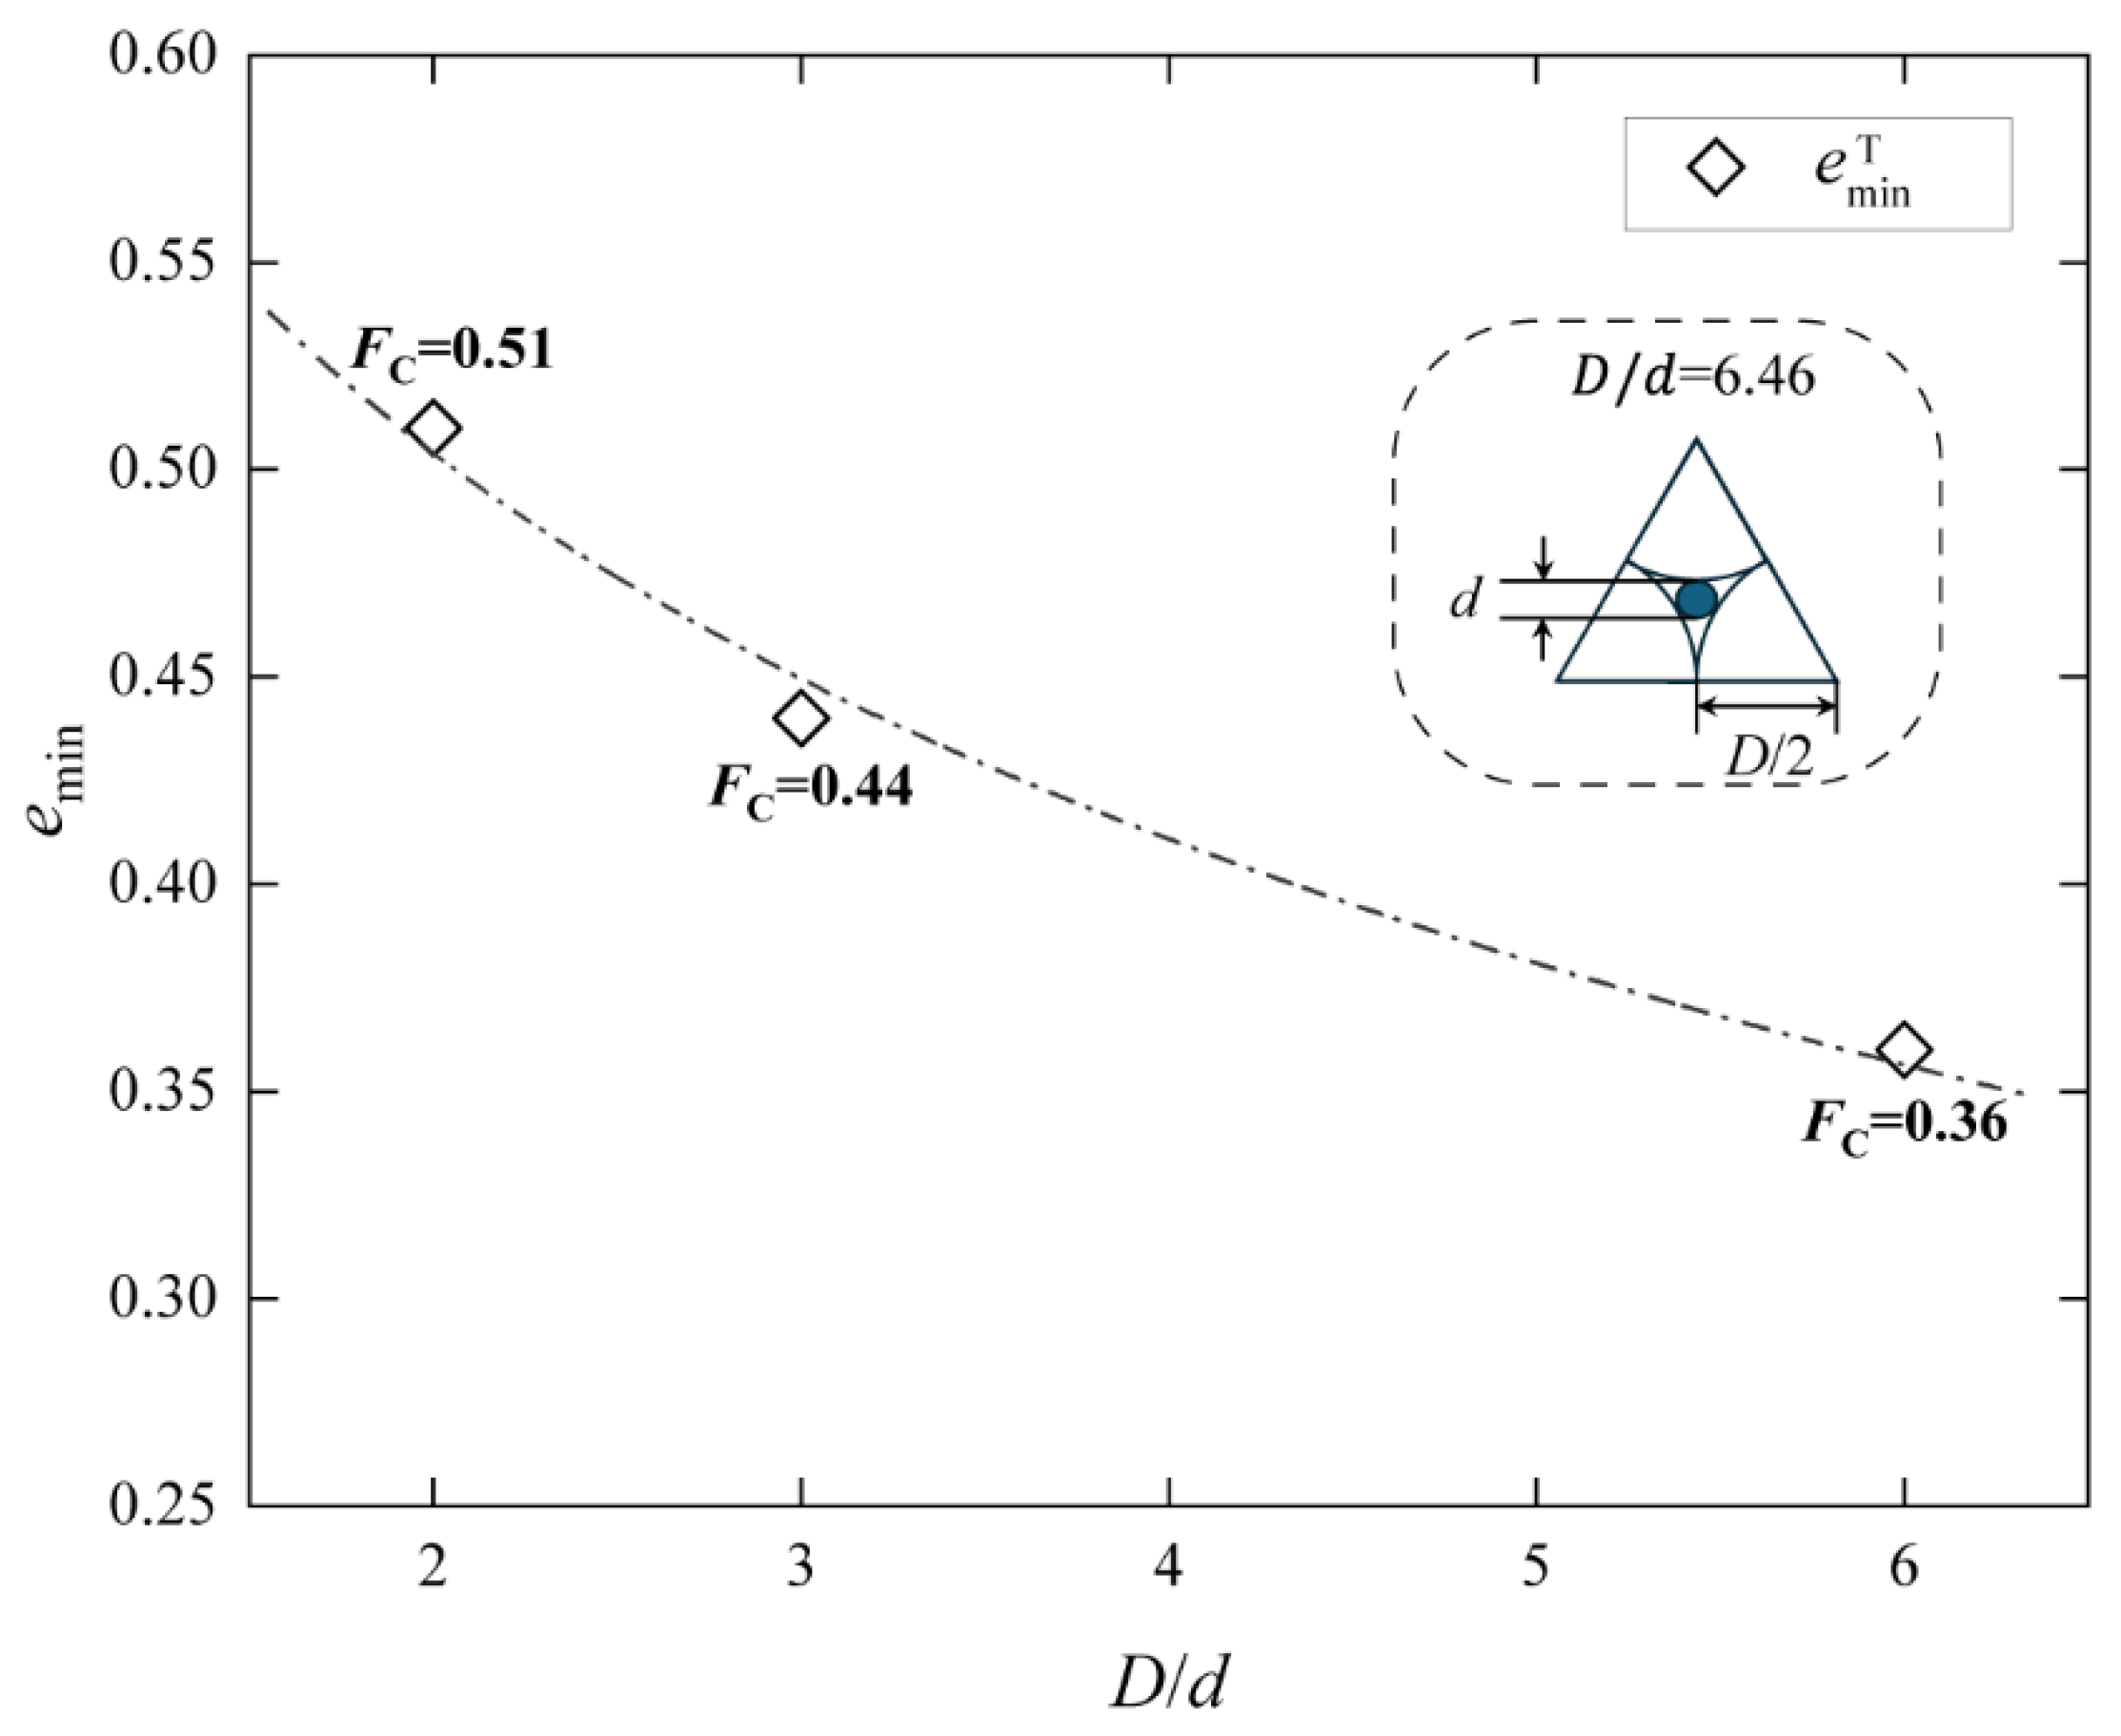
  • An increase in the mean diameter ratio corresponds to a decrease in both the minimum and maximum ratios. This trend loses its effect as the ratio approaches a critical value of 6.5. This suggests a bounded impact for the influence of the mean diameter ratio.
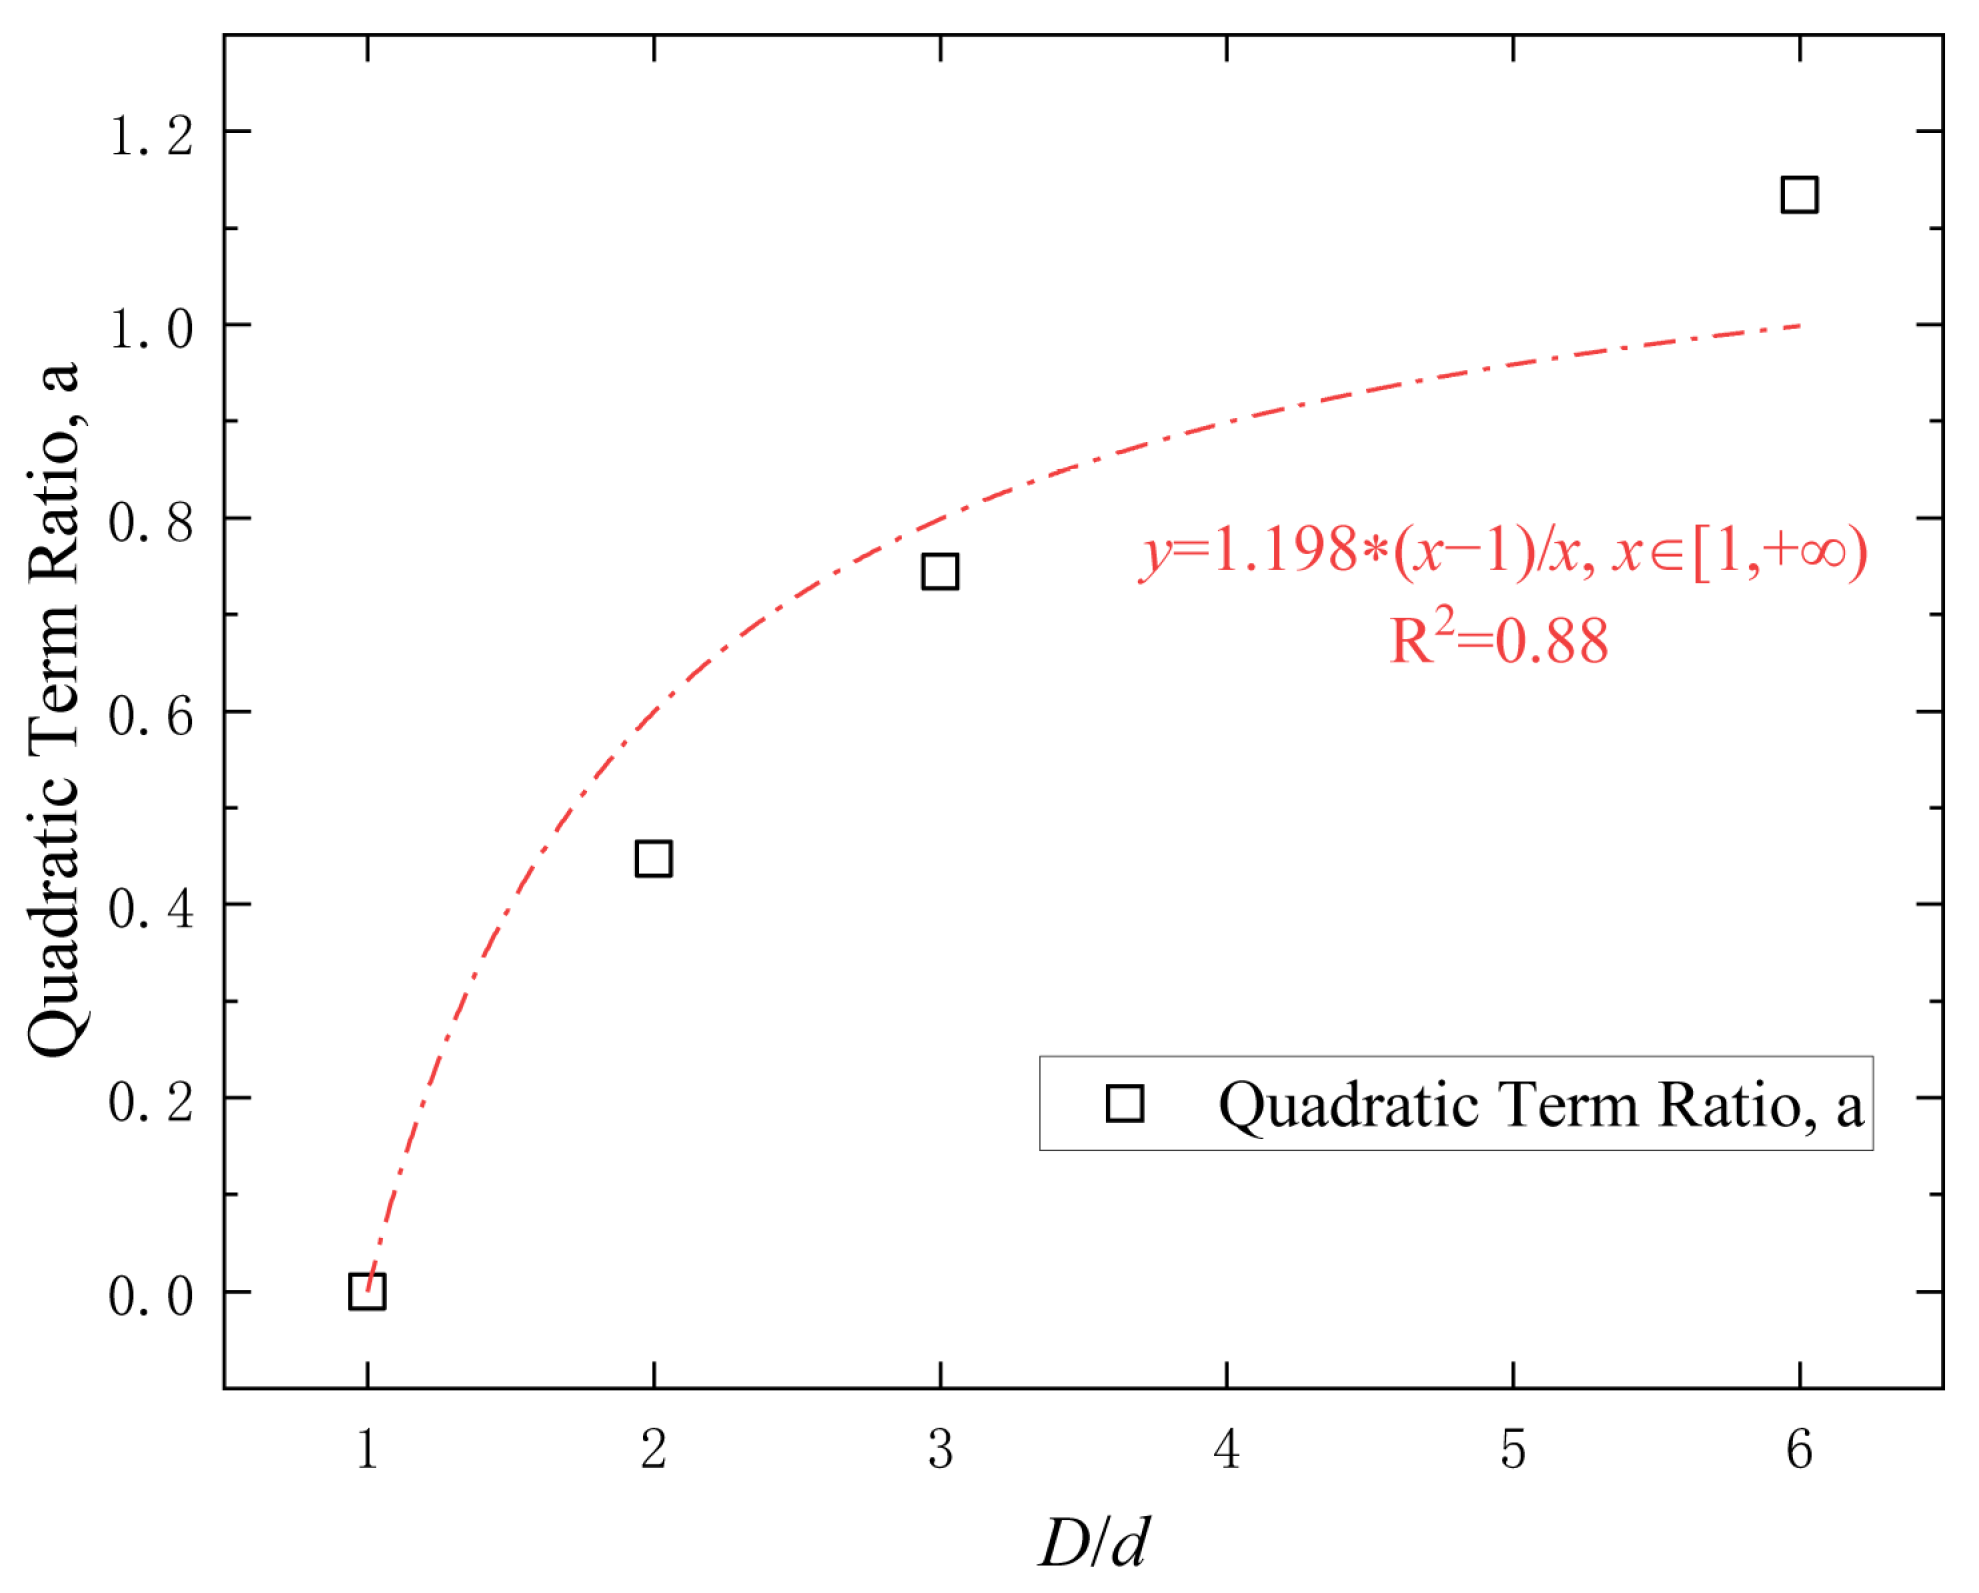
  • The evolution of the minimum void ratio follows a quadratic function characterized by a single fitting parameter. Due to the strong linear correlation between the minimum and maximum void ratios being independent of the fine content and the mean diameter ratio, the latter can be effectively predicted using this linear function.
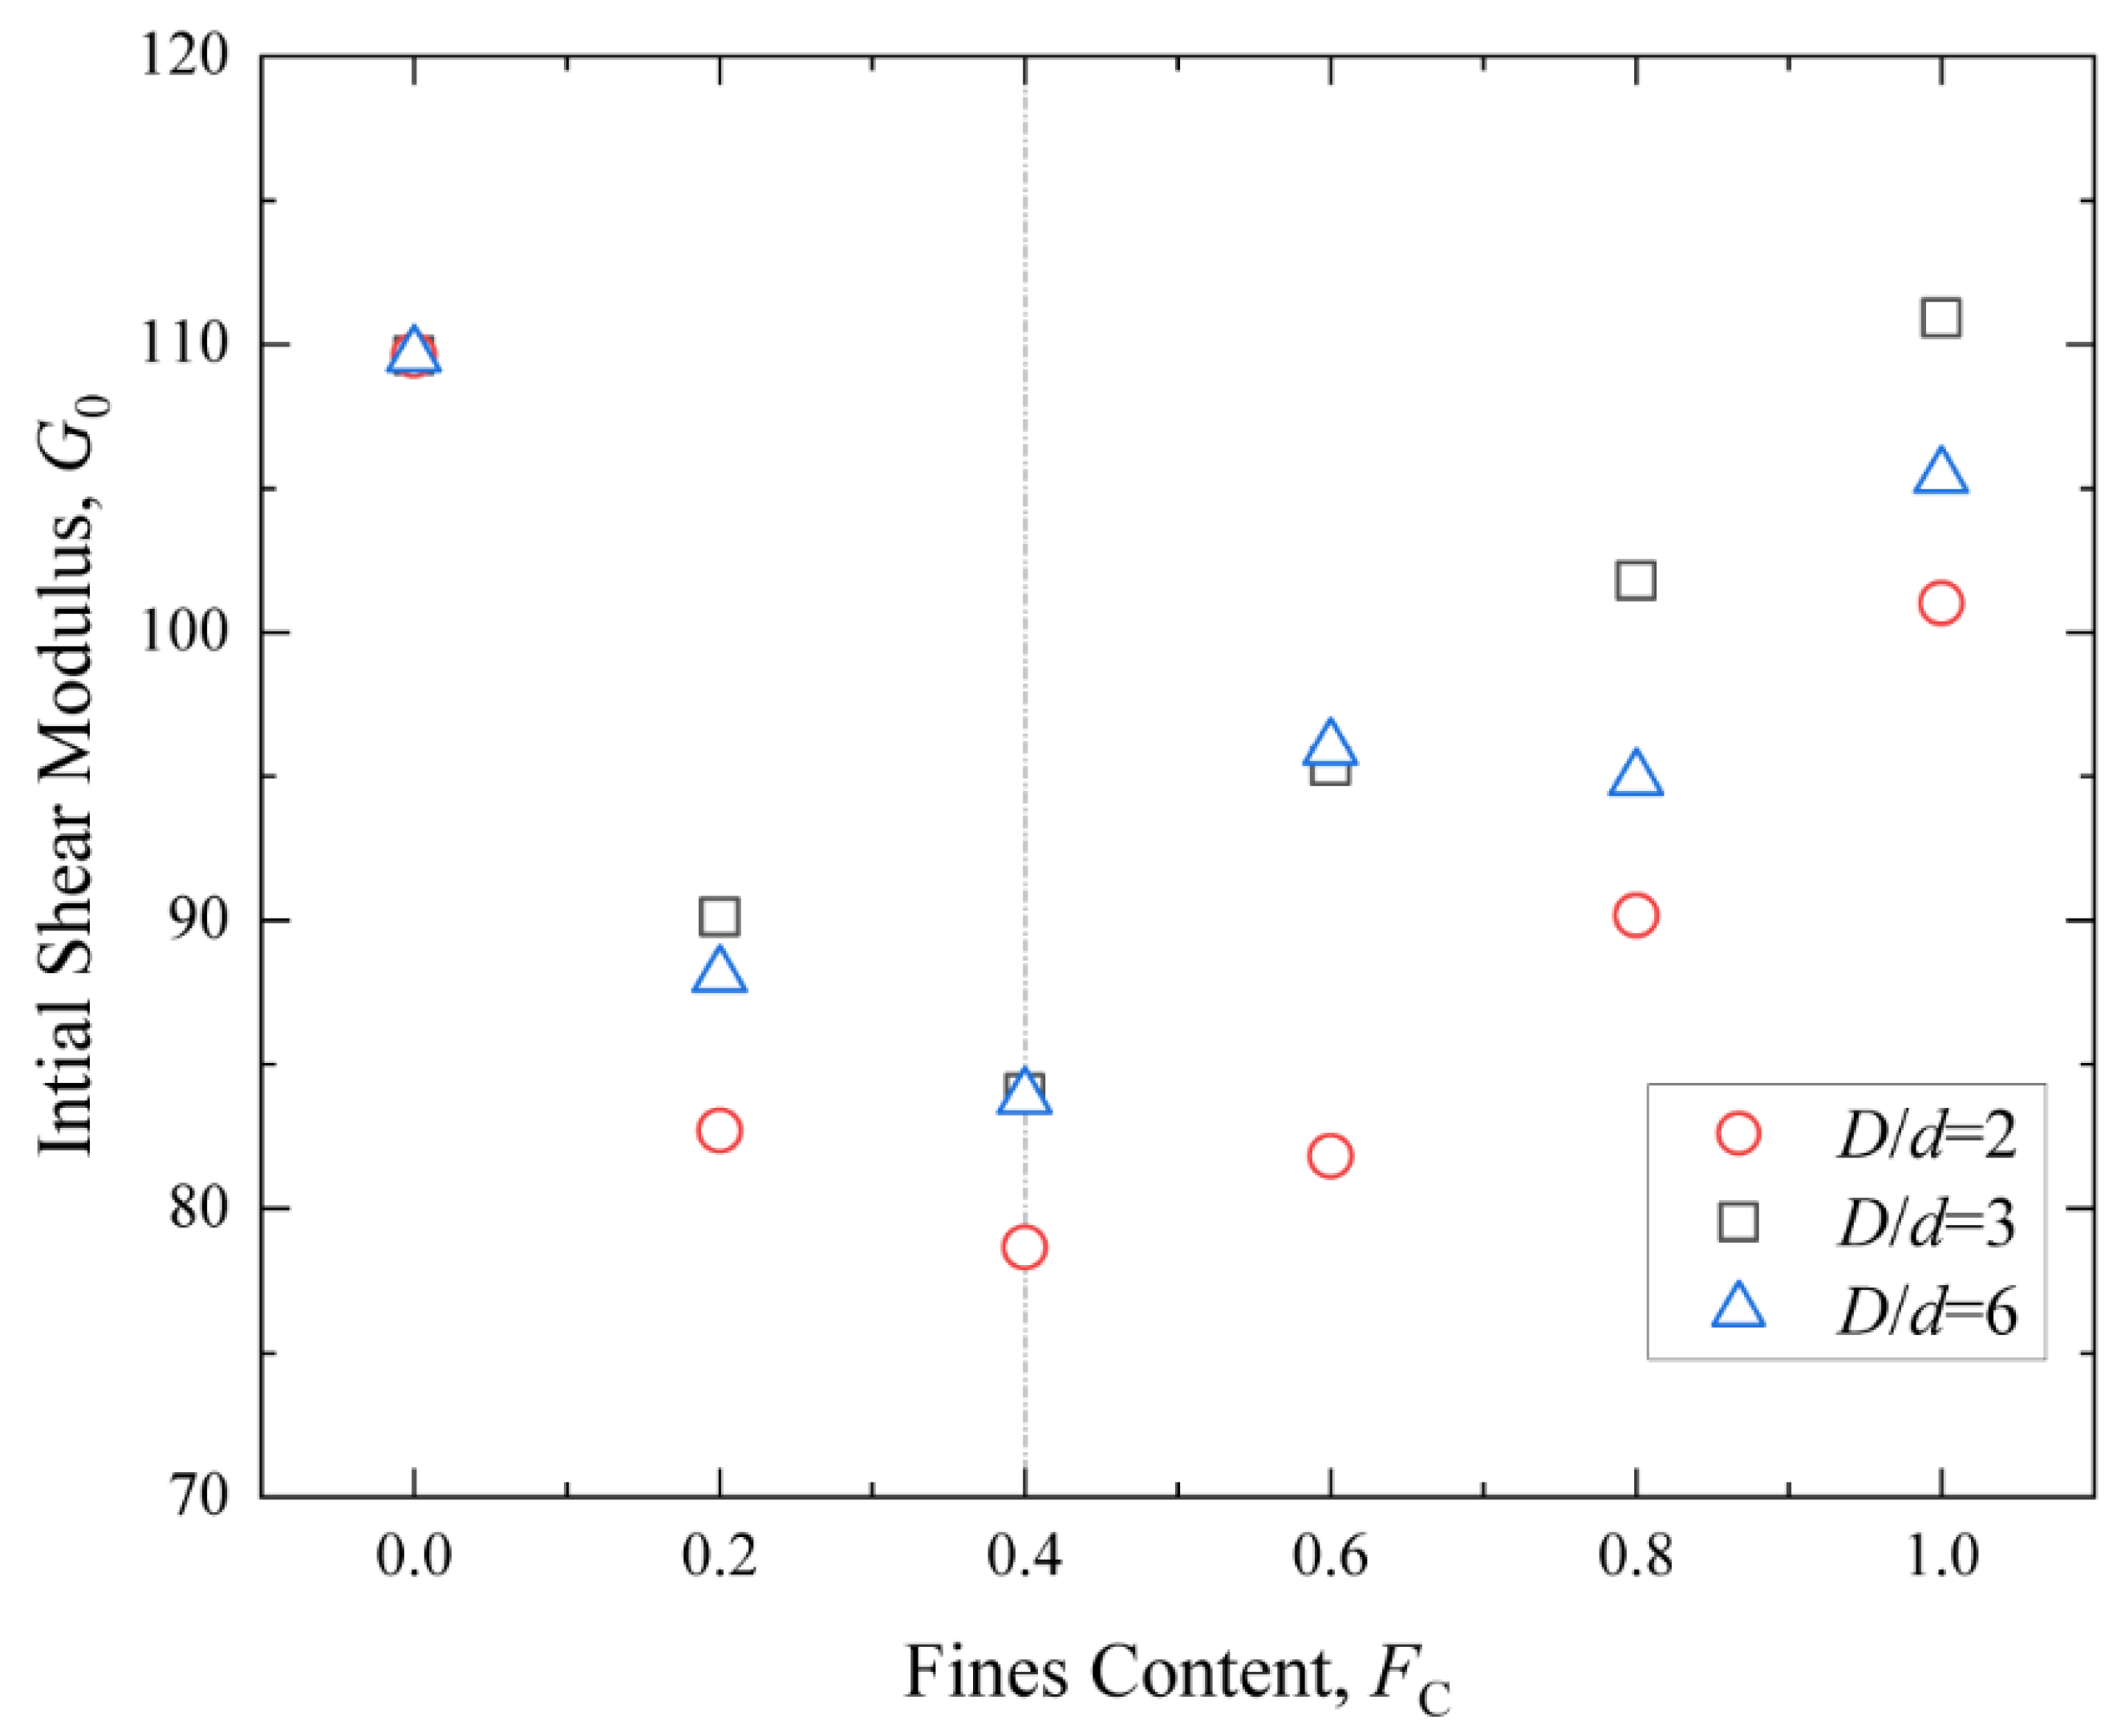
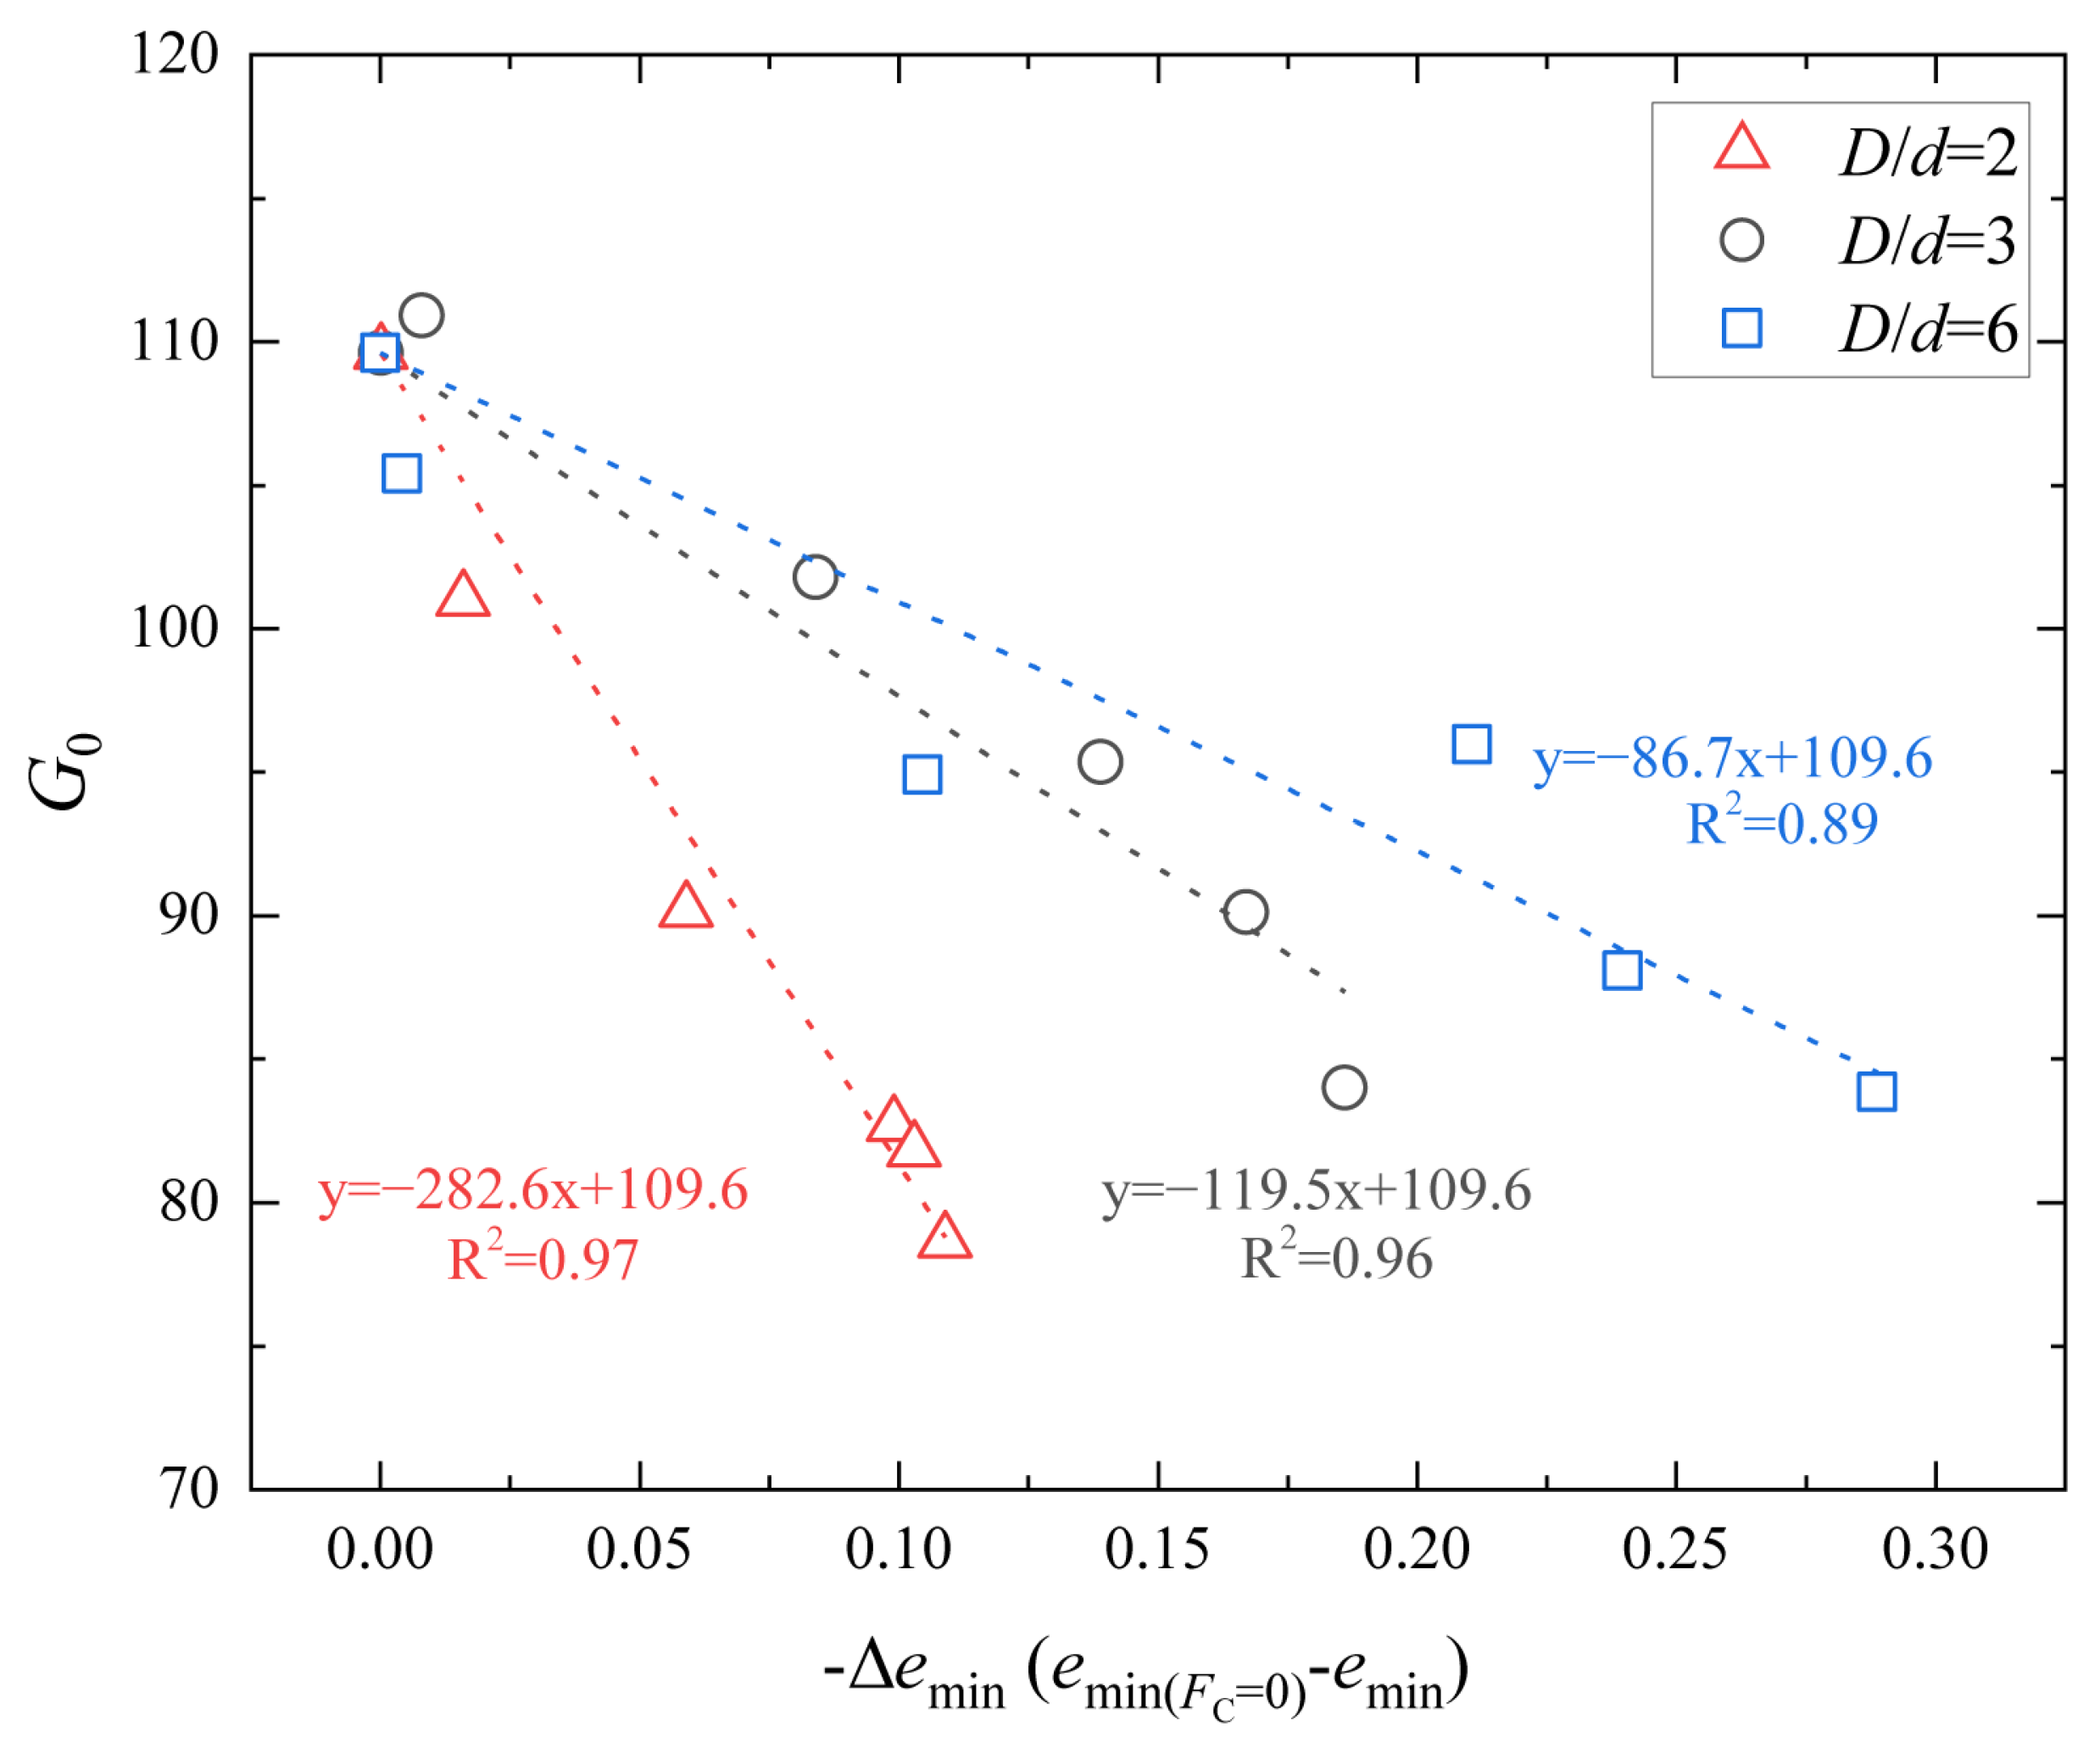
  • In parallel with the evolution of the maximum and minimum void ratios, the initial shear modulus equally demonstrates a trend that begins with an increase and subsequently declines. This trend is punctuated by a transitional fine content, delineating the above two distinct regimes.
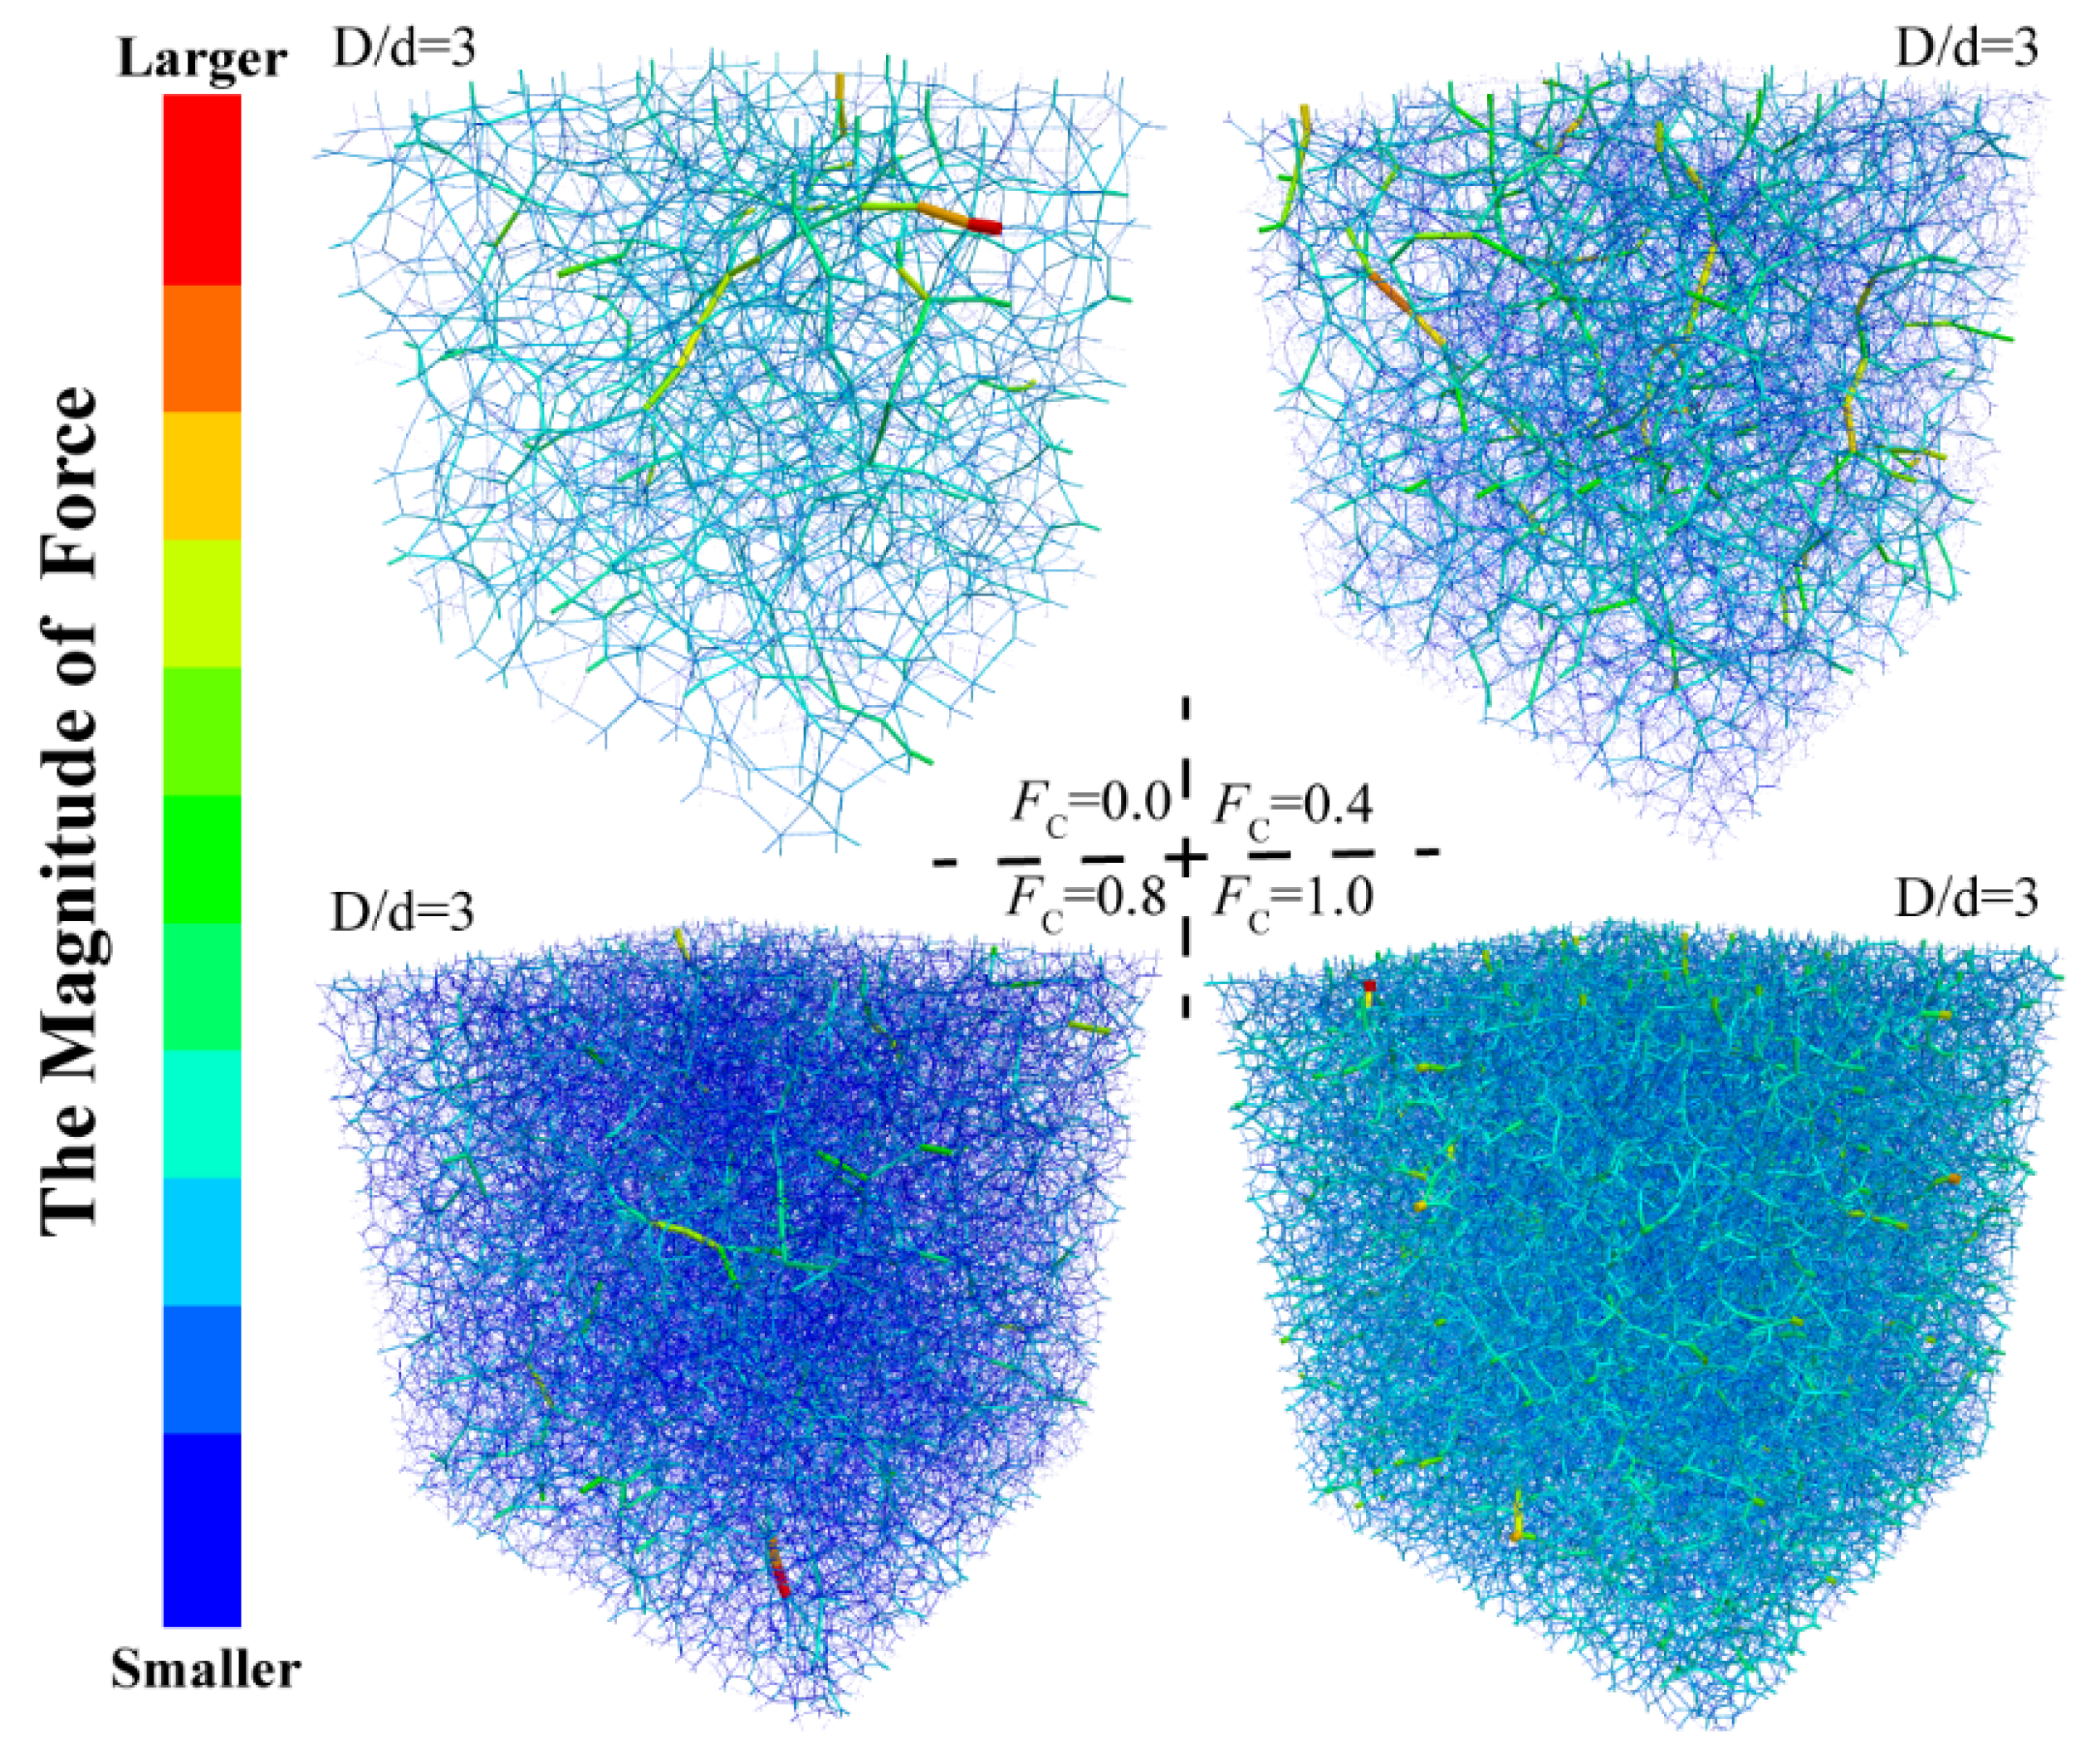
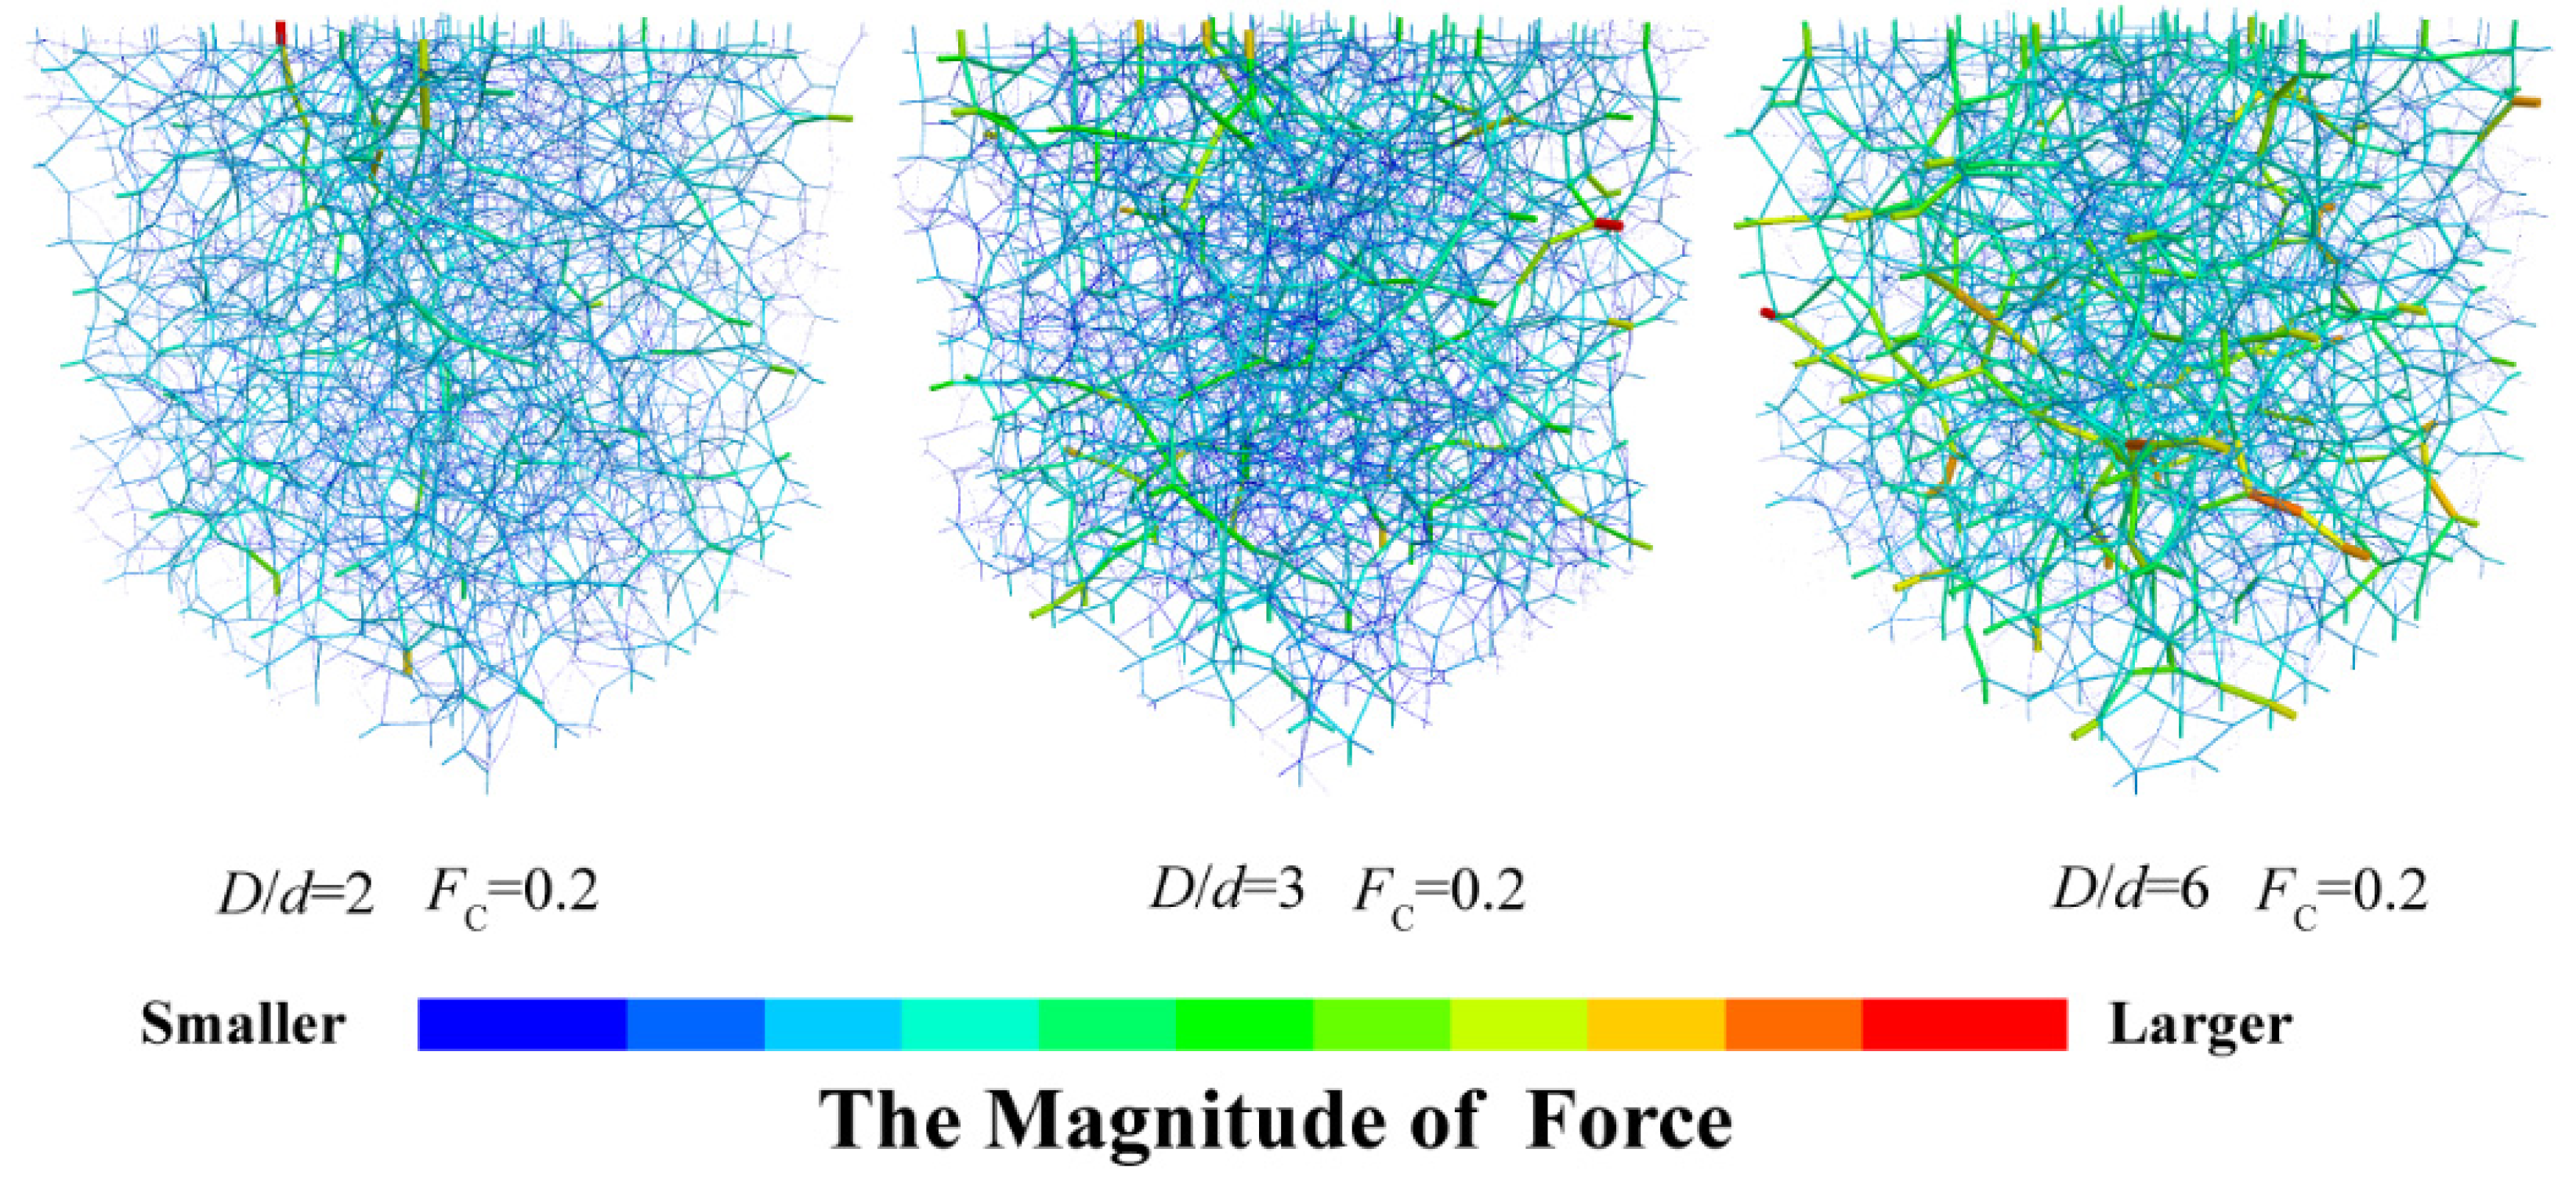
  • From the microscopic perspective, an increase in fine content leads to a transformation of the global force chain. While approaching the transitional fine content, the stress concentrates at limited contact points and the force chain thus becomes much more localized. This explains the initial decrease with the addition of fines ( F C < 0.4). With the further addition of fines ( F C > 0.4), fine particles prevail in the global force chain. At this stage, the addition of fine particles significantly enhances the homogeneity of the global chain. Because most particles contribute to these force chains, the initial shear modulus is consequently increased.
It is important to note that the contact model used in this study is uniform, meaning that the material properties of coarse and fine particles are identical. However, in real-world conditions, the materials of the two particle types in a mixture often differ, necessitating additional research. Additionally, the fitted quadratic equation obtained in this study applies to cohesionless mixtures, and additional research is required to verify its applicability in other scenarios.

Author Contributions

Conceptualization, H.Z. and Z.Z.; methodology, J.Z.; software, J.W.; validation, H.Z., Z.Z. and J.Z.; formal analysis, L.W.; investigation, Y.Z.; resources, J.L.; data curation, H.Z.; writing—original draft preparation, H.Z.; writing—review and editing, H.Z.; visualization, W.Y.; supervision, Z.Z.; project administration, Z.Z.; funding acquisition, Z.Z. All authors have read and agreed to the published version of the manuscript.

Funding

The financial support provided by the National Natural Science Foundation of China (Grant Nos. 42307190 and 41931286) is deeply acknowledged.

Data Availability Statement

The raw data supporting the conclusions of this article will be made available by the authors upon request.

Conflicts of Interest

The authors declare no conflicts of interest.

References

  1. Jebelli, J.; Meguid, M.A.; Sedghinejad, M.K. Excavation Failure during Micro-Tunneling in Fine Sands: A Case Study. Tunn. Undergr. Space Technol. 2010, 25, 811–818. [Google Scholar] [CrossRef]
  2. Cubrinovski, M.; Ishihara, K. Maximum and Minimum Void Ratio Characteristics of Sands. Soils Found. 2002, 42, 65–78. [Google Scholar] [CrossRef] [PubMed]
  3. Iwasaki, T.; Tatsuoka, F. Effects of Grain Size and Grading on Dynamic Shear Moduli of Sands. Soils Found. 1977, 17, 19–35. [Google Scholar] [CrossRef]
  4. Liu, X.; Yang, J.; Zou, D.; Li, Z.; Chen, Y.; Cao, X. Utilizing DEM and Interpretable ML Algorithms to Examine Particle Size Distribution’s Role in Small-Strain Shear Modulus of Gap-Graded Granular Mixtures. Constr. Build. Mater. 2024, 428, 136232. [Google Scholar] [CrossRef]
  5. Sarkar, D.; Goudarzy, M.; König, D.; Wichtmann, T. Influence of Particle Shape and Size on the Threshold Fines Content and the Limit Index Void Ratios of Sands Containing Non-Plastic Fines. Soils Found. 2020, 60, 621–633. [Google Scholar] [CrossRef]
  6. Cho, G.-C.; Dodds, J.; Santamarina, J.C. Particle Shape Effects on Packing Density, Stiffness, and Strength: Natural and Crushed Sands. J. Geotech. Geoenviron. Eng. 2006, 132, 591–602. [Google Scholar] [CrossRef]
  7. Chaney, R.; Demars, K.; Lade, P.; Liggio, C.; Yamamuro, J. Effects of Non-Plastic Fines on Minimum and Maximum Void Ratios of Sand. Geotech. Test. J. 1998, 21, 336. [Google Scholar] [CrossRef]
  8. Rahman, M.M.; Lo, S.R.; Gnanendran, C.T. On Equivalent Granular Void Ratio and Steady State Behaviour of Loose Sand with Fines. Can. Geotech. J. 2008, 45, 1439–1456. [Google Scholar] [CrossRef]
  9. Cabalar, A.F. The Effects of Fines on the Behaviour of a Sand Mixture. Geotech. Geol. Eng. 2011, 29, 91–100. [Google Scholar] [CrossRef]
  10. Zhu, Z.; Zhang, F.; Dupla, J.-C.; Canou, J.; Foerster, E. Investigation on the Undrained Shear Strength of Loose Sand with Added Materials at Various Mean Diameter Ratios. Soil Dyn. Earthq. Eng. 2020, 137, 106276. [Google Scholar] [CrossRef]
  11. Hang, T.; Fan, H.; Xiao, X.; Zhang, L.; Liang, K.; Wu, Q.; Chen, G. Prediction Model for Small-Strain Shear Modulus of Non-Plastic Fine–Coarse-Grained Soil Mixtures Based on Extreme Void Ratios. Soil Dyn. Earthq. Eng. 2024, 176, 108279. [Google Scholar] [CrossRef]
  12. Chang, C.S.; Wang, J.-Y.; Ge, L. Modeling of Minimum Void Ratio for Sand–Silt Mixtures. Eng. Geol. 2015, 196, 293–304. [Google Scholar] [CrossRef]
  13. Chang, C.S.; Wang, J.Y.; Ge, L. Maximum and Minimum Void Ratios for Sand-Silt Mixtures. Eng. Geol. 2016, 211, 7–18. [Google Scholar] [CrossRef]
  14. Polito, C.P. Correlations for Estimating Coefficients for the Prediction of Maximum and Minimum Index Void Ratios for Mixtures of Sand and Non-Plastic Silt. Geotechnics 2023, 3, 1033–1046. [Google Scholar] [CrossRef]
  15. De Larrard, F. Concrete Mixture Proportioning; CRC Press: Boca Raton, FL, USA, 1999; ISBN 978-1-4822-7205-5. [Google Scholar]
  16. Shen, C.; Liu, S.; Xu, S.; Wang, L. Rapid Estimation of Maximum and Minimum Void Ratios of Granular Soils. Acta Geotech. 2019, 14, 991–1001. [Google Scholar] [CrossRef]
  17. Belkhatir, M.; Schanz, T.; Arab, A. Effect of Fines Content and Void Ratio on the Saturated Hydraulic Conductivity and Undrained Shear Strength of Sand–Silt Mixtures. Environ. Earth Sci. 2013, 70, 2469–2479. [Google Scholar] [CrossRef]
  18. Selig, E.; Ladd, R. (Eds.) Evaluation of Relative Density Measurements and Applications. In Evaluation of Relative Density and Its Role in Geotechnical Projects Involving Cohesionless Soils; ASTM International: West Conshohocken, PA, USA, 1973; ISBN 978-0-8031-0081-7. [Google Scholar]
  19. Lo Presti, D.; Pedroni, S.; Crippa, V. Maximum Dry Density of Cohesionless Soils by Pluviation and by ASTM D 4253-83: A Comparative Study. Geotech. Test. J. 1992, 15, 180–189. [Google Scholar] [CrossRef]
  20. GB/T 50123; Standard for Soil Test Method. China Planning Press: Beijing, China, 2015.
  21. Reddy, N.S.C.; He, H.; Senetakis, K. DEM Analysis of Small and Small-to-Medium Strain Shear Modulus of Sands. Comput. Geotech. 2022, 141, 104518. [Google Scholar] [CrossRef]
  22. Cundall, P.A.; Strack, O.D.L. A Discrete Numerical Model for Granular Assemblies. Géotechnique 1979, 29, 47–65. [Google Scholar] [CrossRef]
  23. Zhao, J.; Zhu, Z.; Liu, J.; Zhong, H. Damping Ratio of Sand Containing Fine Particles in Cyclic Triaxial Liquefaction Tests. Appl. Sci. 2023, 13, 4833. [Google Scholar] [CrossRef]
  24. Zhao, J.; Zhu, Z.; Zhang, D.; Wang, H.; Li, X. Assessment of Fabric Characteristics with the Development of Sand Liquefaction in Cyclic Triaxial Tests: A DEM Study. Soil Dyn. Earthq. Eng. 2024, 176, 108343. [Google Scholar] [CrossRef]
  25. Zou, G.; Yang, B.; Yu, J.; Yang, S.; Chen, Q. Strength Formation and Failure Mechanism Analysis of Cement-Stabilized Laterite Granules Based on Numerical Simulation. Buildings 2023, 13, 3093. [Google Scholar] [CrossRef]
  26. Tan, X.; Qiu, Z.; Yin, X.; Hu, Y.; Liu, X.; Zeng, L. Effects of Particle Shape and Packing Density on the Mechanical Performance of Recycled Aggregates for Construction Purposes. Buildings 2023, 13, 2153. [Google Scholar] [CrossRef]
  27. Barnett, N.; Rahman, M.M.; Karim, M.R.; Nguyen, H.B.K.; Carraro, J.A.H. Equivalent State Theory for Mixtures of Sand with Non-Plastic Fines: A DEM Investigation. Géotechnique 2021, 71, 423–440. [Google Scholar] [CrossRef]
  28. Zhang, Z.; Xu, W.; Nie, W.; Deng, L. DEM and Theoretical Analyses of the Face Stability of Shallow Shield Cross-River Tunnels in Silty Fine Sand. Comput. Geotech. 2021, 130, 103905. [Google Scholar] [CrossRef]
  29. Gu, X.; Zhang, J.; Huang, X. DEM Analysis of Monotonic and Cyclic Behaviors of Sand Based on Critical State Soil Mechanics Framework. Comput. Geotech. 2020, 128, 103787. [Google Scholar] [CrossRef]
  30. Gu, X.; Huang, M.; Qian, J. DEM Investigation on the Evolution of Microstructure in Granular Soils under Shearing. Granul. Matter 2014, 16, 91–106. [Google Scholar] [CrossRef]
  31. Hardin, B.O.; Black, W.L. Sand Stiffness Under Various Triaxial Stresses. J. Soil Mech. Found. Div. 1966, 92, 27–42. [Google Scholar] [CrossRef]
  32. Viggiani, G.; Atkinson, J.H. Stiffness of Fine-Grained Soil at Very Small Strains. Géotechnique 1995, 45, 249–265. [Google Scholar] [CrossRef]
  33. Atkinson, J.H. Non-Linear Soil Stiffness in Routine Design. Géotechnique 2000, 50, 487–508. [Google Scholar] [CrossRef]
  34. Miwa, S.; Ikeda, T. Shear Modulus and Strain of Liquefied Ground and Their Application to Evaluation of The Response of Foundation Structures. Struct. Eng. Earthq. Eng. 2006, 23, 167s–179s. [Google Scholar] [CrossRef]
  35. Clayton, C.R.I. Stiffness at Small Strain: Research and Practice. Géotechnique 2011, 61, 5–37. [Google Scholar] [CrossRef]
  36. Chiaro, G.; Koseki, J.; Sato, T. Effects of Initial Static Shear on Liquefaction and Large Deformation Properties of Loose Saturated Toyoura Sand in Undrained Cyclic Torsional Shear Tests. Soils Found. 2012, 52, 498–510. [Google Scholar] [CrossRef]
  37. Yao, C.; Zhong, H.; Zhu, Z. Development of a Large Shaking Table Test for Sand Liquefaction Analysis. 2024. Available online: https://pubs.geoscienceworld.org/gsw/lithosphere/article/2024/2/lithosphere_2024_137/645133/Development-of-a-Large-Shaking-Table-Test-for-Sand (accessed on 9 September 2024).
  38. Benahmed, N. Comportement Mécanique d’un Sable Sous Cisaillement Monotone et Cyclique: Application Aux Phénomènes de Liquéfaction et Mobilité Cyclique. Ph.D. Theis, ENPC, Champs-sur-Marne, France, 2001. [Google Scholar]
  39. McGEARY, R.K. Mechanical Packing of Spherical Particles. J. Am. Ceram. Soc. 1961, 44, 513–522. [Google Scholar] [CrossRef]
Figure 1. Grain-size distribution curve of the mixture with varying mean diameter ratios and fine contents.
Buildings 14 02877 g001
Figure 2. Determination of the minimum void ratio in DEM.
Buildings 14 02877 g002
Figure 3. Determination of the maximum void ratio in DEM.
Buildings 14 02877 g003
Figure 4. The triaxial shear test in DEM.
Buildings 14 02877 g004
Figure 5. Comparison of effective stress paths obtained from the laboratory test and the DEM simulation [38].
Buildings 14 02877 g005
Figure 6. The impact of mean diameter ratio and fine content on minimum void ratio.
Buildings 14 02877 g006
Figure 7. The correlation between the transitional minimum void ratio and mean diameter ratio.
Buildings 14 02877 g007
Figure 8. The functional relationship between the quadratic team ratio and mean diameter ratio.
Buildings 14 02877 g008
Figure 9. The impact of mean diameter ratio and fine content on maximum void ratio.
Buildings 14 02877 g009
Figure 10. Correlation between the maximum void ratio and minimum void ratio.
Buildings 14 02877 g010
Figure 11. The impact of mean diameter ratio and fine content on initial shear modulus.
Buildings 14 02877 g011
Figure 12. The coefficient of variation in contact force with varying fine contents.
Buildings 14 02877 g012
Figure 13. The variation in force chain structure with fine content.
Buildings 14 02877 g013
Figure 14. The variation in force chain structure with mean diameter ratio.
Buildings 14 02877 g014
Figure 15. Correlation between the initial shear modulus and the deviation of minimum void ratio.
Buildings 14 02877 g015
Table 1. DEM model parameters with rolling resistance model.
Linear Group Particle–ParticleParticle–FacetUnity
Effective Modulus E * 1.0 × 1081.0 × 108Pa
Normal-to-Shear Stiffness Ratio κ * 2.02.0-
Friction Coefficient μ 0.550-
Dashpot Group
Normal Critical Damping Ratio β n 0.20.2-
Shear Critical Damping Ratio β s 0.20.2-
Dashpot Mode M d 33-
Rolling Resistance Group
Rolling Friction Coefficient μ r 0.200-
Table 2. The fitting function and parameters for the minimum void ratio.
D/dFitting Function ( F C [ 0 , 1 ] )abc R 2
2 e m i n = 0.44   ×   ( F C ) 2 0.45   ×   F C + 0.63 0.44−0.450.630.91
3 e m i n = 0.74   ×   ( F C ) 2 0.73   ×   F C + 0.63 0.74−0.730.630.86
6 e m i n = 1.13   ×   ( F C ) 2 1.10   ×   F C + 0.63 1.13−1.100.630.87
Table 3. The fitting function and parameters for the maximum void ratio.
D/dFitting Function ( F C [ 0 , 1 ] )abc R 2
2 e m a x = 0.46   ×   ( F C ) 2 0.49   ×   F C + 0.86 0.46−0.490.860.91
3 e m a x = 0.73   ×   ( F C ) 2 0.49   ×   F C   + 0.86 0.73−0.750.860.89
6 e m a x = 1.30   ×   ( F C ) 2 1.31   ×   F C + 0.86 1.30−1.310.860.91
Disclaimer/Publisher’s Note: The statements, opinions and data contained in all publications are solely those of the individual author(s) and contributor(s) and not of MDPI and/or the editor(s). MDPI and/or the editor(s) disclaim responsibility for any injury to people or property resulting from any ideas, methods, instructions or products referred to in the content.

