Article

Investigation of Synergistic Influence of Ultrasound and Co-Doping to Degrade Toluene from Polluted Air in Construction Sites—An Experimental Approach

by
Omid Akbarzadeh
1,2,3,
Yahya Rasoulzadeh
1,4,*,†,
Mohammad Haghighi
2,3,*,†,
Azadeh Talati
2,3 and
Hamed Golzad
5
1
Department of Occupational Health Engineering, Faculty of Health, Tabriz University of Medical Sciences, Tabriz, P.O. Box 51656-65811, Iran
2
Chemical Engineering Faculty, Sahand University of Technology, Sahand New Town, Tabriz P.O. Box 51335-1996, Iran
3
Reactor and Catalysis Research Centre (RCRC), Sahand University of Technology, Sahand New Town, Tabriz P.O.Box 51335-1996, Iran
4
Iranian Road Traffic Injury Research Centre, Tabriz University of Medical Sciences, Tabriz P.O. Box 51656-65811, Iran
5
School of Design and Built Environment, University of Canberra, Canberra 2617, Australia
*
Authors to whom correspondence should be addressed.
These authors contributed equally to this work.
Buildings 2024, 14(9), 2876; https://doi.org/10.3390/buildings14092876
Submission received: 5 August 2024 / Revised: 29 August 2024 / Accepted: 9 September 2024 / Published: 11 September 2024

Abstract

:
Background: Toluene exposure in construction workers can lead to several health problems, primarily affecting the nervous system, respiratory system, and skin. Utilizing advanced photocatalytic materials to degrade gaseous toluene aims to significantly mitigate its negative impact. Methods: In this research, photocatalysts based on pure TiO2 and modified TiO2 were synthesized to evaluate their efficacy in degrading gaseous toluene, a prevalent air pollutant in construction settings. Two synthesis methods were employed. Sonoprecipitation was used to create Fe-N co-doped TiO2 nanoparticles in the first method, while the second method utilized co-precipitation and hydrothermal techniques without ultrasonic assistance to achieve Fe-N co-doping. Seven types of nanophotocatalysts were synthesized, including TiO2-U (with ultrasonic assistance), NTiO2-U, FeNTiO2 (2.5)-U, FeNTiO2 (5)-U, FeNTiO2 (7.5)-U, FeNTiO2 (10)-U, and FeNTiO2 (5) without ultrasonic assistance. Characterization of the synthesized photocatalysts involved various analyses, including XRD, SEM, EDX, UV–VIS DRS, FT–IR, BET, and N2 adsorption-desorption isotherm. Results: Ultrasonic assistance notably improved particle dispersion and prevented agglomeration on the photocatalyst surface. UV–VIS DRS analysis indicated a reduction in band gap energy due to Fe and N doping of TiO2. The study also investigated the influence of Fe doping, initial toluene concentration, light source, and residence time on the degradation rate of gaseous toluene. Experimental findings showed that FeNTiO2 (5)-U exhibited a higher degradation rate of toluene (63.5%) compared to FeNTiO2 (5) (50%) under visible light irradiation over 15 s. Conclusions: The study underscores the significant enhancement in photocatalytic activity for toluene degradation achieved through the combined effects of ultrasound and co-doping methods.

1. Introduction

Due to industrial growth, the presence of air pollutants, such as volatile organic compounds (VOCs) and polycyclic aromatic hydrocarbons (PAHs), has risen in both environmental and workplace settings. [1,2,3]. Petroleum refineries and storage facilities, residential heating systems, the use of solvents in construction and cleaning agents, as well as tobacco smoke, constitute the primary sources of these pollutants [4,5,6,7]. Toluene, utilized in the production of various chemical compounds that are used widely in the construction process, such as paints, coatings, adhesives, sealants, waterproofing products, and polishing agents, represents a type of volatile organic compound (VOC) that poses risks to both humans and the environment [8,9,10,11]. Toluene vapors can be harmful when inhaled, leading to dizziness, headaches, and more severe neurological damage with prolonged exposure. Studies show that both acute and chronic exposure to toluene affects the central nervous system, leading to encephalopathy, cerebellar dysfunction, and other neurotoxic effects. Additionally, prolonged or repeated skin contact can cause irritation and dermatitis. The skin, being a route of exposure, absorbs toluene, which can lead to local and systemic toxic effects, emphasizing the importance of protective measures [12]. Furthermore, improper disposal and spillage can lead to soil and water contamination, posing risks to wildlife and ecosystems. Toluene’s persistence in the environment and its toxicological profile make it a significant environmental pollutant [13].
Various techniques exist for removing pollutants, like toluene and benzene, from workplace air streams. Ideally, pollutants should be eliminated at source in the production process; when this is not feasible, workplace health and safety (WHS) management methods, such as engineering control, including ventilation, must be employed to degrade air pollutants. One method that has garnered significant interest among researchers is photocatalytic degradation. This process uses semiconductors, such as TiO2-based photocatalysts, to break down air pollutants through photocatalysis [14,15,16,17]. TiO2 is widely recognized as a high-performance photocatalyst extensively employed for degrading air pollutants, treating wastewater, and eliminating residual pesticides, among other applications [18,19,20]. TiO2 will be active when exposed to UV light because it has a high-energy band gap (3.2 eV), so this is the main drawback of the TiO2 photocatalyst. Therefore, to enhance photocatalyst efficiency in the visible light region, some metals, such as Fe, Co, Mn [21,22,23], and non-metals, such as N, S and C [24,25,26], can be doped into photocatalyst structures.
Introducing metal ions into TiO2 traps electrons or holes, altering the recombination rate of electron–hole pairs [27]. Iron atoms have been regarded as suitable among various transition metals because the ionic radius of iron is closely matched with that of titanium. This similarity allows Fe3+ ions to effectively integrate into the crystal lattice of TiO2 [28]. Another limitation of TiO2 photocatalysts is the rapid recombination of charge carriers, which occurs within nanoseconds in the absence of promoters [29]. Therefore, iron-doped TiO2 mitigates the recombination of electron–hole pairs and enhances the photocatalytic activity [30,31]. Furthermore, researchers are increasingly focusing on the ultrasonic method for synthesizing photocatalysts [32,33,34]. This approach is beneficial for producing both amorphous and crystalline photocatalysts at the nanoscale, thereby enhancing photocatalytic activity in the visible light spectrum. [34,35]. Ultrasonic waves generate regions of high and low pressure, resulting in the collapse of cavities. This process creates localized hot spots of high temperature and pressure, facilitating the thorough mixing of elements at the nanoscale. Additionally, the formation and collapse of cavitation bubbles induce shock waves that break down particle aggregates and reduce particle size. [36,37,38].
Recent studies have demonstrated that doping TiO2 with non-metal atoms from the P block of the periodic table shifts its optical absorption edge to lower energies. This enhancement is expected to improve photocatalytic efficiency in the visible light spectrum [39,40]. To put it differently, introducing oxygen vacancies by substituting lattice oxygen with elements from the P block, particularly through N-doping, reduces the band gap energy of TiO2. This modification enhances the photocatalytic degradation efficiency under visible light conditions [41,42,43,44]. This has been explained as due to a similar atomic size to oxygen, small ionization energy and high stability [45].
The surface area, particle size, band gap energy, and crystalline structure of a photocatalyst, along with factors such as light intensity, pH, water vapor, and temperature, significantly influence the enhancement of photocatalytic degradation rates. Research highlights the critical role of the elemental composition in photocatalytic activity, underscoring that synthesis conditions are crucial for determining catalyst properties. The method of synthesis directly affects the doping status of ions within the catalyst. [46,47,48]. Various synthesis methods, including sol–gel, hydrothermal, precipitation, and ultrasonic techniques, are available for producing photocatalysts. In catalyst synthesis, the sol–gel method offers high accuracy and uniformity but incurs higher costs and longer operation times, while the hydrothermal technique, though less expensive and faster, faces implementation difficulties due to stringent reaction conditions; precipitation is cost-effective and simple but may suffer from lower precision, and ultrasonic techniques provide rapid processing and enhanced dispersion at the expense of potential equipment-related challenges. In certain cases, combinations of two or three methods may be employed to synthesize a photocatalyst [49,50,51,52].
To address the shortcomings of the previous methods, this study aims to utilize ultrasound-assisted co-precipitation and hydrothermal methods to synthesize Fe-N co-doped TiO2 photocatalysts and investigate the impact of ultrasound assistance on photocatalyst characterization and activity. In this study, the photocatalytic efficiency of both pure TiO2 and modified TiO2 are evaluated by their ability to degrade gaseous toluene under both ultraviolet and visible light irradiation conditions. Finally, the main contributions to the body of knowledge and practice can be listed as:
  • The setting up of a continuous air purification reactor suitable for the real conditions of working environments;
  • Increasing the contact surface of the pollutant with the photocatalyst and the retention time by creating sloping surfaces;
  • Synthesis of a photocatalytic with better properties using an ultrasonic bath technique;
  • Achieving a high rate of toluene degradation under continuous conditions;
  • Improvement of photocatalyst performance under visible light compared to ultraviolet light.

2. Materials and Methods

2.1. Materials

TiCl4 was employed as the titanium precursor for synthesizing TiO2, HMT (hexamethylenetetramine) served as the nitrogen source, iron nitrate nonahydrate (Fe(NO3)3·9H2O) was used as the iron source, and a 25% ammonia solution was utilized for precipitation. All materials were either purchased from or produced by Merch Company (Los Angeles, CA, USA).

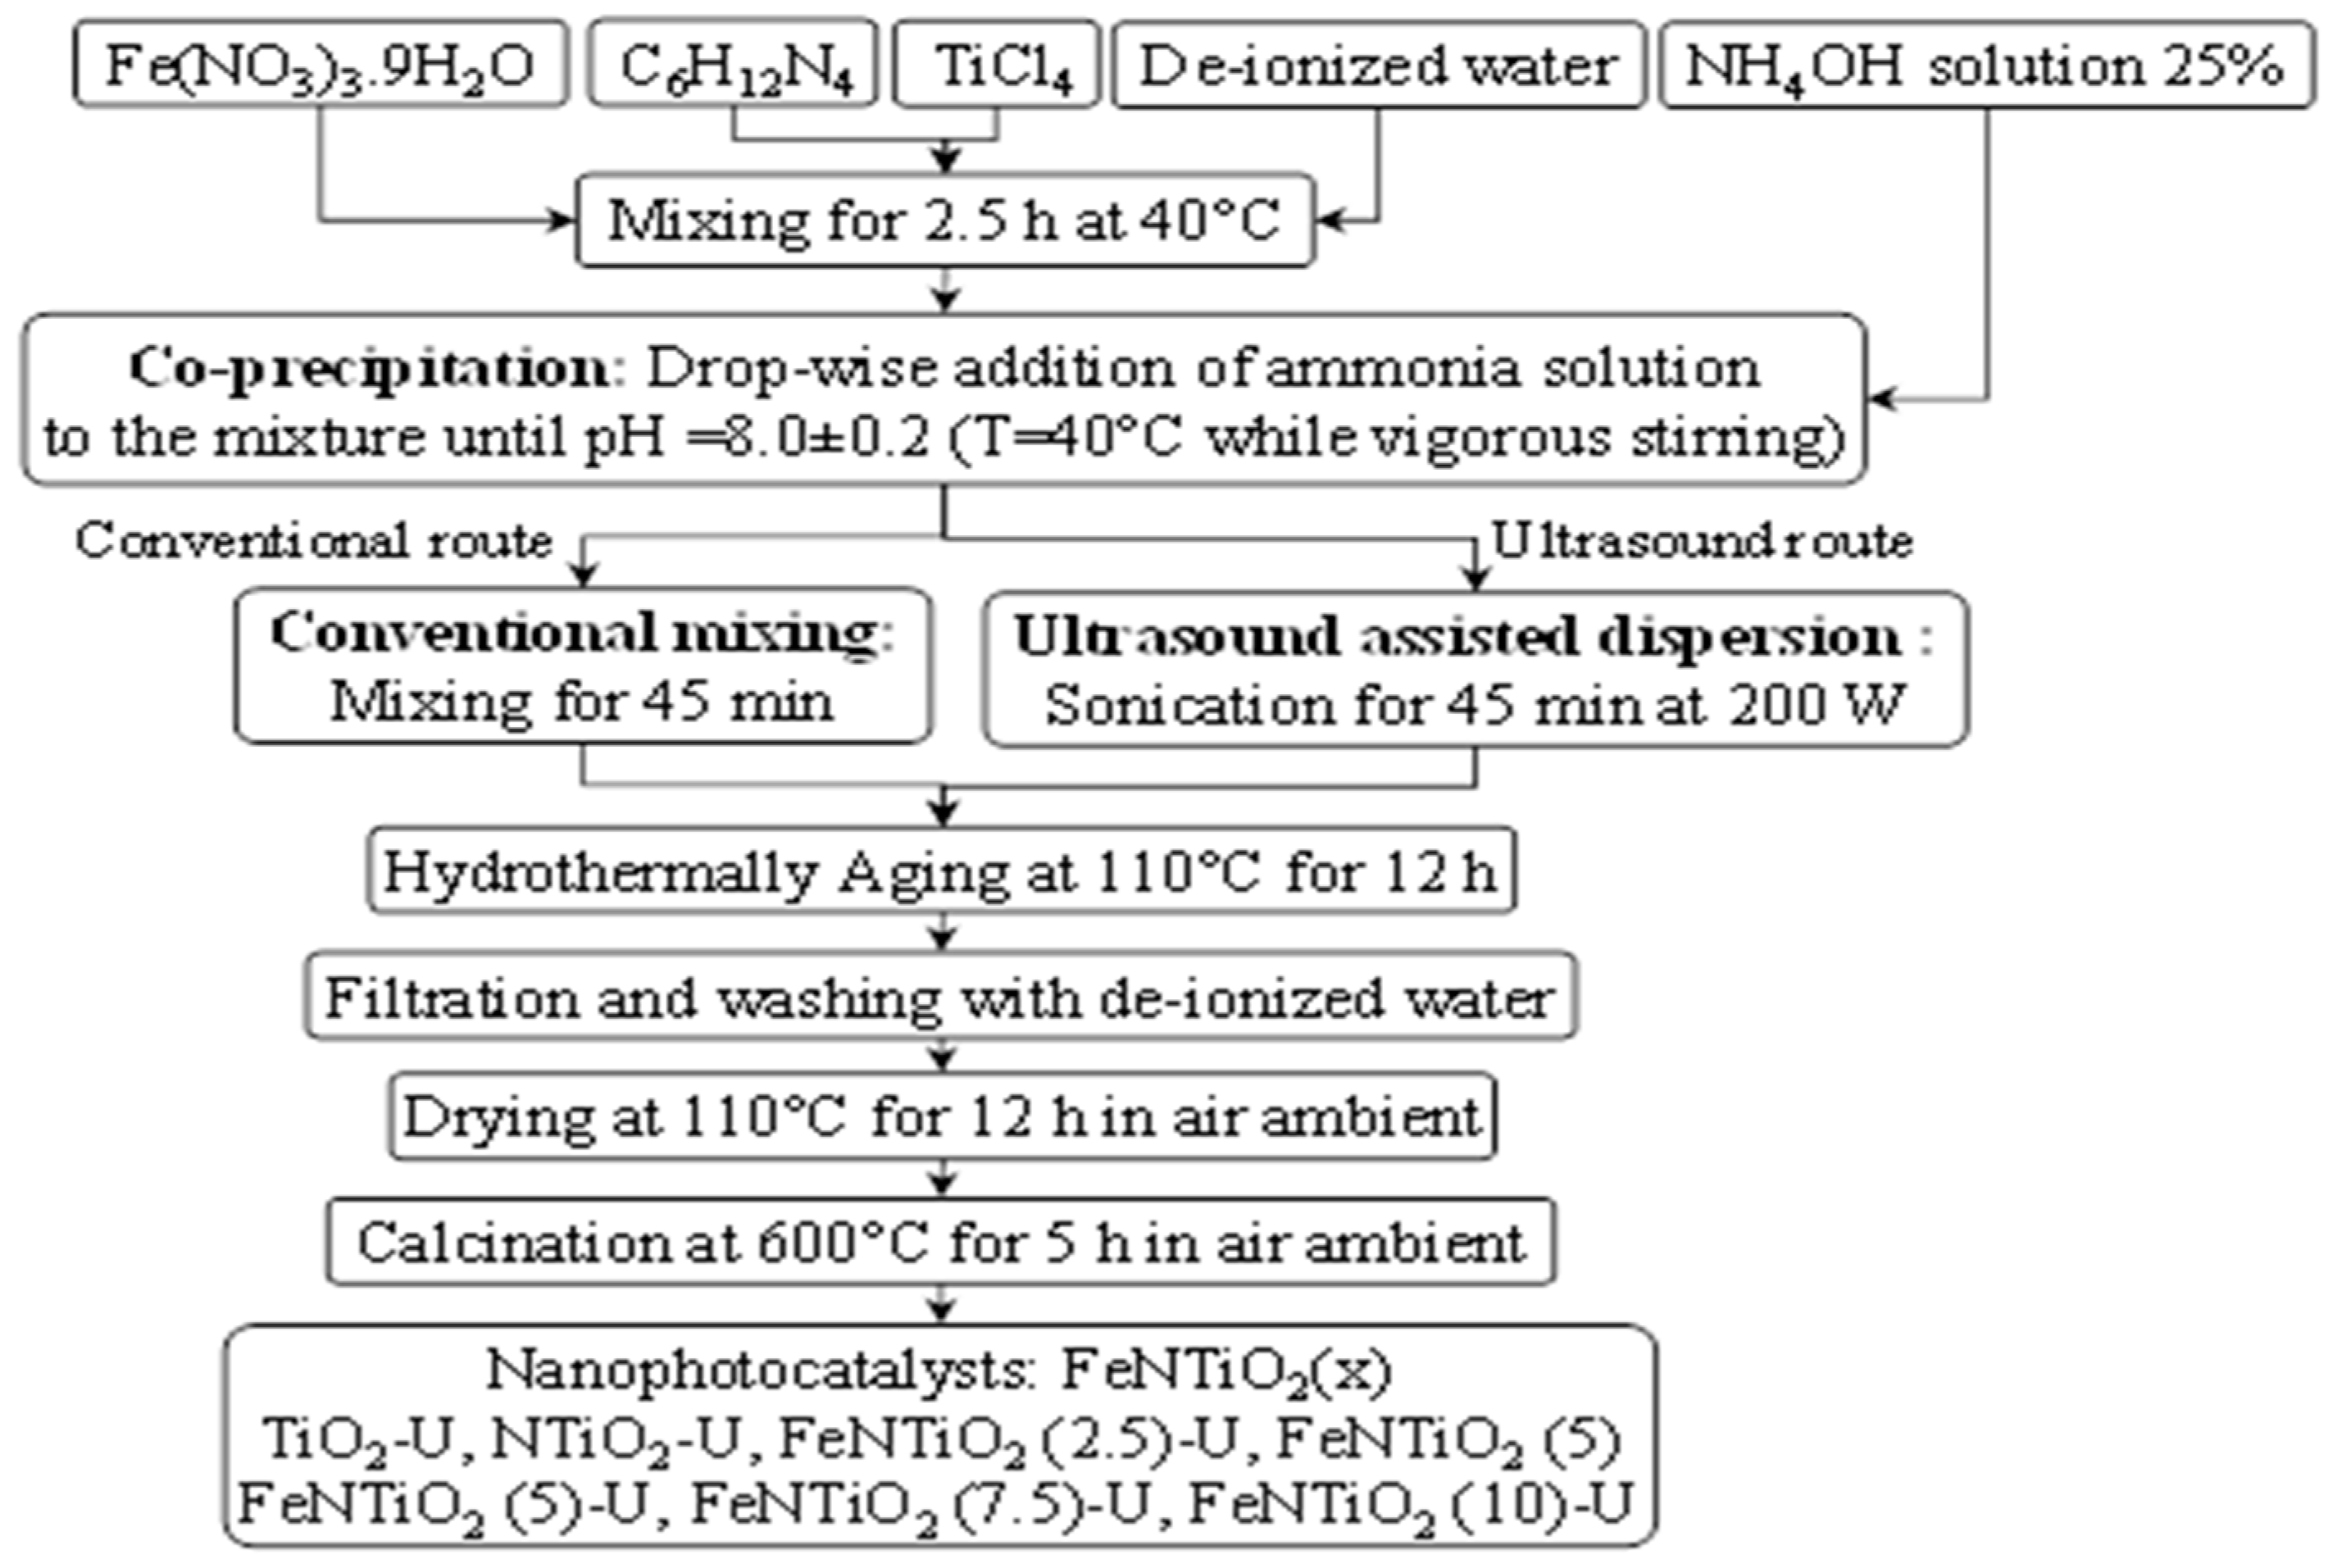
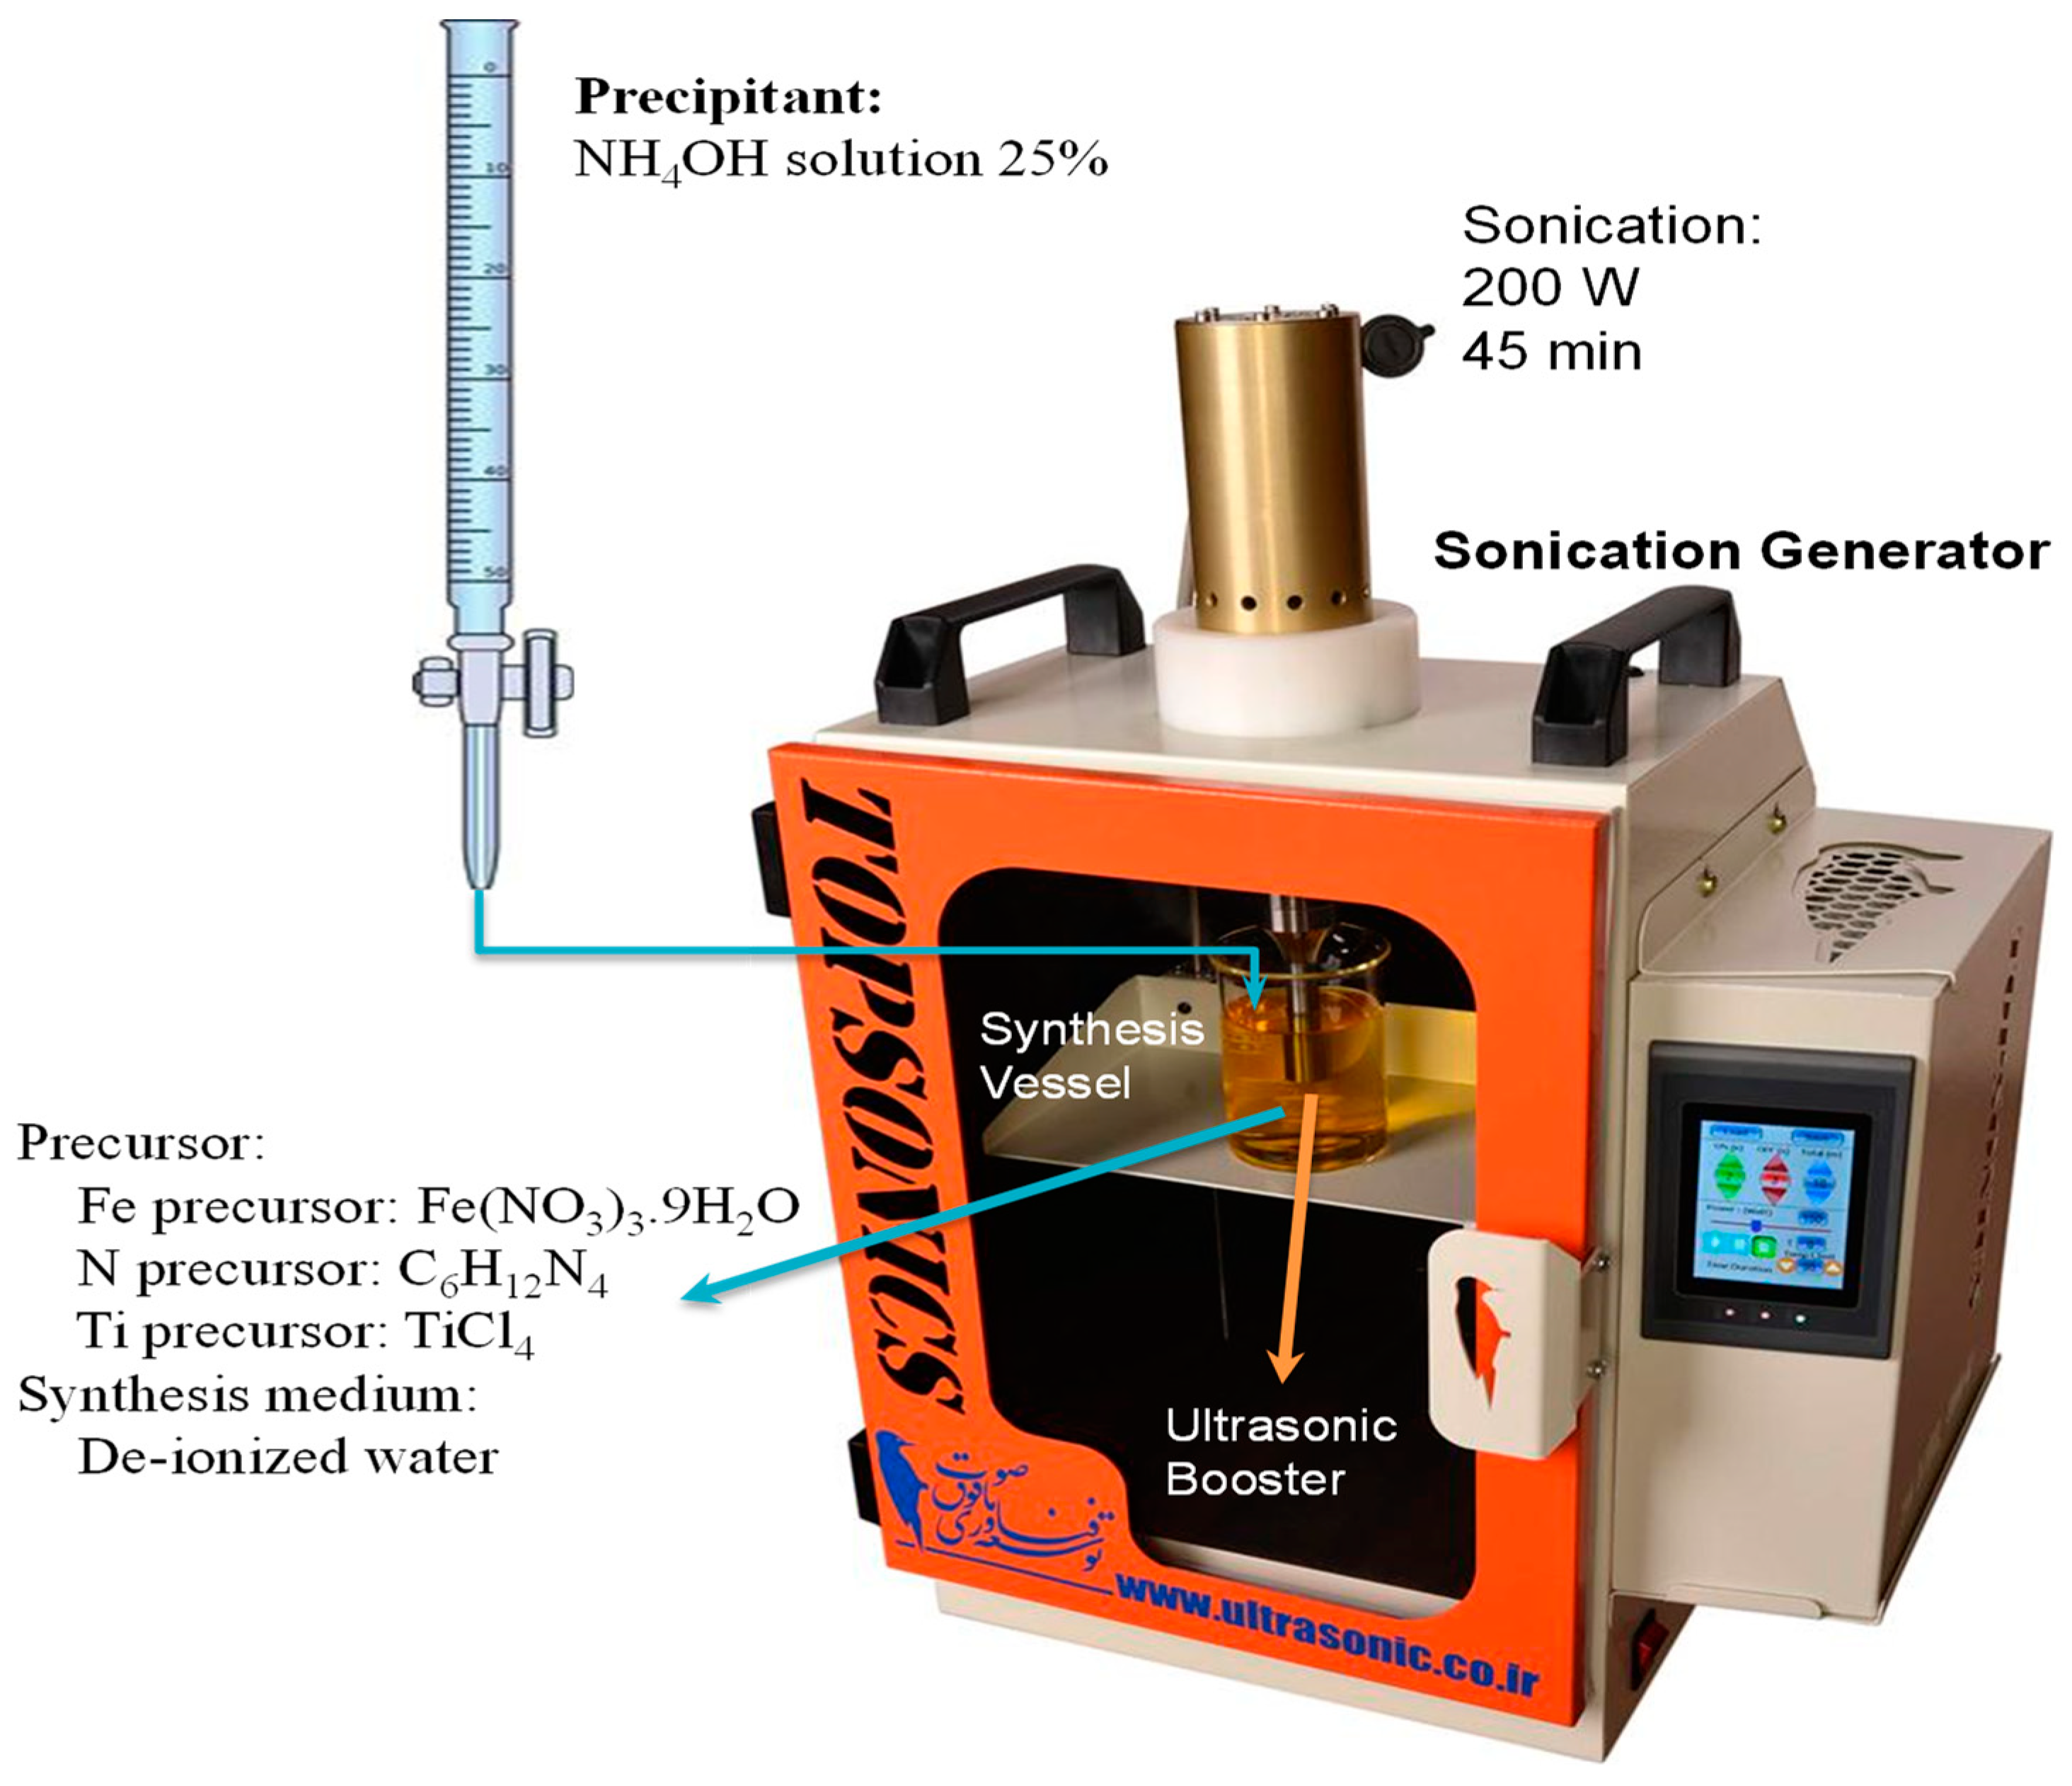
2.2. Nanophotocatalyst Preparation Procedure

As depicted in Figure 1, the samples were synthesized using two methods. In the first approach, Fe-N co-doped TiO2 nanoparticles were prepared via sonoprecipitation. The second method involved synthesizing Fe-N co-doped TiO2 through co-precipitation and hydrothermal techniques without ultrasonic assistance. In detail, a specific volume of TiCl4, HMT, and Fe(NO3)3·9H2O was added to 20 mL of deionized water. The mixture was stirred using a magnetic stirrer for 2.5 h at 40 °C. Subsequently, a 25% ammonia solution was added dropwise until the pH reached 8.0 ± 2. The suspension was vigorously stirred at 40 °C. The resulting stable solution underwent 45 min of sonication at 300 W (Figure 2). Another similar sample was prepared using conventional mixing with a magnetic stirrer for 45 min. After this step, hydrothermal aging was conducted for 12 h at 110 °C. Filtration and washing with deionized water were performed three times for all samples. The samples were then dried for 12 h at 110 °C in ambient air. Calcination was carried out for 5 h at 600 °C in ambient air.
Finally, nano-photocatalysts were synthesized in seven types: TiO2-U (U denotes ultrasonic-assisted), NTiO2-U, FeNTiO2 (2.5)-U, FeNTiO2 (5)-U, FeNTiO2 (7.5)-U, FeNTiO2 (10)-U, and FeNTiO2 (5), without ultrasonic assistance.

2.3. Nanophotocatalysts Characterization Techniques

To examine the crystalline structure of the samples, X-ray diffraction was performed over a 2Ɵ range of 5–70 degrees at a temperature of 25 °C using a Panalytical Xpert PRO X-ray Diffractometer. BET surface analysis was conducted to determine the specific surface area through nitrogen adsorption at 77 K using a Specific Surface Area and Porosity Analyzer, PHS 1020.
The morphology of the synthesized photocatalyst was examined using a scanning electron microscope (Philips XL30 ESEM). Fourier transform infrared spectra (FTIR) were analyzed using an FT–IR/FT–NIR Spectrum (400 Spectrometer). UV–VIS diffuse reflectance spectroscopy (UV-VIS DRS) was performed using a Shimadzu UV 160 A UV–Vis Spectrometer to study the optical properties.
Energy Dispersive X-ray spectroscopy (EDS) was utilized with an EDX spectrometer integrated with the SEM to analyze the elemental composition of the photocatalysts.

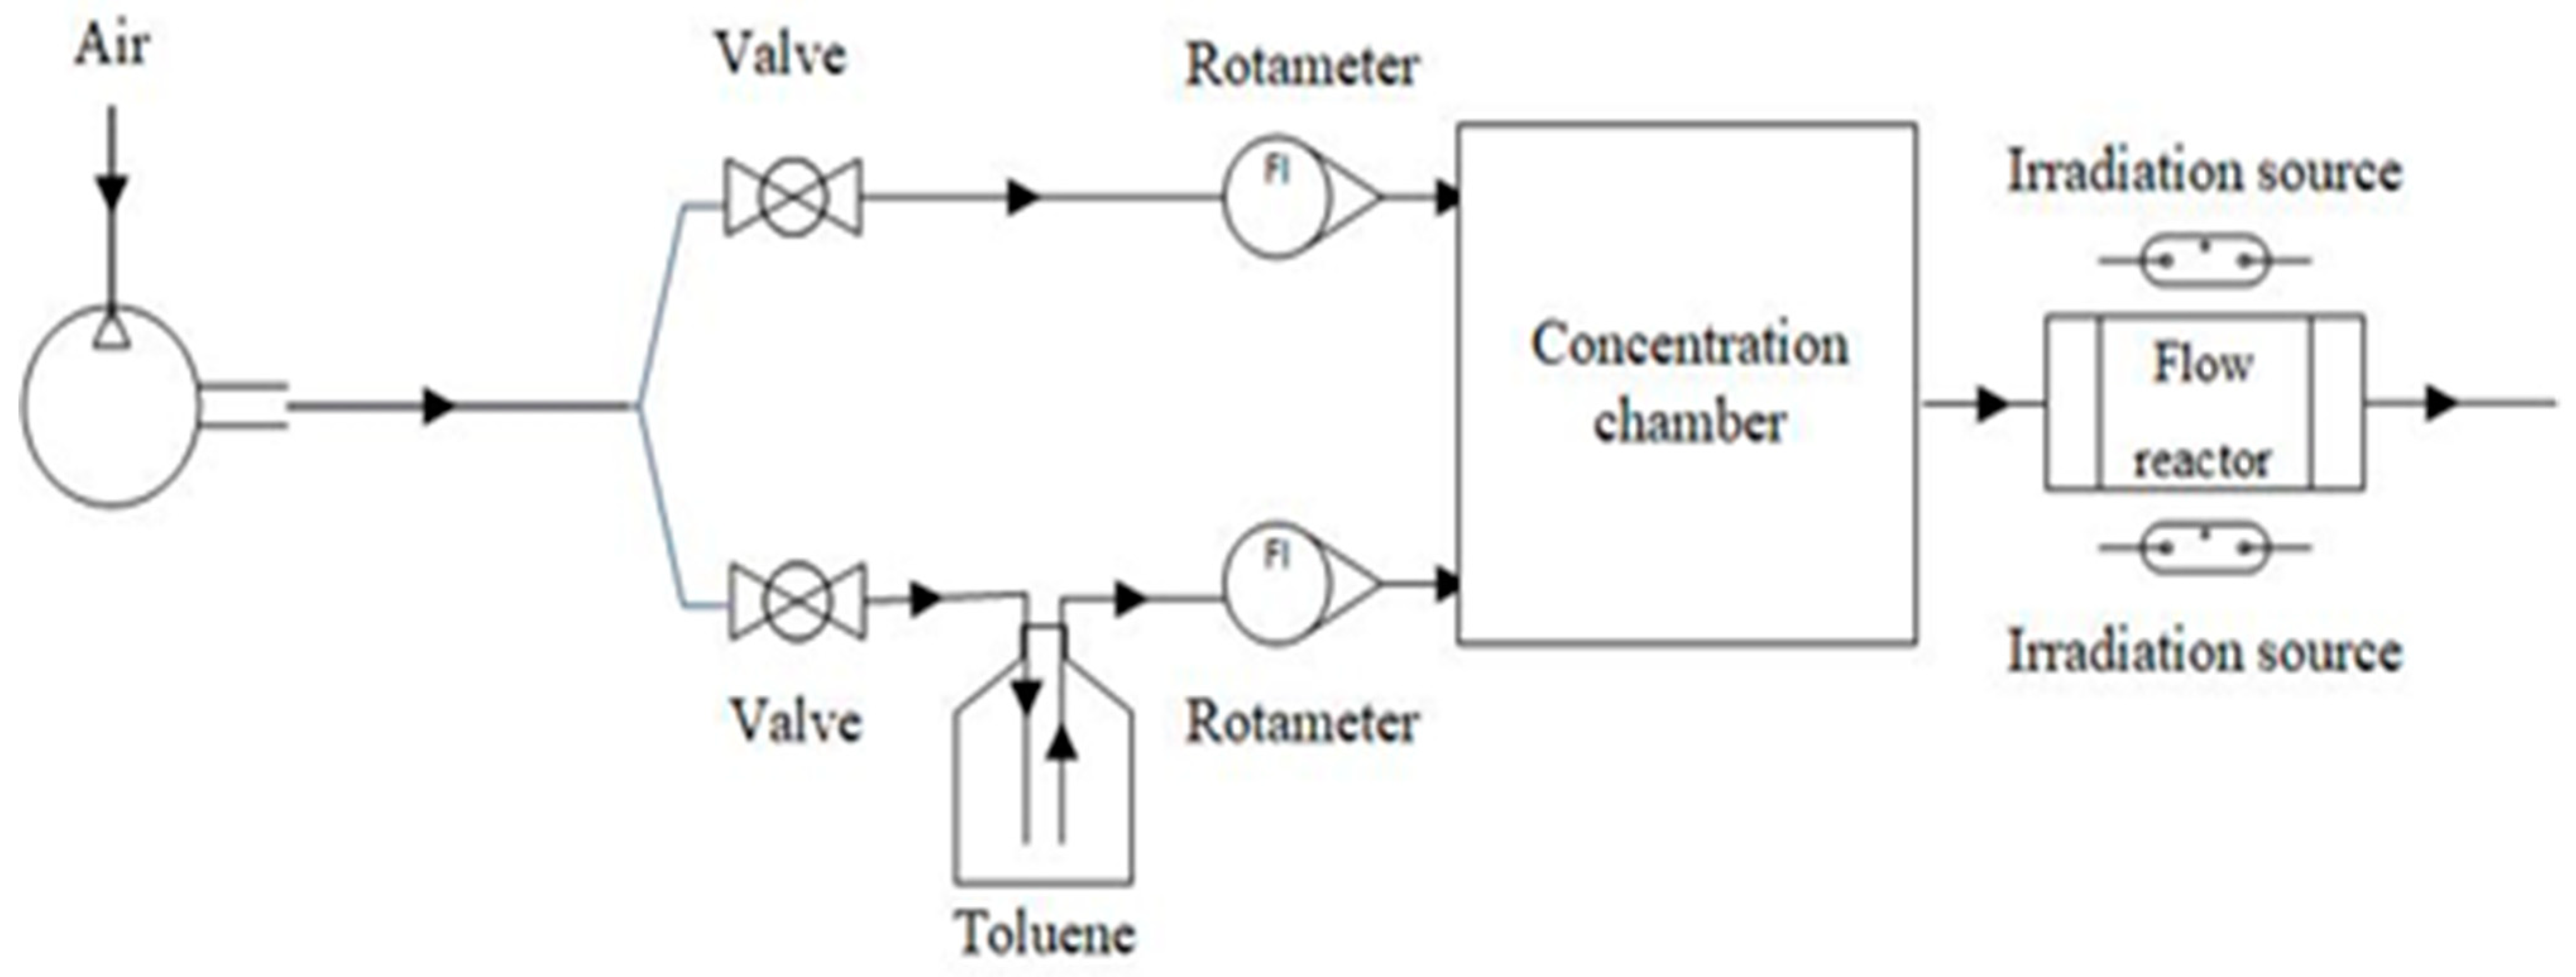
2.4. Experimental Setup for Photocatalytic Performance Test

To assess the photocatalytic performance of the synthesized photocatalysts, experiments were conducted under uniform conditions using TiO2-U, N-TiO2-U, Fe-N/TiO2 (5)-U, and Fe-N/TiO2 (5). Figure 3 illustrates the experimental configuration. The photocatalytic reactions took place in a 180 cm3 two-stage reactor constructed from polytetrafluoroethylene (PTFE). Two quartz glass panels, each 1 mm thick, were fitted onto the PTFE. To enhance air turbulence within the reactor and improve the interaction between the gas flow and the photocatalyst, the PTFE surface was corrugated using a CNC machine (CNC NRC 6090 S2). Toluene was prepared in four concentration ranges: 50 ppm, 100 ppm, 150 ppm, and 200 ppm, within a chamber measuring 50 cm × 50 cm × 20 cm, while airflow was regulated by two rotameters. A thin layer of concrete (sand mesh: 20 × 40) was applied on the PTFE, with the photocatalyst then coated on this layer. At the conclusion of each experiment, the concrete layer was removed, and a new one was created on the PTFE. Two UVA Philips 60 W lamps were positioned 1 cm away from the glass panels, and additional LED lamps were utilized for visible light photocatalytic degradation. Air containing toluene was circulated through the reactor, and the outlet concentration was measured 15 s later using a direct reading first check (first check + multi-gas PID, Ion technology). The degradation rate was determined by calculating the ratio of the outlet concentration to the inlet concentration.

3. Results and Discussions

3.1. Nanophotocatalysts Characterization
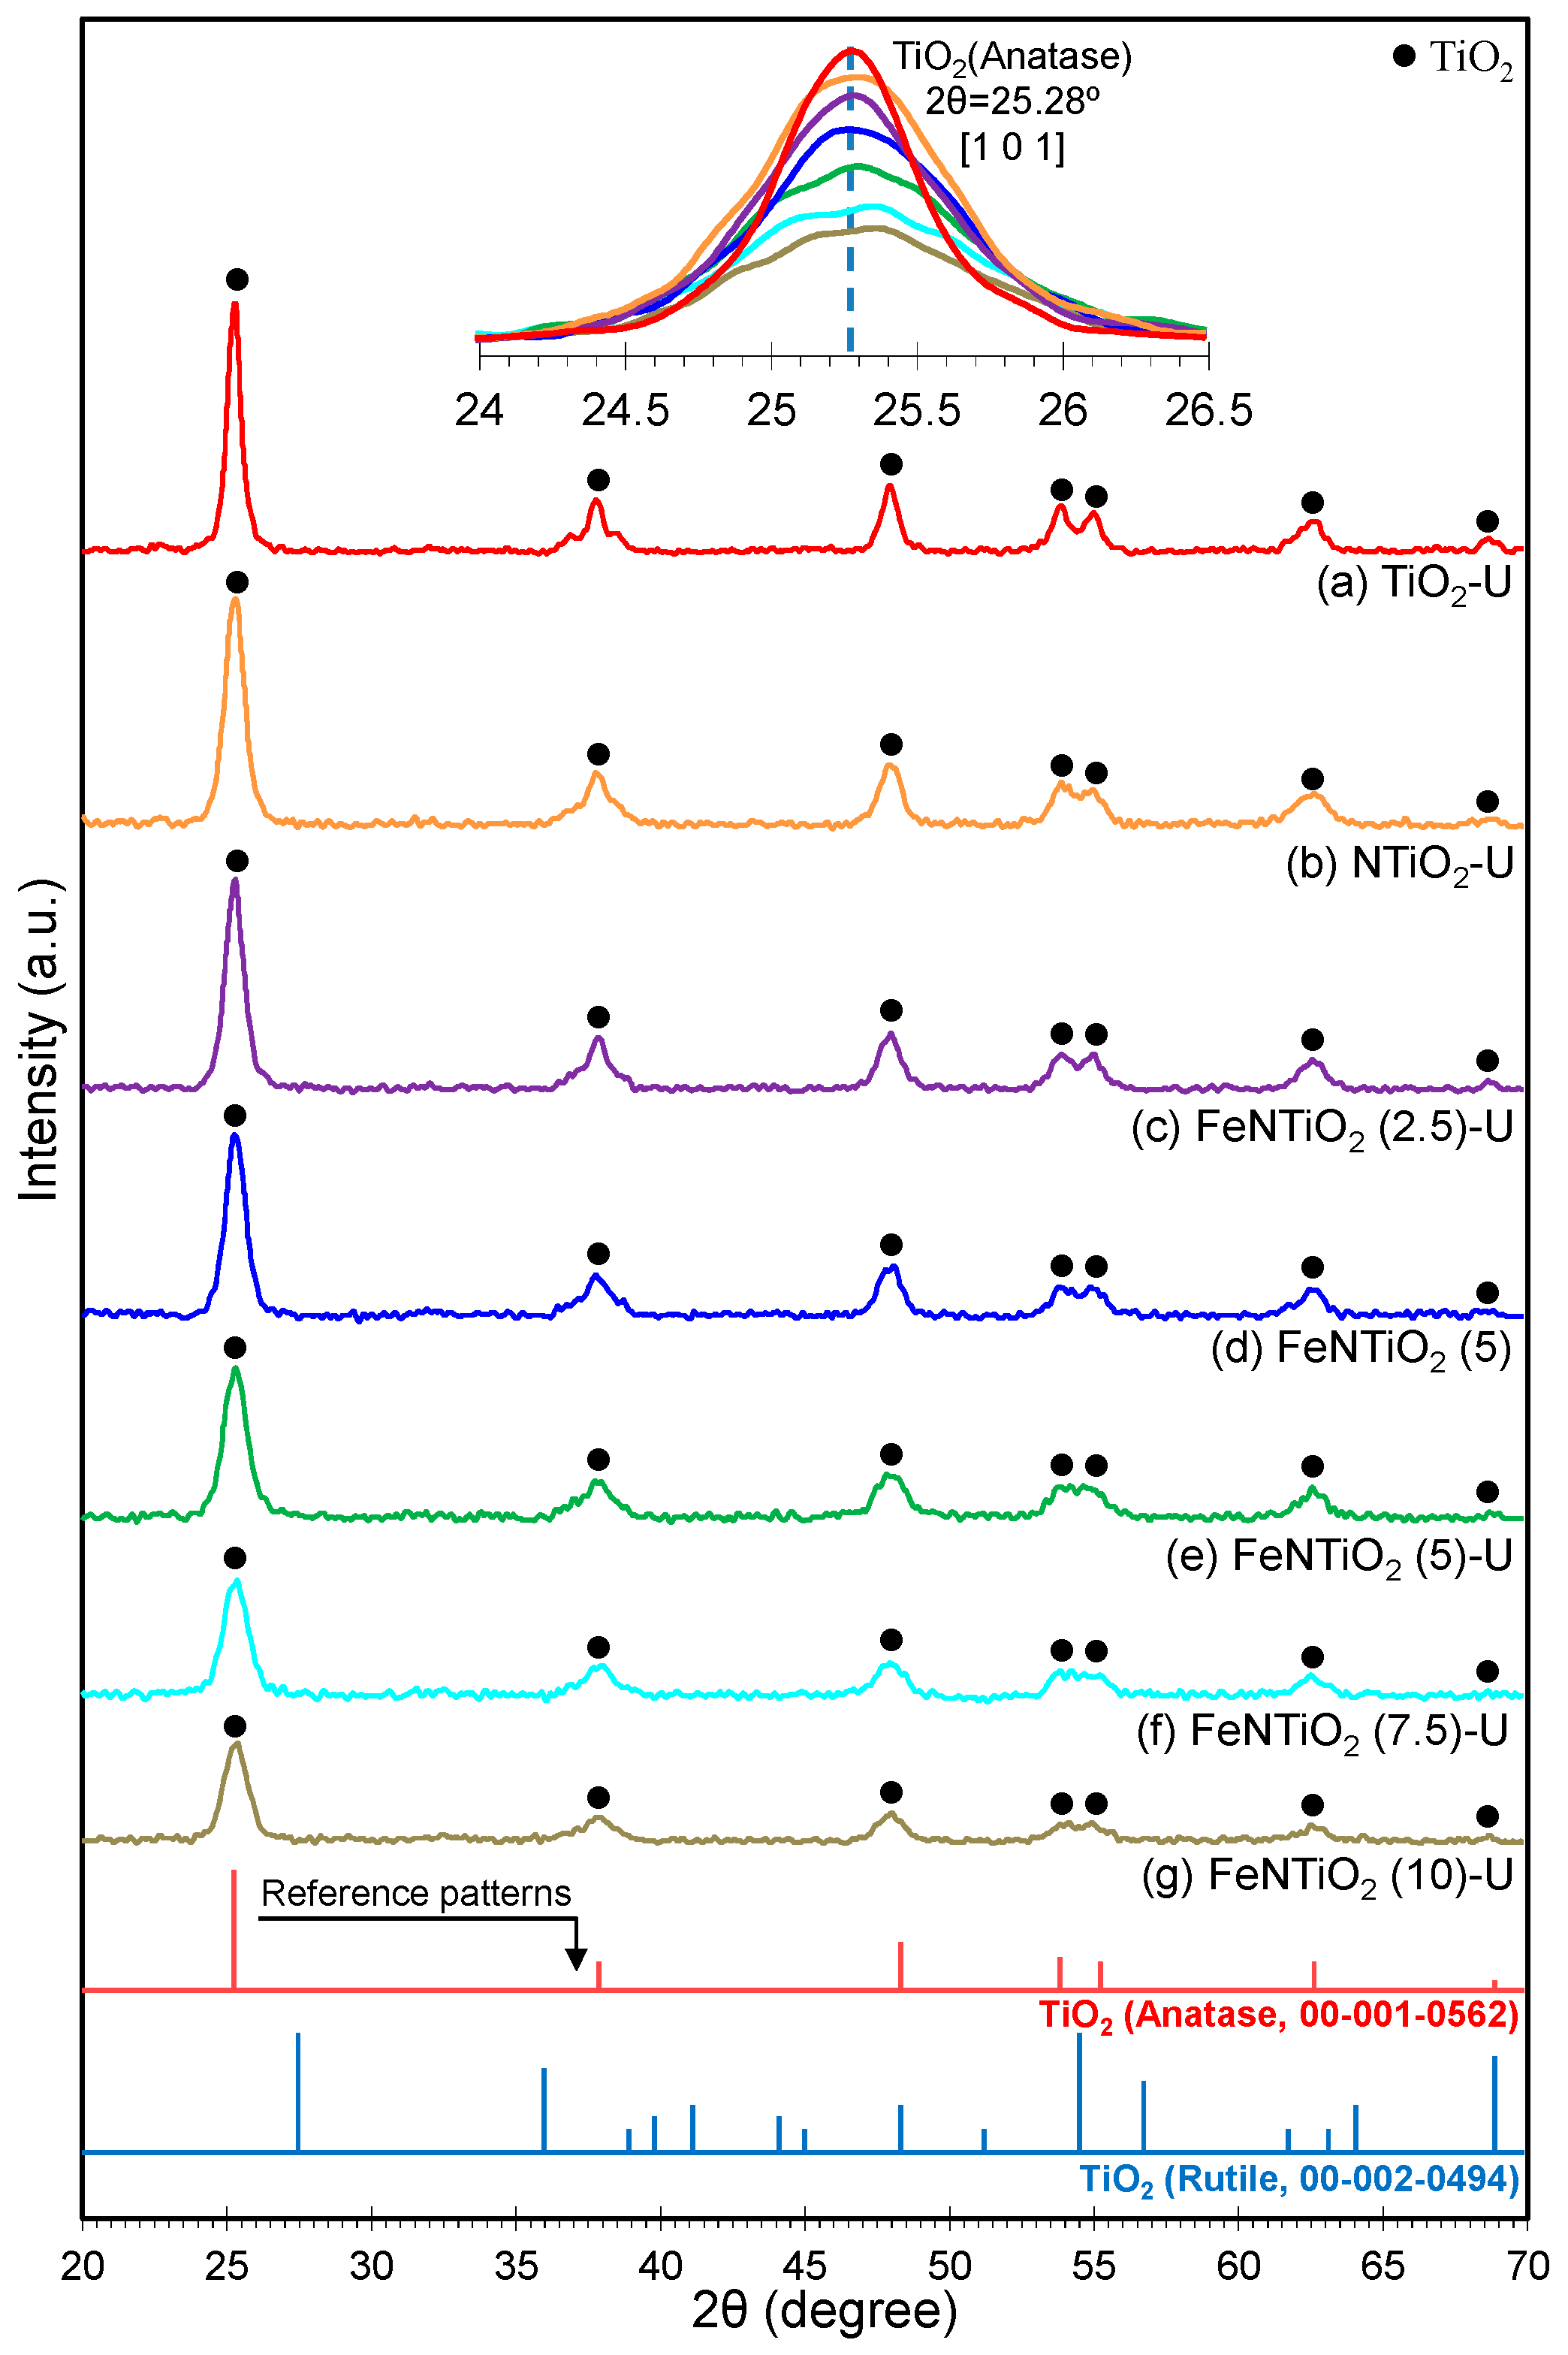
3.1.1. XRD Analysis

Figure 4 displays the XRD patterns of TiO2-U, N-TiO2-U, Fe-N/TiO2 (5)-U, and Fe-N/TiO2 (5). The peaks corresponding to TiO2-U and the other samples appear at 2Ɵ = 25.3, 37.9, 48.4, 53.9, 55.3, 62.7, 69.0, 70.2, 75.4, and 83.2 (see Table 1), which aligns with the JCPDS: 00-001-0562 for anatase TiO2, indicating the successful synthesis of the photocatalysts. Notably, only the anatase phase is present in all samples, with no evidence of rutile or brookite phases. Upon the addition of iron and nitrogen, the XRD peaks become broader and shorter, suggesting the incorporation of these dopants into the TiO2 structure and a reduction in crystallite size. Despite doping with N and Fe in various ratios, the anatase phase of TiO2 remains unchanged. The crystallinity of TiO2, however, diminishes with the inclusion of nitrogen and iron (see Table 2). The absence of distinct peaks for iron and nitrogen in the patterns is attributed to the similarity in ionic radii between Fe3+ and Ti4+, resulting in the integration of Fe3+ ions into the TiO2 lattice. Similar XRD pattern results were reported by Kalantari et al. [53]. Additionally, a comparison between the non-ultrasound and ultrasound patterns of Fe-N/TiO2 (5) reveals that the Fe-N/TiO2 (5)-U sample has a superior crystalline structure. This improvement is attributed to the use of the sonochemistry method, which enhances the distribution of crystal size and structure [54].

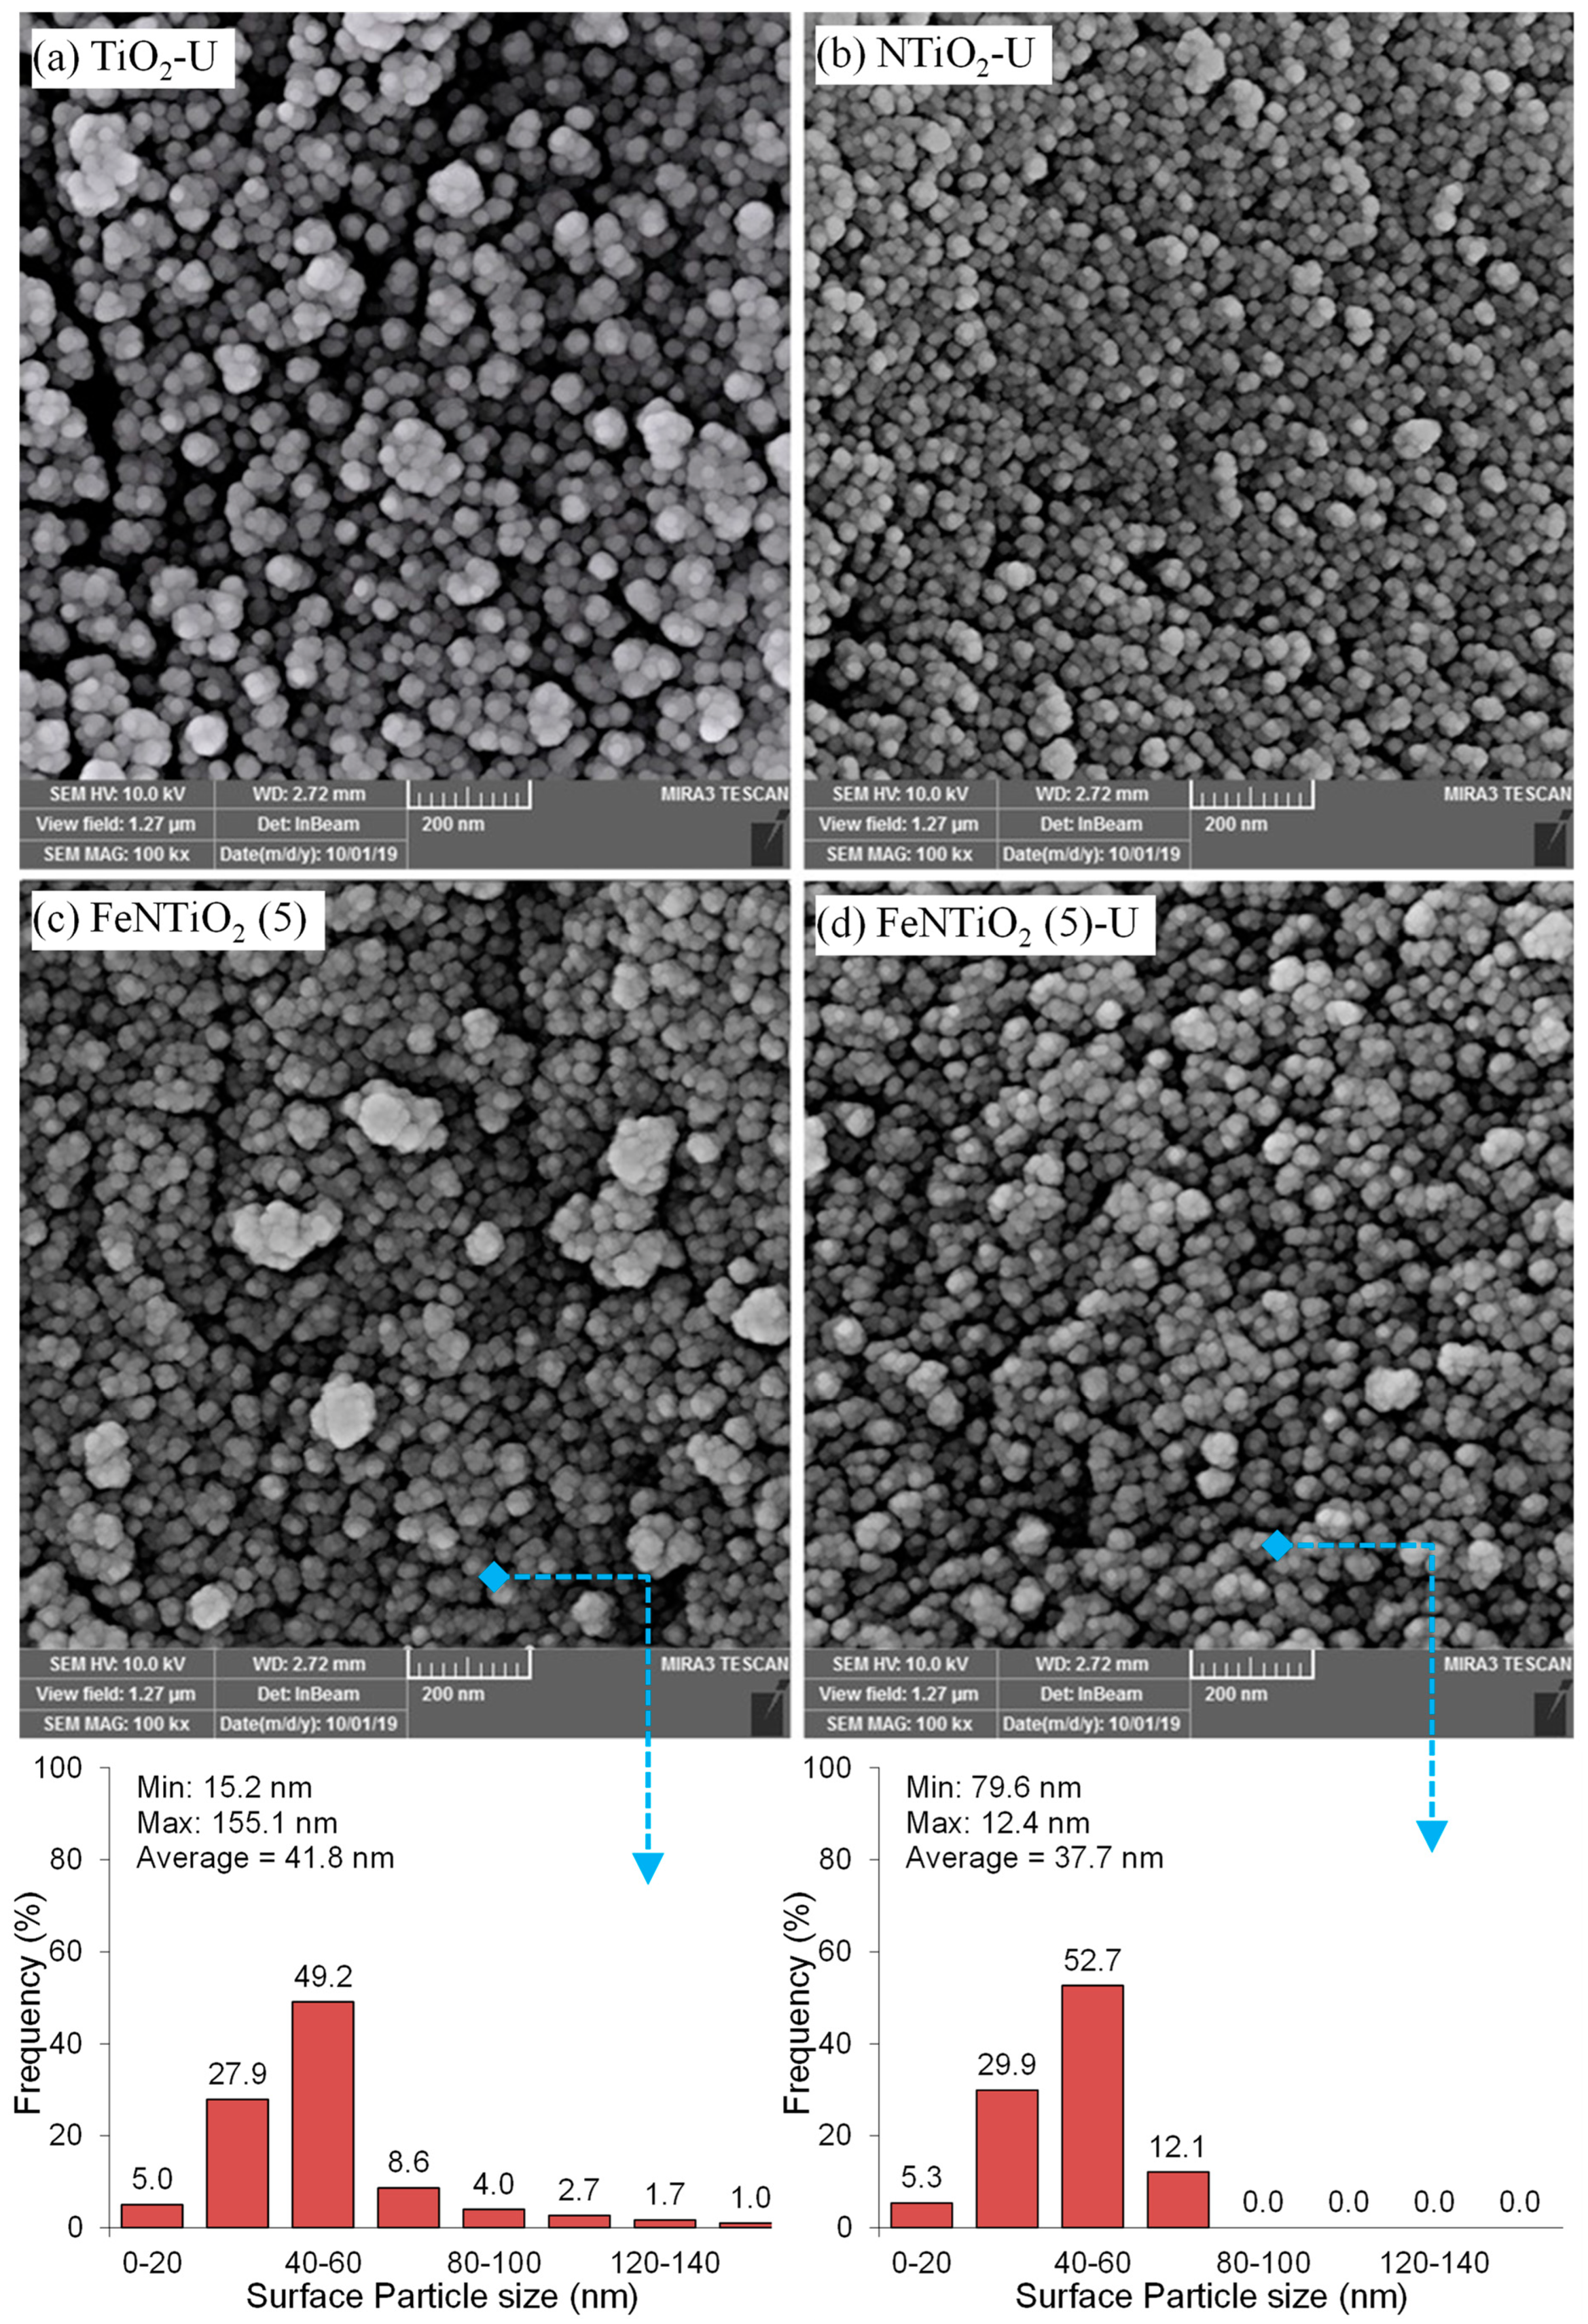
3.1.2. FESEM Analysis
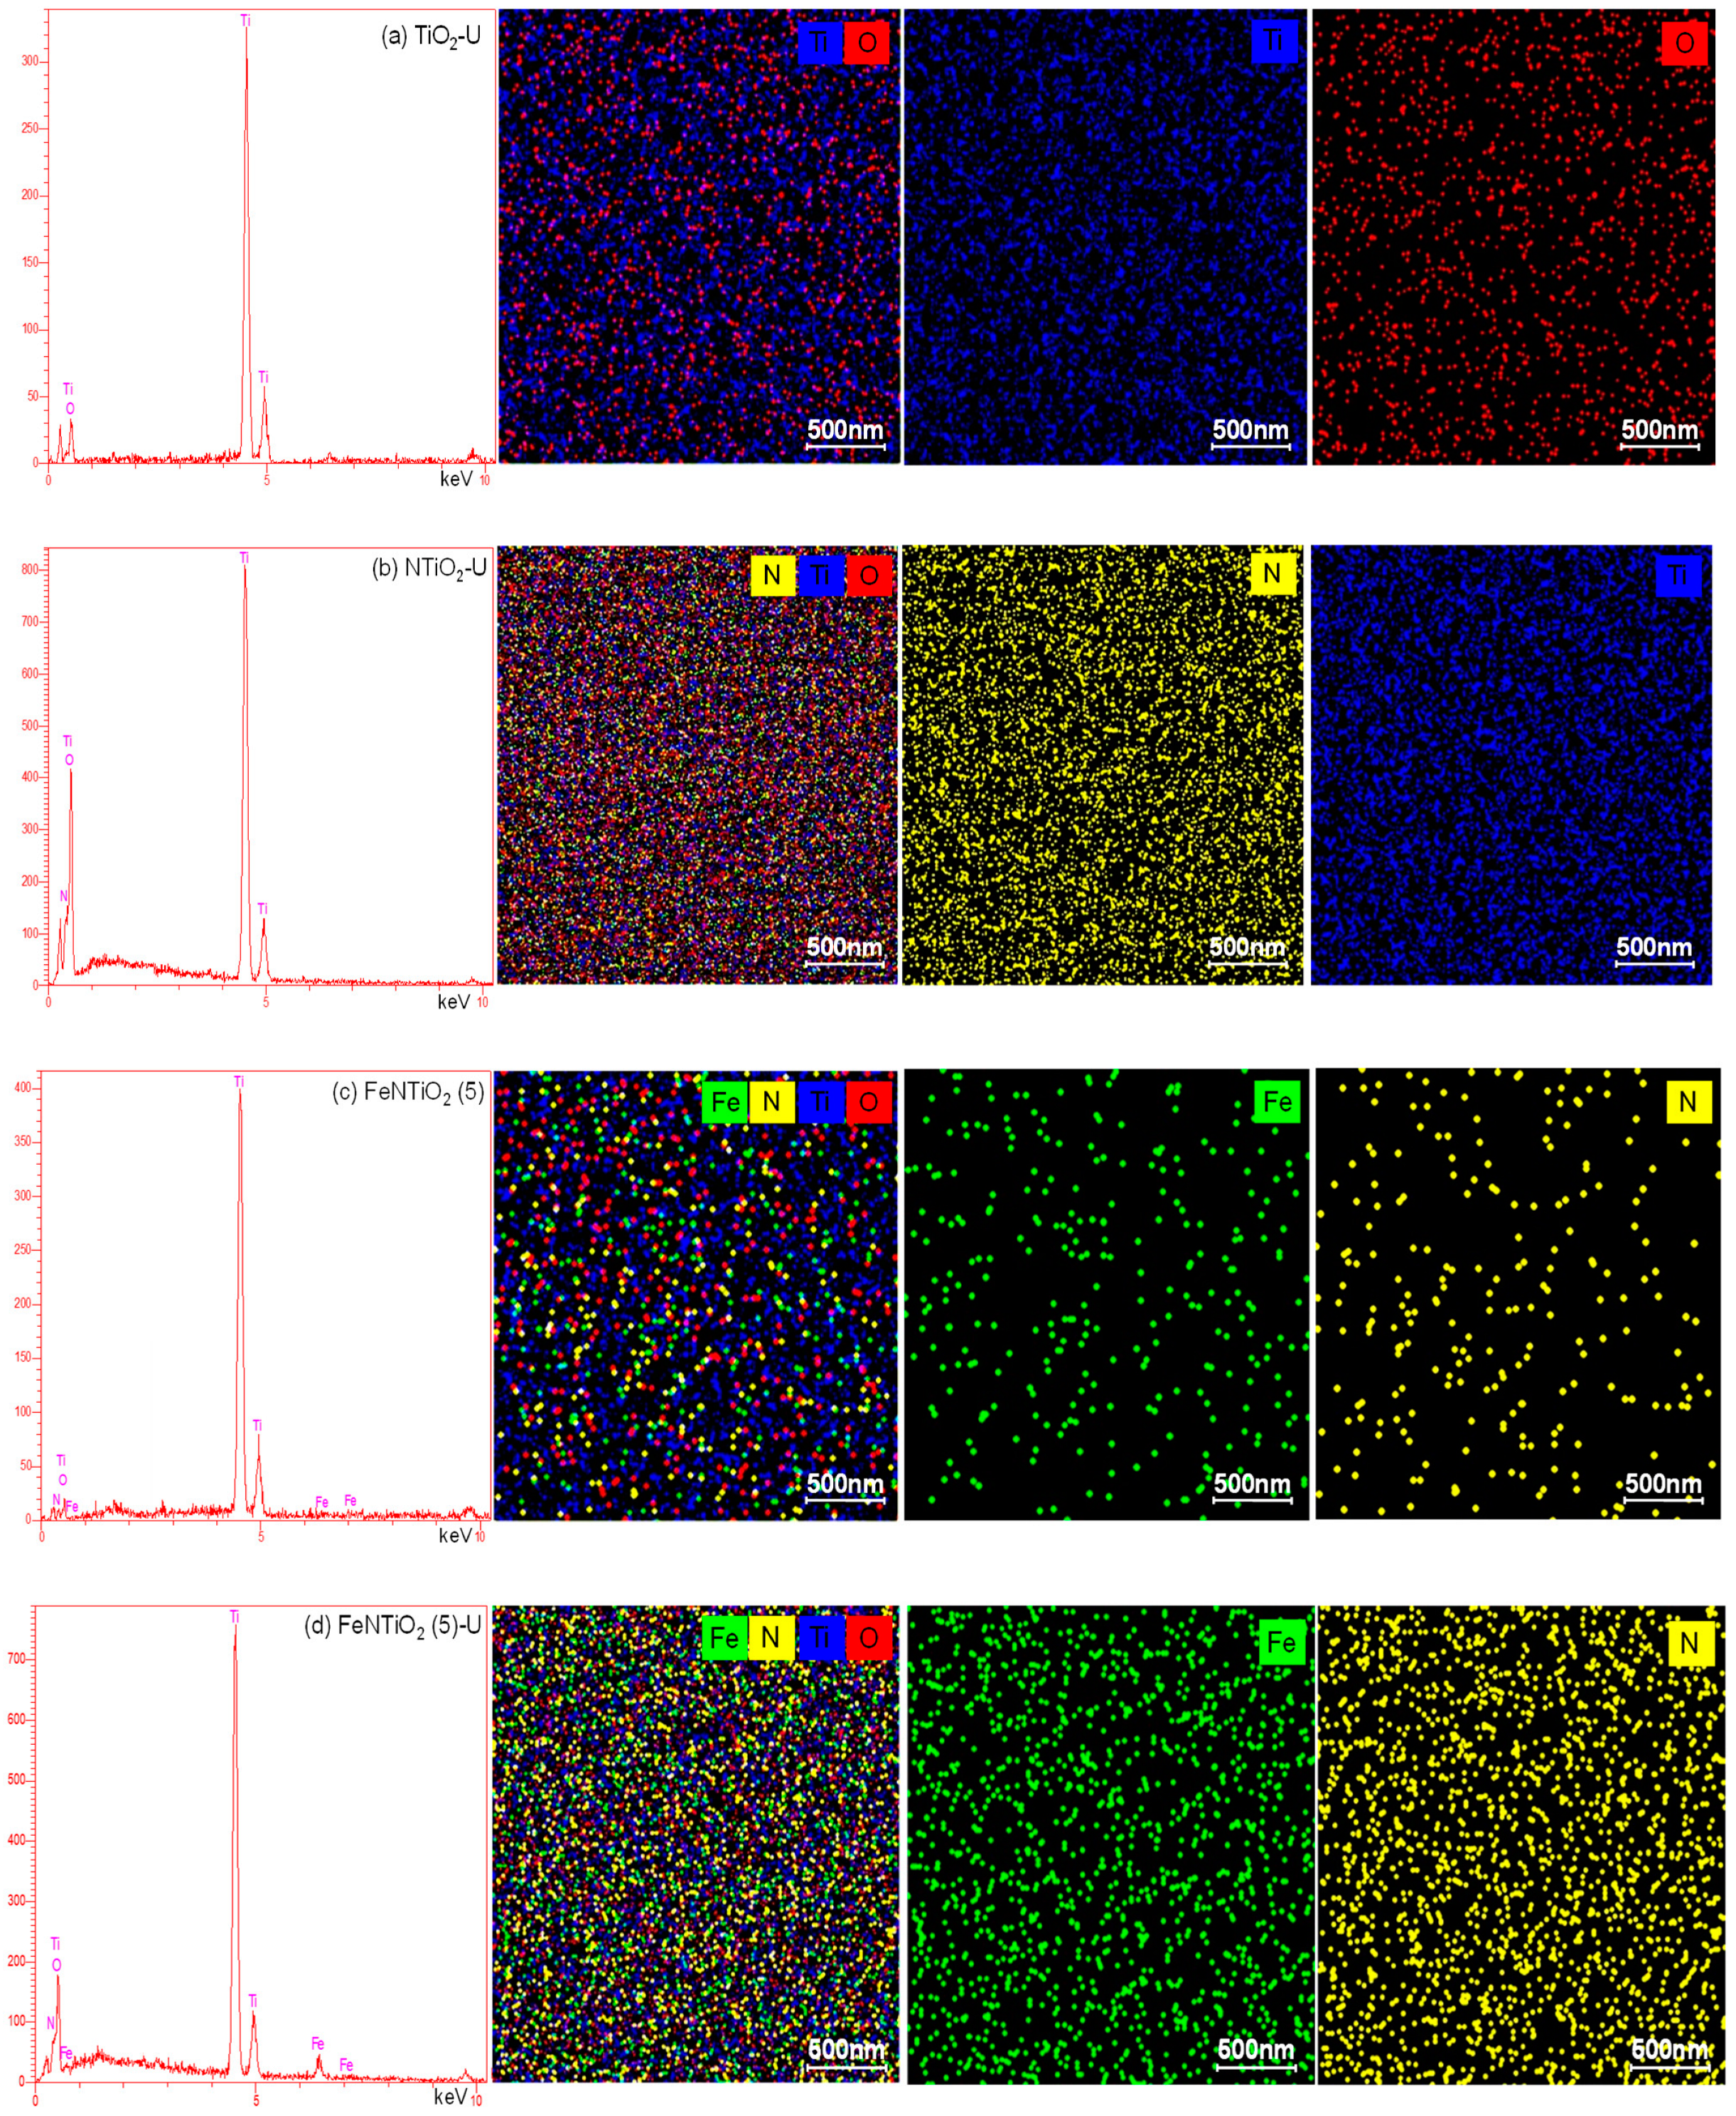
Figure 5 presents the field emission scanning electron microscopy (FESEM) images of TiO2-U, N-TiO2-U, Fe-N/TiO2 (5)-U, and Fe-N/TiO2 (5) photocatalysts. The analysis reveals that all samples are nanoscale with a spherical shape. Specifically, TiO2-U particles are spherical and tend to agglomerate. The incorporation of iron and nitrogen into the TiO2 structure reduces both particle size and agglomeration. Figure 5c,d illustrates the surfaces of Fe-N/TiO2 (5) and Fe-N/TiO2 (5)-U, respectively. It is evident that Fe-N/TiO2 (5)-U particles are smaller and show no signs of agglomeration, indicating that the ultrasonic method enhances the distribution of Fe and N on the TiO2 surface. The average particle sizes for Fe-N/TiO2 (5)-U and Fe-N/TiO2 (5) are 37.7 nm and 41.8 nm, respectively.
Figure 6 depicts the 3D surface images of Fe-N/TiO2 (5) (Figure 6b) and Fe-N/TiO2 (5)-U (Figure 6a). The maximum height, average height, and root mean square for Fe-N/TiO2 (5) and Fe-N/TiO2 (5)-U are 200 nm, 91.9 nm, 33.9 nm, 50 nm, 25.5 nm, and 7.2 nm, respectively. These findings confirm that the use of the ultrasonic method results in reduced particle size and decreased agglomeration.

3.1.3. EDX Analysis

Energy Dispersive Spectroscopy (EDS) was conducted alongside the SEM analysis using the same device under vacuum conditions to examine the elemental composition of pure TiO2 and modified TiO2. Figure 7 displays the EDX dot maps for TiO2-U, N-TiO2-U, Fe-N/TiO2 5-U, and Fe-N/TiO2 5. The EDX dot mapping confirms the presence of iron (Fe), nitrogen (N), titanium (Ti), and oxygen (O) in the samples. These results demonstrate that doping TiO2 with Fe and N was successful, even though the XRD patterns did not show any peaks for Fe and N in the anatase TiO2. Similar findings have been reported by Ganesh et al. and Ambati et al. [55,56]. Additionally, the EDX dot map micrographs reveal an enhanced distribution of Fe and N on the surface of TiO2, with no evidence of agglomeration. The distribution of Fe-N/TiO2 (5)-U is significantly better than that of the non-ultrasonic Fe-N/TiO2 (5) sample. Agglomeration is observed on the surface of Fe-N/TiO2 (5), but not on Fe-N/TiO2 (5)-U. These findings suggest that the ultrasonic method improves the distribution of dopants on the TiO2 surface, thereby enhancing the photocatalytic activity of the samples. Zarrabi et al. [57] obtained similar results regarding the impact of the ultrasonic method on particle distribution.

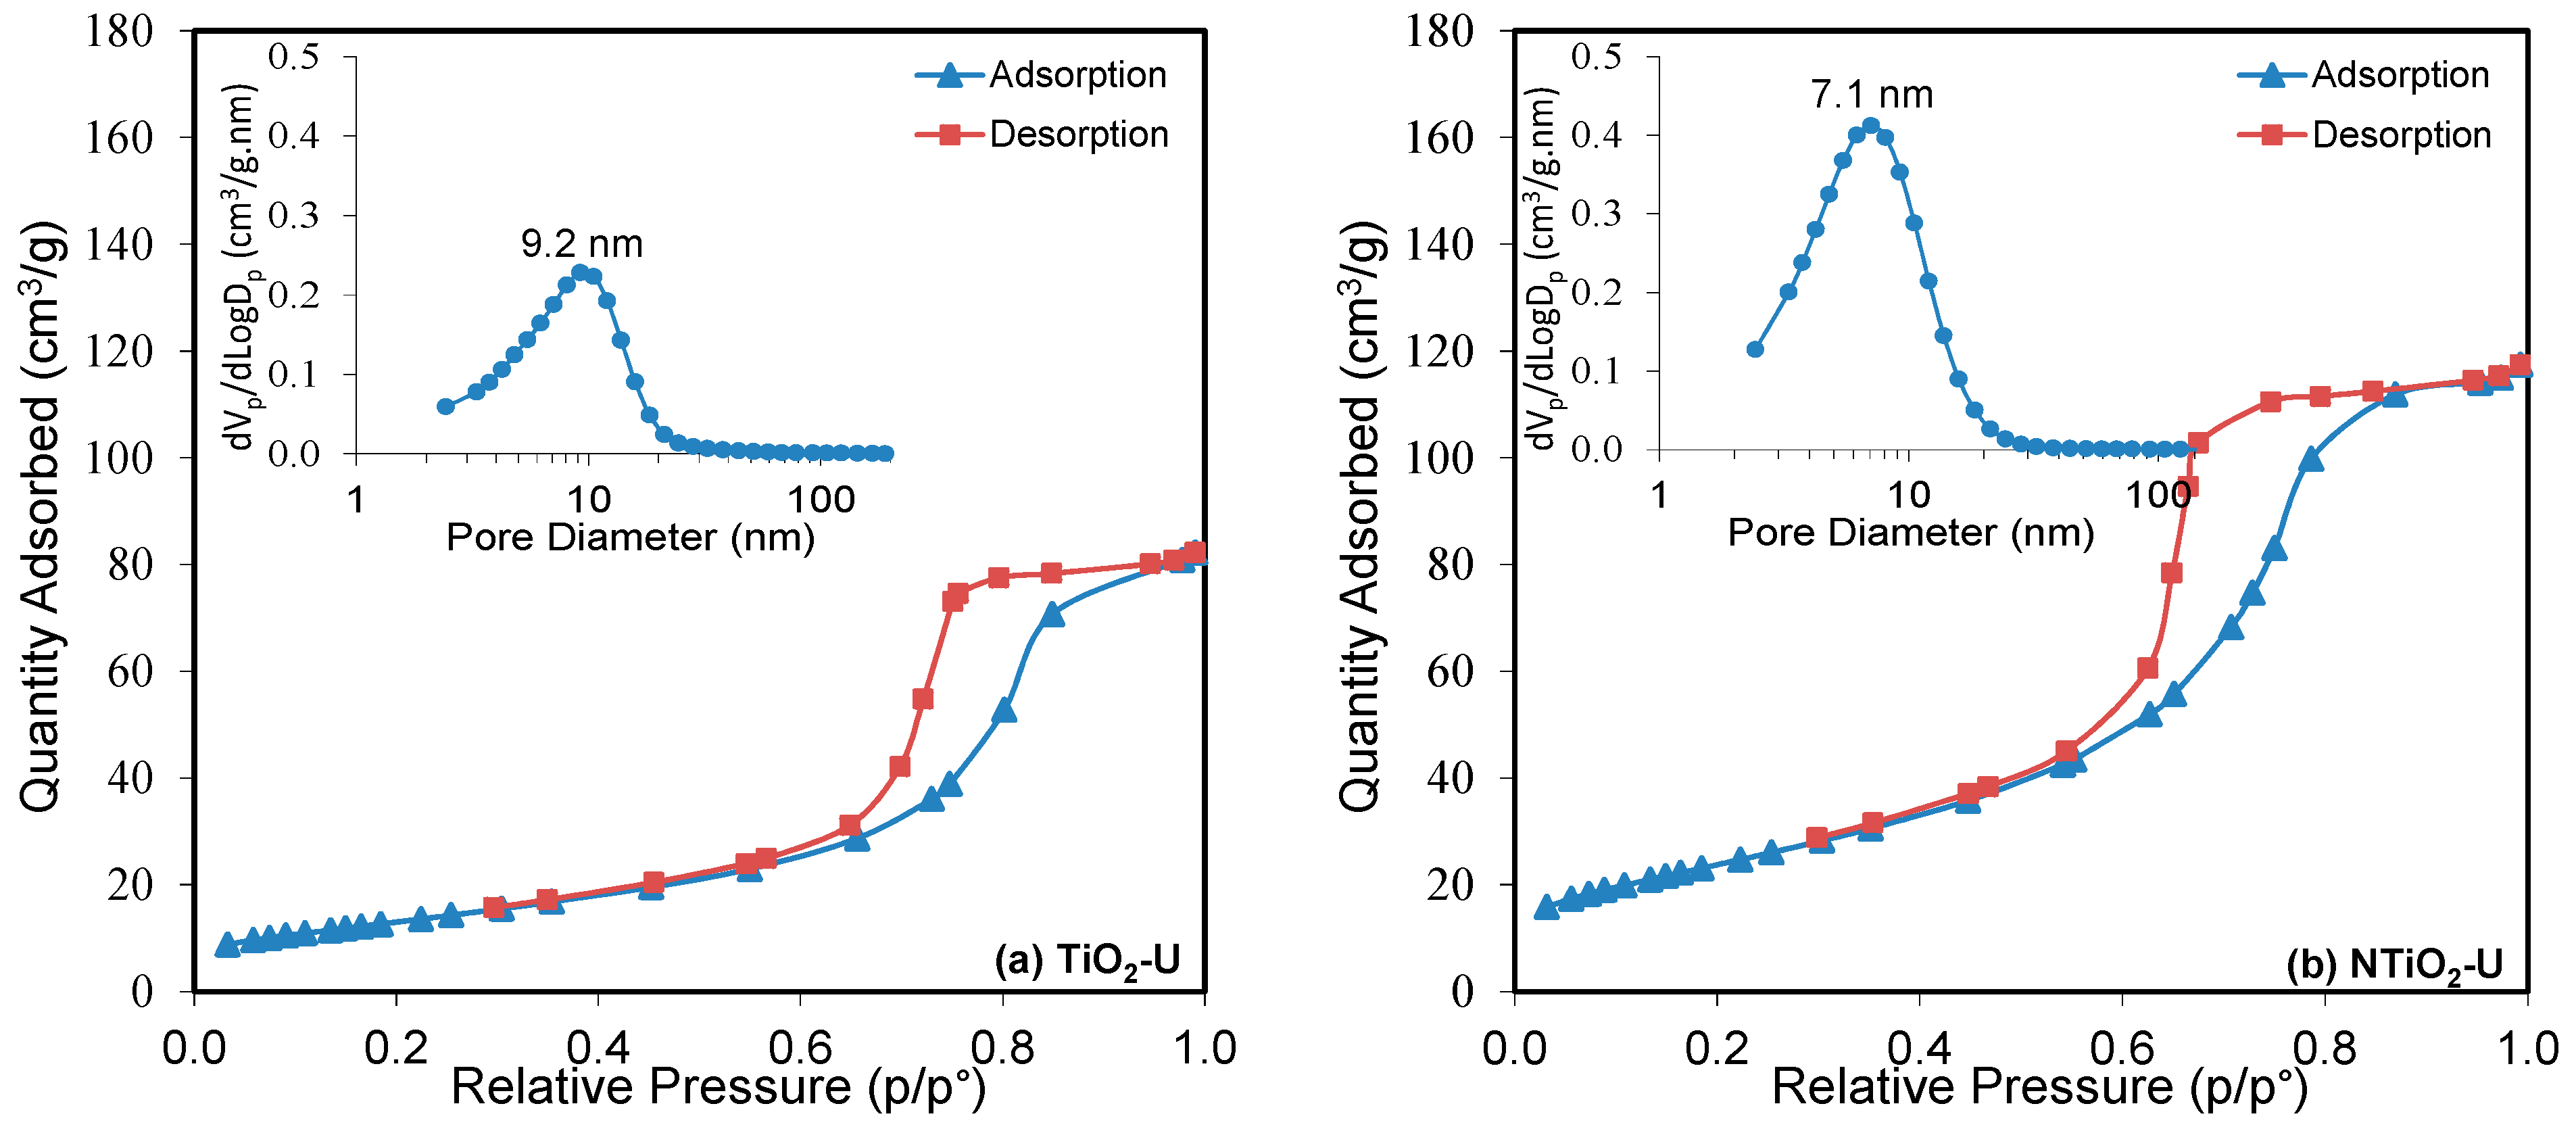
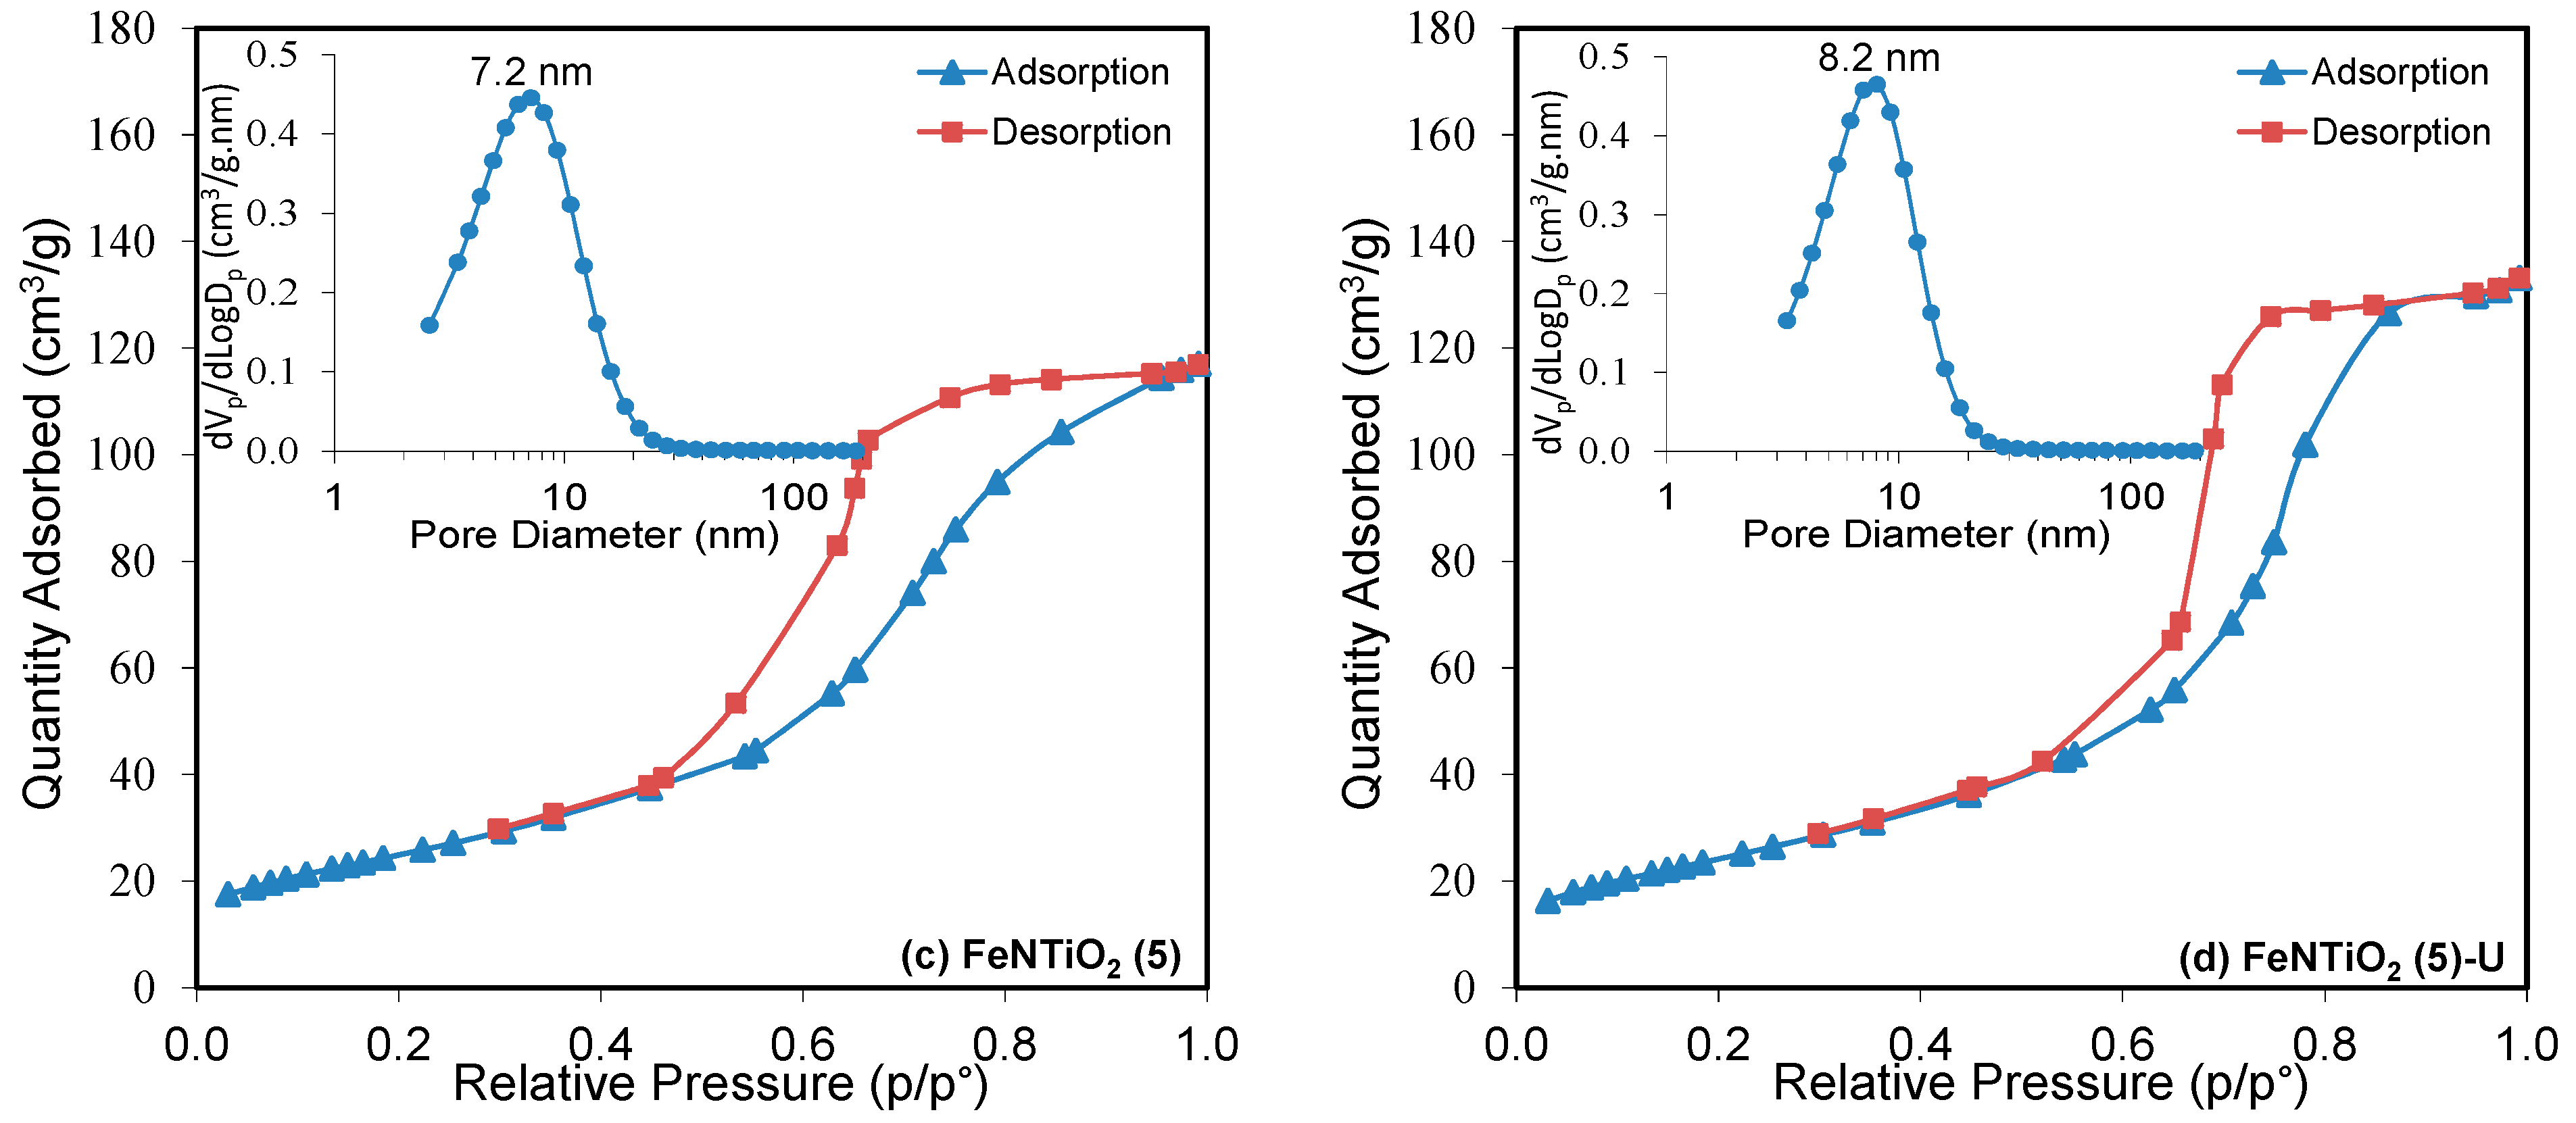
3.1.4. BET–BJH Analysis

The specific surface area (SBET) plays a crucial role in photocatalytic activity. Figure 8 presents the BET–BJH analysis, adsorption and desorption graphs, and pore volume of the synthesized photocatalysts. The analysis indicates that the specific surface areas of modified TiO2 are greater than that of pure TiO2. Additionally, co-doped samples exhibit larger specific surface areas compared to mono-doped samples. Consequently, the particle size of co-doped samples is smaller than that of mono-doped and pure TiO2. The sonication method helps prevent particle agglomeration and induces cavitation, which enhances the specific surface areas of both co-doped and mono-doped TiO2 [58]. According to the results, the specific surface area of Fe-N/TiO2 (5) U (88/37 m2·g−1) is less than Fe-N/TiO2 (5) (89.4 m2·g−1), which could be due to measurement errors in the laboratory instruments. However, Asl et al. [59] reported similar results for specific surface area.
Additionally, Figure 8 displays the N2 adsorption–desorption isotherms, pore volume, and pore size distribution for TiO2 and modified TiO2. All samples exhibit a pore volume greater than 2 nm, indicating that TiO2 has a mesoporous structure. The incorporation of Fe and N into TiO2 results in an increase in the photocatalyst’s pore volume. Initially, at low relative pressures, the adsorption of samples rises with increasing relative pressure. However, once the relative pressure reaches 0.6, the adsorption rate increases sharply due to the accumulation of N2 in the TiO2 mesopores [60]. The samples exhibit the following order of adsorption capacity from highest to lowest: Fe-N/TiO2 (5)-U > Fe-N/TiO2 (5) > N/TiO2-U > TiO2-U. Notably, Fe-N/TiO2 (5)-U shows a higher adsorption capacity compared to the non-ultrasonic synthesized Fe-N/TiO2 (5), attributed to its larger and more diverse pore size distribution. The adsorption–desorption isotherms for these samples fall into the IV type and H1 hysteresis category. These findings indicate that Fe-N/TiO2 (5)-U demonstrates superior photocatalytic activity compared to Fe-N/TiO2 (5) and the other samples [61]. Moreover, the results show that employing the sonochemistry method enhances the photocatalytic properties of the samples, leading to more effective removal of pollutants from air and wastewater.

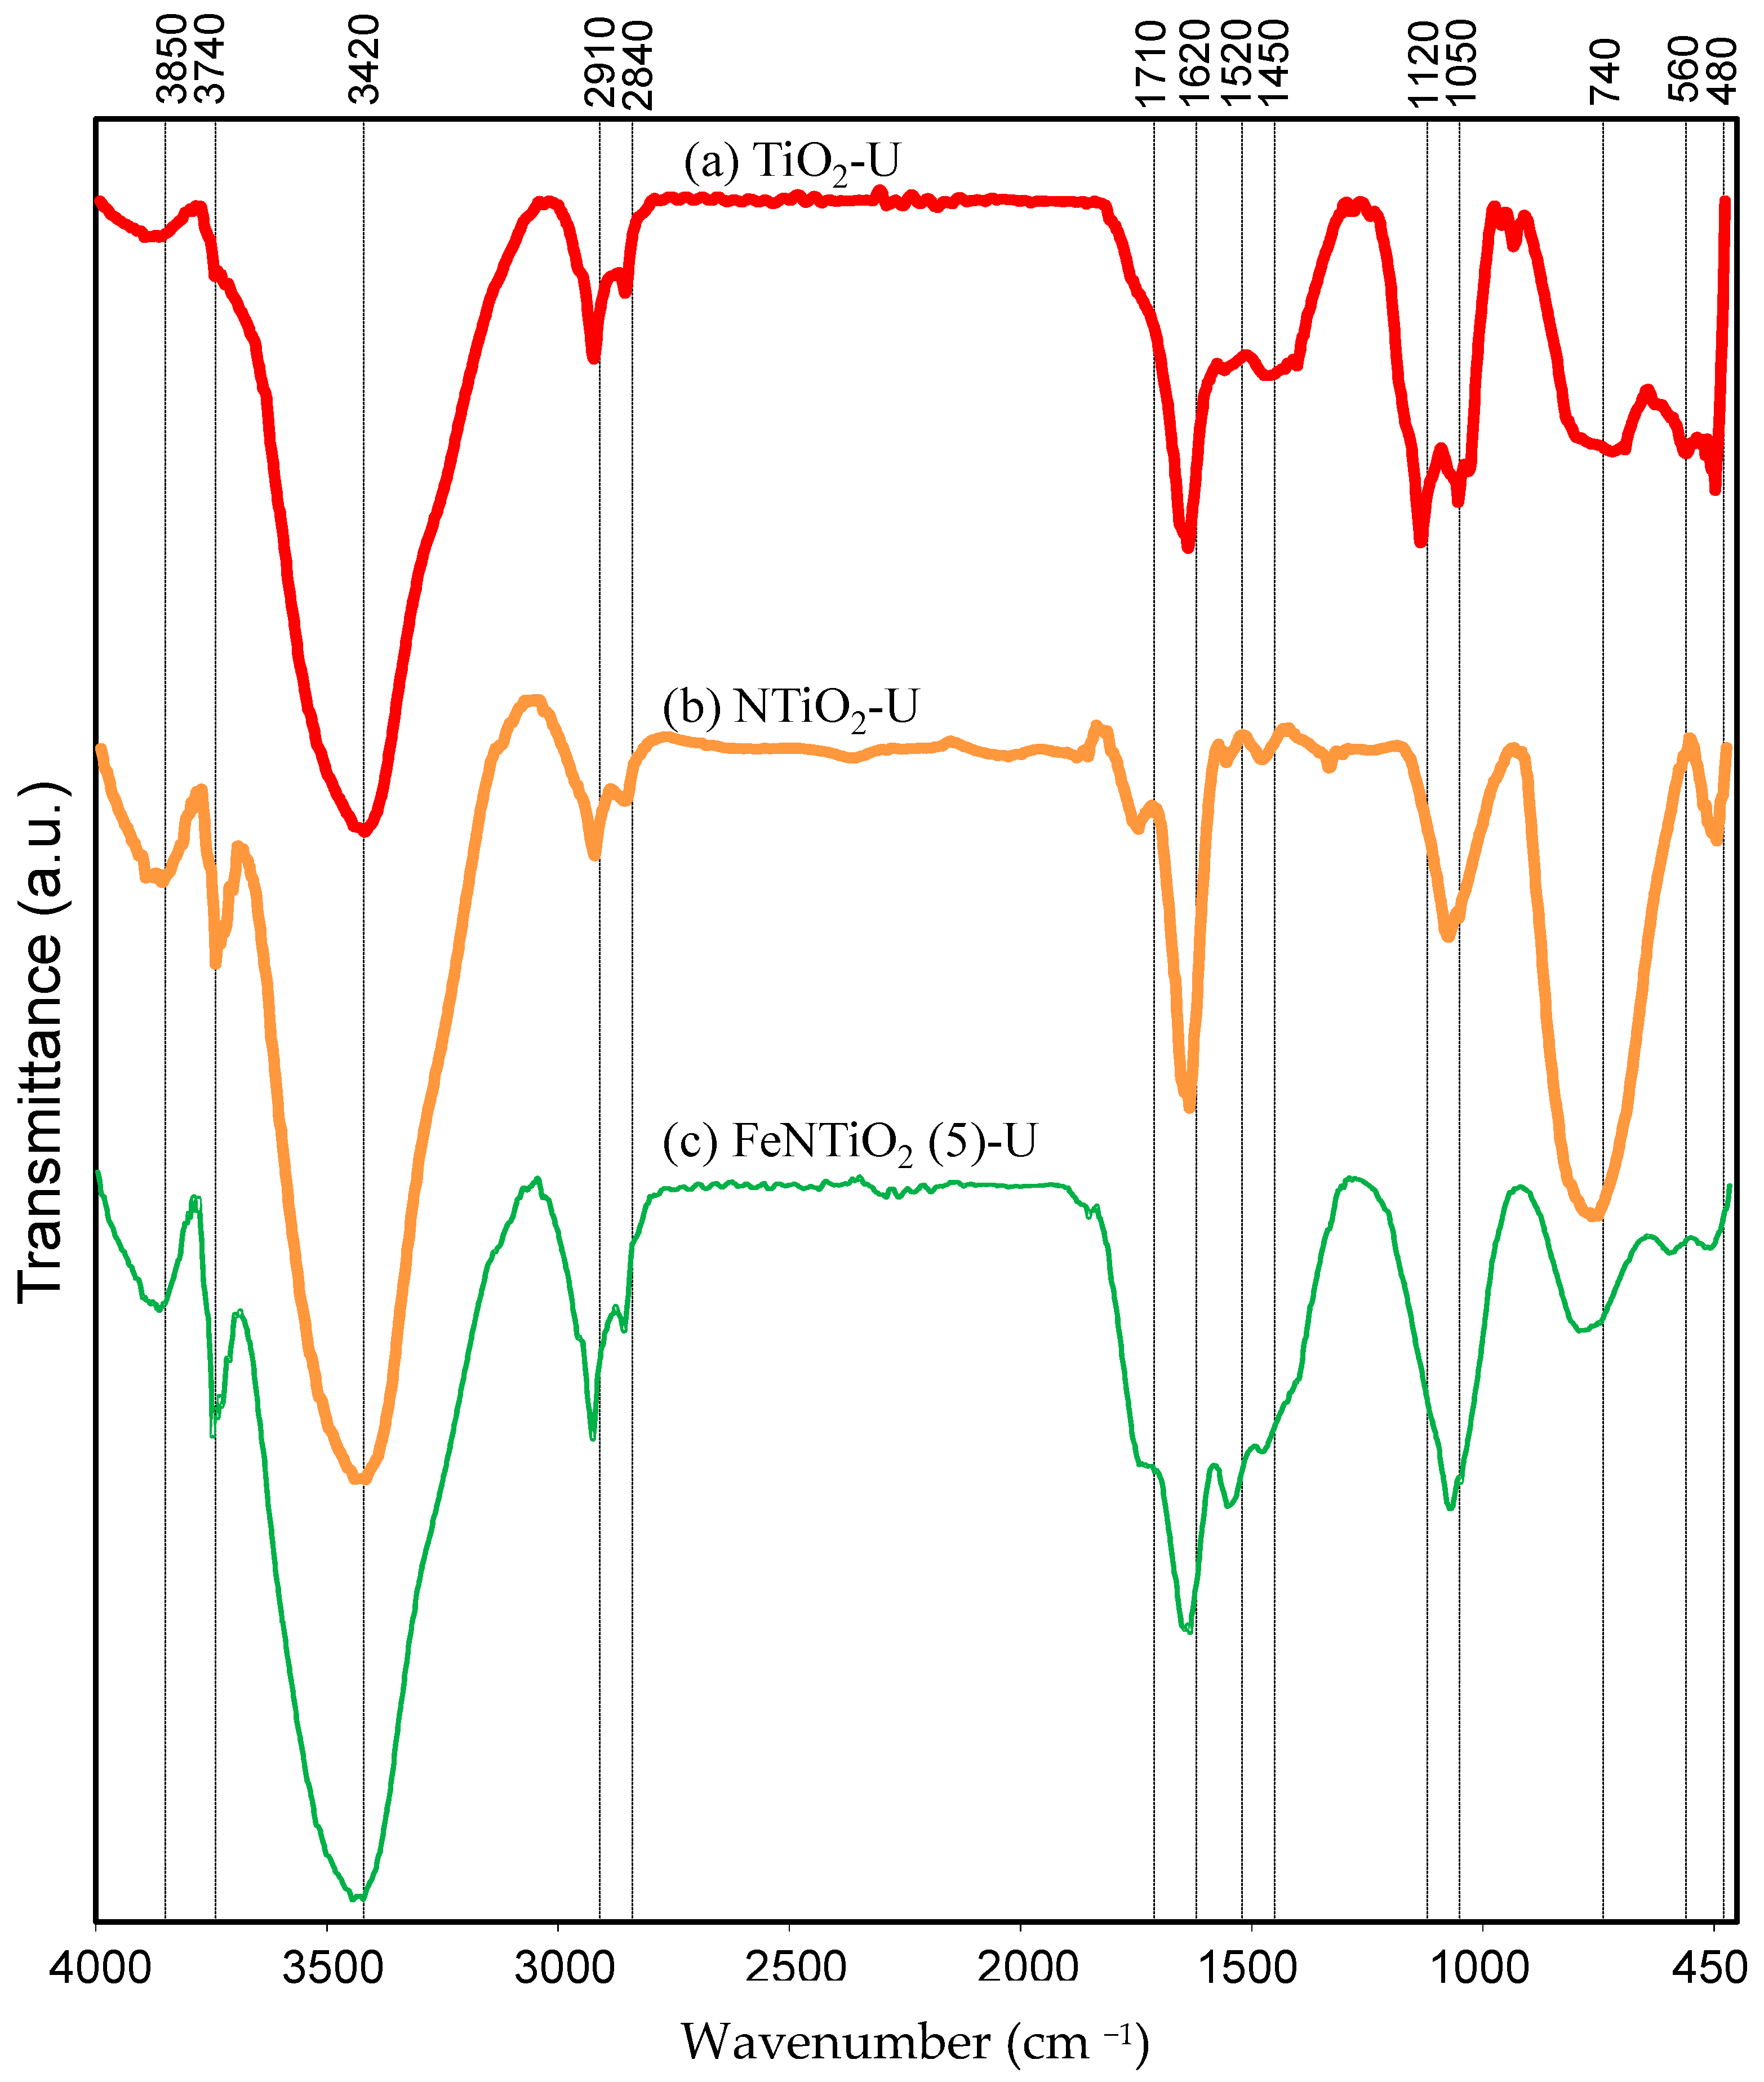
3.1.5. FTIR Analysis
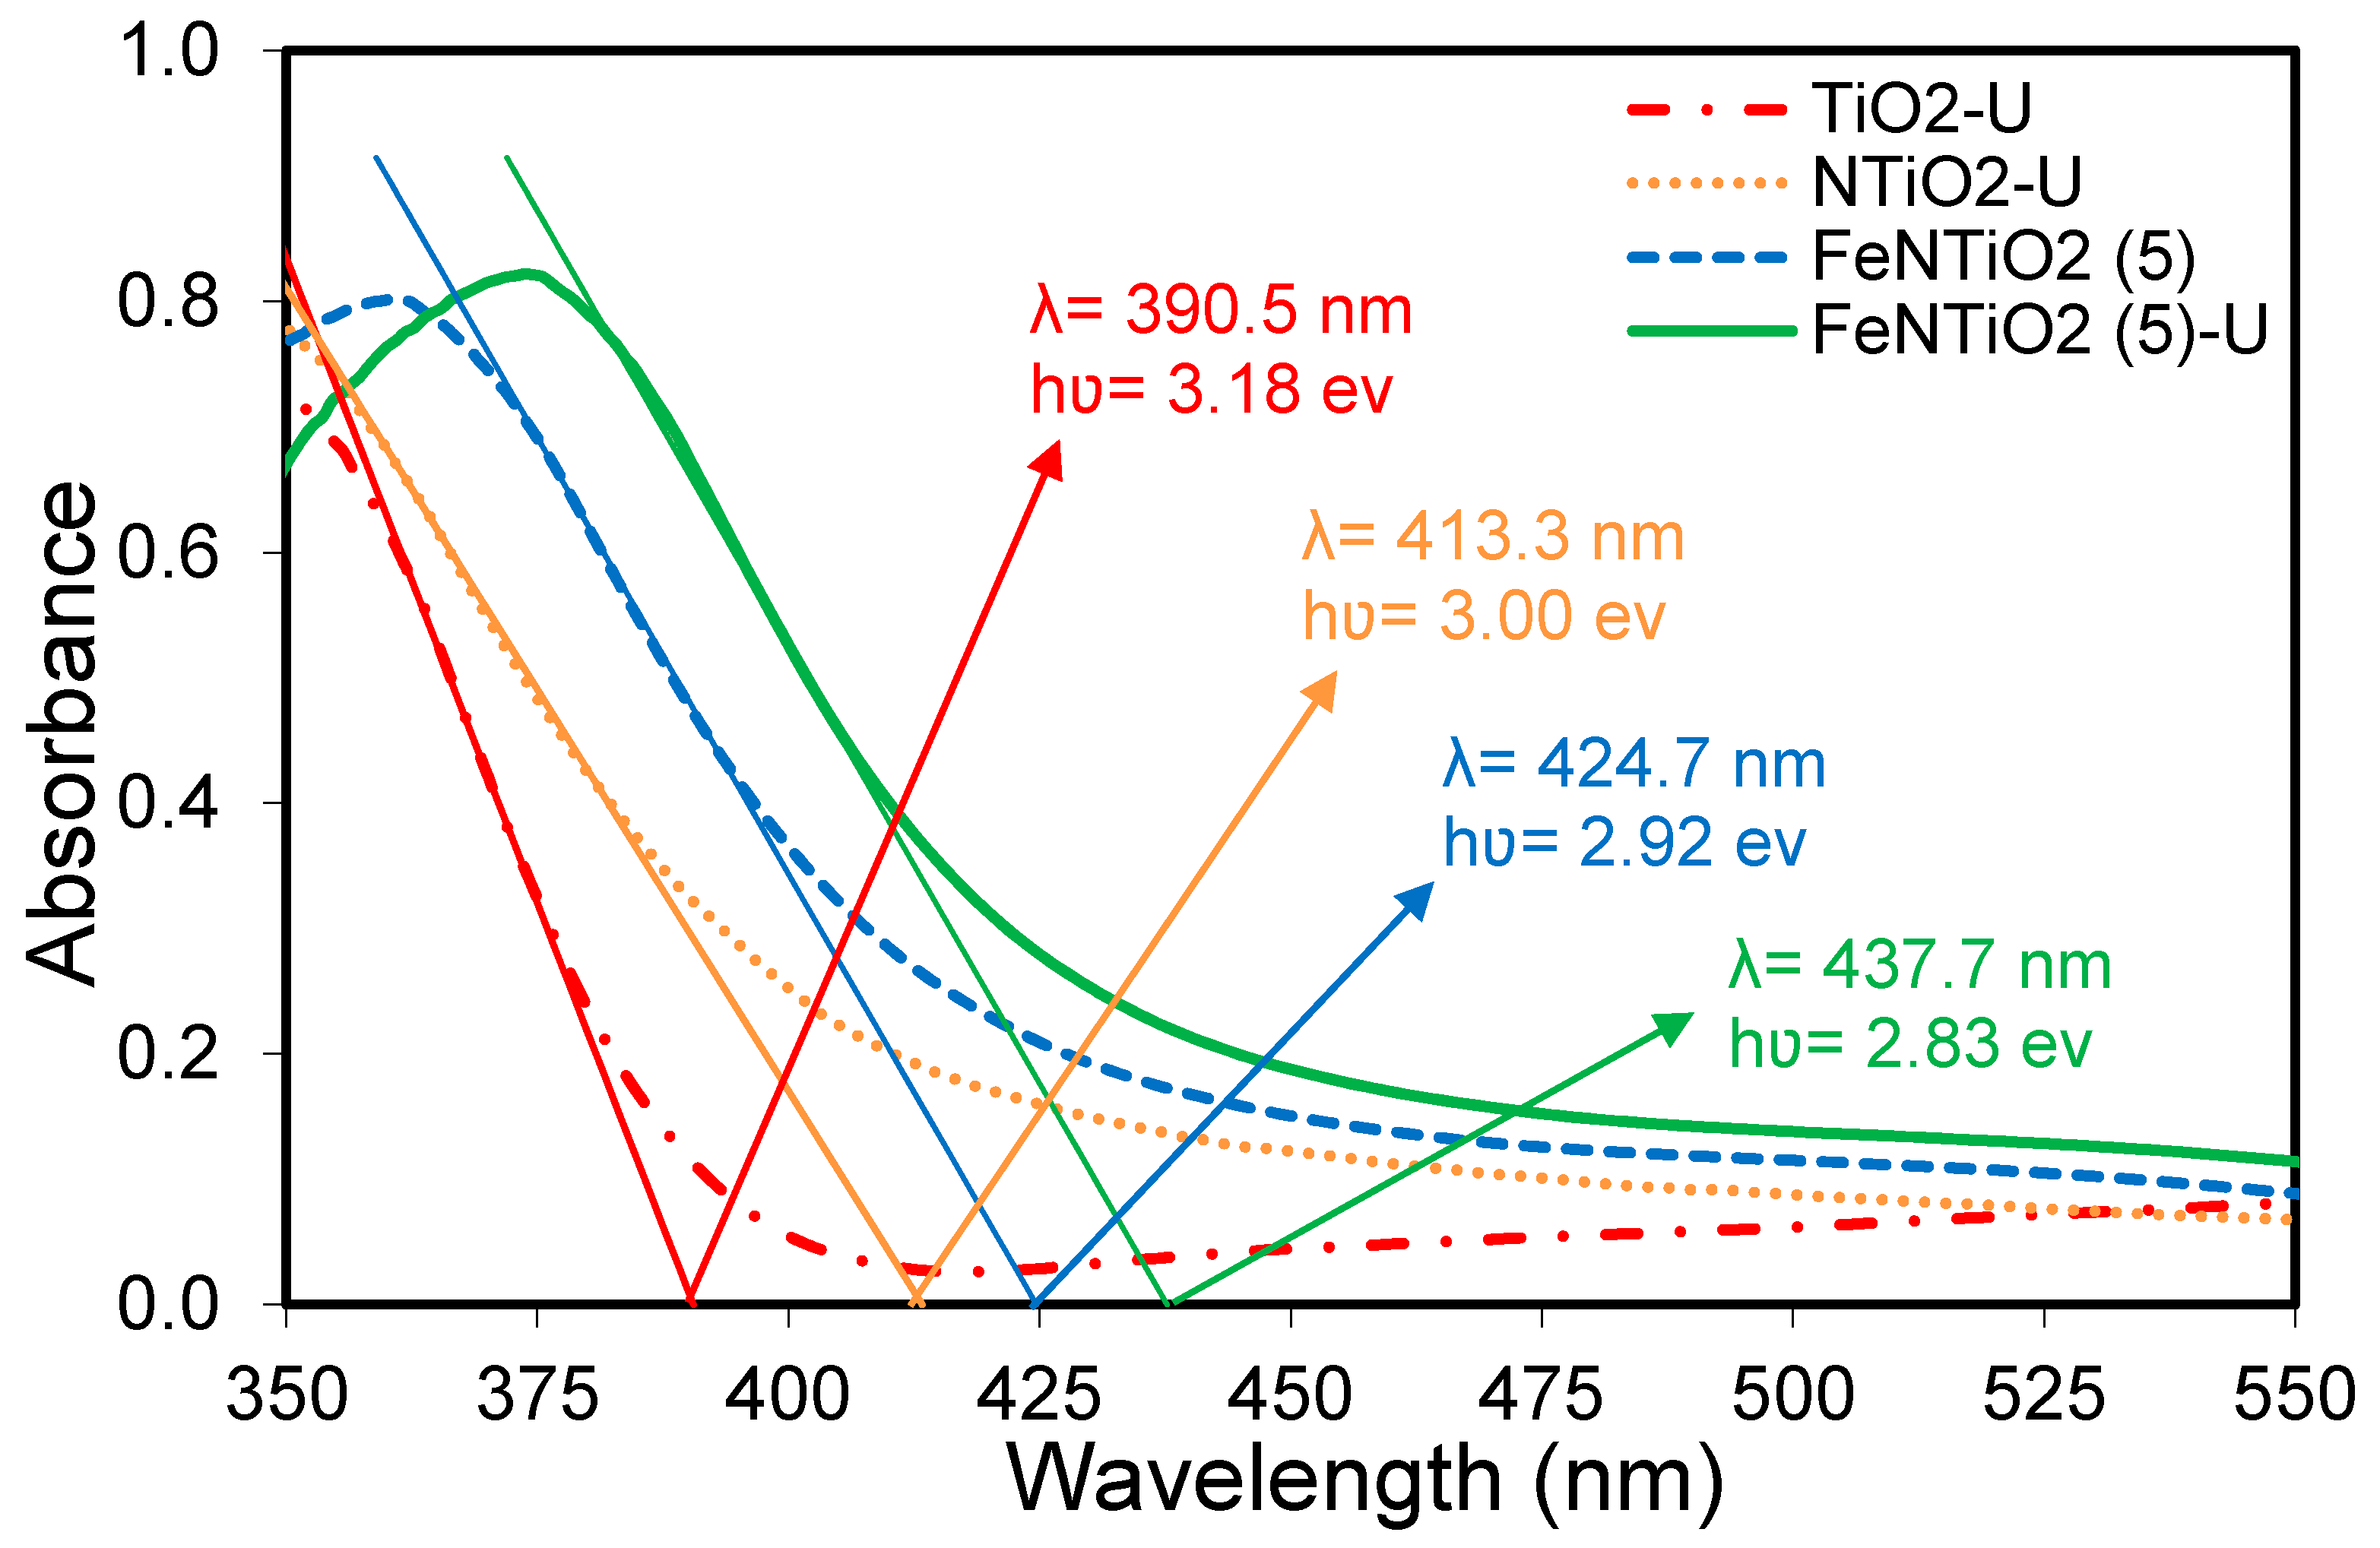
Figure 9 displays the FTIR spectra for both TiO2 and modified TiO2. The broad and intense peaks observed in the range of 480–1050 cm−1 are indicative of Ti-O and Ti-O-Ti bonds within the photocatalysts [62]. The peaks at 1450, 1620, and 3420 cm−1 correspond to the presence of water on the photocatalyst surface, which is either physically adsorbed or associated with OH groups [63,64]. Additionally, the peak at 3420 cm−1 is associated with the bonded OH groups, while the peak at 1620 cm−1 corresponds to the O-H bending of water adsorbed on TiO2 [65,66].
Furthermore, the peaks at 2840 and 2910 cm−1 are attributed to the vibrations of atmospheric C-H or CO₂ present on the photocatalyst surface. Additionally, a small peak observed in the 480–520 cm−1 range is linked to metal oxides, specifically the IR vibrations of the anatase phase of Ti-O. In N-doped samples, this 480–520 cm−1 peak is extended, indicating the formation of non-metal oxides [55,67]. Lastly, the FTIR analysis results show a significant correlation with the findings from EDX and XRD analyses.

3.1.6. DRS Analysis

Figure 10 presents the UV–VIS diffuse reflectance spectra for TiO2 and modified TiO2 photocatalysts. Among all the samples, TiO2-U exhibits the lowest absorption, while FeNTiO2 (5)-U shows the highest absorption. The band gap energies were determined using the formula hʋ = 1240/λ0, where ℎ is Planck’s constant, υ is frequency, and λ0 is the maximum wavelength. The maximum wavelength gradients for TiO2-U, FeTiO2 (2.5)-U, FeNTiO2 (5), and FeNTiO2 (5)-U are 390.5, 413.3, 424.7, and 437.7 nm, respectively. Consequently, the band gap energies were calculated as 3.18, 3.00, 2.92, and 2.83 eV, respectively. The results indicate that doping TiO2 with Fe and N shifts the light absorption edge and reduces band gap energies. Additionally, using the ultrasonic method in synthesizing FeNTiO2 (5)-U increases absorption and decreases band gap energy, demonstrating that this method enhances light absorption by reducing particle size and increasing the number of active sites on the photocatalyst surface [68].
Furthermore, Fe ions introduce a new energy level below the conduction band of TiO2. Additionally, N doping in the TiO2 structure lowers the band gap energies and enhances visible light absorption. This is due to the mixing of the N 2p energy state with the O 2p level at the top of the valence band of TiO2 [69,70]. Moreover, it is evident that the band gap energies and visible light absorption of Fe and N co-doped TiO2 are greater than those of N-doped TiO2 and pure TiO2. This is attributed to the charge transfer transition between the d-electrons of iron ions and the conduction or valence band of TiO2 [71,72,73]. Additionally, iron ions can act as traps for photo-induced electrons. Due to their ability to reduce photo-induced electrons, Fe ions can capture holes at Fe2+ sites, leading to the formation of Fe3+ ions [74].

3.2. Photocatalytic Degradation of Toluene

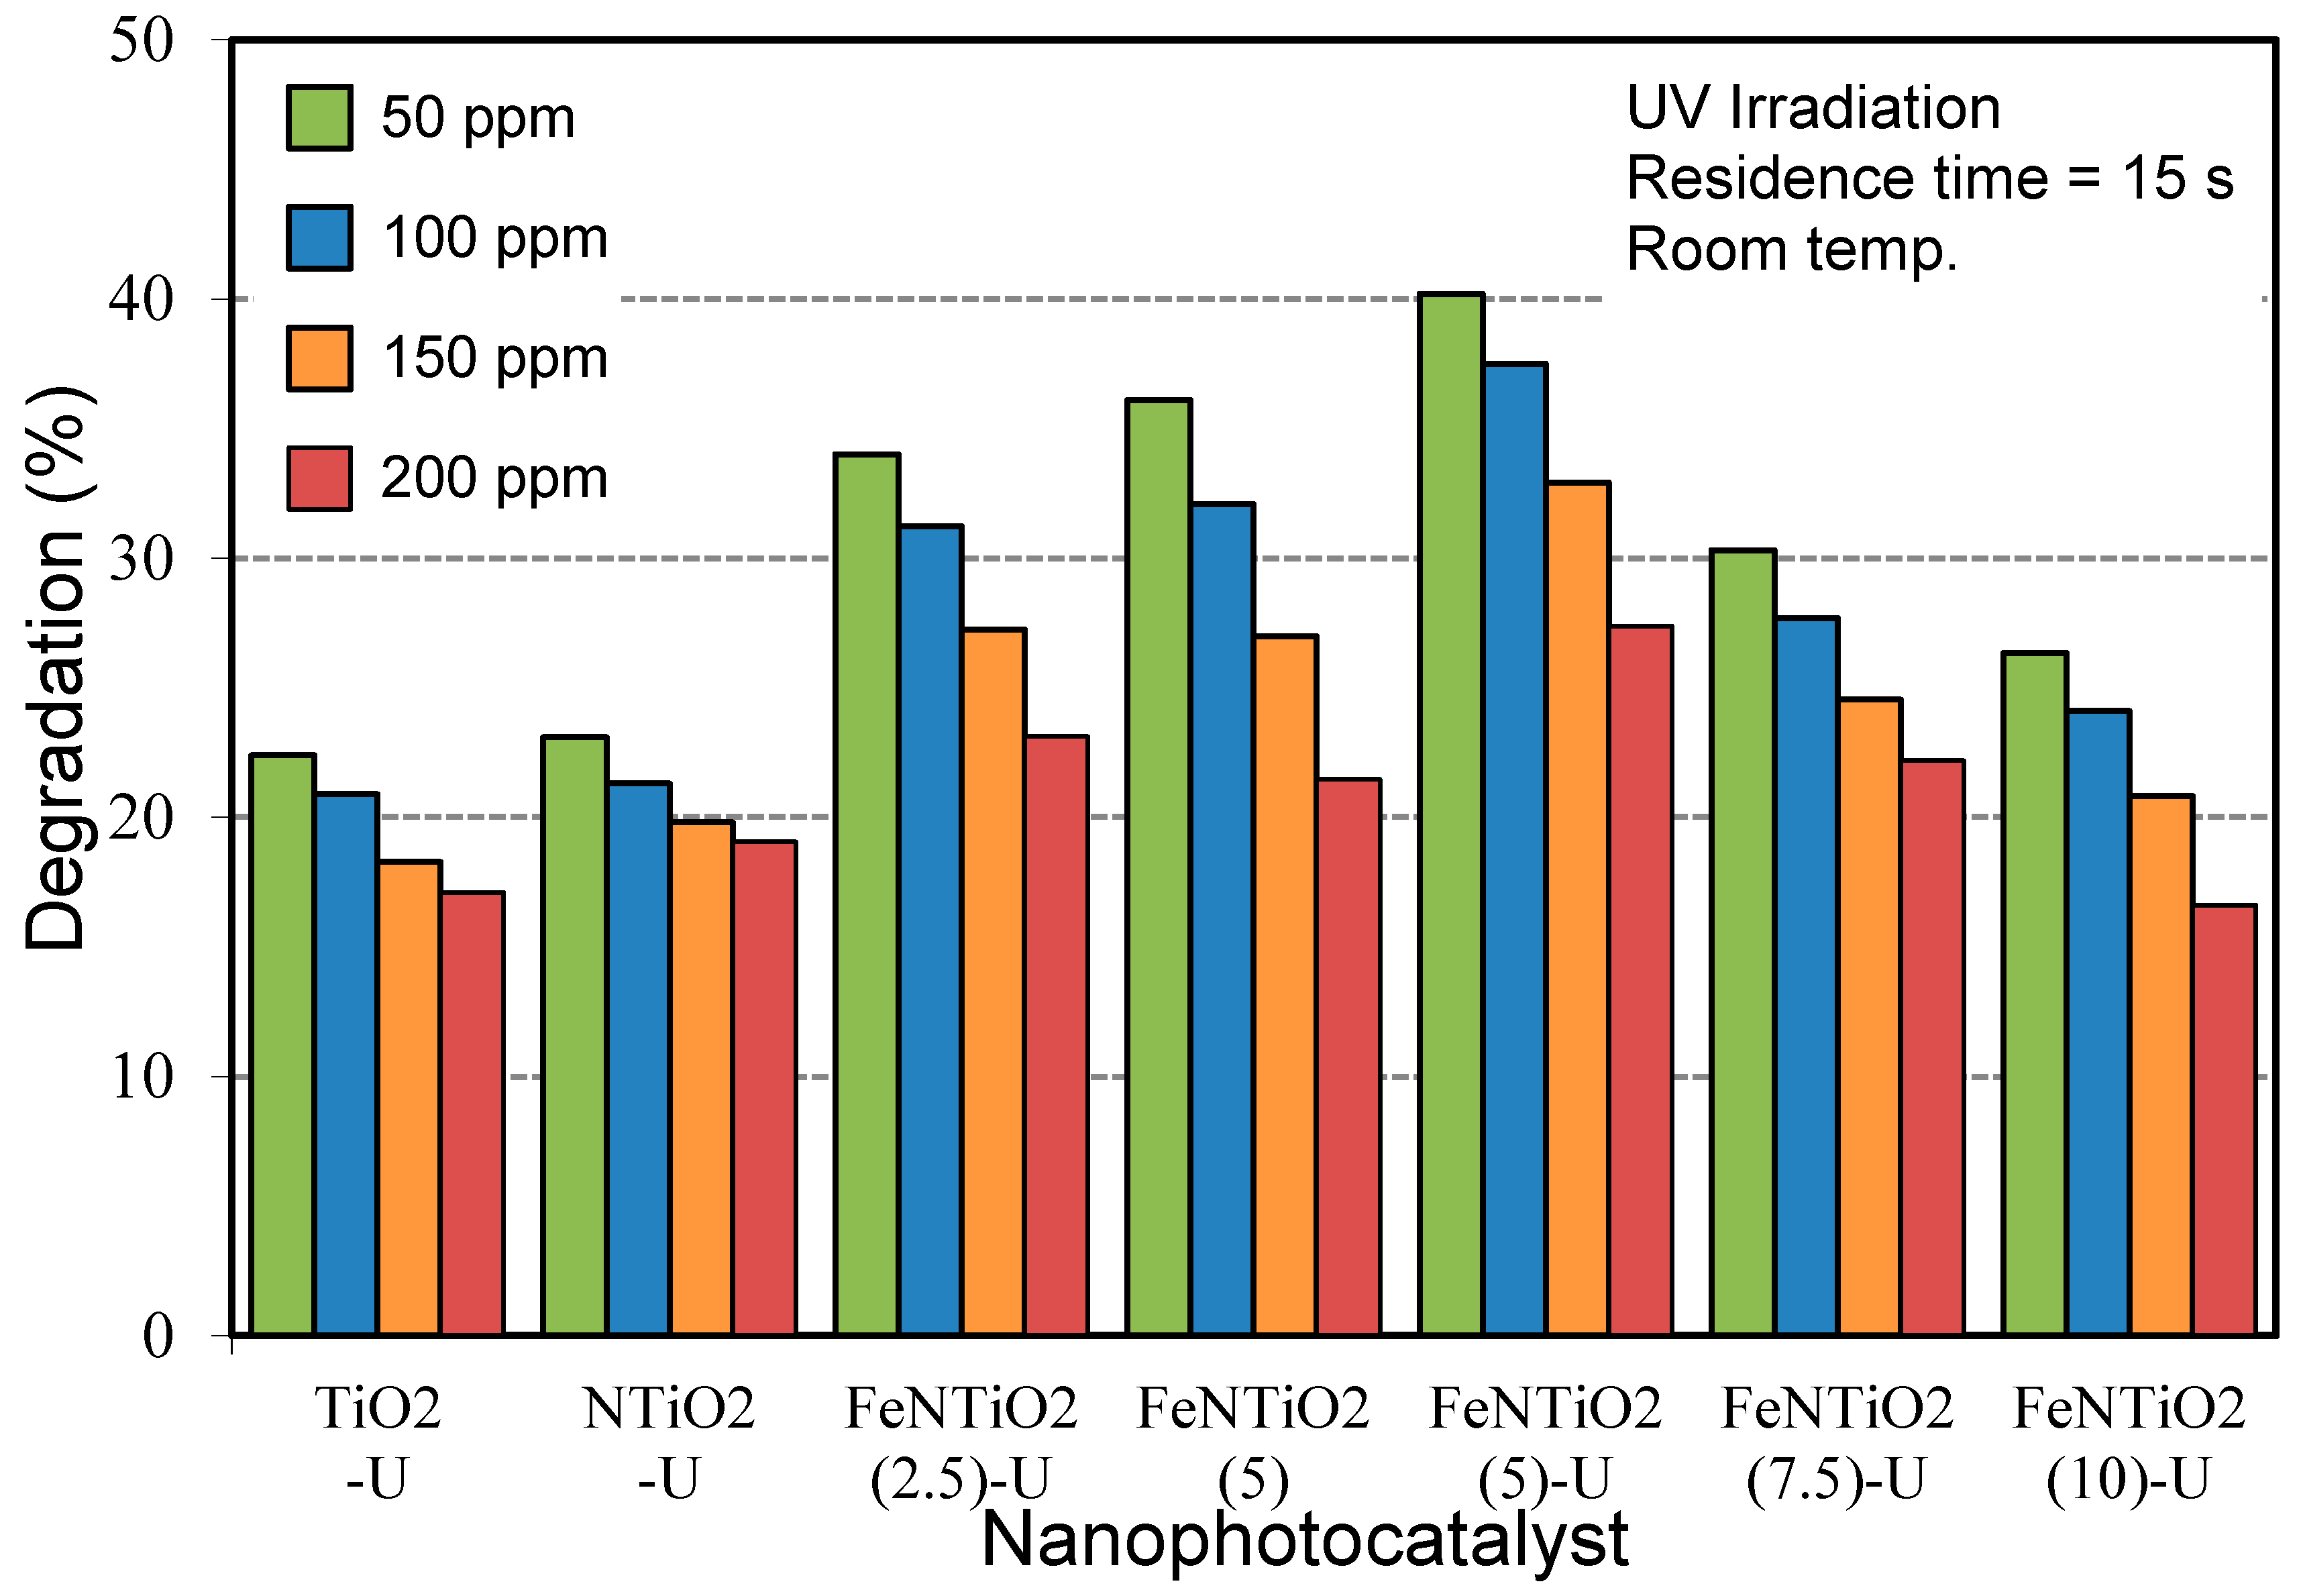
3.2.1. Influence of Doping Composition

Figure 11 illustrates the photocatalytic degradation rate of toluene using TiO2 U, N/TiO2 U, Fe-N/TiO2 (5) U, and Fe-N/TiO2 (5) photocatalysts. At a concentration of 50 ppm, the toluene conversion after 15 s reached 22.40%, 23.30%, 40.2%, and 36.1%, respectively. These results indicate that doping TiO2 with Fe and N enhances the photocatalytic degradation of toluene. The degradation rate is further improved when Fe is doped into the samples using the ultrasound-assisted method. XRD, SEM, and BET analyses confirm that doping with Fe and N reduces crystalline size and increases surface area, while also decreasing agglomeration. Additionally, there is only a slight increase in the degradation rate with N doping alone, which may be due to the removal and washing away of nitrogen during the synthesis process.

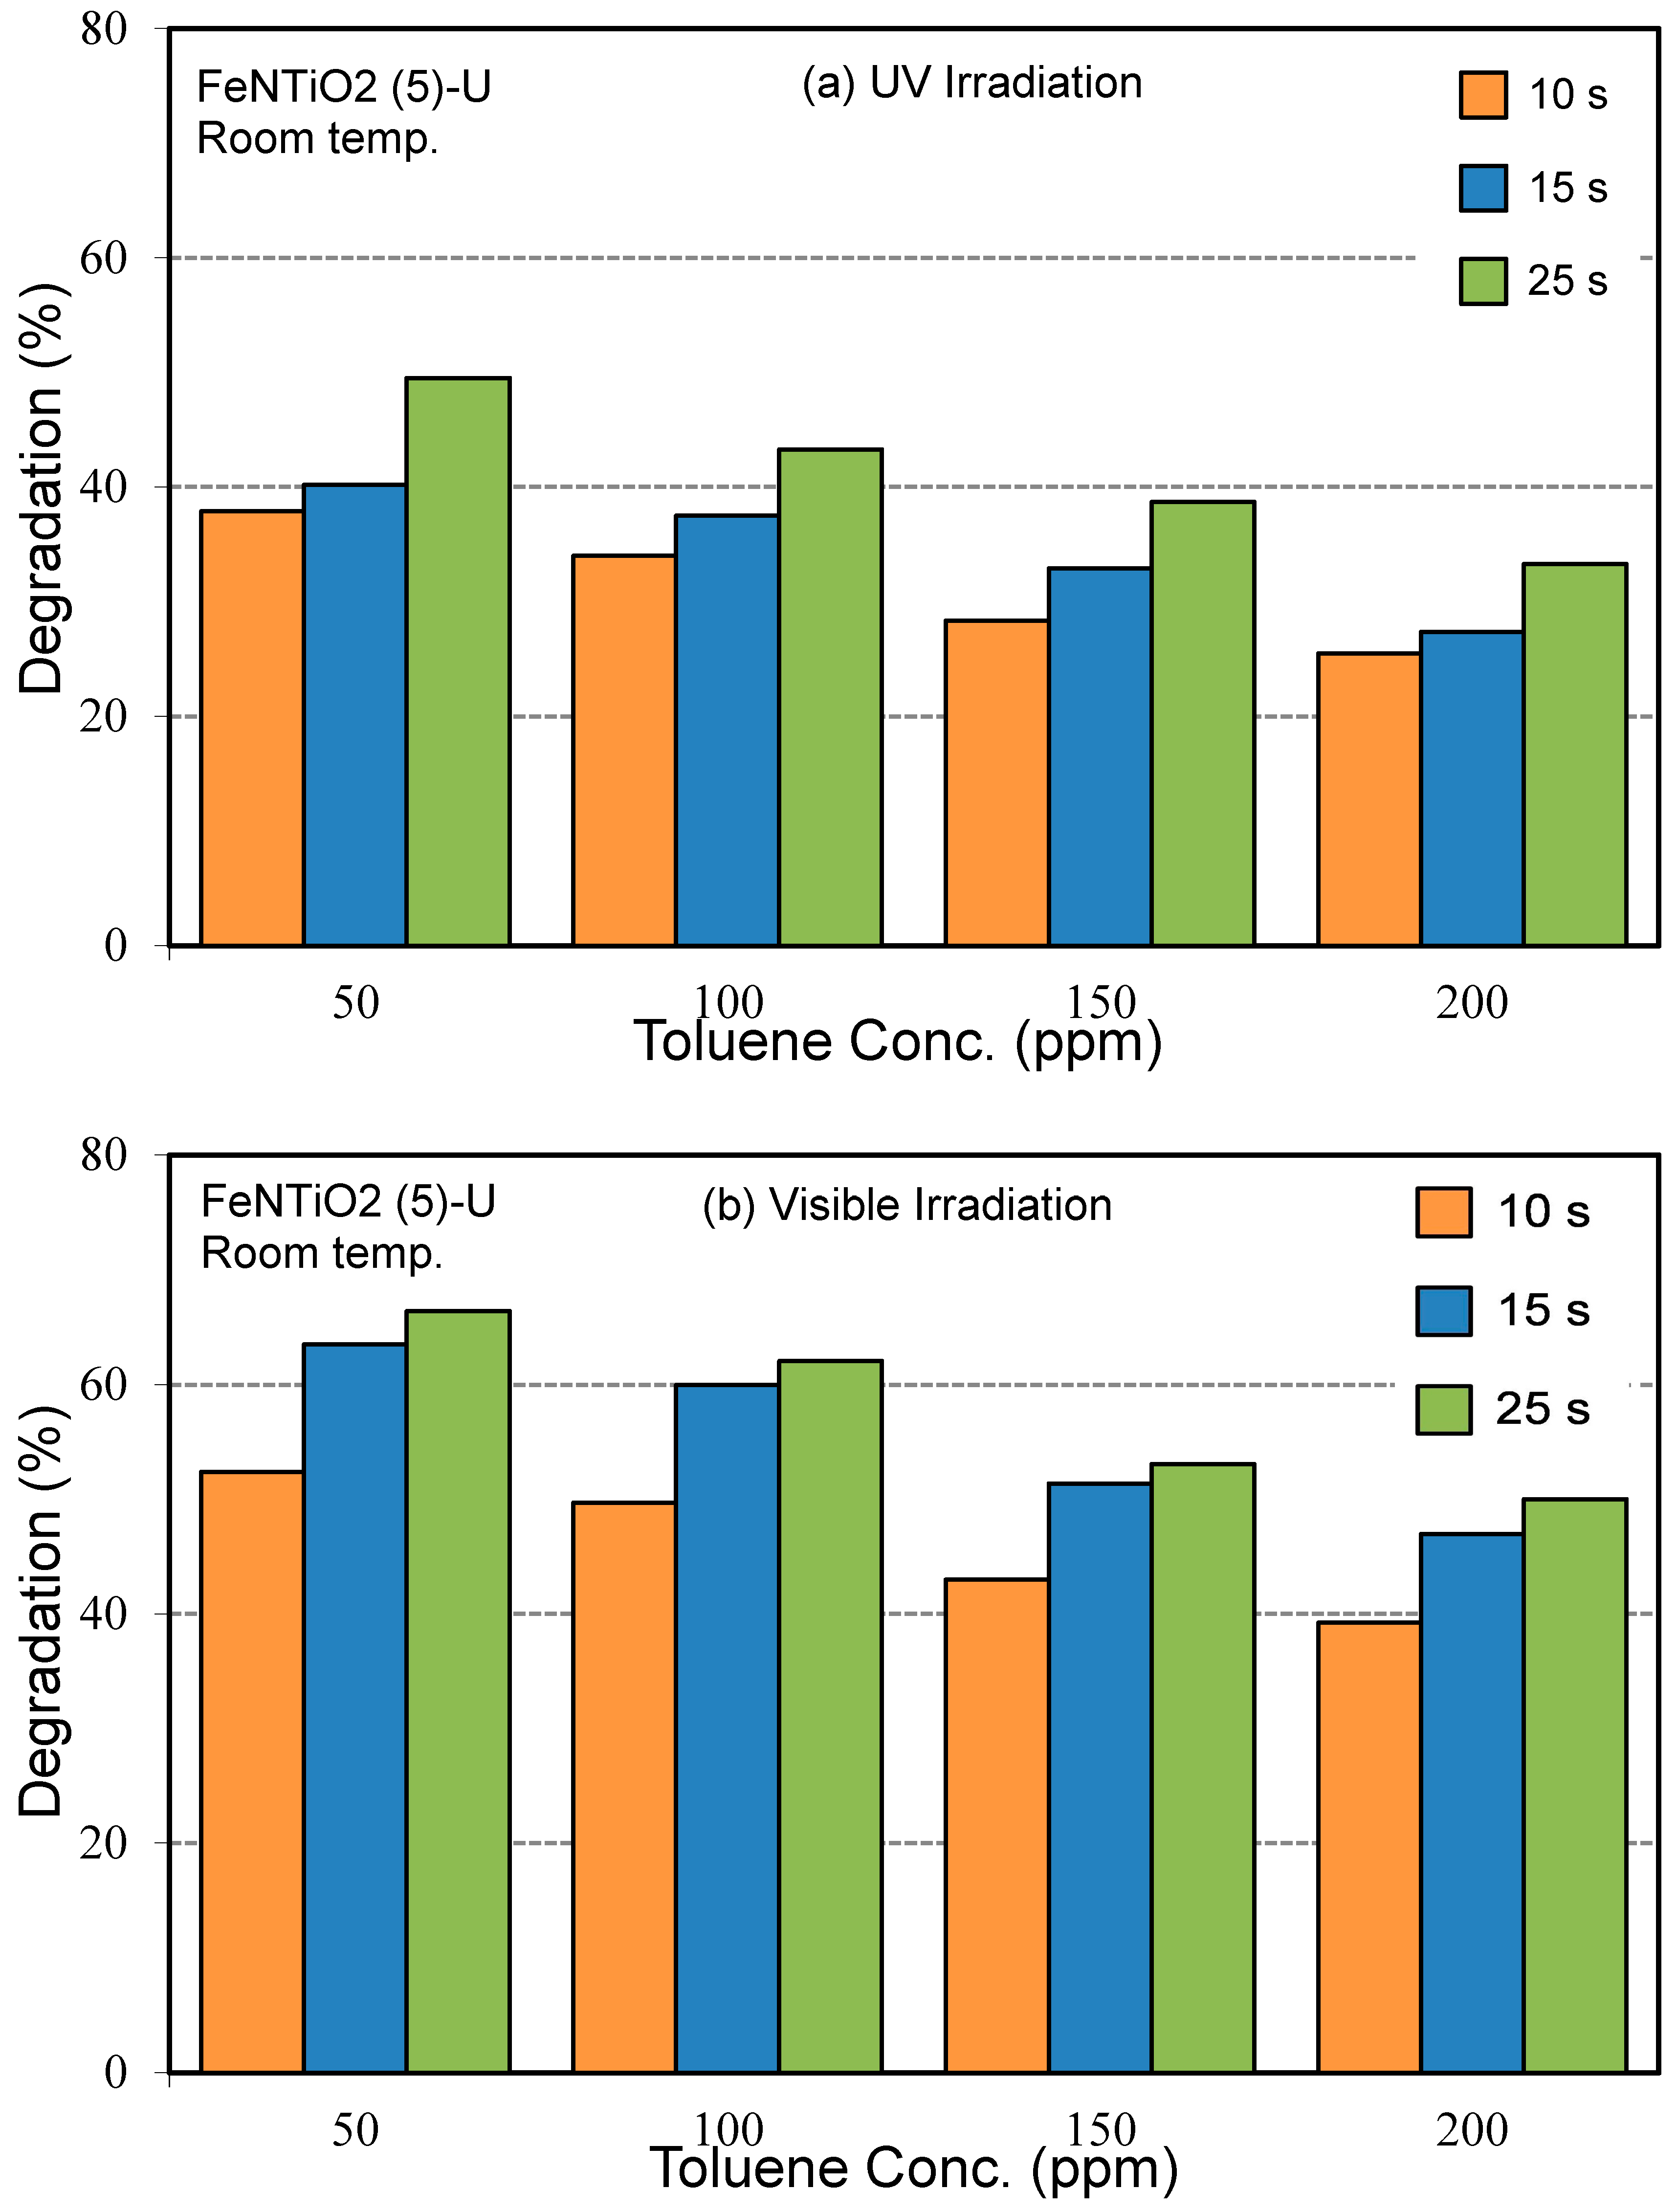
3.2.2. Influence of Ultrasound Irradiation

Figure 12 illustrates the impact of ultrasound-assisted versus conventional methods on the degradation of gaseous toluene. There is a clear distinction in photocatalytic activity between FeNTiO2 (5)-U and FeNTiO2 (5). The sample synthesized using the sonochemical method exhibits significantly higher photocatalytic activity compared to the sample made using the conventional method. This enhanced activity is attributed to the increased number of active sites, improved nucleation, and reduced particle size in the ultrasonic-assisted sample compared to the conventional one [75]. These results demonstrate that the ultrasonic method can enhance photocatalytic activity, effectively improving the removal of pollutants from the air. [76].
Additionally, the impact of varying residence time was examined for Fe-N/TiO2 (5) U and Fe-N/TiO2 (5) samples (see Figure 12). As residence time increased and airflow velocity decreased, the degradation rate of the samples improved. This effect is more pronounced in the ultrasonic-assisted sample. This can be attributed to the extended residence time allowing for longer adsorption, which enhances the contact between photocatalysts and toluene molecules, thereby facilitating more effective oxidation of toluene [77]. Additionally, these results indicate that the degradation of toluene is influenced by the mass transfer to the photocatalyst surface. As residence time decreases and airflow rate increases, the photocatalytic degradation of gaseous toluene diminishes. This reduction is due to the shorter residence time, which limits the amount of toluene that can reach the photocatalyst surface [78]. A study by Korologos et al. [79] reported comparable findings regarding residence time.

3.2.3. Influence of Light Source

The photocatalytic activity of both pure and modified TiO2 was evaluated through the removal of gaseous toluene under UV and visible light to assess the performance of the samples and the effect of different light sources. Initially, experiments conducted without UV or visible light showed no significant reduction in toluene concentration after one reaction cycle, indicating that toluene remains stable in the presence of photocatalysts without light. Figure 13 illustrates the impact of light sources on toluene degradation rates. The degradation rate significantly increased when switching from UV irradiation to visible light (from 40.2% to 63.5% for Fe-N/TiO2 (5) U. UV–VIS DRS analysis shows that doping TiO2 with Fe and N enhances adsorption in the visible light range and reduces the band gap energy. These factors contribute to the improved photocatalytic activity of Fe and N co-doped TiO2 under visible light, surpassing its performance under UV irradiation. Similar findings were reported by Dolat et al. [80].

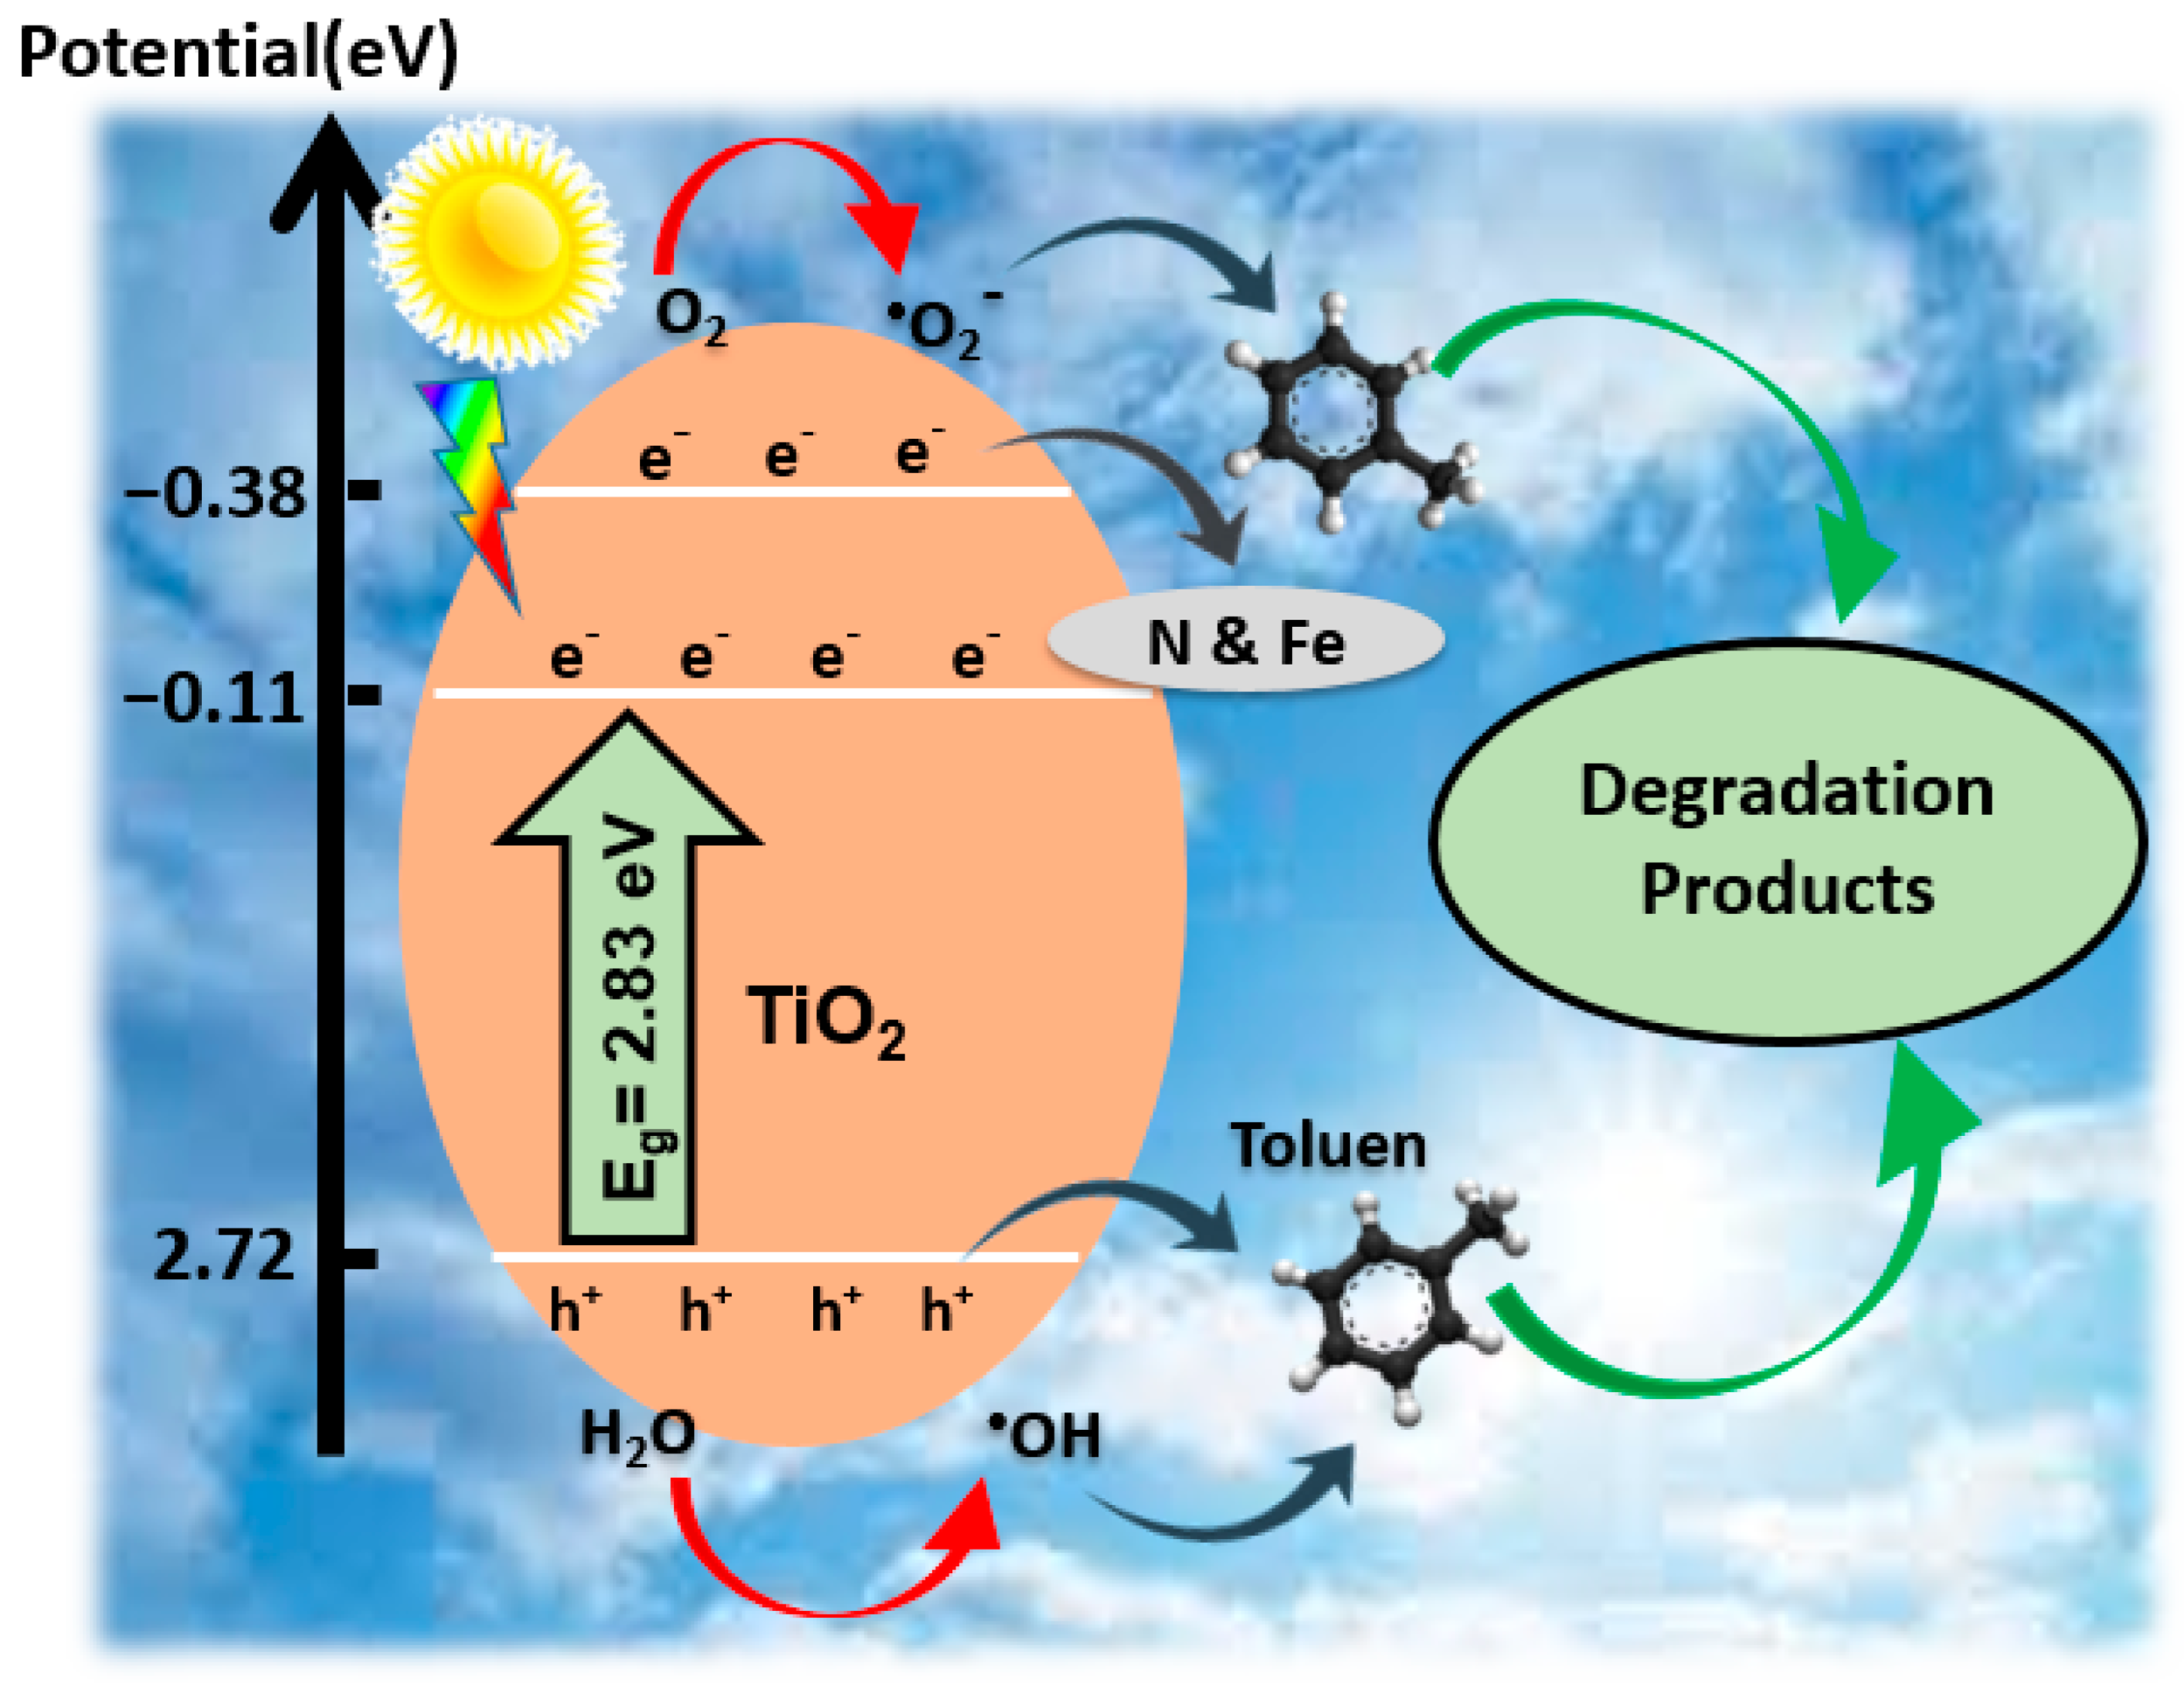
3.3. Reaction Pathway for Toluene Photocatalytic Degradation

To study the mechanism of the photocatalytic degradation process for removing gaseous toluene (Figure 14), the energy value of the valance and conduction band was calculated by:
Evb = X − E0 + 0.5Eg
Ecb =Evb − Eg
In this equation, X is the geometrical mean of the electronegativity of atoms, E0 is the energy of free electrons in the hydrogen scale that is +4.5 eV, Eg is the band gap energy, Ecb is the energy of the conduction band and Evb is the energy of valance band.
Based on these equations, Ecb and Evb of FeNTiO2 (5)-U are −0.11 and +2.72 eV. Because Evb of this sample is more than that of the potential level of H2O/•OH (2.7 eV), pores in the valance band can form OH radicals. Pores on the surface and OH radicals can react with pollutant molecules and degrade them. On the other hand, the reduction–oxidation potential of O2/−•O2− is −0.28 eV, and conduction band electrons cannot produce peroxide radicals. The lowest wavelength energy in the current study is 3.93 eV, so electrons of the valance band can take this energy and excite it to upper levels. These electrons can produce superoxide from absorbed oxygen to the photocatalyst surface. Electrons with small energies (0.7 eV), which exist at low levels, can produce H2O2. Superoxide radicals and hydrogen peroxide can attack pollutant molecules and produce CO2, H2O, and other by-products. Specific surface area FeNTiO2 (5)-U is large and improves absorption of pollutants on their surface. Finally, contact between pollutant and photocatalyst increases and promotes degradation rate. Reaction to degradation of toluene follows:
FeNTiO2(5)-U + hϑ → FeNTiO2(5)-U (e− + h+)
FeNTiO2(5)-U (h+) + H2O → FeNTiO2(5)-U + H+ OH
FeNTiO2(5)-U (h+) + OH → FeNTiO2(5)-U + OH
FeNTiO2(5)-U (e−) + O2 → FeNTiO2(5)-U + O2
O2+ H+ → H2
HO2 + HO2 → H2O2 + O2
FeNTiO2(5)-U (e−) + H2O2-OH + OH
Pollutant + O2− + OH → H2O + CO2 + Other products
While this study presents practical insights, it comes with both advantages and limitations, much like other research in the field. One of the primary strengths of this study is the implementation of a real-based two-stage continuous slope reactor, which closely simulates actual workplace conditions. This setup not only enhances the retention time but also increases the interaction between the pollutant and the photocatalyst surface, thereby potentially improving the overall efficiency of the photocatalytic process. The use of an ultrasonic method to synthesize the photocatalyst is another important advantage, as it increases the photocatalyst’s activity under visible light irradiation, making the procedure more effective and sustainable by employing a wider spectrum of light.
However, despite these strengths, the study also faces certain limitations. A notable drawback is the difficulty in synthesizing bulk volumes of the photocatalyst, primarily due to the requirement of additional starting materials, which can be cost-prohibitive and resource-intensive. Additionally, while the ultrasonic synthesis technique improves photocatalyst activity, it may concern complicated equipment and precise control situations that could pose challenges in replicating the process consistently at a larger scale.
These challenges emphasise areas for future research, such as investigating alternative synthesis techniques that could synthesise larger numbers of photocatalysts without significantly increasing costs or resource demands, and exploring methods to facilitate the ultrasonic synthesis method for easier scalability. By addressing these challenges, the potential for practical, large-scale application of the photocatalytic process can be further realized, contributing to more effective pollutant degradation in real-world settings.

4. Conclusions

In this study, Fe-N/TiO2 photocatalysts were prepared using both ultrasonic-assisted co-precipitation and a hydrothermal method. The ultrasonic-assisted method resulted in smaller particle sizes and higher specific surface areas (SBET), enhancing the photocatalytic activity of the synthesized samples. Among all the samples, Fe-N/TiO2 (5) U demonstrated the highest photocatalytic performance for degrading gaseous toluene within 15 s. BET analysis revealed that the specific surface area of the sample synthesized with ultrasound was 88.3 m2/g, compared to 74 m2/g for the non-ultrasonic-assisted sample, highlighting the role of ultrasound in increasing the SBET of the photocatalysts. XRD analysis showed that the crystalline size of the non-ultrasonic sample was larger than that of the ultrasonic-assisted sample. SEM images indicated that the ultrasonic-assisted sample had significantly less agglomeration, which positively affected the toluene removal rate. Additionally, EDX and FTIR analyses confirmed the successful doping of Fe and N into the TiO2 lattice. The ultrasonic-assisted photocatalyst also had a smaller band gap energy than the non-ultrasonic sample, contributing to its superior photocatalytic performance under visible light. The Fe-N/TiO2 (5) U photocatalyst achieved a 63.5% degradation rate, while the non-ultrasonic-assisted sample achieved only 50%. This study confirms the significant synergistic effect of ultrasound and co-doping in enhancing photocatalytic activity for the degradation of gaseous toluene. Despite the progress made in the photocatalytic degradation of air pollutants, future research should build on the core concept of this study, the use of a continuous reactor, and focus on its application in work environments. Additionally, future studies like this one, which has employed ultrasonic methods and elements such as iron and nitrogen to enhance performance in the visible light spectrum, should explore techniques that further improve photocatalyst efficiency in this range. This is important because ultraviolet radiation has harmful health effects.

5. Patents

This article is derived from a master’s thesis at Tabriz University of Medical Sciences. The reactor used in the study was patented in Iran’s Real Estate and Deeds Registration Organization with registration number 108566 and international classification A61L9/20 on 16 January 2021.

Author Contributions

Conceptualization, O.A. and H.G.; Methodology, O.A., Y.R. and M.H.; Formal analysis, O.A., M.H. and A.T.; Investigation, O.A.; Writing—original draft, O.A.; Writing—review & editing, Y.R., M.H. and H.G.; Supervision, Y.R., M.H. and H.G. All authors have read and agreed to the published version of the manuscript.

Funding

This research was funded by Tabriz University of Medical Sciences.

Data Availability Statement

Data are contained within the article.

Acknowledgments

The authors extend their sincere gratitude to the Iran National Science Foundation, Tabriz University of Medical Sciences, and Sahand University of Technology for their financial support of this research.

Conflicts of Interest

The authors declare no conflict of interest.

Abbreviations

AbbreviationComplete Term
PTFEPoly Tetra Fluoro Ethylene
XRDX-ray Diffraction
BETBrunauer–Emmett–Teller
DRSDiffuse Reflection Spectroscopy
FTIRFourier Transform Infrared Spectroscopy
EDXEnergy Dispersive X-ray Spectroscopy
SEMScanning Electron Microscope
VOCsVolatile Organic Compounds
IRACInternational Agency of Research and Cancer
EPAEnvironmental Protection Agency
NIOSHNational Institute for Occupational Safety and Health
OSHAOccupational Safety and Health Administration
PPEPersonal Protective Equipment
UVUltraviolet irradiation
PCOPhotocatalytic oxidation

References

  1. Campos-Candel, A.; Llobat-Estellés, M.; Mauri-Aucejo, A. Comparative evaluation of liquid chromatography versus gas chromatography using a β-cyclodextrin stationary phase for the determination of BTEX in occupational environments. Talanta 2009, 78, 1286–1292. [Google Scholar] [CrossRef] [PubMed]
  2. Hinwood, A.L.; Rodriguez, C.; Runnion, T.; Farrar, D.; Murray, F.; Horton, A.; Glass, D.; Sheppeard, V.; Edwards, J.W.; Denison, L.; et al. Risk factors for increased BTEX exposure in four Australian cities. Chemosphere 2007, 66, 533–541. [Google Scholar] [CrossRef] [PubMed]
  3. Shakerkhatibi, M.; Benis, K.Z.; Asghari-Jafarabadi, M.; Sadeghi-Bazarghani, H.; Allahverdipour, H.; Oskouei, D.S.; Fatehifar, E.; Farajzadeh, M.; Yadeghari, A.; Ansarin, K.; et al. Air pollution-related asthma profiles among children/adolescents: A multi-group latent class analysis. Ecotoxicol. Environ. Saf. 2021, 219, 112344. [Google Scholar] [CrossRef] [PubMed]
  4. Henry, J.P.; Hill, F.N.; Garst, R.H. Production of Ethylbenzene and Benzene from Toluene. U.S. Patent No. 3,557,235, 19 January 1971. [Google Scholar]
  5. Zhou, Z.-H.; Deng, Y.; Wu, K.-Y.; Tan, Q.-W.; Zhou, X.-L.; Song, D.-L.; Huang, F.-X.; Zeng, W.-H. Source Profiles of VOCs Associated with Typical Industrial Processes in Chengdu. Huan Jing Ke Xue = Huanjing Kexue 2019, 40, 3949–3961. [Google Scholar]
  6. Cho, M.-H.; Jung, S.-H.; Kim, J.-S. Pyrolysis of mixed plastic wastes for the recovery of benzene, toluene, and xylene (BTX) aromatics in a fluidized bed and chlorine removal by applying various additives. Energy Fuels 2009, 24, 1389–1395. [Google Scholar] [CrossRef]
  7. Souza, E.C.; Vessoni-Penna, T.C.; Al Arni, S.; Domínguez, J.M.; Converti, A.; Oliveira, R.P.d.S. Influence of toluene and salinity on biosurfactant production by Bacillus sp.: Scale up from flasks to a bench-scale bioreactor. Braz. J. Chem. Eng. 2017, 34, 395–405. [Google Scholar] [CrossRef]
  8. Cruz, S.L.; Rivera-García, M.T.; Woodward, J.J. Review of toluene action: Clinical evidence, animal studies and molecular targets. J. Drug Alcohol Res. 2014, 3, 235840. [Google Scholar] [CrossRef]
  9. Masekameni, M.D.; Moolla, R.; Gulumian, M.; Brouwer, D. Risk Assessment of Benzene, Toluene, Ethyl Benzene, and Xylene Concentrations from the Combustion of Coal in a Controlled Laboratory Environment. Int. J. Environ. Res. Public Health 2019, 16, 95. [Google Scholar] [CrossRef]
  10. Barros, N.; Carvalho, M.; Silva, C.; Fontes, T.; Prata, J.C.; Sousa, A.; Manso, M.C. Environmental and biological monitoring of benzene, toluene, ethylbenzene and xylene (BTEX) exposure in residents living near gas stations. J. Toxicol. Environ. Health Part A 2019, 82, 550–563. [Google Scholar] [CrossRef]
  11. Li, C.; Li, Q.; Tong, D.; Wang, Q.; Wu, M.; Sun, B.; Su, G.; Tan, L. Environmental impact and health risk assessment of volatile organic compound emissions during different seasons in Beijing. J. Environ. Sci. 2019, 93, 1–12. [Google Scholar] [CrossRef]
  12. Filley, C.M.; Halliday, W.; Kleinschmidt-DeMasters, B. The effects of toluene on the central nervous system. J. Neuropathol. Exp. Neurol. 2004, 63, 1–12. [Google Scholar] [CrossRef] [PubMed]
  13. Yücel, M.; Takagi, M.; Walterfang, M.; Lubman, D.I. Toluene misuse and long-term harms: A systematic review of the neuropsychological and neuroimaging literature. Neurosci. Biobehav. Rev. 2008, 32, 910–926. [Google Scholar] [CrossRef] [PubMed]
  14. Hoffmann, M.R.; Martin, S.T.; Choi, W.; Bahnemann, D.W. Environmental applications of semiconductor photocatalysis. Chem. Rev. 1995, 95, 69–96. [Google Scholar] [CrossRef]
  15. Wang, S.; Ang, H.; Tade, M.O. Volatile organic compounds in indoor environment and photocatalytic oxidation: State of the art. Environ. Int. 2007, 33, 694–705. [Google Scholar] [CrossRef] [PubMed]
  16. Ohno, T.; Mitsui, T.; Matsumura, M. Photocatalytic activity of S-doped TiO2 photocatalyst under visible light. Chem. Lett. 2003, 32, 364–365. [Google Scholar] [CrossRef]
  17. Tang, H.; Berger, H.; Schmid, P.; Lévy, F.; Burri, G. Photoluminescence in TiO2 anatase single crystals. Solid State Commun. 1993, 87, 847–850. [Google Scholar] [CrossRef]
  18. Ikehata, K.; El-Din, M.G. Aqueous pesticide degradation by ozonation and ozone-based advanced oxidation processes: A review (Part II). Ozone Sci. Eng. 2005, 27, 173–202. [Google Scholar] [CrossRef]
  19. Nakata, K.; Fujishima, A. TiO2 photocatalysis: Design and applications. J. Photochem. Photobiol. C Photochem. Rev. 2012, 13, 169–189. [Google Scholar] [CrossRef]
  20. Kim, S.B.; Hong, S.C. Kinetic study for photocatalytic degradation of volatile organic compounds in air using thin film TiO2 photocatalyst. Appl. Catal. B Environ. 2002, 35, 305–315. [Google Scholar] [CrossRef]
  21. Yamashita, H.; Harada, M.; Misaka, J.; Takeuchi, M.; Neppolian, B.; Anpo, M. Photocatalytic degradation of organic compounds diluted in water using visible light-responsive metal ion-implanted TiO2 catalysts: Fe ion-implanted TiO2. Catal. Today 2003, 84, 191–196. [Google Scholar] [CrossRef]
  22. Tayade, R.J.; Kulkarni, R.G.; Jasra, R.V. Transition metal ion impregnated mesoporous TiO2 for photocatalytic degradation of organic contaminants in water. Ind. Eng. Chem. Res. 2006, 45, 5231–5238. [Google Scholar] [CrossRef]
  23. Choi, J.; Park, H.; Hoffmann, M.R. Effects of single metal-ion doping on the visible-light photoreactivity of TiO2. J. Phys. Chem. C 2009, 114, 783–792. [Google Scholar] [CrossRef]
  24. Zhang, J.; Wu, Y.; Xing, M.; Leghari, S.A.K.; Sajjad, S. Development of modified N doped TiO2 photocatalyst with metals, nonmetals and metal oxides. Energy Environ. Sci. 2010, 3, 715–726. [Google Scholar] [CrossRef]
  25. Yu, J.C.; Ho, W.; Yu, J.; Yip, H.; Wong, P.K.; Zhao, J. Efficient visible-light-induced photocatalytic disinfection on sulfur-doped nanocrystalline titania. Environ. Sci. Technol. 2005, 39, 1175–1179. [Google Scholar] [CrossRef] [PubMed]
  26. Ho, W.; Yu, J.C.; Lee, S. Low-temperature hydrothermal synthesis of S-doped TiO2 with visible light photocatalytic activity. J. Solid State Chem. 2006, 179, 1171–1176. [Google Scholar] [CrossRef]
  27. Litter, M.; Navio, J.A. Photocatalytic properties of iron-doped titania semiconductors. J. Photochem. Photobiol. A Chem. 1996, 98, 171–181. [Google Scholar] [CrossRef]
  28. Zhang, Z.; Wang, C.C.; Zakaria, R.; Ying, J.Y. Role of particle size in nanocrystalline TiO2-based photocatalysts. J. Phys. Chem. B 1998, 102, 10871–10878. [Google Scholar] [CrossRef]
  29. Ranjit, K.; Viswanathan, B. Synthesis, characterization and photocatalytic properties of iron-doped TiO2 catalysts. J. Photochem. Photobiol. A Chem. 1997, 108, 79–84. [Google Scholar] [CrossRef]
  30. Wang, C.-Y.; Bahnemann, D.W.; Dohrmann, J.K. A novel preparation of iron-doped TiO2 nanoparticles with enhanced photocatalytic activity. Chem. Commun. 2000, 16, 1539–1540. [Google Scholar] [CrossRef]
  31. Soria, J.; Conesa, J.C.; Augugliaro, V.; Palmisano, L.; Schiavello, M.; Sclafani, A. Dinitrogen photoreduction to ammonia over titanium dioxide powders doped with ferric ions. J. Phys. Chem. 1991, 95, 274–282. [Google Scholar] [CrossRef]
  32. Sun, L.; Li, J.; Wang, C.; Li, S.; Lai, Y.; Chen, H.; Lin, C. Ultrasound aided photochemical synthesis of Ag loaded TiO2 nanotube arrays to enhance photocatalytic activity. J. Hazard. Mater. 2009, 171, 1045–1050. [Google Scholar] [CrossRef] [PubMed]
  33. Matsuzawa, S.; Tanaka, J.; Sato, S.; Ibusuki, T. Photocatalytic oxidation of dibenzothiophenes in acetonitrile using TiO2: Effect of hydrogen peroxide and ultrasound irradiation. J. Photochem. Photobiol. A Chem. 2002, 149, 183–189. [Google Scholar] [CrossRef]
  34. Su, W.; Chen, J.; Wu, L.; Wang, X.; Wang, X.; Fu, X. Visible light photocatalysis on praseodymium (III)-nitrate-modified TiO2 prepared by an ultrasound method. Appl. Catal. B Environ. 2008, 77, 264–271. [Google Scholar] [CrossRef]
  35. Wu, Q.; Ouyang, J.; Xie, K.; Sun, L.; Wang, M.; Lin, C. Ultrasound-assisted synthesis and visible-light-driven photocatalytic activity of Fe-incorporated TiO2 nanotube array photocatalysts. J. Hazard. Mater. 2012, 199, 410–417. [Google Scholar] [CrossRef]
  36. Niksefat, V.; Ghorbani, M. Mechanical and electrochemical properties of ultrasonic-assisted electroless deposition of Ni–B–TiO2 composite coatings. J. Alloys Compd. 2015, 633, 127–136. [Google Scholar] [CrossRef]
  37. Zhang, S. Synergistic effects of C–Cr codoping in TiO2 and enhanced sonocatalytic activity under ultrasonic irradiation. Ultrason. Sonochem. 2012, 19, 767–771. [Google Scholar] [CrossRef]
  38. Teh, C.Y.; Wu, T.Y.; Juan, J.C. Facile sonochemical synthesis of N, Cl-codoped TiO2: Synthesis effects, mechanism and photocatalytic performance. Catal. Today 2015, 256, 365–374. [Google Scholar] [CrossRef]
  39. Asahi, R.; Morikawa, T.; Ohwaki, T.; Aoki, K.; Taga, Y. Visible-light photocatalysis in nitrogen-doped titanium oxides. Science 2001, 293, 269–271. [Google Scholar] [CrossRef]
  40. Cong, Y.; Zhang, J.; Chen, F.; Anpo, M. Synthesis and characterization of nitrogen-doped TiO2 nanophotocatalyst with high visible light activity. J. Phys. Chem. C 2007, 111, 6976–6982. [Google Scholar] [CrossRef]
  41. Choi, W.; Termin, A.; Hoffmann, M.R. The role of metal ion dopants in quantum-sized TiO2: Correlation between photoreactivity and charge carrier recombination dynamics. J. Phys. Chem. 1994, 98, 13669–13679. [Google Scholar] [CrossRef]
  42. Anpo, M.; Ichihashi, Y.; Takeuchi, M.; Yamashita, H. Design of unique titanium oxide photocatalysts by an advanced metal ion-implantation method and photocatalytic reactions under visible light irradiation. Res. Chem. Intermed. 1998, 24, 143–149. [Google Scholar] [CrossRef]
  43. Nakamura, I.; Negishi, N.; Kutsuna, S.; Ihara, T.; Sugihara, S.; Takeuchi, K. Role of oxygen vacancy in the plasma-treated TiO2 photocatalyst with visible light activity for NO removal. J. Mol. Catal. A Chem. 2000, 161, 205–212. [Google Scholar] [CrossRef]
  44. Umebayashi, T.; Yamaki, T.; Itoh, H.; Asai, K. Band gap narrowing of titanium dioxide by sulfur doping. Appl. Phys. Lett. 2002, 81, 454–456. [Google Scholar] [CrossRef]
  45. Pelaez, M.; Nolan, N.T.; Pillai, S.C.; Seery, M.K.; Falaras, P.; Kontos, A.G.; Dunlop, P.S.M.; Hamilton, J.W.J.; Byrne, J.A.; O’Shea, K.; et al. A review on the visible light active titanium dioxide photocatalysts for environmental applications. Appl. Catal. B Environ. 2012, 125, 331–349. [Google Scholar] [CrossRef]
  46. Jung, H.S.; Kim, H. Origin of low photocatalytic activity of rutile TiO2. Electron. Mater. Lett. 2009, 5, 73–76. [Google Scholar] [CrossRef]
  47. Zhang, P.; Yin, S.; Sato, T. The influence of synthesis method on the properties of iron contained N doped TiO2 photocatalysts. Appl. Catal. B Environ. 2011, 103, 462–469. [Google Scholar] [CrossRef]
  48. Inturi, S.N.R.; Suidan, M.; Smirniotis, P.G. Influence of synthesis method on leaching of the Cr-TiO2 catalyst for visible light liquid phase photocatalysis and their stability. Appl. Catal. B Environ. 2016, 180, 351–361. [Google Scholar] [CrossRef]
  49. Zhang, K.; Wang, X.; Guo, X.; He, T.; Feng, Y. Preparation of highly visible light active Fe–N co-doped mesoporous TiO2 photocatalyst by fast sol–gel method. J. Nanoparticle Res. 2014, 16, 2246. [Google Scholar] [CrossRef]
  50. Khalid, N.R.; Ahmed, E.; Rasheed, A.; Ahmad, M.; Ramzan, M.; Shakoor, A.; Elahi, A.; Abbas, S.M.; Hussain, R.; Niaz, N.A. Co-doping effect of carbon and yttrium on photocatalytic activity of TiO2 nanoparticles for methyl orange degradation. J. Ovonic Res. 2015, 11, 107–112. [Google Scholar]
  51. Lachom, V.; Poolcharuansin, P.; Laokul, P. Preparation, characterizations and photocatalytic activity of a ZnO/TiO2 nanocomposite. Mater. Res. Express 2017, 4, 035006. [Google Scholar] [CrossRef]
  52. Eskandarloo, H.; Badiei, A.; Behnajady, M.A.; Ziarani, G.M. Ultrasonic-assisted sol–gel synthesis of samarium, cerium co-doped TiO2 nanoparticles with enhanced sonocatalytic efficiency. Ultrason. Sonochem. 2015, 26, 281–292. [Google Scholar] [CrossRef] [PubMed]
  53. Kalantari, K.; Kalbasi, M.; Sohrabi, M.; Royaee, S.J. Enhancing the photocatalytic oxidation of dibenzothiophene using visible light responsive Fe and N co-doped TiO2 nanoparticles. Ceram. Int. 2017, 43, 973–981. [Google Scholar] [CrossRef]
  54. Shirsath, S.; Pinjari, D.; Gogate, P.; Sonawane, S.; Pandit, A. Ultrasound assisted synthesis of doped TiO2 nano-particles: Characterization and comparison of effectiveness for photocatalytic oxidation of dyestuff effluent. Ultrason. Sonochem. 2013, 20, 277–286. [Google Scholar] [CrossRef] [PubMed]
  55. Ambati, R.; Gogate, P.R. Ultrasound assisted synthesis of iron doped TiO2 catalyst. Ultrason. Sonochem. 2018, 40, 91–100. [Google Scholar] [CrossRef] [PubMed]
  56. Ganesh, I.; Kumar, P.; Gupta, A.; Sekhar, P.; Radha, K.; Padmanabham, G.; Sundararajan, G. Preparation and characterization of Fe-doped TiO2 powders for solar light response and photocatalytic applications. Process. Appl. Ceram. 2012, 6, 21–36. [Google Scholar] [CrossRef]
  57. Zarrabi, M.; Haghighi, M.; Alizadeh, R. Sonoprecipitation dispersion of ZnO nanoparticles over graphene oxide used in photocatalytic degradation of methylene blue in aqueous solution: Influence of irradiation time and power. Ultrason. Sonochem. 2018, 48, 370–382. [Google Scholar] [CrossRef]
  58. Nawawi, W.; Nawi, M. Electron scavenger of thin layer Carbon coated and Nitrogen doped P25 with enhanced photocatalytic activity under visible light fluorescent lamp. J. Mol. Catal. A Chem. 2013, 374, 39–45. [Google Scholar] [CrossRef]
  59. Asl, E.A.; Haghighi, M.; Talati, A. Sono-solvothermal fabrication of flowerlike Bi7O9I3-MgAl2O4 pn nano-heterostructure photocatalyst with enhanced solar-light-driven degradation of methylene blue. Sol. Energy 2019, 184, 426–439. [Google Scholar]
  60. Chen, X.; Kuo, D.-H.; Lu, D. N-doped mesoporous TiO2 nanoparticles synthesized by using biological renewable nanocrystalline cellulose as template for the degradation of pollutants under visible and sun light. Chem. Eng. J. 2016, 295, 192–200. [Google Scholar] [CrossRef]
  61. He, K.; Zhao, C.; Zhao, G.; Han, G. Effects of pore size on the photocatalytic activity of mesoporous TiO2 prepared by a sol–gel process. J. Sol-Gel Sci. Technol. 2015, 75, 557–563. [Google Scholar] [CrossRef]
  62. Jagadale, T.C.; Takale, S.P.; Sonawane, R.S.; Joshi, H.M.; Patil, S.I.; Kale, B.B.; Ogale, S.B. N-doped TiO2 nanoparticle based visible light photocatalyst by modified peroxide sol−gel method. J. Phys. Chem. C 2008, 112, 14595–14602. [Google Scholar] [CrossRef]
  63. Ropero-Vega, J.L.; Aldana-Pérez, A.; Gómez, R.; Niño-Gómez, M.E. Sulfated titania [TiO2/SO42−]: A very active solid acid catalyst for the esterification of free fatty acids with ethanol. Appl. Catal. A: Gen. 2010, 379, 24–29. [Google Scholar] [CrossRef]
  64. Shouxin, L.; Xiaoyun, C.; Xi, C. Preparation of N-doped visible-light response nanosize TiO2 photocatalyst using the acid-catalyzed hydrolysis method. Chin. J. Catal. 2006, 27, 697–702. [Google Scholar]
  65. Cheng, X.; Yu, X.; Xing, Z. Enhanced photoelectric property and visible activity of nitrogen doped TiO2 synthesized from different nitrogen dopants. Appl. Surf. Sci. 2013, 268, 204–208. [Google Scholar] [CrossRef]
  66. Wang, J.; Zhu, W.; Zhang, Y.; Liu, S. An efficient two-step technique for nitrogen-doped titanium dioxide synthesizing: Visible-light-induced photodecomposition of methylene blue. J. Phys. Chem. C 2007, 111, 1010–1014. [Google Scholar] [CrossRef]
  67. Sood, S.; Umar, A.; Mehta, S.K.; Kansal, S.K. Highly effective Fe-doped TiO2 nanoparticles photocatalysts for visible-light driven photocatalytic degradation of toxic organic compounds. J. Colloid Interface Sci. 2015, 450, 213–223. [Google Scholar] [CrossRef] [PubMed]
  68. Kim, T.-H.; Rodríguez-González, V.; Gyawali, G.; Cho, S.-H.; Sekino, T.; Lee, S.-W. Synthesis of solar light responsive Fe, N co-doped TiO2 photocatalyst by sonochemical method. Catal. Today 2013, 212, 75–80. [Google Scholar] [CrossRef]
  69. Kalantari, K.; Kalbasi, M.; Sohrabi, M.; Royaee, S.J. Synthesis and characterization of N-doped TiO2 nanoparticles and their application in photocatalytic oxidation of dibenzothiophene under visible light. Ceram. Int. 2016, 42, 14834–14842. [Google Scholar] [CrossRef]
  70. Karvinen, S.; Hirva, P.; Pakkanen, T.A. Ab initio quantum chemical studies of cluster models for doped anatase and rutile TiO2. J. Mol. Struct. Theochem 2003, 626, 271–277. [Google Scholar] [CrossRef]
  71. Chen, C.-C.; Hu, S.-H.; Fu, Y.-P. Effects of surface hydroxyl group density on the photocatalytic activity of Fe3+-doped TiO2. J. Alloys Compd. 2015, 632, 326–334. [Google Scholar] [CrossRef]
  72. Cong, Y.; Zhang, J.; Chen, F.; Anpo, M.; He, D. Preparation, photocatalytic activity, and mechanism of nano-TiO2 co-doped with nitrogen and iron (III). J. Phys. Chem. C 2007, 111, 10618–10623. [Google Scholar] [CrossRef]
  73. Adán, C.; Bahamonde, A.; Oller, I.; Malato, S.; Martínez-Arias, A. Influence of iron leaching and oxidizing agent employed on solar photodegradation of phenol over nanostructured iron-doped titania catalysts. Appl. Catal. B Environ. 2014, 144, 269–276. [Google Scholar] [CrossRef]
  74. Li, X.; Chen, Z.; Shi, Y.; Liu, Y. Preparation of N, Fe co-doped TiO2 with visible light response. Powder Technol. 2011, 207, 165–169. [Google Scholar] [CrossRef]
  75. Neppolian, B.; Wang, Q.; Jung, H.; Choi, H. Ultrasonic-assisted sol-gel method of preparation of TiO2 nano-particles: Characterization, properties and 4-chlorophenol removal application. Ultrason. Sonochem. 2008, 15, 649–658. [Google Scholar] [CrossRef] [PubMed]
  76. Sancheti, S.V.; Saini, C.; Ambati, R.; Gogate, P.R. Synthesis of ultrasound assisted nanostuctured photocatalyst (NiO supported over CeO2) and its application for photocatalytic as well as sonocatalytic dye degradation. Catal. Today 2018, 300, 50–57. [Google Scholar] [CrossRef]
  77. Akly, C.; Chadik, P.A.; Mazyck, D.W. Photocatalysis of gas-phase toluene using silica–titania composites: Performance of a novel catalyst immobilization technique suitable for large-scale applications. Appl. Catal. B Environ. 2010, 99, 329–335. [Google Scholar] [CrossRef]
  78. Demeestere, K.; Dewulf, J.; De Witte, B.; Beeldens, A.; Van Langenhove, H. Heterogeneous photocatalytic removal of toluene from air on building materials enriched with TiO2. Build. Environ. 2008, 43, 406–414. [Google Scholar] [CrossRef]
  79. Korologos, C.A.; Philippopoulos, C.J.; Poulopoulos, S.G. The effect of water presence on the photocatalytic oxidation of benzene, toluene, ethylbenzene and m-xylene in the gas-phase. Atmos. Environ. 2011, 45, 7089–7095. [Google Scholar] [CrossRef]
  80. Dolat, D.; Mozia, S.; Ohtani, B.; Morawski, A.W. Nitrogen, iron-single modified (N-TiO2, Fe-TiO2) and co-modified (Fe, N-TiO2) rutile titanium dioxide as visible-light active photocatalysts. Chem. Eng. J. 2013, 225, 358–364. [Google Scholar] [CrossRef]
Figure 1. One-pot sonoprecipitation design of FeNTiO2 nanophotocatalyst via ultrasound and co-doping synergistic method.
Buildings 14 02876 g001
Figure 2. Experimental setup for one-pot sonoprecipitation design of FeNTiO2 nanophotocatalyst via ultrasound and co-doping synergistic method.
Buildings 14 02876 g002
Figure 3. Experimental setup for testing of photocatalytic performance of co-doped FeNTiO2 nanophotocatalyst in efficient visible light responsive photodecomposition of toluene from polluted air in a flow reactor.
Buildings 14 02876 g003
Figure 4. XRD patterns of co-doped FeNTiO2 nanophotocatalysts: (a) TiO2-U, (b) NTiO2-U, (c) FeNTiO2 (2.5)-U, (d) FeNTiO2 (5), (e) FeNTiO2 (5)-U, (f) FeNTiO2 (7.5)-U and (g) FeNTiO2 (10)-U.
Buildings 14 02876 g004
Figure 5. FESEM images of co-doped FeNTiO2 nanophotocatalysts: (a) TiO2-U, (b) NTiO2-U, (c) FeNTiO2 (5) and (d) FeNTiO2 (5)-U.
Buildings 14 02876 g005
Figure 6. Overview of 3D surface images of co-doped FeNTiO2 nanophotocatalysts: (a) FeNTiO2 (5) and (b) FeNTiO2 (5)-U.
Buildings 14 02876 g006
Figure 7. EDX analysis of co-doped FeNTiO2 nanophotocatalysts: (a) TiO2-U, (b) NTiO2-U, (c) FeNTiO2 (5) and (d) FeNTiO2 (5)-U.
Buildings 14 02876 g007
Figure 8. Adsorption/Desorption isotherms and pore size distribution of co-doped FeNTiO2 nanophotocatalysts: (a) TiO2-U, (b) NTiO2-U, (c) FeNTiO2 (5) and (d) FeNTiO2 (5)-U.
Buildings 14 02876 g008aBuildings 14 02876 g008b
Figure 9. FTIR analysis of co-doped FeNTiO2 nanophotocatalysts: (a) TiO2-U, (b) NTiO2-U and (c) FeNTiO2 (5)-U.
Buildings 14 02876 g009
Figure 10. DRS analysis of co-doped FeNTiO2 nanophotocatalysts: TiO2-U, NTiO2-U and FeNTiO2 (5)-U.
Buildings 14 02876 g010
Figure 11. Influence of doping composition on photocatalytic degradation of various toluene concentrations over FeNTiO2 nanophotocatalysts under UV irradiation.
Buildings 14 02876 g011
Figure 12. Influence of ultrasound irradiation at various residence times on co-doping of FeNTiO2 nanophotocatalysts in photocatalytic degradation of gaseous toluene under UV irradiation: (a) without ultrasound and (b) with ultrasound.
Buildings 14 02876 g012
Figure 13. Influence of light source on photocatalytic degradation of various toluene concentrations over FeNTiO2 (5)-U nanophotocatalyst.
Buildings 14 02876 g013
Figure 14. Reaction mechanism of photodegradation of toluene over FeNTiO2 (5)-U nanophotocatalyst.
Buildings 14 02876 g014
Table 1. XRD Major Peaks of TiO2.
NoSubstanceJCPDS NoPhaseXRD Major Peaks
1TiO200-001-0562Anatase25.3, 37.9, 48.4, 53.9, 55.3, 62.7, 69.0, 70.2, 75.4, 83.2
Table 2. Structural properties of co-doped FeNTiO2 nanophotocatalyst.
NanophotocatalystN
(wt. %)
Fe/TiO2 (wt. %)Ultrasound IrradiationSBET
(m2/g)
VP
(cm3/g)
DP
(nm)
λ0
(nm)
Band Gap
(eV)
Relative Crystallinity
Time (min)Power (W)TiO2 a
TiO2-U-04530047.80.131010.6390.53.18100
NTiO2-U3004530088.00.18808.2413.3392.6
FeNTiO2(2.5)-U302.545300-----86.2
FeNTiO2(5)305--89.40.19408.1424.72.9275.5
FeNTiO2(5)-U3054530088.30.20709.3437.72.8361.7
FeNTiO2(7.5)-U307.545300-----48.9
FeNTiO2(10)-U301045300-----40.4
a Crystallite phase: Anatase (JCPDS: 00-001-0562, 2θ = 25.3, 37.9, 48.4, 53.9, 55.3, 62.7, 69.0, 70.2, 75.4 and 83.2°).
Disclaimer/Publisher’s Note: The statements, opinions and data contained in all publications are solely those of the individual author(s) and contributor(s) and not of MDPI and/or the editor(s). MDPI and/or the editor(s) disclaim responsibility for any injury to people or property resulting from any ideas, methods, instructions or products referred to in the content.

