Article

Consideration of Different Soil Properties and Roughness in Shear Characteristics of Concrete–Soil Interface

by
Shihao Wang
,
Zhenqiang Ni
*,
Fengzhan Hou
,
Wenlan Li
and
Long Bing
College of Architecture and Engineering, Liaocheng University, Liaocheng 252000, China
*
Author to whom correspondence should be addressed.
Buildings 2024, 14(9), 2889; https://doi.org/10.3390/buildings14092889
Submission received: 19 August 2024 / Revised: 4 September 2024 / Accepted: 10 September 2024 / Published: 12 September 2024
(This article belongs to the Section Building Materials, and Repair & Renovation)

Abstract

:
To investigate the impact of diverse soil characteristics and surface irregularities on interfacial shear strength attributes, a large-scale straight shear apparatus and particle flow software were employed to conduct interfacial shear experiments with varying soil properties and surface irregularities. The results demonstrated that, under an identical R and normal stress conditions, the clay and silty clay shear stress–displacement curves exhibited strain softening, while the silt curve exhibited strain hardening. An increase in R can markedly enhance the peak shear strength at the interface, although a critical value exists beyond which this effect is no longer observed. The Rc is primarily contingent upon the soil properties. Numerical simulations demonstrate that the internal shear displacement and deformation resulting from the diverse soil properties are distinct. Clay particles are constituted of varying-sized particle aggregates that collectively resist shear. Silt particles resist shear through interfacial friction generated by shear. The practicality of Duncan and Clough’s constitutive model for interfacial shear with roughness influence is verified, and the constitutive model under strain hardening is modified.

1. Introduction

The interactions between concrete and soils are a common feature of engineering structures, including piles and soils, retaining walls and slope soils, and skidding piles and landslide soils. The mechanical characteristics of these interactions play an important role in ensuring the structural stability of the structures in question [1,2]. The roughness of the concrete pile surface exerts a significant influence on the pile lateral friction resistance, soil shear strength, and the soil shear zone in the vicinity of the contact surface [3,4]. The interfacial shear mechanical properties of the pile–soil interface are of great consequence to the bearing capacity of the pile, which is a topic of considerable research interest. A great many scholars have conducted systematic research on the factors that influence interfacial shear, including the roughness of the structural surface, the property of the soil, and the water content.
In examining the shear characteristics of the interface between concrete and soil, several studies have indicated that the predominant failure mode is the rigid–plastic deformation of the soil. In related studies, the Duncan–Chang model has been developed under various conditions to simulate the behavior of soil mechanics. Additionally, a multiple linear regression formula has been proposed to predict the cohesive force and internal friction angle of the interface [5,6,7,8,9,10]. The results of large-scale direct shear tests demonstrate that the mechanical properties of the contact surface are markedly influenced by a number of factors, including the surface roughness of the structural element, the mechanical properties of the soil, and the normal stress. The interface shear strength, soil cohesion, internal friction angle, and residual strength increase with increasing interface roughness, while the shear strength tends to stabilize with increasing shear displacement. When the roughness is maintained at a constant level, no correlation is observed between the interface shear strength and the form of the structural surface. Other related studies and direct shear tests have also identified significant size effects [11,12,13,14,15,16,17,18]. The results of the numerical simulation of discrete elements demonstrate that the shear failure mode of the contact surface, the movement of soil particles in the vicinity of the contact surface, and the distribution of contact forces are influenced by the conditions at the interface. In the case of CNS conditions, the peak shear stress at the interface displays an enhancement characteristic, whereas under CNL conditions, the peak shear stress at the interface exhibits a weakening characteristic [19,20,21]. The material’s constitutive modeling in recent years has modeled the friction of soil very accurately [22,23].
In conclusion, numerous scholars have previously investigated the shear properties of the concrete–soil interface. The theoretical analysis is primarily conducted through the stress–strain relationship, which is used to construct the constitutive relationship. The numerical simulation is mainly carried out through the use of finite element software, which is employed to simulate the contact and coupling relationship of the interface. Indoor experiments are primarily conducted through the use of different concrete interface roughness levels, with the aim of studying the shear properties of concrete–soil. The theoretical analysis has seen significant advancements, yet the surface treatment of concrete roughness in indoor experiments is typically created as regular grooves, which do not align with the actual concrete surface and exhibit considerable deviation. Moreover, there is a paucity of experiments on the interface shear properties, considering different soil properties [24].
Accordingly, this paper employs the method of casting concrete on the surface of sand under varying degrees of coarseness to create concrete surfaces with distinct levels of roughness. The contact soil is composed of clay, silty clay, and silt, representing three distinct soil properties. A large-scale straight shear experiment is conducted to investigate the concrete–interface shear characteristics in consideration of varying soil properties and roughness. Additionally, the shear strength and stress–strain relationship of the interfacial shear is analyzed with respect to different roughness and soil properties. A numerical shear experiment model is constructed using PFC2D to analyze the displacement field and contact force changes of particles, as well as to investigate the mechanical evolution law and damage mechanism in the shear process under different contact conditions. The findings of this research will contribute to the existing body of knowledge on interfacial shear, and will have significant theoretical and engineering implications.

2. Interface Shear Experiment

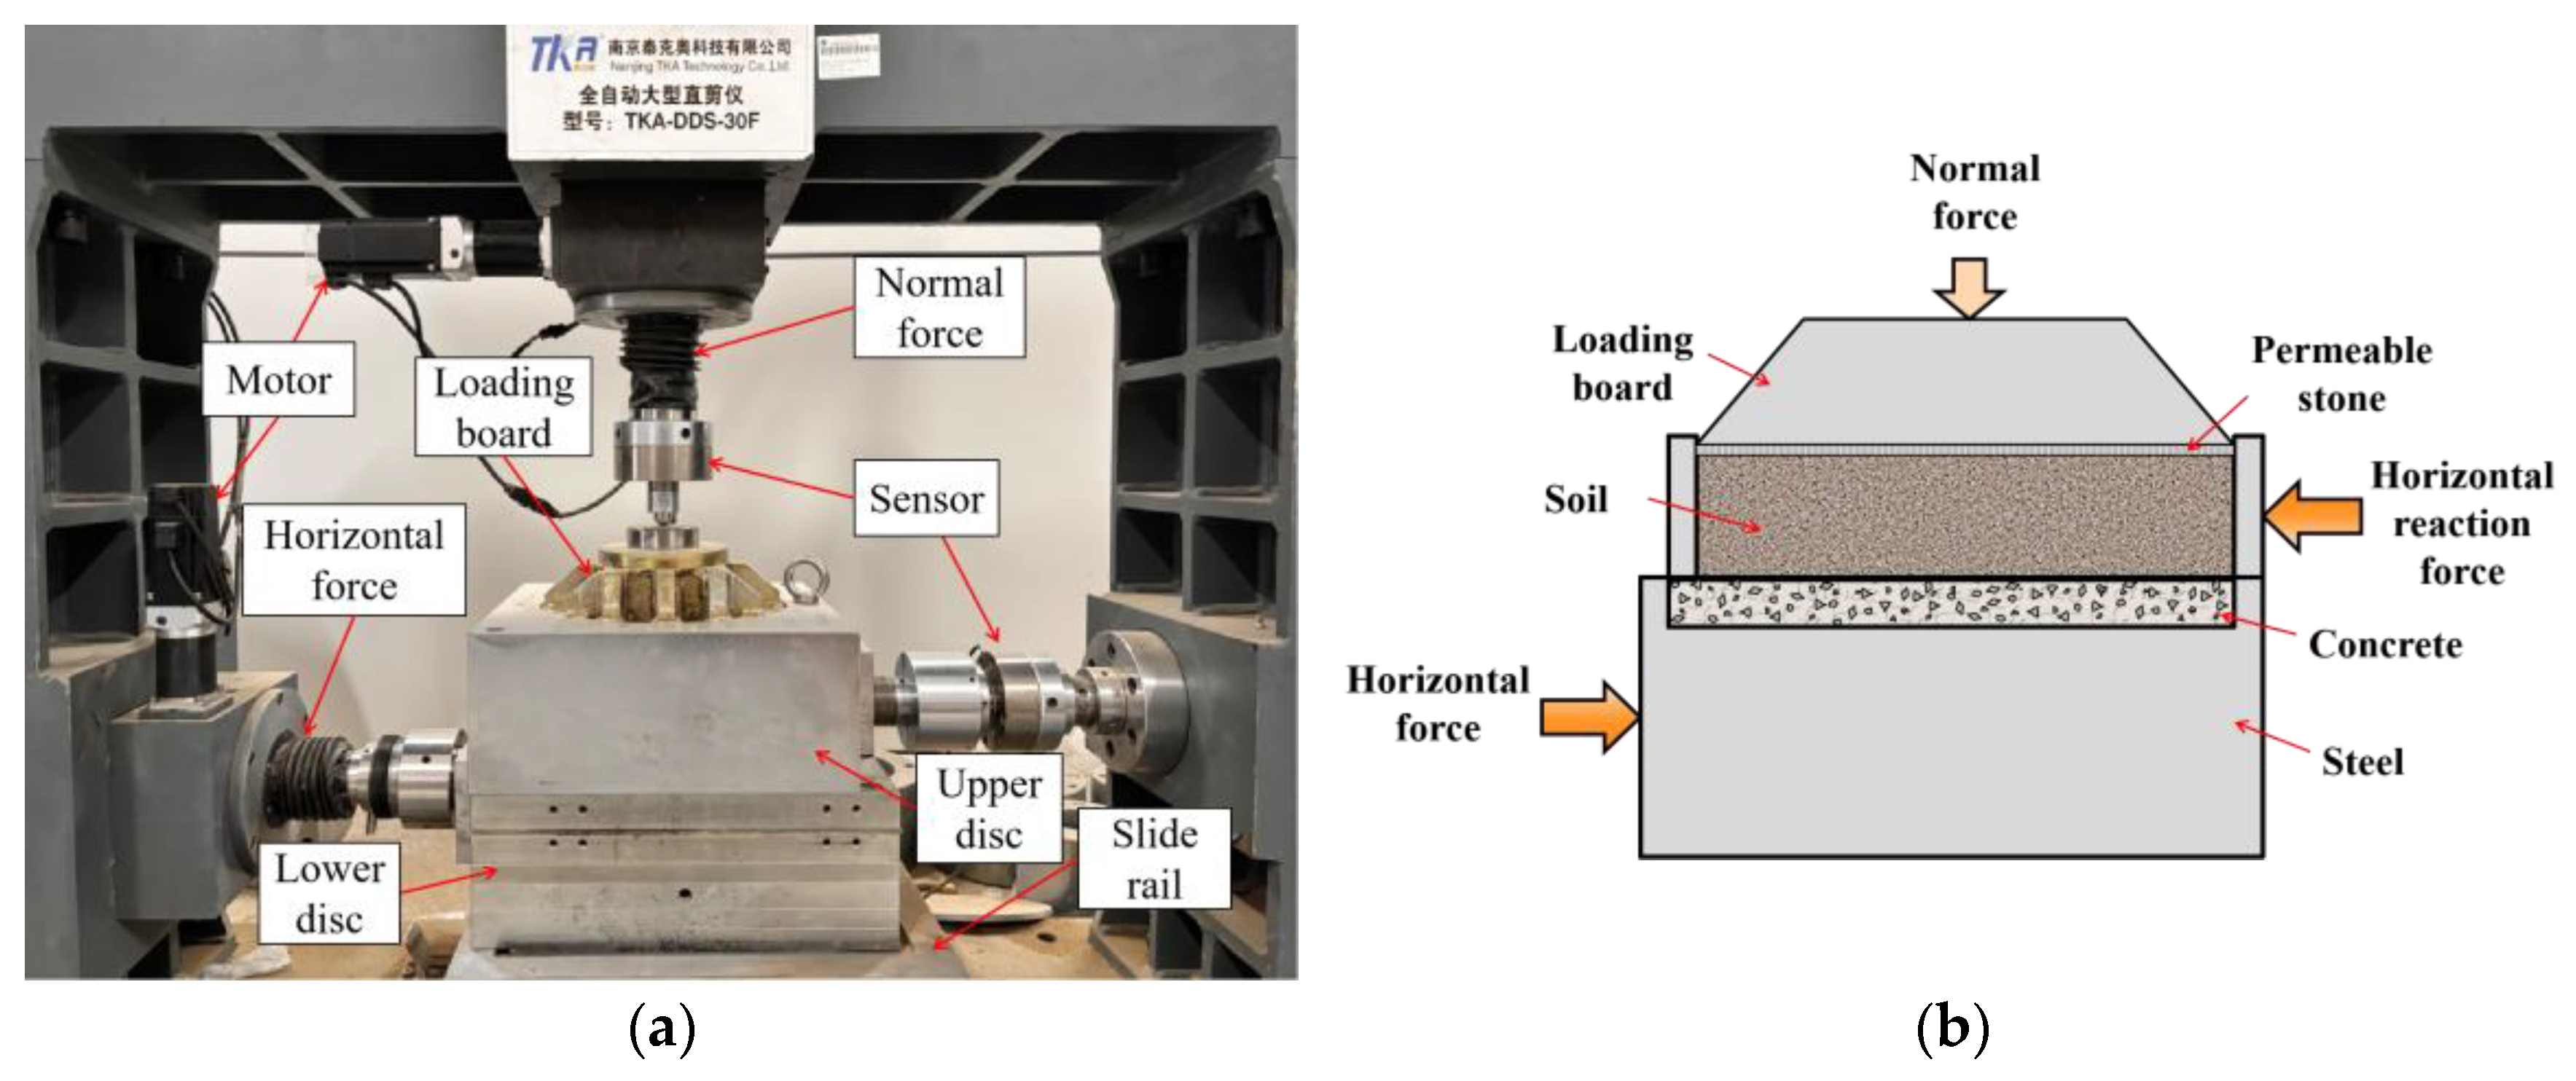
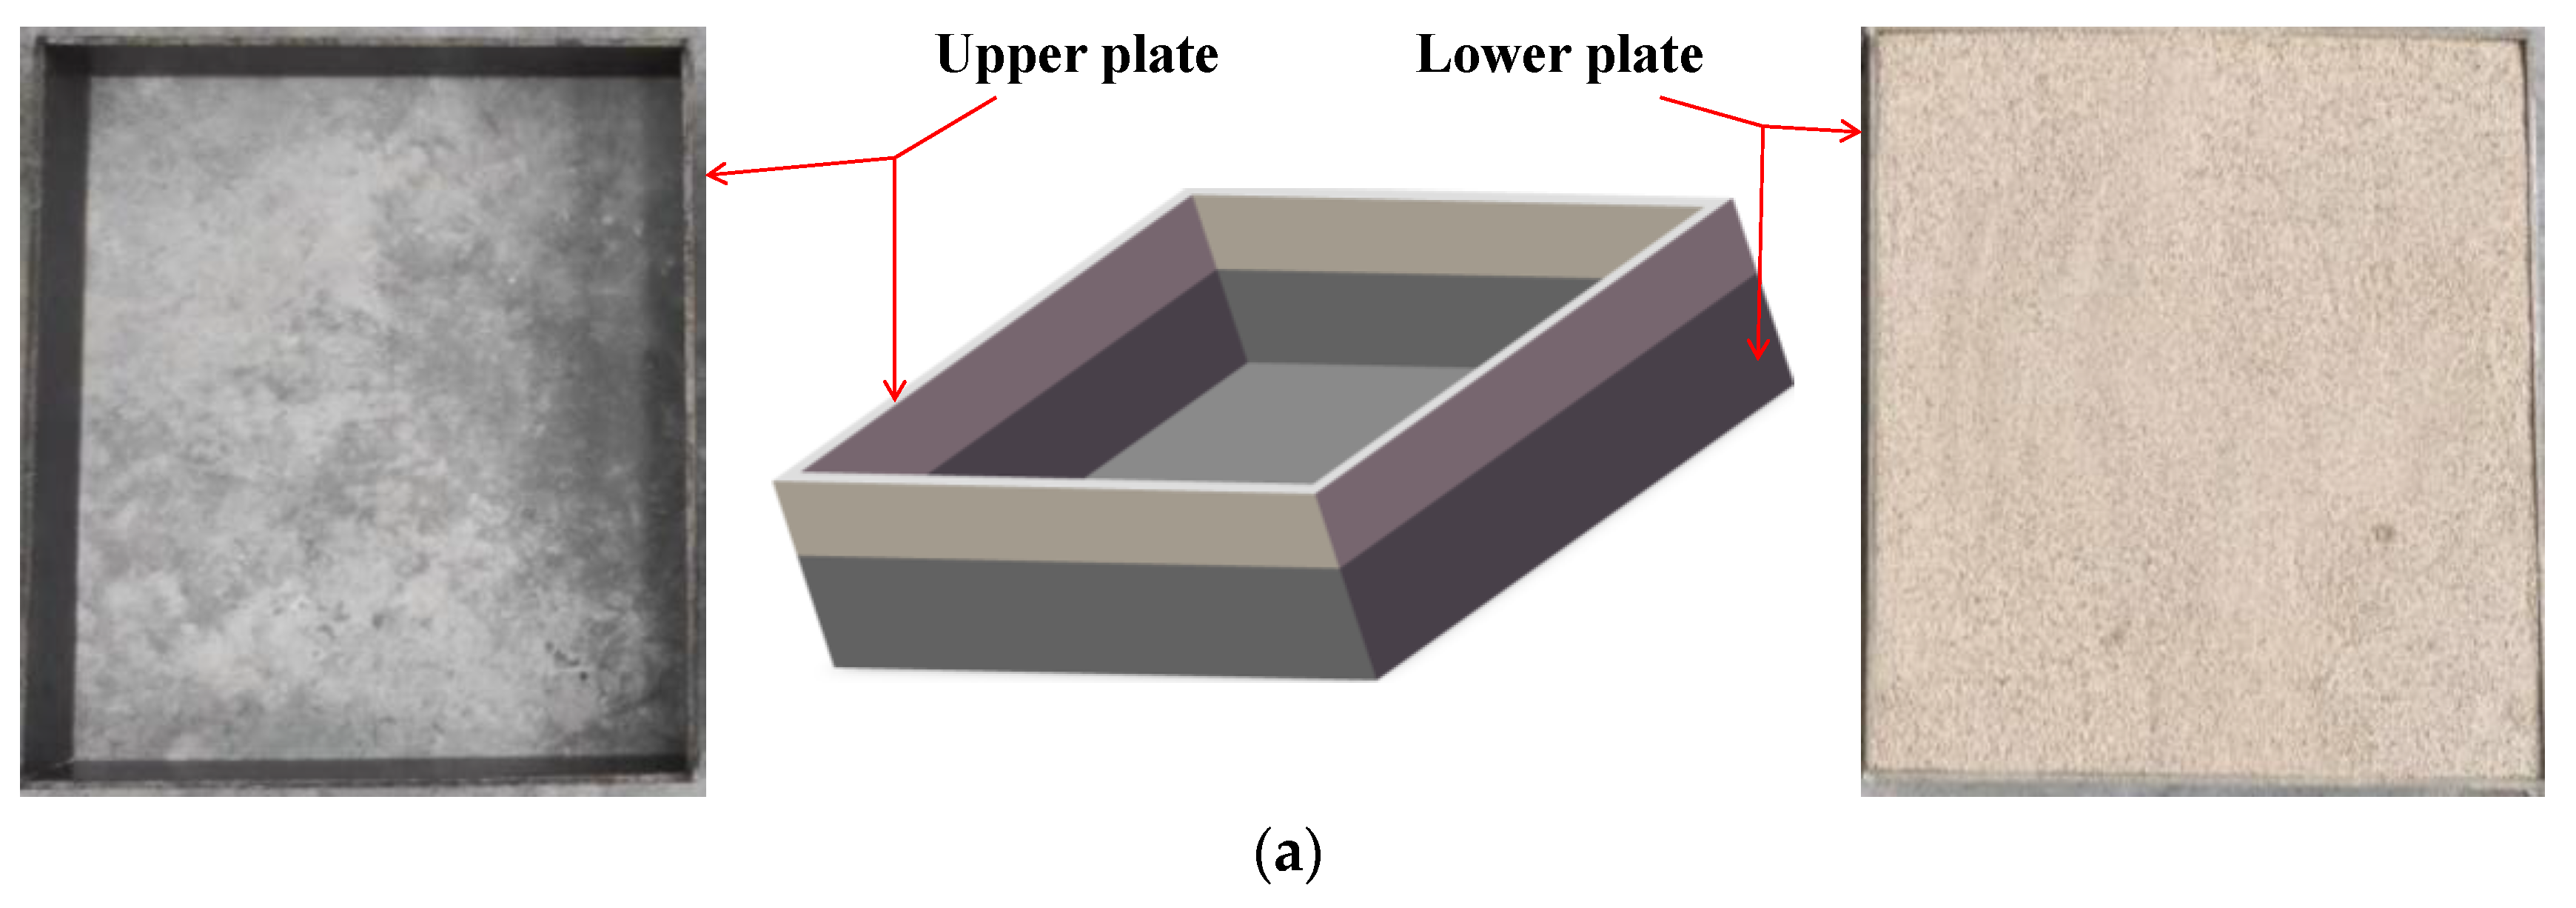
2.1. Experiment Apparatus and Materials

The apparatus utilized in the experiment is a TKA-DDS-30F large-scale straight shear apparatus, as illustrated in Figure 1. The apparatus is an integral reaction frame structure, with a maximum vertical loading force of 100 kN and a maximum horizontal shear force of 100 kN. The lower plate of the shear box is rectangular in shape, with dimensions of 340 mm in length, 300 mm in width, and 42 mm in height. It is used to place the concrete slab. The upper plate is a cylinder, 300 mm in diameter and 165 mm in height. It is used to place the soils. The upper and lower plates of the shear box are in contact with the slide rail, and the maximum shear displacement is 40 mm.
The experimental soils were placed in three layers within the upper plate and compacted. The height of the fill was 135 mm. The dry density was 1.48 g/cm3, and the water content was 14%. The specific experimental parameters are presented in Table 1.
The concrete slabs were manufactured using C30 concrete and had dimensions of 340 mm by 300 mm by 40 mm. In order to achieve the desired interface roughness for the actual project, the mold was initially constructed and divided into two plates: the lower plate, which was 5 cm in height and had a bottom surface; and the upper plate, which was 4 cm in height and had no bottom surface. Three distinct types of sand, varying in coarseness and fineness, were placed within the lower plate. The upper and lower plates were then compacted and smoothed, after which the well-mixed concrete was poured into the upper plate. This resulted in the formation of three concrete slabs, each exhibiting a distinct roughness level. These were designated as 1, 2, and 3, respectively. Additionally, the fourth plate, comprising a smooth concrete surface, was prepared and designated as 0#. These are illustrated in Figure 2.

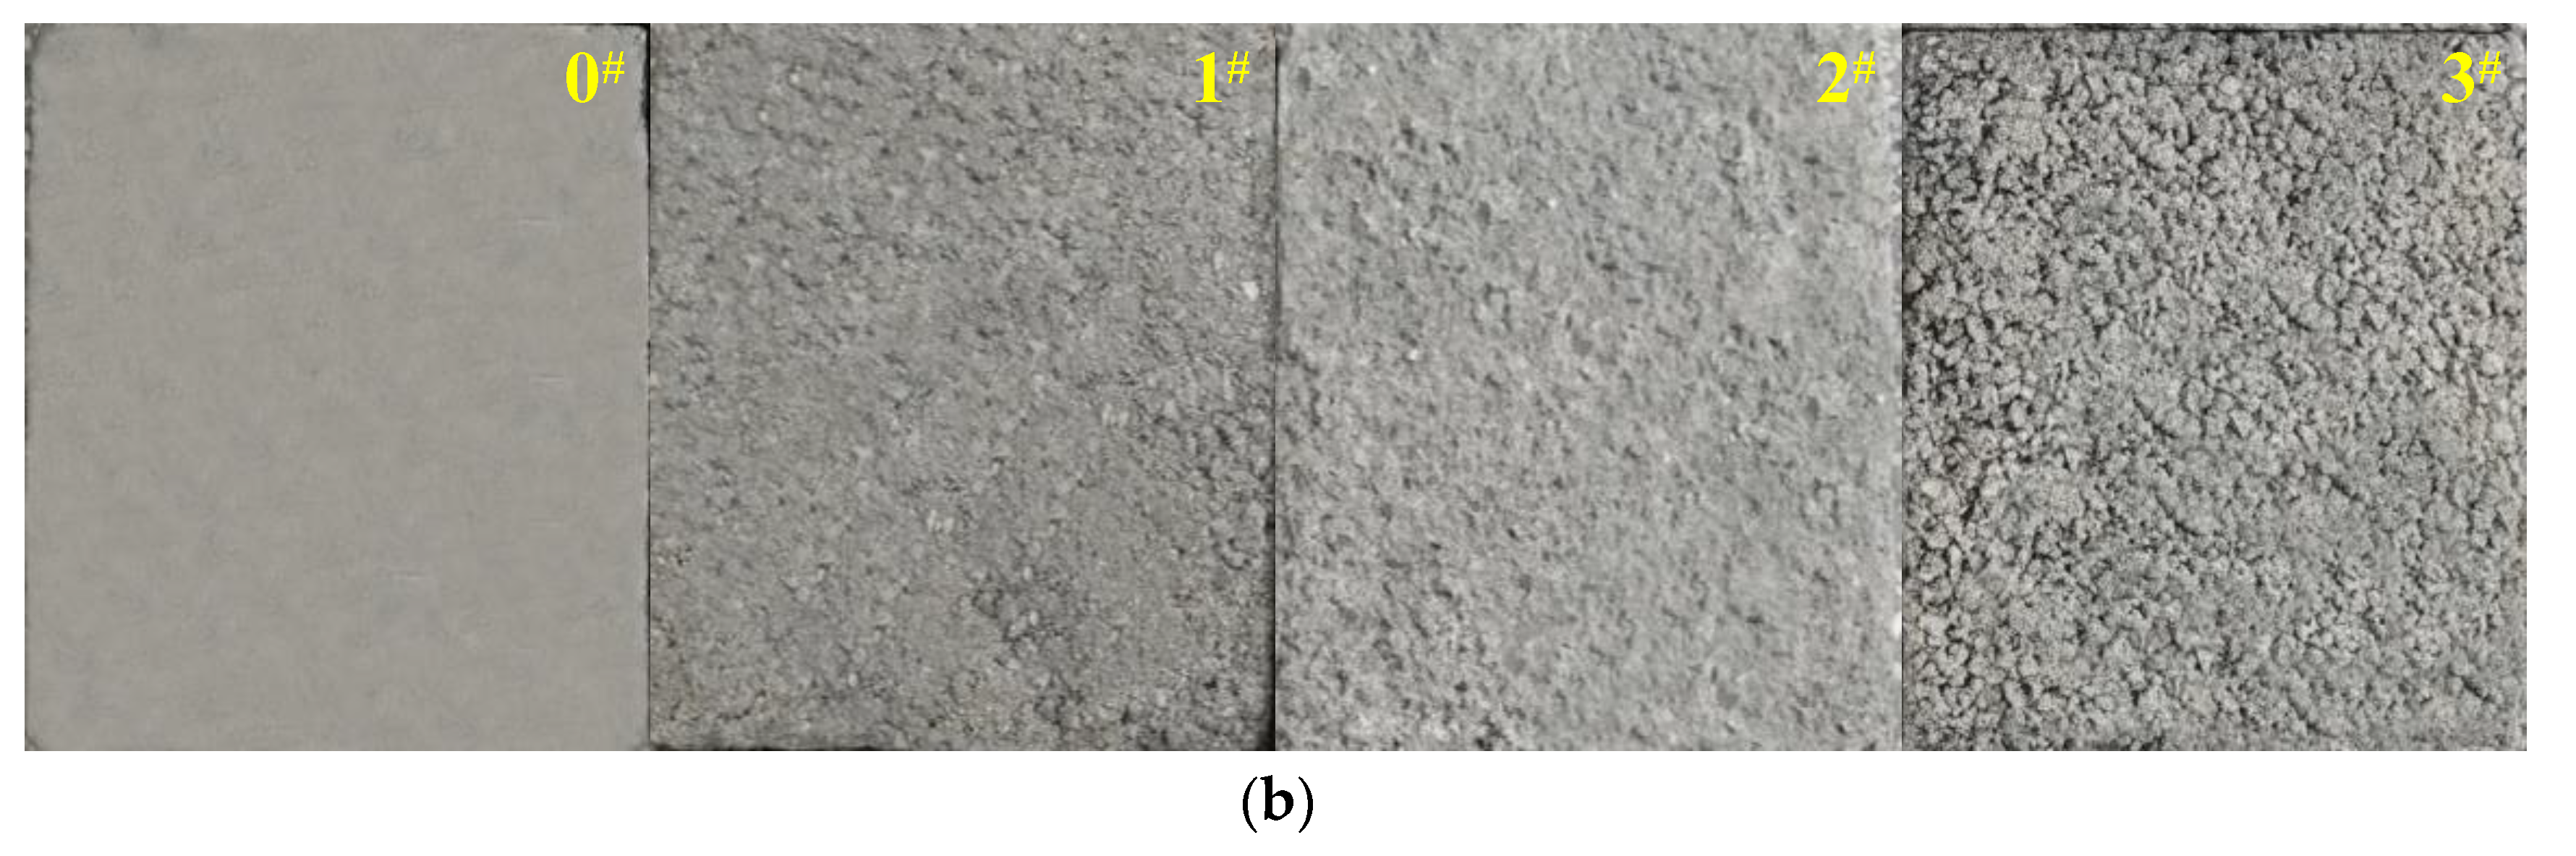
2.2. Evaluation and Calculation of Roughness

A substantial body of scholarship has been devoted to the study of roughness evaluation methods, with a particular focus on relative roughness, arithmetic average roughness, peaks and valleys maximum roughness, and the sand filling method, among others. The sand filling method is notable for its simplicity, convenience, and high accuracy, making it a widely utilized approach in engineering applications [25,26]. The calculated surface roughness (R) of the four concrete slabs utilized in the experimental investigation is presented in Table 2 below.

2.3. Experiment Method

These experiments were conducted using a large-scale straight shear apparatus, wherein concrete slabs of varying roughness were positioned in the lower plate of the shear box and distinct soils were loaded in the upper plate. The experimental method employed was constant normal stress (CNL) consolidation fast shear. The soil was fully drained and consolidated under a normal stress of 400 kPa, and the consolidation was terminated when the settlement reached a value of less than 0.01 mm in one hour. The normal stresses in shear were 100 kPa, 200 kPa, 300 kPa, and 400 kPa, and the shear rate was 1 mm/min. The experiment was terminated when the shear displacement reached a value of 40 mm.

3. Influence of Soil Properties on Interfacial Shear Properties

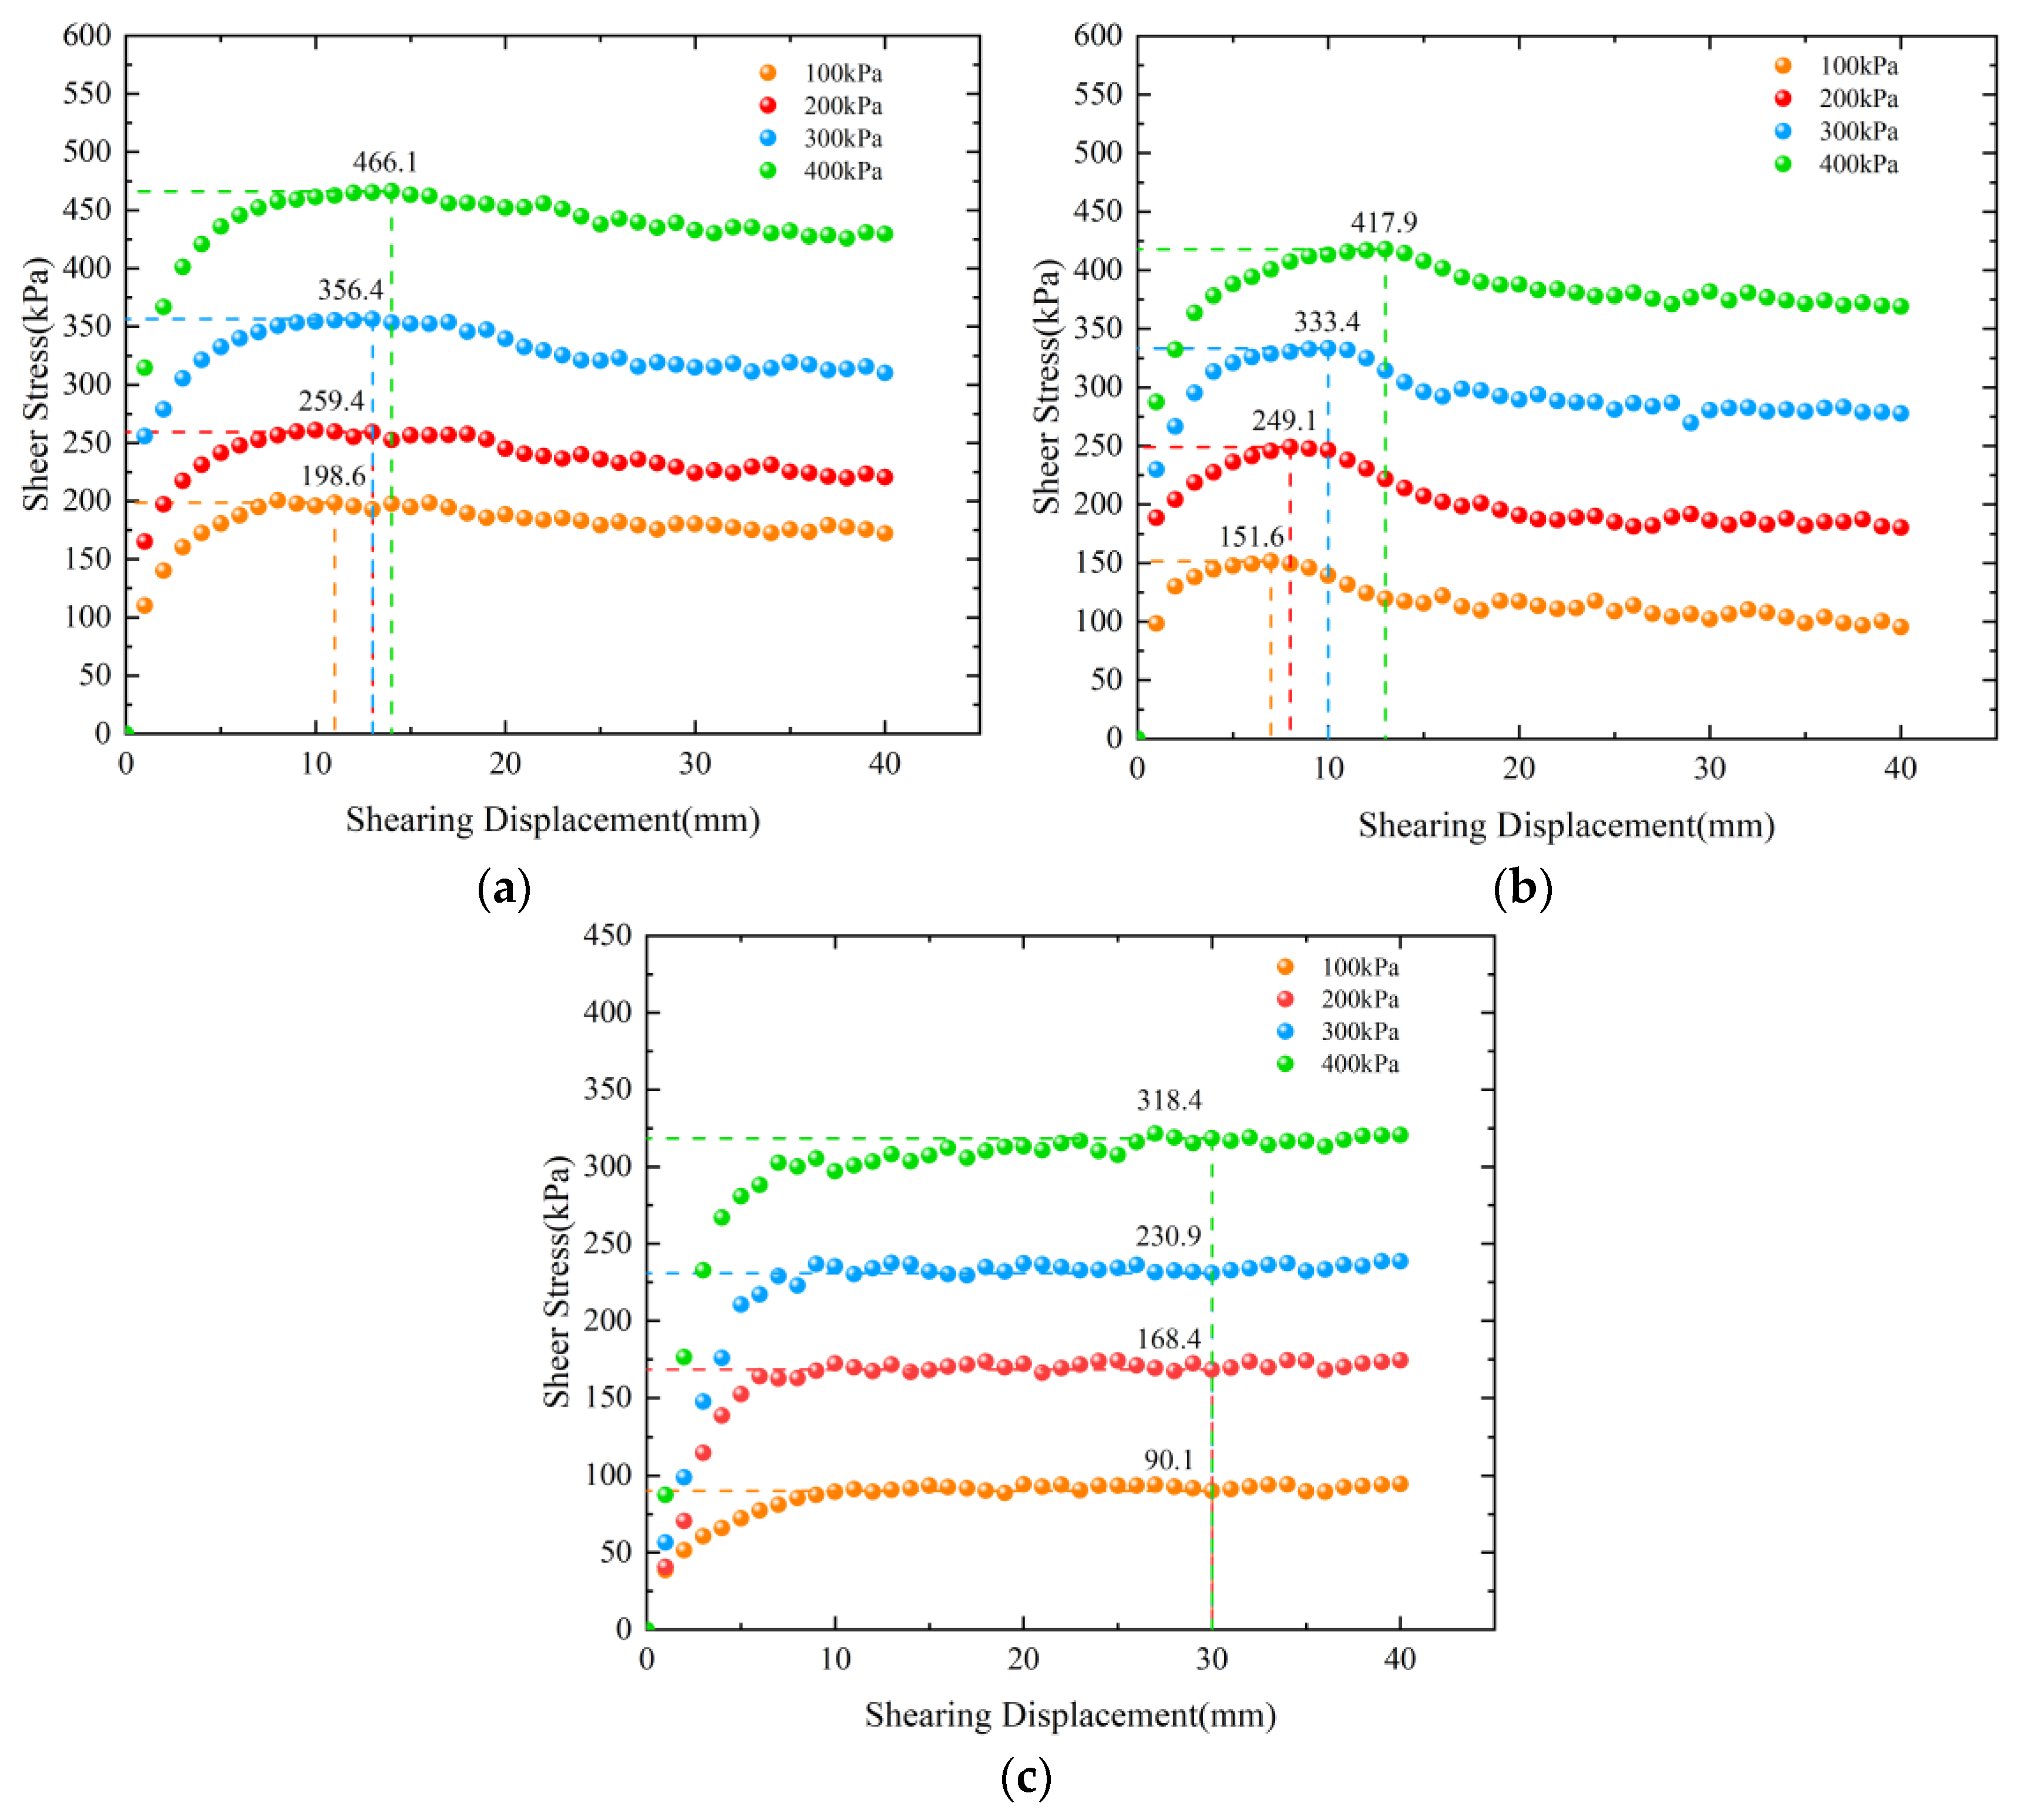
3.1. Influence of Soil Properties on the Peak Value of Shear Stress

When the shear stress–displacement curve reaches a peak value, the interface shear strength is taken as the peak value. In the event that the curve lacks a peak value, the displacement is taken to be between 1/10 and 1/15 of the shear displacement of the soil, representing the peak value of the interface shear strength. In this paper, the displacement is taken to be 30 mm when the corresponding shear stress is taken as the interface shear strength.
The shear stress–displacement curves of the concrete–soil interface were obtained through experimentation and are illustrated in Figure 3 for a value of R = 0.44 mm. The dotted lines represent the shear strength values under each normal stress, and the colors are consistent with those used in the stress–displacement curve.
As illustrated in the figure, the peak shear strengths of clay, silty clay, and silt under identical normal stress conditions exhibit notable differences, which can be attributed to the inherent properties of the soil. The initial shear strength is typically used to indicate the shear resistance of soil. It is defined as the shear stiffness when the shear strain ε = 0.02. The initial shear stiffness (Ei) of the three soils increases with increasing normal stress. The magnitude of Ei for the three soils is clay > silty clay > silt under the same normal stress. A larger Ei indicates a larger shear stress under small soil deformation, which is indicative of stronger soil friction and bonding.
Clay exhibits a greater abundance of clay minerals than silty clay and silt. The findings of Zhao’s research indicate that when the water content and dry density remain constant, the matrix suction increases with the addition of clay particles to soil samples [27]. The particle size also undergoes a corresponding change. Under the same matrix suction, clay exhibits a greater suction capacity than silty clay and silt. The formation of stronger cohesion and greater matrix suction result in a more robust bonding at the interface, thereby enhancing stability during shear. Furthermore, the presence of a greater degree of cohesion in the soil leads to the formation of smaller agglomerates at low water content, which increases the sliding friction between concrete and soil and strengthens the shear capacity of the interface [28]. Consequently, as the clay becomes more cohesive, the maximum peak shear strength is achieved for clay, followed by silty clay, and the minimum is observed for silt.

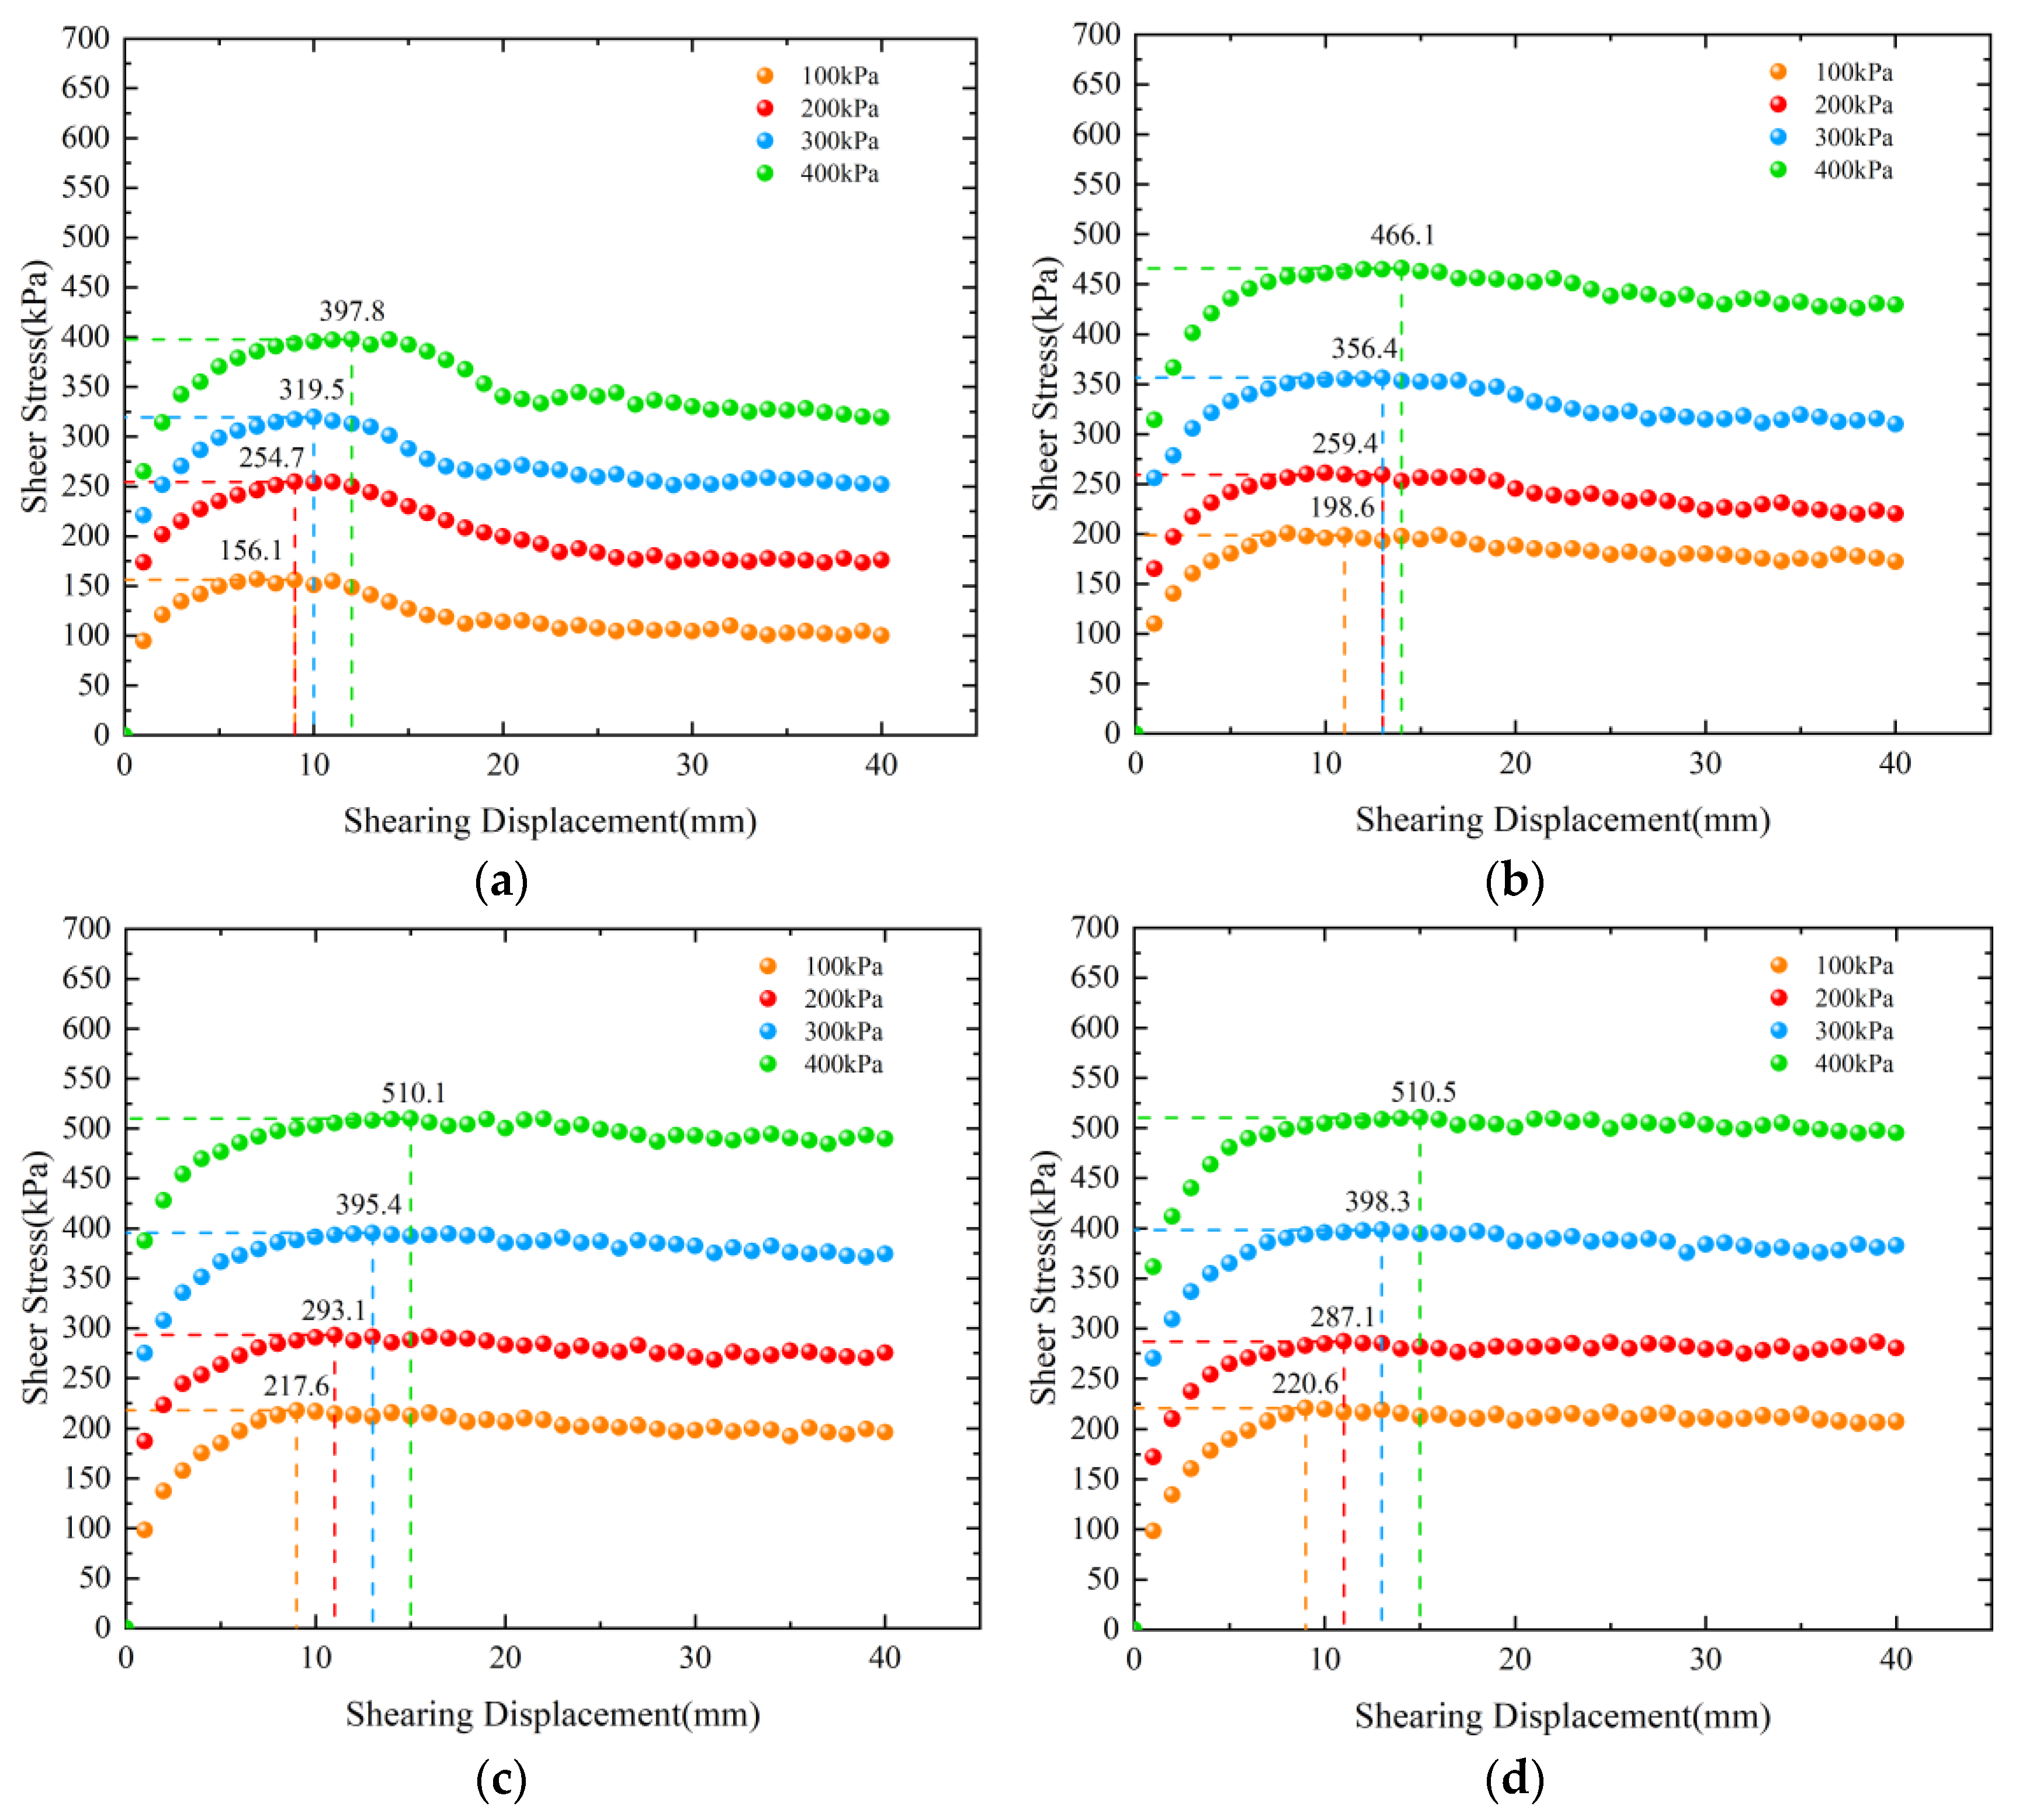
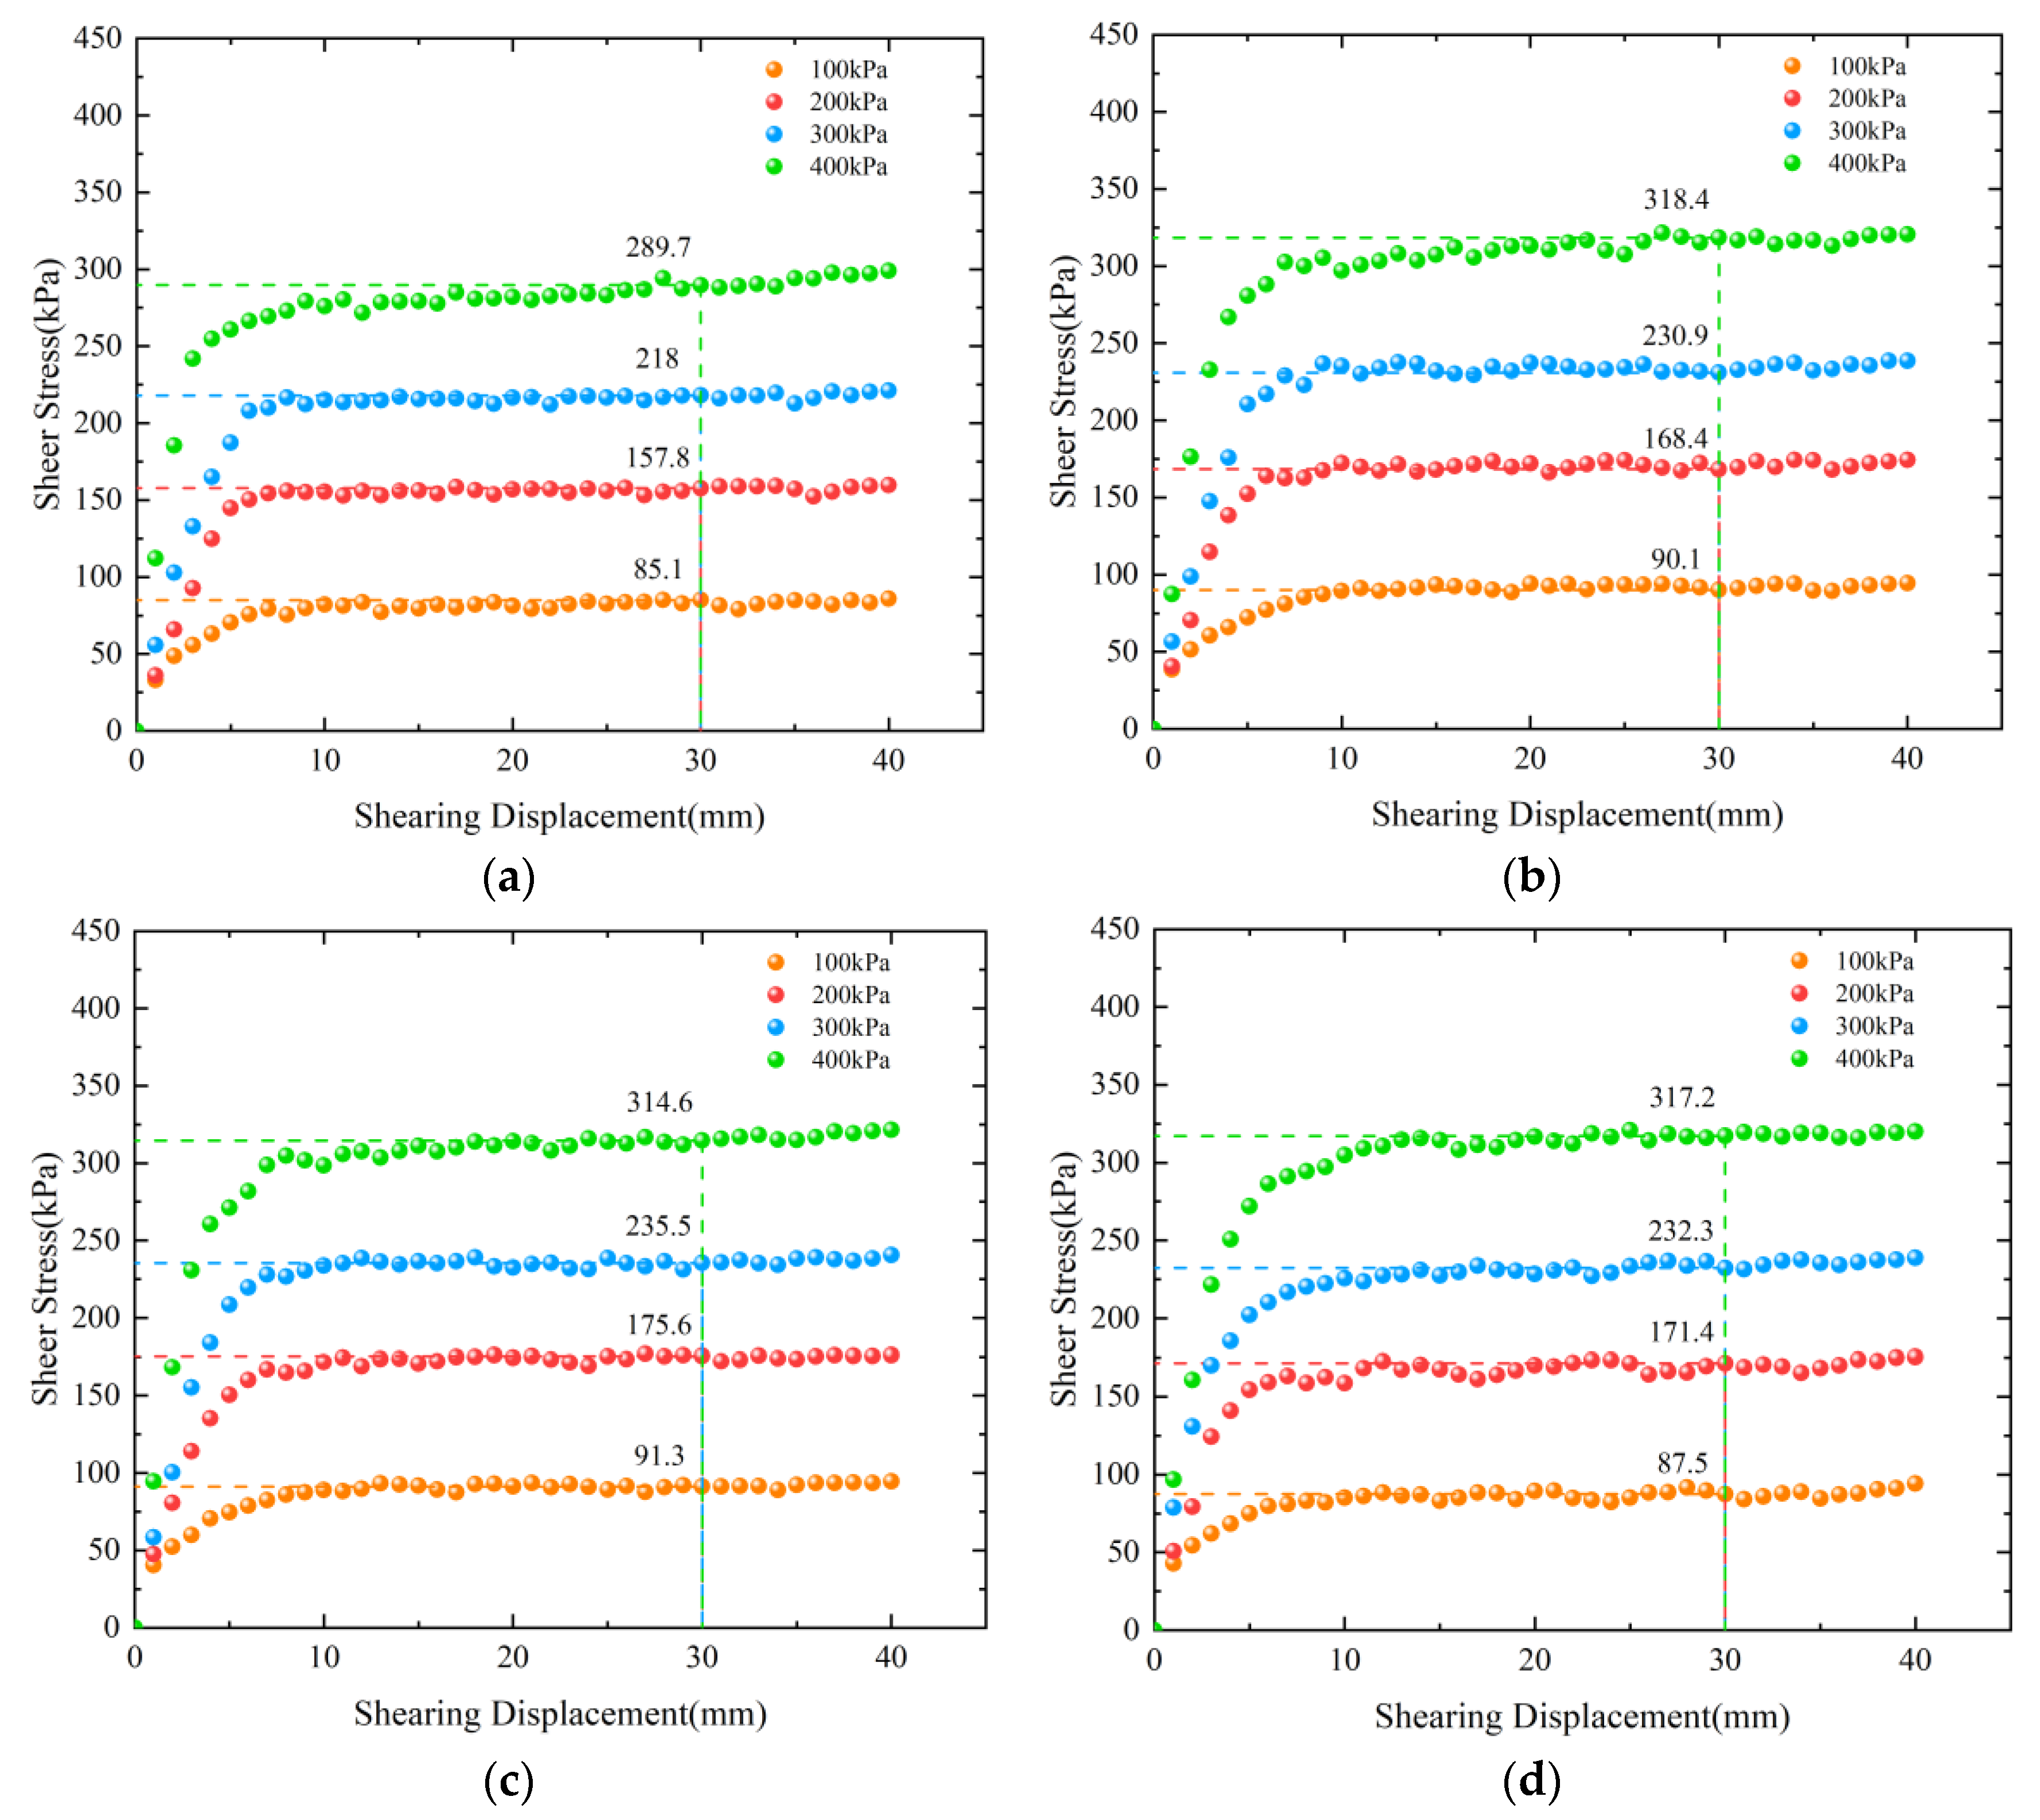
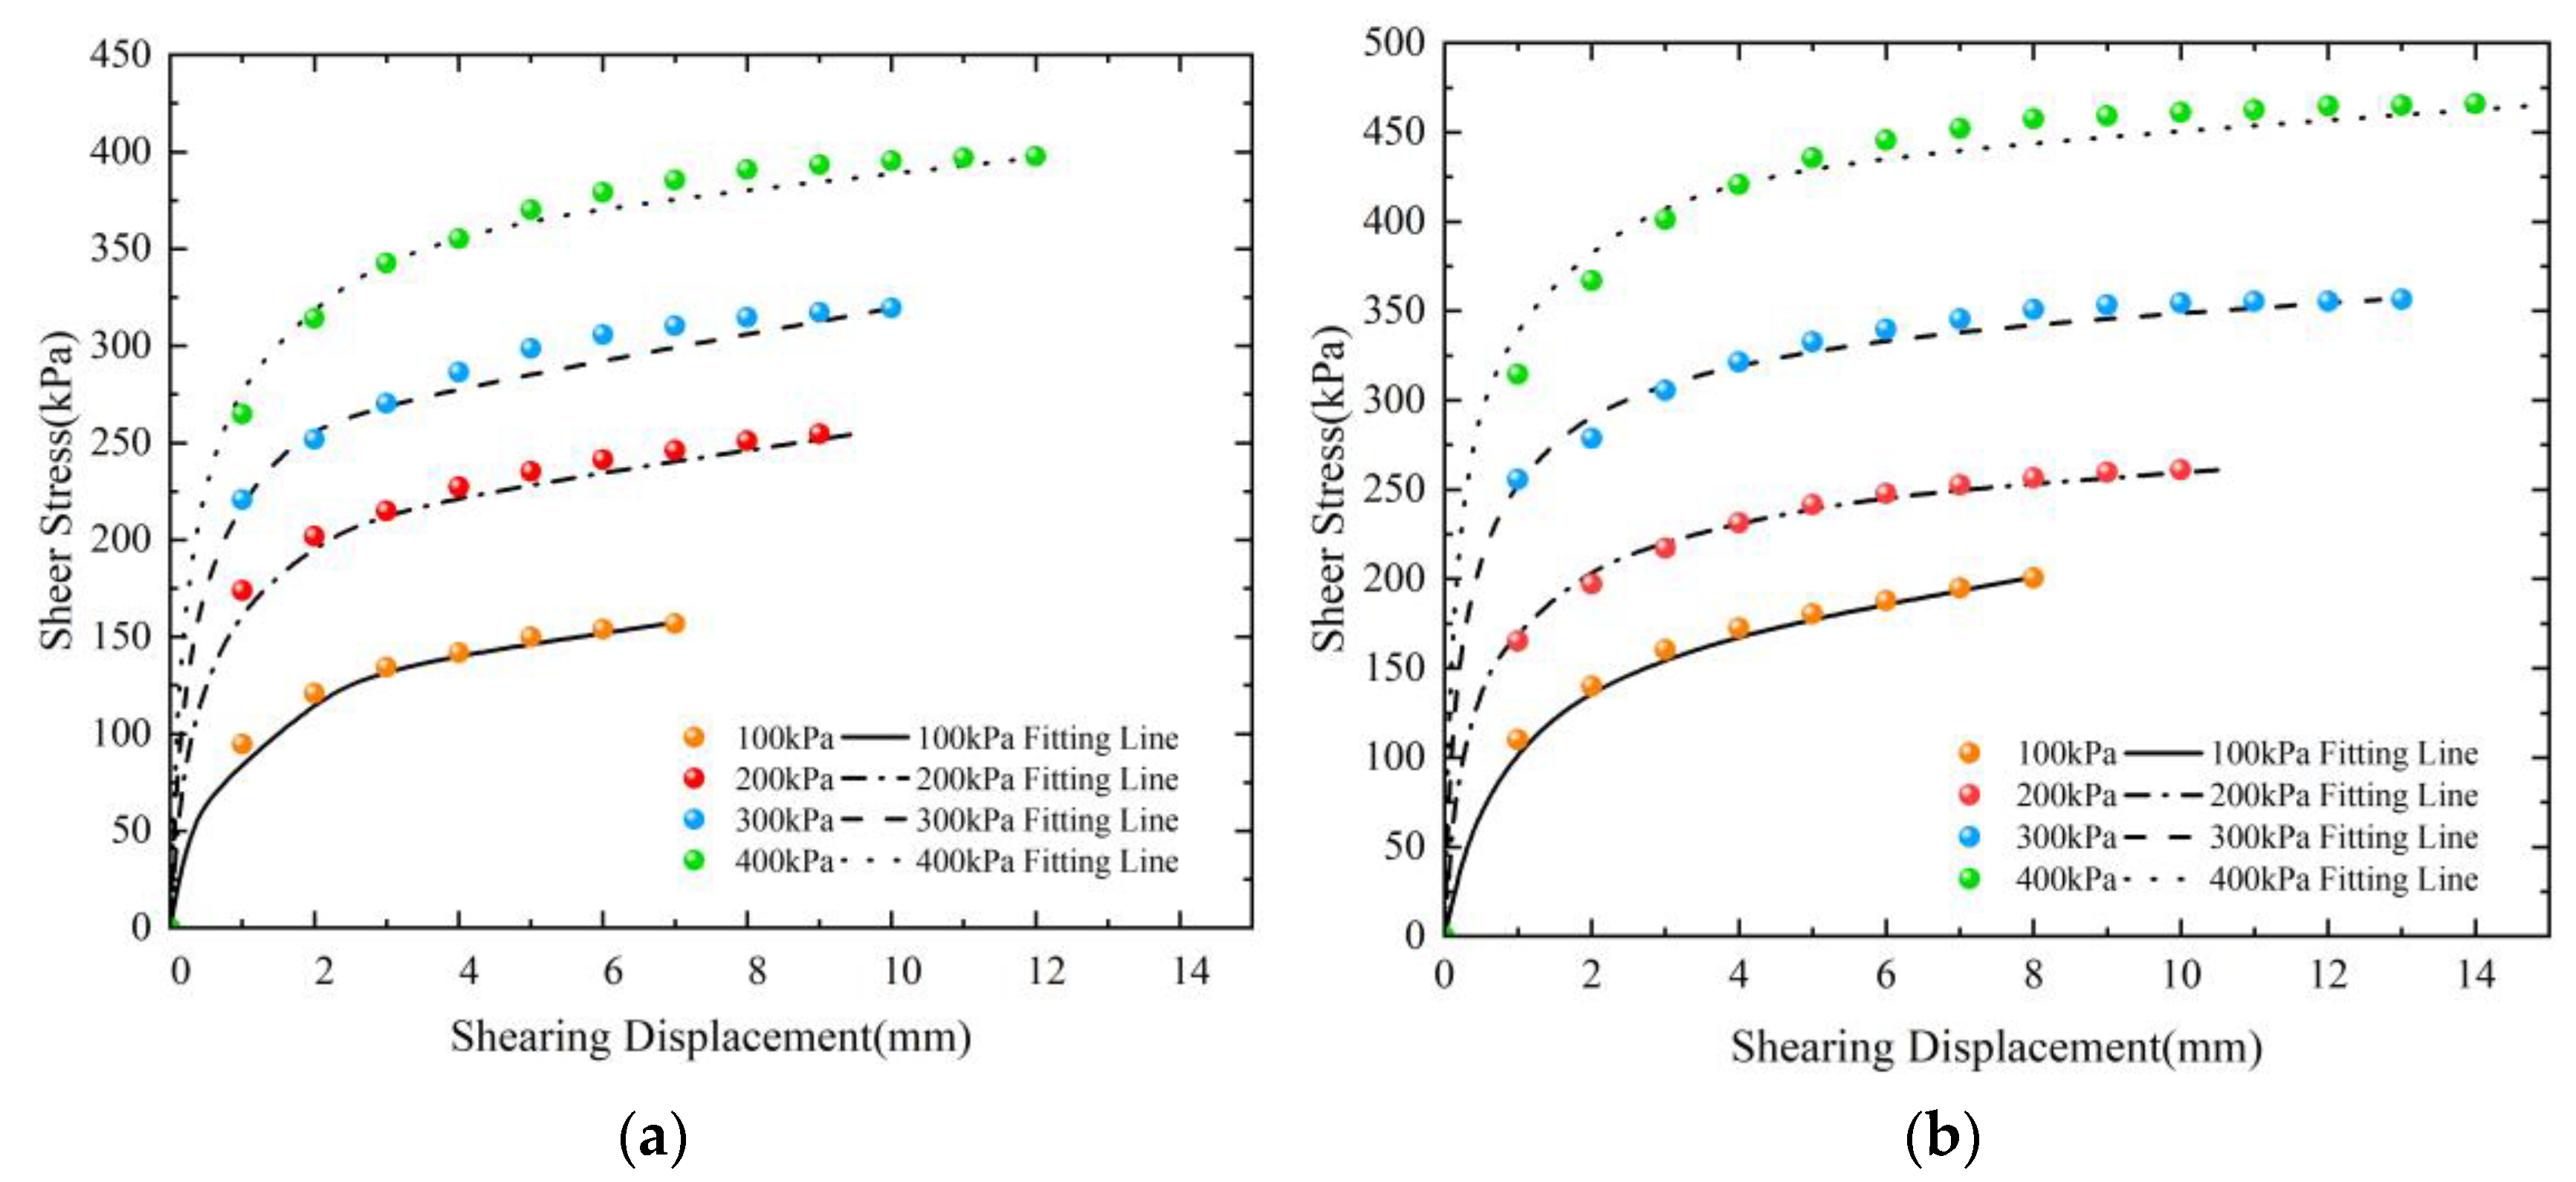
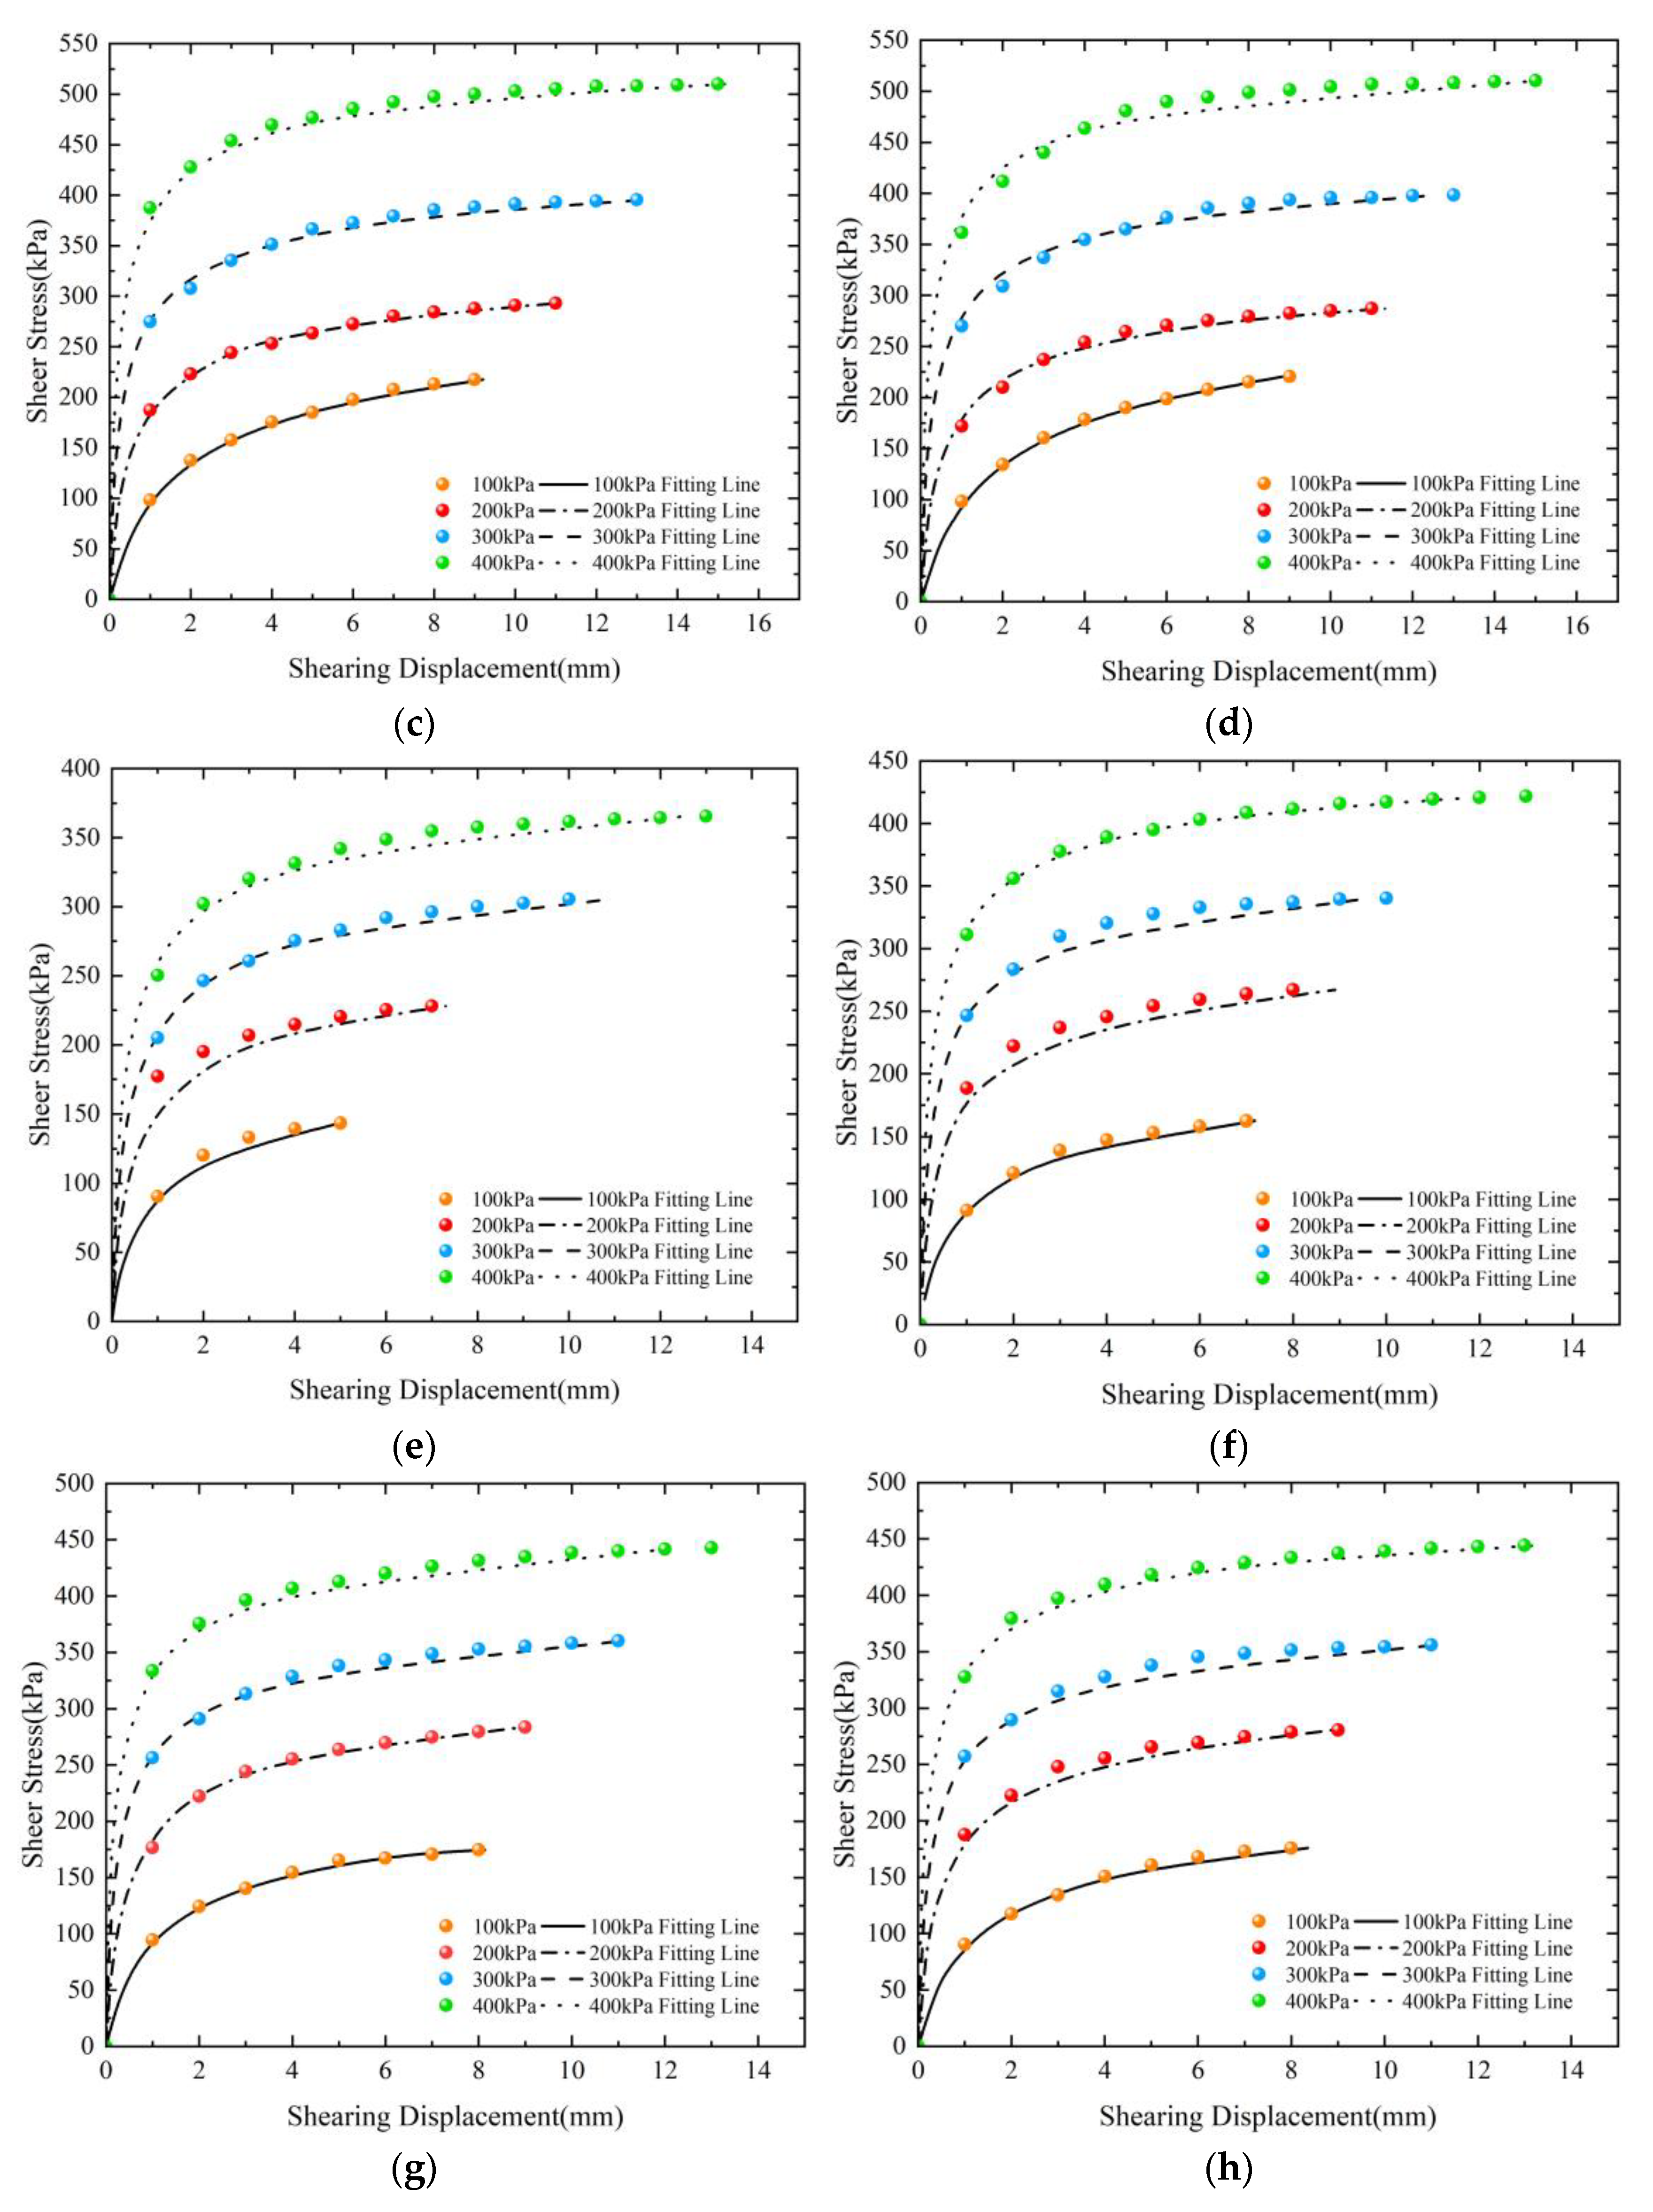
3.2. Influence of Soil Properties on the Relationship between Shear Stress and Displacement

The peak shear stress corresponding to the displacement value at the concrete–soil interface obtained from the experiments with R = 0.44 mm is shown in Figure 4.
As illustrated in the figure, the peak shear stress corresponding to the shear displacement of the three soils increases with the increase in normal stress. The phenomenon can be attributed to the fact that as the normal stress rises, the soils become more structured and densely packed. Consequently, the shear force between the particles and the concrete increases in tandem with the rise in contact force, and the shear displacement necessary for damage also becomes larger. The peak shear stresses of the three soils under the same normal stress correspond to the shear displacements, with clay exhibiting the highest values, followed by silty clay and then silt. This is attributed to the presence of clay minerals, which render the structural destruction of the soil more challenging and necessitate greater displacements.
The soil normal displacement–shear displacement curves of the concrete–soil interface, obtained from the experiments, indicate that the change rule is consistent under different roughness conditions. For instance, when R = 0.44 mm and the normal stress is 400 kPa, the result is shown in Figure 5.
In accordance with the aforementioned preload consolidation conditions, clay and silty clay demonstrate a considerable degree of consolidation, thereby exhibiting strain softening, which can be defined as expansion deformation. In contrast, silt displays a distinct behavior. As the structure of the soil is destroyed, the cohesive force is weakened, while that of clay and silty clay continue to increase with the shear displacement. This indicates that the soils undergo shear expansion deformation, accompanied by a decrease in shear stress and the presentation of softening characteristics. As the shear displacement of the silt increases, the soil undergoes shear contraction deformation, exhibiting increased densification and an augmented occlusion force between particles and concrete. This results in a shear stress–displacement curve that displays hardening characteristics.

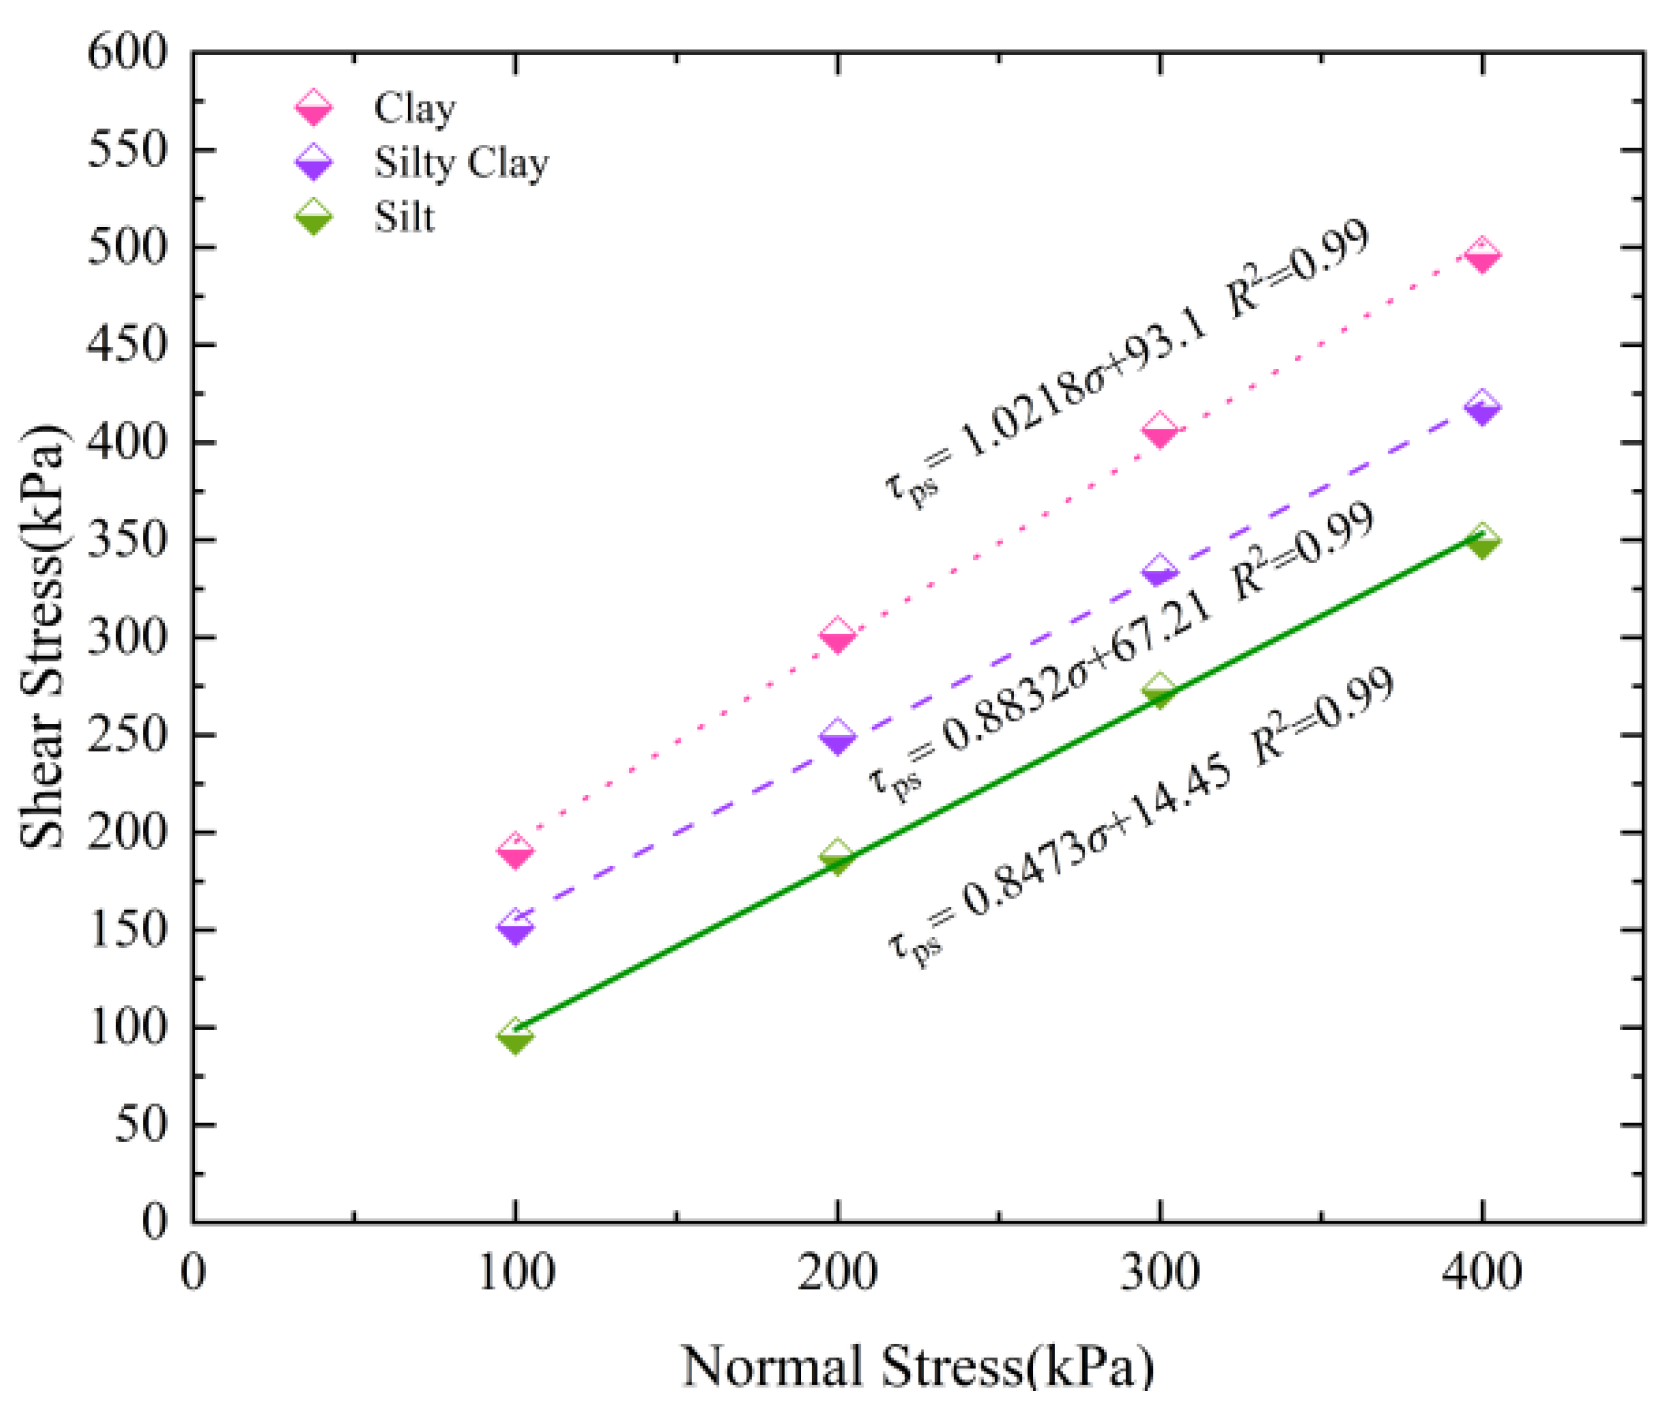
3.3. Influence of Soil Properties on Shear Strength Indexes

The relationship curves between shear strength and normal stress at the concrete–soil interface obtained according to the experiment with R = 0.44 mm are shown in Figure 6.
As illustrated in the figure, the shear strength envelopes of all three soils exhibit a conformity to the Mohr–Coulomb criterion [29]:
τ p = c p + σ tan ϕ p
In this context, the term τ p denotes the concrete–soil interface shear strength, c p denotes the interface cohesion, σ denotes the normal stress, and ϕ p denotes the interface friction angle.

4. Influence of Roughness on Interfacial Shear Experiments

The influence of roughness on the shear strength of the interface and the plastic deformation of the soil is subject to a threshold value, which is defined as the critical roughness (Rc). In interfacial shear, when the R of the concrete is less than the Rc, the soil particles exhibit sliding or rolling, resulting in sliding damage. Conversely, when the R of the concrete is greater than the Rc, the shear damage forms a shear zone, localizing the strain. The strength at the time of damage is approximately equal to the strength of the soil and no longer increases with an increase in R. In this paper, we determine whether the influence of R on the soil reaches the threshold value by its peak shear strength [30,31].

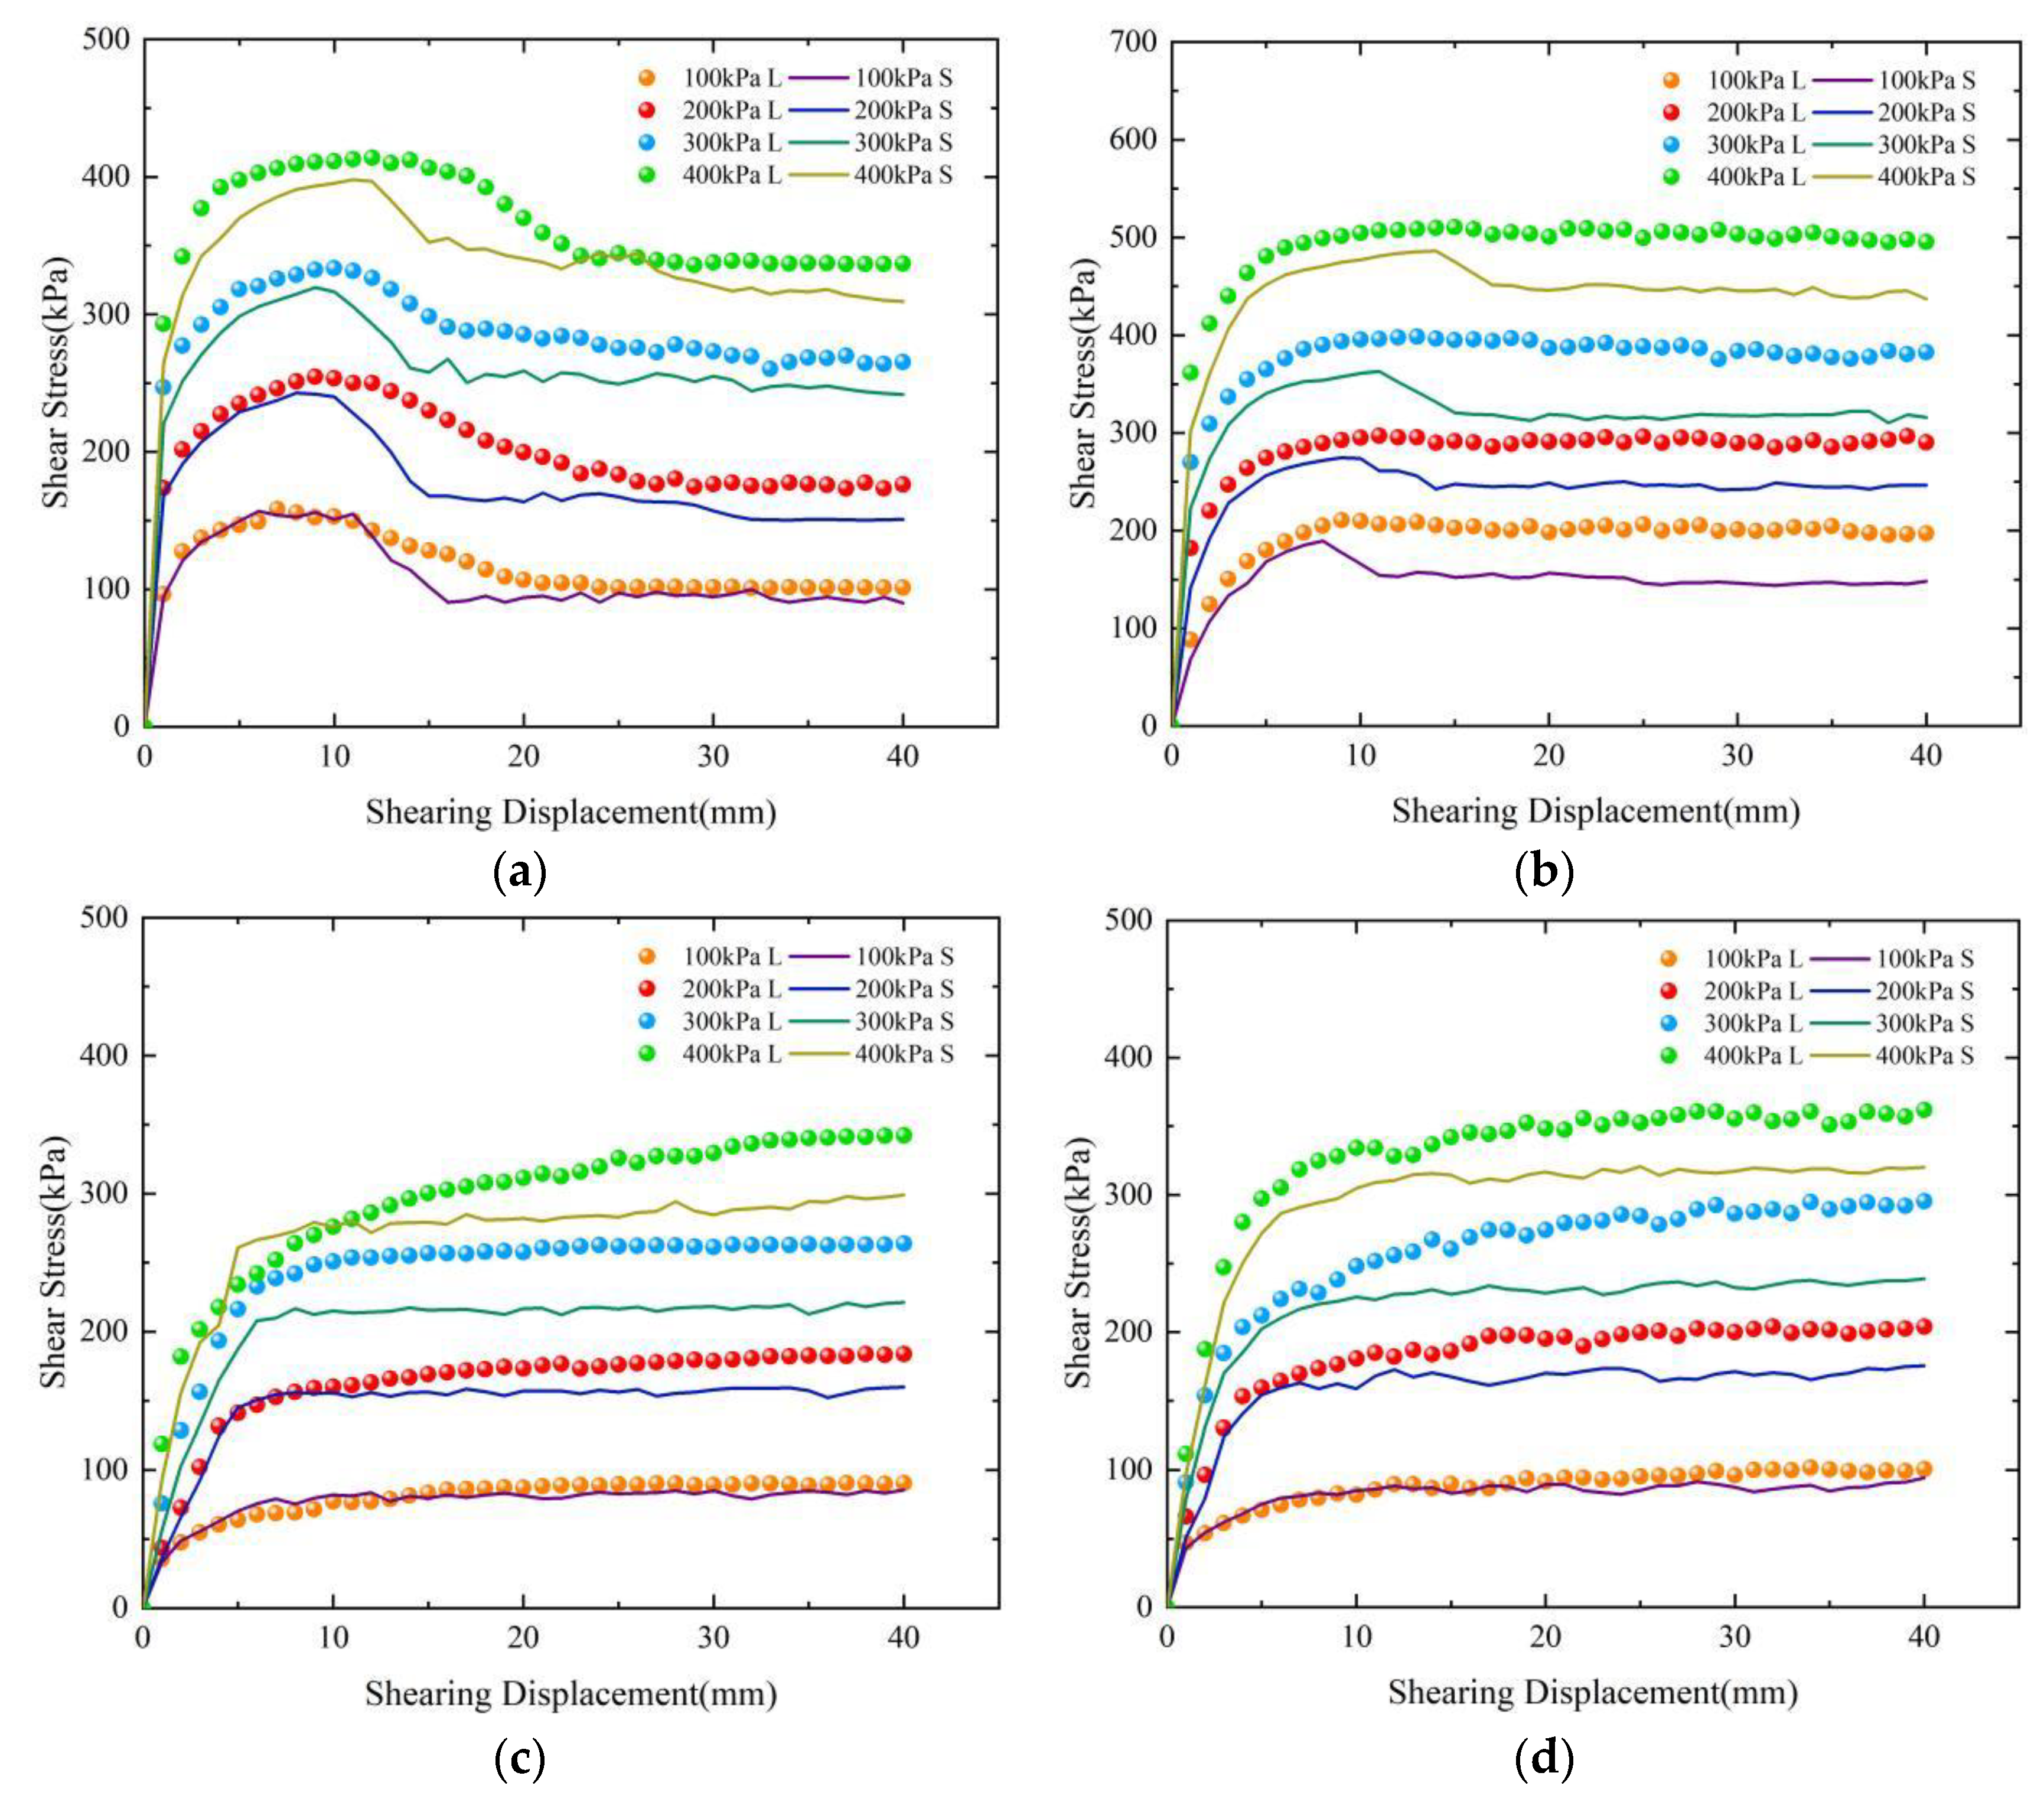
4.1. Influence of Roughness on the Interfacial Shear Experiment

The shear behavior of silty clay and clay is analogous. To illustrate, consider the case of clay. The shear stress–displacement curves, obtained from the shear test on the interface between concrete with varying degrees of roughness and clay, is illustrated in Figure 7.
As illustrated in the figure, an increase in R is accompanied by a notable rise in shear stress. To illustrate, when the normal stress is set at 400 kPa, the shear strengths are 397.5 kPa, 466.1 kPa, 510.1 kPa, and 510.5 kPa, respectively, with an R of 0 mm, 0.44 mm, 1.02 mm, and 1.78 mm, representing a 28.4% increase. The residual strengths are 319.4 kPa, 429.6 kPa, 489.9 kPa, and 495.3 kPa, representing a 55.1% increase. It can be seen that the Rc has been reached when the R is 1.02 mm. Based on these findings, it can be surmised that the Rc of clay is within the range of 0.44 mm to 1.02 mm. Furthermore, for an R of 0 mm, 0.44 mm, 1.02 mm, and 1.78 mm, the residual strength in comparison to the peak strength decreased by 19.6%, 7.8%, 4.0%, and 3.0%, respectively. The curves exhibited softening characteristics, with the most pronounced softening observed at 0 mm R. With an increasing R, the softening characteristics of the curves diminished. It can be inferred that the enhancement of clay plastic deformability with an increasing R is associated with an increase in clay shear ductility [26].
As illustrated in Figure 8, the shear stress–displacement curves obtained from the shear test at the interface of concrete and silt with varying degrees of roughness are presented in the experimental results.
As illustrated in the figure, the R has a notable impact on the shear strength of concrete and silt. When R < 0.44 mm, the shear strength exhibits an upward trajectory with an increase in R. However, beyond this threshold, the influence of R on shear strength diminishes. It can be inferred from this that the Rc of the silt is less than 0.44 mm. The Rc of silt is less than that of clay and silty clay, which is due to the inferior structural properties of silt and the low cohesion of the soil.

4.2. Influence of Roughness on Shear Strength Indexes

The shear stress–normal stress curves of clay, silty clay, and silt were fitted with a linear function, and the strength indexes of various soil contact surfaces were calculated using the Mohr–Coulomb criterion. This allowed the shear strength indexes of the three types of concrete–soil under different roughness levels to be obtained, as illustrated in Figure 9.
As illustrated in the figure, a low roughness exerts a more pronounced influence on ϕ p , particularly for clay. When the R is increased to 0.44 mm, the corresponding increase in ϕ p for clay is 13.1%. The increase in ϕ p is observed to diminish in a gradual manner with the augmentation of R, suggesting that the influence of R on ϕ p exhibits a biphasic pattern, initially increasing and subsequently declining. A threshold exists for ϕ p , and this threshold is correlated with the Rc. When the R is less than the Rc, an increase in R results in an increase in the angle of ϕ p This is due to the fact that a rougher surface provides a greater contact area, thereby increasing the frictional resistance between the particles. When the R reaches the Rc, it also signifies that the peak value of ϕ p has been reached, and the interfacial friction angle exhibits fluctuations within a certain range when the R is increased further.
The value of c p serves as a crucial indicator of interfacial shear strength. As the R value increases from 0 mm to 1.78 mm, the silt exhibits a notable rise in c p , from 16.2 kPa to 22 kPa, representing a 35.8% increase. Similarly, the silty clay demonstrates a 25.7% increase in c p , from 74.8 kPa to 94 kPa, while the clay exhibits a 34.6% increase, from 80.9 kPa to 108.9 kPa. The impact of R on interfacial cohesion is considerable, as previously stated. This is because interfacial cohesion is contingent upon the adhesion between concrete and soil, as well as the particle-locking effect between soil particles. An increase in R can facilitate the filling of soil particles into the grooves of the concrete slab, thereby enhancing the friction between the slab and the soil, as well as between soil and soil. Furthermore, it expands the interfacial area between the soil particles and the concrete slab, which in turn strengthens the adhesion between them, thereby improving the interfacial cohesion.
Furthermore, the figure illustrates that the correlation between the magnitude of the angle of interfacial friction and cohesion is more pronounced in clay than in silty clay and even more so in silt. This suggests that clay mineral content is a significant factor influencing the shear strength parameters at the concrete–soil interface. This phenomenon can be attributed to the fact that at the lower water content specified in this experiment, clay and silty clay form more robust structures, whereas silt forms less stable structures.

5. Numerical Simulation

The FEM is not an effective means of analyzing the changes in the internal structure and the role of intergranular bonding in soil, which has a loose granular structure. Consequently, numerical simulation experiments are conducted using the particle flow software PFC2D 5.0 (https://www.itascacg.com/software/pfc (accessed on 11 July 2024)), which is a comprehensive numerical program that simulates the motion of a circular granular medium and its interactions. The PFC2D simulation can be employed as a substitute for indoor tests for parameter prediction and to simulate geotechnical particle interactions, size deformations, and fracture problems.

5.1. Concrete and Soil Shear Modeling

To ensure the simulation’s representativeness, the model’s size and that of the actual large-scale straight shear instrument are 1:1. The equivalent wall is established with a total of 20 facets.
As evidenced by the experiment, the stiffness of the concrete is significantly greater than that of the soil particles. Therefore, the concrete can be considered a rigid body within the context of this experiment. The volume and position of the concrete remain constant throughout the experiment. In this study, the concrete is created using the clump method. The clump is employed primarily for the simulation of an object with a fixed shape and rigidity. In the simulation, the clump is composed of multiple balls held together by a specific strength of bonding. There is no relative displacement between these ball particles, and the clump can only produce translation and rotation. When subjected to an external force, the clump will not be deformed or destroyed and will maintain its original shape. Modifications to the parameters of the clump facilitate alterations to the flatness of the concrete slab surface, which in turn influence the R. The ball particles are randomly generated within the upper plate, with the number of particles determined by the range of the set particle-size distribution (0.9 mm to 1.5 mm) and the void ratio [32,33].

5.2. Parameter Calibration and Model Validation

In this paper, the term “clay” encompasses both clay and silty clay. The complexity of fine parameter calibration and the microscopic differences between silty clay and clay make it impractical to differentiate between them. Therefore, only the fine parameters of clay and silt materials are calibrated. To more accurately reflect the contact of the soil samples, the ball particle contact in this paper employs a contact bonding model [34]. The values of each fine-scale parameter involved in the simulation are listed in Table 3.
Their shear–displacement curves were obtained by numerical simulation and are shown in Figure 10.
As illustrated in the figure, L represents the experiment result, while S denotes the numerical simulation result. When the normal stress is 100 kPa and the R = 0 mm, the discrepancy between the experimental and simulated shear strengths is 0.91% for clay and 5.33% for silt. As the normal stress increases, at a normal stress of 400 kPa and R = 1.78 mm, the relative error for clay is 4.78% and for silt is 11.53%. These values remain within the allowable range. This is due to the fact that the boundary conditions of the numerical simulation are optimal, and an increase in normal stress will result in greater friction between the soil and the shear disc, thereby increasing the shear strength. It is evident that the shear–displacement curves derived from the experiment and the numerical simulation exhibit greater consistency and a lack of distortion, thereby enabling their analysis as scientific data.

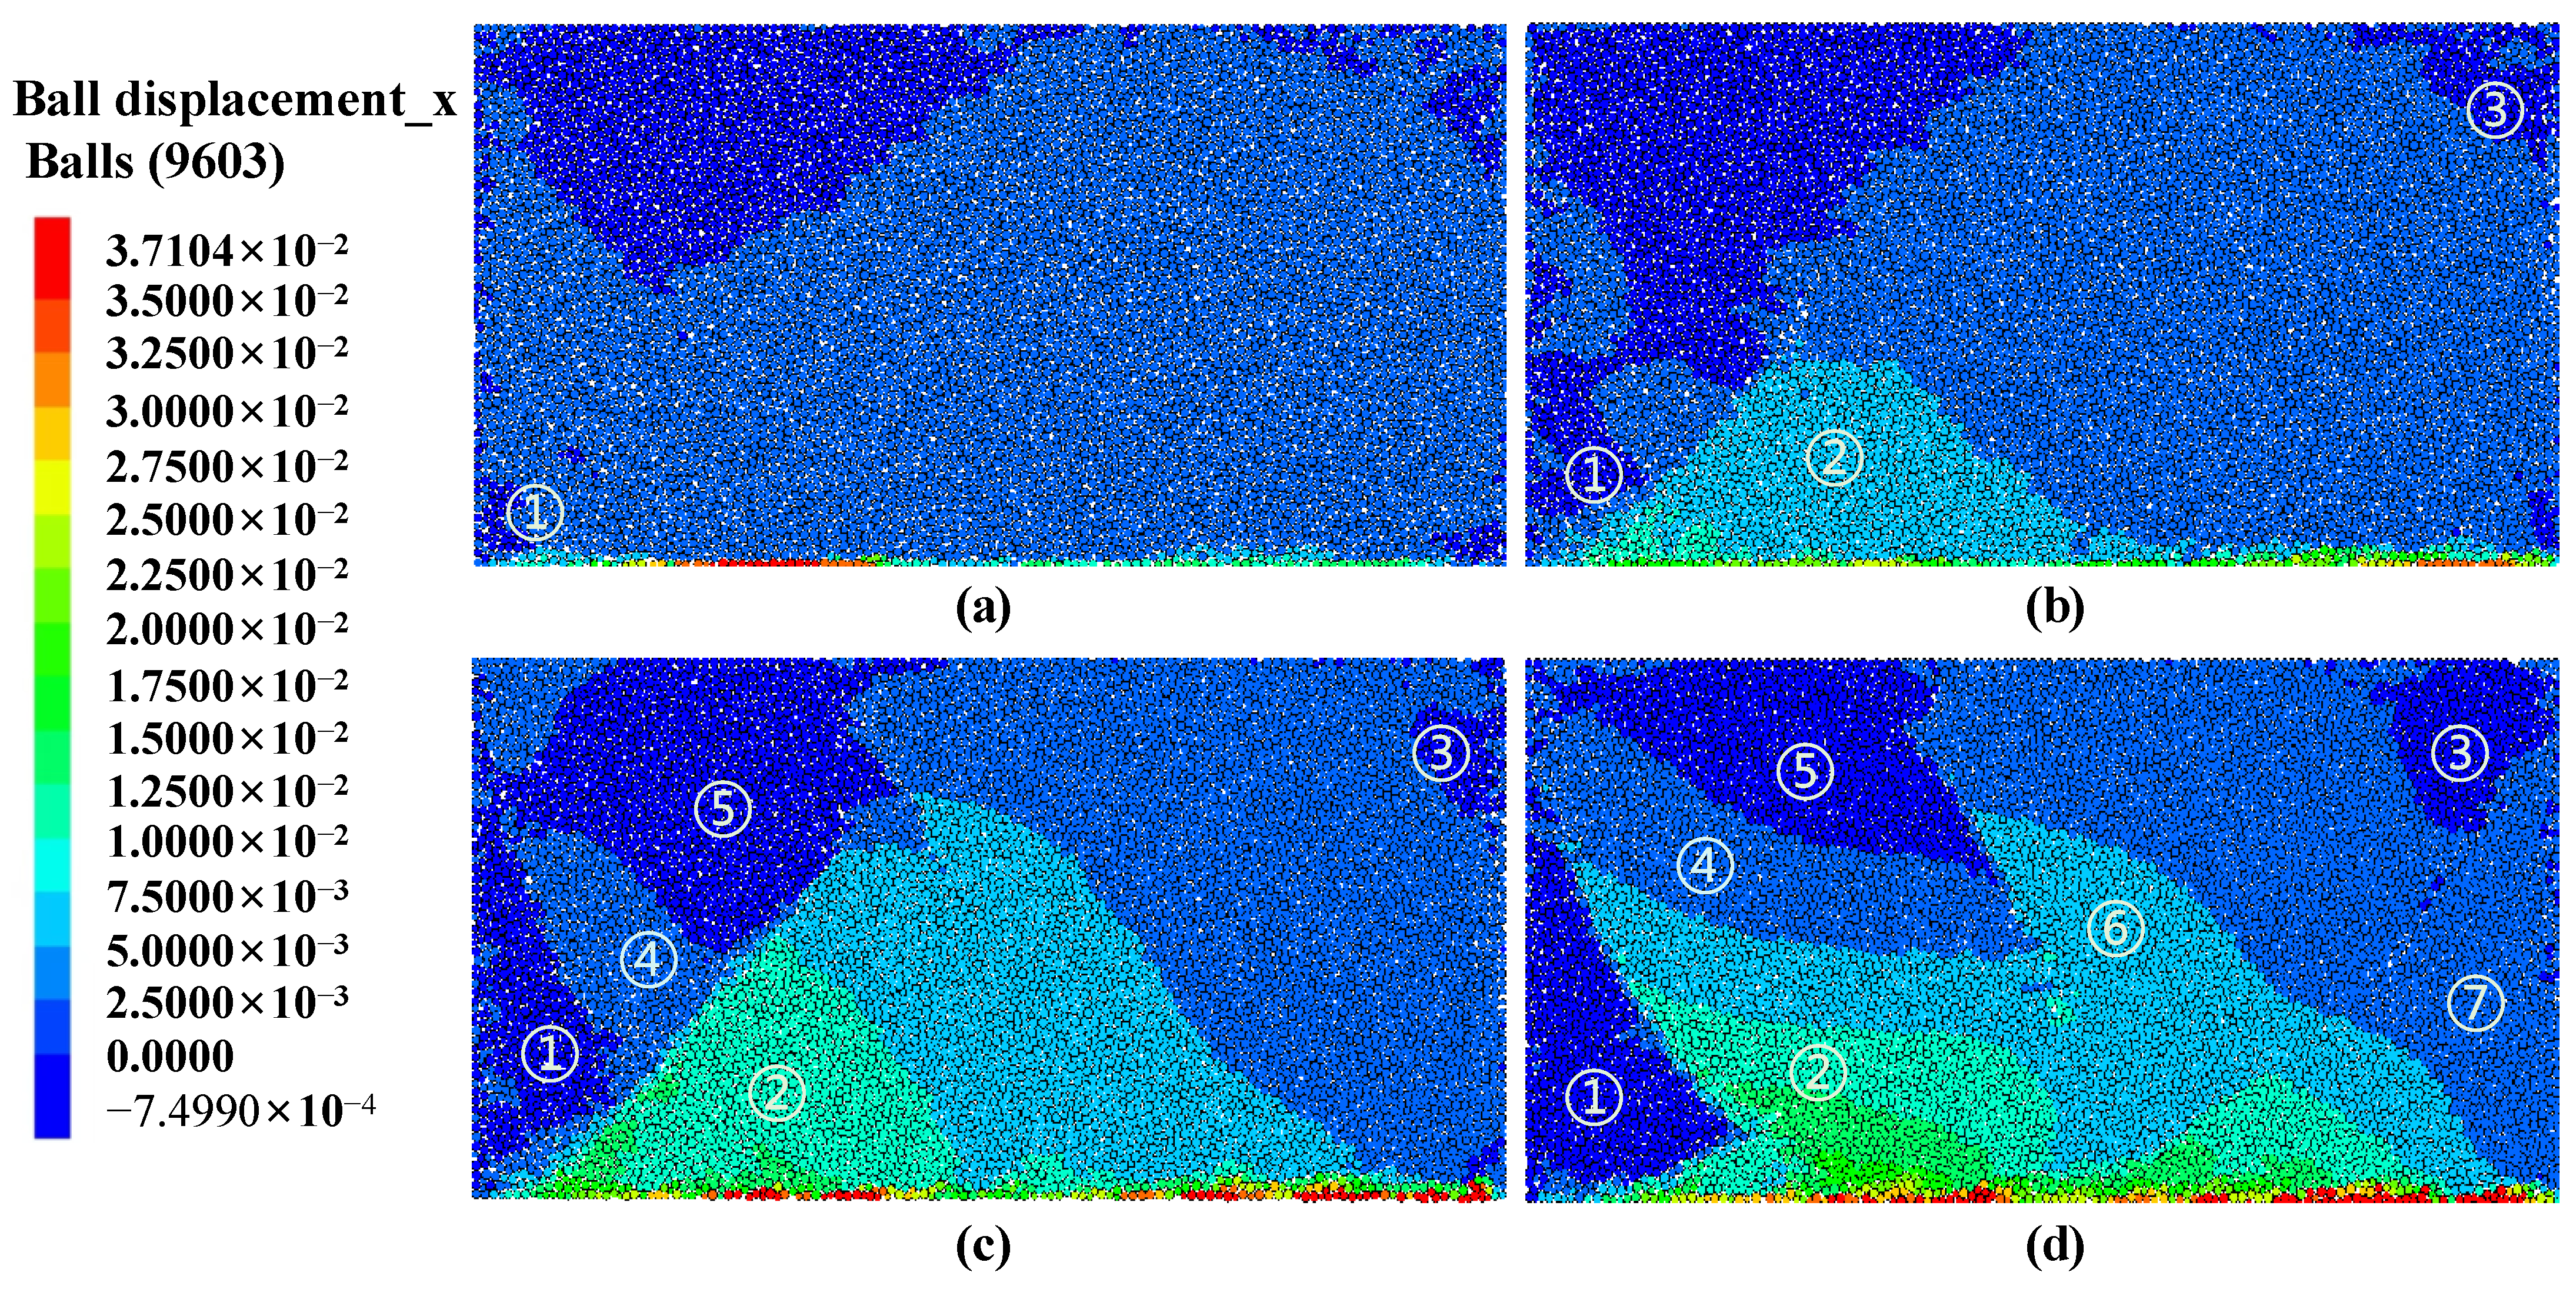
5.3. Clay Displacement Analysis

Figure 11 illustrates the displacement of the particles in the shear direction subsequent to the completion of 40 mm of shear processing of the clay. The symbols ①, ②, and ③, etc., represent the sequence and location of the agglomerates’ formation.
As illustrated in the figure, the normal stress exerts a more pronounced influence on the displacement than other factors. At low normal stress, it is evident that the shear surface of the clay particles is distributed in the form of a circular arc from the bottom to the top. The maximum shear displacement is observed at the bottom, at a distance of 7–10 cm from the lower-left end point. This phenomenon can be attributed to the fact that the clay undergoes complete consolidation under the influence of the normal force, forming a multitude of large-volume aggregates that collectively resist the external force. Consequently, the particles and aggregates situated at the bottom are displaced. At the end point, the particle aggregates are influenced by the boundary and begin to tumble. At a distance of 7–10 cm from the lower-left end point, the particles move with the concrete and exert pressure on the soil particles in the shear direction, resulting in a displacement of the middle particles at the bottom that is smaller than that observed at 7–10 cm from the lower-left end point. As the normal stress is increased, the size of the particle aggregates decreases, resulting in the formation of multiple shear zones. Upon reaching a normal stress of 400 kPa, the particles at the lower-left end point begin to migrate with the concrete to the other side. This results in the formation of new shear zones and cracks in conjunction with the existing shear zones, which in turn causes particles to migrate in a tumbling motion, leading to shear deformation of the soil and displacement of the largest position, which extends to 17–27 cm from the lower-left end point.

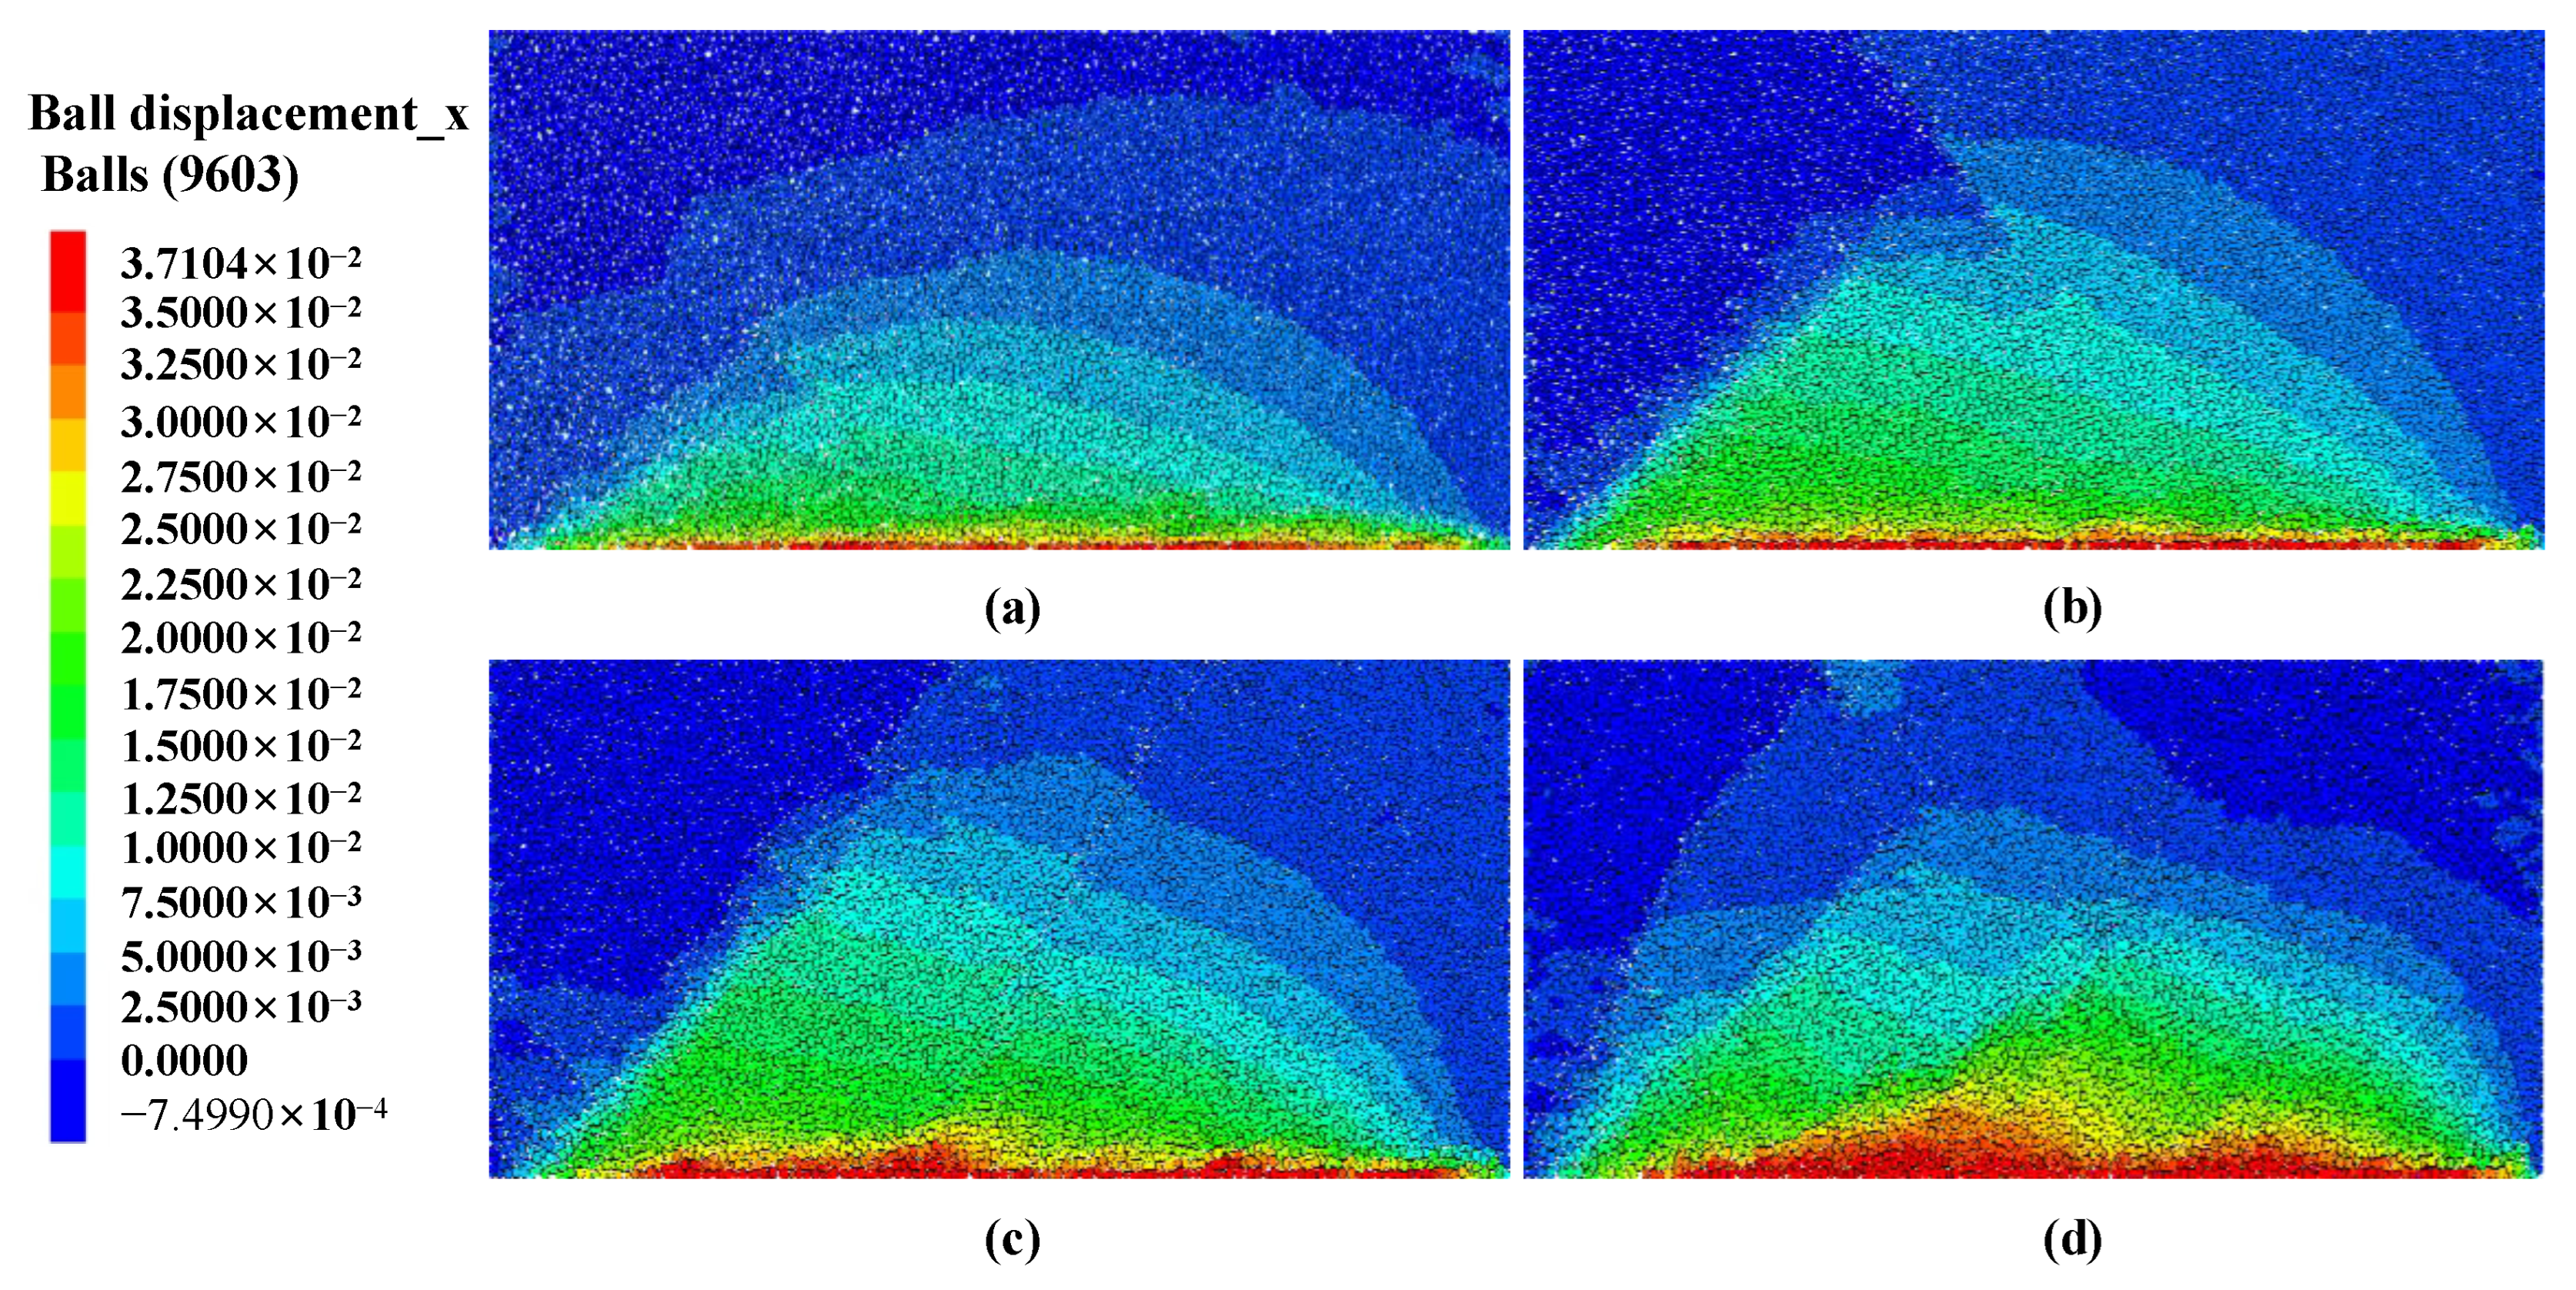
5.4. Displacement Analysis of Silt

Figure 12 illustrates the displacement of silt along the shear direction of the particles at the conclusion of 40 mm of shear.
The figures illustrate that the normal stress exerts a significant influence on the shear displacement of silt. As the normal stress increases, the displacement of silt also rises. When the normal stress is 100 kPa, the displacement is largest at the bottom of the middle layer of particles. In contrast, the displacement of other particles is upwardly extended in the form of a circular arc, with the highest displacement occurring at the top surface. The point of the top surface is 65.41 mm from the top surface. As the normal stress increases, the middle particles are displaced by the bottom particles. The same displacement of the middle particles is driven by the bottom particles as the normal stress increases, which is also 5–12 cm away from the lower-left end point. The displacement is extended upward in the form of a circular arc. When the normal stress exceeds 200 kPa, fissures emerge within the soil mass, and the particle displacement is significantly affected by the fissures. In general, the displacement near the fissure boundary continues to increase, while the displacement far from the interface remains unchanged. The reason for this is that silt itself has low cohesion and does not form clay-like particle aggregates. The cohesion at the powdered concrete–soil interface is mainly derived from the contribution of the friction between the particles and the interface. When the bottom particles are completely displaced by the concrete slab, the upper particles move with it. An increase in normal stress results in a reduction in the gap between particles, leading to shear shrinkage and an increase in particle occlusion. This, in turn, causes strain hardening of the shear stress–displacement curve.

6. Constitutive Model

The analysis presented above reveals that the stress–displacement curves of both clay and silty clay exhibit strain-softening behavior, whereas the silt shear displays strain-hardening characteristics. In this paper, the hyperbolic model proposed by Clough and Duncan is modified using nonlinear fitting to obtain model equations suitable for the pre-peak strain-softening and strain-hardening stages, in order to fit the initial peak stage shear stress–displacement curves of the three types of soil. These equations are then compared with the above experimental results [35].

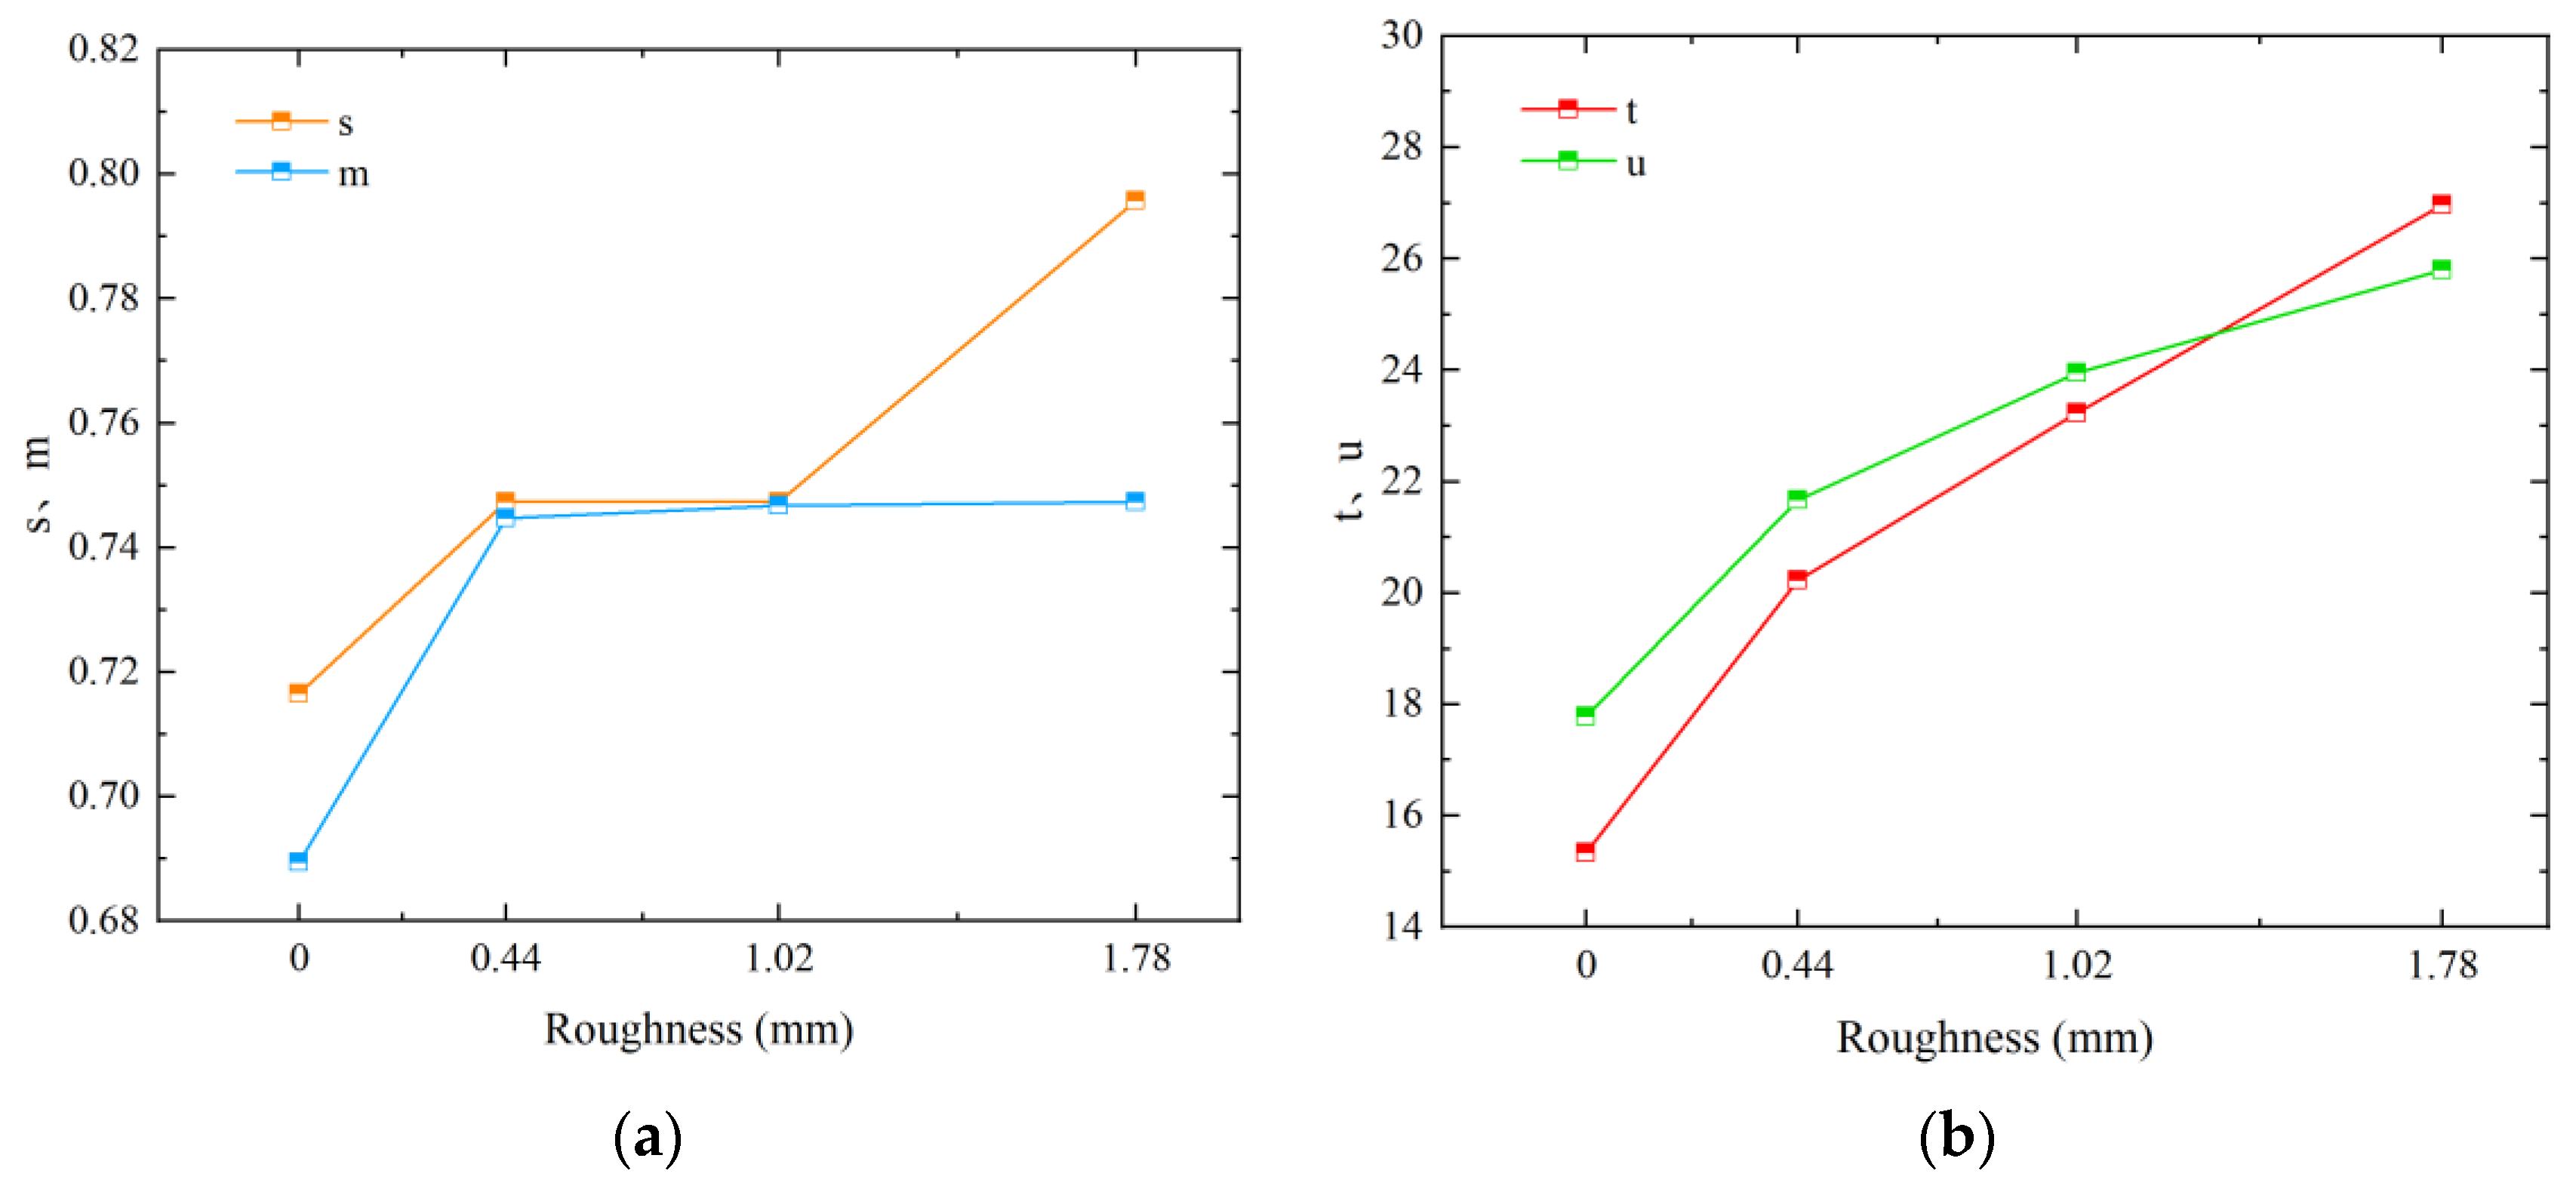
6.1. Fitting before Peak Strain Softening

In the initial peak stage of shear stress, the relationship between shear stress and shear volume is obtained from the Clough and Duncan hyperbolic model:
τ = δ a + b δ
The term τ denotes the shear stress, δ denotes the shear displacement, and a, b are parameters. These parameters can be obtained ( a = 1 E i , b = 1 τ ult ) through interface shear experiments. Ei denotes the initial shear stiffness, and τ s denotes the asymptotic value of the hyperbolic curve. As the curve exhibits strain softening and τ s is always greater than the shear strength τ p , the ratio of the two is defined as the failure ratio R f :
R f = τ p τ s
Substituting a, b into Equation (2) and taking the derivative to δ , the interface shear modulus Ki is obtained:
K i = ( 1 R f τ τ p ) E i
The initial shear stiffness, an important experimental parameter, is related to the normal stress as follows:
E i = K P a σ P a n
The term Pa represents the standard atmospheric pressure, while K and n are parameters. By combining Equations (1) and (5), we obtain Equation (4) that describes the relationship between the normal stress, interfacial friction angle, interfacial cohesion, and interfacial shear modulus:
K i = ( 1 R f τ c p + σ tan ϕ p ) 2 K P a ( σ P a ) n
Finally, the relationship between shear stress τ and initial-peak position S is obtained, τ = S K i . The fitted curve for the pre-peak phase is drawn and compared with the experiment data in Figure 13.
For strain-softening materials, there is a stress peak. When determining the shear strength, the peak value is taken. Moreover, the model is not applicable to the softening part in the latter half.
As depicted in the figure, while the data fitting with the experimental data seems to show a high degree of correlation, one cannot simply assume that this necessarily substantiates the efficacy of the Clough and Duncan eigenstructural model in a clay and silty clay roughness assessment. There may be other factors at play that could be influencing the results and making the apparent correlation less reliable. Moreover, the claim that an increase in roughness leads to the shear stress–shear volume curve reaching its peak at the backward shift position is not without question. Additionally, the assertion that roughness significantly enhances the shear ductility of soil samples under low normal stress based on the observed phenomena with a decrease in normal stress is rather bold and may not hold true in all cases. There could be other factors contributing to the change in shear ductility that have not been considered.

6.2. Strain Hardening Fitting

The stress–strain curves of silt are strain hardening with τ p = τ s . As in the clay method, the silt fitted straight lines Ei and τ p are obtained.
High correlation coefficients were obtained from the experimental parameters for both Ei and σ , τ p , and σ , and the relationship was fitted to Ei and σ , τ p , and σ to obtain the equation [36].
E i = s σ + t
τ p = m σ + u
In this context, the variables s, t, m, and u are to be regarded as parameters, and the resulting fitting curves are illustrated in Figure 14.
As illustrated in the figure, an increase in roughness results in a gradual growth in the parameter s, m, with a relatively minor change. This suggests that the influence of roughness on s, m is limited, and that the average value, s ¯ , m ¯ , can be used to represent s, m. In contrast, the parameter t, u demonstrates a clear linear correlation with an increase in roughness, and the expression for the change in parameter t, u with the change in roughness is given as follows:
t = α R + β
u = γ R + θ
In this context, α denotes the slope of the line fitted by Equation (9), while β denotes the intercept of the line fitted by Equation (9). Similarly, γ denotes the slope of the line fitted by Equation (10), whereas θ denotes the intercept of the line fitted by Equation (10).
The expressions for the relationship between Ei and R and τ p and R, respectively, can be obtained by bringing Equations (9) and (10) into Equations (7) and (8), respectively:
E i = s ¯ σ + α R + β
τ p = m ¯ σ + γ R + θ
Subsequently, Equations (11) and (12) are integrated into Equation (2), which can be aggregated to derive the expression for the hyperbolic model of the variation of concrete and silt with roughness:
τ = δ 1 s ¯ σ + α R + β + δ m ¯ σ + γ R + θ
The hyperbolic model is capable of accounting for the influence of normal stress and roughness, and comprises a total of six parameters, all of which can be derived from the concrete–silt interface shear test. σ , R, and the experimentally obtained parameters are brought into Equation (12) to obtain the silt shear stress–shear fitting curve, and the test values are compared to obtain the validation results under different roughness levels, as shown in Figure 15.
The fitted curves obtained by correcting the strain-hardening model to take into account the effect of roughness may not be as accurate as they seem. Although the silt shear stress–shear displacement curves appear to be well fitted, as illustrated in the figure, there are doubts about whether this model can truly simulate the peak shear strength of the concrete–silt interface and the shear displacement of the elastic phase of the curves under different roughness conditions. It is possible that there are limitations and inaccuracies in the model, and further scrutiny and verification are required to determine the reliability of these results.

7. Discussion

The objective of this study is to investigate the interfacial shear behavior of concrete in contact with clay, silty clay, and silt. To this end, we conducted indoor interfacial shear tests and numerical simulations, as well as a partial theoretical analysis. We then verified the results of each with the other in order to draw reliable scientific conclusions.
It should be noted, however, that the present study is not without limitations. In particular, the indoor tests were conducted under conditions of CNL, and did not include tests under CNS and CV conditions. Furthermore, the simulated concrete slab and the actual roughness concrete slab exhibited only partial matching in terms of roughness. Finally, the theoretical analysis did not involve the model after the shear peak under strain-softening conditions. These limitations render the study less comprehensive.
The scope of this paper is constrained by the necessity to avoid opening up new research avenues. In future research, it would be advantageous to address these issues and expand the experimental conditions, thereby enhancing the richness and comprehensiveness of this research field. Additionally, further exploration could be made into the influence of different environmental factors on interfacial shear behavior, which would provide a more in-depth understanding of the complex interactions between concrete and different soil types.

8. Conclusions

This method is designed to more accurately replicate the surface roughness of field-cast concrete, thereby producing test results that are more closely aligned with the actual engineering situation. The findings of this study led to the following conclusions.
(1)
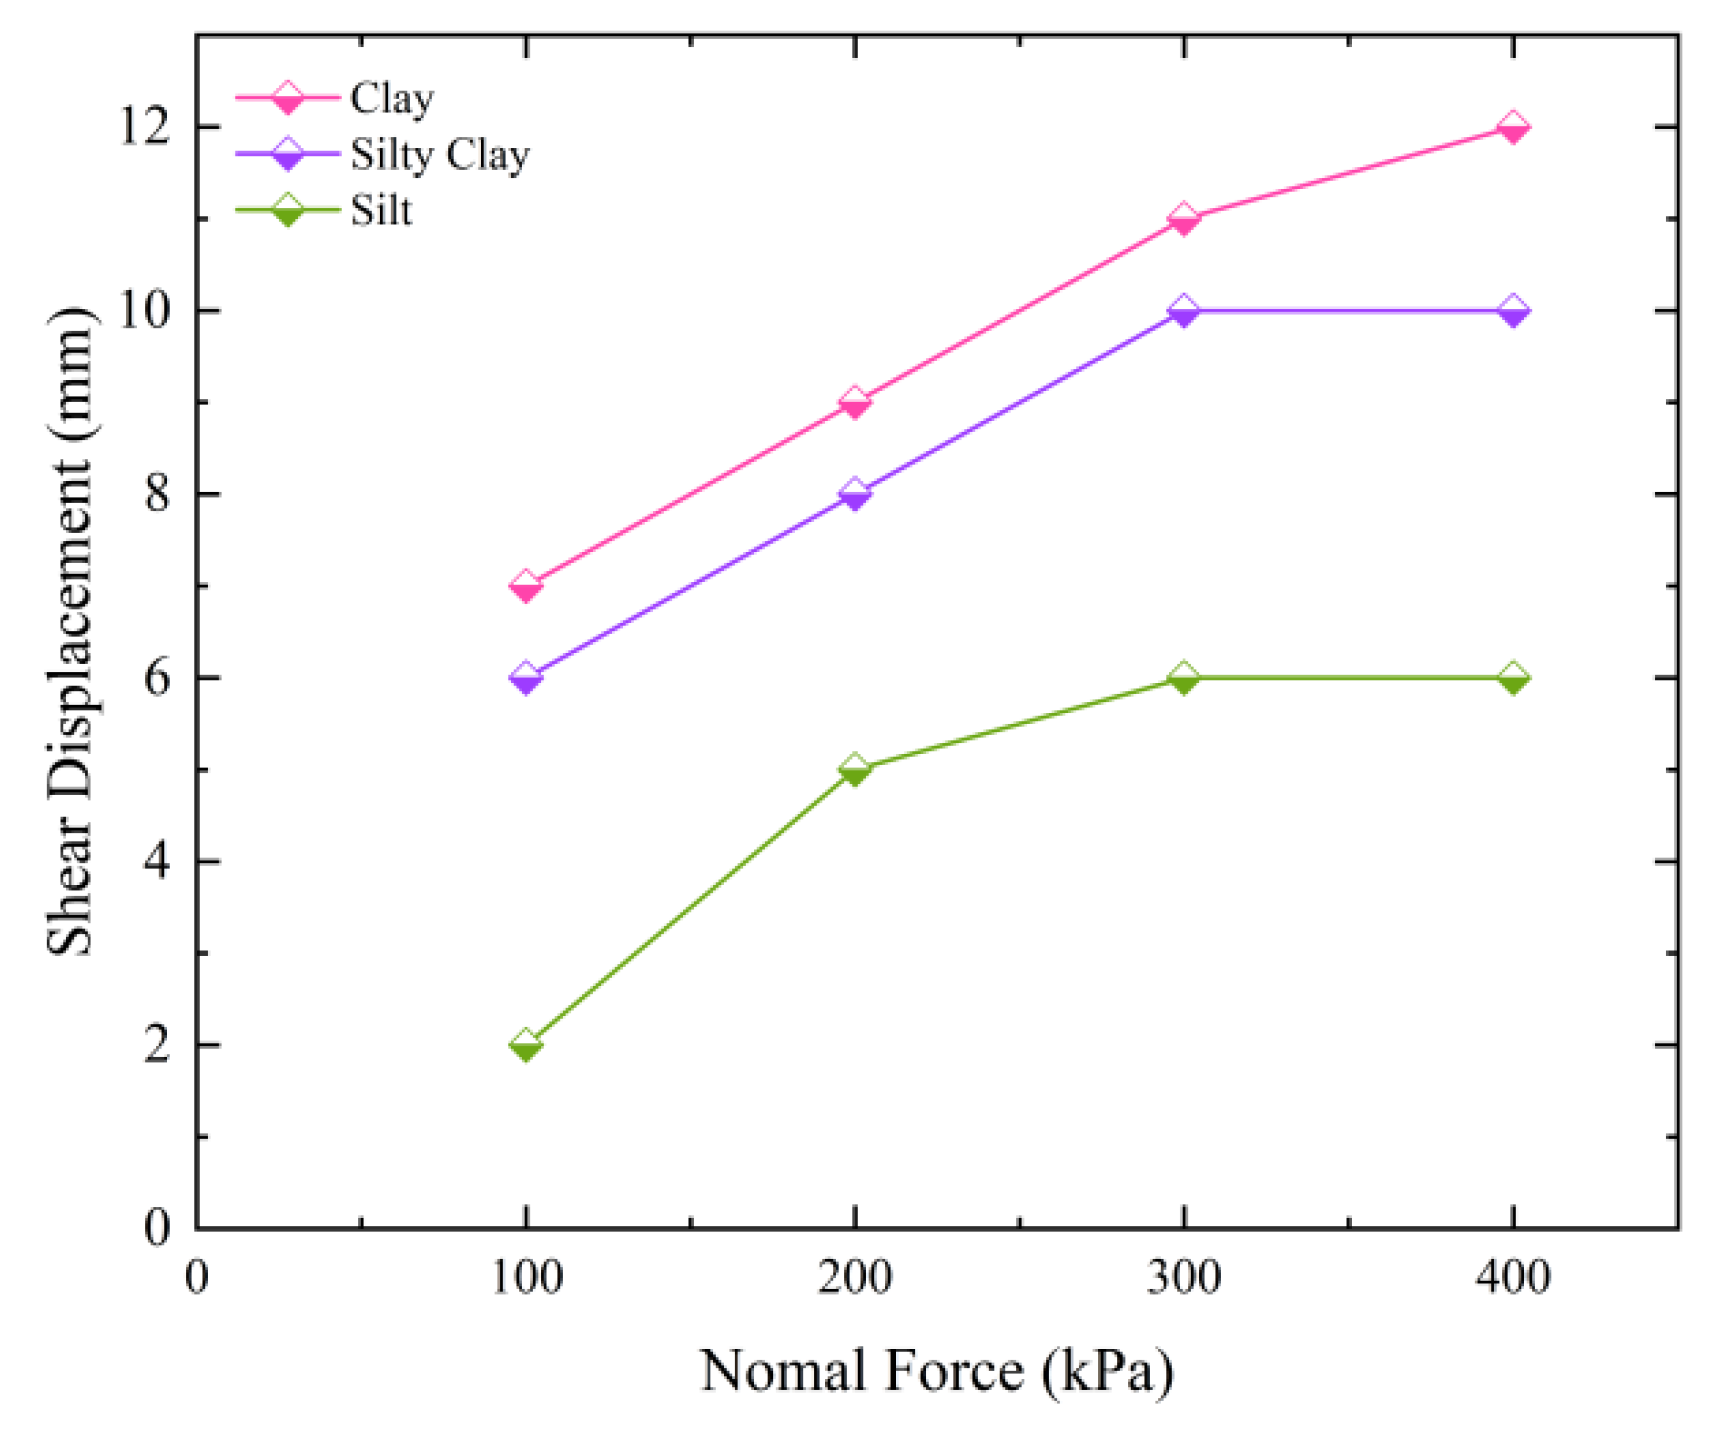
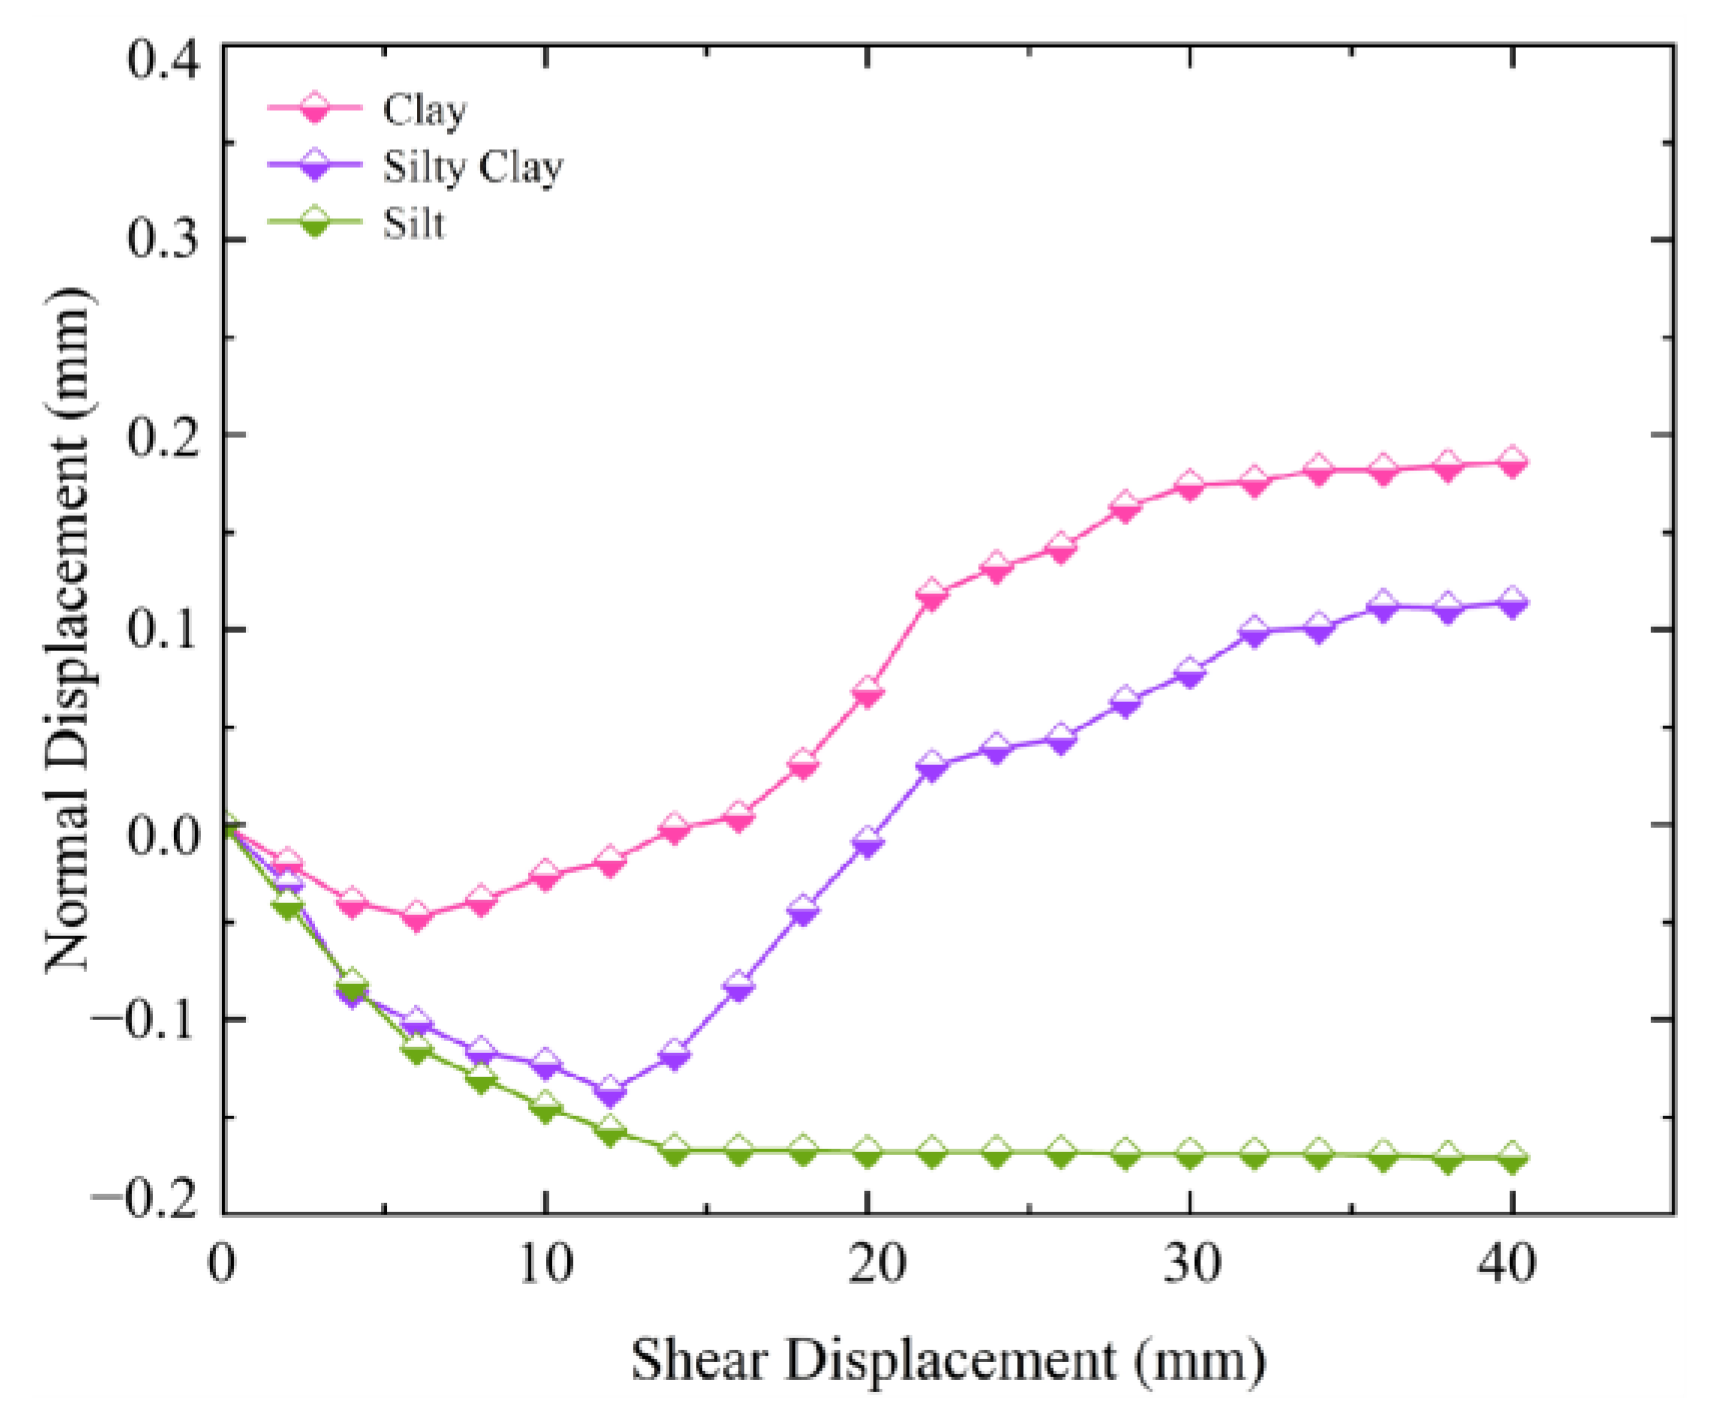
When subjected to the same level of roughness, the shear stress–displacement curves of clay and silty clay demonstrate strain softening, whereas silt exhibits strain hardening. As the normal stress increases, the displacement required for the peak shear strength of the three soils increases. During the shear process, the clay and silty clay exhibit shear expansion deformation, while the silt displays shear contraction deformation.
(2)
During the shear process, clay particles form aggregates of varying sizes to resist shear, resulting in the formation of multiple shear bands with the increase in normal stress. Silt particles resist shear through interfacial friction generated by shear, and when the bottom particles are displaced, occlusion force is generated between the particles to resist shear. The magnitude of this occlusion force is directly proportional to the normal stress, and the displacement of particles is directly proportional to the magnitude of the occlusion force.
(3)
The hyperbolic model put forth by Clough and Duncan was fitted to obtain model equations that are suitable for strain softening prior to the peak and strain hardening. Additionally, an intrinsic model of strain hardening under the influence of roughness was proposed, and it yielded favorable fitting results.
(4)
Future work will focus on addressing the limitations identified in this study. Tests under CNS and CV conditions will be conducted to gain a more comprehensive understanding of interfacial shear behavior. Efforts will be made to improve the matching of simulated and actual concrete slabs in terms of roughness. Moreover, the model after the shear peak under strain-softening conditions will be explored to enhance the theoretical analysis. This will contribute to a more in-depth understanding of interfacial shear behavior and provide more accurate guidance for practical engineering applications.

Author Contributions

Conceptualization, Z.N. and S.W.; methodology, Z.N. and S.W.; software, S.W.; validation, F.H., W.L. and L.B.; formal analysis, S.W. and L.B.; investigation, S.W. and F.H.; resources, Z.N. and S.W.; data curation, F.H.; writing—original draft preparation, S.W.; writing—review and editing, Z.N. and S.W.; visualization, W.L. and L.B.; supervision, F.H.; project administration, S.W.; funding acquisition, Z.N. All authors have read and agreed to the published version of the manuscript.

Funding

This research was co-funded by the “Shandong Province Housing and Urban–Rural Construction Science and Technology Program Project of China (2022-K9-1)”; “Horizontal Project of Liaocheng University (K24LD71)”; and the “Shandong Provincial Transportation Technology Plan of China (2023B37)”.

Data Availability Statement

Data are contained within the article.

Conflicts of Interest

The authors declare no conflicts of interest.

References

  1. Zhang, B.Y.; Wen, Y.F.; Zhu, B.Z.; Yu, Y.Z. A Review of Developments in Geotechnical Structures and Slope Engineering—Mechanisms of Action and Numerical Simulation Methods. China Civ. Eng. J. 2016, 49, 1–15+35. [Google Scholar] [CrossRef]
  2. Zhang, L.; Wang, T.; Zhao, Z.; Jin, X. Research on Bearing Difference between Single-Pile Composite Foundation Field Test and Group-Pile Composite Foundation of High-Rise Buildings. Buildings 2023, 13, 2127. [Google Scholar] [CrossRef]
  3. Boulon, M. Basic features of soil structure interface behaviour. Comput. Geotech. 1989, 7, 115–131. [Google Scholar] [CrossRef]
  4. Hu, L.M. Study on Mechanical Characteristies of Soil-Structure Interface and Its Application; D. Tsinghua University: Beijing, China, 2000. [Google Scholar]
  5. Yin, Z.Z.; Zhu, H.; Xu, G.H. Deformation of soil-structure material contact surface and its mathematical simulation. Chin. J. Geotech. Eng. 1994, 3, 14–22. [Google Scholar]
  6. Zhang, G.; Zhang, J.M. Experimental study of monotonic mechanical properties of coarse-grained soils in contact with structural surfaces. Chin. J. Geotech. Eng. 2004, 1, 21–25. [Google Scholar]
  7. Wang, G.; Zhang, X.P.; Jiang, Y.J.; Li, B.; Wu, X.Z.; Huang, N. Meso-mechanism research on shear failure of rock joint based on particle discrete element method. J. Cent. South Univ. 2015, 46, 1442–1453. [Google Scholar]
  8. Feligha, M.; Hammoud, F.; Belachia, M.; Nouaouria, M.S. Experimental Investigation of Frictional Behavior Between Cohesive Soils and Solid Materials Using Direct Shear Apparatus. Geotech. Geol. Eng. 2016, 34, 567–578. [Google Scholar] [CrossRef]
  9. Han, F.; Ganju, E.; Salgado, R.; Prezzi, M. Effects of Interface Roughness, Particle Geometry, and Gradation on the Sand-Steel Interface Friction Angle. J. Geotech. Geoenviron. Eng. 2018, 144, 12. [Google Scholar] [CrossRef]
  10. Wang, Y.; Liu, X.; Zhang, M.; Bai, X. Effect of Roughness on Shear Characteristics of the Interface between Silty Clay and Concrete. Adv. Civ. Eng. 2020, 2, 1–9. [Google Scholar] [CrossRef]
  11. Zhang, M.; Sang, S.; Wang, Y.; Bai, X. Factors Influencing the Mechanical Characteristics of a Pile–Soil Interface in Clay Soil. Front. Earth Sci. 2020, 7, 364. [Google Scholar] [CrossRef]
  12. Zhou, J.J.; Yu, J.L.; Gong, X.; Naggar, M.H.E.; Zhang, R. The effect of cemented soil strength on the frictional capacity of precast concrete pile-cemented soil interface. Acta Geotech. 2020, 15, 3271–3282. [Google Scholar] [CrossRef]
  13. Gu, M.; Han, J.; Zhao, M. Three-Dimensional DEM Analysis of Axially Loaded Geogrid-Encased Stone Column in Clay Bed. Int. J. Geomech. 2020, 20, 04019180. [Google Scholar] [CrossRef]
  14. Ding, L.N.; Chai, J.N.; Qin, Y.; Xu, Z.G. A study of the correction of the formula for the peak shear strength of joints. Chin. J. Appl. Mech. 2021, 2, 811–817. [Google Scholar] [CrossRef]
  15. Li, D.; Shi, C.; Ruan, H.; Li, B.Y. Shear Characteristics of Soil—Concrete Structure Interaction Interfaces. Appl. Sci. 2022, 12, 9145. [Google Scholar] [CrossRef]
  16. Jin, J.X.; Yuan, S.H.; Liang, B. Visualized test study on shear characteristics of friction pile-sand-soil interface. J. Exp. Mech. 2022, 37, 551–559. [Google Scholar] [CrossRef]
  17. Ma, Y.; Guo, J.; Wang, R.; Zhang, Q.; Zhang, Q.; Li, J.; Zuo, S. Study on Cyclic Shear Properties of Siliceous Sand–Steel Interface under Different Normal Loading Conditions. Buildings 2023, 13, 2241. [Google Scholar] [CrossRef]
  18. Jia, J.; Wei, H.; Yang, D.; Wu, Y. The Impact of Freeze–Thaw Cycles on the Shear and Microstructural Characteristics of Compacted Silty Clay. Buildings 2023, 13, 2308. [Google Scholar] [CrossRef]
  19. Lin, C.; Wang, G.; Guan, C.; Feng, D.; Zhang, F. Experimental study on the shear characteristics of different pile-soil interfaces and the influencing factors. Cold Reg. Sci. Technol. 2023, 206, 103739. [Google Scholar] [CrossRef]
  20. Nguyen, T.T.; Nguyen, D.M.; Nguyen, T.; Thanh, C.P. Interface Shear Strength Behavior of Cement-Treated Soil under Consolidated Drained Conditions. Buildings 2023, 13, 1626. [Google Scholar] [CrossRef]
  21. Santos, D.B.; Sousa, P.F.D.; Cavalcante, A.L.B. Analytical Modeling of Unsaturated Soil Shear Strength during Water Infiltration for Different Initial Void Ratios. Sustainability 2024, 16, 1394. [Google Scholar] [CrossRef]
  22. Amorosi, A.; Kavvadas, M. A constitutive model for structured soils. Géotechnique 2000, 50, 263–273. [Google Scholar] [CrossRef]
  23. Savvides, A.A.; Papadrakakis, M. A computational study on the uncertainty quantification of failure of clays with a modified Cam-Clay yield criterion. SN Appl. Sci. 2021, 3, 659. [Google Scholar] [CrossRef]
  24. Liu, F.C.; Shang, S.P.; Wang, H.D. Study df Shaer Properties of Silty Clay-Concrete Interface by Simple Shear Tests. Chin. J. Rock Mech. Eng. 2011, 30, 1720–2728. [Google Scholar]
  25. Cheng, H.; Zeng, G.D.; Zhou, M.; Wang, X.; Zhang, J.S.; Wang, J. Peak Shear Strength Model for Clay-concrete Interface Considering Roughness. Adv. Eng. Sci. 2021, 53, 168–177. [Google Scholar] [CrossRef]
  26. Chen, X.B.; Zhang, J.S.; Xiao, Y.; Li, J. Effect of roughness on shear behavior of red clay–concrete interface in large-scale direct shear tests. Can. Geotech. J. 2015, 52, 1122–1135. [Google Scholar] [CrossRef]
  27. Zhao, J.Y.; Li, S.Y.; Wang, C.; You, T.T.; Liu, X.Y.; Zhao, Y.C. A universal soil–water characteristic curve model based on the particle size distribution and fractal theory. J. Hydrol. 2023, 622, 129691. [Google Scholar] [CrossRef]
  28. Taha, A.; Fall, M. Shear Behavior of Sensitive Marine Clay-Concrete Interfaces. J. Geotech. Geoenviron. Eng. 2013, 139, 644–650. [Google Scholar] [CrossRef]
  29. Cheng, H.; Chen, X.B.; Zhang, J.S.; Li, J.; Zhang, B. Experimental Study on Residual Strength Characteristics of Red Viscous Concrete-Clay Structures at Contact Surfaces. J. Cent. South Univ. 2017, 48, 2458–2464. [Google Scholar] [CrossRef]
  30. Uesugi, M.; Kishida, H. Influential Factors of Friction Between Steel and Dry Sands. Soils Found. 1986, 26, 33–46. [Google Scholar] [CrossRef]
  31. Martinez, A.; Frost, J.D. The influence of surface roughness form on the strength of sand–structure interfaces. Géotech. Lett. 2017, 7, 1–8. [Google Scholar] [CrossRef]
  32. Mehrotra, B.K.M.P. Modelling of particle stratification in jigs by the discrete element method. Miner. Eng. 1998, 11, 511–522. [Google Scholar] [CrossRef]
  33. Li, S.; Liu, Y.; Wu, K.J. Exploring Mesoscopic Deformation Mechanism of Sand in Direct ShearTest by Numerical Simulation Using Discrete Element Method. J. Yangtze River Sci. Res. Inst. 2017, 34, 8. [Google Scholar] [CrossRef]
  34. Gu, M.; Han, J.; Zhao, M. Three-Dimensional Discrete-Element Method Analysis of Stresses and Deformations of a Single Geogrid-Encased Stone Column. Int. J. Geomech. 2017, 17, 04017070. [Google Scholar] [CrossRef]
  35. Clough, G.W.; Duncan, J.M. Finite element analyses of retaining wall behavior. J. Soil Mech. Found. Eng. 1971, 97, 1657–1673. [Google Scholar] [CrossRef]
  36. Gao, D.H.; Xing, Y.C.; Guo, M.X.; Zhang, A.J.; Wang, X.T.; Ma, B.H. Modified hyperbola model of interface between unsaturated remolded loess and concrete. J. Jilin Univ. 2020, 50, 156–164. [Google Scholar] [CrossRef]
Figure 1. Experiment apparatus: (a) TKA-DDS-30F large direct shear apparatus; (b) shear box cross-section.
Buildings 14 02889 g001
Figure 2. Concrete slab mold and concrete slabs: (a) Concrete slab mold; (b) concrete slabs.
Buildings 14 02889 g002aBuildings 14 02889 g002b
Figure 3. Interface shear stress–displacement curves for R = 0.44 mm: (a) Clay; (b) silty clay; (c) silt.
Buildings 14 02889 g003
Figure 4. Peak shear stress corresponding to shear displacement.
Buildings 14 02889 g004
Figure 5. Relationship between soil normal displacement and shear displacement.
Buildings 14 02889 g005
Figure 6. Shear strength envelope of concrete interface at R = 0.44 mm.
Buildings 14 02889 g006
Figure 7. Concrete and clay shear stress–displacement curves for different R values: (a) R = 0 mm; (b) R = 0.44 mm; (c) R = 1.02 mm; (d) R = 1.78 mm.
Buildings 14 02889 g007
Figure 8. Concrete and silt shear stress–displacement curves for different R values: (a) R = 0 mm; (b) R = 0.44 mm; (c) R = 1.02 mm; (d) R = 1.78 mm.
Buildings 14 02889 g008
Figure 9. Shear strength index of concrete–soil at different R values: (a) Interfacial friction angle; (b) interfacial cohesion.
Buildings 14 02889 g009
Figure 10. Comparison of shear–displacement curves between experiments and numerical simulation: (a) Clay, R = 0 mm; (b) clay, R = 1.78 mm; (c) silt, R = 0 mm; (d) silt, R = 1.78 mm.
Buildings 14 02889 g010
Figure 11. Displacement in shear direction for clay particle simulation experiments: (a) 100 kPa; (b) 200 kPa; (c) 300 kPa; (d) 400 kPa.
Buildings 14 02889 g011
Figure 12. Displacement in shear direction for silt particle simulation experiments: (a) 100 kPa; (b) 200 kPa; (c) 300 kPa; (d) 400 kPa.
Buildings 14 02889 g012
Figure 13. Comparison of experimental and fitted values for clay and silty clay: (a) Clay, R = 0 mm; (b) clay, R = 0.44 mm; (c) clay, R = 1.02 mm; (d) clay, R = 1.78 mm; (e) silty clay, R = 0 mm; (f) silty clay, R = 0.44 mm; (g) silty clay, R = 1.02 mm; (h) silty clay, R = 1.78 mm.
Buildings 14 02889 g013aBuildings 14 02889 g013b
Figure 14. Fitted parameters: (a) Parameters s and m; (b) parameters t and u.
Buildings 14 02889 g014
Figure 15. Comparison of test and fitted values for silt: (a) Silt, R = 0 mm; (b) silt, R = 0.44 mm; (c) silt, R = 1.02 mm; (d) silt, R = 1.78 mm.
Buildings 14 02889 g015
Table 1. Geotechnical experiment parameters.
SoilRelative Density g/cm3Density g/cm3Dry Density g/cm3PorosityLiquid Limit %Plastic Limit %Plasticity IndexCuCc
Clay2.731.911.480.83238.920.218.73.190.82
Silty Clay2.721.831.480.88528.917.311.62.730.95
Silt2.691.871.480.76319.512.57.02.360.93
Table 2. Concrete surface roughness.
Concrete NumberSand Size Distribution (mm)Maximum Surface Height (mm)Sand Filling Volume (mm3)R (mm)
00000
1<1.180.3244.80.44
22.36–1.180.97103.71.02
34.75–2.361.81181.61.78
Table 3. Fine view parameters of the simulation experiment.
SoilNormal Stiffness (N/m)Tangential Stiffness (N/m)Normal Bond Strength (N)Tangential Bond Strength (N)Coefficient of Friction
Clay6 × 1065 × 1069 × 1039 × 1030.3
Silt2 × 1061 × 1064 × 1034 × 1030.5
Disclaimer/Publisher’s Note: The statements, opinions and data contained in all publications are solely those of the individual author(s) and contributor(s) and not of MDPI and/or the editor(s). MDPI and/or the editor(s) disclaim responsibility for any injury to people or property resulting from any ideas, methods, instructions or products referred to in the content.

