Article

Seismic Response of Multi-Story Buildings Subjected to Luding Earthquake 2022, China Considering the Deformation Saturation Theory

1
Key Laboratory of Earthquake Engineering and Engineering Vibration, Institute of Engineering Mechanics, China Earthquake Administration, Harbin 150080, China
2
Key Laboratory of Earthquake Disaster Mitigation, Ministry of Emergency Management, Harbin 150080, China
3
School of Civil Engineering, Institute of Disaster Prevention, Sanhe 065201, China
4
Yunnan Earthquake Agency, Kunming 650224, China
5
School of Civil Engineering, Jiaying University, Meizhou 514015, China
*
Authors to whom correspondence should be addressed.
Buildings 2024, 14(9), 2887; https://doi.org/10.3390/buildings14092887
Submission received: 12 August 2024 / Revised: 31 August 2024 / Accepted: 10 September 2024 / Published: 12 September 2024
(This article belongs to the Section Building Structures)

Abstract

:
Frequent seismic events have demonstrated that building collapse is primarily caused by the loss of load-bearing capacity in vertical structural members. In response to this risk, various national design codes have been established. This study conducted field investigations at an earthquake site in Luding County, Sichuan Province, which was struck at a magnitude of 6.8 on 5 September 2022. In this case, the lower x-direction load-bearing wall of the Tianyi Hotel suffered severe shear damage, and the building was on the verge of collapse. However, no obvious damage was seen in the elementary school dormitory. Numerical simulation analysis revealed that during the earthquake, the buildings primarily experienced y-direction displacement in the x-direction, with significant differences in the stress state among different axes. In the model of Tianyi Hotel, the x-direction load-bearing walls suffered shear damage, while the frame columns were still in the elastic stage. At this point, the shear force of the walls was 6–9 times that of the frame columns. Comparing the damage characteristics of the two buildings during the earthquake, it was found that different structural forms lead to different internal force distributions. This phenomenon is further interpreted through the principle of “deformation saturation”, with core structural components being modeled and tested using quasi-static experiments. The results indicated substantial differences in material properties among different structural forms, including variations in lateral stiffness, ultimate load-bearing capacity, and maximum displacement. Moreover, at the same floor level, components with smaller ultimate displacements are decisive of the overall structural stability. To ensure seismic resilience and stability, it is essential to consider not only the load-bearing capacity but also the rational arrangement and cooperative interactions between different components to achieve a balanced distribution of overall stiffness. This approach significantly enhances the building’s resistance to collapse.

1. Introduction

Human history has experienced numerous earthquakes, such as the 1906 San Francisco earthquake, the 1960 Chile earthquake, the 2008 Wenchuan earthquake, the 2015 Nepal earthquake, and the 2023 Turkey earthquake, among others. One critical issue that must be considered in structural seismic resistance is the significant damage or potential structural collapses caused by earthquakes. Extensive post-earthquake investigations have identified the failure of vertical load-bearing components as a primary cause of building collapses [1,2,3,4]. In China, many rural towns feature self-constructed buildings, with the first floor designated for commercial use and the upper floors for residential purposes. To meet the demands of applicability and economy, these buildings are often modified from traditional masonry structures to a hybrid structure of frame–masonry, where the street-facing side features a framed structure, and the rear side is composed of masonry walls. To leverage the advantages of both frame and masonry structures in buildings, numerous studies have extensively explored both aspects, providing evaluations and suggestions regarding their performance to enhance the building’s seismic resistance.
Regarding the frame component, Paulay and Park introduced the failure mode of the “strong column–weak beam” yielding mechanism [5,6]; however, this mode is rarely observed in many earthquakes [7]. To explore the reasons for this phenomenon, Ye Lieping et al. [8] isolated building models from earthquake-damaged sites and used numerical analysis to identify factors preventing its occurrence. They found that, compared to traditional frame beams, infill walls on beams as well as new composite components formed with beams and slabs provide a component with significant bending stiffness. To repeat the failure mode, the column-to-beam load-bearing capacity ratio should exceed current code limits. Sudarsana et al. [9] established models with various number of floors, providing representative buildings with reasonable parameters for design application. Numerous scholars have explored how to realize the “strong column–weak beam” mechanism. In their Incremental Dynamic Analysis (IDA), Haselton and Liel [10,11] studied the impact of parameters like axial load ratio and P-Δ effects on structural collapse. While quasi-static tests and numerical analyses conveniently provide force–displacement curves and analysis results, the response of real three-dimensional structures to seismic forces still differs from that of planar components, verifying the indispensable value of shake table experiments. Chaker et al. [12] established a model of a frame with infill walls and conducted shake table tests, discovering that the influence of infill walls alters the natural period and stiffness of the concrete frame. To improve the seismic performance of structures, Xu introduced an external substructure and verified its feasibility through numerical analysis [13,14].
The load-bearing walls of the masonry component are constructed from blocks and mortar. Compared to structures formed from homogenous materials, these parts are prone to failure due to inadequate bonding strength between the mortar and blocks and poor compatibility between these materials. Traditional masonry structures are commonly regarded as having high self-weight and stiffness, inflexible architectural layouts, and weak seismic resistance [15,16]. In response to these issues, scholars [17,18,19,20] have conducted field surveys, experimental studies, and numerical analyses for verification. However, some researchers argue that certain masonry structures exhibit good seismic performance, with field investigations from seismic events providing relevant examples. During the Tangshan earthquake, numerous masonry structures suffered severe damage or collapsed, leading to the introduction of structural columns in design codes to enhance the integrity, ductility, and shear resistance of masonry structures [21]. Following two earthquakes in Turkey in 2011, Piroglu et al. [22] examined buildings and found that enclosed masonry structures without seismic measures showed no significant damage. Subsequent studies [23,24] using numerical analysis have further explored these observations. Shake table experiments, an indispensable method, have also been conducted using scaled models of actual structures, demonstrating the effectiveness of seismic retrofitting measures [25].
Evaluation and investigation serve as crucial methods for assessing the performance state of structures, testing seismic resistance techniques, and making recommendations for modifications regarding factors like irregularities in buildings. Bhalkikar and others [26] have developed a new method of rapid visual survey to assess concrete buildings in surveyed areas and compared it with four other methods. Kassem and colleagues [27] used rapid visual screening to analyze 500 buildings in the northern and eastern parts of George Town, Malaysia, estimating their seismic performance based on building height and irregularities. Following an evaluation of earthquake damage in Turkey, Halit, and others, ref. [28] analyzed damaged reinforced concrete structures and offered recommendations for their design and construction. Aykanat and colleagues [29] conducted post-earthquake surveys and evaluations of reinforced concrete and masonry structures in Western Turkey, providing explanations for the observed damage. Işık and others [30], based on the Turkish rapid seismic assessment method, evaluated buildings damaged in the February 6 earthquake in Turkey, determining the impact of building irregularities on performance and response measures post-earthquake, thereby validating the assessment method.
While extensive research by numerous scholars has led to updates in seismic standards, buildings still frequently collapse during earthquakes. For instance, during the 2010 Yushu earthquake, commercial buildings along the streets in the old town showed plastic hinges at the ends of the frame columns, diagonal cracks penetrating the walls, and buildings collapsing forward [31]. In the 2013 Lushan earthquake, a residential building in Shuangshi Town of Lushan County showed no obvious damage on the street-facing side but severe intersecting cracks and partial wall collapses on the back and side walls [32]. During the 2017 Jiuzhaigou earthquake, the visitor center in Jiuzhaigou suffered light damage to the interior frame columns, while the external window-interposed walls exhibited intersecting diagonal cracks [33]. Remarkably, masonry structures, traditionally considered weak in seismic resistance, have remained intact in some extreme earthquake zones, such as the teacher’s residences at Xuan Kou Middle School [34] and the Qinxue Building at Bailu Middle School [35]. This indicates that the current understanding of structural collapse mechanisms is incomplete. Research tends to separate frame and masonry components rather than studying the overall collapse mechanisms of hybrid frame–masonry structures. Existing theories do not fully explain the mechanisms of building collapse. The concept of “deformation saturation” [36] offers a new perspective that more reasonably explains seismic damage phenomena. For example, if there are multiple fully bricked walls in the y-direction and openings along the x-axis, where the stiffness in the x-direction is less than that in the y-direction, the structure will primarily undergo y-direction displacement in the x-direction. Differences in the constitution of non-structural elements or structural configurations mean that vertical load-bearing components differ significantly in properties. If components with significant constitutive differences exist on the same floor, they will undergo the same displacement under the action of the floor slab during an earthquake. The seismic shear force will then be distributed according to the y-direction stiffness of the components along each axis. Due to differences in component properties, some components may reach their ultimate deformation point first, leading to failure and, under gravitational forces, potentially causing building collapse.
To address the significant differences in seismic damage manifestations between two types of buildings at the earthquake site, two sets of buildings of a similar size and proximity to the epicenter, but with vastly different performance, were selected as case studies. Using the numerical analysis software Perform-3D (https://www.csiamerica.com/products/perform3d, accessed on 10 August 2024), models of the actual buildings were created to observe their motion patterns, deformations, and damage states under seismic activity, clearly revealing the stress and deformation states of the two types of buildings affected by the earthquake. Based on the characteristic components of the case study buildings, models of frame columns and walls were constructed, and quasi-static tests were conducted on both sets of models to verify the accuracy of the numerical analysis. By combining the “deformation saturation” theory and experimental data, a rational explanation was provided for the differing performances of various buildings. This research not only offers explanations for building collapses but also provides valuable references for the overall anti-collapse design of buildings.

2. Seismic Damage Investigation

On 5 September 2022, a magnitude 6.8 earthquake struck Luding County in Ganzi Tibetan Autonomous Prefecture, Sichuan Province, primarily affecting Detuo, Moxi, and the surrounding areas, with the epicenter located near the Hailuogou Scenic Area. According to the “Code for Seismic Design of Buildings” GB 50011-2010 (2016 revision) [21], the seismic fortification intensity for Luding County in Ganzi Tibetan Autonomous Prefecture is designated as 8 degrees, with a basic design seismic acceleration of 0.2 g, classified under the second group for earthquake design. Based on field investigations, it is known that the village or town in question primarily consists of multi-story buildings. The main types of building structures found there include hybrid frame–masonry structures, masonry structures, and a small number of earthen structures, as well as frame–shear wall structures and shear wall structures. The earthquake occurred near a tourist area, where the housing structures are predominantly hybrid structures of frame–masonry. Damage was concentrated at the lower levels, particularly severe longitudinally due to the structural form and masonry materials used. The load-bearing walls at the base of the masonry structures were notably compromised. However, some masonry structures at the earthquake site showed no significant damage. To analyze the seismic damage phenomena, two buildings were selected that had similar volumes but exhibited significantly different states of damage and representativeness. One building was a hybrid structure of frame–masonry, and the other was a masonry structure. This analysis aimed to understand the variance in performance between different structural forms in the same seismic event. The two typical buildings are Tianyi Hotel, which represents hybrid frame–masonry structures, and Beitou Village Central Elementary School Dormitory (hereafter referred to as the elementary school dormitory), which represents masonry structures. The positions of the two relative to the earthquake epicenter are marked in Figure 1.

2.1. Tianyi Hotel

Tianyi Hotel, as depicted in Figure 2a,b, is a five-story frame–masonry hybrid structure. The ground floor of the building is used for commercial purposes, while the upper floors serve as the hotel. According to the base shear method, the ground floor is subjected to the highest seismic forces, making it the most susceptible to severe damage—a conclusion confirmed by field investigations. Therefore, the analysis focuses solely on the ground floor. To clearly describe the state of damage, the ground floor was divided into a grid for analysis, and a schematic floor plan was drawn. In this context, the x-direction is designated as the longitudinal direction, the y-direction is the transverse direction, and the vertical direction is the z-direction, as shown in Figure 2c. To accommodate its functional needs, the ground floor requires a large area. Thus, axis Ⓐ is designated for the frame columns, where the column sections are 400 mm × 400 mm, axis Ⓑ is designated for a combination of frame and structural columns, and axis Ⓒ is designated for open window masonry wall axes, where the wall thicknesses are 240 mm. Axes ①, ②, ③, and ⑤ have fully masonry transverse walls, and the building height is 3600 mm. As shown in Figure 3a,b, columns along axis Ⓐ show signs of tilting, with concrete spalling at both ends, and the surface decorative layer peeling off, indicating the formation of plastic hinges to some extent. The damage to the concrete columns along axis Ⓑ is similar to that on axis Ⓐ, but it is less severe. The damage on both axes is concentrated at the column ends, with no apparent damage at the intersecting beam ends, hence not forming a “strong column–weak beam” pattern. The main damage along axis Ⓒ is concentrated in the walls between the windows, where diagonal shear cracks appear, forming wedge-shaped blocks. Some of these blocks are dislodged, and the rebar in the structural columns is buckled, indicating a height reduction along this axis. This axis shows a tendency for the building to lean backward, as depicted in Figure 3c. Comparing the y-direction and x-direction damage, the y-direction damage and cracking are less severe, suggesting smaller y-direction displacement and a predominance of x-direction movement.

2.2. Beitou Village Central Elementary School Dormitory

Figure 4a,b show the elementary school dormitory, a four-story building with its floor plan displayed in Figure 4c. The thickness of the building wall is 240 mm, and the height is 3600 mm. Based on the base shear method, the ground floor is subjected to the greatest earthquake shear forces, and since the layout of each floor is similar, only the ground floor is analyzed. Field surveys indicate that the building has an interior corridor-style masonry structure with well-integrated ring beams and structural columns, providing good overall integrity. Figure 4 and Figure 5 illustrate that, to meet functional needs, axes Ⓐ and Ⓓ require openings for doors and windows, which are similar in position and size. This design leads to walls between windows with small shear spans, prone to shear damage [37], although no such damage is observed in this building. The internal axes Ⓑ and Ⓒ, which have large doorways and staircases, show no apparent damage to the wall surface’s decorative layer. Despite having several fully masonry transverse walls, there is no noticeable damage; compared to the x-direction, the y-direction has greater lateral stiffness, making it less prone to y-direction displacement. Thus, the building is more likely to move along the x-direction.

3. Structural Elastoplastic Dynamic Time–History Analysis

3.1. Modeling Method and Model Validation

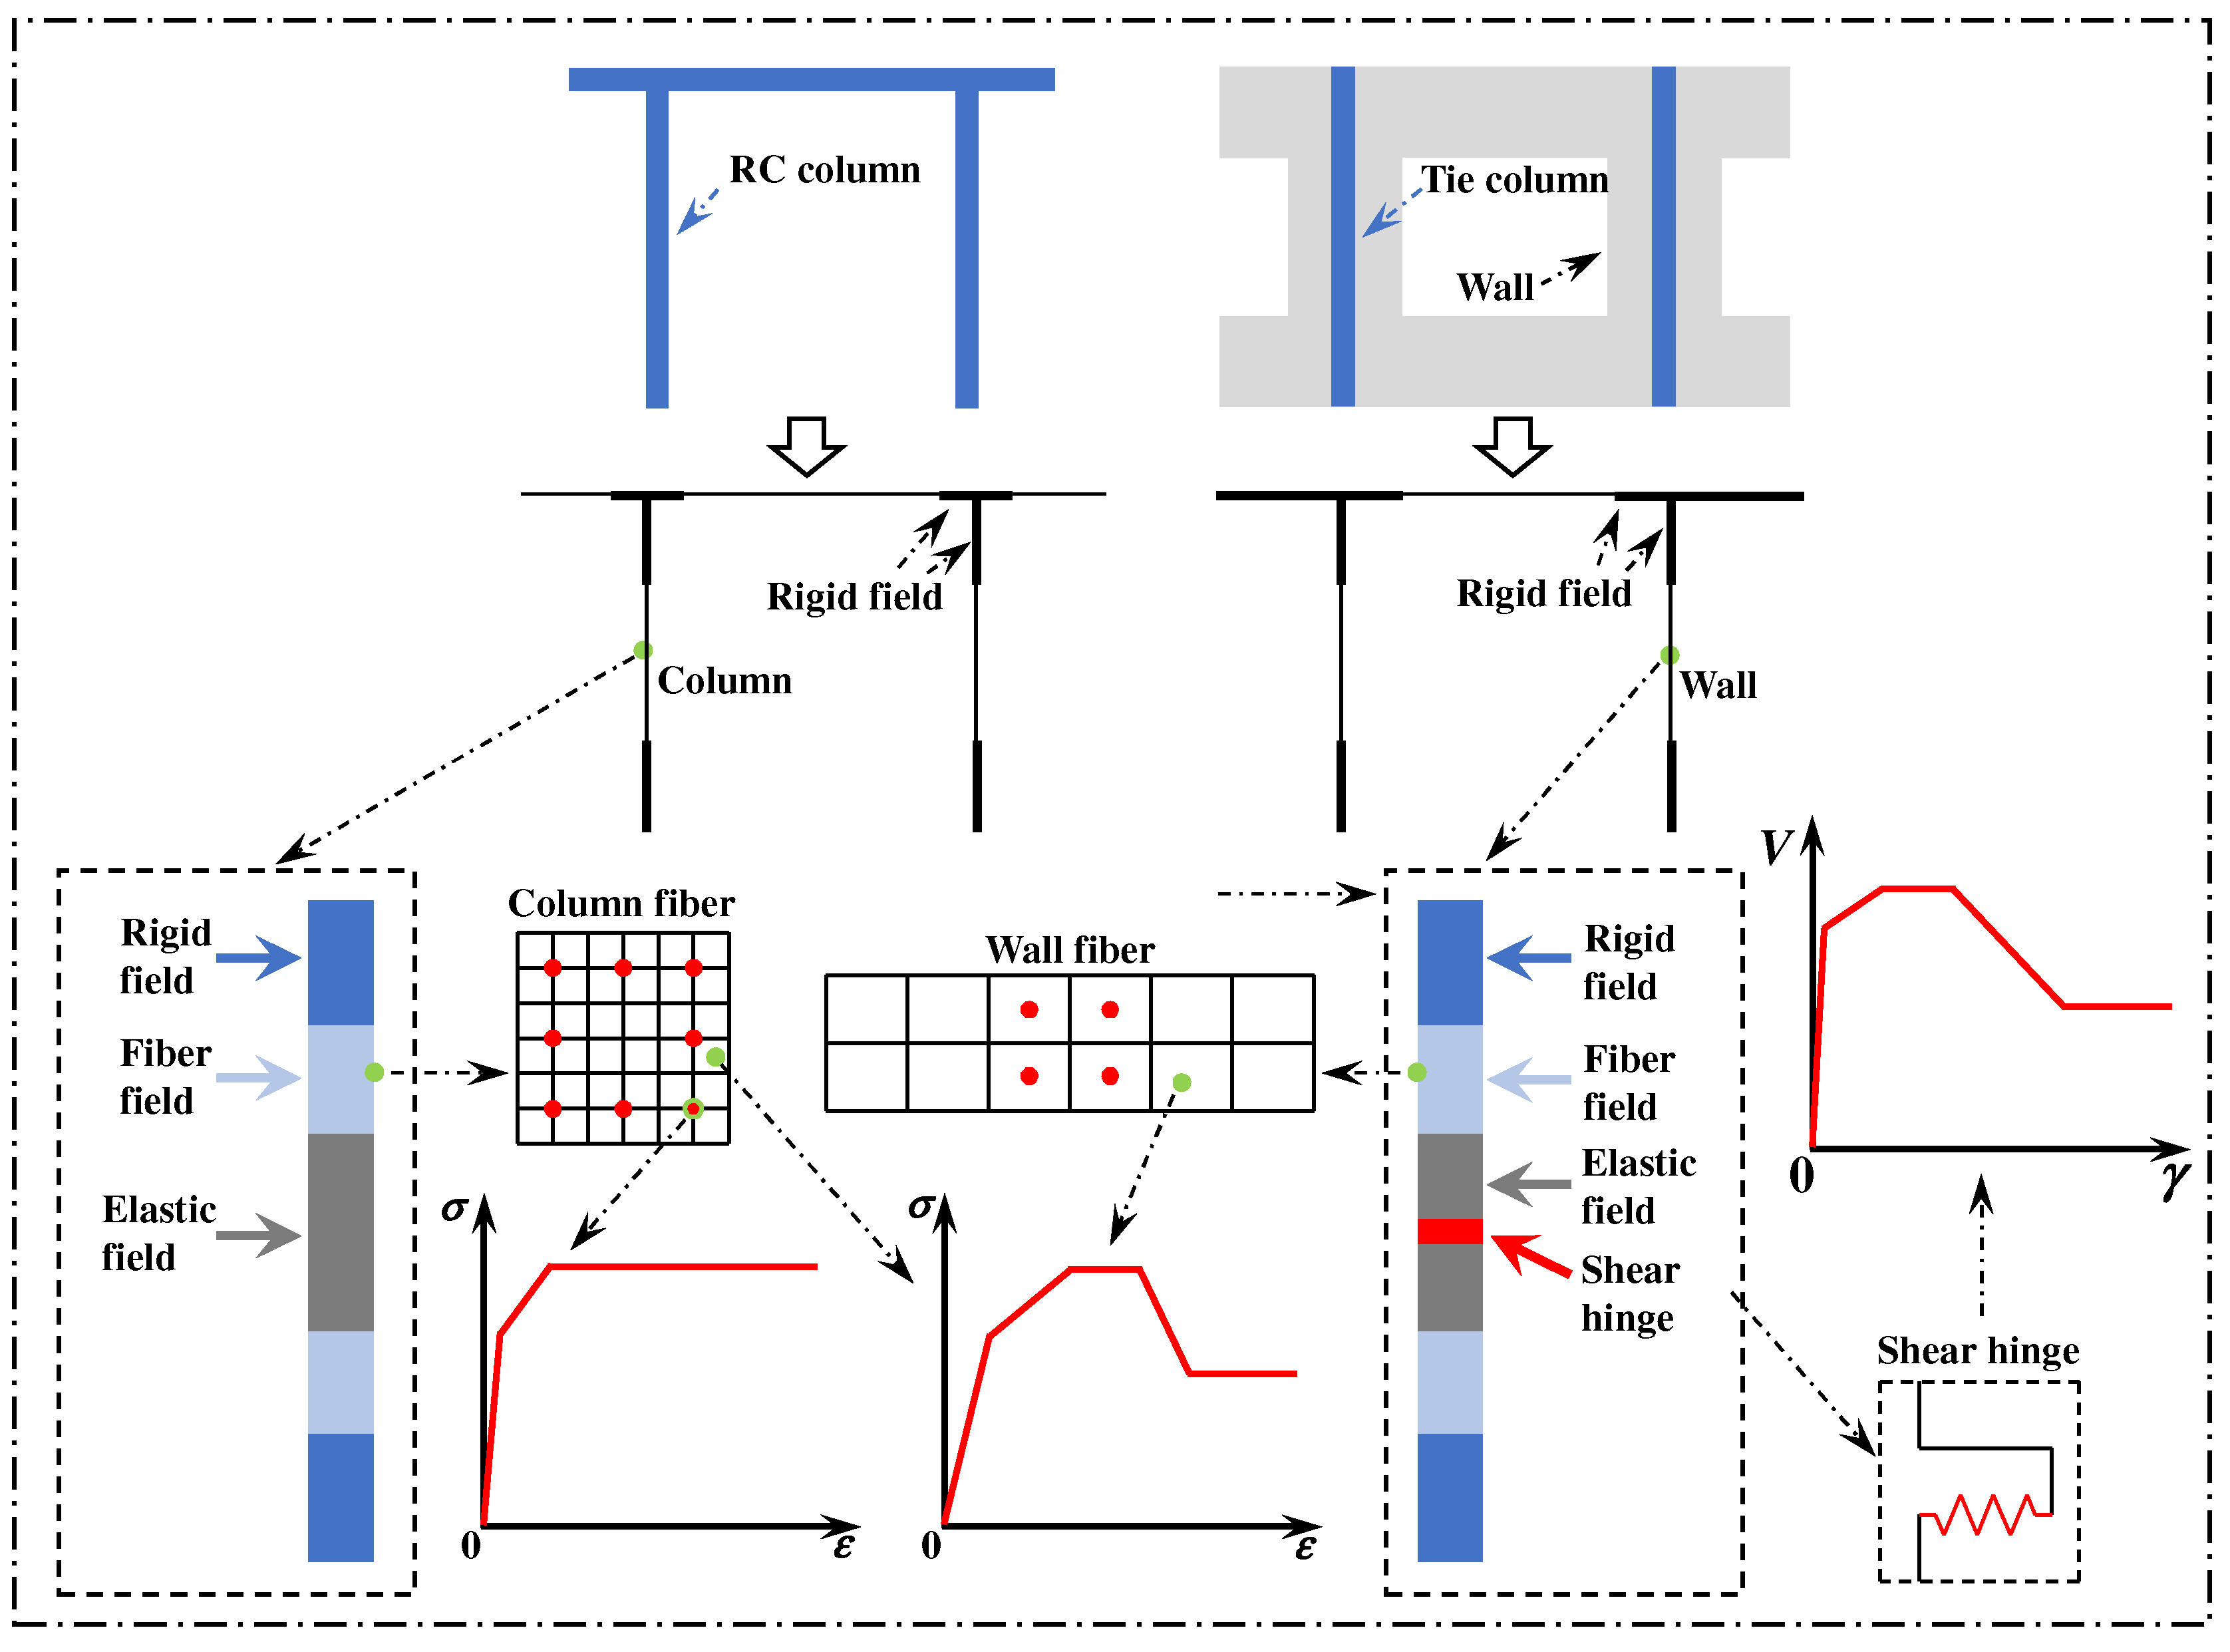
In order to obtain a macroscopic model of the study building, the corresponding numerical model was established using the numerical analysis software Perform-3D. Based on the seismic damage investigation and related tests, it was found that the bending failure of the frame column mainly occurred. The damage was mainly concentrated in the upper and lower end of the columns, and relatively serious plastic hinges had already appeared at the column ends. For the structural components of beams and columns in buildings, conventional fiber elements are sufficient for simulation. These are divided along their length into five sections: rigid zones, fiber zones, elastic zone, fiber zones, and rigid zones, and the length of the fiber zone is set as half of the long axis of the cross-section. The fiber zone cross-section consists of various steel and concrete fibers. The three-line model with certain strengthening effects is selected for the reinforcement constitutive structure [38], while the five-line model is selected for the concrete constitutive structure [39]. For masonry walls, combined observation of the earthquake damage site and test phenomenon shows that the failure mode is shear failure. In order to simulate the failure phenomenon relatively accurately, plastic shear hinge [40,41,42] is introduced into the simulation method. The shear hinge exhibits a relatively large stiffness in the initial stage and remains in an elastic state. Once the deformation reaches a certain magnitude, the load-bearing capacity of the shear hinge starts to deteriorate, and its stiffness declines. When the received shear force attains its maximum value, it signifies that the shear hinge has been severely damaged. Subsequently, the bearing capacity of the shear hinge continuously decreases. Eventually, the bearing capacity of the shear hinge becomes identical to the frictional force. For x-direction walls with openings, the stiffness of upper and lower window walls is higher than that of the walls between windows, and the upper and lower walls are set as the rigid zone. The wall between the windows is simulated by a fiber zone, elastic zone, and shear hinge. For the transverse wall, the simulation mode is the same as that for the x-direction wall, in which the masonry constitutive model is selected as a five-line model, and the required parameters of the constitutive model are adopted as suggested by Shabani [43]. Model simplification, element division, and constitutive relationships are shown in Figure 6.
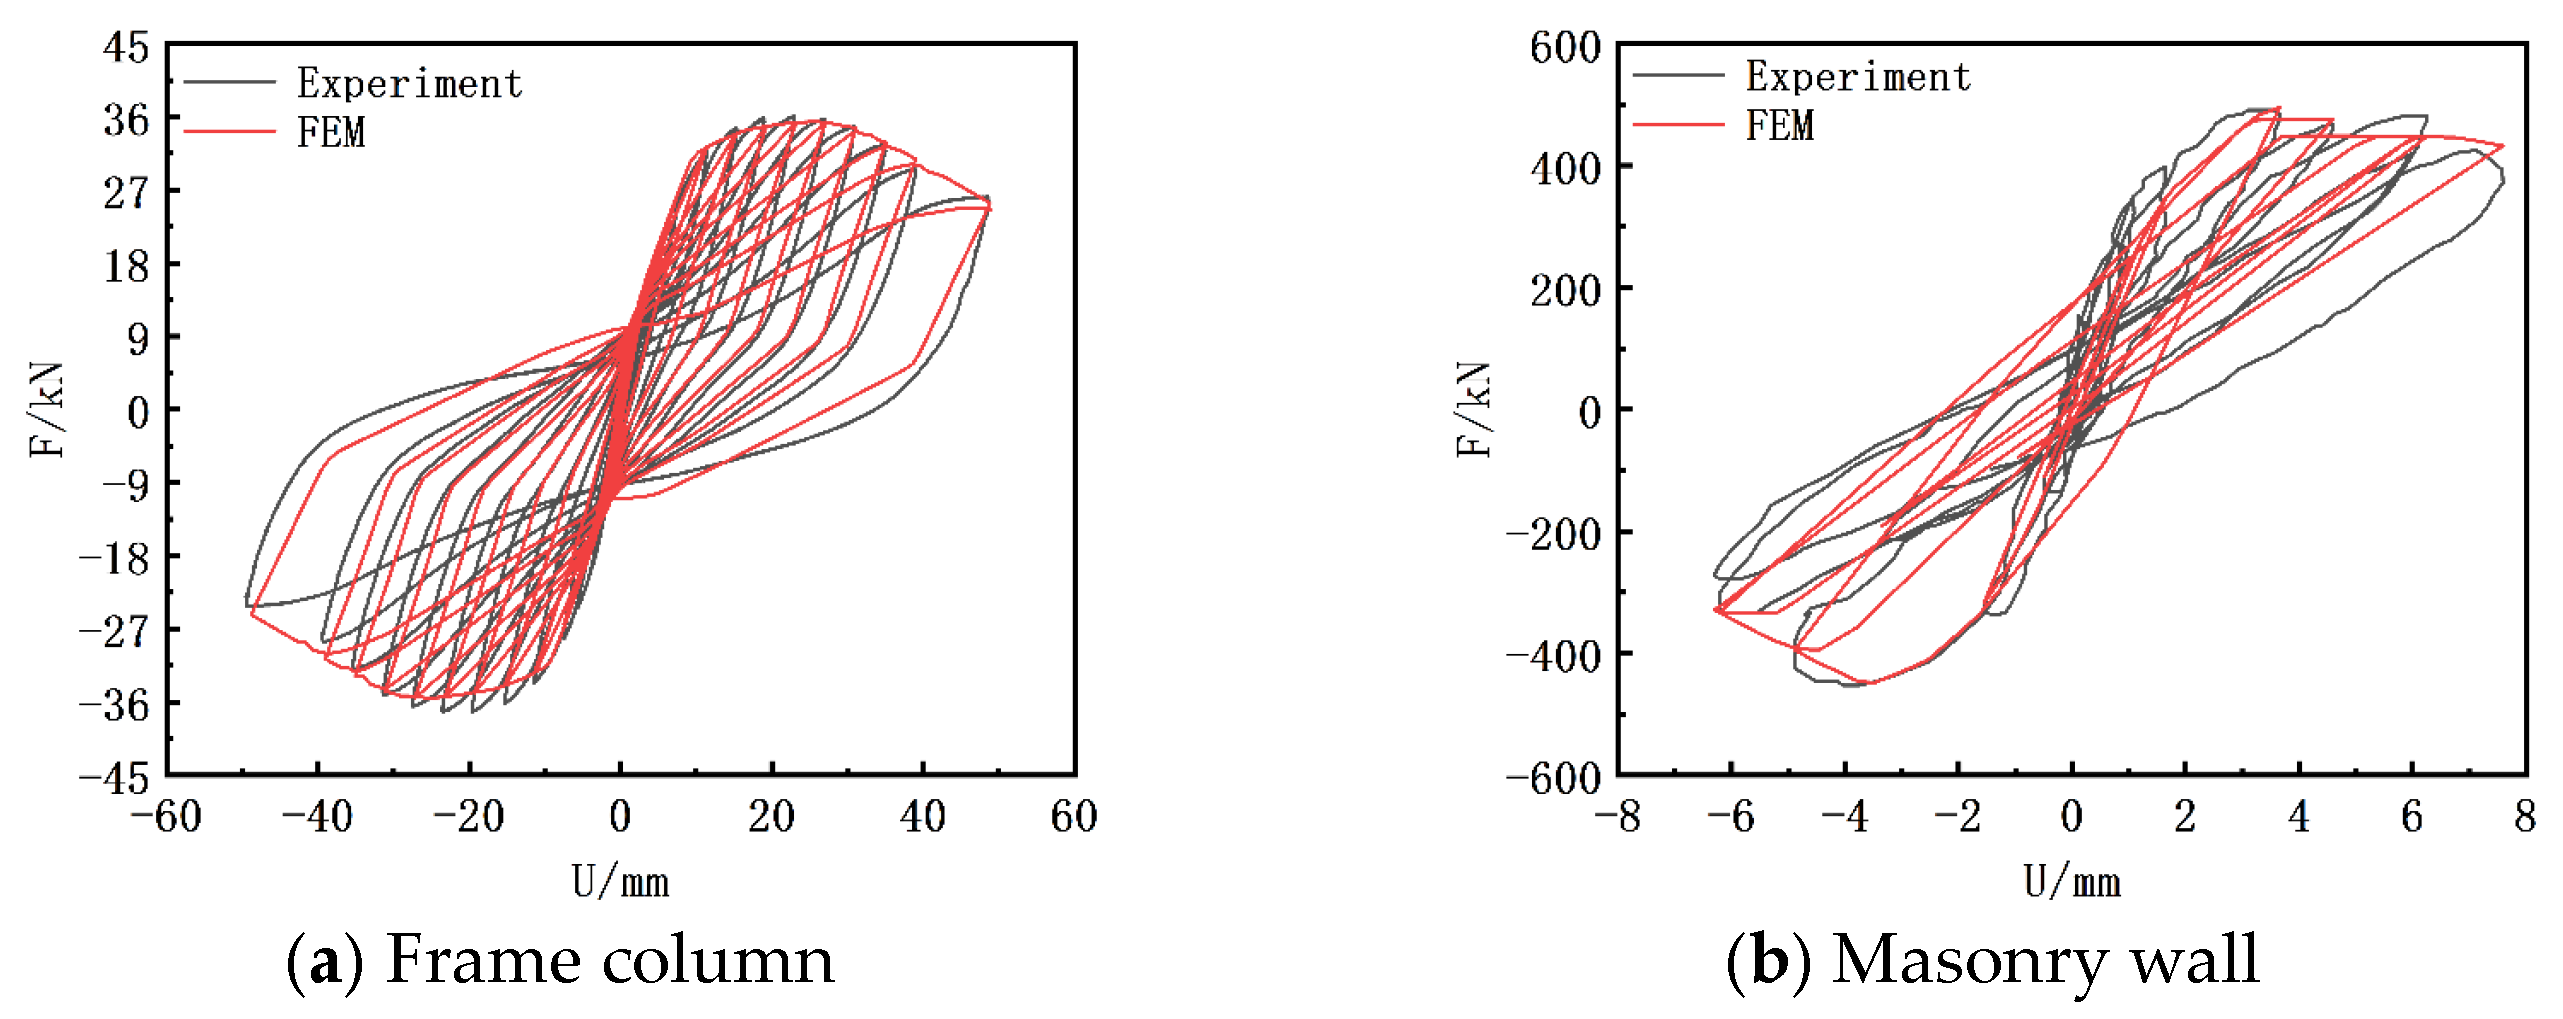
To verify the accuracy of the subsequent analysis model, experimental models from the relevant literature were selected as references. Using the aforementioned modeling techniques and finite element software, these experimental models were reconstructed. The F2 model in reference [44] is selected as the verification model for the frame part. The M1-1 model in reference [45] is selected as the verification model for the masonry load-bearing wall. As shown in Figure 7, the comparison between the experimental data and finite element analysis results shows good agreement, validating that this modeling approach is suitable for further analysis.

3.2. Model Establishment and Seismic Input

Based on the available data for Tianyi Hotel and the elementary school dormitory, numerical analysis models were established. The material data for the buildings were sourced from the referenced standards [21]. As the building materials cannot be accurately obtained, the concrete grade used for the beams and columns of the two buildings is now unified and specified as C30, and HRB400 steel reinforcement is specified for the rebars. The walls are constructed from clay bricks and corresponding mortar, with a thickness of 240 mm. Considering the walls, decorative layers, equipment, etc., the building load is calculated to be 1 t/m2 [46]. This load is then distributed to each node based on the proportion of the dependent area. The calculation model is shown in Figure 8.
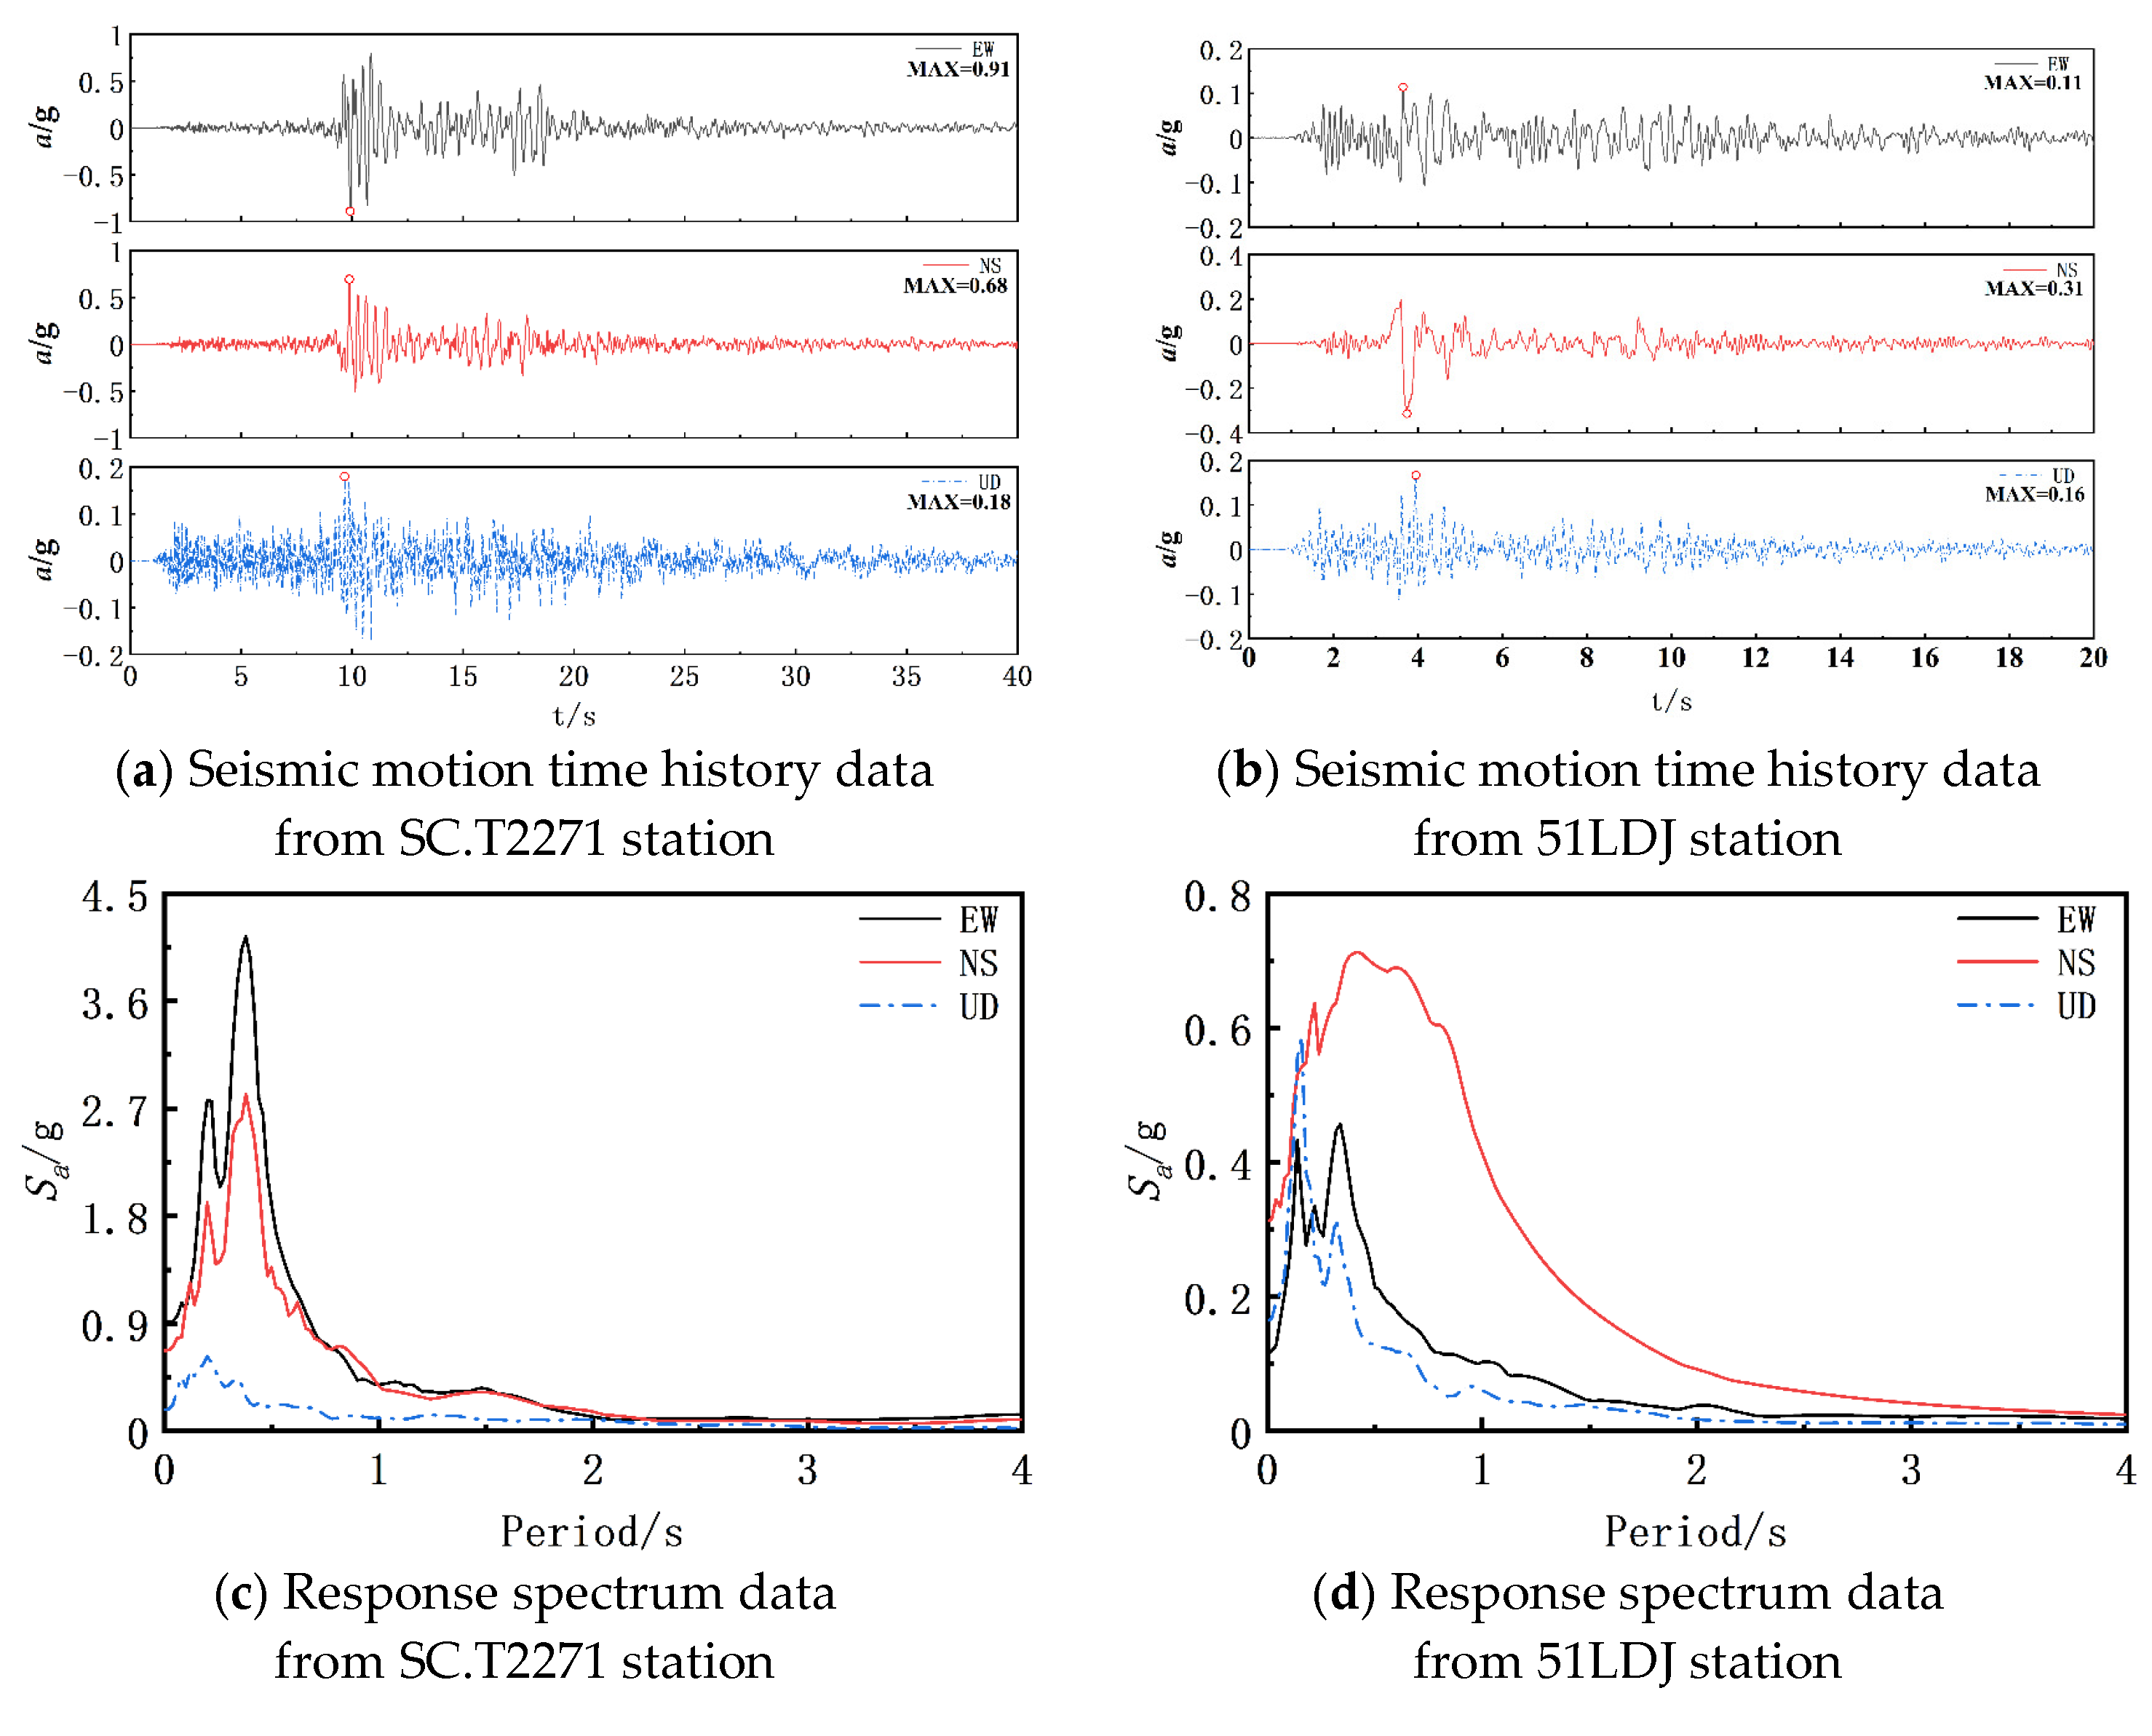
To explore the reasons for the significant differences in performance between the two buildings, seismic data from typical stations within Luding County, specifically SC.T2271 and 51LDJ, were used for the elastoplastic time–history analysis. The data were amplitude-modulated, adjusting the Peak Ground Acceleration (PGA) to 0.1 g, 0.5 g, and 1.0 g, to simulate conditions of minor earthquakes, major earthquakes, and extreme seismic events, respectively, where the buildings are located. Due to the presence of significant amounts of invalid data in the recorded station data, which would increase computational costs and reduce efficiency, the data were truncated. This truncation considered a response spectrum tolerance value of ≤0.01 before and after the truncation. The processed station data are illustrated in Figure 9 and Table 1.

3.3. Structural Characteristics

The modal data for the Tianyi Hotel and the elementary school dormitory models are presented in Table 2. For both models, the first mode of vibration occurs along the x-axis (longitudinal direction), the second mode occurs along the y-axis (transverse direction), and the third mode involves torsion along the z-axis (vertical direction). This indicates that the x-direction has less lateral stiffness than the y-direction. As suggested by Figure 2, Figure 3, Figure 4 and Figure 5, this could be due to the presence of numerous door and window openings along the x-direction axes, which reduce the lateral stiffness in that direction. In contrast, the y-direction features multiple unopened fully masonry walls, contributing to greater stiffness in the y-direction and torsional directions compared to the x-direction.

3.4. Model Plastic State

As discussed in Section 1, the damage to the buildings is primarily concentrated on the ground floor; a pattern also evident in the numerical analysis models. To clearly display the model’s damage state, only the ground floor is shown. To examine the damage state and sequence of the components along each axis, this paper defines masonry wall shear strain and steel yielding as the performance points for walls and concrete beams/columns, respectively. Using a model subjected to a PGA = 0.5 g earthquake as an example, the plastic state of the two models is extracted at the moment when a specific axis reaches its maximum performance point. As shown in Figure 10, in Tianyi Hotel, the model’s x-axis lines all exhibit varying degrees of damage. For the y-direction load-bearing components, only component B5 reaches 80% of the wall’s performance point shear strain, while the other y-direction components largely remain in the elastic stage. In the elementary school dormitory, only some vertical load-bearing components along axes Ⓐ and Ⓓ reach 40% of their performance points, with no significant damage observed in the other components, indicating that the main displacement direction of both numerical models is in the x-direction. Under this displacement direction, different degrees of damage occur along each axis. In Tianyi Hotel, axes Ⓐ and Ⓑ suffer lighter damage, ranging from 40% to 80%. Components A1 and A5 exhibit the most severe damage in these two axes, with steel strain exceeding 80% of their yield strain. Components B2 and B4 experience the least damage, with steel strain only reaching 40% of the yield strain. Components A2, A3, A4, and B1 have moderate damage, with strains also exceeding 60% of the yield strain. Compared to axes Ⓐ and Ⓑ, axis Ⓒ suffers more severe damage; all vertical load-bearing components on axis Ⓒ reach 100%. It can be deduced that when all components on axis Ⓒ reach their performance points, the steel in the other two axes has not yet yielded. Driven by data from the two stations, the building’s axis Ⓒ first reaches its performance point and subsequently fails, while axes Ⓐ and Ⓑ still possess a high seismic reserve. This numerical result, closely resembling the actual earthquake damage, further verifies the overall accuracy of the numerical model.
Compared to traditional masonry components, axes Ⓐ and Ⓑ consist of concrete columns, which have better ductility. Although the maximum damage on these axes reaches 80%, the x-direction rebar inside the columns did not yield, and no plastic hinges formed at the ends, suggesting that these column components were still essentially in the elastic stage. In contrast, axis Ⓒ, composed of masonry walls and structural columns, was prone to shear failure, which could lead to structural collapse. For the elementary school dormitory, the building’s vertical load-bearing components consist of bearing walls with varying openness ratios. These components should theoretically undergo the same damage pattern as the Ⓒ axis of Tianyi Hotel. However, the numerical analysis results show that the damage only reaches 40% of the performance point, which is insufficient to cause severe damage or building collapse. This model result is consistent with the actual building performance, thus validating the rationality of the three-dimensional model.

3.5. Displacement Response

As stated in Section 1, the damage to both buildings is primarily concentrated on the ground floor. The analysis now focuses on selected nodes where damage is significant. For Tianyi Hotel, the intersection of axes Ⓐ and ① (designated as N1, marked with a yellow circle) and axes Ⓒ and ① (designated as N2, marked with a blue circle) are selected. For the elementary school dormitory, the intersection of axes Ⓐ and ① (also designated as N1, marked with a yellow circle) and axes Ⓓ and ① (designated as N2, marked with a blue circle) are chosen as points of interest (as shown in Figure 8). Using data from station SC.T2271 with PGA = 0.1 g as an example, the displacement responses of the two models are plotted. As shown in Figure 11a, the maximum x-direction displacements for Tianyi Hotel at nodes N1 and N2 are 2.87 mm and 2.13 mm, respectively, while the maximum y-direction displacements for both nodes are 0.55 mm. Based on the displacement waveforms and values, it is observed that the displacements in both directions are well synchronized, with no apparent phase difference. The displacement ratios between N1 and N2 in the x-direction and y-direction are 1.0:1.0:3.9:5.2, indicating some torsional behavior in the building. However, relative to the transverse and torsional movements, the model primarily moves in the x-direction.
As shown in Figure 11b, the elementary school dormitory exhibits good synchronicity between y-direction and y-direction displacements, with no apparent phase difference. The maximum y-direction displacement for N1 and N2 is 0.12 mm, and the maximum x-direction displacement is 0.23 mm, with a displacement ratio of 1.0:1.0:1.9:1.9. It can be observed that there is no significant twisting of the model, and the y-direction displacements are smaller than those in the x-direction. Thus, it is determined that the model primarily moves in the x-direction. The displacement responses for the other working conditions of Tianyi Hotel and the elementary school dormitory are shown in Table 3.

3.6. Base Shear Response

According to the base shear method, the maximum shear forces in a building occur at the ground level. This has been confirmed by both field damage assessments and numerical analyses. Using data from station SC.T2271 with PGA = 0.1 g as an example, the shear forces along each axis at the ground level are plotted in Figure 12. For Tianyi Hotel, the x-direction shear forces across the three axes are well-aligned, without significant phase differences. At 14.87 s, the shear forces reach their maximum values, with the x-direction shear forces for axes Ⓐ, Ⓑ, and Ⓒ being 150 kN, 70 kN, and 1340 kN, respectively. The ratio of these forces is 2.1:1.0:19.1, indicating that the shear forces on axes Ⓐ and Ⓑ are relatively close, while axis Ⓒ experiences the highest shear force: approximately 85.9% of the total shear. For the elementary school dormitory, the peak base shear is observed at 13.91 s, with the x-direction shear forces for axes Ⓐ, Ⓑ, Ⓒ and Ⓓ, being 420 kN, 210 kN, 210 kN, and 390 kN, respectively. The ratio of these forces is 2.1:1.0:1.1:2.0, showing that axes Ⓐ and Ⓓ have the largest shear forces, accounting for about 34.1% and 31.7% of the total shear, respectively. Compared to Tianyi Hotel, the elementary school dormitory withstands a PGA = 1.0 g seismic event more effectively. The shear force distribution across the axes in the dormitory is more uniform, with the maximum shear force percentage only reaching 34.6%, whereas Tianyi Hotel shows a greater disparity in shear force distribution, with the maximum reaching as high as 85.9%. This indicates that in Tianyi Hotel, the earthquake shear forces are highly concentrated on axis Ⓒ, leading to early damage to the vertical load-bearing components on this axis. In contrast, the more even distribution of shear forces in the elementary school dormitory prevents easy damage to its vertical load-bearing components, resulting in different performances under the same seismic conditions. These numerical results, consistent with the damage observations described in Section 1, also validate the rationality of the model establishment. Base shear responses for other working conditions of Tianyi Hotel and the elementary school dormitory are shown in Table 4.

4. “Deformation Saturation” Theory Discussion and Validation

Section 1 of this article introduced the seismic damage survey, stating that the ground level x-direction components of Tianyi Hotel consist of frame columns and perforated load-bearing walls, while the ground level x-direction components of the elementary school dormitory consist solely of perforated load-bearing walls. To intuitively explore the differing performances of these two buildings, the building components are categorized into two types, namely frame columns (defined as PF) and perforated walls (defined as WALL).

4.1. Model Parameters

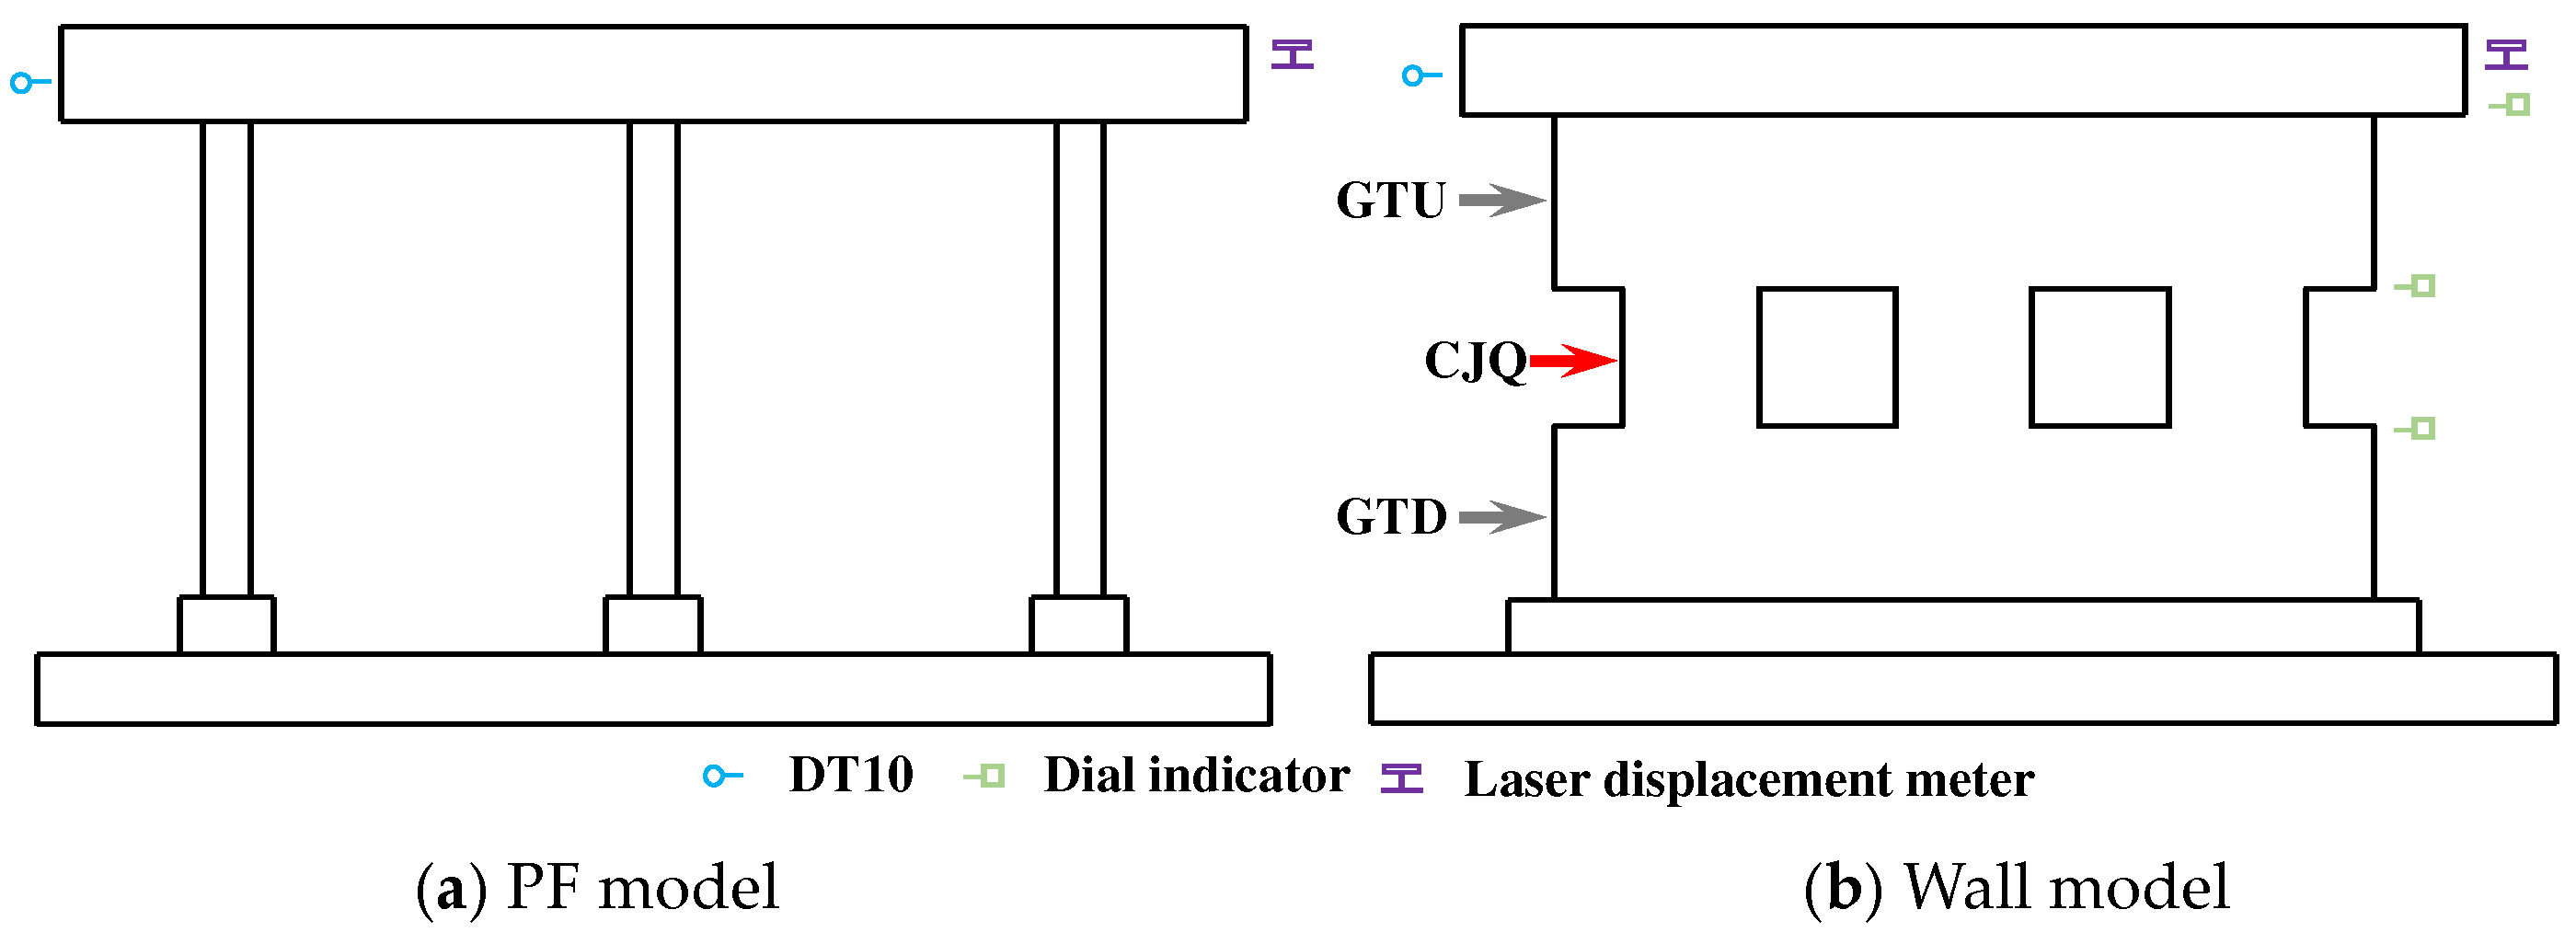
Based on the actual buildings, the models are constructed at a 1:3 scale ratio, as illustrated in Figure 13. The PF model consists of three frame columns and one loading beam, with the columns spaced 900 mm apart. Each column measures 130 × 130 × 1060 mm and contains four 8 mm diameter steel rebars. The rebars are embedded at the bottom into the baseplate and bent and anchored at the top into the loading beam. The concrete cover is 15 mm thick, and the stirrups are made from 2 mm diameter galvanized wire. The model wall is divided into three parts: the wall above the window (GTU), the wall below the window (GTD), and the wall between the windows (CJQ). Both the GTU and GTD have the same dimensions, 1800 × 380 × 80 mm, while the CJQ measures 300 × 300 × 80 mm. To meet the boundary conditions and experimental needs, both models have a loading beam at the top with dimensions of 2590 × 200 × 100 mm, containing two rows of rebars with three 6 mm diameter steel rebars per row. The stirrup setup in the loading beam is consistent with that in the PF model. Both models are cast in two bays simultaneously, allowing for cross-validation and the use of stacked weights to ensure vertical loading while eliminating the lag response of hydraulic jacks. This setup simulates the vertical load-bearing components of the ground floor of a multi-story building, with an axial compression ratio of 0.2 to mimic the stress conditions of actual multi-story structures.

4.2. Material Testing

To meet the axial compression ratio requirements of the experimental models, the concrete strength was appropriately reduced. Through mix-design testing, the concrete mix ratio was determined to be 1:2.6:4.0 (cement/sand/gravel). To obtain concrete material parameters, samples were taken during the casting of the models, and these samples were cured under the same conditions and for the same duration as the models. The testing included compressive strength tests on six cubic specimens with a side length of 150 mm and elasticity modulus assessments on six prismatic specimens measuring 150 mm × 150 mm × 300 mm. To match the concrete strength of the test models, AQ100GJC low-yield point steel was used for the longitudinal reinforcement of the columns, while HRB400-grade steel was used for the longitudinal reinforcement of the beams. Galvanized iron wire with a diameter of 2 mm was used for the stirrups, with additional densification at appropriate positions. Moreover, two layers of steel wire mesh (wire diameter 1 mm, grid size 25 mm × 25 mm) were installed in the model wall to prevent cracking during curing. The properties of the materials required for the experiment are listed in Table 5.
In Table 5, fcu is the compressive strength of the concrete cubes; Ec is the modulus of elasticity of the concrete; fy,c, fu,c, and Es are the yield strength, ultimate strength, and modulus of elasticity of the longitudinal reinforcing bars in the frame columns, respectively; fy,b and fu,b are the yield strength and ultimate strength of the longitudinal reinforcing bars in the loaded beams, respectively; and fy,s and fu,s are the yield strength and ultimate strength of the stirrups used in the model, respectively.

4.3. Experimental Loading and Measurement

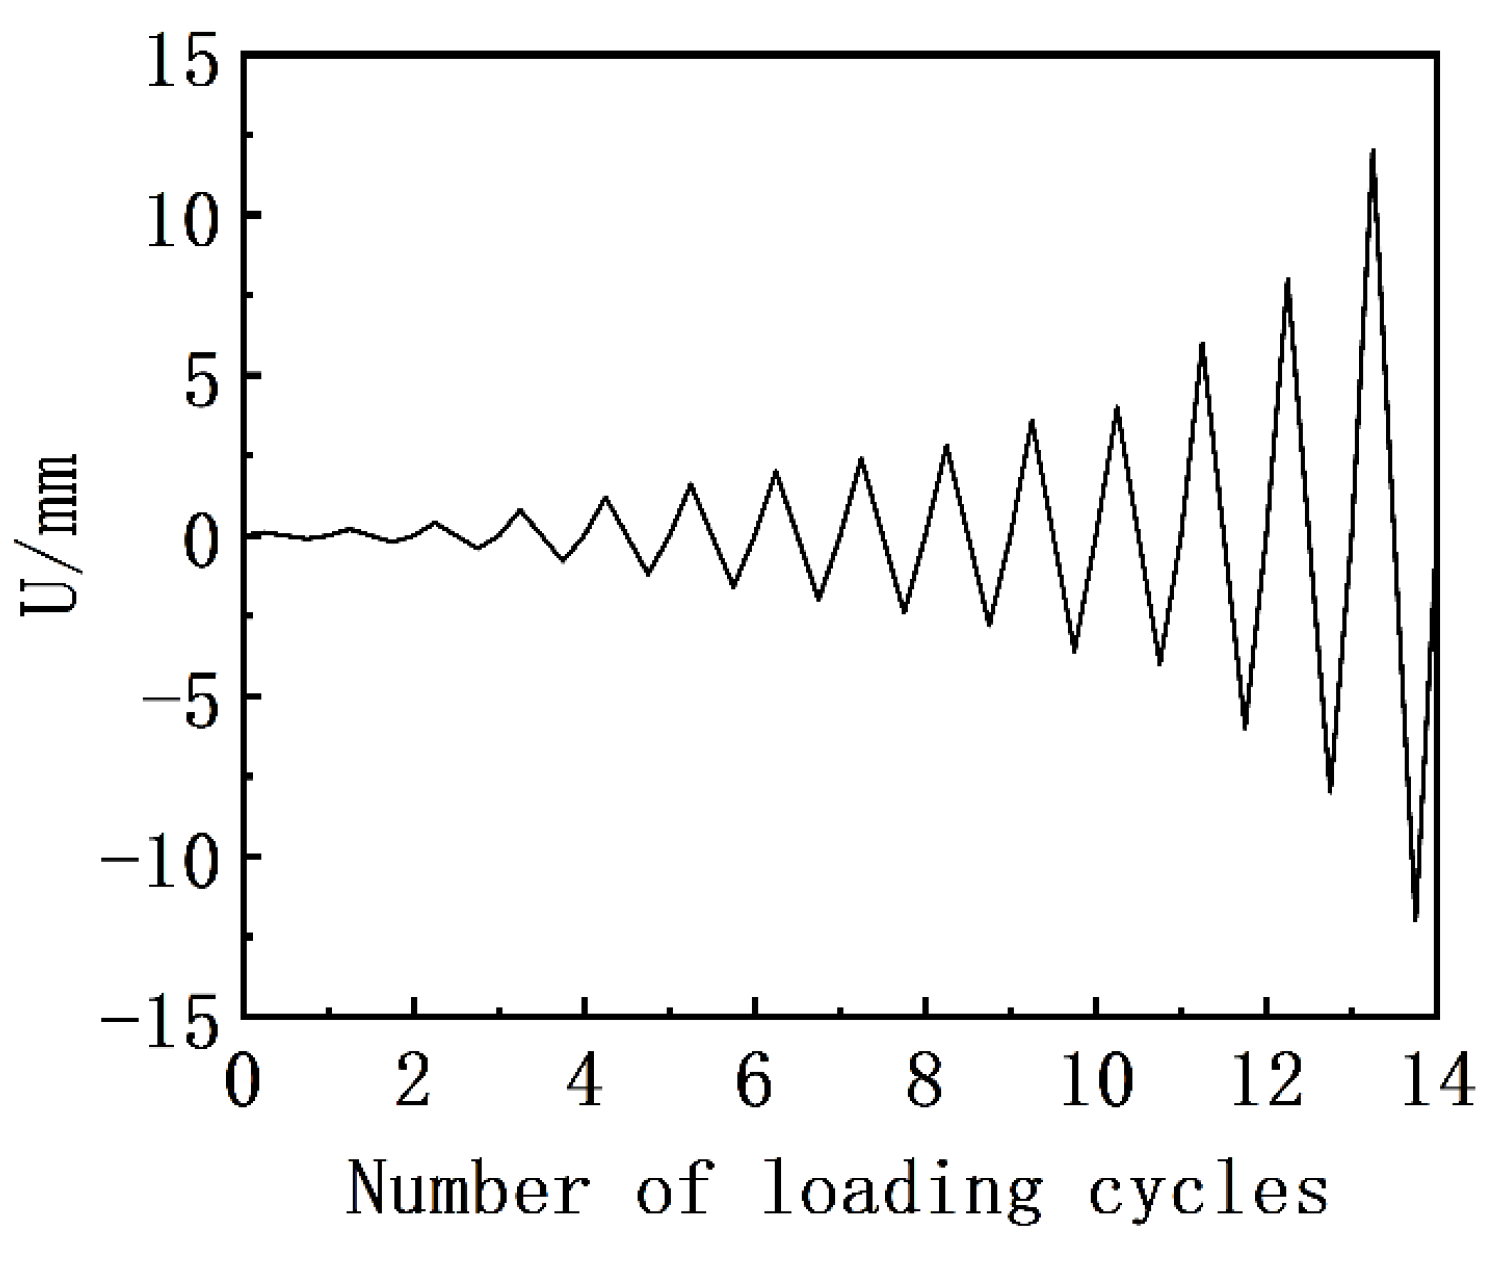
The experiment was conducted at the Key Laboratory for Building Failure Mechanisms and Mitigation under the China Earthquake Administration. The test utilized a displacement-controlled low-cycle reciprocating loading regime, divided into 22 stages: 0.1 mm, 0.2 mm, 0.4 mm, 0.8 mm, 1.2 mm, 1.6 mm, 2.0 mm, 3.0 mm, 4.0 mm, 6.0 mm, 8.0 mm, 12.0 mm, 16.0 mm, 20.0 mm, 24.0 mm, 28.0 mm, 32.0 mm, 36.0 mm, 40.0 mm, 50.0 mm, 60.0 mm, and 70.0 mm. To meet the requirements for loading rate, the loading frequency was appropriately adjusted: 0.1 mm to 2.0 mm at 0.05 Hz, 3.0 mm to 4.0 mm at 0.02 Hz, and 6.0 mm to 70.0 mm at 0.01 Hz. The experiment used an MTS 244.41 hydraulic servo actuator capable of a ±125 mm displacement range and a maximum load output of 500 kN. Two actuators were used for loading to eliminate torsional interference on the model. To eliminate disturbances such as sliding between the model and the loading plate, sliding of the model base, and deformation of the reaction frame, accurate measurement of the model’s actual deformation was ensured. Two sets of high-precision DT10 electronic displacement meters and two sets of LK-G500 laser displacement meters were installed at both ends of the loading beam. In addition, a set of micrometers was placed at the top of each of the three parts of the model wall to capture deformation in each section. The model loading regime and displacement measurement setup are illustrated in Figure 14 and Figure 15.

4.4. Damage Modes

4.4.1. PF Model

At a loading condition of 6.0 mm, horizontal cracks appeared at the top and bottom ends of the PF model (frame column), and as the loading conditions intensified, these cracks gradually extended. By the time the load reached 20.0 mm, the cracks had connected to form ring-shaped cracks; a phenomenon also observed at the base of the columns. The presence of ring-shaped cracks at both ends of the columns indicated the formation of plastic hinges. Between the conditions of 24.0 mm and 36.0 mm, the damage at the plastic hinges of the column ends progressively worsened. At a loading of 40.0 mm, the protective concrete layer at the column ends began to spall, and as the displacement increased, this spalling became more severe, with the internal reinforcement bars becoming exposed. At a displacement of 70.0 mm, the core concrete within the column peeled off significantly. Under the influence of gravity, the stirrups snapped, and the longitudinal rebars bulged outward in a lantern shape. The load had decreased by more than 85% of the maximum bearing capacity, prompting the cessation of the experiment. Throughout the experimental procedure, the PF model exhibited a typical bending failure. The final failure mode of the PF model is illustrated in Figure 16.

4.4.2. Wall Model

At lower loading conditions, the model deformation was minimal, and the model remained in the elastic phase. At a loading of 3.0 mm, due to stress concentration, cracks first appeared at the corners of the walls between the windows. From 4.0 mm to 6.0 mm, some of these cracks extended and penetrated through, effectively segmenting the model into several parts. At 8.0 mm, diagonal shear cracks appeared in the sections of wall between the windows, and these cracks extended rapidly. Within this loading condition, the diagonal cracks had completely penetrated the entire wall section, resulting in significant shear damage. The test was unable to proceed beyond 12.0 mm as the model collapsed; the loading beam and the protective devices came into close contact, necessitating the termination of the experiment. It was observed that the damage was primarily concentrated in the wall sections between the windows, with the cracks causing these parts of the wall to form wedge-shaped bodies. In comparison to the PF model, the wall model exhibited brittle shear failure, with more severe damage and no significant displacement observed during the loading process. Figure 17 displays the final state of damage in the wall model.
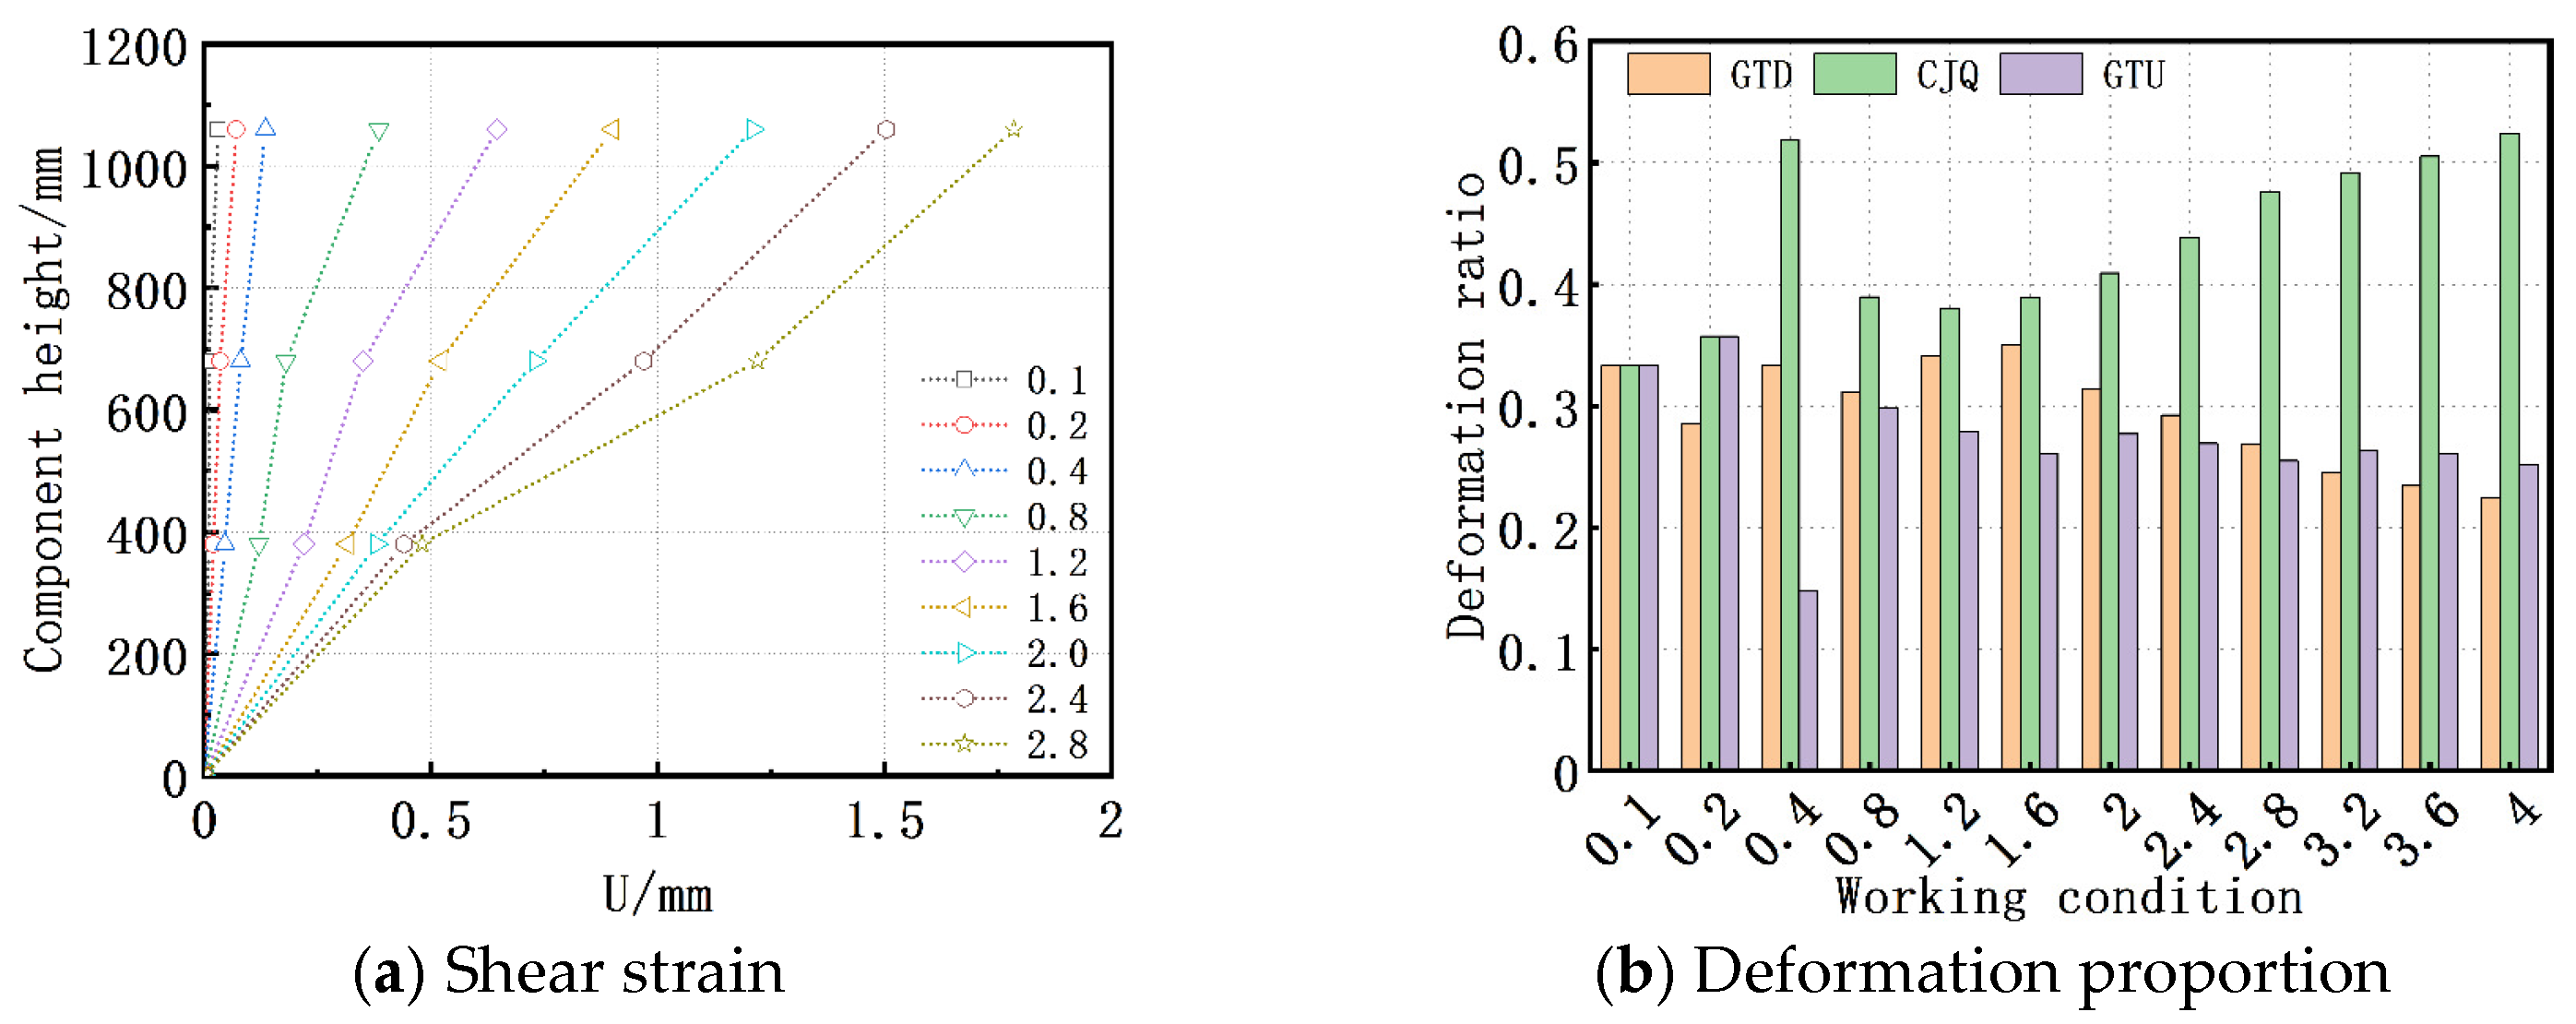
Based on the experimental observations, the three sections of the wall model primarily experienced shear deformation. The deformations of each section are depicted in Figure 18. At lower loading levels, the lateral shifts in all three sections were minor, with the CJQ (the wall between the windows) section experiencing the largest deformation, although the differences among the three sections were relatively small. As the displacement increased, the deformation of each section also increased, with the CJQ section showing the greatest deformation, accounting for 40–50% of the total deformation. The disparity between the CJQ section and the other two sections gradually widened, indicating that deformation in the wall model was concentrated in the CJQ section, which determined the model’s limit of deformation.

4.5. Force–Displacement Relationship

4.5.1. Hysteresis Curve

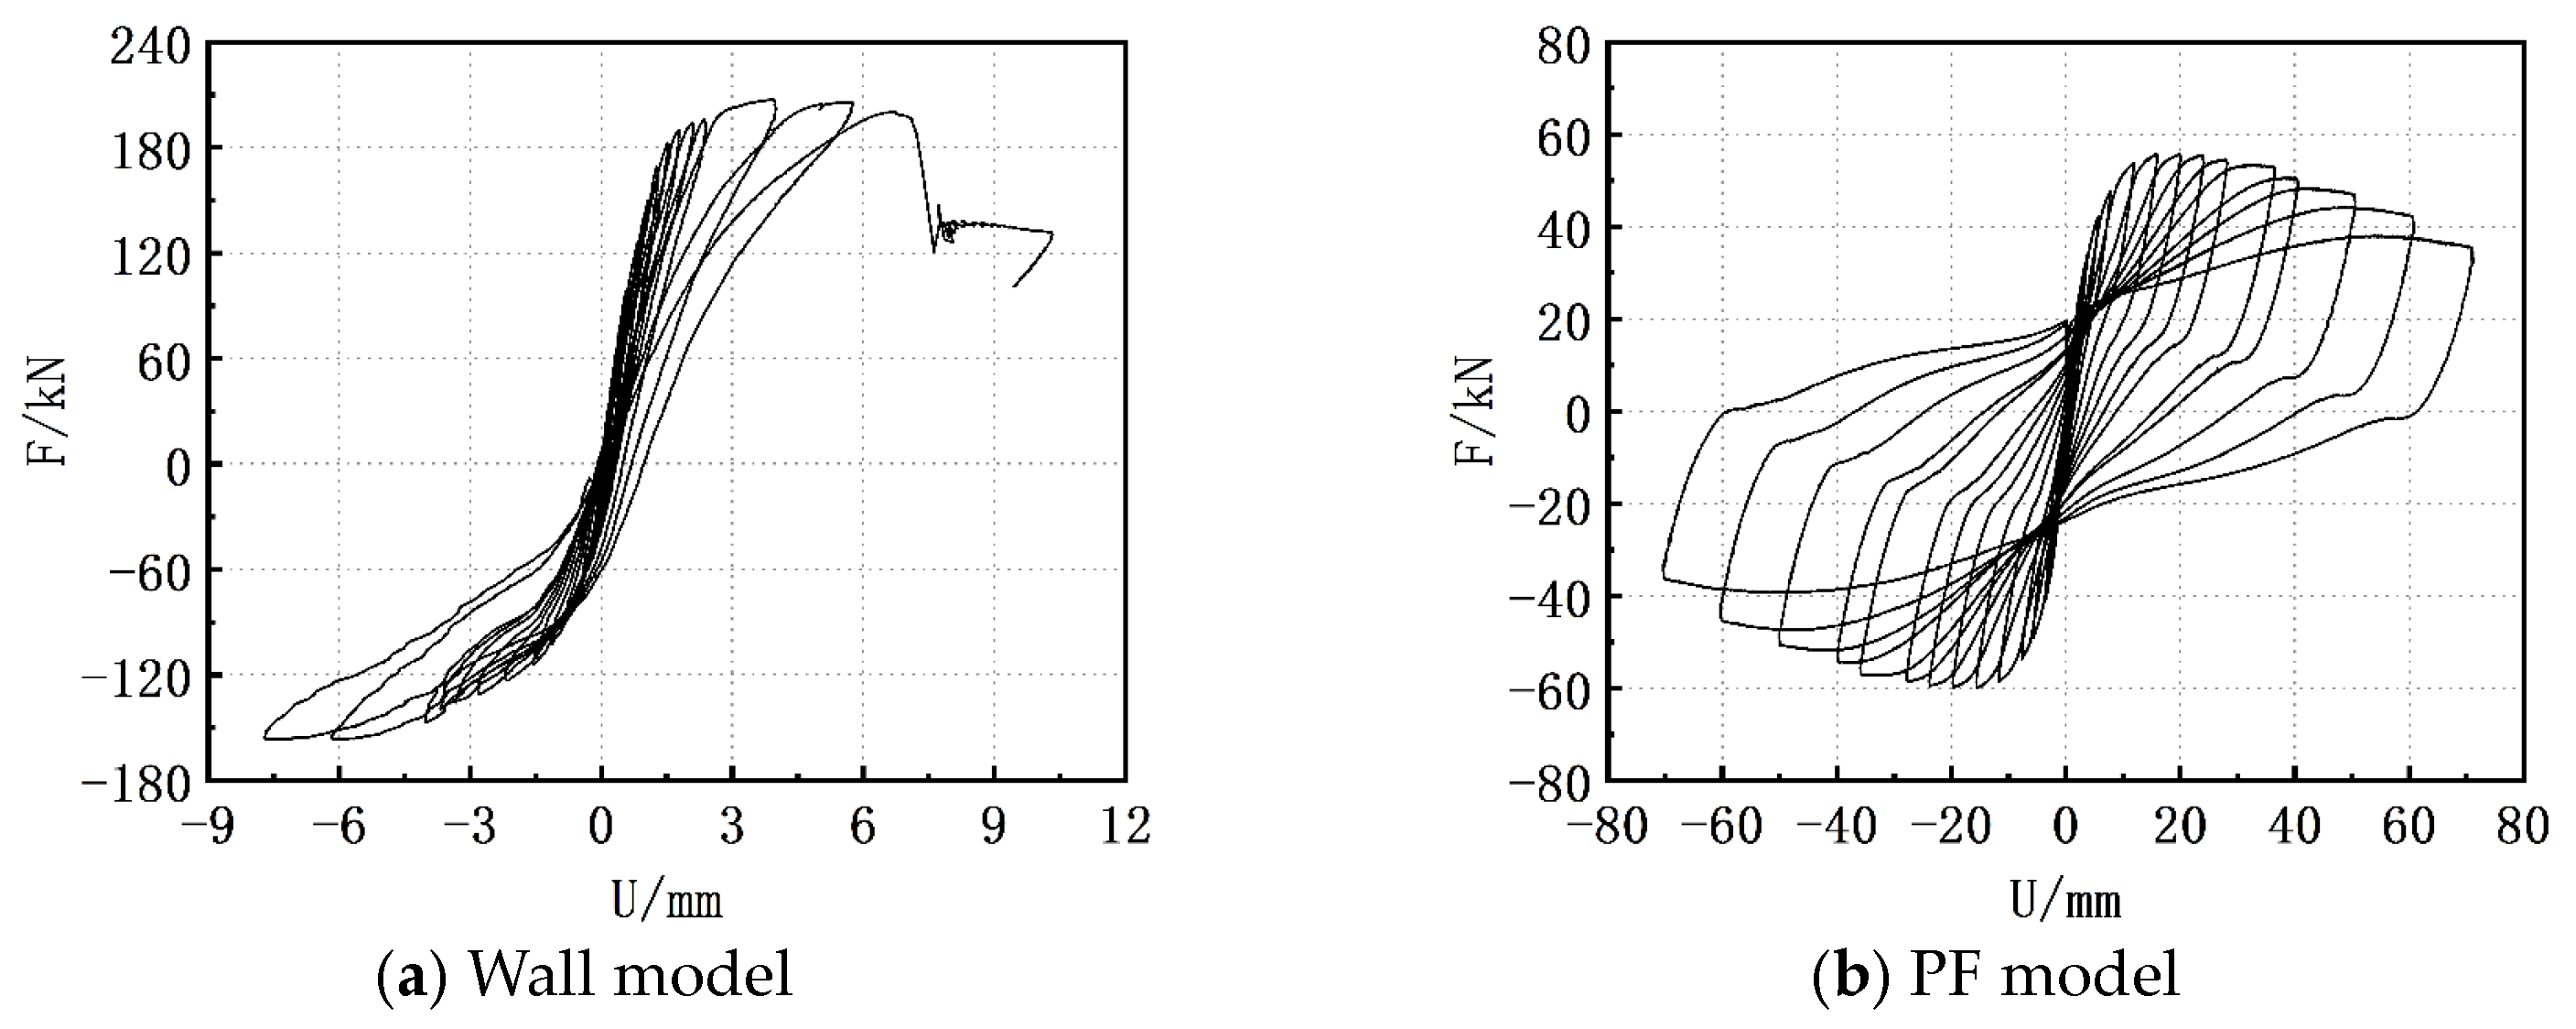
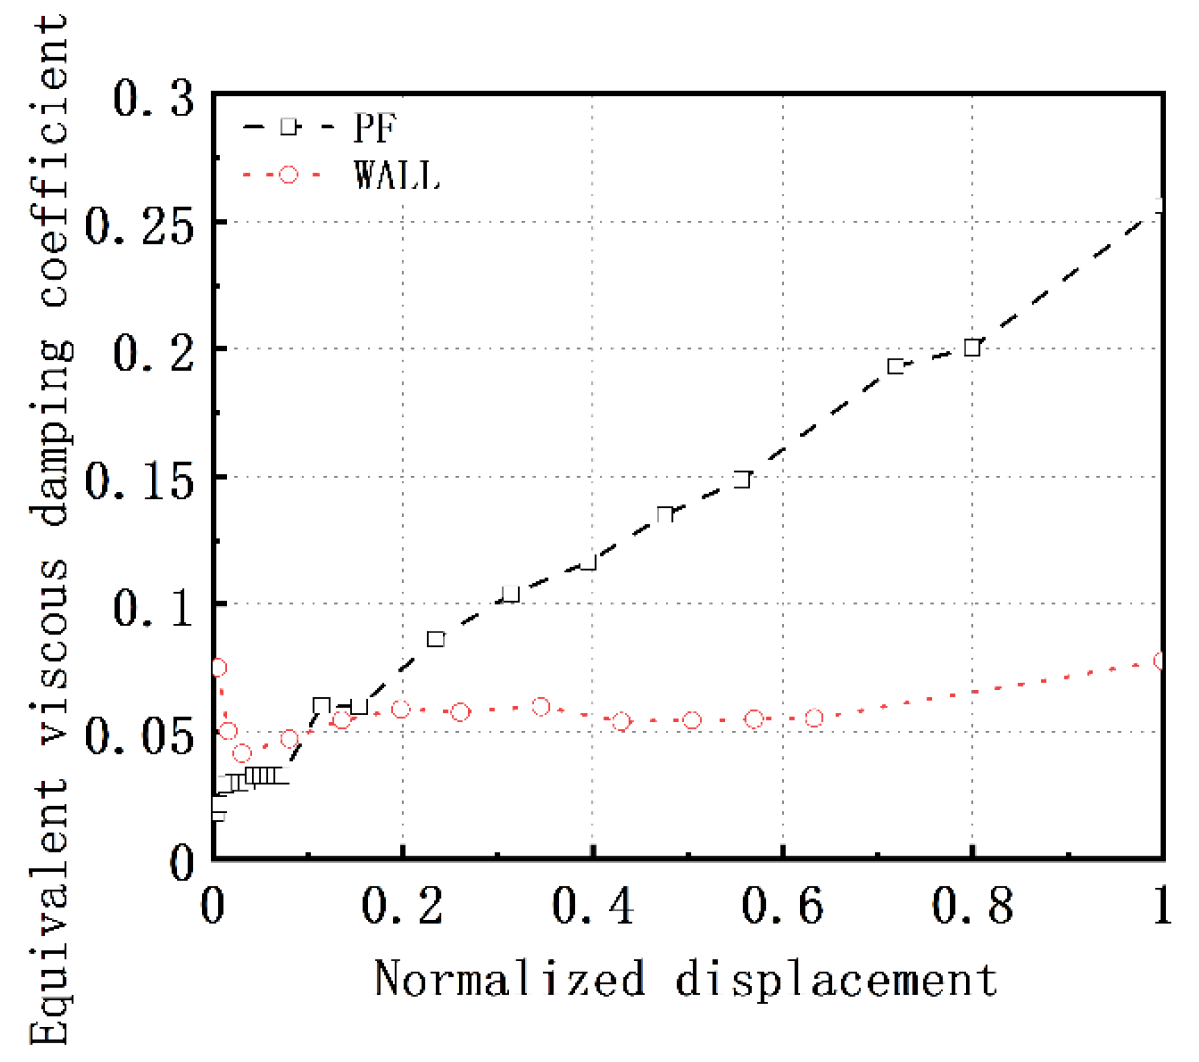
As illustrated in Figure 19 and Figure 20, for the wall model, the area of the hysteresis loops is relatively small under small loading conditions, but its energy dissipation capacity is stronger than that of the PF model. When the displacement approaches the limit of 13%, the energy dissipation capacities of the two models become similar, with an equivalent viscous damping coefficient of about 0.05. As the displacement further increases, this coefficient does not show a significant increase, reaching a maximum of about 0.08, corresponding to a displacement of about 75% of the limit displacement. For conditions ranging from 0.1 mm to 2.0 mm, the PF model also exhibits small hysteresis loop areas and a weaker energy dissipation capacity, with the equivalent viscous damping coefficient generally being maintained between 0.02 and 0.03, indicating that the model is nearly in an elastic state. As the displacement increases, the area of the hysteresis loops gradually enlarges, and its capacity to dissipate energy is enhanced. It is observed that at a condition of 16.0 mm, the PF model reaches its maximum load-bearing capacity, with an equivalent viscous damping coefficient of 0.03. In the 50.0 mm condition, the PF model reaches its collapse displacement. The reason for the difference in energy dissipation capacities between the two models is due to their deformation characteristics. The wall model primarily undergoes shear deformation, ultimately leading to brittle failure. In contrast, under small loading conditions, the columns of the PF model are in the elastic phase and dissipate less energy. As the displacement increases, plastic hinges successively appear at both ends of the columns and develop fully with increasing displacement, eventually resulting in ductile bending failure.

4.5.2. Skeleton Curve Analysis

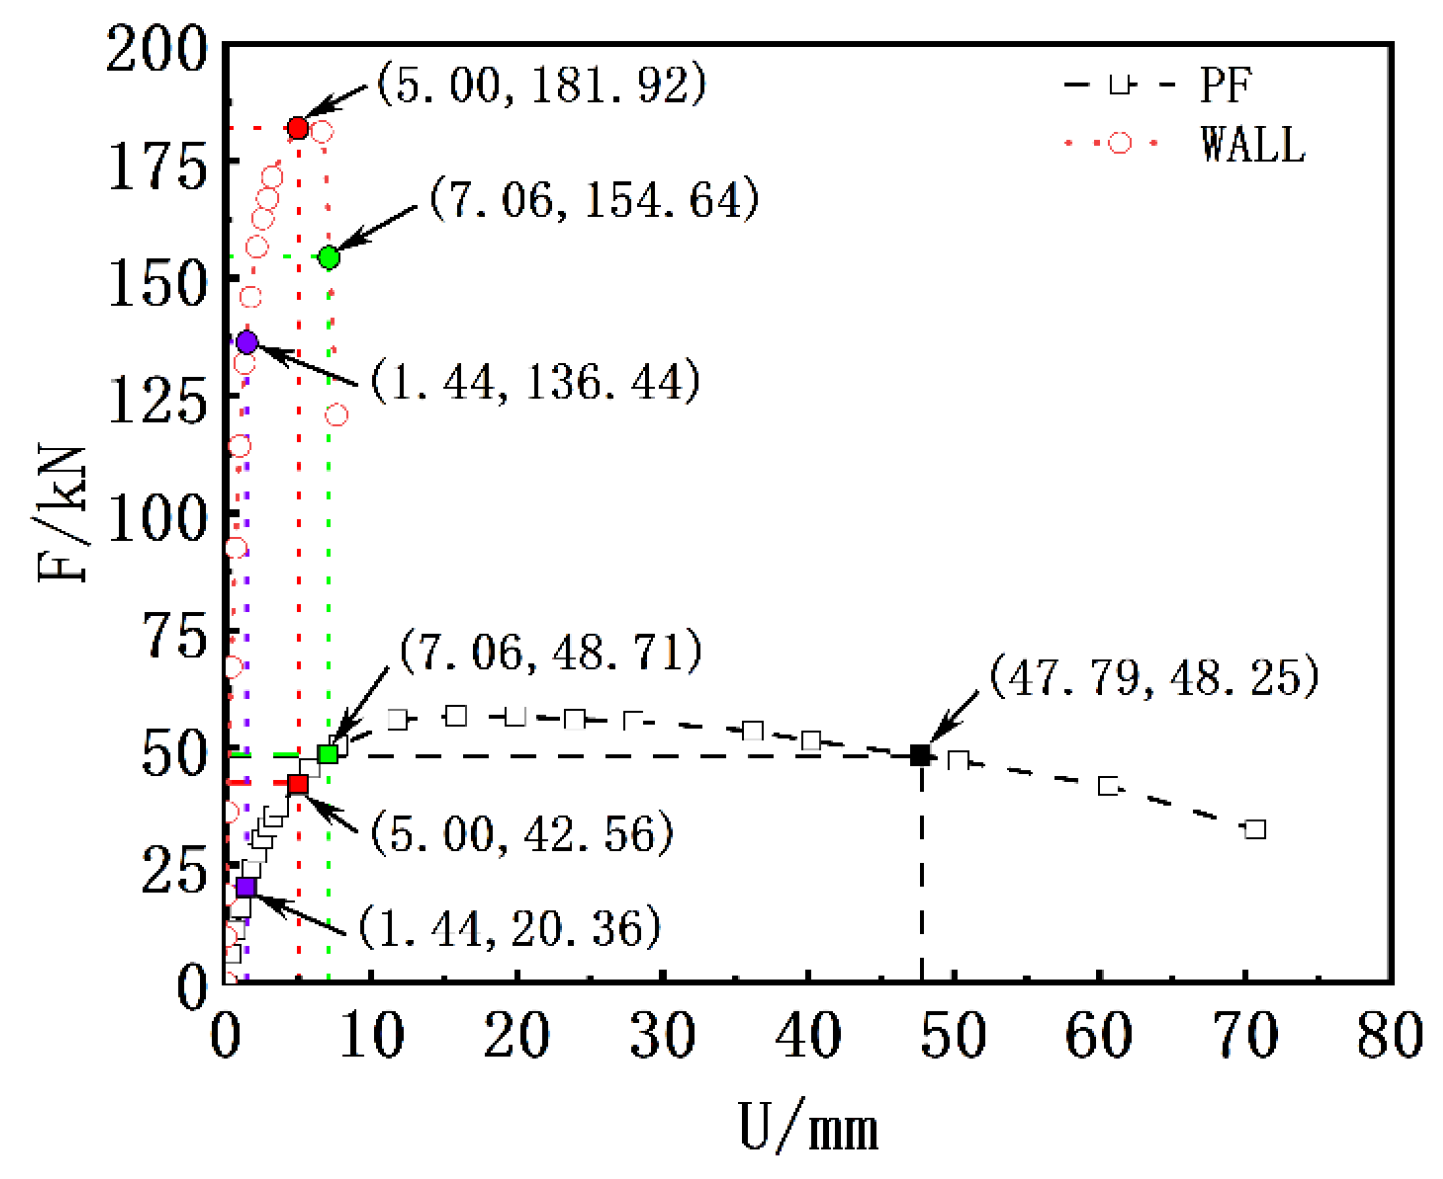
Figure 21 illustrates the skeleton curves for the wall and PF models. At small displacements, both models are within the elastic range, with the wall model exhibiting a greater initial stiffness than the PF model. At a displacement of 2.55 mm, the wall model shows crack formation, corresponding to a cracking load of 162.69 kN. The PF model begins to crack at a displacement of 5.76 mm, with a corresponding load of 45.54 kN. Using graphing methods [47], the yield, peak, and ultimate loads for the PF model are identified as 42.56 kN, 56.75 kN, and 48.23 kN, corresponding to displacements of 5.00 mm, 15.80 mm, and 47.79 mm, respectively. The inter-story drift ratios for these displacements are 1/212, 1/67.1, and 1/22.2. Even at a displacement of 70 mm, the PF model does not experience substantive collapse. For clarity in comparing the two models, a displacement of 47.79 mm is defined as the collapse displacement for the PF model according to the literature [47]. As the displacement increases, the load for the wall model rises more rapidly. Its yield, peak, and ultimate loads are 136.44 kN, 181.92 kN, and 154.64 kN, corresponding to displacements of 1.44 mm, 5.00 mm, and 7.06 mm, respectively. The inter-story drift ratios are 1/736.1, 1/212, and 1/150.1. The wall model collapses at a displacement of 7.62 mm—close to the displacement at peak load capacity—indicating that after reaching peak load, the model suffers significant damage, and the load capacity rapidly declines. It is worth noting that the PF model did not yield when the wall model was destroyed. Compared to the PF model, the wall model has smaller key displacement points and displacement changes in its skeleton curve, allowing the displacement at peak load to be considered the trigger point for collapse. Comparing the skeleton curves of the two models, the PF model has a lower lateral stiffness and load-bearing capacity but a larger ultimate displacement and better ductility, displaying “weak ductile” characteristics. It exhibited ductile bending failure during testing. In contrast, the wall model has higher a lateral stiffness and load-bearing capacity but smaller ultimate displacement and poorer ductility, showing “strong brittle” characteristics. It exhibited brittle shear failure during testing.
Two sets of models are placed on the same floor to simulate the different axial compositions of the Tianyi Hotel. The PF model and the wall model simulate axes Ⓐ and Ⓒ, respectively, as previously mentioned. As determined by Figure 21 and Table 6, influenced by the movement of the floor slab, the ultimate displacement of the wall model is 5.00 mm, which only accounts for 10% of the PF model’s ultimate displacement of 47.79 mm. At this displacement, the PF model generates a shear force of 42.56 kN, which is 75% of the peak load of 56.75 kN. It is evident that, compared to the wall model, the PF model’s carrying capacity and ductility are not fully utilized; especially its ductility.
η 1 = 5.00 47.79 = 10 %
η 2 = 42.56 56.75 = 75 %
Based on observations from seismic damage sites and numerical analysis, it is evident that buildings with multiple non-opening transverse walls have relatively lower x-direction stiffness compared to their y-direction stiffness. The damage is predominantly concentrated on the ground floor, suggesting that vertical load-bearing components mainly undergo x-direction failure.
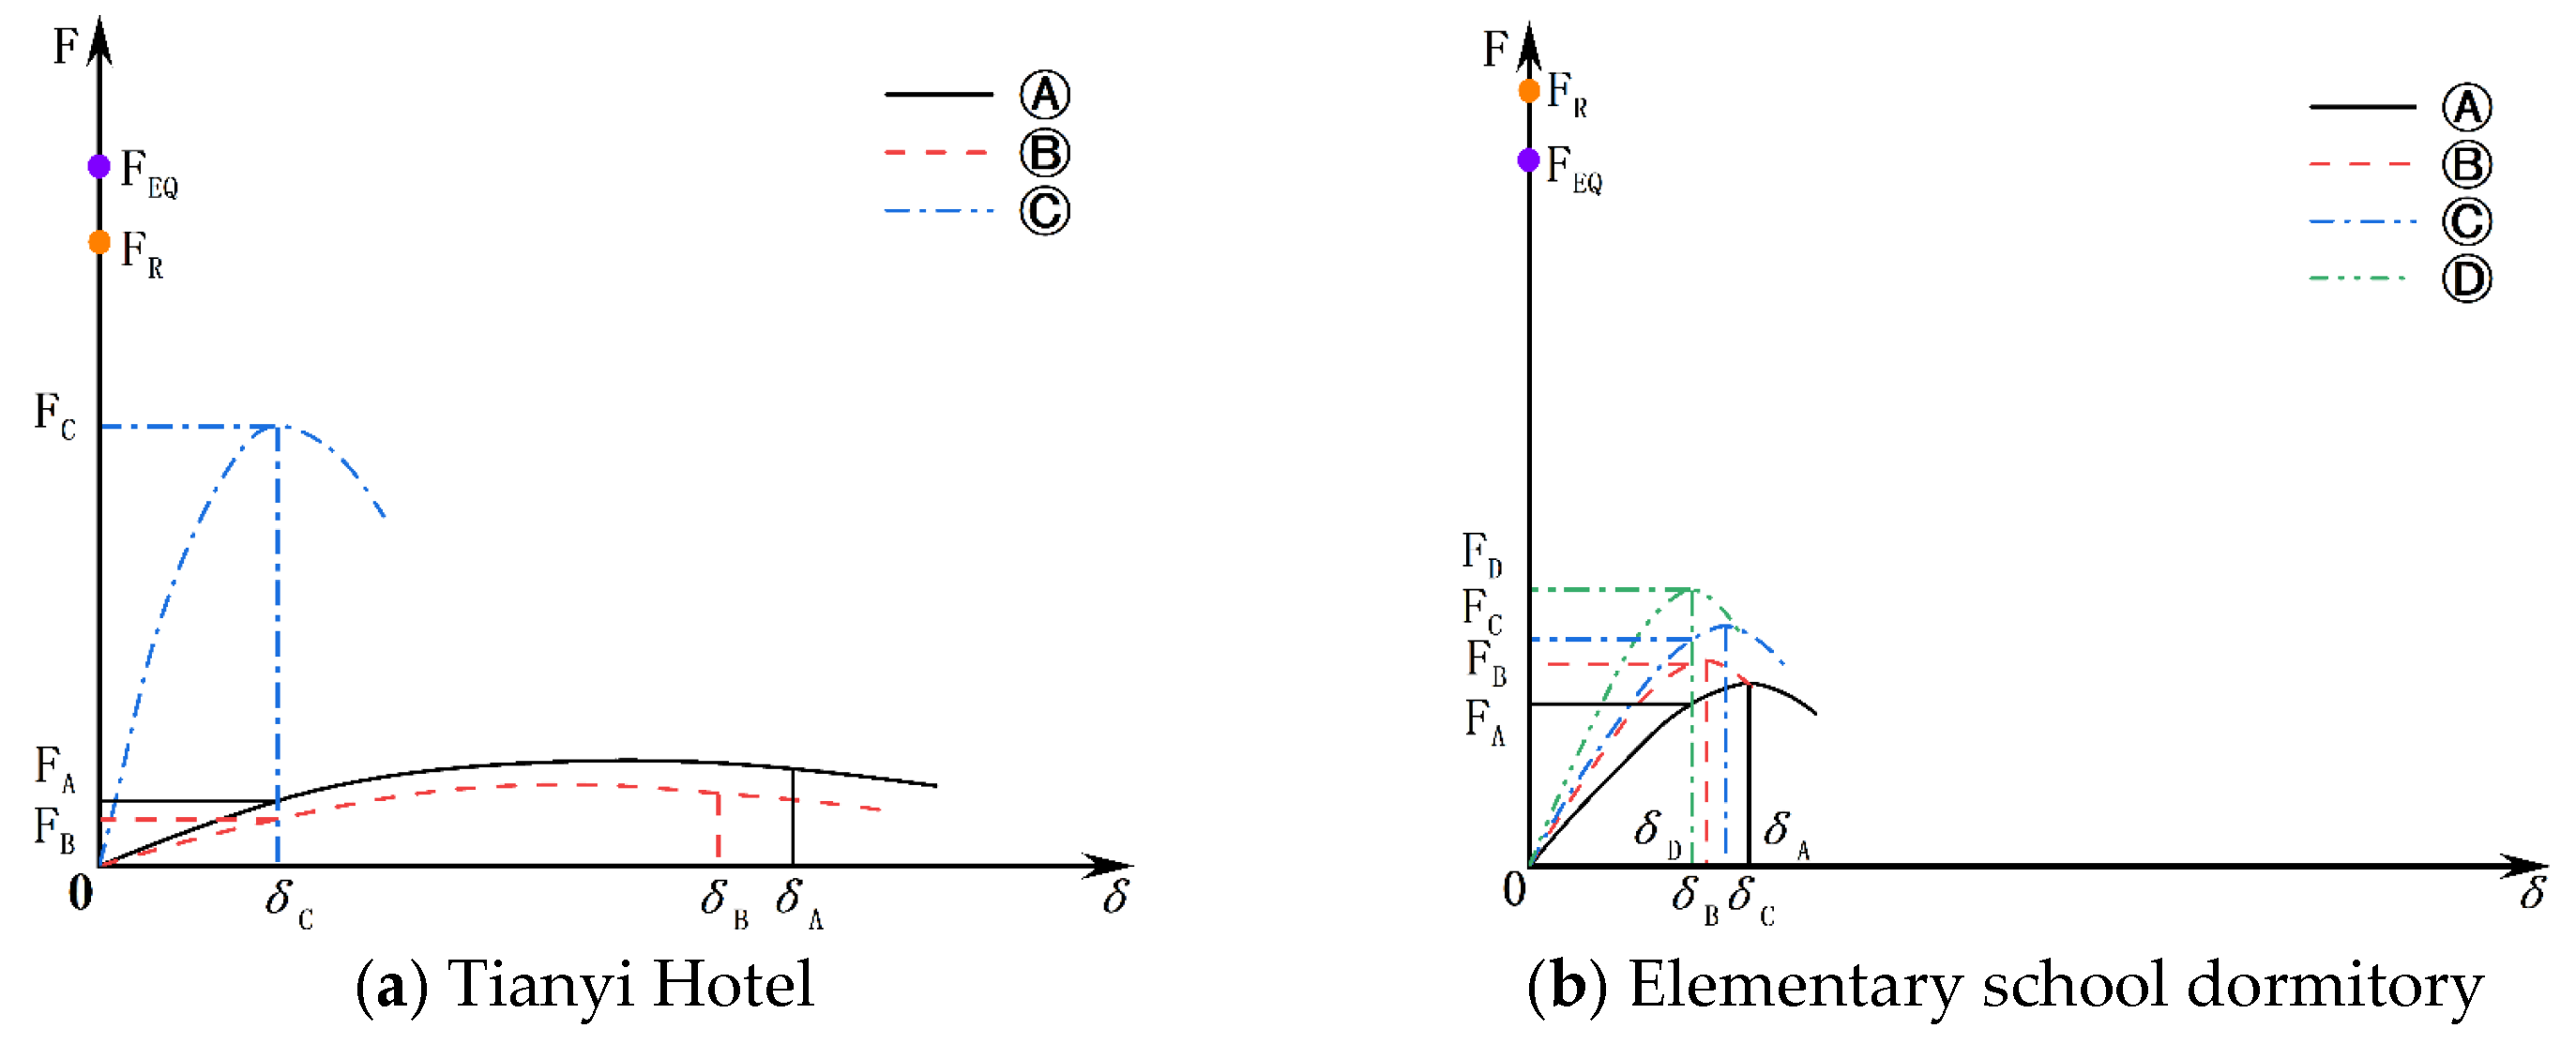
By comparing the typical component makeup and the experimental skeleton curves (Figure 21) of the two buildings, a shear force–displacement diagram for each axis can be constructed (Figure 22a). The Ⓐ and Ⓑ axes of Tianyi Hotel are primarily composed of frame columns, corresponding to the PF model. It is observed that these axes exhibit lower lateral stiffness, lower load-bearing capacity, greater ultimate displacement, and better ductility, demonstrating “weak ductile” characteristics, which are prone to bending failure. The δA and δB displacements, at which the load-bearing capacity of axes Ⓐ and Ⓑ decrease to 85%, are defined as the deformation saturation points for each respective axis. On the other hand, axis Ⓒ consists of walls with openings, constructed from clay bricks. Compared to reinforced concrete, this material has a lower load-bearing capacity. However, the wall area between the windows on axis Ⓒ is larger than that on axis Ⓐ, resulting in higher lateral stiffness, higher ultimate load-bearing capacity, smaller deformations, and poorer ductility for axis Ⓒ, exhibiting “strong brittle” characteristics and a susceptibility to shear failure. The displacement δC, corresponding to the maximum load-bearing capacity, is considered the deformation saturation point for this axis. In Tianyi Hotel, seismic forces are distributed based on the lateral stiffness. Due to the higher lateral stiffness of axis Ⓒ, the ground-level seismic forces are concentrated on this axis, causing a stiffness and seismic shear force distribution that is uneven, characterized as “asymmetry”. This phenomenon is referred to as “force concentration”.
Combining numerical analysis and experimental results, the distribution of seismic shear forces is based on the lateral stiffness of each axis. When the seismic activity is minor, the seismic shear forces are small, and each axis is nearly in an elastic state. The lateral displacement δ of the vertical load-bearing components is small and less than the deformation saturation points of the axes. At this stage, the total seismic force FEQ is less than the total resistance FR, i.e., FEQ < FR = FA + FB + FC, and the structure remains intact. However, as the seismic activity increases, the displacements of the axes increase, and so do the seismic shear forces. The Ⓒ axis, due to its higher lateral stiffness, receives a larger share of the seismic shear force, exhibiting “strong brittle” characteristics. The main deformation is concentrated in the walls between the windows, where the limited ultimate deformation means that displacements quickly reach the deformation saturation point δC, leading to shear failure on this axis. The other two axes, mainly consisting of concrete columns, show “weak ductile” characteristics. When δ = δC, δ has not reached the deformation saturation points δA and δB of axes Ⓐ and Ⓑ; hence, their ductility is not fully utilized. The seismic force FEQ exceeds their resistance FR, FEQ > FR = FA + FB + FC, causing severe damage on axis Ⓒ. Under the influence of gravity, the entire structure is on the verge of collapse. Therefore, the trigger point for the collapse of the building depends on the smallest deformation saturation point among the axes; that is, the collapse trigger point δmax = δC.
For the elementary school dormitory, since all axes consist of walls with openings and similar opening ratios, the lateral stiffness of each axis is similar, all displaying “strong brittle” characteristics. When the seismic activity is minor, the ground floor lateral displacements δ are small and below the deformation saturation points of the axes, remaining nearly elastic. As the seismic activity increases, the lateral displacements and shear forces on each axis increase. Since the lateral stiffness is similar across all axes, the shear forces are evenly distributed. The lateral displacements produced by the vertical load-bearing components do not reach the collapse trigger point of the structure; that is, δmax < δD, FEQ < FR = FA + FB + FC. Thus, the structure remains relatively stable.
As illustrated in Figure 22, due to different structural configurations, the shear force–displacement relationship varies between axes. Compared to concrete columns, masonry wall components have higher lateral stiffness and load-bearing capacities but smaller ultimate deformation and poorer ductility. Thus, whether the structure collapses depends on the component with the smallest deformation among the axes, typically the masonry wall components. Therefore, detailed design and comprehensive calculation considerations are needed in the design process to achieve a balance across all axes.

5. Discussion on “Asymmetry” and “Symmetry” Characteristics

Due to differences in functional use, construction methods, and other factors, the force–displacement curves for different axes can vary significantly. Based on the curves obtained from the experiments described in this article, a combination is formed and representative buildings are identified, as illustrated in Figure 23 and Table 7, where δ1 represents the lateral displacement generated by the structure. The first category is the “weak ductile + strong brittle” combination, represented by PF + wall, with an example building being Building 7, Group 1 in Detuo Town. This building displays “asymmetry” characteristics, where there is a significant difference in the lateral stiffness between the axes, and the deformation saturation point of axis Ⓒ is smaller than that of axis Ⓐ. The structure is prone to damage and even collapse; thus, the collapse displacement trigger point depends on axis Ⓒ. The second category is the “strong brittle + strong brittle” combination, represented by wall + wall, with the former Minya Konka school dormitory as an example. This building has similar structural configurations across its axes and minor differences in lateral stiffness, presenting “uniform” characteristics. Therefore, the distribution of seismic forces is relatively similar across all axes. The third category is the “weak ductile + weak ductile” combination, represented by PF + PF, exemplified by a certain under-construction frame structure. As this type of structure lacks non-structural components such as internal walls, the lateral stiffness across the axes is quite balanced, showing “uniform” characteristics. Moreover, each axis has a larger ultimate displacement, making it difficult for the vertical load-bearing components to reach their deformation saturation points, and no significant damage occurs in these buildings.

6. Conclusions

This article selects typical buildings struck by a 6.3 magnitude earthquake in Luding to describe the seismic damage. Using numerical analysis, the motion of the building and the state of its components are analyzed. To validate the reliability of the numerical analysis results, related quasi-static tests are performed, and the “deformation saturation” theory is applied for exploratory interpretation to further analyze the structural force mechanisms. The following conclusions are drawn:
  • Structures previously thought to have poor seismic performance exhibited good behavior after the earthquake. Seismic damage investigations revealed that the y-direction load-bearing components of Tianyi Hotel suffered more severe damage than those in the x-direction, with the Ⓒ axis components being the most severely damaged, putting the building at risk of collapse. In contrast, the elementary school dormitory, which is composed entirely of masonry walls, including y-direction walls with varying degrees of openings, showed poor component deformation, leading to shear damage, yet no significant damage was observed in the dormitory. The numerical analysis results show that Tianyi Hotel has a minimum shear force ratio of 2.2:1.0:11.8 among its axes, while the elementary school dormitory has a maximum shear force ratio of 2.1:1.0:1.1:2.0, indicating significant differences in lateral stiffness due to varied constructions, leading to “force concentration” phenomena.
  • Both the damage sites and numerical analyses reveal the presence of multiple fully masonry transverse walls, with the x-direction stiffness being greater than the y-direction stiffness. This configuration causes the structure to primarily move towards the x-direction, forming the basis for the “deformation saturation” theory. Due to differences in functionality and construction methods, various structural axes exhibit different structural configurations. These configurations possess distinct shear force–displacement curves, leading to a mixture of vertical load-bearing components with different constitutive properties on the same floor. This phenomenon contributes to “deformation saturation” and can cause structural failure or even collapse.
  • Open-window walled components have a high load-bearing capacity but poor ultimate deformation and ductility. The deformation of the walls between windows accounts for about 50% of the total deformation and hence the concentration of earthquake damage in these areas. Conversely, concrete columns exhibit better ultimate deformation and ductility, demonstrating a strong energy absorption capability, although their load-bearing capacity is lower than that of walls. When both types of structural components coexist on the same floor, the wall components are likely to sustain damage first, leading to structural collapse. Meanwhile, the concrete columns do not reach their limit displacement, and their excellent ductility is not fully utilized. Therefore, the key to building damage and even collapse lies in the brittle components with poor deformation. Defining the minimum deformation of the least-deformed component as the structure’s deformation saturation point is crucial for assessing the building’s seismic resilience. This approach highlights the importance of considering both strength and ductility in structural design to prevent premature failure in certain components, while others remain largely unutilized.
  • When the constitutive properties of vertical load-bearing components on the same floor are similar, lateral shifts are less likely to reach the collapse trigger point of the structure, meaning the structural resistance is greater than the seismic forces it experiences. While the “deformation saturation” theory offers a reasonable explanation for the behavior of the two buildings discussed, further investigation and analysis of other structures are required to gain a more comprehensive understanding of the collapse mechanisms and to validate the applicability of this theory more broadly.

Author Contributions

Conceptualization, X.G.; methodology, X.G.; software, X.D. and R.L.; validation, L.A.; investigation, R.L. and C.Y.; data curation, X.D., L.A., R.L. and C.Y.; writing—original draft, X.D.; writing—review & editing, X.G.; visualization, L.A.; project administration, X.G.; funding acquisition, X.G. and L.A. All authors have read and agreed to the published version of the manuscript.

Funding

This study was funded by the National Natural Science Foundation of China (Grant No: 52278489) and the Earthquake Science and Technology Innovation Team of Yunan Earthquake Agency (Grant No: CXTD202401).

Data Availability Statement

Some or all pictures, data, models, or codes generated or used during the study are available from the corresponding author upon request.

Acknowledgments

The relevant experiments were completed in the Key Laboratory of Building Collapse Mechanism and Disaster Prevention, China Earthquake Administration. The authors thank these institutions for their support of this study.

Conflicts of Interest

The authors declare that they have no known competing financial interests or personal relationships that could have appeared to influence the work reported in this paper.

References

  1. Paulay, T. Developments in the seismic design of reinforced concrete frames in New Zealand. Can. J. Civ. Eng. 1981, 8, 91–113. [Google Scholar] [CrossRef]
  2. Ivanović, S.; Trifunac, M.; Novikova, E.; Gladkov, A.; Todorovska, M. Ambient vibration tests of a seven-story reinforced concrete building in Van Nuys, California, damaged by the 1994 Northridge earthquake. Soil Dyn. Earthq. Eng. 2000, 19, 391–411. [Google Scholar] [CrossRef]
  3. Civil and Structural Groups of Tsing Hua University; Xi’nan Jiao Tong University; BeiJing Jiao Tong University. Analysis on seismic damage of buildings in the wen chuan earthquake. J. Build. Struct. 2008, 29, 1–9. [Google Scholar]
  4. Varum, H.; Furtado, A.; Rodrigues, H.; Dias-Oliveira, J.; Vila-Pouca, N.; Arêde, A. Seismic performance of the infill masonry walls and ambient vibration tests after the Ghorka 2015, Nepal earthquake. Bull. Earthq. Eng. 2017, 15, 1185–1212. [Google Scholar] [CrossRef]
  5. Paulay, T.; Priestley, M. Seismic Design of Reinforced Concrete and Masonry Buildings; John Wiley & Sons, Inc.: New York, NY, USA, 1992. [Google Scholar]
  6. Park, R. Improving the resistance of structures to earthquakes. Bull. N. Z. Soc. Earthq. Eng. 2001, 34, 1–39. [Google Scholar] [CrossRef]
  7. Halder, L.; Dutta, S.C.; Sharma, R.P.; Bhattacharya, S. Lessons learnt from post-earthquake damage study of Northeast India and Nepal during last ten years: 2021 Assam earthquake, 2020 Mizoram earthquake, 2017 Ambasa earthquake, 2016 Manipur earthquake, 2015 Nepal earthquake, and 2011 Sikkim earthquake. Soil Dyn. Earthq. Eng. 2021, 151, 106990. [Google Scholar] [CrossRef]
  8. Ye, L.P.; Qu, Z.; Ma, Q.L.; Lin, X.C.; Lu, X.; Pan, P. Study on ensuring the strong column-weak beam mechanism for RC frames based on the damage analysis in the Wenchuan earthquake. Build. Struct. 2008, 38, 52–59+67. [Google Scholar]
  9. Sudarsana, I.K.; Budiwati, I.A.M.; Aditya, P.W. Effect of Column to Beam Strength Ratio on Performance of Reinforced Concrete Frames. In Proceedings of the 1st International Conference on Engineering Technology and Industrial Application, Surakarta, Indonesia, 4 December 2014. [Google Scholar]
  10. Haselton, C.B.; Liel, A.B.; Deierlein, G.G.; Dean, B.S.; Chou, J.H. Seismic collapse safety of reinforced concrete buildings. I: Assessment of ductile moment frames. J. Struct. Eng. 2011, 137, 481–491. [Google Scholar] [CrossRef]
  11. Liel, A.B.; Haselton, C.B.; Deierlein, G.G. Seismic collapse safety of reinforced concrete buildings. II: Comparative assessment of nonductile and ductile moment frames. J. Struct. Eng. 2011, 137, 492–502. [Google Scholar] [CrossRef]
  12. Chaker, A.A.; Cherifati, A. Influence of masonry infill panels on the vibration and stiffness characteristics of R/C frame buildings. Earthq. Eng. Struct. Dyn. 2015, 28, 1061–1065. [Google Scholar] [CrossRef]
  13. Xu, J.G.; Cao, X.Y.; Shi, J.Z. A comparative study of the novel externally-attached precast SRC braced-frames for seismic retrofitting under near-field spectrum-compatible non-stationary stochastic earthquake. Structures 2023, 50, 200–214. [Google Scholar] [CrossRef]
  14. Xu, J.G.; Cao, X.Y.; Wu, G. Seismic collapse and reparability performance of reinforced concrete frames retrofitted with external PBSPC BRBF sub-frame in near-fault regions. J. Build. Eng. 2023, 64, 105716. [Google Scholar] [CrossRef]
  15. Wang, Q.; Li, J.; Liao, W.; Zhang, L.; Qin, X. Building damages in Deyang city by the 2008 Wenchuan earthquake. Geod. Geodyn. 2011, 2, 59–63. [Google Scholar]
  16. Penna, A.; Morandi, P.; Rota, M.; Manzini, C.F.; Da Porto, F.; Magenes, G. Performance of masonry buildings during the Emilia 2012 earthquake. Bull. Earthq. Eng. 2014, 12, 2255–2273. [Google Scholar] [CrossRef]
  17. Mistler, M.; Butenweg, C.; Meskouris, K. Modelling methods of historic masonry buildings under seismic excitation. J. Seismol. 2006, 10, 497–510. [Google Scholar] [CrossRef]
  18. Nakagawa, T.; Narafu, T.; Imai, H.; Hanazato, T.; Ali, Q.; Minowa, C. Collapse behavior of a brick masonry house using a shaking table and numerical simulation based on the extended distinct element method. Bull. Earthq. Eng. 2012, 10, 269–283. [Google Scholar] [CrossRef]
  19. Parisi, F.; Augenti, N. Seismic capacity of irregular unreinforced masonry walls with openings. Earthq. Eng. Struct. Dyn. 2013, 42, 101–121. [Google Scholar] [CrossRef]
  20. Kallioras, S.; Graziotti, F.; Penna, A. Numerical assessment of the dynamic response of a URM terraced house exposed to induced seismicity. Bull. Earthq. Eng. 2019, 17, 1521–1552. [Google Scholar] [CrossRef]
  21. GB 50011-2010; Code for Seismic Design of Buildings. China Architecture & Building Press: Beijing, China, 2016.
  22. Piroglu, F.; Ozakgul, K. Site investigation of masonry buildings damaged during the 23 October and 9 November 2011 Van Earthquakes in Turkey. Nat. Hazards Earth Syst. Sci. 2013, 13, 689–708. [Google Scholar] [CrossRef]
  23. Medeiros, P.; Vasconcelos, G.; Lourenço, P.B.; Gouveia, J. Numerical modelling of non-confined and confined masonry walls. Constr. Build. Mater. 2013, 41, 968–976. [Google Scholar] [CrossRef]
  24. Qamaruddin, M.; Chandra, B.; Arya, A. Dynamic testing of brick building models. Proc. Inst. Civ. Eng. Part Res. Theory 2015, 77, 353–365. [Google Scholar] [CrossRef]
  25. Benedetti, D.; Carydis, P.; Pezzoli, P. Shaking table tests on 24 simple masonry buildings. Earthq. Eng. Struct. Dyn. 1998, 27, 67–90. [Google Scholar] [CrossRef]
  26. Bhalkikar, A.; Kumar, R.P. A comparative study of different rapid visual survey methods used for seismic assessment of existing buildings. Structures 2021, 29, 1847–1860. [Google Scholar] [CrossRef]
  27. Kassem, M.M.; Beddu, S.; Ooi, J.H.; Tan, C.G.; Mohamad El-Maissi, A.; Mohamed Nazri, F. Assessment of seismic building vulnerability using rapid visual screening method through web-based application for Malaysia. Buildings 2021, 11, 485. [Google Scholar] [CrossRef]
  28. Mertol, H.C.; Tunç, G.; Akış, T.; Kantekin, Y.; Aydın, İ.C. Investigation of RC Buildings after 6 February 2023, Kahramanmaraş, Türkiye Earthquakes. Buildings 2023, 13, 1789. [Google Scholar] [CrossRef]
  29. Aykanat, B.; Ertürk, E.; Altunışık, A.C.; Aslan, M.E. Field Investigation on Reinforced Concrete and Masonry Buildings Damages after 23 November 2022 Gölyaka (Düzce) Earthquake. J. Earthq. Tsunami 2023, 17, 1793–4311. [Google Scholar] [CrossRef]
  30. Işık, E.; Hadzima-Nyarko, M.; Radu, D.; Bulajić, B. Study on Effectiveness of Regional Risk Prioritisation in Reinforced Concrete Structures after Earthquakes. Appl. Sci. 2024, 14, 6992. [Google Scholar] [CrossRef]
  31. Huang, S.N.; Yuan, Y.F.; Meng, Q.L. Study on seismic resistance of rural houses based on earthquake damage to buildings in Yushu earthquake. World Earthq. Eng. 2011, 27, 77–82. [Google Scholar]
  32. Zhe, Q.; Zhong, J.; Sun, J. Seismic damage to masonry structures in M7.0 Lushan earthquake. Earthq. Eng. Eng. Dyn. 2013, 33, 27–35. [Google Scholar]
  33. Zhang, L.; Zhu, B.; Tao, Z.; Chen, X. Field Investigation and Failure Characteristics of Buildings Damaged by the 7.0-Magnitude Earthquake in Jiuzhaigou. China Earthq. Eng. J. 2019, 41, 1053–1059. [Google Scholar]
  34. Ye, L.; Li, Y.; Peng, P. Seismic damages of building structures of Xuankou Middle School in Yingxiu Town. Build. Struct. 2009, 39, 54–57. [Google Scholar]
  35. Mei, Y. A Study on the Aseismic Capacity of ‘Qiuzhi Building’ with Masonry Structure in Bailu Middle School; Institute of Engineering Mechanics, China Earthquake Administration: Harbin, China, 2012.
  36. Guo, X. Application of deformation saturation theory in the seismic damage analysis of Luding, Sichuan Ms6.8 Earthquake in 2022. J. Inst. Disaster Prev. 2022, 24, 1–10. [Google Scholar]
  37. Federal Emergency Management Agency (FEMA). NEHRP Guidelines for the Seismic Rehabilitation of Buildings; FEMA 273; FEMA: Washington, DC, USA, 1997.
  38. GB 50010−2010; Code for Design of Concrete Structures. China Architecture & Building Press: Beijing, China, 2015.
  39. Scott, A.; Park, R.; Priestley, M.J.M. Stress-strain behavior of concrete confined by overlapping hoops at low and high strain rates. J. Am. Concr. Inst. 1982, 79, 13–27. [Google Scholar]
  40. Peruch, M.; Spacone, E.; Camata, G. Nonlinear analysis of masonry structures using fiber-section line elements. Earthq. Eng. Struct. Dyn. 2019, 48, 1345–1364. [Google Scholar] [CrossRef]
  41. Turnšek, V.; Čačovič, F. Some experimental results on the strength of brick masonry walls. In Proceedings of the 2nd International Brick & Block Masonry Conference, Stoke-on-Trent, UK, 12–15 April 1971; British Ceramic Research Association: Stoke-on-Trent, UK, 1971; pp. 149–156. [Google Scholar]
  42. Anthoine, A.; Magonette, G.; Magenes, G. Shear-compression testing and analysis of brick masonry walls. In Proceedings of the 10th European Conference on Earthquake Engineering, Vienna, Austria, 28 August–2 September 1995; Central Institute for Meteorology and Geodynamics: Vienna, Austria, 1995; pp. 1657–1662. [Google Scholar]
  43. Shabani, A.; Kioumarsi, M. A novel macroelement for seismic analysis of unreinforced masonry buildings based on MVLEM in OpenSees—ScienceDirect. J. Build. Eng. 2022, 49, 104019. [Google Scholar] [CrossRef]
  44. Lata, A.; Xun, G.; Ruofan, L.; Xiaoyao, D.; Bideng, L. Experimental study on the seismic performance of RC frames considering the cast sequence of infilled walls and columns. Structures 2022, 44, 186–199. [Google Scholar] [CrossRef]
  45. Sun, M.; Liu, W. Experimental study on seismic behavior for porous masonry. Earthq. Resist. Eng. Retrofit. 2004, 31–34. [Google Scholar] [CrossRef]
  46. GB 50009−2012; Load Code for the Design of Building Structures. China Architecture & Building Press: Beijing, China, 2012.
  47. Park, R. State of the art report ductility evaluation from laboratory and analytical testing. In Proceedings of the Ninth World Conference on Earthquake Engineering, Tokyo, Japan, 2–9 August 1988; pp. 605–616. [Google Scholar]
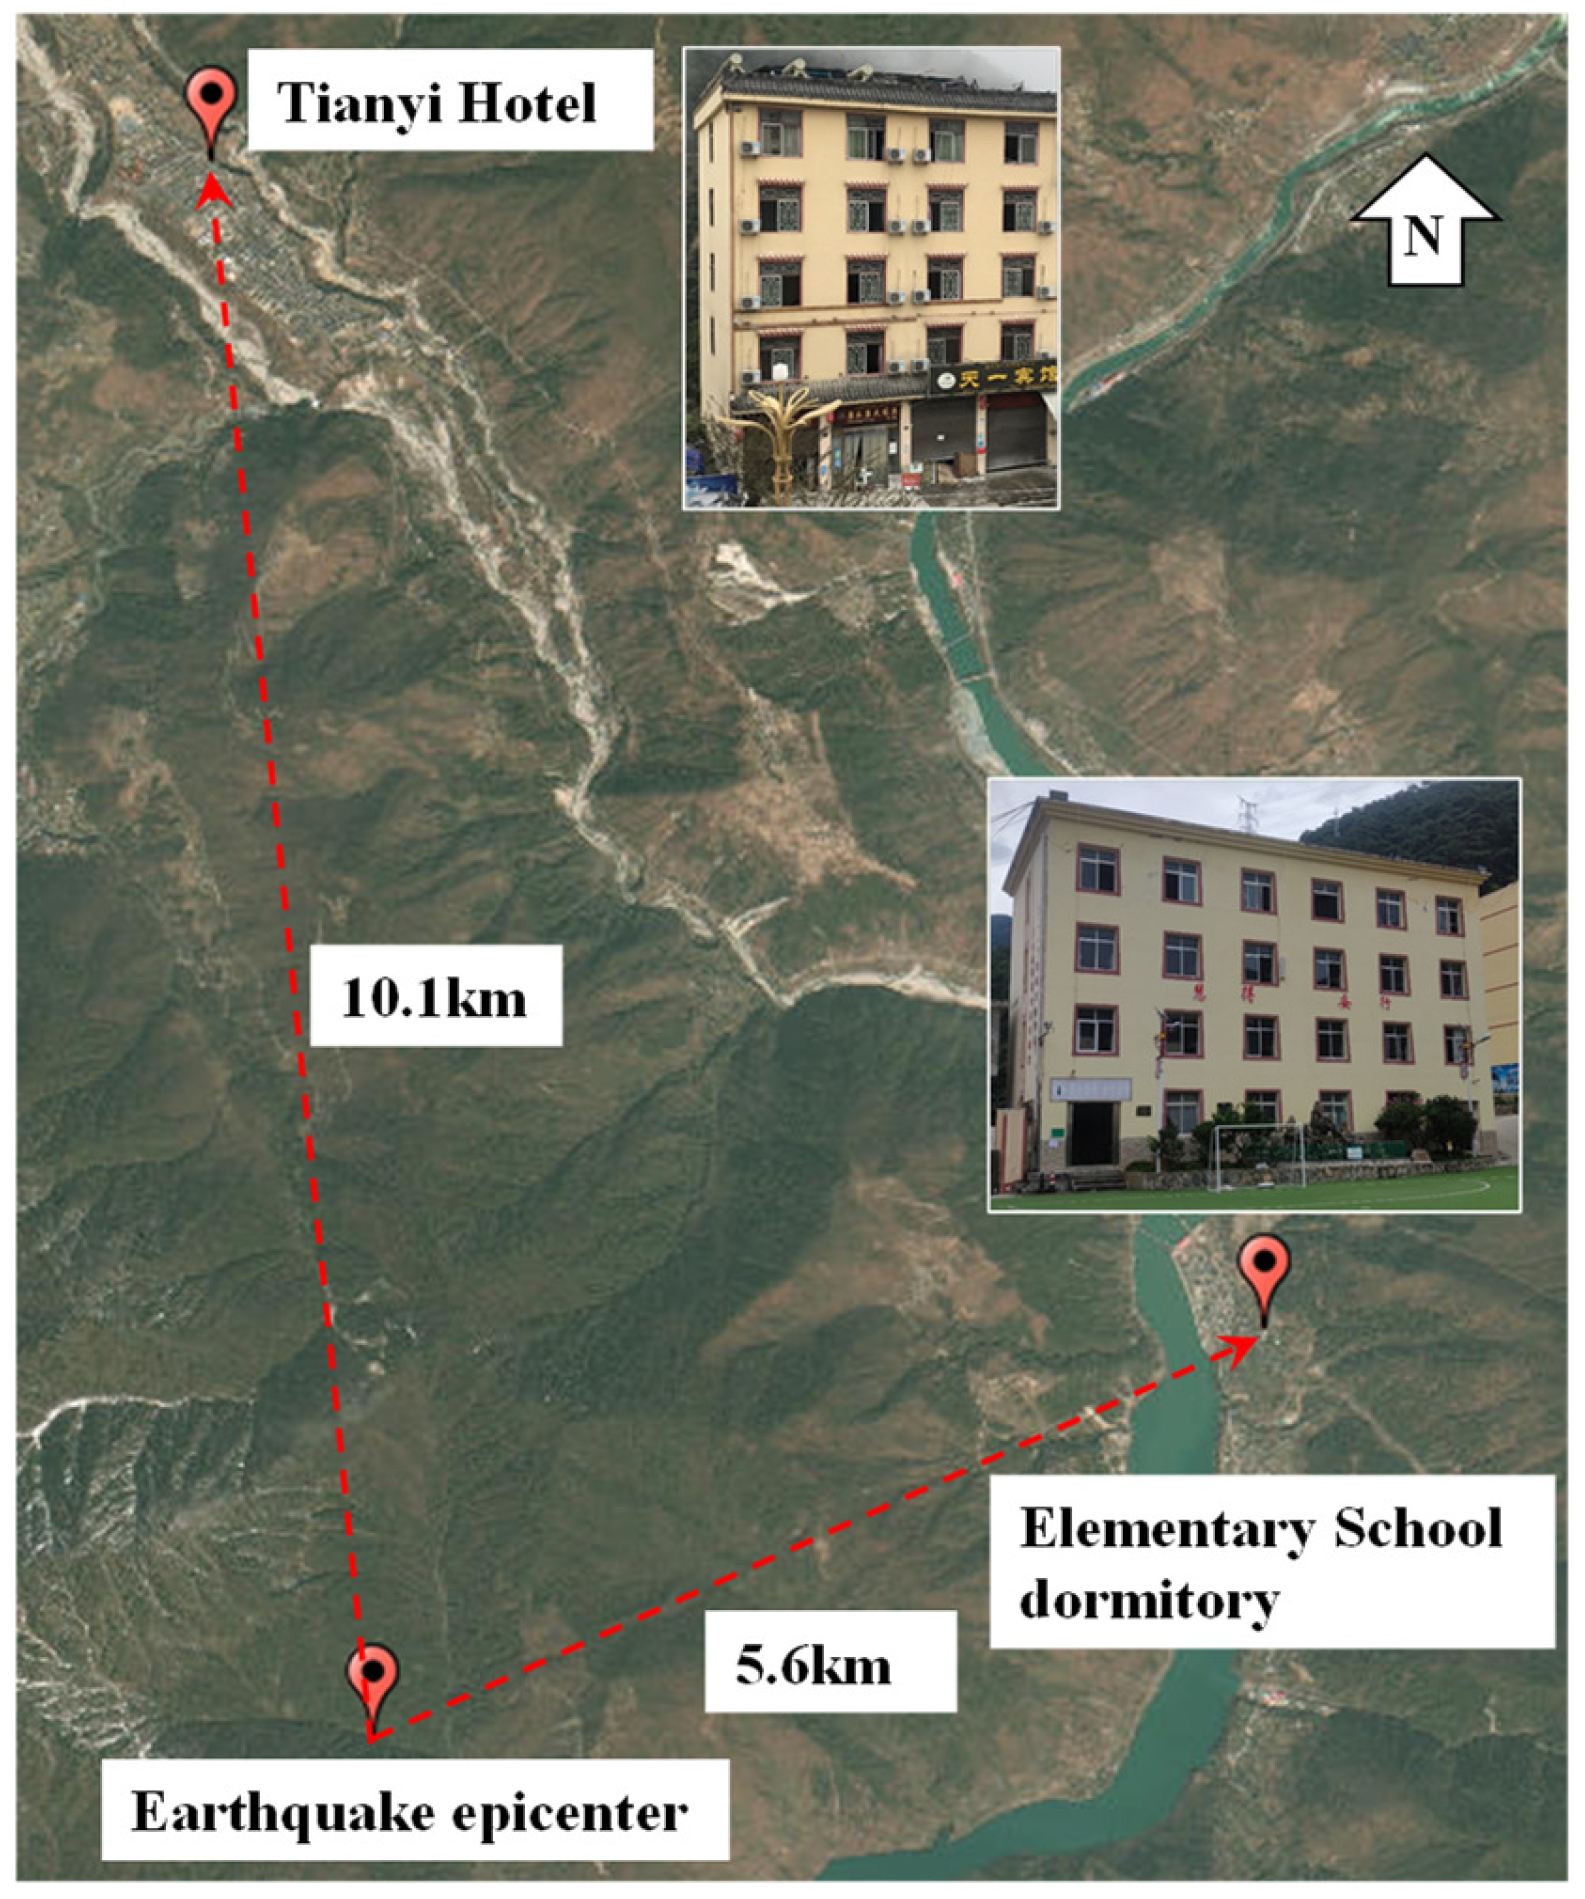
Figure 1. Locations of buildings and the earthquake epicenter.
Buildings 14 02887 g001
Figure 2. Elevations and floor plan of Tianyi Hotel.
Buildings 14 02887 g002
Figure 3. Seismic damage diagrams of Tianyi Hotel.
Buildings 14 02887 g003
Figure 4. Facade and floor plan of the elementary school dormitory.
Buildings 14 02887 g004
Figure 5. Interior of the elementary school dormitory.
Buildings 14 02887 g005
Figure 6. Simplified equivalent model.
Buildings 14 02887 g006
Figure 7. Model validation.
Buildings 14 02887 g007
Figure 8. Calculation model.
Buildings 14 02887 g008
Figure 9. Typical station information.
Buildings 14 02887 g009
Figure 10. Structural plastic state.
Buildings 14 02887 g010
Figure 11. Model displacement based on station SC.T2271 (PGA = 0.1 g).
Buildings 14 02887 g011
Figure 12. Model shear force based on station SC.T2271 (PGA = 0.1 g).
Buildings 14 02887 g012
Figure 13. Dimensions and construction of the PF and wall models.
Buildings 14 02887 g013
Figure 14. Model loading regime.
Buildings 14 02887 g014
Figure 15. Displacement measurement setup.
Buildings 14 02887 g015
Figure 16. Final failure mode of the PF model.
Buildings 14 02887 g016
Figure 17. Damage state of the wall model.
Buildings 14 02887 g017
Figure 18. Deformation amount at different locations of the wall model.
Buildings 14 02887 g018
Figure 19. Hysteresis curve of the models.
Buildings 14 02887 g019
Figure 20. Energy dissipation coefficient chart.
Buildings 14 02887 g020
Figure 21. Skeleton curve.
Buildings 14 02887 g021
Figure 22. Shear force–displacement relationship diagram for two buildings.
Buildings 14 02887 g022
Figure 23. Shear–displacement diagram and layout of typical buildings.
Buildings 14 02887 g023aBuildings 14 02887 g023b
Table 1. Seismic motion record.
Serial NumberStation CodeEpicentral Distance/kmPGA/gDuration/s
EWNSUDRecordAfter Clipping
1SC.T2271-0.910.680.1812046
251LDJ16.200.110.310.1613929
Table 2. Model dynamic characteristics.
Calculation ModelMode NumberMode ShapeNatural Period/s
Tianyi Hotel1x-direction motion0.2741
2y-direction motion0.1776
3z-rotation0.1573
Elementary school dormitory1x-direction motion0.1360
2y-direction motion0.1128
3z-rotation0.0998
Table 3. Comparison of model displacements at different times.
ModelWorking Conditions/gTime/sUy/mmUx/mmRatio
N1N2N1N2
Tianyi HotelSC.T22710.114.870.550.55−2.87−2.131.0:1.0:5.2:3.9
0.514.161.981.98−13.33−13.191.0:1.0:6.7:6.7
51LDJ0.14.12−0.33−0.332.021.421.0:1.0:6.1:4.3
0.54.13−1.49−1.4912.0310.181.0:1.0:8.1:6.8
Elementary school dormitorySC.T22710.113.91−0.12−0.120.230.231.0:1.0:1.9:1.9
0.513.92−0.18−0.181.351.351.0:1.0:7.5:7.5
1.013.93−0.51−0.514.634.621.0:1.0:9.1:9.1
51LDJ0.14.150.020.02−0.43−0.431.0:1.0:21.5:21.5
0.54.150.040.04−0.83−0.831.0:1.0:20.8:20.8
1.04.160.070.07−2.49−2.491.0:1.0:35.6:35.6
Note: Uy denotes y-direction displacement, and Ux denotes x-direction displacement. The N2 y-direction displacement is taken as the unit of measurement, with all other displacements compared to it.
Table 4. Comparison of model shear forces on each axis at different times.
ModelWorking Conditions/gTime/sF(×103)/kNRatio
Tianyi HotelSC.T22710.114.87−0.15−0.07−1.34-2.1:1.0:19.1
0.514.16−0.45−0.21−2.79-2.1:1.0:13.3
51LDJ0.14.120.110.050.90-2.2:1.0:18.0
0.54.130.500.232.71-2.2:1.0:11.8
Elementary school dormitorySC.T22710.113.910.420.200.210.392.1:1.0:1.1:2.0
0.513.921.941.131.201.801.7:1.0:1.1:1.6
1.013.932.571.811.822.381.4:1.0:1.0:1.3
51LDJ0.14.15−0.73−0.34−0.36−0.682.1:1.0:1.1:2.0
0.54.15−2.56−1.79−1.80−2.371.4:1.0:1.0:1.3
1.04.16−3.05−2.14−2.20−2.801.4:1.0:1.0:1.3
Table 5. Mechanical properties of materials/MPa.
ModelfcuEcfy,cfu,cEsfy,bfu,bfy,sfu,s
PF17.6420,492150260197,000474636160201
WALL---
Table 6. Characteristics of the models’ skeleton curves.
ModelPcr/kNΔcr/mmPy/kNΔy/mmPmax/kNΔmax/mmPu/kNΔu/mmη1η2
Wall162.692.55136.441.44181.925.00154.647.06--
PF45.545.7642.565.0056.7515.8048.2347.7910%75%
Note: Pcr is the cracking load; Δcr is the cracking displacement; Py is the yield load; Δy is the yield displacement; Pmax is the maximum load; Δmax is the displacement corresponding to the maximum load; Pu is the ultimate load; Δu is the ultimate displacement. η1 is the ratio of this displacement to the ultimate displacement of the PF model when Δ = 5.00 mm (the maximum load-bearing displacement Δmax of the wall model). η2 is the ratio of the shear force for the PF model to its maximum load capacity when Δ = 5.00 mm.
Table 7. Building classifications.
No.CategoryBuildingsCombinationTypeStatus
1INo. 7, group 1, Detuo TownPF + wallAsymmetryDamaged
2IIFormer Minya Konka school dormitoryWall + wallSymmetryUndamaged
3IIIA frame under constructionPF + PFUndamaged
Disclaimer/Publisher’s Note: The statements, opinions and data contained in all publications are solely those of the individual author(s) and contributor(s) and not of MDPI and/or the editor(s). MDPI and/or the editor(s) disclaim responsibility for any injury to people or property resulting from any ideas, methods, instructions or products referred to in the content.