
Material Properties and Mechanical Performances of Manufactured Factory-Produced Glass Fiber-Reinforced Autoclaved Aerated Concrete Panel


Abstract
1. Introduction
2. Materials and Methods
2.1. Mix Design
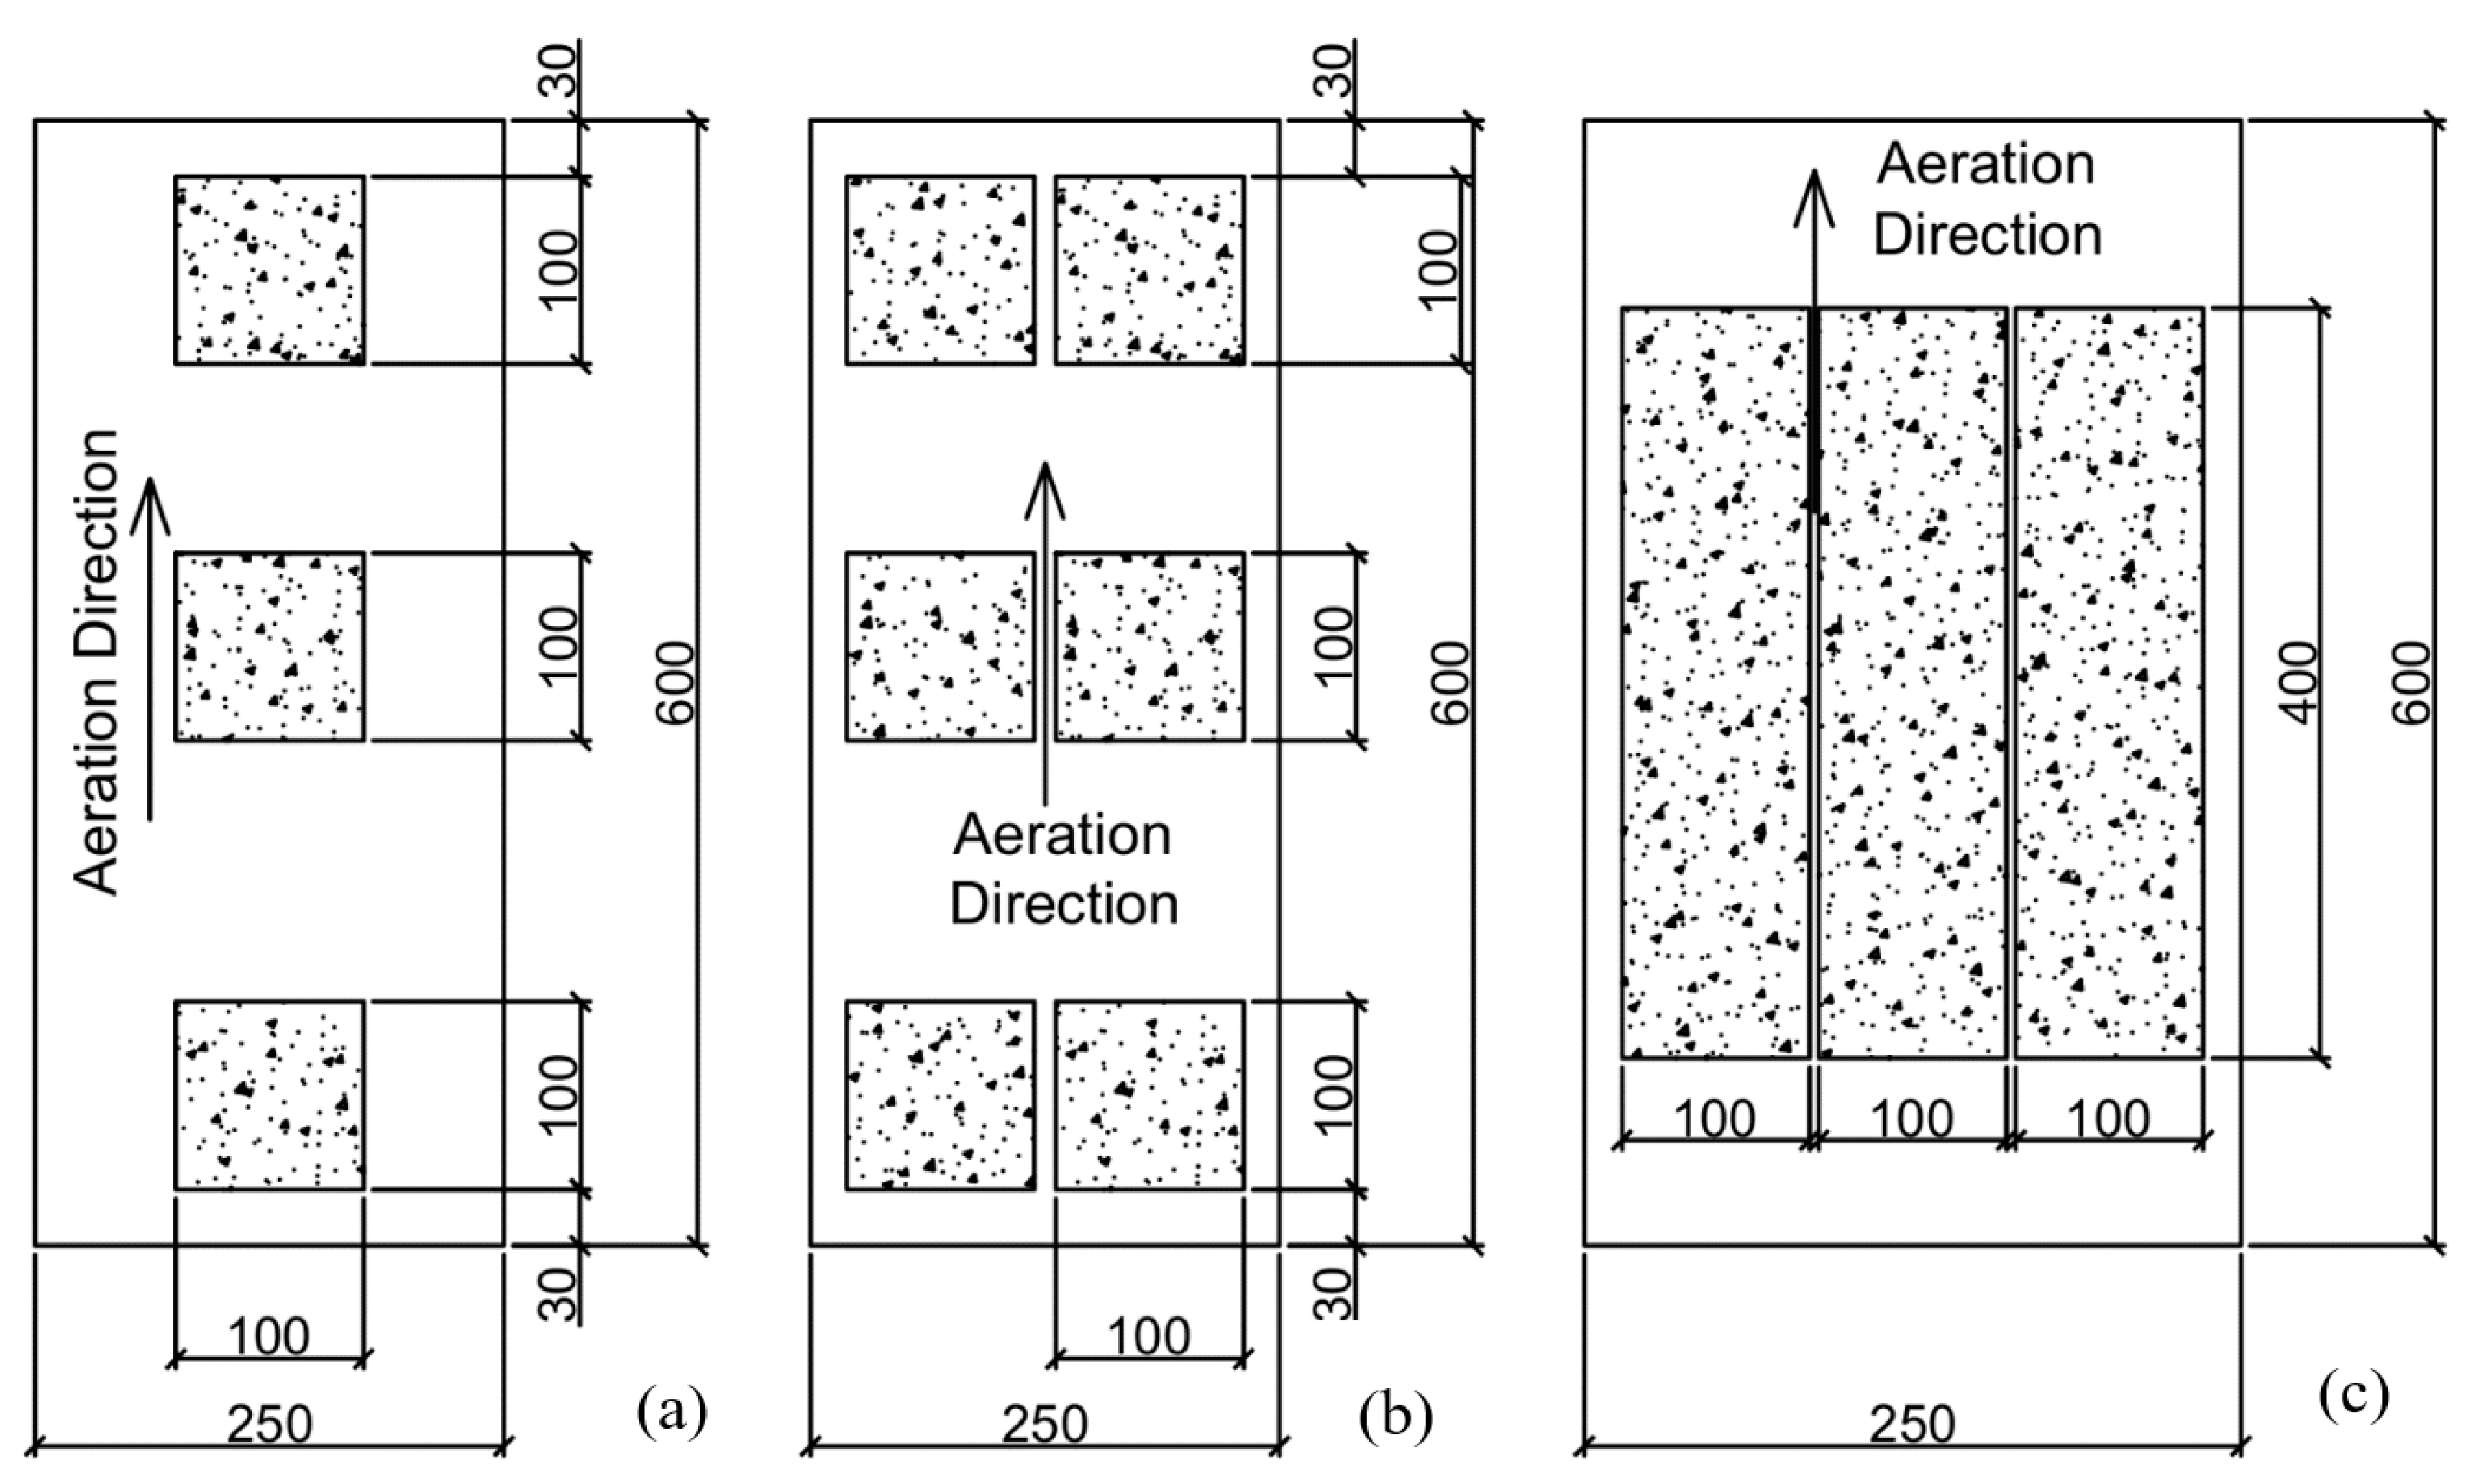
2.2. Specimen Preparation
2.3. Dry Density and Water Absorption
2.4. Compressive Strength Tests
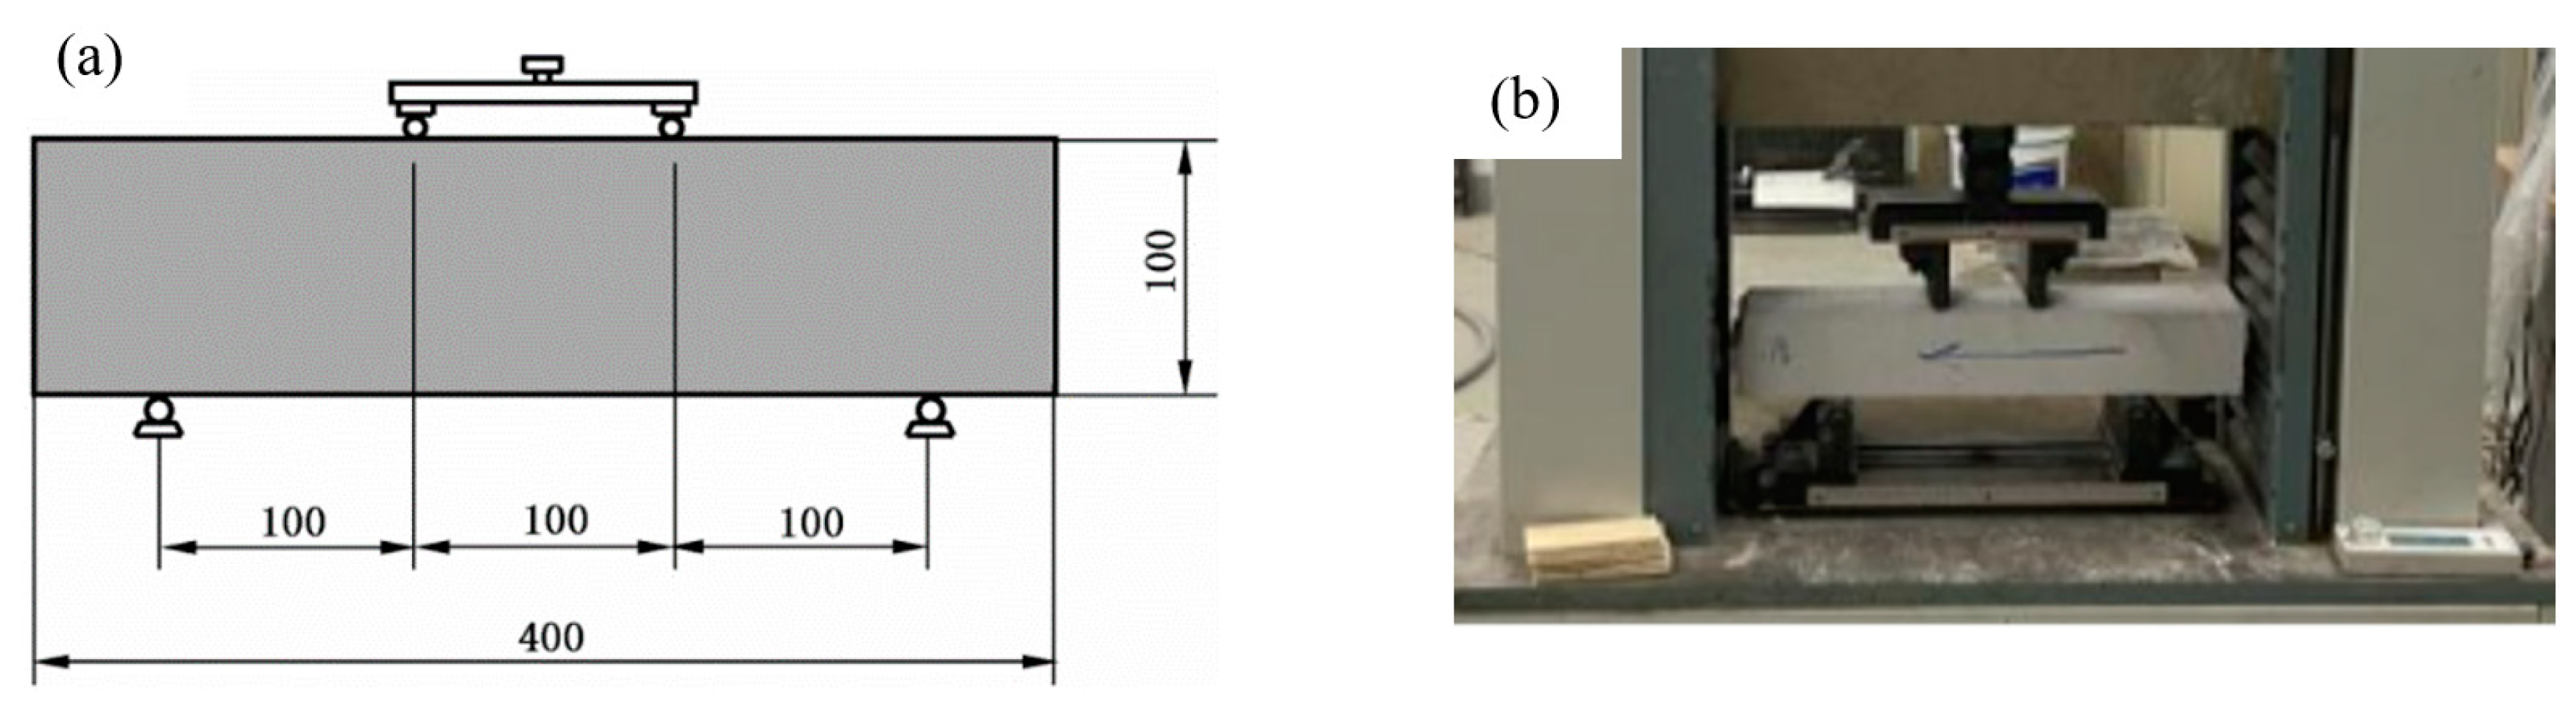
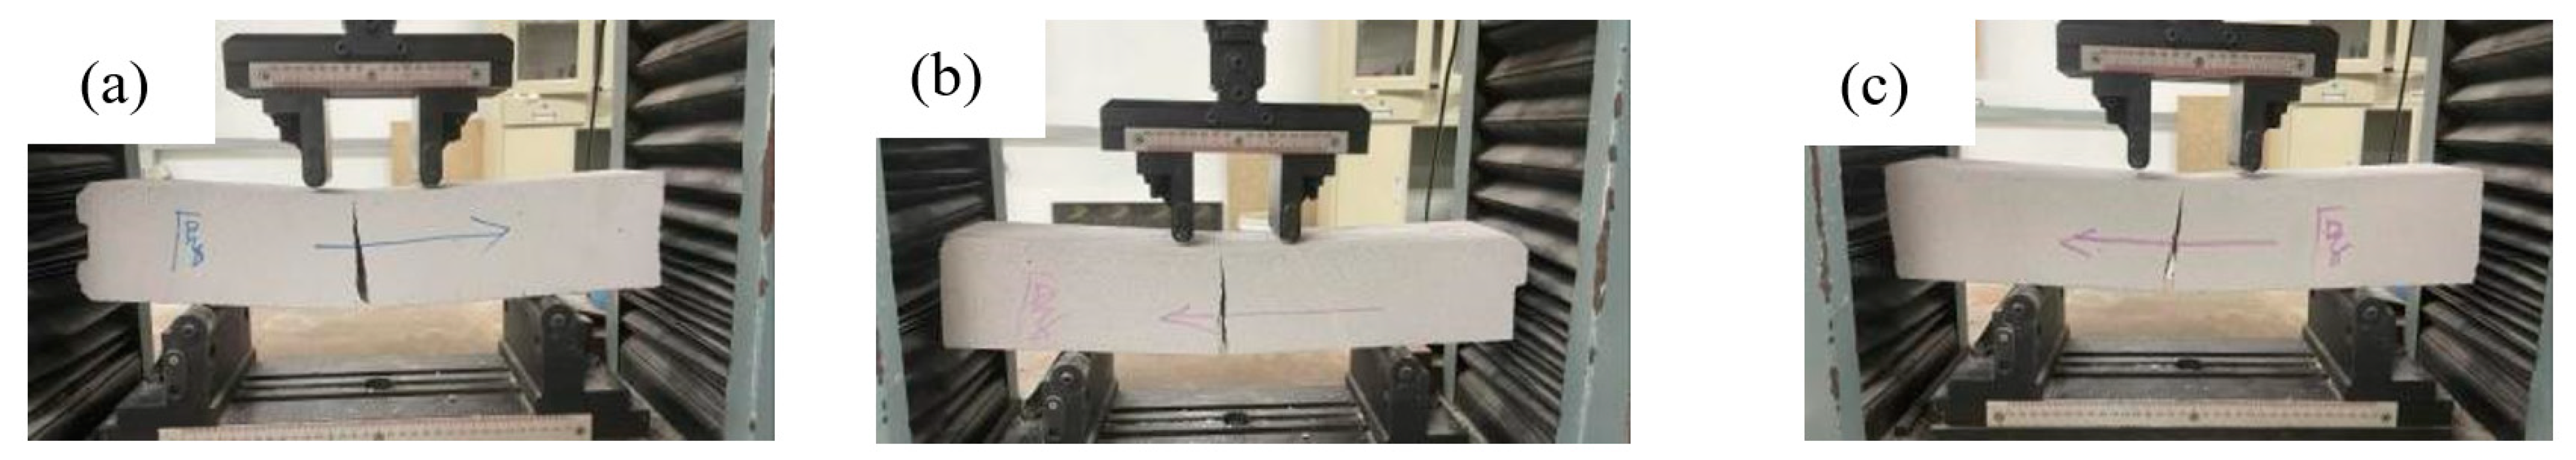
2.5. Flexural Strength Tests
3. Material Properties
3.1. Dry Densities and Water Absorptions
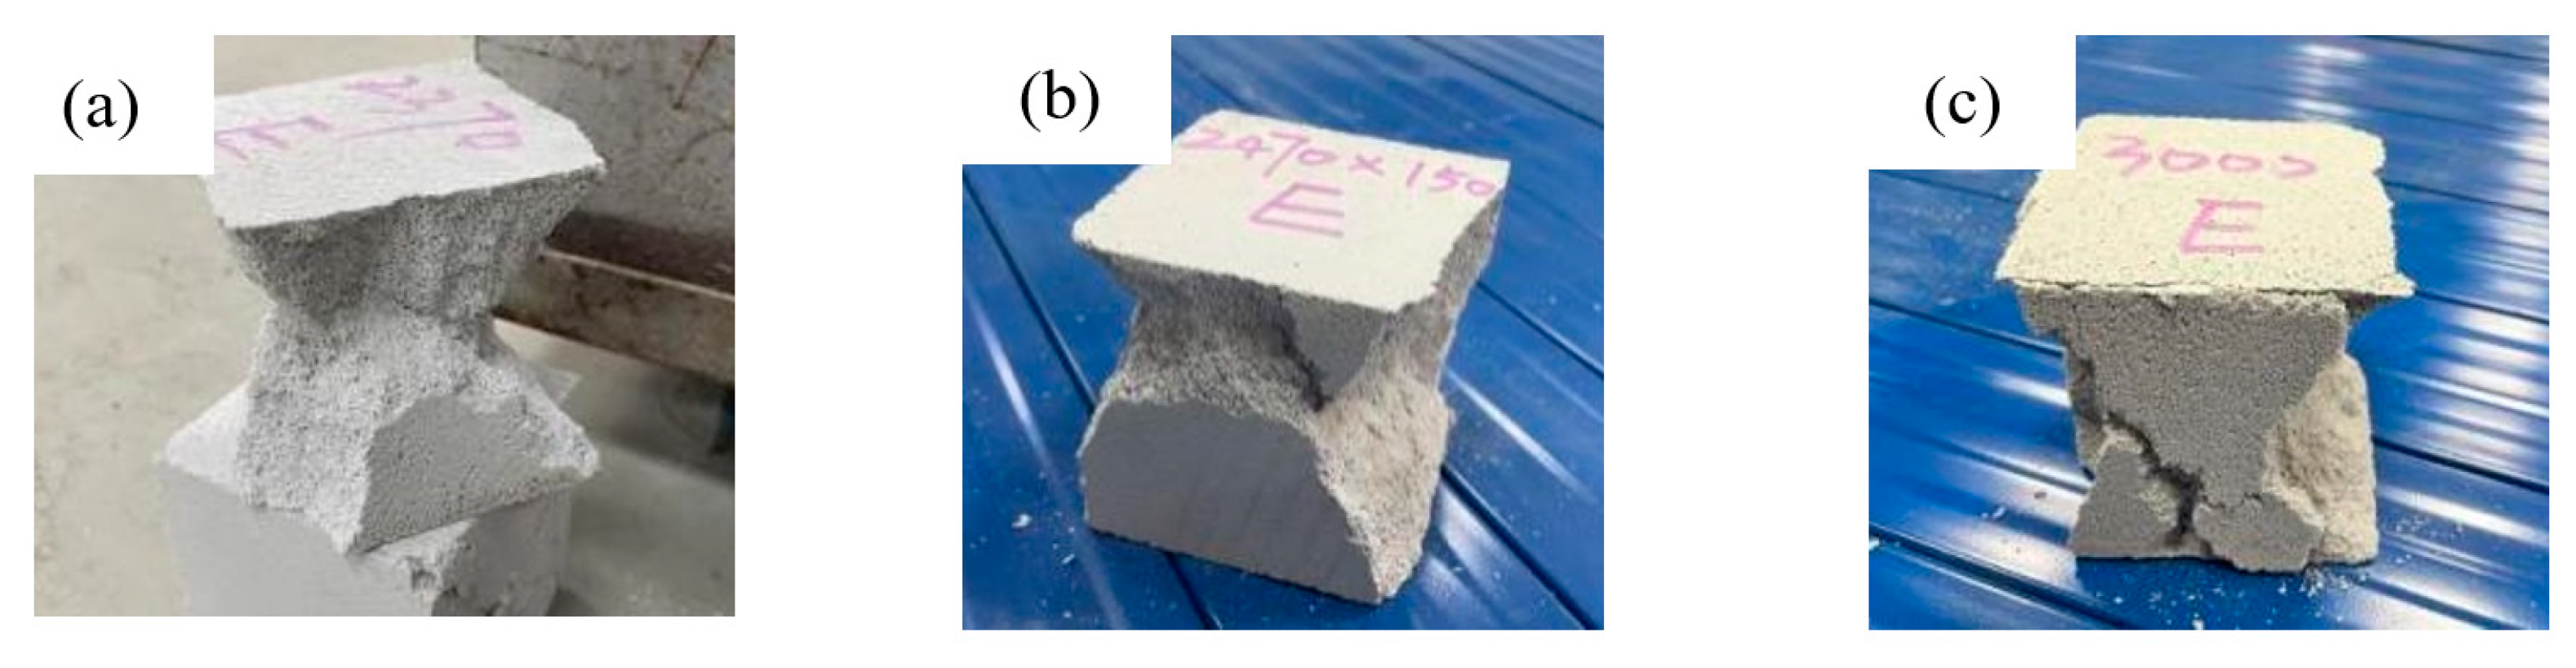
3.2. Compressive Strengths
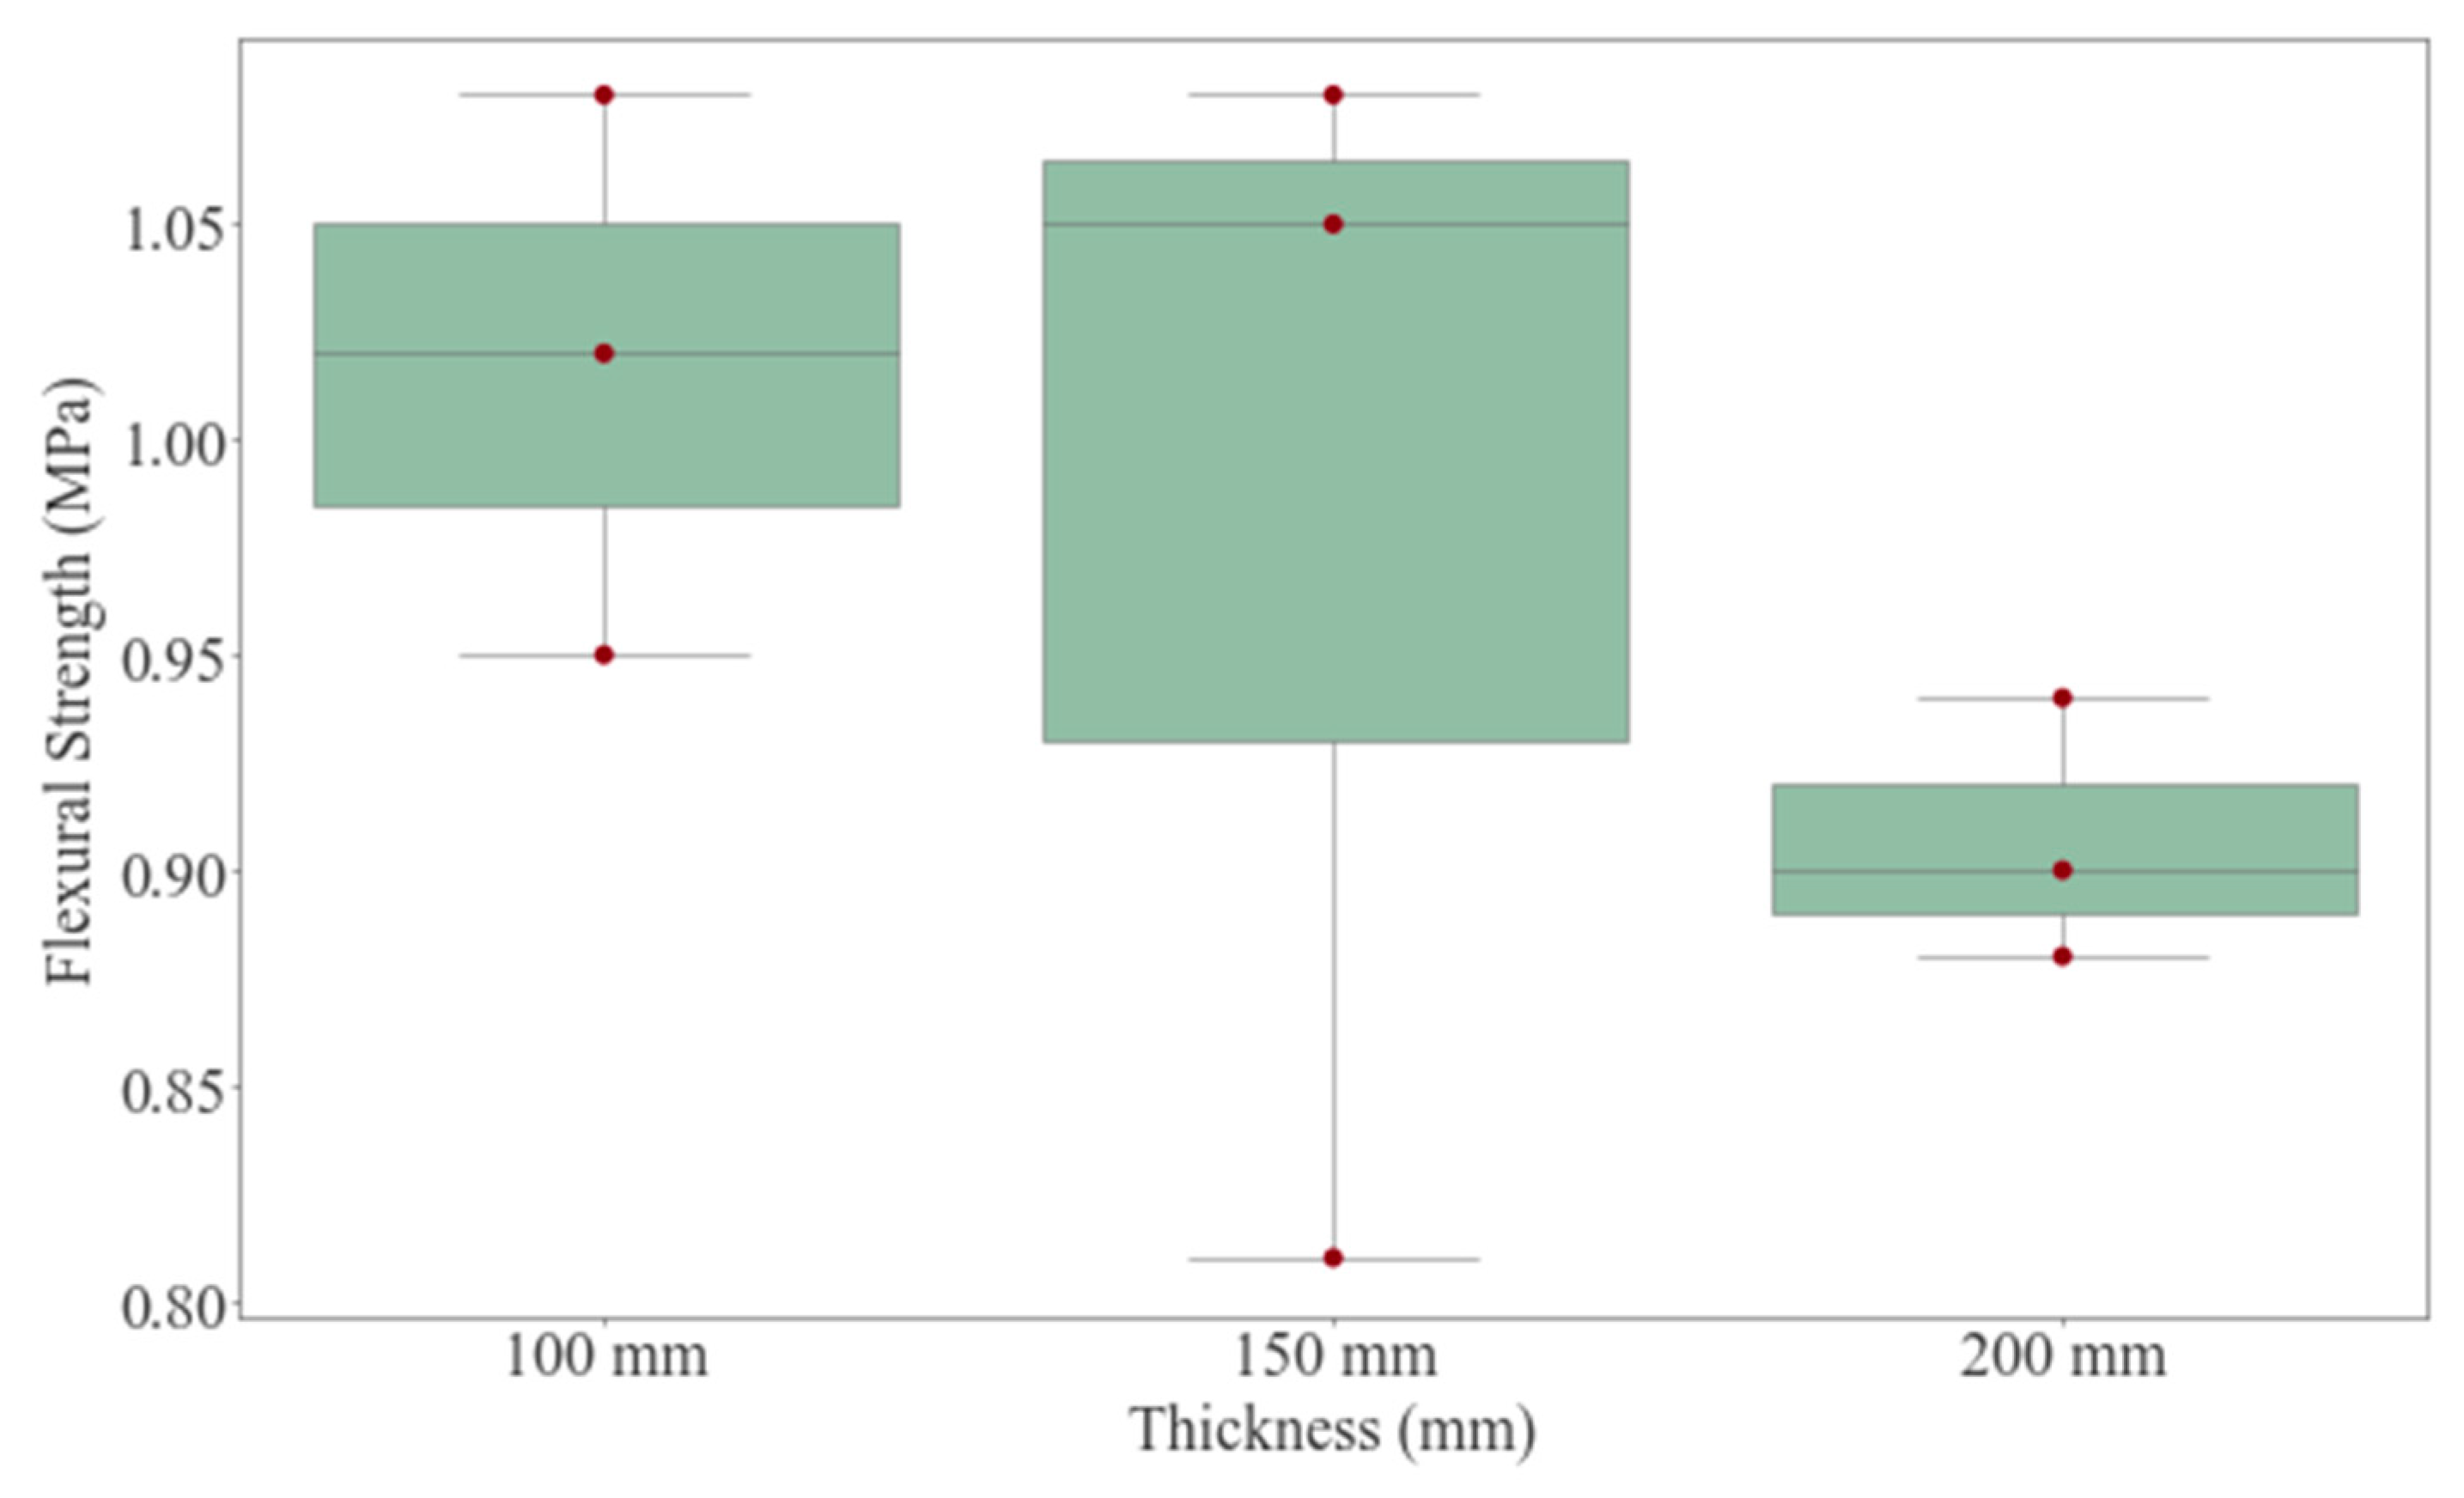
3.3. Flexural Strengths
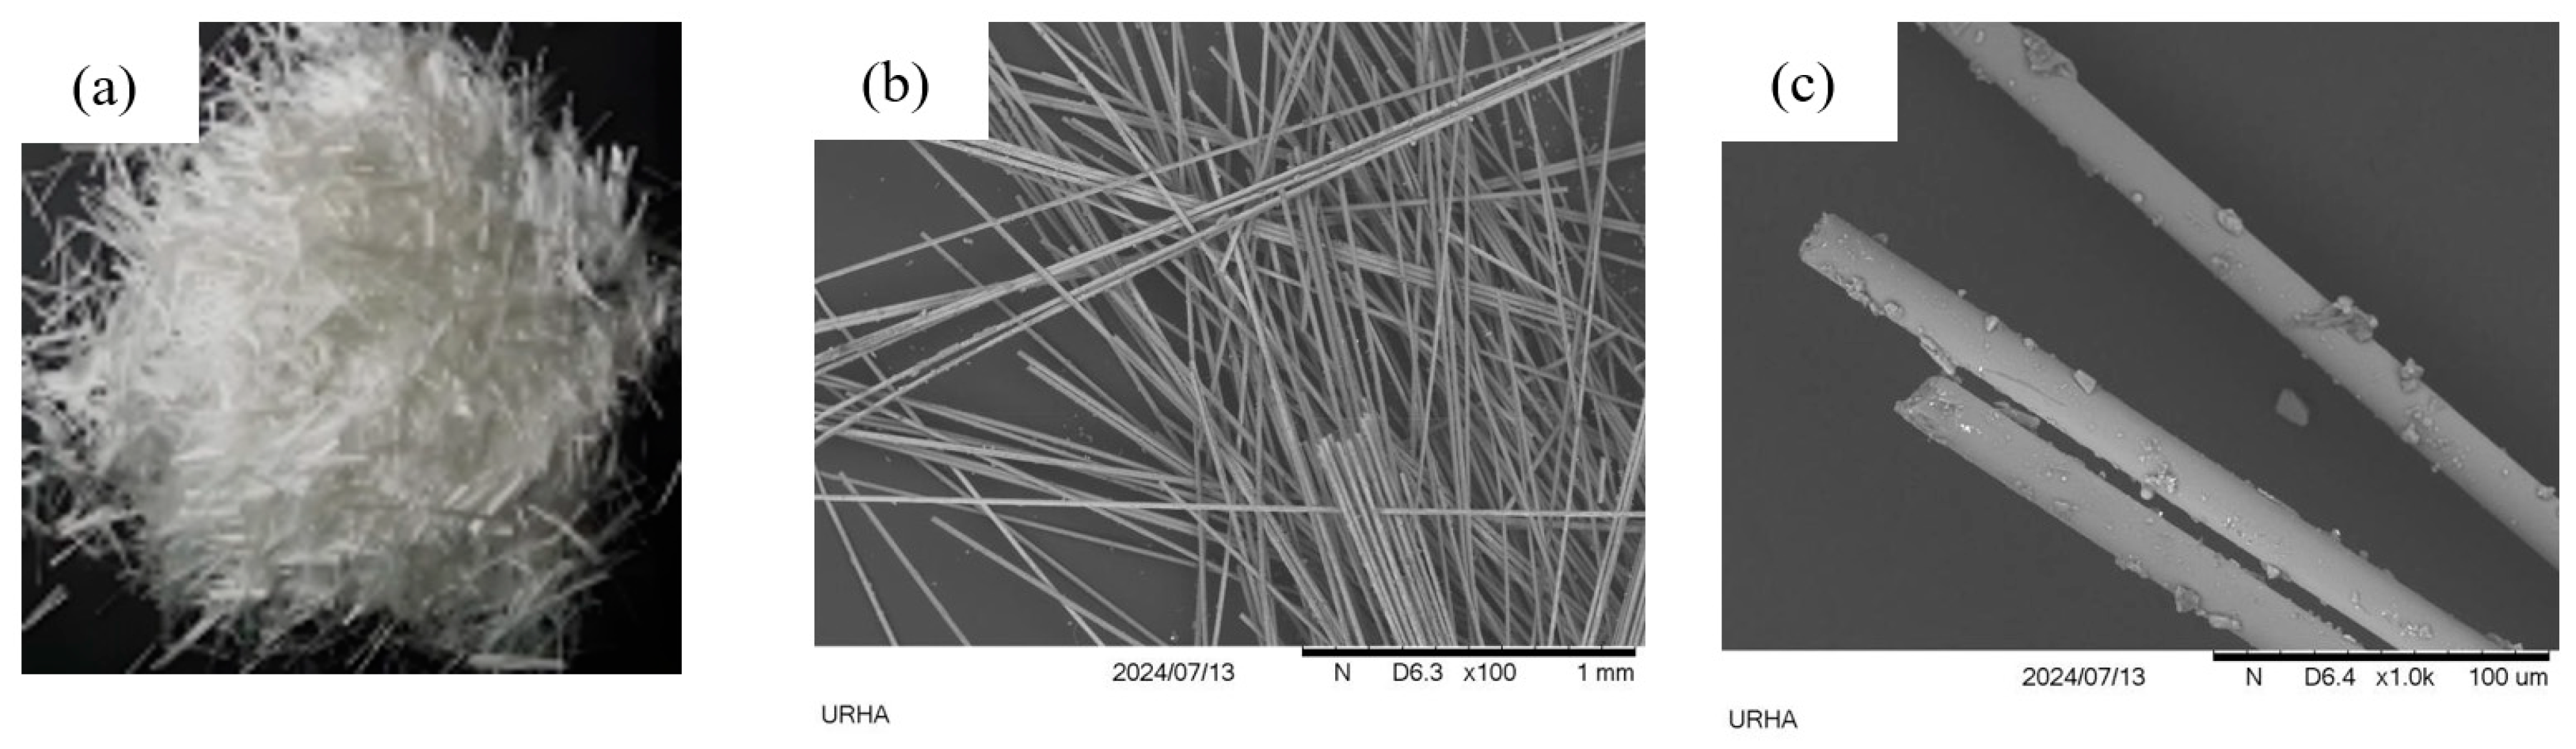
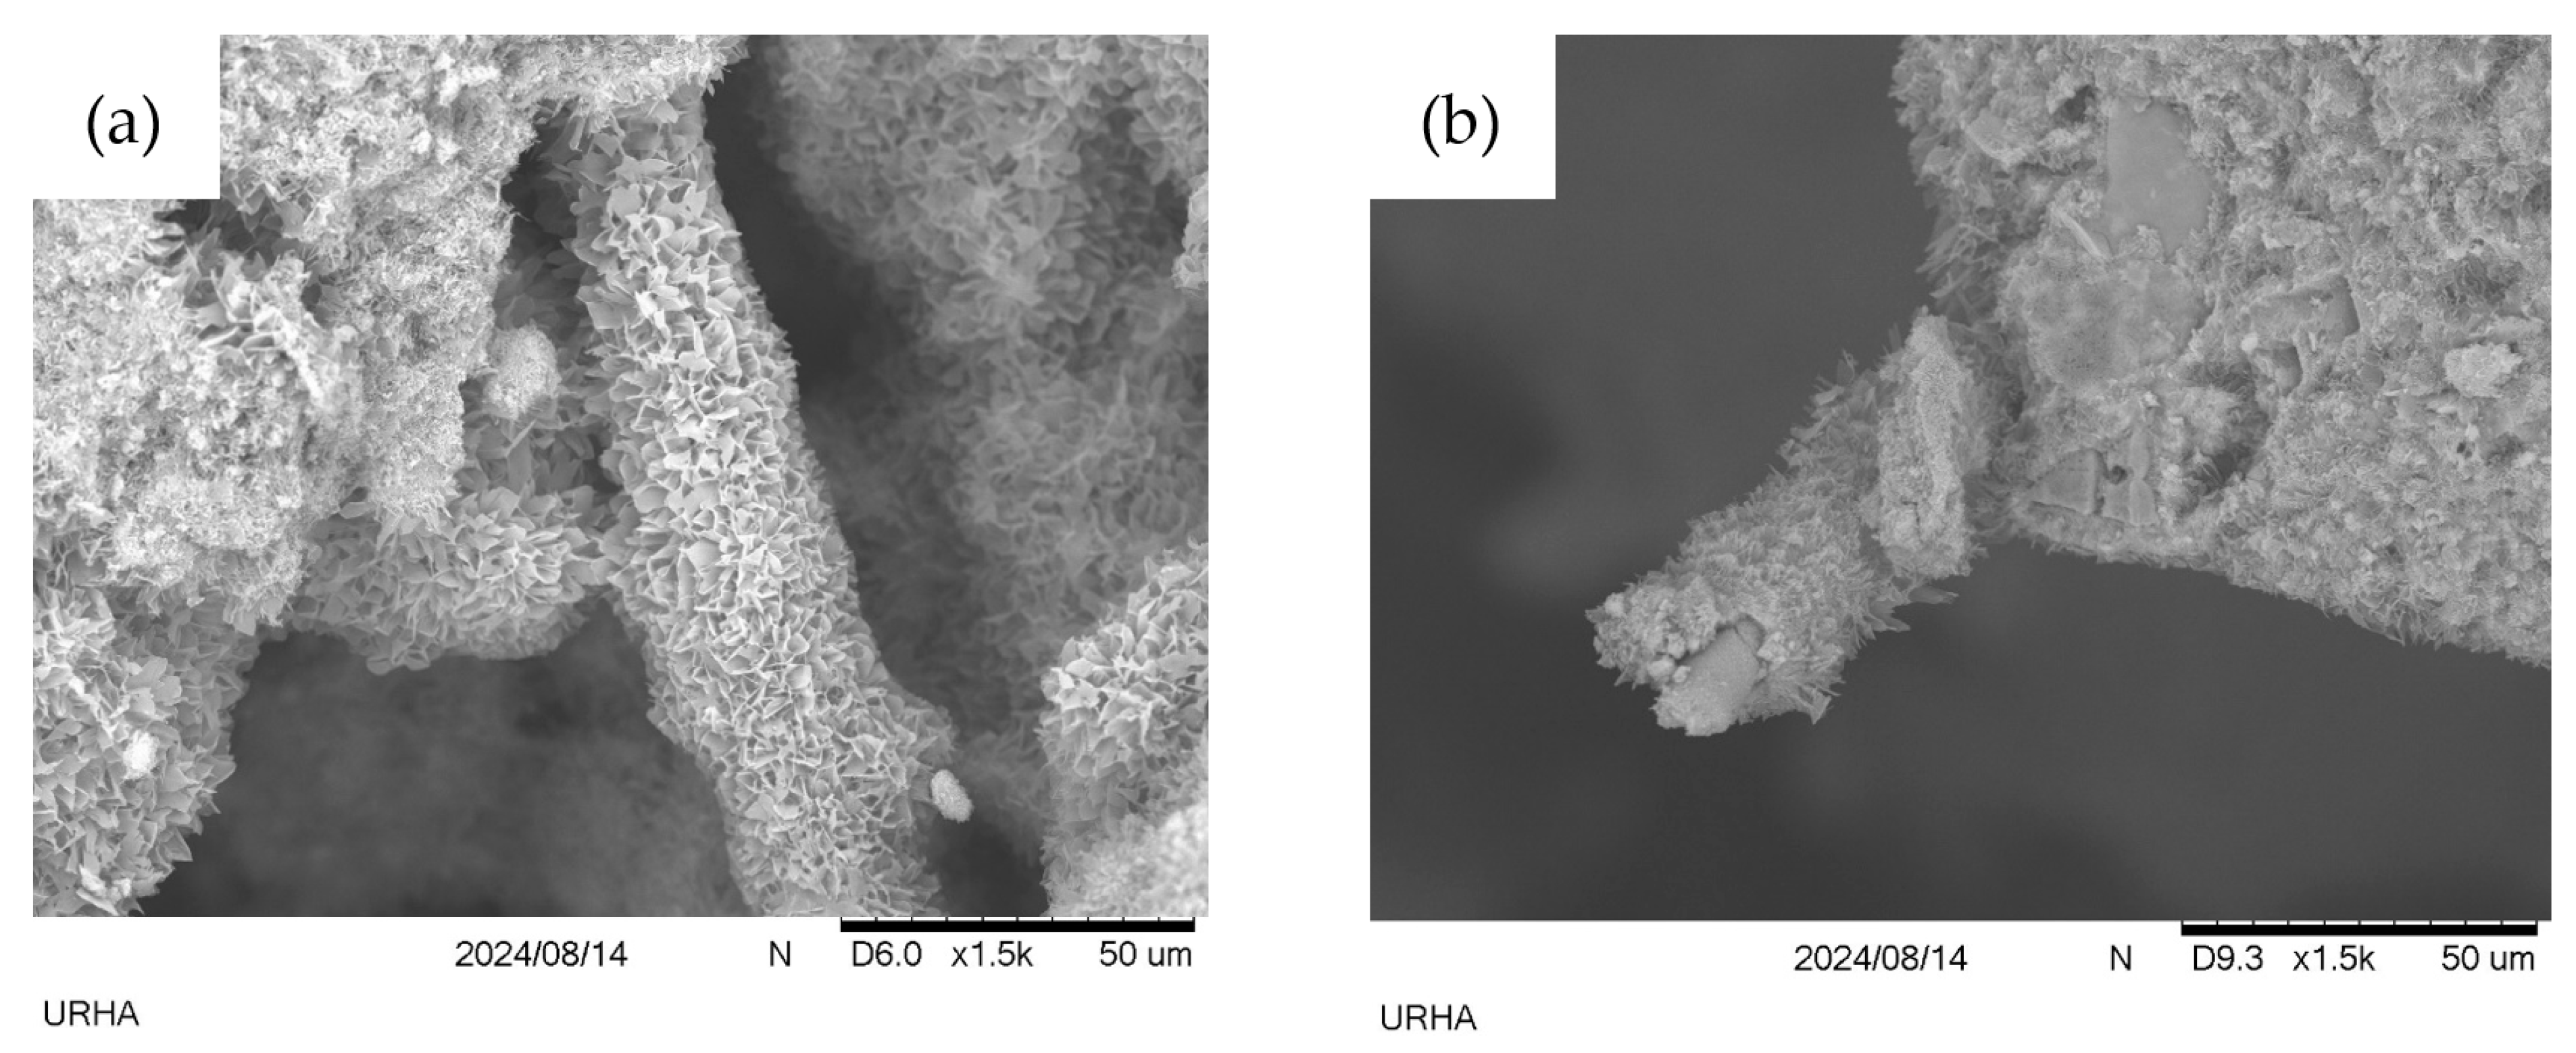
3.4. Scanning Electron Microscope Analyses of Material after the Flexural Strength Tests
4. Static Loading
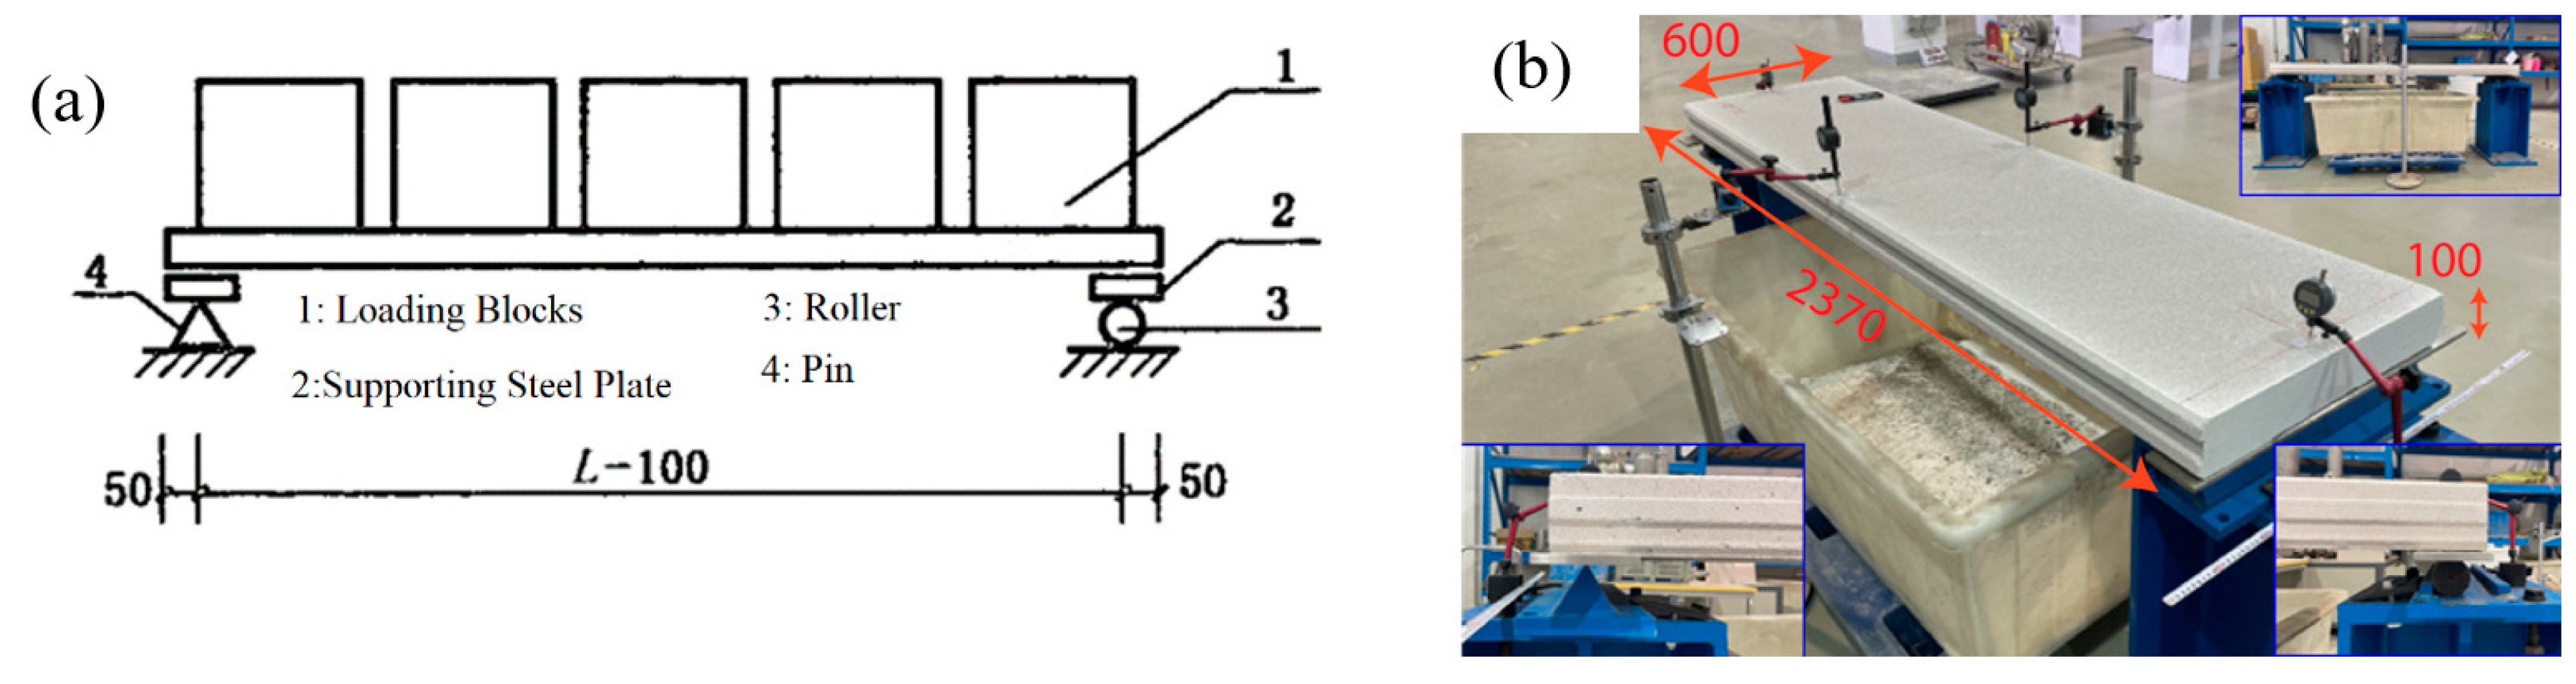
4.1. Test Setup
4.2. Testing Results
4.3. Comparison with Steel-Reinforced AAC Panels (SR-AAC)
5. Impact Tests
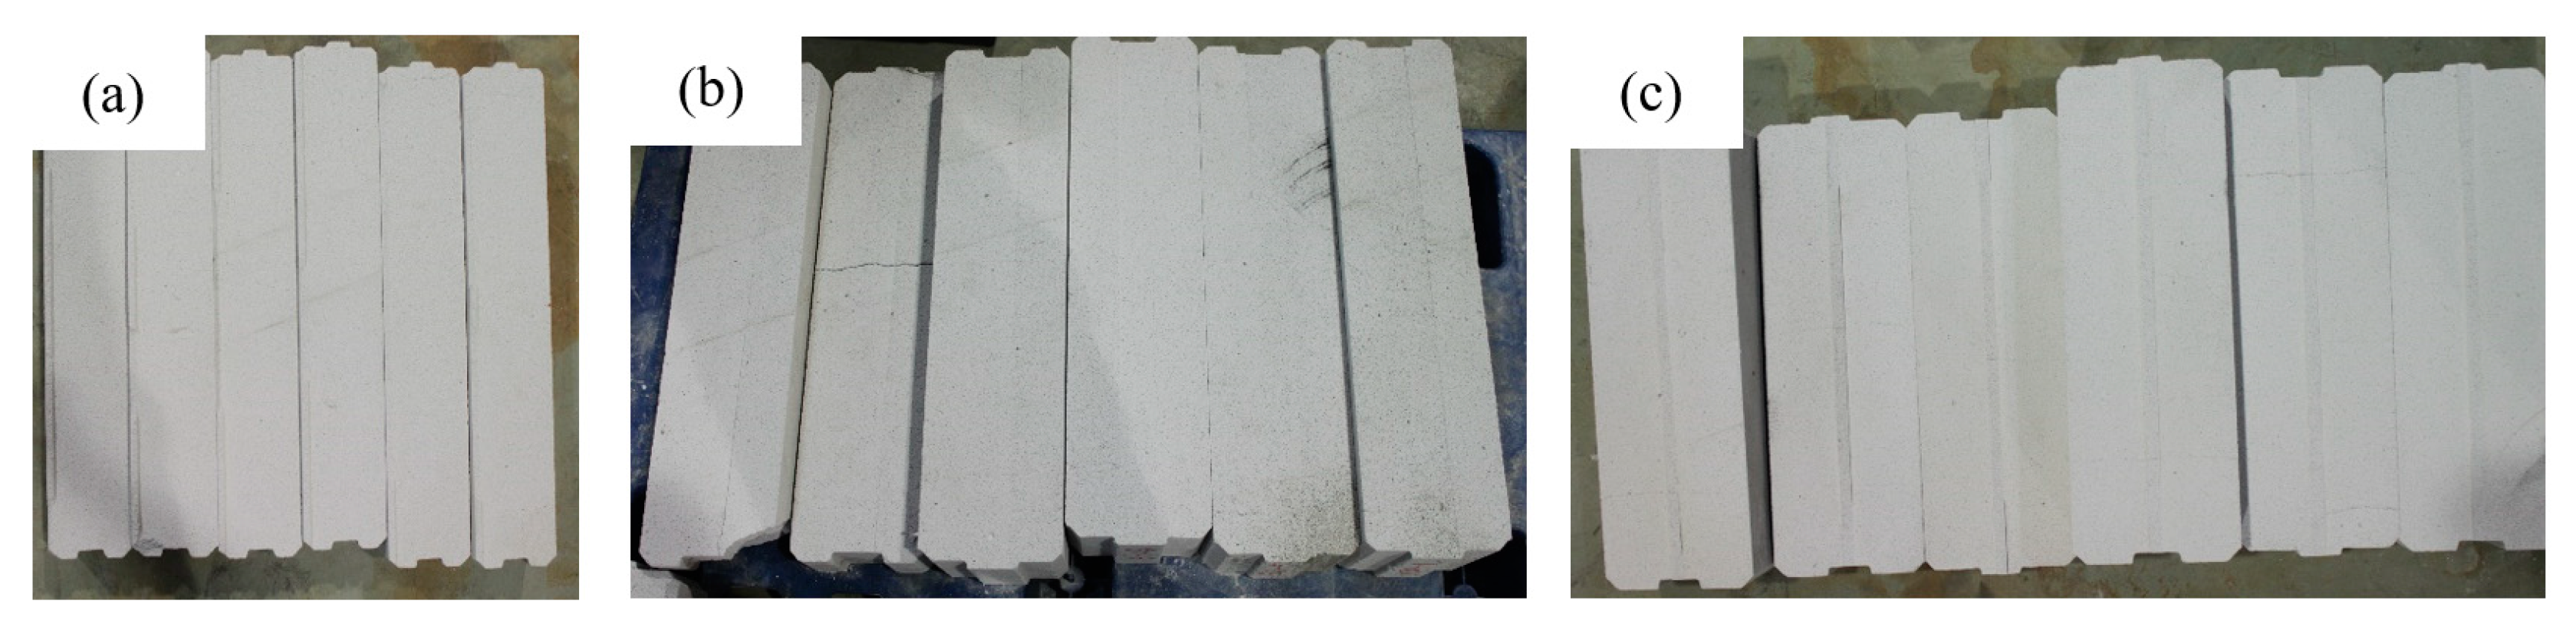
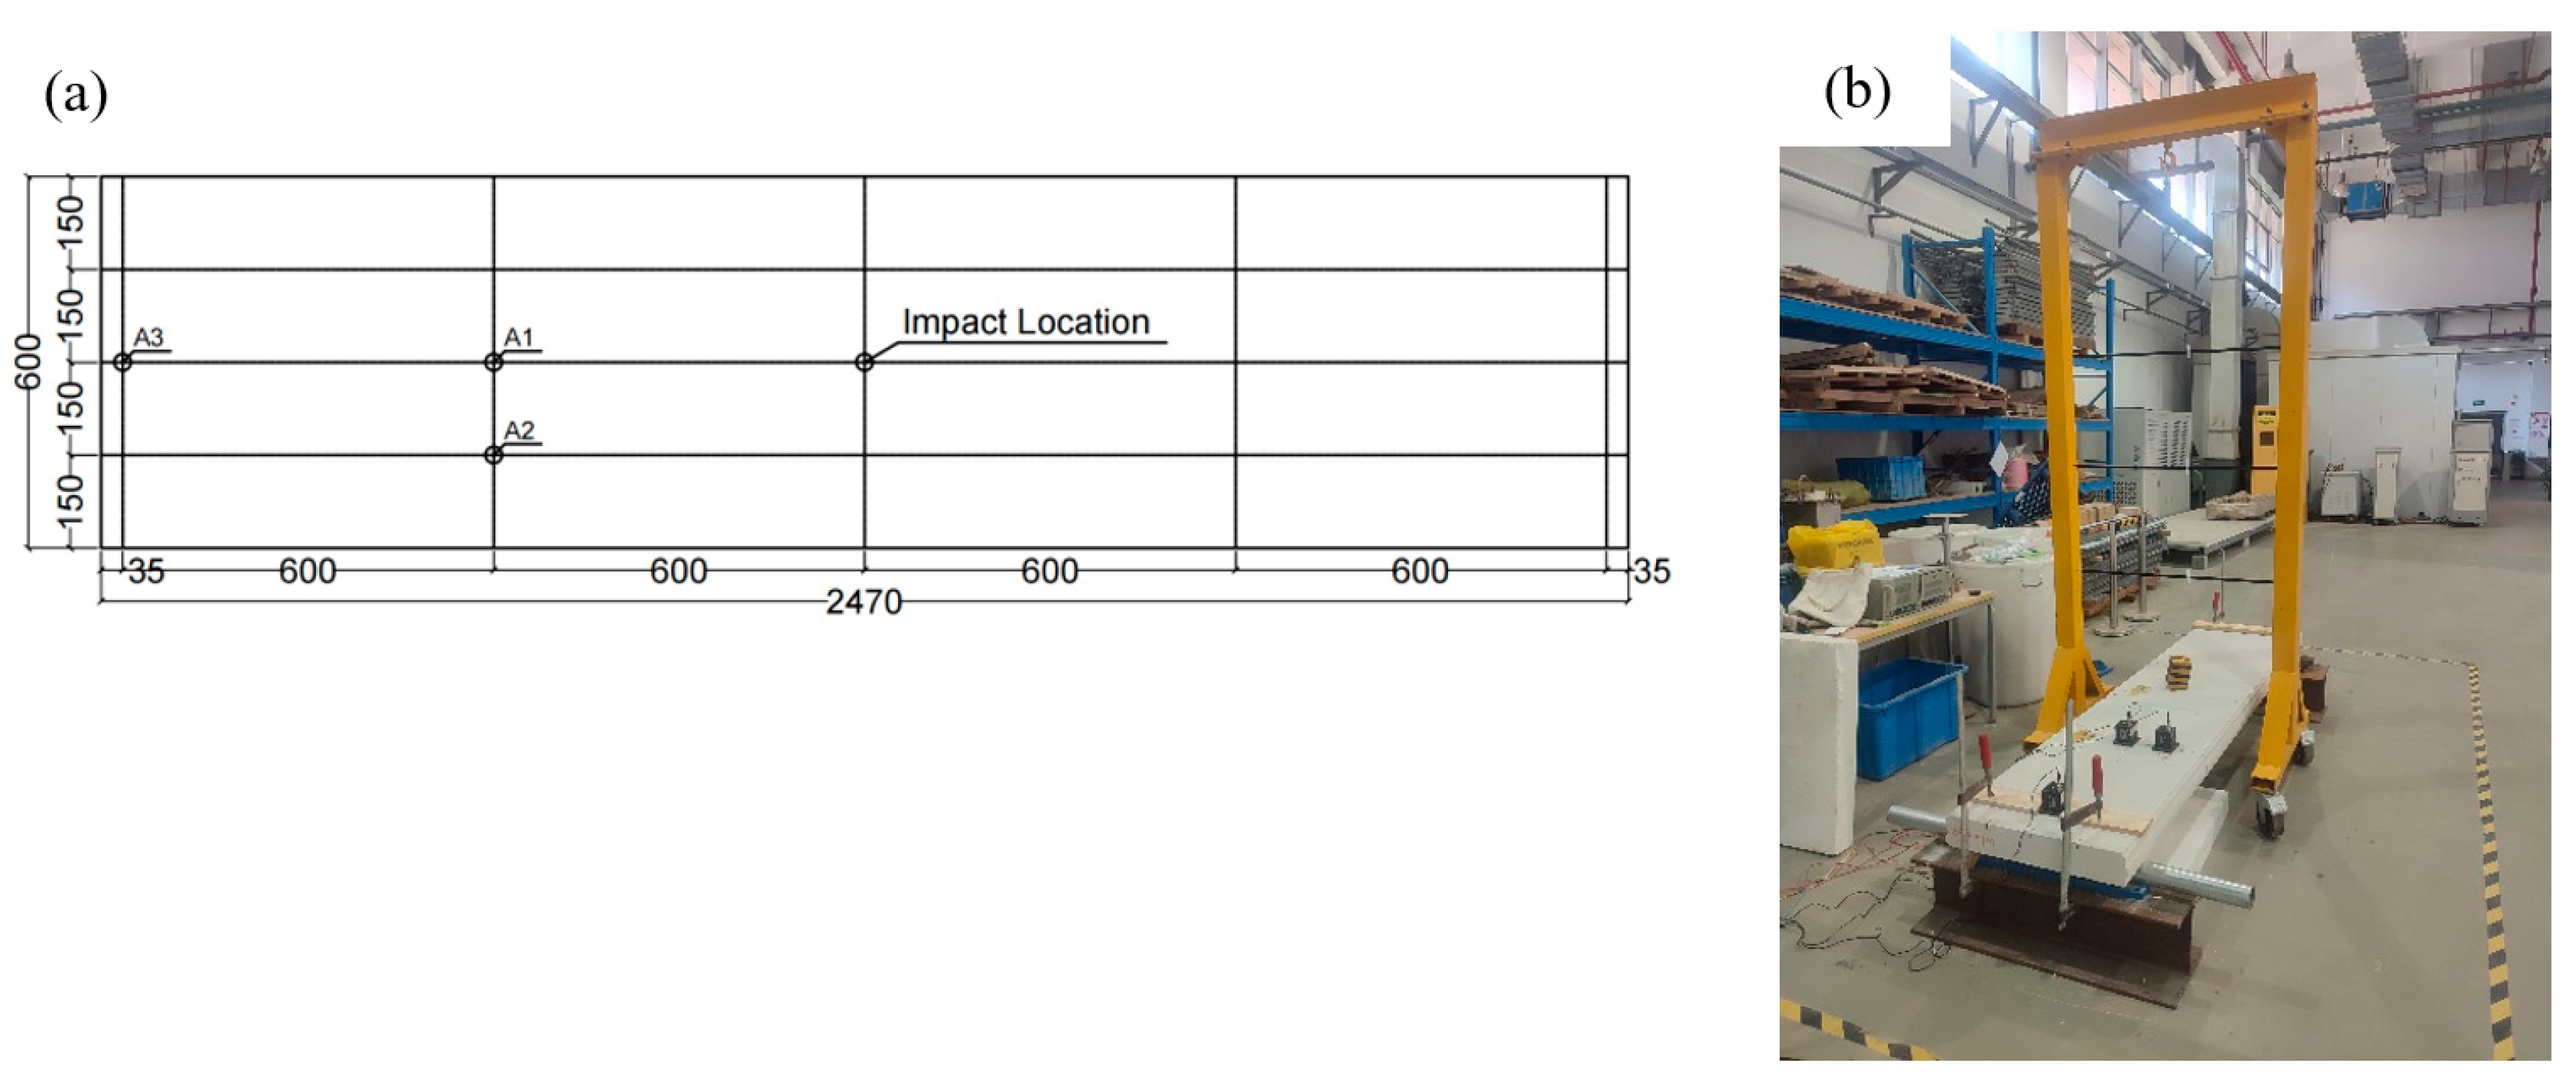
5.1. Single Panel Tests
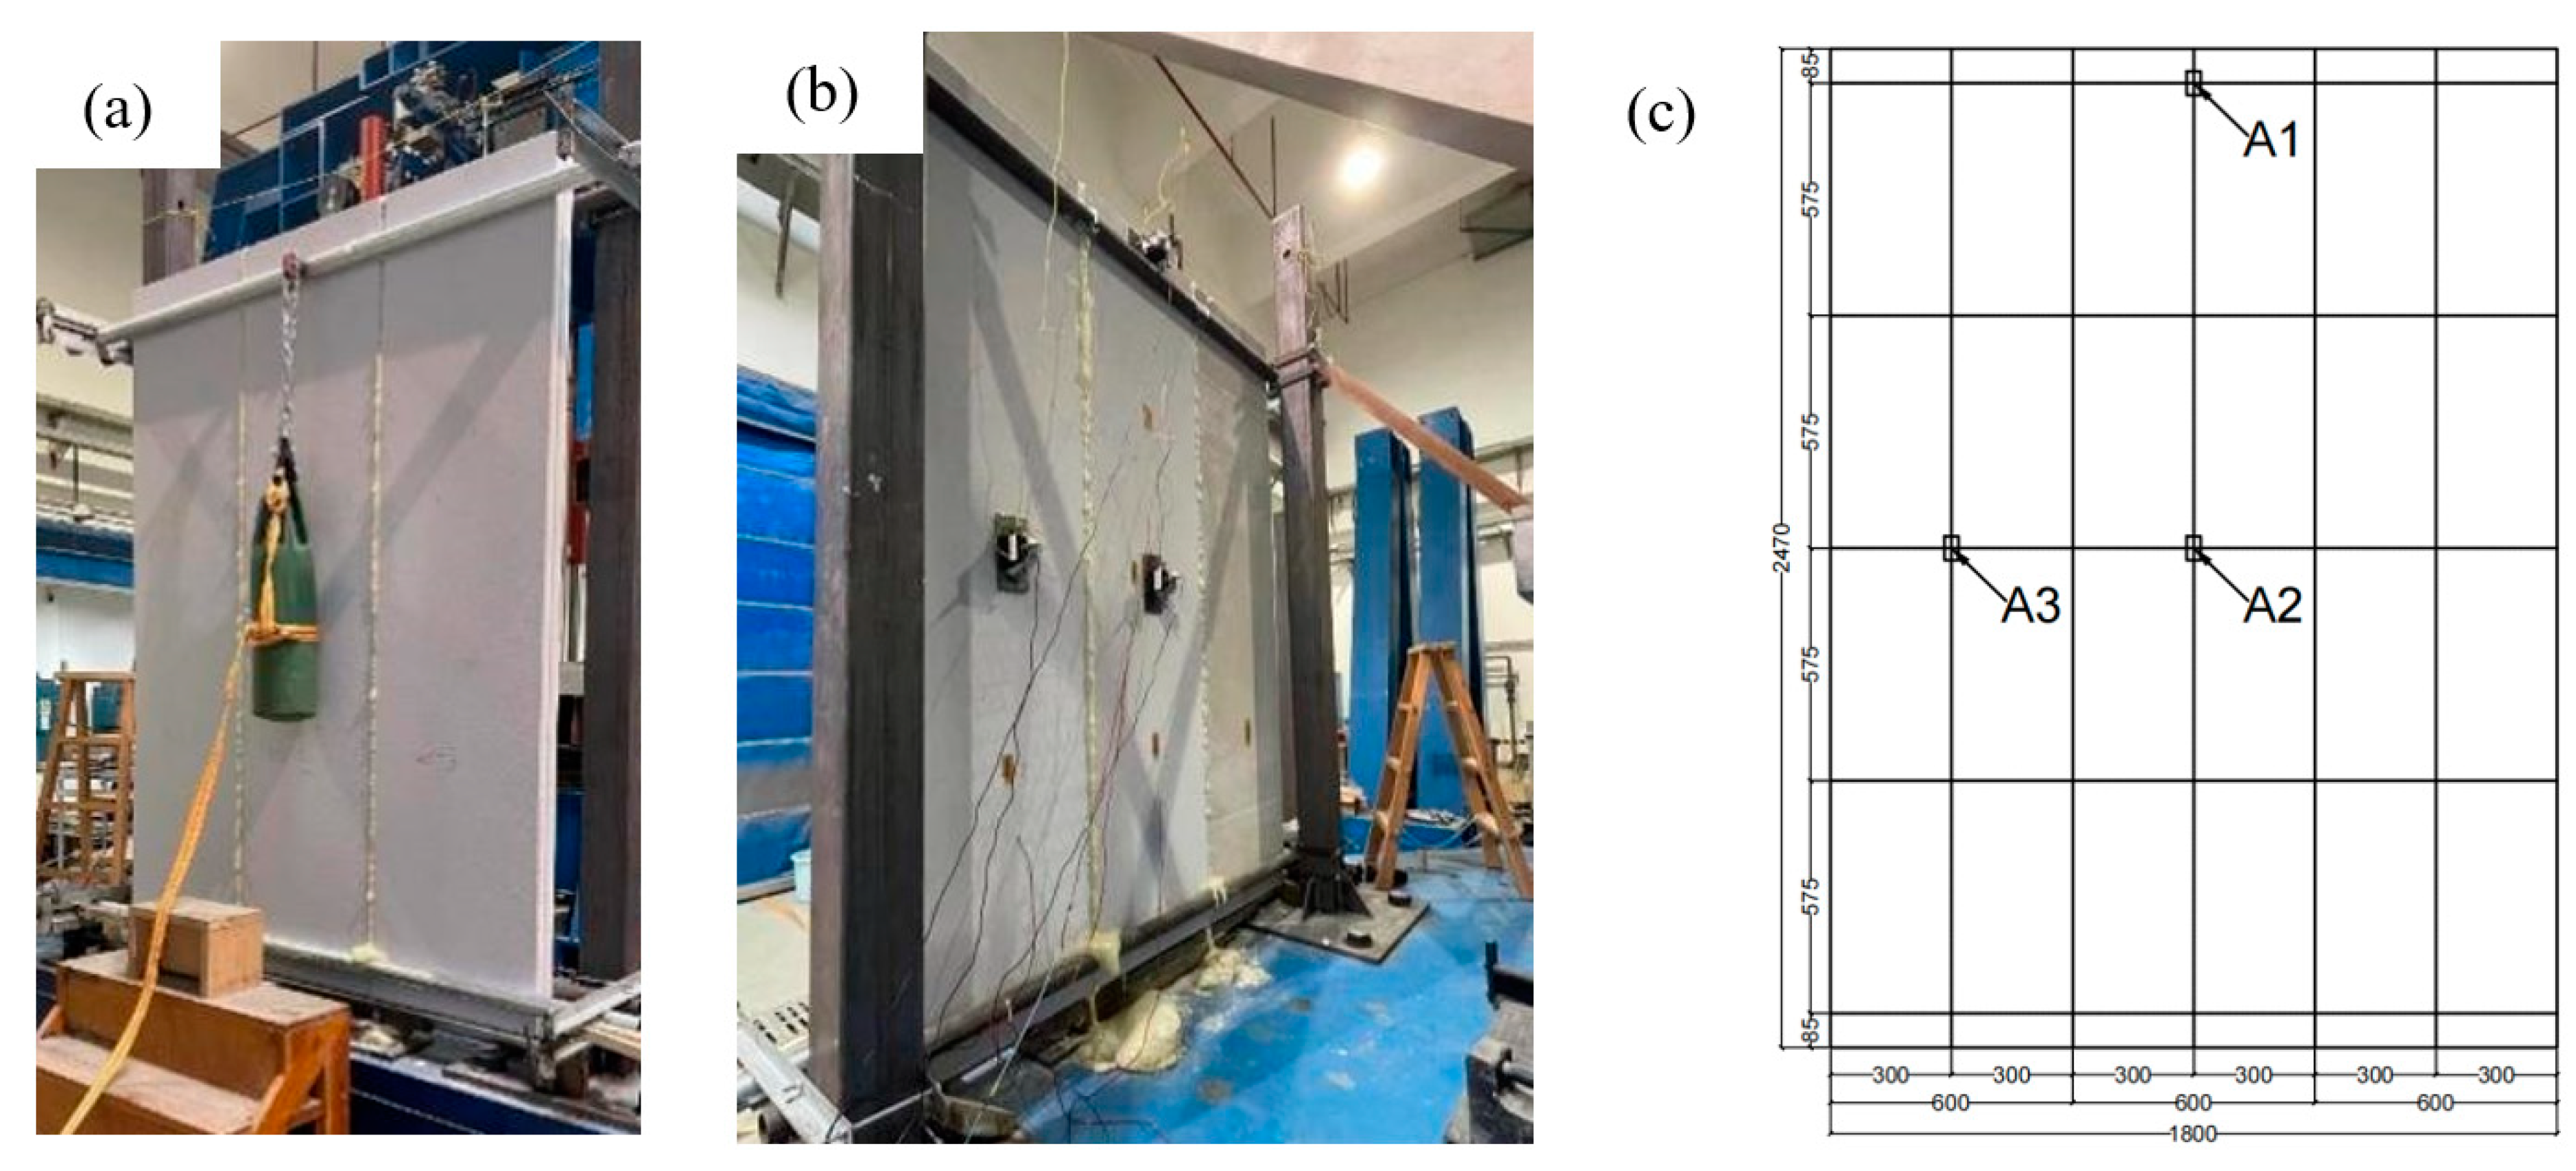
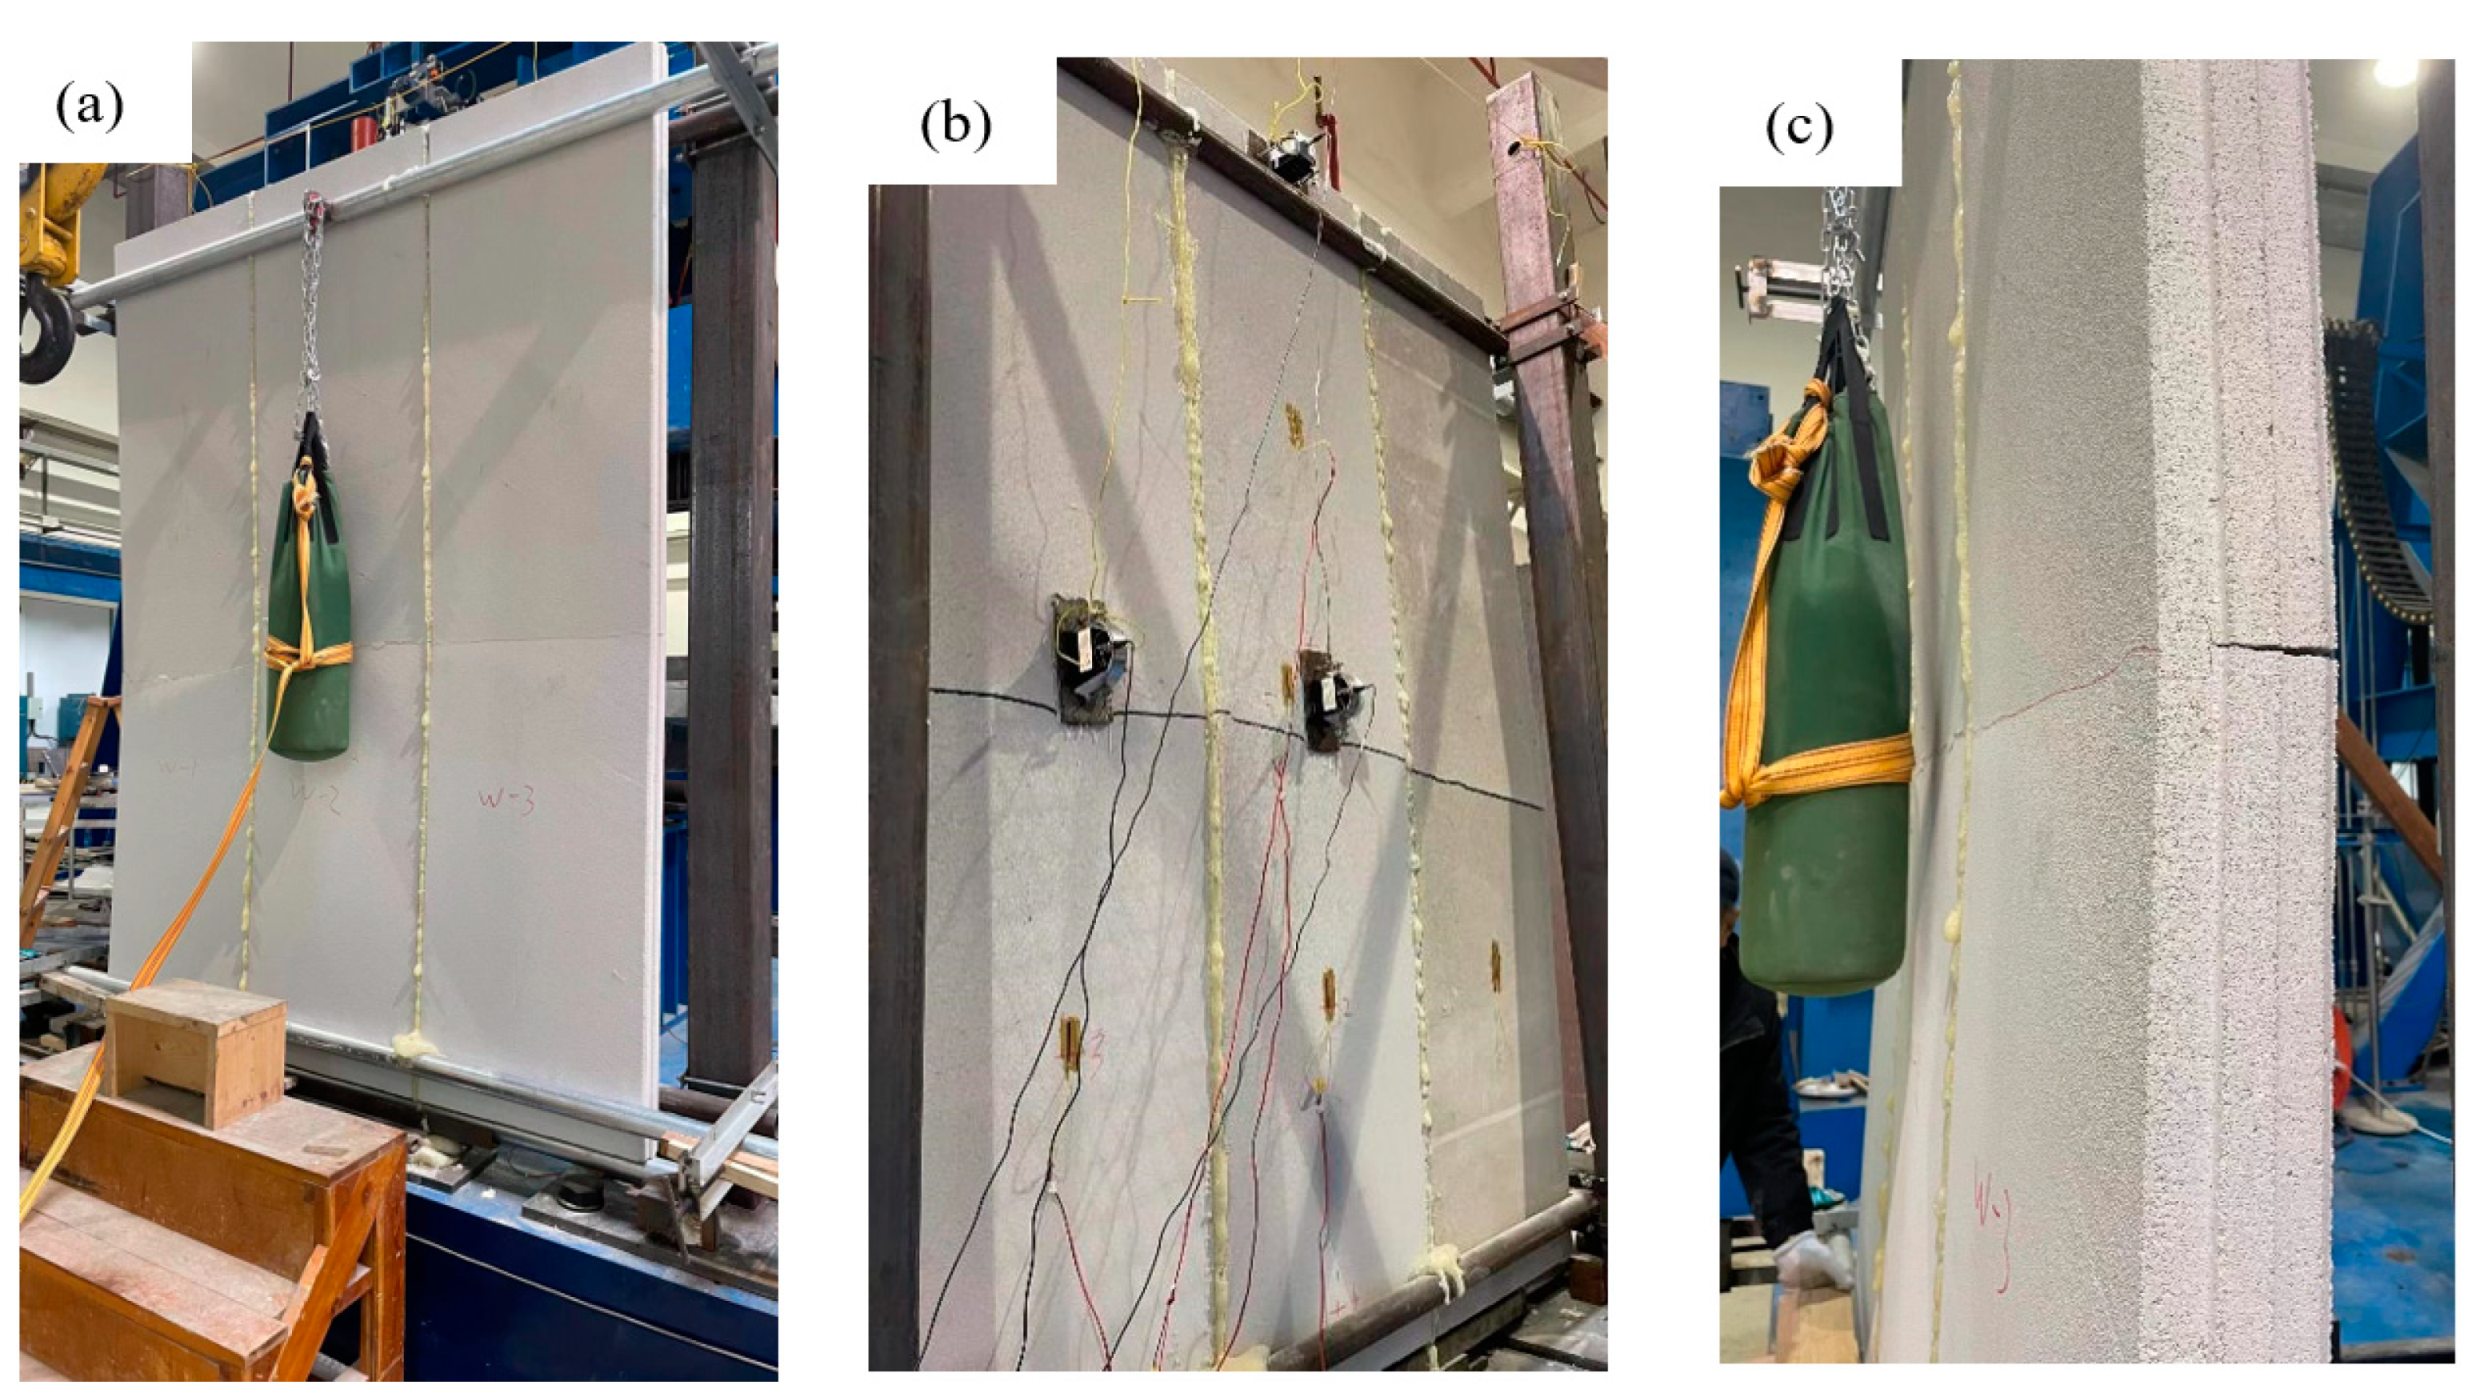
5.2. Assembled Wall Tests
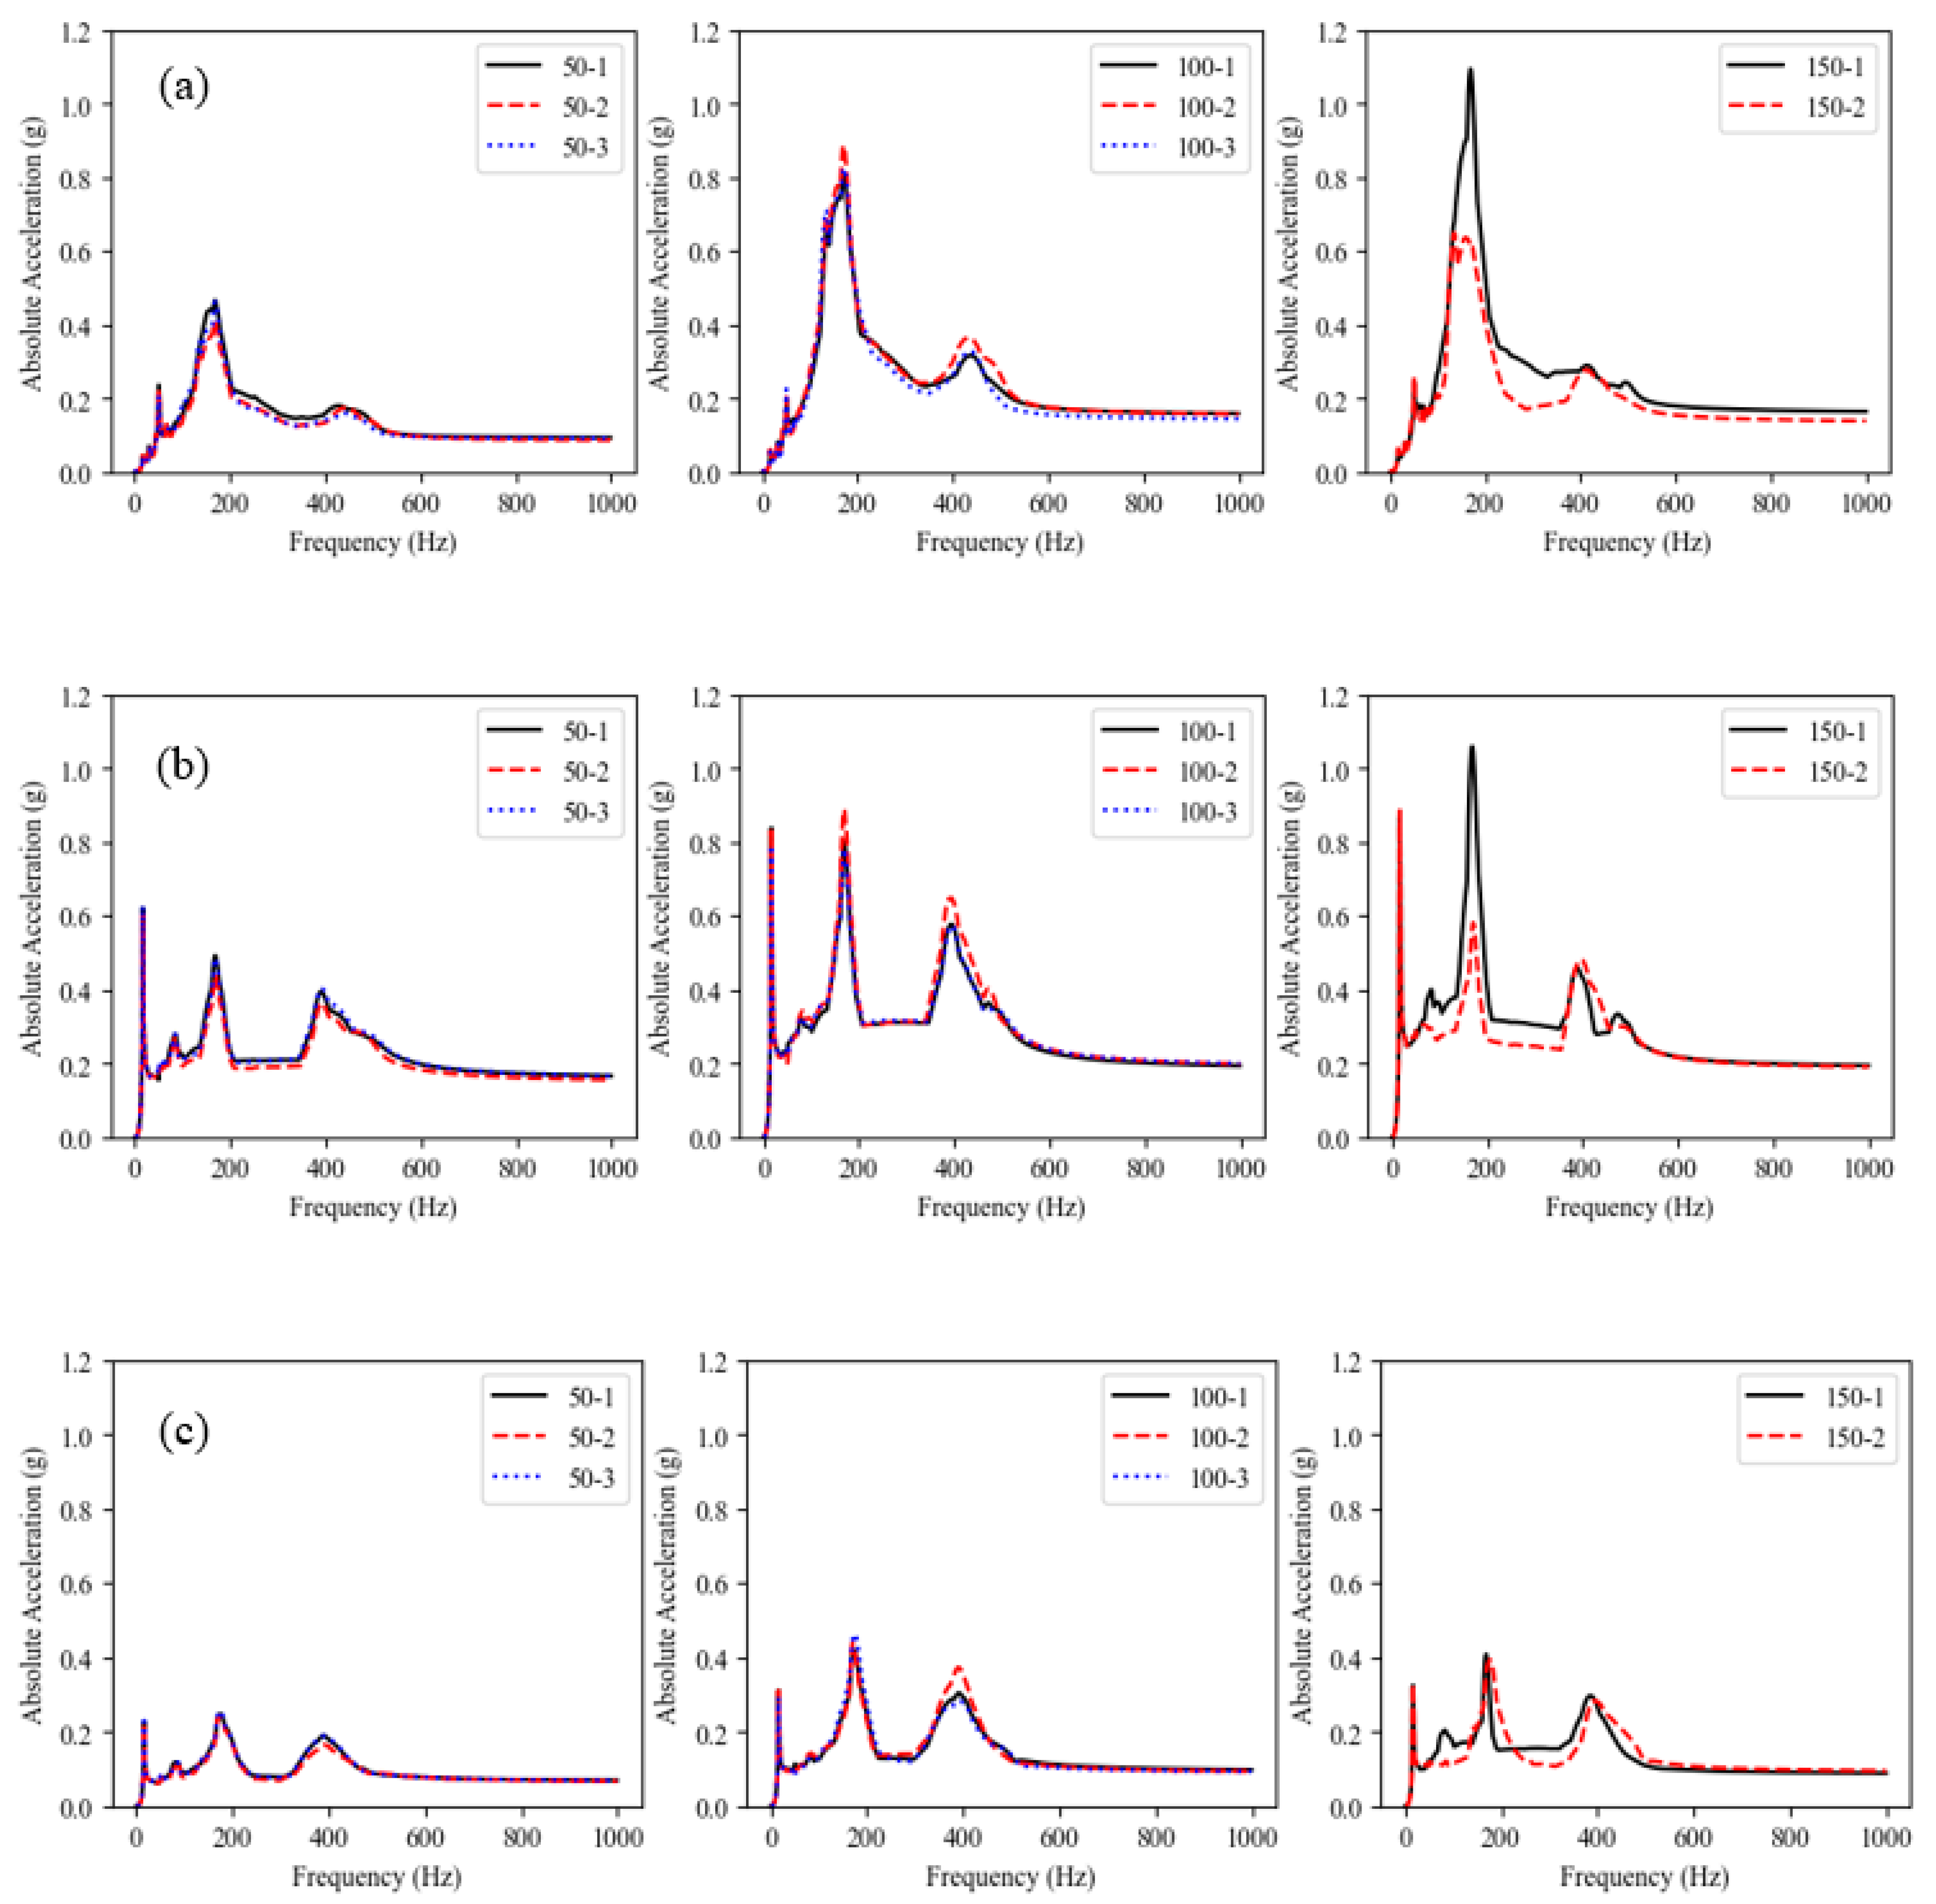
5.3. Results from the Single Panel Tests
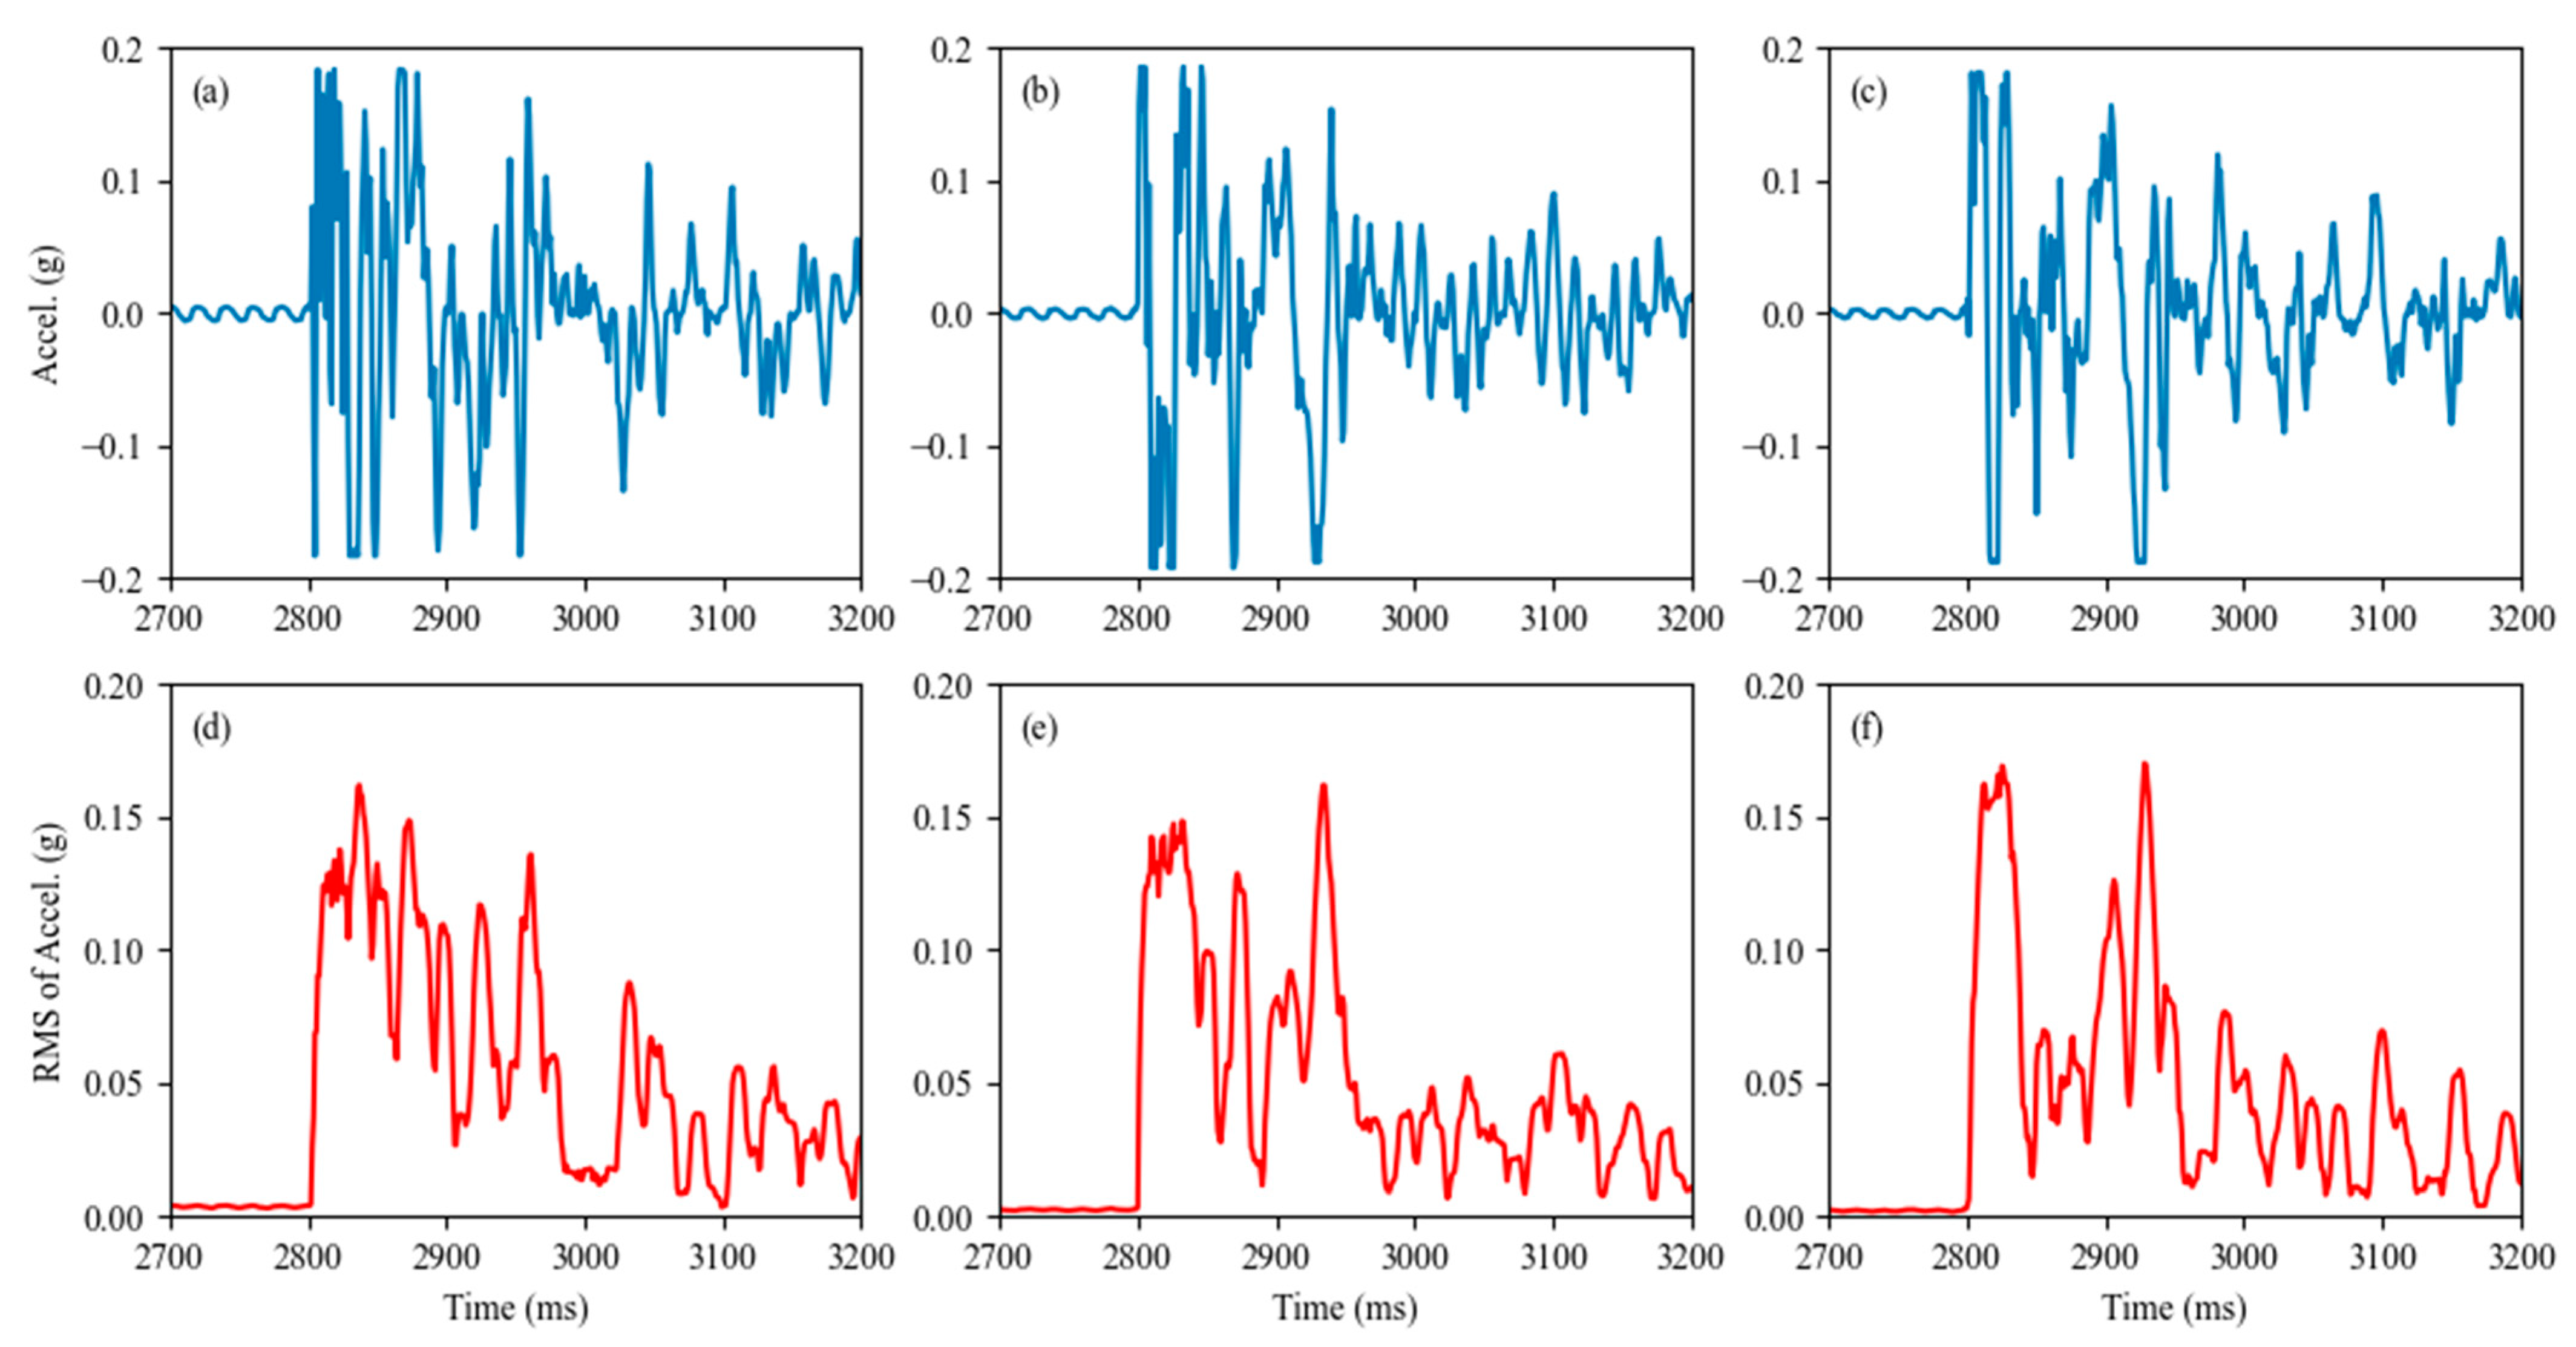
5.4. Assembled Wall Impact Test Results
6. Conclusions and Remarks
- The average dry density and absorption of the FR-AAC material are 533 kg/m3 and 63%, respectively, while the compressive strength and flexural strength vary with the panel thickness. The compressive and flexural strengths are smaller for the samples taken from panels with 200 mm thickness;
- All six panels tested under static uniformly distributed loading exceeded 1.5 times the self-weight limit, which satisfies the standard requirement. However, the failure is brittle and the panel is sensitive to defects that exist in the critical region. Further investigations on ductility and durability are necessary before its implementation;
- The wall panels passed the impact test and thus satisfied the requirement for its application as building partition walls. However, it is evident that considerable levels of damage were induced through the impact, and the wall failed during the third repeating impact. Its application in more severe conditions, such as those for exterior walls, shall be further verified;
- The durability of FRAAC is expected to be better than SRAAC, mainly due to the better durability of the fibers than the steel rebars. However, more long-term tests shall be required to compare the two solutions, especially under the alternation of moisture and temperature, which could be more critical to the interface between fibers and the AAC matrix. Such degradation is worth further exploration;
- The FACC and the wall panels demonstrated satisfactory performances regarding their mechanical strengths. However, more verifying work shall be conducted to ensure such products’ reliable and safe applications. Besides durability, health and safety during construction shall also be addressed, considering the brittle nature of the F-AAC panels. In order to overcome such shortcomings, it is suggested to use mixed fibers of different lengths or a mixture of several types of fibers. The type and dosage of such fiber mixture shall be further investigated;
- Due to the limitation of the availability of materials and panels manufactured in the factory environment, the fiber type and content were pre-selected based on the manufacturer’s recommendation. Future optimization will be conducted in the laboratory at a smaller scale. The final selection shall be based on the overall consideration of the mechanical properties and the sustainability of materials, such as their embodied carbon and energy levels. Fibers with less environmental burden, such as natural fibers or fibers produced from waste materials, can be considered to enhance their sustainability further;
- The sensitivity of material with respect to the thickness of the panel, more specifically, the impacts from the different durations at the designated curing temperature, is worth further investigation. The defects within the material are critical, and the appropriate quality control process is worth further investigation;
- The sustainability benefits of using FR-AAC over SRAAC shall be further quantified using the life cycle assessment method. The embedded carbon of FR-AAC can be further reduced by utilizing waste solid material [40,41] or introducing carbon dioxide curing [42], which has been approved by prior research.
Author Contributions
Funding
Data Availability Statement
Acknowledgments
Conflicts of Interest
References
- Sun, J. Autoclaved aerated concrete block prefabricated multi-storey building technology. J. World Archit. 2022, 6, 1–4. [Google Scholar] [CrossRef]
- Jiang, Y.; Qi, Z. Autoclaved Aerated Concrete Production Technology; China Building Material Industry Press: Beijing, China, 2021. [Google Scholar]
- Drochytka, R.; Zach, J.; Korjenic, A.; Hroudová, J. Improving the energy efficiency in buildings while reducing the waste using autoclaved aerated concrete made from power industry waste. Energy Build. 2013, 58, 319–323. [Google Scholar] [CrossRef]
- Trindade, A.D.; Coelho, G.B.A.; Henriques, F.M.A. Influence of the climatic conditions on the hygrothermal performance of autoclaved aerated concrete masonry walls. J. Build. Eng. 2021, 33, 101578. [Google Scholar] [CrossRef]
- Huang, F.; Zhang, J.; Zheng, X.; Wu, Y.; Fu, T.; Easa, S.; Liu, W.; Qiu, R. Preparation and performance of autoclaved aerated concrete reinforced by dopamine-modified polyethylene terephthalate waste fibers. Constr. Build. Mater. 2022, 348, 128649. [Google Scholar] [CrossRef]
- Tang, T.; Cai, L.; You, K.; Liu, M.; Han, W. Effect of microwave pre-curing technology on carbide slag-fly ash autoclaved aerated concrete (CS-FA AAC): Porosity rough body formation, pore characteristics and hydration products. Constr. Build. Mater. 2020, 263, 120112. [Google Scholar] [CrossRef]
- Jiang, J.; Lu, X.; Niu, T.; Hu, Y.; Wu, J.; Cui, W.; Zhao, D.; Ye, Z. Performance optimization and hydration characteristics of BOF slag-based autoclaved aerated concrete (AAC). Cem. Concr. Compos. 2022, 134, 104734. [Google Scholar] [CrossRef]
- Serhat Baspinar, M.; Demir, I.; Kahraman, E.; Gorhan, G. Utilization potential of fly ash together with silica fume in autoclaved aerated concrete production. KSCE J. Civ. Eng. 2014, 18, 47–52. [Google Scholar] [CrossRef]
- Song, Y.; Dong, M.; Wang, Z.; Qian, X.; Yan, D.; Shen, S.; Zhang, L.; Sun, G.; Lai, J.; Ruan, S. Effects of red mud on workability and mechanical properties of autoclaved aerated concrete (AAC). J. Build. Eng. 2022, 61, 105238. [Google Scholar] [CrossRef]
- Ma, B.-G.; Cai, L.-X.; Li, X.-G.; Jian, S.-W. Utilization of iron tailings as substitute in autoclaved aerated concrete: Physico-mechanical and microstructure of hydration products. J. Clean. Prod. 2016, 127, 162–171. [Google Scholar] [CrossRef]
- Cai, L.; Li, X.; Ma, B.; Lv, Y. Effect of binding materials on carbide slag based high utilization solid-wastes autoclaved aerated concrete (HUS-AAC): Slurry, physic-mechanical property and hydration products. Constr. Build. Mater. 2018, 188, 221–236. [Google Scholar] [CrossRef]
- Peng, Y.; Liu, Y.; Zhan, B.; Xu, G. Preparation of autoclaved aerated concrete by using graphite tailings as an alternative silica source. Constr. Build. Mater. 2021, 267, 121792. [Google Scholar] [CrossRef]
- Seddighi, F.; Pachideh, G.; Salimbahrami, S.B. A study of mechanical and microstructures properties of autoclaved aerated concrete containing nano-graphene. J. Build. Eng. 2021, 43, 103106. [Google Scholar] [CrossRef]
- Wang, Y.; Wang, W.; Wang, D.; Liu, Y.; Liu, J. Study on the influence of sample size and test conditions on the capillary water absorption coefficient of porous building materials. J. Build. Eng. 2021, 43, 103120. [Google Scholar] [CrossRef]
- Kadhim, A.; Sadique, M.; Al-Mufti, R.; Hashim, K. Long-term performance of novel high-calcium one-part alkali-activated cement developed from thermally activated lime kiln dust. J. Build. Eng. 2020, 32, 101766. [Google Scholar] [CrossRef]
- Narayanan, N.; Ramamurthy, K. Structure and properties of aerated concrete: A review. Cem. Concr. Compos. 2000, 22, 321–329. [Google Scholar] [CrossRef]
- Kalpana, M.; Mohith, S. Study on autoclaved aerated concrete: Review. Mater. Today Proc. 2020, 22, 894–896. [Google Scholar] [CrossRef]
- Ghazi Wakili, K.; Hugi, E.; Karvonen, L.; Schnewlin, P.; Winnefeld, F. Thermal behaviour of autoclaved aerated concrete exposed to fire. Cem. Concr. Compos. 2015, 62, 52–58. [Google Scholar] [CrossRef]
- Xie, D.; Cai, L.; Wang, J. Regulating effect of cement accelerator on high content solid-wastes autoclaved aerated concrete (HCS-AAC) slurry performance and subsequent influence. Materials 2021, 14, 799. [Google Scholar] [CrossRef]
- Qu, X.; Zhao, X. Previous and present investigations on the components, microstructure and main properties of autoclaved aerated concrete—A review. Constr. Build. Mater. 2017, 135, 505–516. [Google Scholar] [CrossRef]
- Chucholowski, C.; Müller, H.; Thienel, K.-C. Low-sulfate autoclaved aerated concrete (AAC): A recyclable AAC with calcined clay. Constr. Build. Mater. 2022, 342, 127984. [Google Scholar] [CrossRef]
- Shan, C.; Yang, Z.; Su, Z.; Rajan, R.; Zhou, X.; Wang, L. Preparation and characterization of waterproof autoclaved aerated concrete using molybdenum tailings as the raw materials. J. Build. Eng. 2022, 49, 104036. [Google Scholar] [CrossRef]
- Cai, Q.; Ma, B.; Jiang, J.; Wang, J.; Shao, Z.; Hu, Y.; Qian, B.; Wang, L. Utilization of waste red gypsum in autoclaved aerated concrete preparation. Constr. Build. Mater. 2021, 291, 123376. [Google Scholar] [CrossRef]
- Jiang, J.; Cai, Q.; Ma, B.; Hu, Y.; Qian, B.; Ma, F.; Shao, Z.; Xu, Z.; Wang, L. Effect of ZSM-5 waste dosage on the properties of autoclaved aerated concrete. Constr. Build. Mater. 2021, 278, 122114. [Google Scholar] [CrossRef]
- Junaid, M.F.; ur Rehman, Z.; Kuruc, M.; Medveď, I.; Bačinskas, D.; Čurpek, J.; Čekon, M.; Ijaz, N.; Ansari, W.S. Lightweight concrete from a perspective of sustainable reuse of waste byproducts. Constr. Build. Mater. 2022, 319, 126061. [Google Scholar] [CrossRef]
- Goodier, C.; Cavalaro, S.; Lee, K.; Casselden, R. Durability variations in reinforced autoclaved aerated concrete (RAAC)–extended abstract. In MATEC Web of Conferences; EDP Sciences: Les Ulis, France, 2022; Volume 361, p. 06005. [Google Scholar] [CrossRef]
- Kadashevich, I.; Schneider, H.-J.; Stoyan, D. Statistical modeling of the geometrical structure of the system of artificial air pores in autoclaved aerated concrete. Cem. Concr. Res. 2005, 35, 1495–1502. [Google Scholar] [CrossRef]
- Lashari, A.R.; Kumar, A.; Kumar, R.; Rizvi, S.H. Combined effect of silica fume and fly ash as cementitious material on strength characteristics, embodied carbon, and cost of autoclave aerated concrete. Environ. Sci. Pollut. Res. 2022, 30, 27875–27883. [Google Scholar] [CrossRef]
- Ma, X.; Li, H.; Wang, D.; Li, C.; Wei, Y. Simulation and experimental substantiation of the thermal properties of non-autoclaved aerated concrete with recycled concrete powder. Materials 2022, 15, 8341. [Google Scholar] [CrossRef]
- Schober, G. Porosity in autoclaved aerated concrete (AAC): A review on pore structure, types of porosity, measurement methods and effects of porosity on properties. Cem. Wapno Beton 2011, 16, 39–43. Available online: https://www.cementwapnobeton.pl/Porosity-in-autoclaved-aerated-concrete-AAC-A-review-on-pore-structure-types-of-porosity,178120,0,2.html (accessed on 11 October 2023).
- Kamal, M.A. Analysis of autoclaved aerated concrete (AAC) blocks with reference to its potential and sustainability. J. Build. Mater. Struct. 2020, 7, 76. [Google Scholar] [CrossRef]
- Pakravan, H.R.; Latifi, M.; Jamshidi, M. Hybrid short fiber reinforcement system in concrete: A review. Constr. Build. Mater. 2017, 142, 280–294. [Google Scholar] [CrossRef]
- He, T.; Xu, R.; Da, Y.; Yang, R.; Chen, C.; Liu, Y. Experimental study of high-performance autoclaved aerated concrete produced with recycled wood fibre and rubber powder. J. Clean. Prod. 2019, 234, 559–567. [Google Scholar] [CrossRef]
- Fládr, J.; Bílý, P. Specimen size effect on compressive and flexural strength of high-strength fibre-reinforced concrete containing coarse aggregate. Compos. Part B Eng. 2018, 138, 77–86. [Google Scholar] [CrossRef]
- Onur Pehlivanlı, Z.; Uzun, İ. Effect of polypropylene fiber length on mechanical and thermal properties of autoclaved aerated concrete. Constr. Build. Mater. 2022, 322, 126506. [Google Scholar] [CrossRef]
- Demir, İ.; Sevim, O.; Ogdu, M.K.; Dogan, O.; Demir, S. Mechanical and physical properties of autoclaved aerated concrete reinforced using carbon fibre of different lengths. Teh. Vjesn.—Technol. Gaz. 2021, 28, 503–508. [Google Scholar] [CrossRef]
- Geetha, S.; Selvakumar, M. Graphene oxide admixed aerated concrete composite with carbon fibres. Mater. Today Proc. 2018, 5, 19808–19814. [Google Scholar] [CrossRef]
- GB/T15762-2020; Autoclaved Aerated Concrete Slabs. State Administration for Market Regulation: Beijing, China, 2020.
- GB/T 23451-2023; Light Weight Panels for Partition Wall Used In Buildings. State Administration for Market Regulation: Beijing, China, 2009.
- Wei, C.; Liu, X.; Zhang, Z.; Wu, P. Utilization of solid wastes for aerated concrete preparation: Mechanical properties and microstructural analysis. J. Build. Eng. 2024, 82, 108235. [Google Scholar] [CrossRef]
- Wang, S.; Gu, X.; Liu, J.; Zhu, Z.; Wang, H.; Ge, X.; Hu, Z.; Xu, X.; Nehdi, M.L. Assessment of lithium slag as a supplementary siliceous material in autoclaved aerated concrete: Physical properties and hydration characteristics. Constr. Build. Mater. 2024, 442, 137621. [Google Scholar] [CrossRef]
- Gu, X.; Wang, S.; Liu, J.; Zhu, Z.; Wang, H.; Ge, X.; Hu, Z.; Xu, X.; Nehdi, M.L. Improving physical properties, microstructure and actual carbon sequestration of steel slag based autoclaved aerated concrete by accelerated carbonation. J. Build. Eng. 2024, 94, 110045. [Google Scholar] [CrossRef]


| Raw Materials | Mix Design (kg/m3) |
|---|---|
| P·II 42.5 Portland cement | 160 |
| Quicklime | 200 |
| Aluminum powder | 0.6 |
| Gypsum | 40 |
| Silica sand | 396.8 |
| Glass fiber | 4 |
| Thickness (mm) | Dry Density (r0), kg/m3 | Mass Moisture Content (Ws), % | Absorption (Wr), % | |||
|---|---|---|---|---|---|---|
| Average | SD | Average | SD | Average | SD | |
| 100 | 526.96 | 3.30 | 23.91% | 1.05% | 67.19% | 0.66% |
| 150 | 534.18 | 4.77 | 28.45% | 4.36% | 60.13% | 3.85% |
| 200 | 537.81 | 2.77 | 25.84% | 0.71% | 62.62% | 1.71% |
| Thickness | Compressive Strength (MPa) | Mean (MPa) | SD (MPa) |
|---|---|---|---|
| 100 | 3.70 | 3.95 | 0.59 |
| 4.62 | |||
| 3.53 | |||
| 150 | 3.92 | 4.23 | 0.30 |
| 4.25 | |||
| 4.52 | |||
| 200 | 3.39 | 3.19 | 0.17 |
| 3.10 | |||
| 3.08 |
| Thickness | Flexural Strength (MPa) | Mean (MPa) | SD (MPa) |
|---|---|---|---|
| 100 | 1.02 | 1.02 | 0.07 |
| 0.95 | |||
| 1.08 | |||
| 150 | 1.08 | 0.98 | 0.15 |
| 1.05 | |||
| 0.81 | |||
| 200 | 0.88 | 0.91 | 0.03 |
| 0.94 | |||
| 0.90 |
| Specimen | 100 mm−1 | 100 mm−2 | 150 mm−1 | 150 mm−2 | 200 mm−1 | 200 mm−2 |
|---|---|---|---|---|---|---|
| Self-weight (kg) | 109 | 115 | 156 | 157 | 262 | 264 |
| Span (mm) | 2270 | 2270 | 2370 | 2370 | 2900 | 2900 |
| Peak load (kN) | 2.55 | 2.06 | 2.89 | 4.66 | 5.29 | 6.32 |
| Load to self-weight ratio (-) | 2.39 | 1.83 | 1.89 | 3.03 | 2.06 | 2.44 |
| Ultimate moment (kN·m) | 0.72 | 0.58 | 0.86 | 1.38 | 1.92 | 2.29 |
| Flexural strength (MPa) | 0.72 | 0.58 | 0.38 | 0.61 | 0.48 | 0.57 |
| Panel Thickness | Reinforcement Diagram |
|---|---|
| 100 mm | 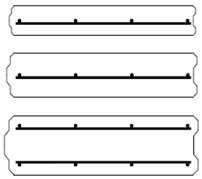 |
| 150 mm | |
| 200 mm |
Disclaimer/Publisher’s Note: The statements, opinions and data contained in all publications are solely those of the individual author(s) and contributor(s) and not of MDPI and/or the editor(s). MDPI and/or the editor(s) disclaim responsibility for any injury to people or property resulting from any ideas, methods, instructions or products referred to in the content. |
© 2024 by the authors. Licensee MDPI, Basel, Switzerland. This article is an open access article distributed under the terms and conditions of the Creative Commons Attribution (CC BY) license (https://creativecommons.org/licenses/by/4.0/).
Share and Cite
Song, P.; Peng, X.; Zheng, R.; Xia, J. Material Properties and Mechanical Performances of Manufactured Factory-Produced Glass Fiber-Reinforced Autoclaved Aerated Concrete Panel. Buildings 2024, 14, 2895. https://doi.org/10.3390/buildings14092895
Song P, Peng X, Zheng R, Xia J. Material Properties and Mechanical Performances of Manufactured Factory-Produced Glass Fiber-Reinforced Autoclaved Aerated Concrete Panel. Buildings. 2024; 14(9):2895. https://doi.org/10.3390/buildings14092895
Chicago/Turabian StyleSong, Pei, Xiaoxuan Peng, Rengeng Zheng, and Jun Xia. 2024. "Material Properties and Mechanical Performances of Manufactured Factory-Produced Glass Fiber-Reinforced Autoclaved Aerated Concrete Panel" Buildings 14, no. 9: 2895. https://doi.org/10.3390/buildings14092895
APA StyleSong, P., Peng, X., Zheng, R., & Xia, J. (2024). Material Properties and Mechanical Performances of Manufactured Factory-Produced Glass Fiber-Reinforced Autoclaved Aerated Concrete Panel. Buildings, 14(9), 2895. https://doi.org/10.3390/buildings14092895