Study Protocol

Risk Assessment of Underground Tunnel Engineering Based on Pythagorean Fuzzy Sets and Bayesian Networks

1
School of Civil and Architecture Engineering, East China University of Technology, Nanchang 330013, China
2
School of Civil Engineering and Architecture, Wuhan University of Technology, Wuhan 430070, China
*
Author to whom correspondence should be addressed.
Buildings 2024, 14(9), 2897; https://doi.org/10.3390/buildings14092897
Submission received: 7 August 2024 / Revised: 27 August 2024 / Accepted: 28 August 2024 / Published: 13 September 2024
(This article belongs to the Special Issue Advances in Life Cycle Management of Buildings)

Abstract

:
With the acceleration of urbanization, the importance of risk management in underground construction projects has become increasingly prominent. In the process of risk assessment for underground construction projects, the uncertainty of subjective factors from experts poses a significant challenge to the accuracy of assessment outcomes. This paper takes a section of the Nanchang Metro Line 2 as the research object, aiming to address the subjectivity issues in the risk assessment of underground construction projects and to enhance the scientific rigor and accuracy of the assessment. The study initially conducts a comprehensive identification and analysis of risk factors in underground engineering through a literature review and expert consultation method. Based on this, this paper introduces the theory of Pythagorean fuzzy sets to improve the Delphi method in order to reduce the impact of subjectivity in expert assessments. Furthermore, this paper constructs a Bayesian network model, incorporating risk factors into the network, and quantifies the construction risks through a probabilistic inference mechanism. The research findings indicate a total of 12 key risk factors that have been identified across four dimensions: geological and groundwater conditions, tunnel construction technical risks, construction management measures, and the surrounding environment. The Bayesian network assessment results indicate that the effectiveness of engineering quality management and the state of safety management at the construction site are the two most influential factors. Based on the assessment results, this paper further conducts a risk control analysis and proposes targeted risk management measures.

1. Introduction

In the field of urban rail transit underground engineering, with the continuous advancement of technology and the increasing complexity of projects, the refinement and scientific construction of risk assessment models have become the key driving forces for promoting the safe and efficient development of the industry. However, for a long time, the inherent subjectivity in the expert assessment phase has gradually become a bottleneck that restricts the accuracy and reliability of risk assessment, which urgently needs a breakthrough through theoretical innovation and technological integration. Guided by the ‘Urban Rail Transit Underground Engineering Construction Risk Management Specification’, risk analysis methods are clearly divided into three major dimensions: qualitative, quantitative, and comprehensive analyses. This classification system not only provides a framework for the systematic implementation of risk management but also points out the optimization path. To enhance the overall quality and efficiency of underground construction projects, both academia and the engineering community are actively exploring and integrating a variety of advanced methods and technological tools. These include the Delphi method, which involves anonymous, iterative consultation and feedback from experts [1]; the expert survey method, which is characterized by rigorous questionnaire design and data analysis processes [2]; the analytic hierarchy process (AHP), which constructs clear hierarchical structure models [3]; risk assessment matrix methods [4]; and the fuzzy set theory, which is introduced to address uncertainty issues in risk assessment. The comprehensive application of these methods enables more effective identification, assessment, and mitigation of various risk factors in subway construction projects. It offers a variety of tools and perspectives for risk management, thereby ensuring the safety and smooth progression of the construction process.
However, in the complex environment of underground construction, the task of risk assessment faces multiple challenges and uncertainties. Traditional risk assessment models often heavily rely on expert evaluation, where the influence of subjective factors cannot be overlooked, limiting the objectivity and accuracy of the assessment results. Naji [5] indicated that using the Delphi method to assess the factors of digital transformation in the construction industry can effectively identify the critical factors at the construction phase. This study draws on this method by consulting experts to assess risk factors, but at the same time, it recognizes the limitations of expert subjectivity in traditional models. To overcome this limitation, Abramov I [6] and his team’s research provided an integrated approach that combined the analytic hierarchy process (AHP) with Monte Carlo simulation techniques to conduct a systematic assessment of risk factors in the construction phase for construction companies. This study employs a similar integrated approach, enhancing the quantitative analysis capabilities of risk assessment by introducing Pythagorean fuzzy numbers and Bayesian networks. Lapidus A [7] provided a survey method that offered a reference for this study to collect information on risk factors. Zhu Y [8] proposed a genetic taboo algorithm that not only enhanced the efficiency of enterprise evaluation but also offered the possibility of reducing the time required to establish assessment methods. This study has also considered the application potential of this algorithm in the development process of the risk assessment methodology. The research by Khan S [9], which integrated historical accident data with expert assessment, provided a comprehensive evaluation of railway accident risks and offered valuable experience for this study in the assessment of risk probabilities and consequences. The combination of the generalized intuitionistic fuzzy soft set and the TOPSIS decision-making model proposed by Wu H [10] provided an innovative approach for this study in the construction of the evaluation index system and the calculation of weights. Ansari R [11] employed the best–worst method (BWM) to reasonably allocate weights to these criteria and subsequently innovatively introduced the fuzzy FUZZY VIKOR method for the comprehensive ranking of existing risks, providing scientific support for the risk priority setting in this study. Ilczuk P [12], based on expert interview data and employing a risk analysis method grounded in fuzzy set theory, enhanced the safety of the railway traffic control industry. Gul M [13] integrated a Pythagorean fuzzy analytical hierarchical process with the fuzzy FUZZY VIKOR method in a risk assessment framework, providing an exemplary model of methodological innovation and integration for this study. Çalık A [14] developed a novel group decision-making method within the Pythagorean fuzzy environment by integrating the AHP and TOPSIS methods. The innovation of this approach lay in its combination of two established decision-making techniques, enhancing the consistency and accuracy of the group decision-making process. Chen Q Y [15] proposed a model that employed Fermatean fuzzy linguistic sets (FFLSs) and the combination compromise solution (CoCoSo) method, specifically aimed at risk assessment and prioritization of occupational hazards. The model enhanced the expressive power and flexibility of risk assessment by utilizing FFLSs to handle the complex and vague risk evaluations provided by experts. The research by Shete P C [16] employed a Pythagorean fuzzy analytic hierarchy process (AHP) framework to study the factors promoting sustainable supply chain innovation (SSCIEs). This indicated the potential application of Pythagorean fuzzy set theory in other fields such as supply chain management, providing an interdisciplinary perspective for this study. Ak M F [17] emphasized the importance of multi-attribute decision making in risk analysis and noted that the analytic hierarchy process and TOPSIS are two commonly used MADM methods. These methods have been employed in this study to construct the evaluation index system and calculate the weights of indicators, ensuring the systematic and scientific nature of the risk assessment. Wang L [18] improved the existing fuzzy TODIM method, proposing an approach that retained more information during the decision-making process. This refinement helped to prevent the loss of information when translating fuzzy preferences into crisp values, enhancing the reliability of decision-making. Zhang Z [19], by analyzing the application of the interval type-2 fuzzy TOPSIS (IT2-FTOPSIS) method in risk assessment, pointed out the shortcomings of existing research in considering utility functions. To address this, a novel IT2-FTOPSIS method incorporating utility functions was developed to more accurately assess the operational risks of subway stations. Wang Y M [20] focused on the multi-attribute decision-making problems in a fuzzy environment, proposing a fuzzy TOPSIS method based on alpha level sets, and provided the corresponding nonlinear programming solution algorithm. The study also explored the intrinsic connections and differences between the fuzzy TOPSIS method and the fuzzy weighted average method. It not only demonstrated the unique advantages and application potential of the proposed method but also revealed the essential distinctions and room for improvement between this approach and other decision-making procedures in handling fuzzy information. Liu P [21] introduced the concepts of complex q-rung orthopair fuzzy sets and linguistic sets, which were utilized for dealing with uncertain information in multi-attribute group decision-making problems. The manuscript also brought forth the Heronian mean and geometric Heronian mean operators, which effectively aggregate q-rung orthopair linguistic fuzzy numbers into a unified element. These concepts and tools offered a novel perspective for handling complex uncertain information in underground tunnel engineering. Al-shami [22] presented a new category, called “(2,1)-fuzzy sets”, which were suitable for managing real-life scenarios. By defining the score and accuracy functions, the paper provided an evaluation and ranking method for (2,1)-fuzzy sets and reformulated aggregation operators to fit the (2,1)-fuzzy sets environment, offering a successful technique for multi-criteria decision-making (MCDM) problems. Mohamad M [23] proposed a risk-based inspection (RBI) framework aimed at optimizing construction inspections for transportation projects. By integrating fuzzy sets (FSs) and Bayesian belief networks (BBNs), the study offered a modular representation for construction inspection risk analysis, enhancing the efficiency and functionality of the risk analysis process. Tian Z [24] developed a cross-risk assessment method based on Bayesian networks and the degree of crossover. This method took into account not only the cross impact of risk factors but also the mutual influence of crossover operations, providing a quantitative approach and grading standards for construction safety management and control. Nguyen S [25] proposed an operational risk analysis model for container shipping systems that considered the quantification of uncertainty. The model used the Bayesian probability theory to quantify the magnitude of risk and employed evidential reasoning along with a set of three uncertainty indicators to address the uncertainty stemming from expert subjectivity. Lu X [26] put forward a probabilistic risk assessment approach for metro construction based on the credal network, revealing the epistemic uncertainty caused by geological and hydrological conditions and human factors. The method quantified prior probabilities using interval probabilities and probability boxes and qualified conditional probabilities with imprecise leaky noisy-OR models and imprecise Dirichlet models. Duan R [27] introduced a novel diagnostic method for the train-ground wireless communication system, leveraging reliability analysis, fuzzy set theory, and multi-attribute decision making to tackle challenges in system diagnosis. Khalaj M [28] proposed an extended cross-entropy measure of belief values based on the belief degree using available evidence, defining a new aspect of belief functions known as a belief set. The study then defined a new cross-entropy measure between two belief sets and provided its application in MCDM with belief-valued information. Whether through fuzzy set theory, Bayesian networks, or by combining various decision-making tools, scholars are striving to enhance the accuracy and efficiency of risk assessment. Zhu J [29] discussed a hybrid risk ranking model that combined linguistic neutrosophic numbers, regret theory, and the PROMETHEE method, aiming to improve the traditional failure mode and effects analysis approach. This method enhanced the accuracy and reliability of risk assessment by considering the psychological behaviors of decision makers. Dabbagh R [30] introduced a hybrid decision-making approach based on FMEA, fuzzy cognitive map, and multi-objective optimization on the basis of ratio analysis for assessing and prioritizing occupational health and safety risks. The method identified risks and determined the values of risk assessment criteria, then ascertained the weights of criteria based on their causal relationships through FCM and a hybrid learning algorithm, concluding with risk prioritization using the MOORA method. Wang W [31] proposed a novel FMEA method that took into account both the psychological behavior of decision makers and the interaction relationships among risk factors. The method utilized prospect theory to determine the risk assessment of factors and employed a fuzzy measure and Choquet integral to aggregate the prospect value of the failure mode on each risk factor. However, these risk assessment models are overly reliant on expert evaluation. To mitigate the influence of subjective factors from experts, it is necessary to fully consider the individual assessment information from experts and select the optimal solution to make the evaluation results more objective.
To address the specific challenges of high subjectivity in expert assessments and significant uncertainty in the risk assessment of subway tunnel construction projects, this paper proposes a novel risk assessment method that utilizes Pythagorean fuzzy numbers for expert evaluation data screening, in conjunction with a Bayesian network. The core of this method lies in optimizing the parameter weight allocation mechanism, thereby effectively reducing the subjective bias and uncertainty factors in the expert assessment process, and subsequently significantly enhancing the precision and reliability of risk assessments. Furthermore, leveraging the powerful probabilistic inference capabilities of Bayesian networks, the proposed method not only enables real-time monitoring and identification of potential risk factors in the construction process but also provides a scientific basis and real-time decision support for decision makers. By thoroughly exploring and applying the risk assessment method based on Pythagorean fuzzy sets and Bayesian networks proposed in this study, the structural stability, usage safety, and overall construction efficiency of subway tunnel engineering projects can be significantly enhanced. Through in-depth exploration and extensive application of this method, there is a promising prospect of building a solid barrier for the safe and efficient advancement of subway projects, propelling the construction of urban rail transit to an even higher level of development.

2. Risk Evaluation Methodology
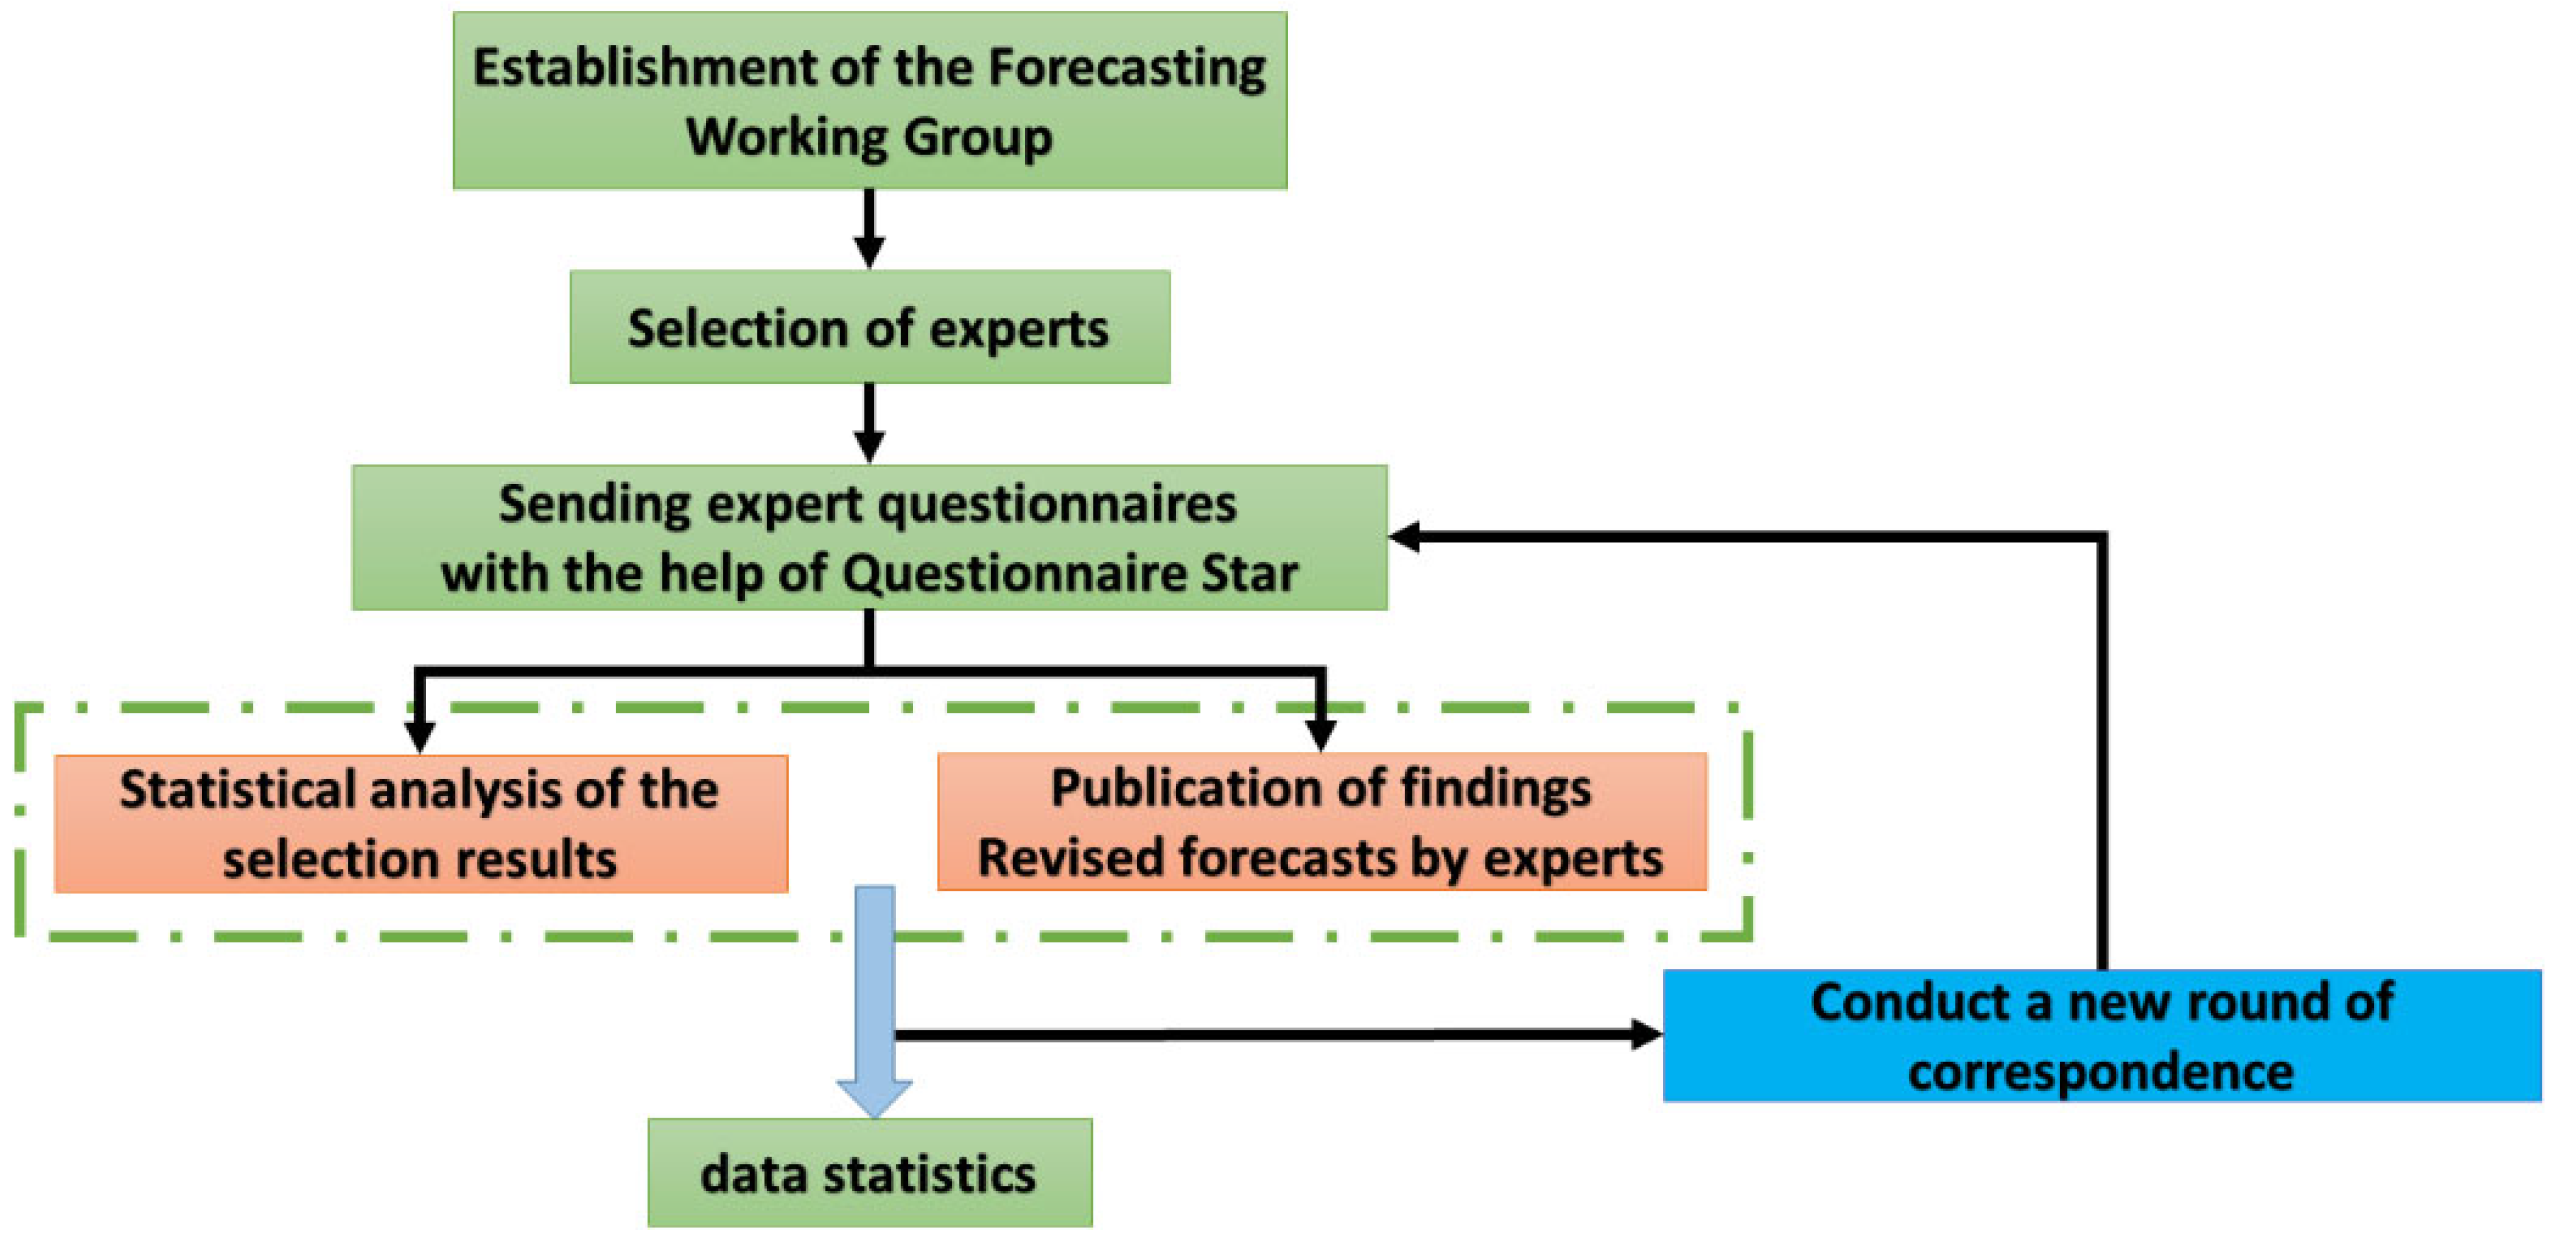
2.1. Delphi Method

The Delphi method, as a recognized expert consultation technique, plays an essential role in the field of risk assessment. Considering the complexity of projects such as underground tunnel engineering, where precise quantitative analysis methods may be difficult to apply, the Delphi method relies on the extensive experience and professional judgment of experts in the field to provide an effective means of risk analysis. The method facilitates the concentration of information and the integration of perspectives through multiple rounds of anonymous surveys and in-depth discussions, thereby forming a structured qualitative analysis approach [32]. Especially in high-risk engineering projects such as subway construction, the application of the Delphi method provides the management team with a powerful tool to identify and understand potential risk factors and to formulate scientific management strategies and decisions accordingly.
In the process of implementing the Delphi method, the following steps are adhered to: establishing a forecasting working group, selecting experts, sending out expert inquiry forms, collecting and organizing opinions, providing feedback, repeating the inquiry process until consensus is reached, and comprehensively processing the opinions of experts to ultimately draw conclusions. The detailed procedure of the Delphi survey is shown in Figure 1.
To ensure the rigor of the research, the selected panel of experts must meet the following criteria: members must have at least five years of practical experience in the field of underground tunnel engineering, possess a good reputation within the engineering community, and have the ability to clearly articulate their professional insights and recommendations. Furthermore, the experts must voluntarily participate in this study and commit to taking part in at least two rounds of the Delphi survey, maintaining the independence and objectivity of their viewpoints to ensure the neutrality and accuracy of the assessment process.
After the establishment of the expert panel, based on a profound understanding of the risks associated with underground tunnel construction and in conjunction with expert consultation and an extensive literature review, a preliminary risk assessment index system is constructed. The system focuses on identifying and defining the types of risks and their potential impacts that may be encountered during the initial phase of underground tunnel construction. Subsequently, an expert inquiry form is designed to comprehensively capture and quantify the key indicators for risk assessment in underground tunnel construction. Furthermore, utilizing the online survey tool ‘Questionnaire Star’, at least two rounds of expert inquiries are launched to widely collect and integrate the professionals’ opinions and suggestions. Thereafter, the collected data are meticulously summarized and analyzed, and the feedback from the experts is filtered and integrated to ensure that the assessment indicators are rational and highly representative and universal. On this basis, the risk assessment index system is carefully revised and adjusted to ensure that it comprehensively and accurately reflects the risk status of underground tunnel engineering. When the experts’ opinions reach a high degree of consensus, further inquiries are terminated, and the collected data are subjected to final statistical analysis and assessment.
The Delphi method’s advantage in risk assessment lies in its unique expert consultation mechanism, which gathers expert wisdom through multiple rounds of anonymous surveys, enhancing the rationality and scientific nature of decision making. However, the method also has limitations, such as an over reliance on the subjective judgment of experts that may lead to biased results and the potential for expert opinions to be influenced by external factors, making it difficult to ensure their independence.

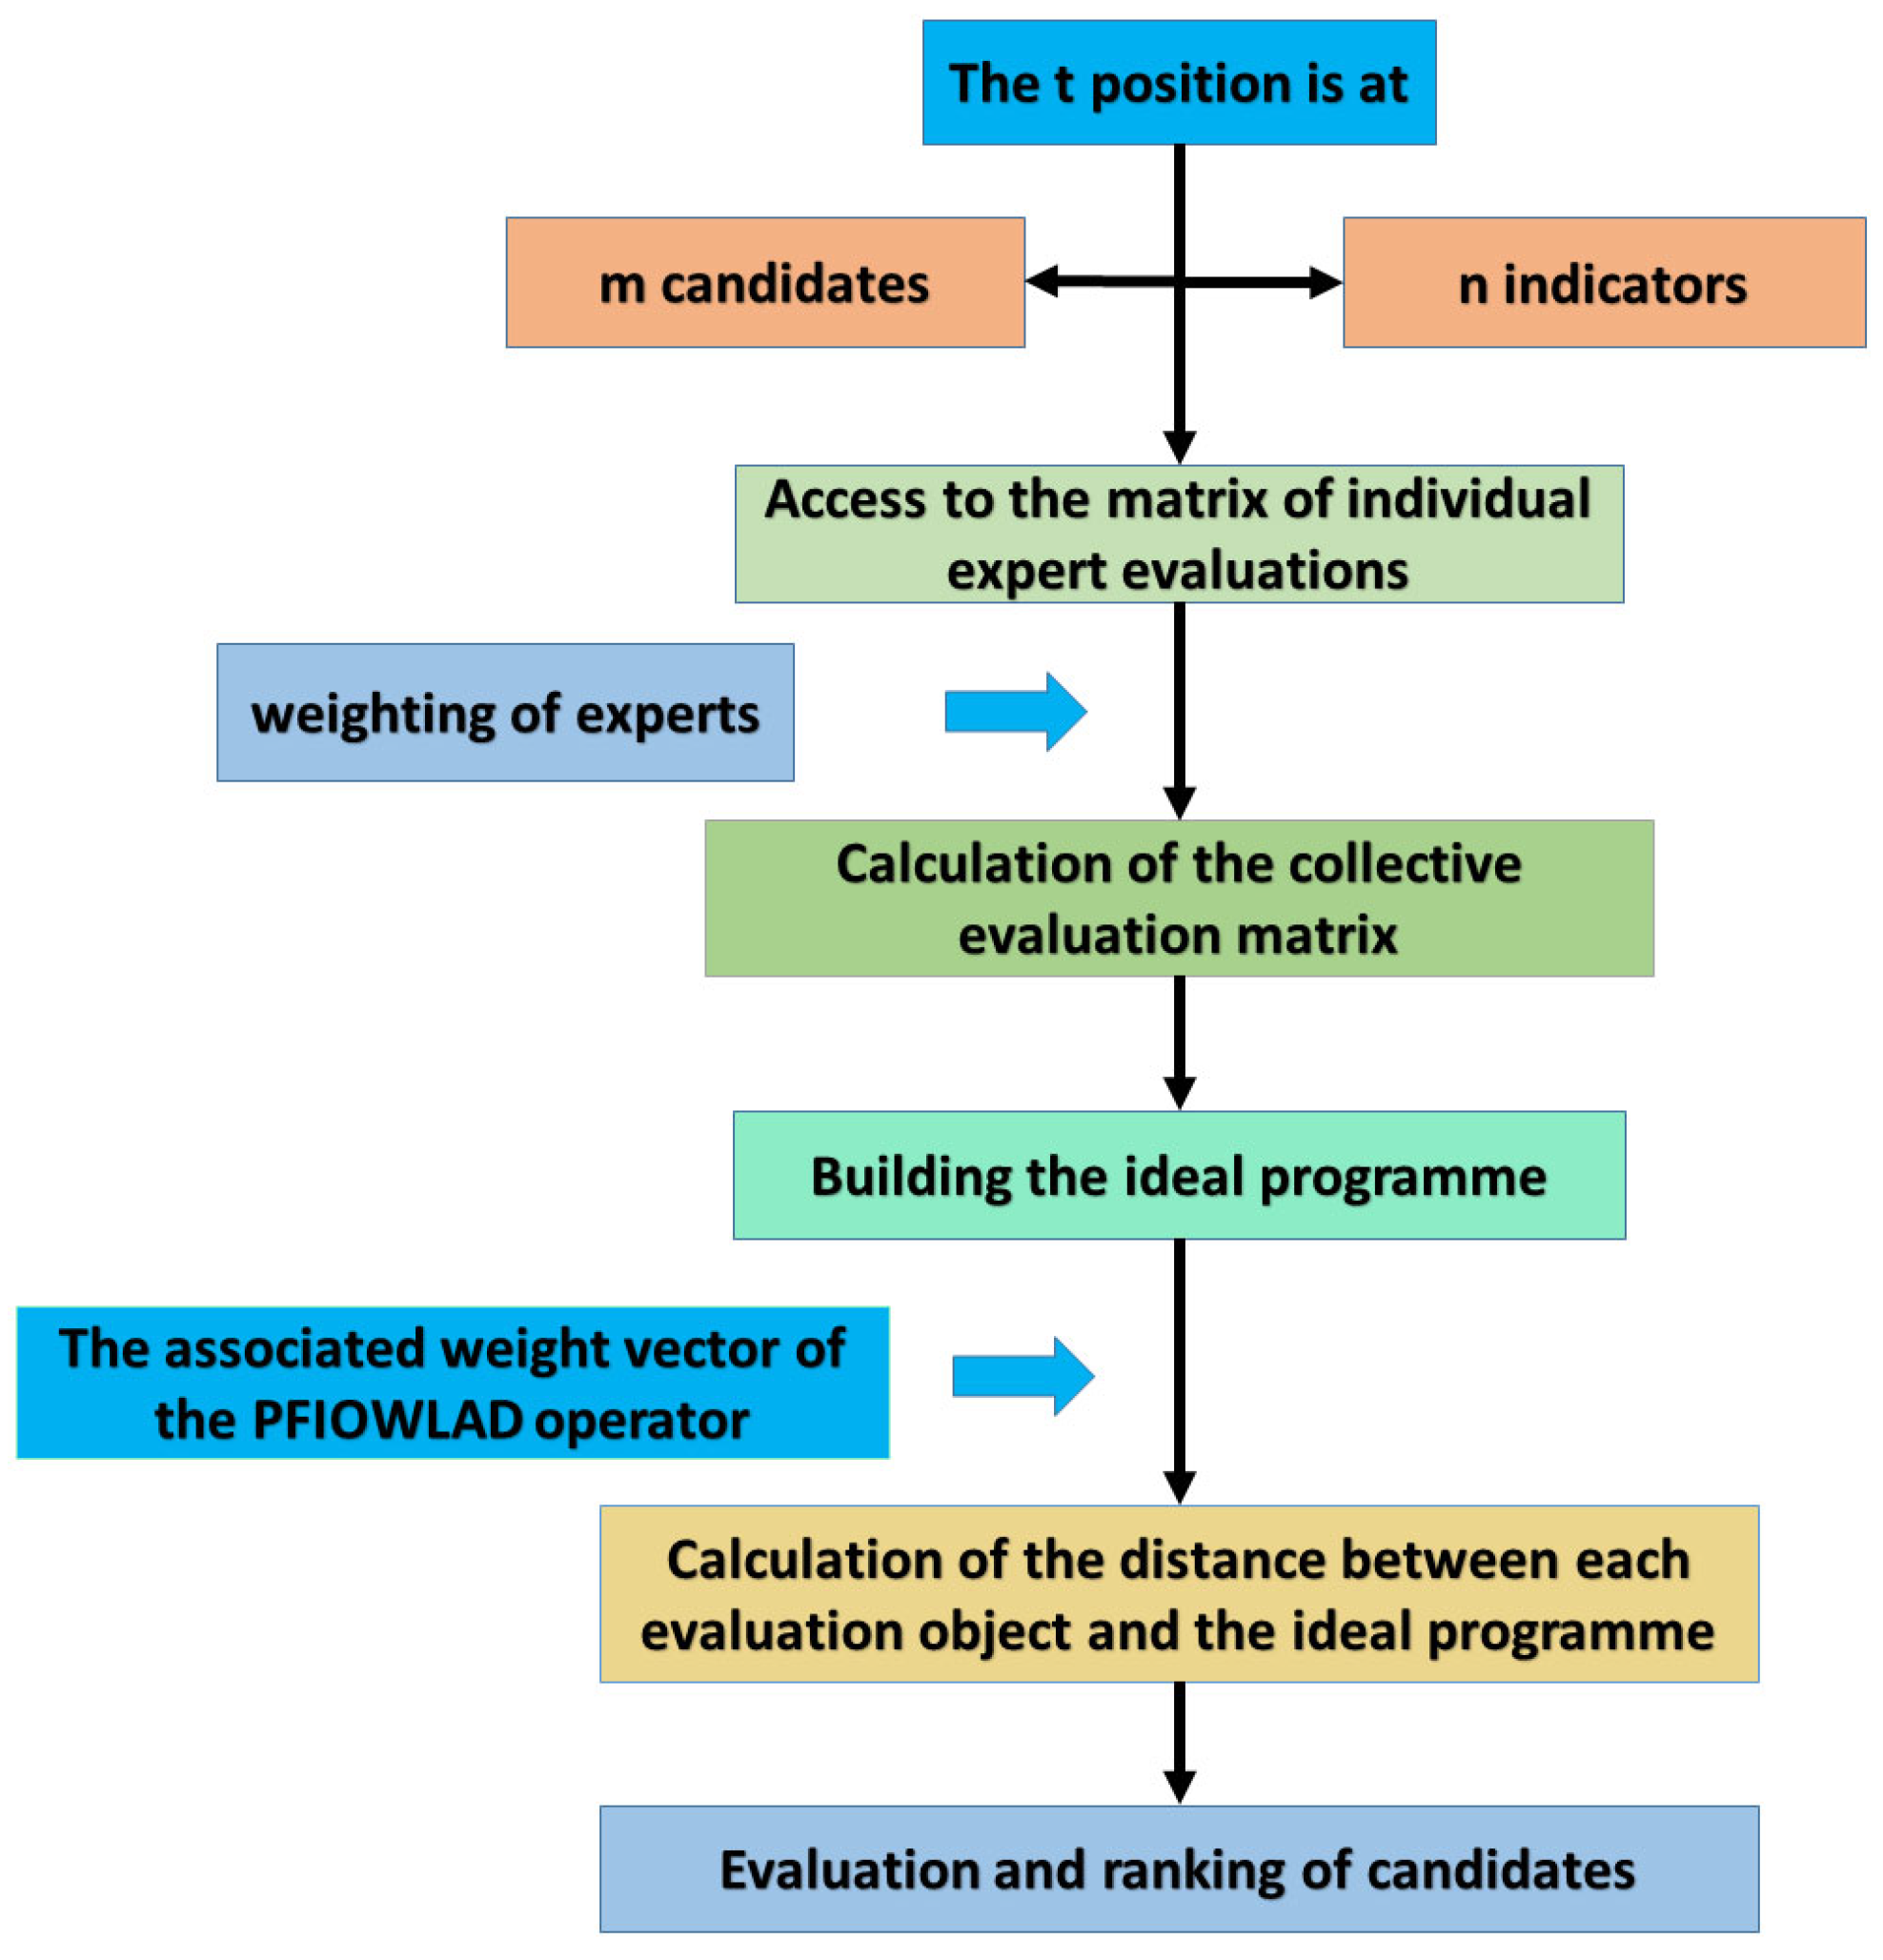
2.2. Pythagorean Fuzzy Set Theory

Since Pythagorean fuzzy sets were introduced by Yager [33] in 2013, they have quickly attracted extensive research and attention from scholars worldwide. As an extension of the intuitionistic fuzzy set theory, this approach further refines the depiction of uncertainty by introducing the condition that the sum of the squares of the membership degree and the non-membership degree should not exceed 1, providing a more flexible and powerful mathematical tool for fields such as multi-attribute decision making.
In the in-depth study of Pythagorean fuzzy set operators, the PFIOWLAD operator stands out as an innovative integration method, distinguished by its ingenious fusion of the concept of logarithmic distance. This operator dynamically adjusts the distance through an ordered induced vector, aiming to more accurately capture and reflect the complexity of the evaluation process and the subjectivity of expert assessments. Specifically, the PFIOWLAD operator not only fully considers the objective differences between the evaluated subjects but also assigns weights based on the expertise and experience of the experts, achieving an organic combination of subjective and objective information, significantly enhancing the accuracy and comprehensiveness of the evaluation.
In the construction of the relative weight vector for the PFIOWLAD operator, employing the normal distribution method is a scientific and rational choice [34]. The normal distribution, due to its wide applicability and excellent mathematical properties, performs remarkably in simulating and reflecting the distribution of expert weights. Utilizing the normal distribution method not only accurately reflects the significance and influence of different experts in the evaluation process but also effectively reduces the biases that may arise from the subjective judgments of individual experts, thereby enhancing the objectivity and reliability of decision outcomes. The specific formula for obtaining the relative weight vector of the PFIOWLAD operator using the normal distribution method is denoted as w i , and is expressed as follows:
w i = 1 2 π σ n e ( ( i μ n ) 2 2 σ n 2 ) , i = 1 , 2 , n
in which μ n and σ n represent the mean and standard deviation of data 1, 2, …, n, respectively.
w i = 1 2 π σ n exp ( ( i μ n ) 2 2 σ n 2 ) i = 1 n 1 2 π σ n exp ( ( i μ n ) 2 2 σ n 2 ) = exp ( ( i μ n ) 2 2 σ n 2 ) i = 1 n exp ( ( i μ n ) 2 2 σ n 2 ) , i = 1 , 2 , , n
This study employs a systematic evaluation process, as illustrated in Figure 2, strictly adhering to the methodological principles of scientific rigor. Initially, the study establishes an assessment committee comprising t experts with profound professional knowledge and practical experience in their respective fields. This committee is tasked with conducting a comprehensive and in-depth evaluation of m candidate subjects and n indicators, thereby forming an individual evaluation matrix that ensures the thoroughness and professionalism of the evaluation process. After establishing the weights of each expert, the collective evaluation matrix is further calculated. The normal distribution method is utilized to determine the relative weight vector of the PFIOWLAD operator, a step that ensures the rationality and scientific nature of weight distribution in the evaluation process. Subsequently, the collective evaluation matrix is integrated using the PFIOWLAD operator to calculate the distance between each evaluation subject and the ideal solution. Ultimately, the evaluation subjects are ranked based on the computational results, providing clear and scientific criteria for decision makers, effectively supporting the decision-making process. This process not only enhances the objectivity and accuracy of the evaluation but also offers a powerful analytical tool for decision making in complex fields such as underground engineering.
Pythagorean fuzzy numbers offer an effective solution to the issue of excessive subjectivity in expert assessments by introducing the method of normal distribution for weight assignment, thereby enhancing the rationality of decision making. However, this approach still requires continuous refinement and adjustment in practical applications to ensure its effectiveness and applicability across various decision-making scenarios.

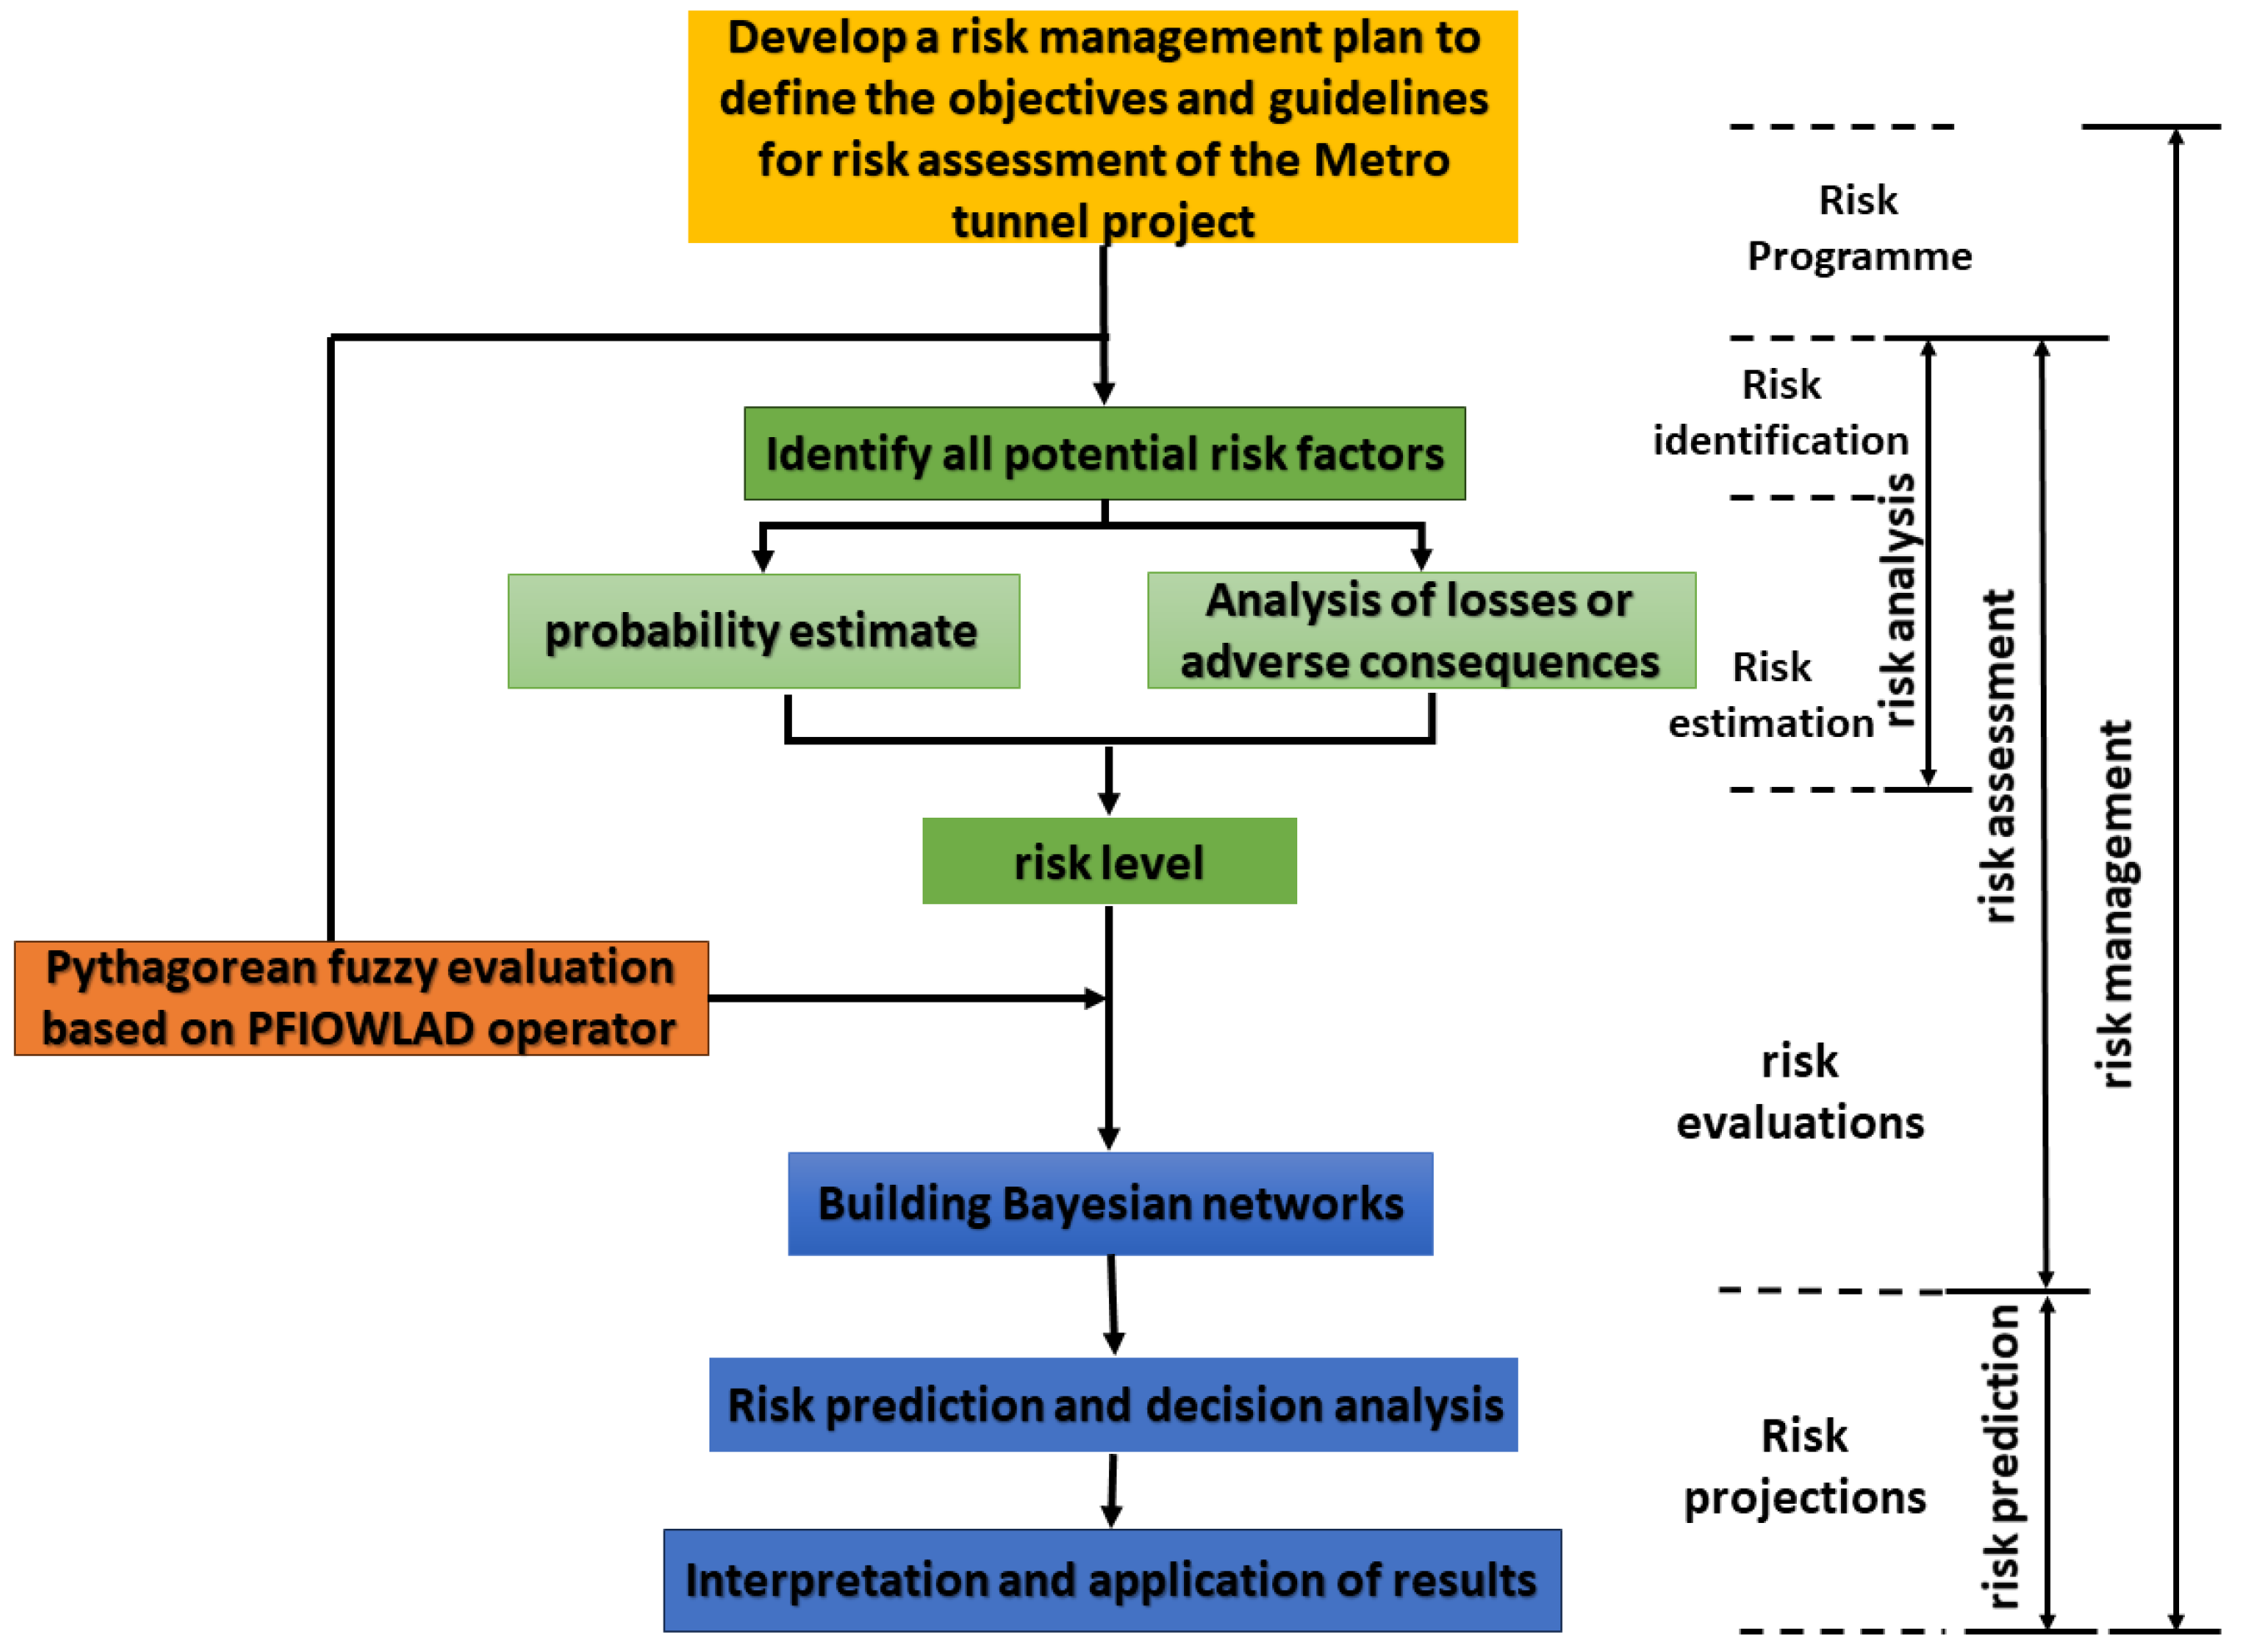
2.3. Bayesian Network

Bayesian methods, as a powerful probabilistic tool, have demonstrated unique value in dealing with uncertainty issues, especially in the risk assessment of complex construction environments [35]. By ingeniously integrating the knowledge of authoritative experts with fuzzy theory, this approach can obtain prior probabilities that are closer to reality, thereby significantly enhancing the precision of risk assessment. In the context of risk assessment, the Bayesian model is primarily composed of two core elements: the structural relationships between risk factors and the parameters of each risk factor. This model can be intuitively represented graphically with nodes and arcs, where each node symbolizes a specific variable, and the state of the node accurately reflects the probabilistic measure of that risk factor. The arcs play the role of showing the causal relationships between nodes, clearly revealing the mechanism of interaction between risk factors.
The parameter system of a Bayesian network is constructed from a collection of conditional probabilities, which endows the model with powerful expressive capabilities. Specifically, each node in the network is equipped with a conditional probability table that exhaustively describes the correlations between its parent and child nodes, thereby precisely capturing and reflecting the dependency relationships between adjacent nodes. Through such an ingenious design, Bayesian networks not only provide a comprehensive and detailed depiction of risk factors and their intricate interrelationships in complex construction environments but also offer a solid scientific basis for risk assessment, making the risk evaluation process more accurate and efficient.
A Bayesian network consists of a set of nodes X = ( F , N ) , P , where F represents the set of nodes in the network, N signifies the directed acyclic graph structure between nodes, and P denotes the conditional probability distribution of each node. Under the network structure of specific risk factors, the network parameters can be progressively optimized through the calculation of prior and posterior probabilities. The set of discrete node variables F = G 11 , G 12 , , G n n describes the collection of variable nodes within the network.
In this study, an integrated evaluation method was employed, aiming to refine the expert assessment process and enhance the objectivity of the results through scientific methodology. Specifically, this research initially utilized Pythagorean fuzzy numbers to process the expert assessment data obtained from the Delphi method survey. The advantage of Pythagorean fuzzy numbers lies in their ability to more delicately express the evaluators’ opinions and reduce the bias that might be introduced by the subjective judgment of a single expert in the calculation process, thereby assisting us in finding an evaluation result closer to the ideal solution.
Subsequently, to further enhance the precision and reliability of the assessment, the refined evaluation data were applied to a Bayesian network for in-depth analysis. As a probabilistic graphical model, a Bayesian network can effectively represent and reason about complex probabilistic relationships between variables. In this study, the application of Bayesian networks aimed to determine the final weight distribution of each evaluation criterion through further processing of the expert assessment data.
P ( Y = y i , X = x i ) = P ( X = x i ) × P ( Y = y i | X = x i )
P ( Y ) = i P ( X x i ) × P ( Y = y i | X = x i )
p ( X = x i | Y = y j ) = P ( X = x i ) × P ( Y = y j | X = x i ) P ( Y = y j )

3. Construction of Underground Tunnel Engineering Construction Risk Model

3.1. Risk Assessment Indicator System Construction

Underground tunnel engineering, as a vital component of urban infrastructure construction, is characterized by complex construction environments, high technical requirements, and significant safety risks [36]. Analyzing the main risks faced during the construction process of underground tunnel engineering in recent years reveals that the risks in underground tunnel engineering mainly exist in four major criteria indicator layers: geological and groundwater conditions, foundation pit construction technical risks, construction management, and the surrounding environment. In conjunction with relevant materials and expert consultation, 12 indicators were selected. The geological and groundwater conditions included three indicators: distribution of groundwater, rock formation, and soil bearing capacity. The foundation pit construction technical risks included three indicators: the standardization of the support system, the rationality of soil construction methods, and the effectiveness of detection methods. Construction management included three indicators: the state of safety management at the construction site, the effectiveness of engineering quality management, and the completeness of emergency plans. The surrounding environment included three indicators: traffic control, assessment of the impact of surrounding buildings, and public safety risk analysis. The construction of the underground tunnel construction risk evaluation index system is shown in Figure 3.

3.2. Construction of a Bayesian Network Risk Assessment Model Based on Pythagorean Fuzzy Sets

The construction of the Bayesian network model plays a pivotal role in the visual representation of risk factors in underground tunnel construction, especially in terms of accurately depicting the underlying correlations and interaction mechanisms between various risk factors [37]. This model not only deeply analyzes the complexity and inherent uncertainty in the field of tunnel construction safety but also endows the capability for dynamic safety risk assessment and prediction based on multi-factor changes. By quantifying the state transitions of each risk factor and their cascading effects, the model provides a scientific basis for decision-makers, aiding them in formulating more precise and efficient safety management strategies. The aim is to significantly reduce the likelihood of construction accidents and to enhance the overall level of construction safety.
Furthermore, the Bayesian network model has opened up new perspectives and pathways for research in the field of tunnel construction safety, establishing a highly systematic and flexible analytical framework. It not only provides an in-depth analysis of the intricate interdependencies and influence mechanisms among various factors throughout the entire construction process but also offers solid theoretical support and practical guidance for the continuous optimization of construction safety management systems and the promotion of innovative practices in construction safety. The risk assessment flowchart for underground tunnel engineering construction is shown in Figure 4, which visually demonstrates the operational process and significant effectiveness of the model in practical application. It not only validates its scientific and practical applicability but also provides a reference paradigm for subsequent research and application.
Expert opinions on the risk probabilities of engineering projects were collected using the Delphi method and transformed into numerical form. To address the subjectivity and uncertainty inherent in expert assessments, the Pythagorean fuzzy induced ordered weighted averaging distance (PFIOWLAD) operator was applied to evaluate and weight the characteristics in the dataset, aiming to reduce the impact of redundant information on the risk assessment results. Based on this, a Bayesian network model was constructed, taking into account the specific risk conditions of the engineering project, the interdependencies among risk factor indicators, and their joint distribution. With the aid of GeNIe 4.0 software, the internodal relationships in the established Bayesian network topology were determined according to expert experience and relevant accident investigation reports [38]. Subsequently, the expert assessment data collected were input into the model to preliminarily obtain the posterior probabilities of each risk factor. Furthermore, by integrating existing data, such as case studies of risk accidents in actual projects, the parameters of the Bayesian network were adjusted through learning and inference, making the distribution of posterior probabilities more aligned with the actual situation.
The Bayesian risk assessment model based on the Pythagorean fuzzy induced ordered weighted averaging distance (PFIOWLAD) operator integrated the weighting of feature selection with the advantages of Bayesian inference, effectively addressing complex risk assessment issues. This model not only enhanced the accuracy of predictions but also deepened the analysis and understanding of risk factors, providing a robust basis for scientific decision making.

4. Practical Engineering Application and Analysis

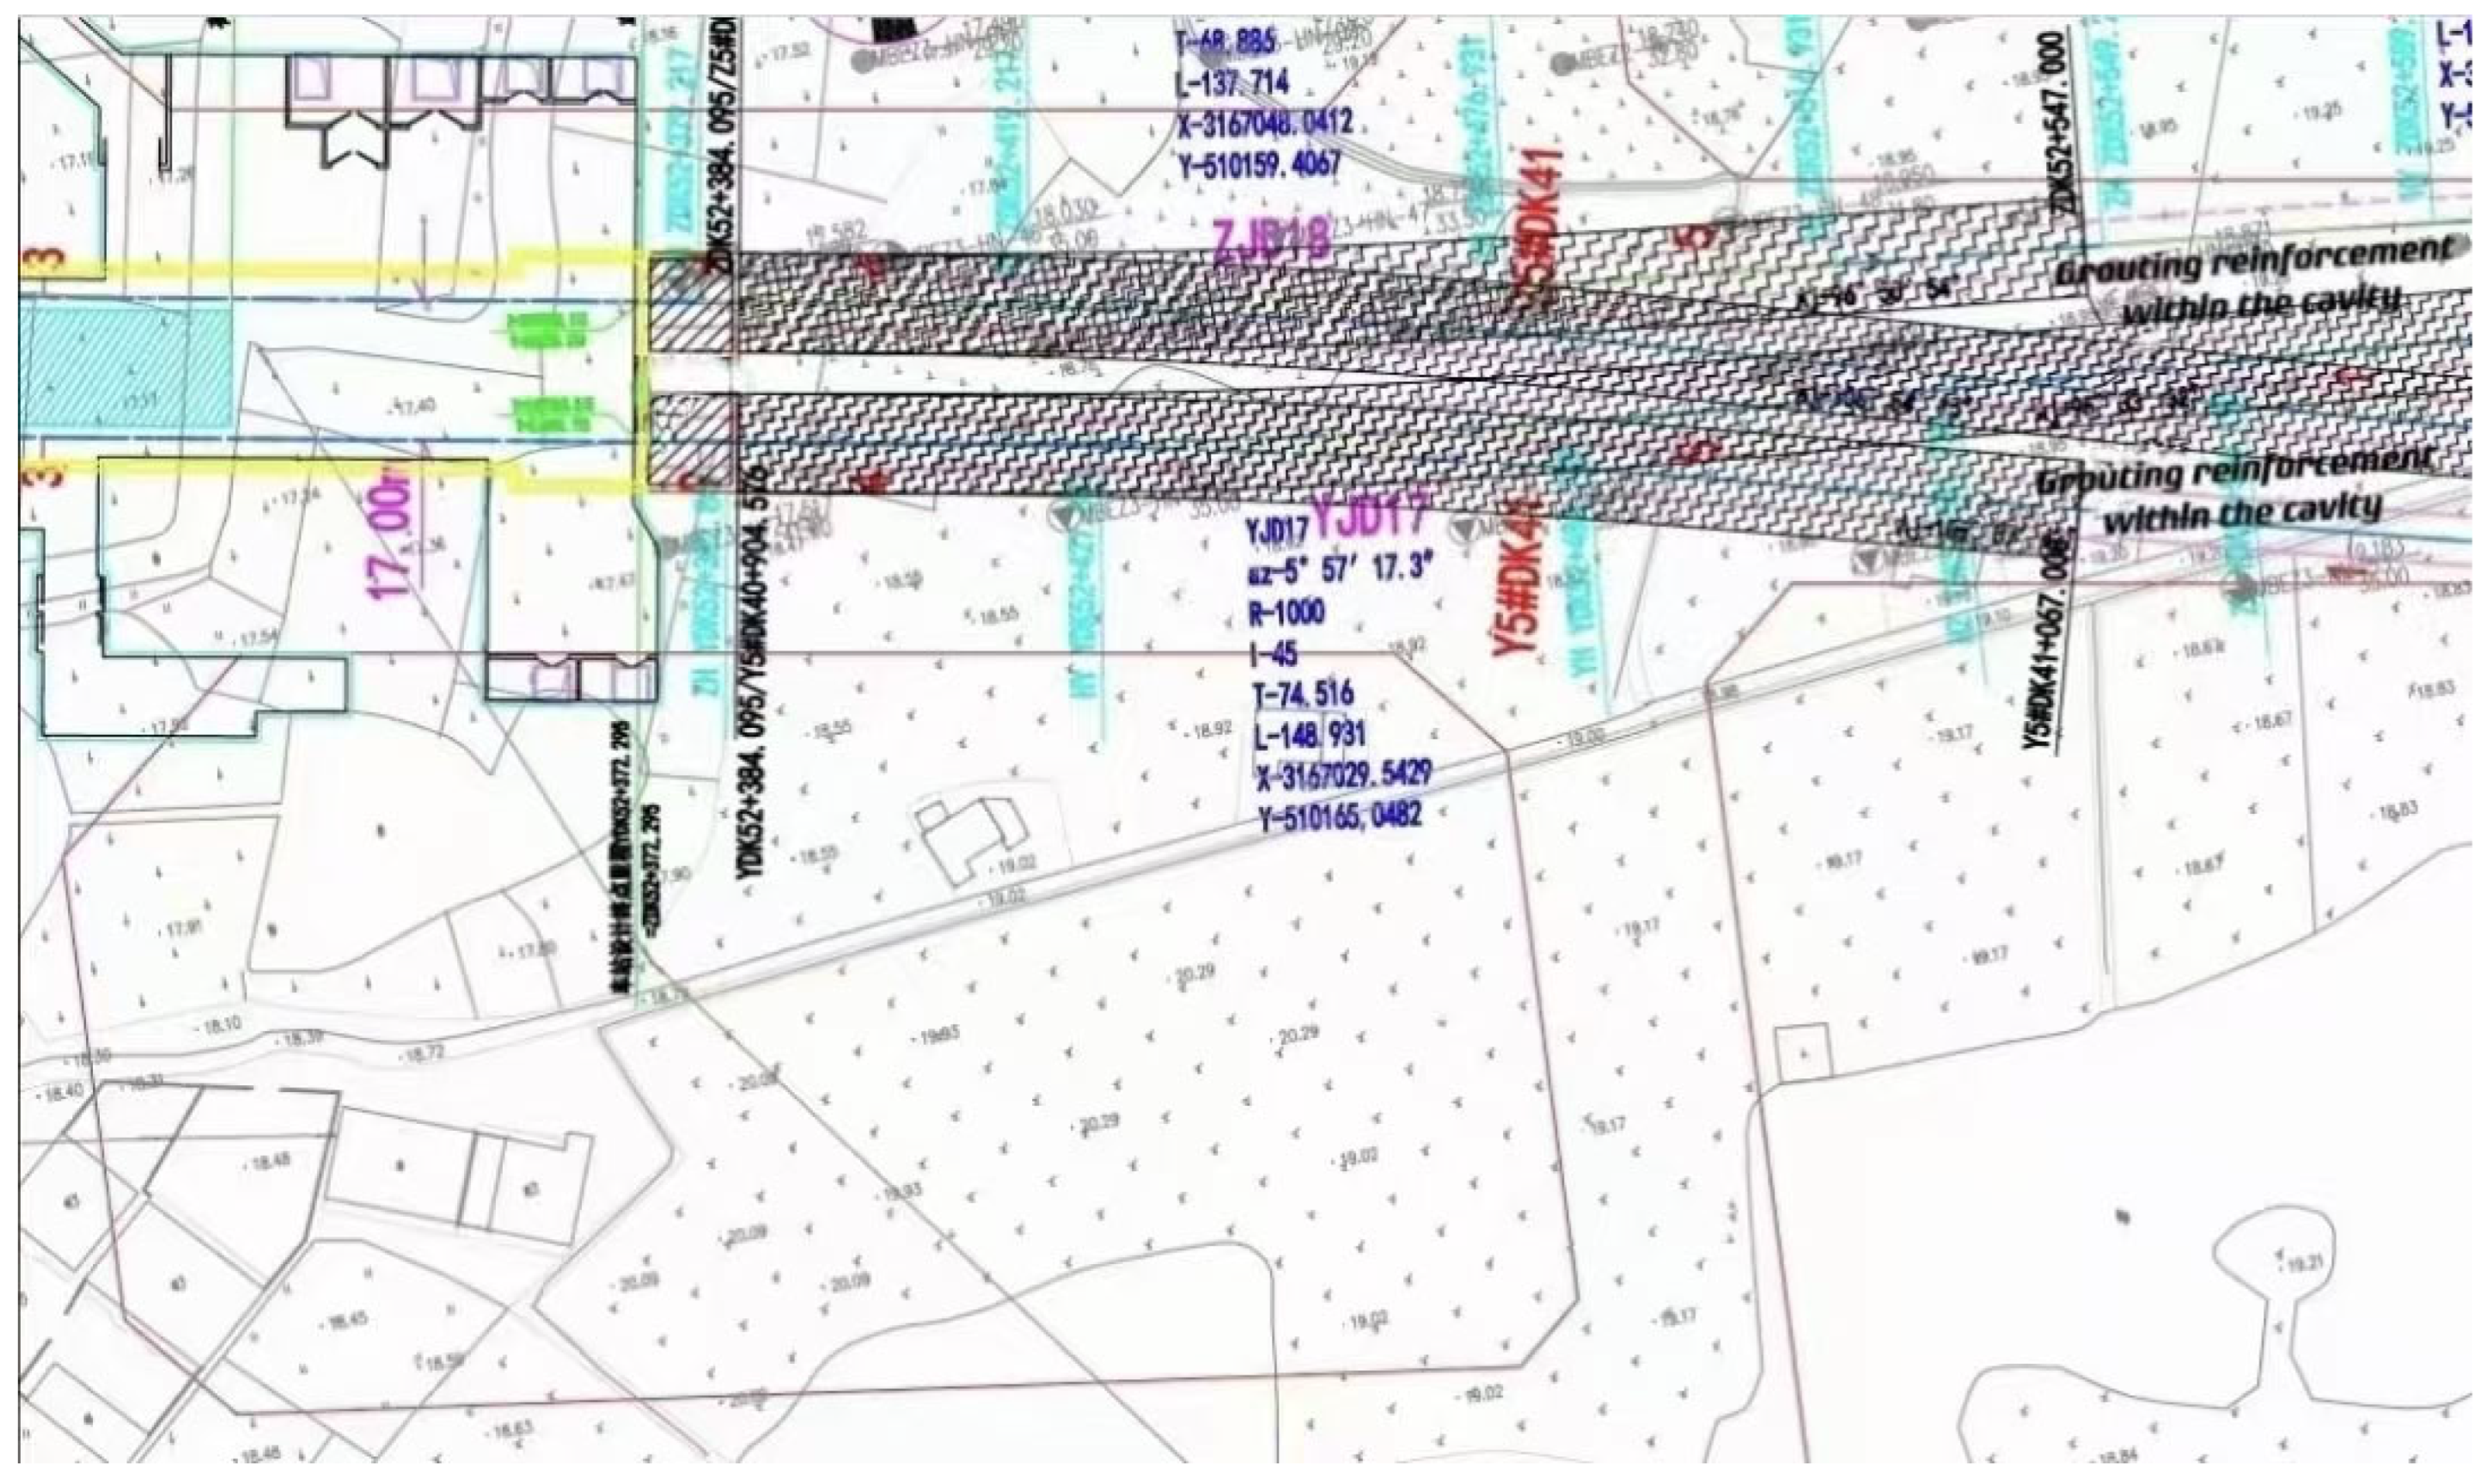
4.1. Project Overview

The Nanchang Metro Line 2 project, planned to extend along Guangzhou Road, proposes a scheme for vertically crossing under Tianxiang Avenue and establishing the Nanchang East High-Speed Railway Station beneath it, as illustrated in Figure 5. The construction area primarily encompasses farmland and wasteland designated for urban road usage in the planning. Additionally, there is an approximately 100 m long parallel section above and below Line 2 and Line 5 after Hufan Station, with Line 5 being constructed first, followed by the development of Line 2. The tunnel design incorporates an assembled circular lining structure, utilizing common ring segments with an inner diameter of 5400 mm and an outer diameter of 6000 mm, and implementing interlocking assembly technology.
Based on the results of geological surveys and mapping, combined with an analysis of the geomorphological genesis and morphological characteristics, the topography of this section is classified as a second-level terrace in the Gan-Fu alluvial plain area. The terrain is relatively open and flat, with ground elevations ranging from 17.49 m to 22.64 m, and a height difference of approximately 5.15 m, where the surfaces of ditches and ponds are relatively lower in elevation. Further geological investigations have revealed the presence of multiple strata of soil and rock, which are primarily categorized based on geological age, genesis type, lithological characteristics, and degree of weathering. These include the Quaternary System’s recent alluvial layer (Q4ml), the Quaternary System’s recent lacustrine deposits (Q4), the Quaternary System’s upper Pleistocene alluvial layer (Q3al), and the Paleogene System’s Xinyu Group bedrock (Exn). Specifically, the Quaternary System’s recent fill layer (Q4ml) comprises miscellaneous fill and plain fill, mainly consisting of gravel, bricks, and domestic waste, with a small amount of cohesive soil. The miscellaneous fill, with an asphalt or concrete surface for the top 20 cm, has a thickness ranging from 0.90 m to 8.50 m, with an average thickness of 3.90 m. The Quaternary System’s recent lacustrine deposits (Q4) are predominantly silty clay, gray-black in color, in a flowing to soft plastic state, containing organic matter and a fishy odor, with a thickness ranging from 0.40 m to 0.50 m, averaging 0.48 m. The Quaternary System’s upper Pleistocene alluvial layer (Q3al) is composed mainly of sand layers and cohesive soil layers, with sand layers including fine sand, medium sand, coarse sand, gravel, and pebbles, and cohesive soil including silty clay and hard plastic clay, with a thickness ranging from 1.10 m to 13.40 m, averaging 8.17 m. The Paleogene System’s Xinyu Group bedrock (Exn) serves as the foundational rock stratum of the area and has a crucial impact on tunnel construction.

4.2. Construction Risk Assessment

4.2.1. Application of Pythagorean Fuzzy Numbers

Focusing on the construction risk assessment of the Nanchang Metro project, this study introduced the theory of Pythagorean fuzzy sets to enhance the precision and applicability of multi-indicator evaluation. An assessment committee comprising 32 senior experts in the field of metro construction was established by the research team. Leveraging their extensive practical experience, they conducted a comprehensive evaluation and analysis of the 12 key risk factors within the project. The adoption of this methodology ensured the comprehensiveness and in-depth nature of the risk assessment, providing robust decision support for construction risk management in metro engineering projects.
In this process, two core sets were involved: the risk factor set A = A 1 , A 2 , , A m and the expert set F = F 1 , F 2 , , F n . Considering the potential fuzziness and uncertainty inherent in expert subjective evaluations, to mitigate the information loss caused by these subjective factors, this study employed the Pythagorean fuzzy induced ordered weighted averaging distance operator to refine the quantified expert evaluation information. Ultimately, these processed computational results served as an important basis for assessing the risks associated with the project.
To more accurately adjust the probability parameters of the risk impact of various factors, this study, based on the Delphi method, also integrated the theory of Pythagorean fuzzy numbers [39]. In the assessment process of subway construction risk causes, the evaluation information of four representative experts is represented in the form of individual evaluation matrices, as shown in Table 1. In the context of expert evaluation schemes, weight allocation plays an essential role. To fully reflect the different importance and influence of each expert in the evaluation process, specific weight vectors τ = 0.3 , 0.2 , 0.3 , 0.2 were assigned according to the expert’s professional level and influence in the industry. This weight vector was designed to reflect the varying significance of each expert in the overall evaluation scheme. Based on such weight distribution, a Pythagorean fuzzy induced ordered weighted averaging distance (PFIOWLAD) collective evaluation matrix R q = ( r i j ) 4 × 4 was further constructed, as illustrated in Table 2.
Taking R 1 ( A 1 F 1 ) as an example, the calculation is as follows: R ( A 1 F 1 ) = ( 0.4 × 0.3 + 0.3 × 0.2 + 0.2 × 0.3 + 0.9 × 0.2 , 0.6 × 0.3 + 0.4 × 0.2 + 0.7 × 0.3 + 0.3 × 0.2 ) . Similarly, R ( A 1 F 2 ) can be obtained as < 0.78 , 0.44 > , and R ( A 1 F 3 ) as < 0.56 , 0.43 > . This matrix not only synthesized the evaluative opinions of all experts but also fully considered the weight differences among them during the evaluation process, thereby providing us with a more comprehensive and accurate basis for assessment. For each specific indicator, the maximum membership degree and the minimum membership degree were carefully selected from the matrix R q = r ij m n , using these as the basis to construct the ideal scheme I [40], as shown in Table 3. Taking I F 1 as an example, the maximum membership degree in the collective evaluation matrix corresponding to F 1 was M a x { 0.42 , 0.73 , 0.65 , 0.51 } , and the minimum membership degree was M i n { 0.53 , 0.38 , 0.25 , 0.55 } ; thus, I F 1 = < 0.73 , 0.25 > . Similarly, I F 2 = < 0.78 , 0.40 > , I F 3 = < 0.67 , 0.43 > , and I F 4 = < 0.70 , 0.35 > .
R q = ( r i j ) 4 × 4 ( q = 1 , 2 , 3 , 4 )
Here, r i j q denotes the evaluation of the candidate risk assessment probability relationship A i under the criterion F j by expert q .
Utilizing the method of normal distribution [41], we could derive the associated weight vector W for the PFIOWLAD operator as W = w 1 , w 2 , w 3 , w 4 , which was W = 0.2 , 0.3 , 0.3 , 0.2 . To evaluate the candidate schemes, we calculated the distance between each candidate solution A i and the ideal solution I , selecting the expert evaluation with the minimum distance as the index for the probability level of risk assessment. The Beidou Tianyuan method was employed to calculate the distance between the candidate assessment results and the ideal assessment results for evaluation purposes, as follows:
d P D F ( α i β i ) = 1 2 ( | α i 1 2 β i 2 2 | + | α i 2 2 β i 2 2 | + | ( 1 α i 1 2 β i 2 2 ) ( 1 α i 2 2 β i 2 2 ) | )
P F I O W L A D ( < α 1 , β 1 > , , < α n , β n > ) = exp w j I n ( d P F D ( α σ ( j ) , β σ ( j ) ) )
in which d P F D ( α σ ( j ) , β σ ( j ) ) denotes d P F D ( α i , β i ) ) corresponding to the jth largest μ i in the fuzzy number pair < x i , y i > .
The computational process was conducted using Beidou Tianyuan V3.0 software, and the computational code along with the results are shown in Figure 6.
The calculations showed that
P F I O W L A D ( A 1 , I ) = exp j = 1 4 w j I n d P F D ( r σ ( 1 , j ) , I σ ( j ) ) = 0.1221
P F I O W L A D ( A 2 , I ) = 0.15751
P F I O W L A D ( A 3 , I ) = 0.1421
P F I O W L A D ( A 4 , I ) = 0.30189
Therefore, candidate A 1 was selected.

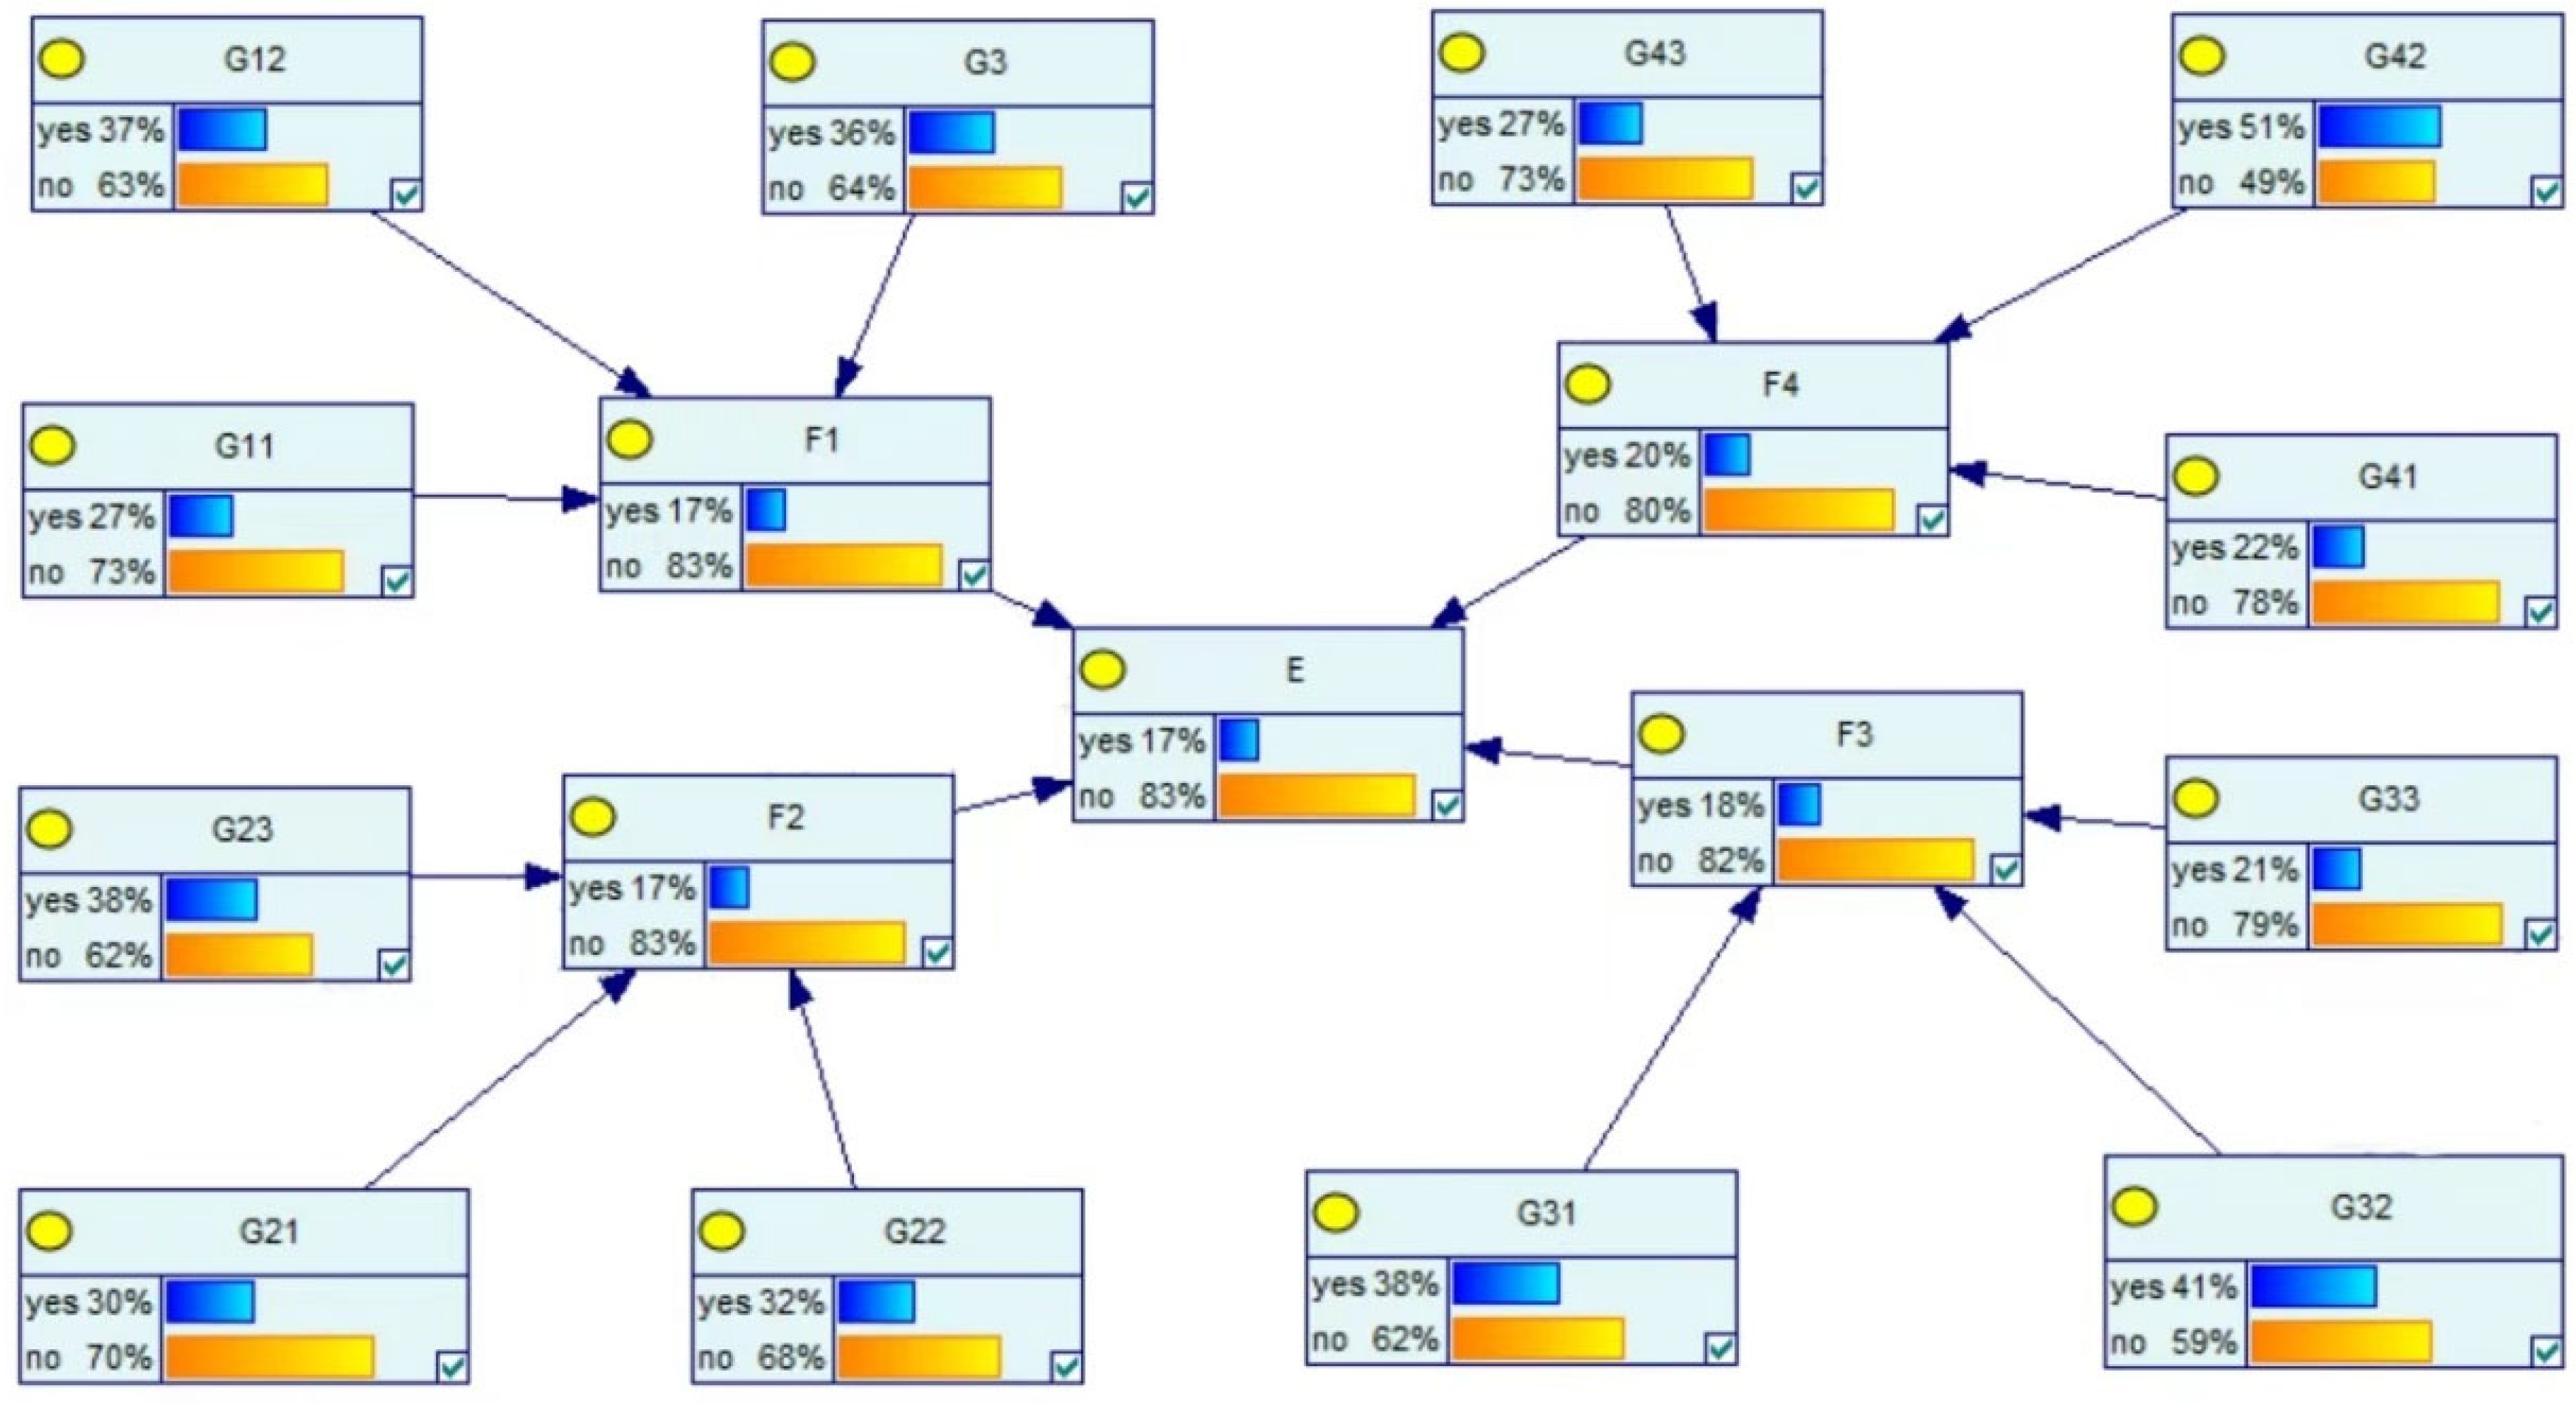
4.2.2. Risk Probability Analysis of Bayesian Networks

Based on the judgment of Pythagorean fuzzy numbers, representative evaluation information was selected. Experts, according to the proportional scoring system, conducted a comparative analysis of the importance of risk factors at the same hierarchical level and performed a quantitative scaling to construct a judgment matrix. The weight vector was calculated separately using the geometric mean method. Here, the weight vectors of the three experts judged to be representative of A 1 were averaged to serve as the final weight vector. Taking the calculation of the weight vector F 4 for G 41 to G 43 as an example, the respective weight vectors were G 4 1 = [ 0.19   0.52   0.29 ] , G 4 2 = [ 0.24   0.49   0.27 ] , G 4 3 = [ 0.23   0.52   0.25 ] , and F 4 = ( G 41 + G 42 + G 43 ) / 3 = [ 0.22   0.51   0.27 ] . Similarly, the weight vectors for  G 11 to G 13 was F 1 = [ 0.27   0.37   0.36 ] , for G 21 to G 23  was  F 2 = [ 0.30   0.32   0.38 ] , and for G 31 to G 32 was F 3 = [ 0.38   0.41   0.21 ] . The weight vector for F 1 to F 4 was defined as E = [ 0.04   0.40   0.41   0.05 ] . Based on this, a Bayesian network topology was established and probability weights between various factors were inputted. Additionally, the content link for the survey questionnaire conducted via the Wenjuanxing platform is https://www.wjx.cn/vm/tevHLKI.aspx#, accessed on 13 July 2024. Due to space limitations, only the conditional probability calculation for the ‘Surrounding Environment F 4 ’ node is illustrated as an example. Experts determined that the probability of the occurrence of ‘Emergency Plan Completeness G 33 ’ was caused by ‘Construction Management F 3 ’. Utilizing GeNIe 4.0 software for computation, where the influence proportion of ‘Construction Management F 3 ’ was 0.41, an input of 0.41 was entered under ‘yes’ and 0.59 under ‘no’. Based on the probabilities of occurrence and non-occurrence of each indicator, the probabilities of each accident could then be derived, as shown in Figure 7.
To further refine the model, risk accidents and their causal relationships that occurred in actual projects were taken into account. Adjustments and optimizations were made to the relevant nodes in the network based on the causal logic of accidents. Consequently, a Bayesian network model of the causal chain for construction risks in subway engineering was obtained [42], as shown in Figure 8. Additionally, during the implementation of a project, it is essential to record the types and frequencies of risk accidents in a timely manner. Factors of frequent risk accidents that were not initially considered should be incorporated into the risk assessment indicators. The probability parameter table for this project in GeNIe 4.0 should be updated regularly, thereby endowing the model with a dynamic and updatable risk assessment system. This facilitates continuous adjustment of control measures and optimization of the model according to the actual situation during the implementation process.
Meticulous classification and assessment of risk factors during the construction process of Nanchang Metro Line 2 were conducted. A thorough review of the literature on underground engineering risks revealed that these risks were finely categorized into five specific levels [43]. Based on the probability intervals of accident occurrence, the risk levels were divided into five distinct grades. Specifically, an accident probability between 0.01% and 0.1% was described as ‘very rare’, between 0.1% and 1% as ‘occasional’, between 1% and 10% as ‘possible’, and above 10% as ‘frequent’, as shown in Table 4.
Building upon the pre-existing risk causal chain network model, this research further revised and provided a detailed record of the indicator layer that may trigger accidents during the construction process of a section of Nanchang Metro Line 2. By inputting these risk indicators into GeNIe 4.0 software in the form of a probability parameter table, new causal weights for the indicator layers were obtained. The assessment results highlighted six key risk factors, with their probabilities of causing accidents during construction being ‘Emergency Plan Completeness’ at 10.2%, ‘Soil Excavation Method Rationality’ at 12.8%, ‘Support System Standardization’ at 12.8%, ‘Detection Means Effectiveness’ at 14.4%, ‘Inadequate Safety Management at the Construction Site’ at 19.9%, and ‘Lack of Engineering Quality Management’ at 20.9%, as shown in Table 5. These data not only revealed the significance of each risk factor but also indicated their combined impact on construction safety. Given the frequency and severity of these risk factors, we integratedly determined the construction risk engineering level to be ‘Level II, Moderate’. This determination implied that without effective intervention, the probability of accidents occurring was non-negligible. Therefore, it is recommended that construction units take necessary preventive and control measures to reduce the risk of accidents and ensure the safety of the construction process.
To enhance the safety of construction and the reliability of engineering quality, it is emphasized that construction entities must strictly adhere to design specifications, industry standards, and safety protocols. Furthermore, construction entities are required to strengthen the management of engineering quality and optimize the safety precautions at the construction site to reduce the frequency of risk incidents.

4.3. Construction Risk Prevention and Control Measures

Data analysis from the Delphi method survey indicated that the Nanchang Rail Transit Line 2 subway tunnel construction faces a variety of risk factors, the importance of which necessitates effective preventive measures to ensure the safety and quality of the project. Key factors such as the effectiveness of engineering quality management, safety management at the construction site, rationality of soil excavation methods, effectiveness of detection means, standardization of support systems, and completeness of emergency plans play a crucial role in risk control and prevention.
In response to the risk model predicted in advance, a series of targeted preventive measures should be implemented. The enforcement of these measures significantly reduces the probability of risk incidents occurring [44]. In terms of engineering quality management, strict quality control and inspection systems should be reinforced to ensure that every aspect of the construction process adheres to established standards. Concurrently, high-quality materials and advanced construction techniques should be selected to enhance the overall quality and durability of the project. Additionally, dedicated personnel should be assigned to oversee quality, with regular documentation and reporting on construction quality to ensure the effectiveness and continuity of quality management. In the realm of construction site safety management, detailed safety plans and operating procedures should be formulated, along with regular comprehensive safety training to ensure that all personnel fully understand and strictly comply with safety operating regulations [45]. Moreover, necessary safety facilities and personal protective equipment should be provided to maximize the safety of construction workers.
It is evident that effective preventive measures are crucial for ensuring the safety and quality of subway tunnel construction. By implementing stringent quality management, comprehensive safety management, scientifically sound construction methods, and effective monitoring and emergency plans, we can significantly mitigate the risks and challenges that may be encountered during construction. This will ensure the smooth progress of the project and meet the expected safety standards and quality requirements.

5. Conclusions and Discussion

Focusing on the risk assessment of a specific section of the Nanchang Metro Line 2 construction project, this study employs a method that integrates Pythagorean fuzzy numbers with Bayesian networks to conduct an in-depth analysis of expert evaluation data obtained through the Delphi method. The findings identify key risk factors, including the ‘completeness of emergency plans’, ‘rationality of soil excavation methods’, ‘standardization of support systems’, ‘effectiveness of detection methods’, ‘poor safety management at construction sites’, and ‘insufficiency of engineering quality management’, quantifying the probabilities of these factors causing risk incidents as 10.2%, 12.8%, 12.8%, 14.4%, 19.9%, and 20.9%, respectively. The conclusions drawn from this research not only provide decision support for the risk management of the Nanchang Metro Line 2 section project but also offer a new perspective and methodology for risk assessment in similar underground engineering projects, thereby advancing the state of knowledge in the field of risk assessment.
The Pythagorean fuzzy set theory employed enhances traditional risk assessment methods, particularly in addressing uncertainties and subjective judgments. By integrating a Bayesian network, this research further refines the dynamic updating capabilities of the risk assessment model, bringing the results closer to actual construction conditions and improving the adaptability and flexibility of risk management. Additionally, this study conducts a quantitative analysis of the weights of risk factors, providing a scientific basis for risk control and resource allocation in underground engineering projects.
While this study has achieved certain innovations and breakthroughs in risk assessment methods, it also has some limitations. Firstly, due to the scarcity of historical data, this study relies heavily on qualitative assessment methods. To overcome this limitation, it is recommended that future research strengthen the integration with actual engineering projects and collect more historical data to support quantitative analysis. In addition, the universality of this study awaits further verification. It is suggested that subsequent studies apply the methods of this research in different types of underground engineering projects to test and improve the model’s generalizability and accuracy. Lastly, the optimization of the risk management process and the enhancement of risk education are also important directions for future work to ensure that risk management measures can be effectively implemented.

Author Contributions

Conceptualization, Z.W. and Z.L.; methodology, Z.W.; software, T.J.; validation, Z.W., T.J. and Z.L.; formal analysis, Z.W.; investigation, T.J.; resources, Z.W.; data curation, Z.L.; writing—original draft preparation, T.J.; writing—review and editing, Z.W.; visualization, Z.L.; supervision, T.J.; project administration, Z.W.; funding acquisition, Z.W. All authors have read and agreed to the published version of the manuscript.

Funding

The study was supported by the National Natural Science Foundation Project of China (No. 42061011, No. 41977236), the Key Research and Development Program Project of the Jiangxi Natural Science Foundation (No. 20223BBG71W01), the Key Research and Development Program of the Jiangxi Science and Technology Special Fund Project (No. 20232BBE50025), and the Doctoral Scientific Research Foundation Project of East China University of Technology (No. DHBK2023014).

Data Availability Statement

Data available on request due to privacy.

Conflicts of Interest

The authors declare no conflict of interest.

References

  1. Ameyaw, E.E.; Hu, Y.; Shan, M.; Chan, A.P.C.; Le, Y. Application of delphi method in construction engineering and management research: A quantitative perspective. J. Civ. Eng. Manag. 2016, 22, 991–1000. [Google Scholar] [CrossRef]
  2. Hesse, A.A.; Atadero, R.A.; Ozbek, M.E. Using Expert Opinion to Quantify Uncertainty in and Cost of Using Nondestructive Evaluation on Bridges. Adv. Civ. Eng. 2017, 2017, 7925193. [Google Scholar] [CrossRef]
  3. Zhang, L.; Wang, Y.; Zhang, J.; Zhang, S.; Guo, Q. Rockfall hazard assessment of the slope of Mogao Grottoes, China based on AHP, F-AHP and AHP-TOPSIS. Environ. Earth Sci. 2022, 81, 377. [Google Scholar] [CrossRef]
  4. Maiers, J.; Sherif, Y.S. Applications of fuzzy set theory. IEEE Trans. Syst. Man Cybern. 1985, SMC-15, 175–189. [Google Scholar] [CrossRef]
  5. Naji, K.K.; Gunduz, M.; Alhenzab, F.; Al-Hababi, H.; Al-Qahtani, A. Assessing the Digital Transformation Readiness of the Construction Industry Utiliz-ing the Delphi Method. Buildings 2024, 14, 601. [Google Scholar] [CrossRef]
  6. Abramov, I.; AlZaidi, Z.A.K. Evaluation of the Effective Functioning of Construction Enterprises in the Conditions of Occur-rence of Diverse Risk Factors. Buildings 2023, 13, 995. [Google Scholar] [CrossRef]
  7. Lapidus, A.; Abramov, I.; Kuzmina, T.; Abramova, A.; AlZaidi, Z.A.K. Study of the Sustainable Functioning of Construction Companies in the Conditions of Risk Factors. Buildings 2023, 13, 2282. [Google Scholar] [CrossRef]
  8. Zhu, Y. A Prediction Method of Enterprise Evaluation Based on Genetic Taboo Algorithm. In Proceedings of the 2023 IEEE 15th International Conference on Computational Intelligence and Communication Networks (CICN), Bangkok, Thailand, 22–23 December 2023; pp. 74–79. [Google Scholar]
  9. Khan, S.; Pervez, A.; Zhang, Y.; Ahmad, S.; Sharifzada, H.; Ismail, E.A.; Awwad, F.A. Comprehensive risk assessment of Pakistan railway network: A semi-quantitative risk matrix approach. Heliyon 2024, 10, e32682. [Google Scholar] [CrossRef]
  10. Wu, H.; Wang, J.; Feng, J.; Liu, D.; Liu, S. Research on the decision-making of flood prevention emergency plans during reservoir con-struction based on generalized intuitionistic fuzzy soft sets and TOPSIS. Water Supply 2020, 20, 3665–3675. [Google Scholar] [CrossRef]
  11. Ansari, R.; Dehghani, P.; Mahdikhani, M.; Jeong, J. A Novel Safety Risk Assessment Based on Fuzzy Set Theory and Decision Methods in High-Rise Buildings. Buildings 2022, 12, 2126. [Google Scholar] [CrossRef]
  12. Ilczuk, P.; Kycko, M. Risk Assessment in the Design of Railroad Control Command and Signaling Devices Using Fuzzy Sets. Appl. Sci. 2023, 13, 12460. [Google Scholar] [CrossRef]
  13. Gul, M. Application of Pythagorean fuzzy AHP and VIKOR methods in occupational health and safety risk assessment: The case of a gun and rifle barrel external surface oxidation and colouring unit. Int. J. Occup. Saf. Ergon. 2018, 26, 705–718. [Google Scholar] [CrossRef] [PubMed]
  14. Alık, A. A novel Pythagorean fuzzy AHP and fuzzy TOPSIS methodology for green supplier selection in the Industry 4.0 era. Soft Comput. 2021, 25, 2253–2265. [Google Scholar]
  15. Chen, Q.Y.; Liu, H.C.; Wang, J.H.; Shi, H. New model for occupational health and safety risk assessment based on Fermatean fuzzy linguistic sets and CoCoSo approach. Appl. Soft Comput. 2022, 126, 109262. [Google Scholar] [CrossRef]
  16. Shete, P.C.; Ansari, Z.N.; Kant, R. A Pythagorean fuzzy AHP approach and its application to evaluate the enablers of sustainable supply chain innovation. Sustain. Prod. Consum. 2020, 23, 77–93. [Google Scholar] [CrossRef]
  17. Ak, M.F.; Gul, M. AHP–TOPSIS integration extended with Pythagorean fuzzy sets for information security risk analysis. Com-Plex Intell. Syst. 2019, 5, 113–126. [Google Scholar] [CrossRef]
  18. Wang, L.; Wang, Y.-M.; Martínez, L. Fuzzy TODIM method based on alpha-level sets. Expert Syst. Appl. 2020, 140, 112899. [Google Scholar] [CrossRef]
  19. Zhang, Z.; Zhao, X.; Qin, Y.; Si, H.; Zhou, L. Interval type-2 fuzzy TOPSIS approach with utility theory for subway station operational risk evaluation. J. Ambient. Intell. Humaniz. Comput. 2012, 13, 4849–4863. [Google Scholar] [CrossRef]
  20. Wang, Y.M.; Elhag, T.M.S. Fuzzy TOPSIS method based on alpha level sets with an application to bridge risk assessment. Expert Syst. Appl. 2006, 31, 309–319. [Google Scholar] [CrossRef]
  21. Liu, P.; Ali, Z.; Mahmood, T. A method to multi-attribute group decision-making problem with complex q-rung orthopair lin-guistic information based on heronian mean operators. Int. J. Comput. Intell. Syst. 2019, 12, 1465–1496. [Google Scholar] [CrossRef]
  22. Al-shami, T.M. (2, 1)-Fuzzy sets: Properties, weighted aggregated operators and their applications to multi-criteria deci-sion-making methods. Complex Intell. Syst. 2023, 9, 1687–1705. [Google Scholar] [CrossRef]
  23. Mohamad, M.; Tran, D.Q. Risk-based prioritization approach to construction inspections for transportation projects. J. Constr. Eng. Manag. 2021, 147, 04020150. [Google Scholar] [CrossRef]
  24. Tian, Z.; Chen, Q.; Zhang, T. A method for assessing the crossed risk of construction safety. Saf. Sci. 2022, 146, 105531. [Google Scholar] [CrossRef]
  25. Nguyen, S.; Chen, P.S.-L.; Du, Y.; Thai, V.V. An Operational Risk Analysis Model for Container Shipping Systems considering Uncertainty Quantification. Reliab. Eng. Syst. Saf. 2021, 209, 107362. [Google Scholar] [CrossRef]
  26. Lu, X.; Phoon, K.K.; Xu, C.; Du, X.; Tang, C. A Probabilistic risk assessment approach for surface settlement caused by metro tunnel con-struction using credal network. ASCE-ASME J. Risk Uncertain. Eng. Syst. Part A Civ. Eng. 2022, 8, 04022040. [Google Scholar] [CrossRef]
  27. Duan, R.; Zhou, H.; Fan, J. Diagnosis strategy for complex systems based on reliability analysis and MA DM under epistemic uncertainty. Eksploat. I Niezawodn. 2015, 17. [Google Scholar] [CrossRef]
  28. Khalaj, M.; Tavakkoli-Moghaddam, R.; Khalaj, F.; Siadat, A. New definition of the cross entropy based on the Dempster-Shafer theory and its application in a decision-making process. Commun. Stat.–Theory Methods 2020, 49, 909–923. [Google Scholar] [CrossRef]
  29. Zhu, J.; Shuai, B.; Li, G.; Chin, K.S.; Wang, R. Failure mode and effect analysis using regret theory and PROMETHEE under linguistic neutro-sophic context. J. Loss Prev. Process Ind. 2020, 64, 104048. [Google Scholar] [CrossRef]
  30. Dabbagh, R.; Yousefi, S. A hybrid decision-making approach based on FCM and MOORA for occupational health and safety risk analysis. J. Saf. Res. 2019, 71, 111–123. [Google Scholar] [CrossRef]
  31. Wang, W.; Liu, X.; Qin, Y.; Fu, Y. A risk evaluation and prioritization method for FMEA with prospect theory and Choquet integral. Saf. Sci. 2018, 110, 152–163. [Google Scholar] [CrossRef]
  32. Okoli, C.; Pawlowski, S.D. The Delphi method as a research tool: An example, design considerations and applications. Inf. Manag. 2004, 42, 15–29. [Google Scholar] [CrossRef]
  33. Yager, R.R.; Abbasov, M.A. Pythagorean Membership Grades, Complex Numbers, and Decision Making. Int. J. Intell. Syst. 2013, 28, 436–452. [Google Scholar] [CrossRef]
  34. Zhang, C.; Hu, Q.; Zeng, S.; Su, W. IOWLAD-based MCDM model for the site assessment of a household waste processing plant under a Pythagorean fuzzy environment. Environ. Impact Assess. Rev. 2021, 89, 106579. [Google Scholar] [CrossRef]
  35. Zampieri, F.G.; Casey, J.D.; Shankar-Hari, M.; Harrell, F.E.; Harhay, M.O. Using Bayesian Methods to Augment the Interpretation of Critical Care Trials. An Overview of Theory and Example Reanalysis of the Alveolar Recruitment for Acute Respiratory Distress Syndrome Trial. Am. J. Respir. Crit. Care Med. 2021, 203, 543–552. [Google Scholar] [CrossRef] [PubMed]
  36. Nguyen, T.S.; Likitlersuang, S. Influence of the Spatial Variability of Soil Shear Strength on Deep Excavation: A Case Study of a Bangkok Underground MRT Station. Int. J. Géoméch. 2021, 21, 04020248. [Google Scholar] [CrossRef]
  37. Zhang, X.; Mahadevan, S. Bayesian network modeling of accident investigation reports for aviation safety assessment. Reliab. Eng. Syst. Saf. 2020, 209, 107371. [Google Scholar] [CrossRef]
  38. Abratenko, P.; An, R.; Anthony, J.; Arellano, L.; Asaadi, J.; Ashkenazi, A.; Spentzouris, P. New CC 0 π GENIE model tune for MicroBooNE. Phys. Rev. D 2022, 105, 072001. [Google Scholar] [CrossRef]
  39. Jia, Q.; Herrera-Viedma, E. Pythagorean Fuzzy Sets to Solve Z-Numbers in Decision-Making Model. IEEE Trans. Fuzzy Syst. 2022, 31, 890–904. [Google Scholar] [CrossRef]
  40. Meng, L.; Chonghui, Z.; Chenhong, Y.; Yujing, Y. Knowledge diffusion trajectories in the Pythagorean fuzzy field based on main path analysis. Int. J. Intell. Comput. Cybern. 2022, 15, 124–143. [Google Scholar] [CrossRef]
  41. Zhang, Y.; Jin, Z.; Mirjalili, S. Generalized normal distribution optimization and its applications in parameter extraction of pho-tovoltaic models. Energy Convers. Manag. 2020, 224, 113301. [Google Scholar] [CrossRef]
  42. Waldmann, M.R.; Martignon, L. A Bayesian network model of causal learning. In Proceedings of the Twentieth Annual Conference of the Cognitive Science Society; Routledge: Routledge, UK, 2022; pp. 1102–1107. [Google Scholar]
  43. Guo, K.; Zhang, L. Multi-source information fusion for safety risk assessment in underground tunnels. Knowl.-Based Syst. 2021, 227, 107210. [Google Scholar] [CrossRef]
  44. Trzop, K.; Palka, D.; Szurgacz, D.; Sobik, L. Preventive measures to minimize natural hazards in the Polish underground mining in-dustry. In IOP Conference Series: Earth and Environmental Science; IOP Publishing: Bristol, UK, 2021; Volume 684, p. 012009. [Google Scholar]
  45. Chen, H.; Li, H.; Goh, Y.M. A review of construction safety climate: Definitions, factors, relationship with safety behavior and research agenda. Saf. Sci. 2021, 142, 105391. [Google Scholar] [CrossRef]
Figure 1. Flowchart of Delphi method survey.
Buildings 14 02897 g001
Figure 2. Multi-indicator evaluation process for underground tunnel construction based on the PFIOWLAD operator.
Buildings 14 02897 g002
Figure 3. Underground tunnel construction engineering risk assessment index system.
Buildings 14 02897 g003
Figure 4. Underground tunnel construction risk assessment flowchart.
Buildings 14 02897 g004
Figure 5. Construction plan of a section of Nanchang Metro Line 2.
Buildings 14 02897 g005
Figure 6. Diagram of the operation code and the operation result.
Buildings 14 02897 g006
Figure 7. Schematic diagram of risk factor probability data input.
Buildings 14 02897 g007
Figure 8. The subway construction engineering risk causal chain Bayesian network model.
Buildings 14 02897 g008
Table 1. Pythagorean (PFIOWLAD) evaluation matrix R q .
F 1 F 2 F 3 F 4
R 1 A 1 <0.4, 0.6><0.8, 0.4><0.8, 0.1><0.7, 0.5>
A 2 <0.8, 0.5><0.3, 0.7><0.7, 0.4><0.2, 0.9>
A 3 <0.7, 0.1><0.8, 0.3><0.4, 0.8><0.8, 0.3>
A 4 <0.9, 0.3><0.7, 0.5><0.6, 0.7><0.1, 0.8>
R 2 A 1 <0.3, 0.4><0.8, 0.3><0.3, 0.9><0.7, 0.5>
A 2 <0.7, 0.5><0.8, 0.6><0.9, 0.4><0.2, 0.9>
A 3 <0.5, 0.2><0.5, 0.7><0.3, 0.5><0.9, 0.3>
A 4 <0.4, 0.7><0.9, 0.3><0.6, 0.5><0.4, 0.8>
R 3 A 1 <0.2, 0.7><0.8, 0.6><0.4, 0.6><0.7, 0.5>
A 2 <0.7, 0.3><0.4, 0.9><0.8, 0.4><0.4, 0.7>
A 3 <0.8, 0.5><0.6, 0.3><0.4, 0.7><0.7, 0.2>
A 4 <0.4, 0.6><0.2, 0.5><0.3, 0.5><0.2, 0.6>
R 4 A 1 <0.9, 0.3><0.7, 0.4><0.7, 0.2><0.7, 0.5>
A 2 <0.7, 0.2><0.4, 0.7><0.2, 0.8><0.3, 0.6>
A 3 <0.5, 0.3><0.6, 0.4><0.7, 0.6><0.1, 0.7>
A 4 <0.2, 0.7><0.4, 0.6><0.3, 0.4><0.8, 0.2>
Table 2. Pythagorean (PFIOWLAD) collective evaluation matrix R.
F 1 F 2 F 3 F 4
A 1 <0.42, 0.53><0.78, 0.44><0.56, 0.43><0.70, 0.50>
A 2 <0.73, 0.38><0.45, 0.74><0.67, 0.48><0.28, 0.78>
A 3 <0.65, 0.28><0.64, 0.40><0.44, 0.67><0.65, 0.35>
A 4 <0.51, 0.55><0.53, 0.48><0.45, 0.54><0.33, 0.62>
Table 3. Ideal solution I.
F 1 F 2 F 3 F 4
I <0.73, 0.28><0.78, 0.40><0.67, 0.43><0.70, 0.35>
Table 4. Standards for the probability levels of underground engineering risk occurrence.
HierarchyABCDE
Description of the incidentunlikelyinfrequentoccasionalpromisefrequent
interval probabilityp < 0.01%0.01% ≤ p < 0.1%0.1% ≤ p < 1%1% ≤ p < 10%p ≥ 10%
Note: p is the probability of a risky incident.
Table 5. Indicator layer risk cause weighting table.
Risk Factors at the Indicator LayerWeight DistributionWeighted Ranking
Groundwater distribution0.01110
Stratigraphic lithology0.0157
Soil bearing capacity0.0148
Support system normative0.1284
Rationalization of earthwork methods0.1284
Means of detection validity0.1443
Construction site safety management0.1992
Engineering quality management effectiveness0.2091
Emergency preparedness0.1025
Traffic control situation0.0129
Neighbouring building impact assessment0.0256
Public security risk analysis0.0148
Disclaimer/Publisher’s Note: The statements, opinions and data contained in all publications are solely those of the individual author(s) and contributor(s) and not of MDPI and/or the editor(s). MDPI and/or the editor(s) disclaim responsibility for any injury to people or property resulting from any ideas, methods, instructions or products referred to in the content.

