


Research on the Deformation Control Measures during the Construction Period of Super High-Rise Buildings with an Asymmetric Plan

Abstract
1. Introduction
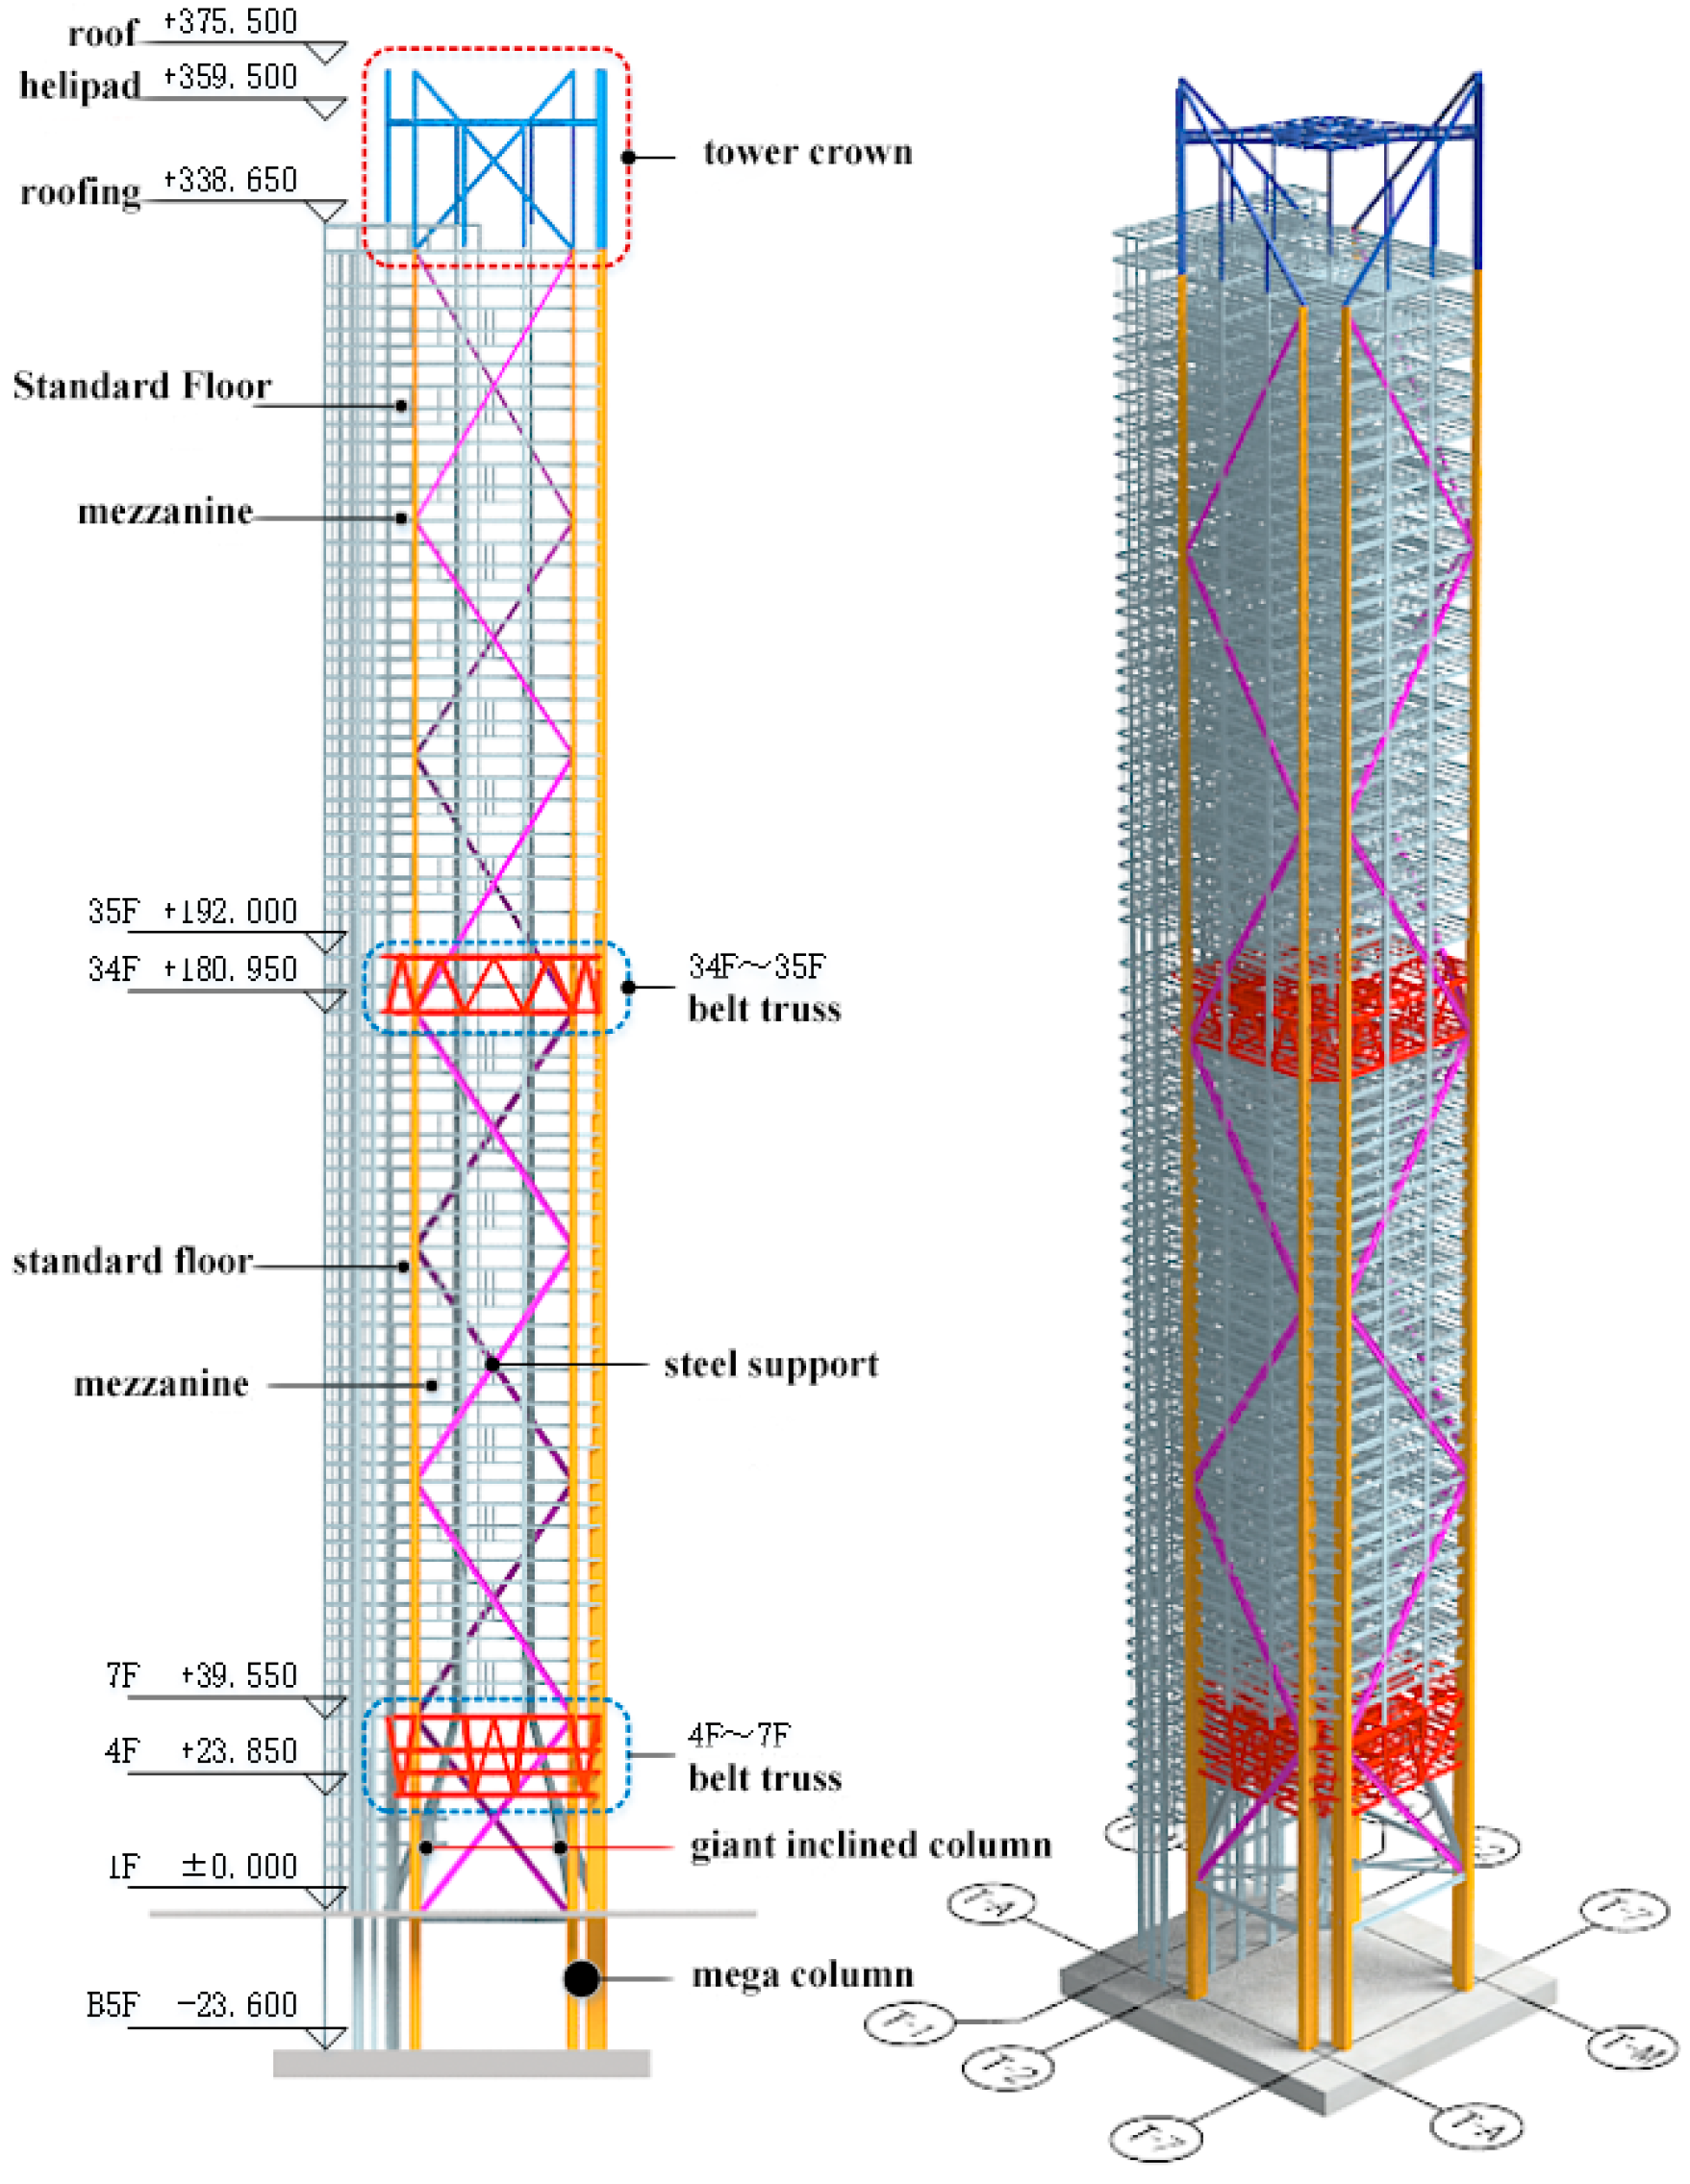
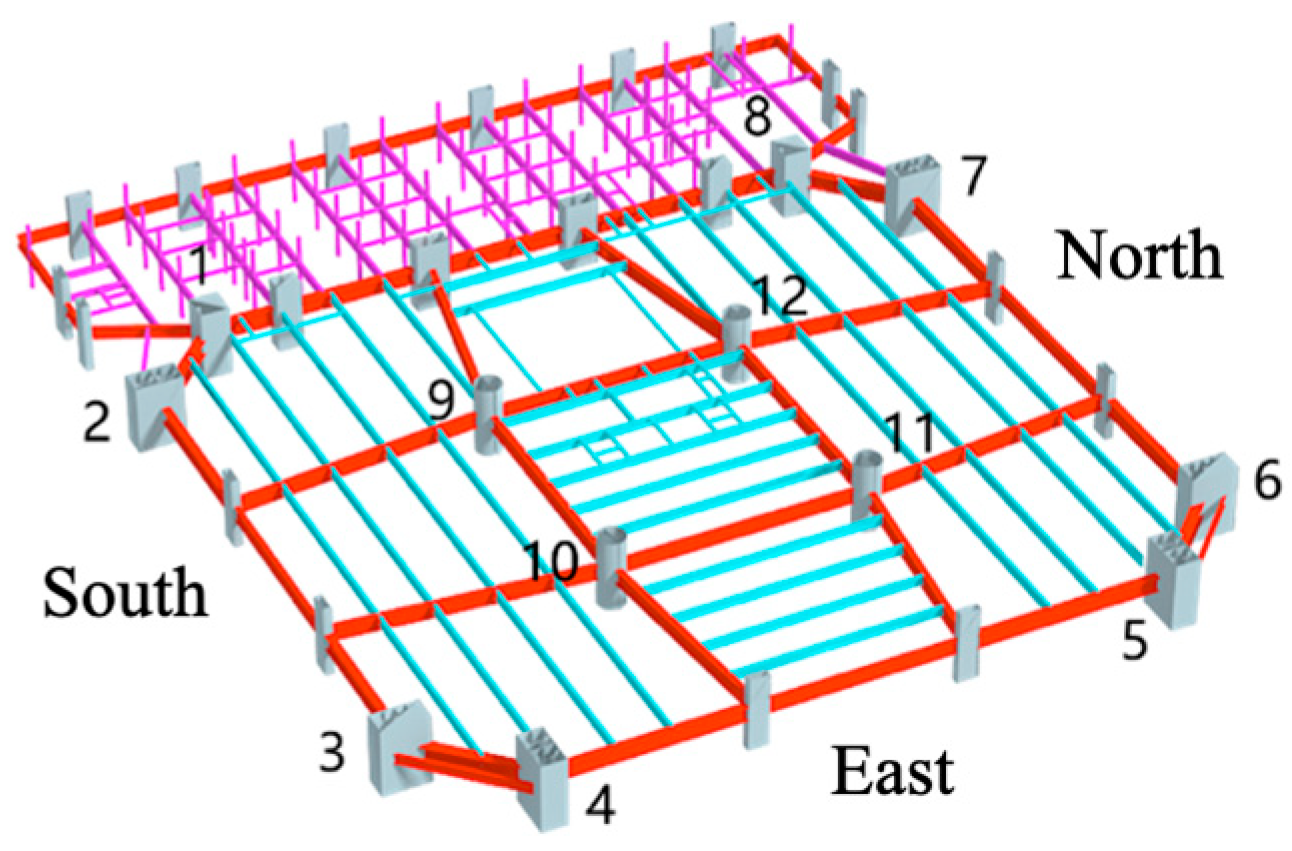
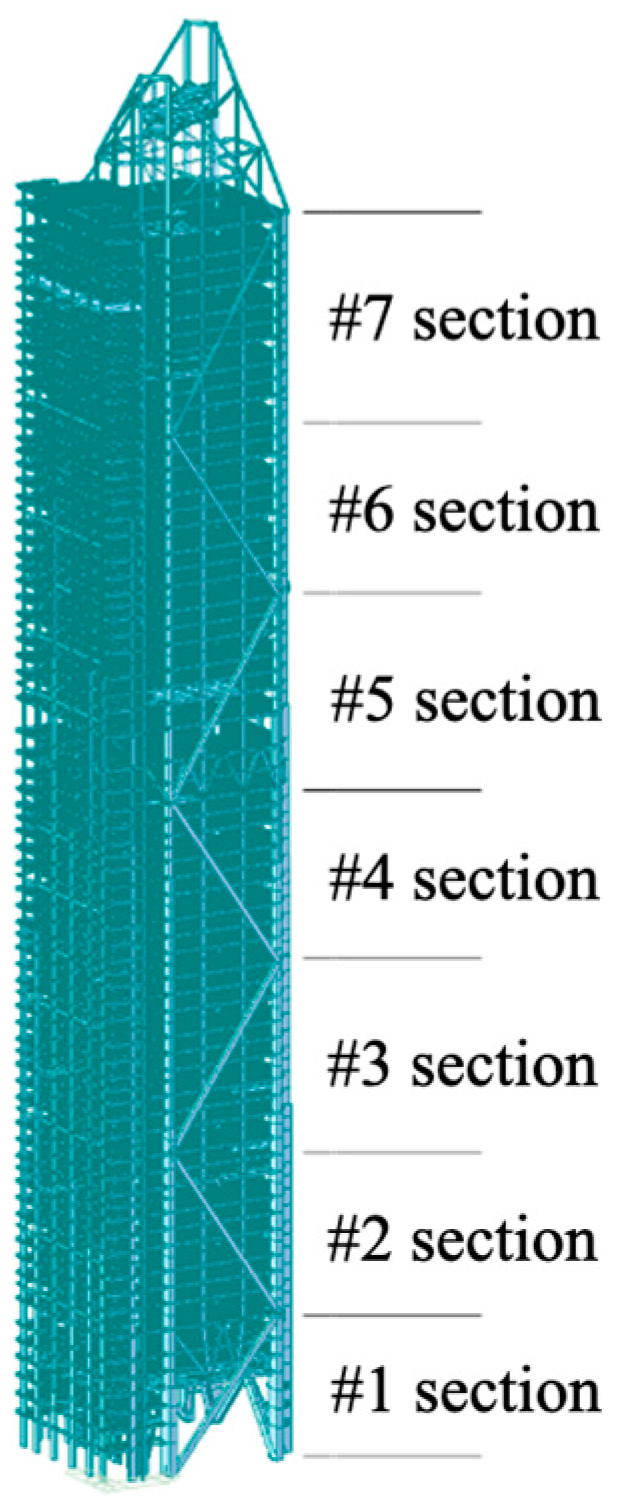
2. Project Overview
3. Factors Influencing Deformation during Construction
3.1. Factors Influencing Horizontal Deformation
- (1)
- Dead Load: As the structure installation progresses, the building’s gravity center will bear greater asymmetric or uneven loads, affecting its verticality and increasing the horizontal deformation.
- (2)
- Horizontal Load: With increasing building height during construction, horizontal loads, especially wind loads, will also increase, causing greater horizontal deformation.
- (3)
- Shrinkage and Creep of Concrete: Long-term shrinkage and creep effects in concrete will cause increasing asymmetricity between stiffness and gravity centers, which will influence the horizontal deformation.
- (4)
- Construction Speed: Related to concrete shrinkage and creep, it will also affect the development of horizontal deformation.
- (5)
- Closure Timing of Mega Braces and Belt Truss: Closure of mega braces and belt truss will influence the overall stiffness of structure during construction.
3.2. Factors Influencing Vertical Deformation
4. Numerical Modelling
4.1. Assumptions and Settings
- (1)
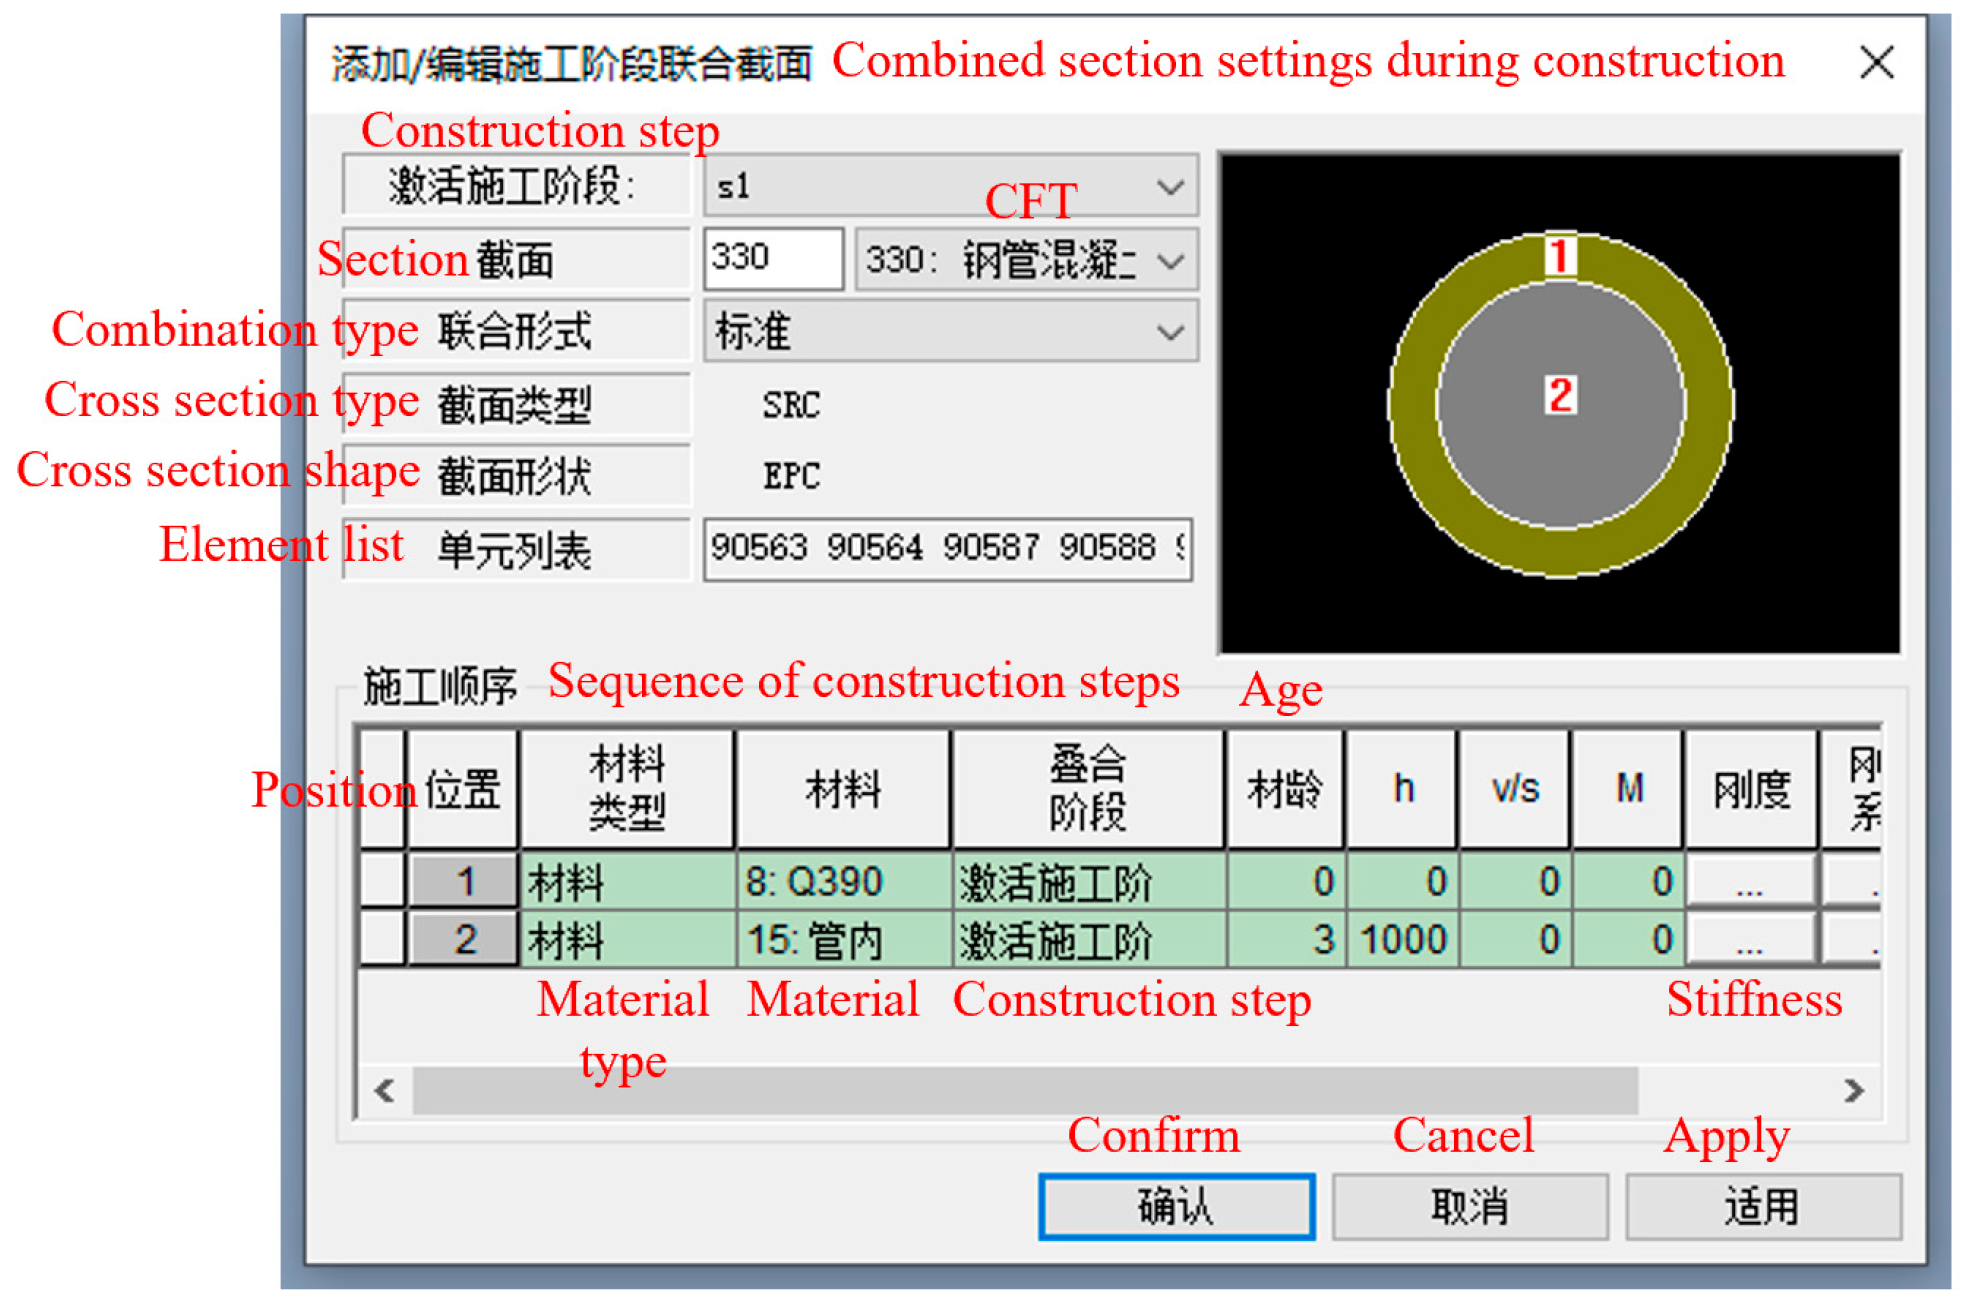
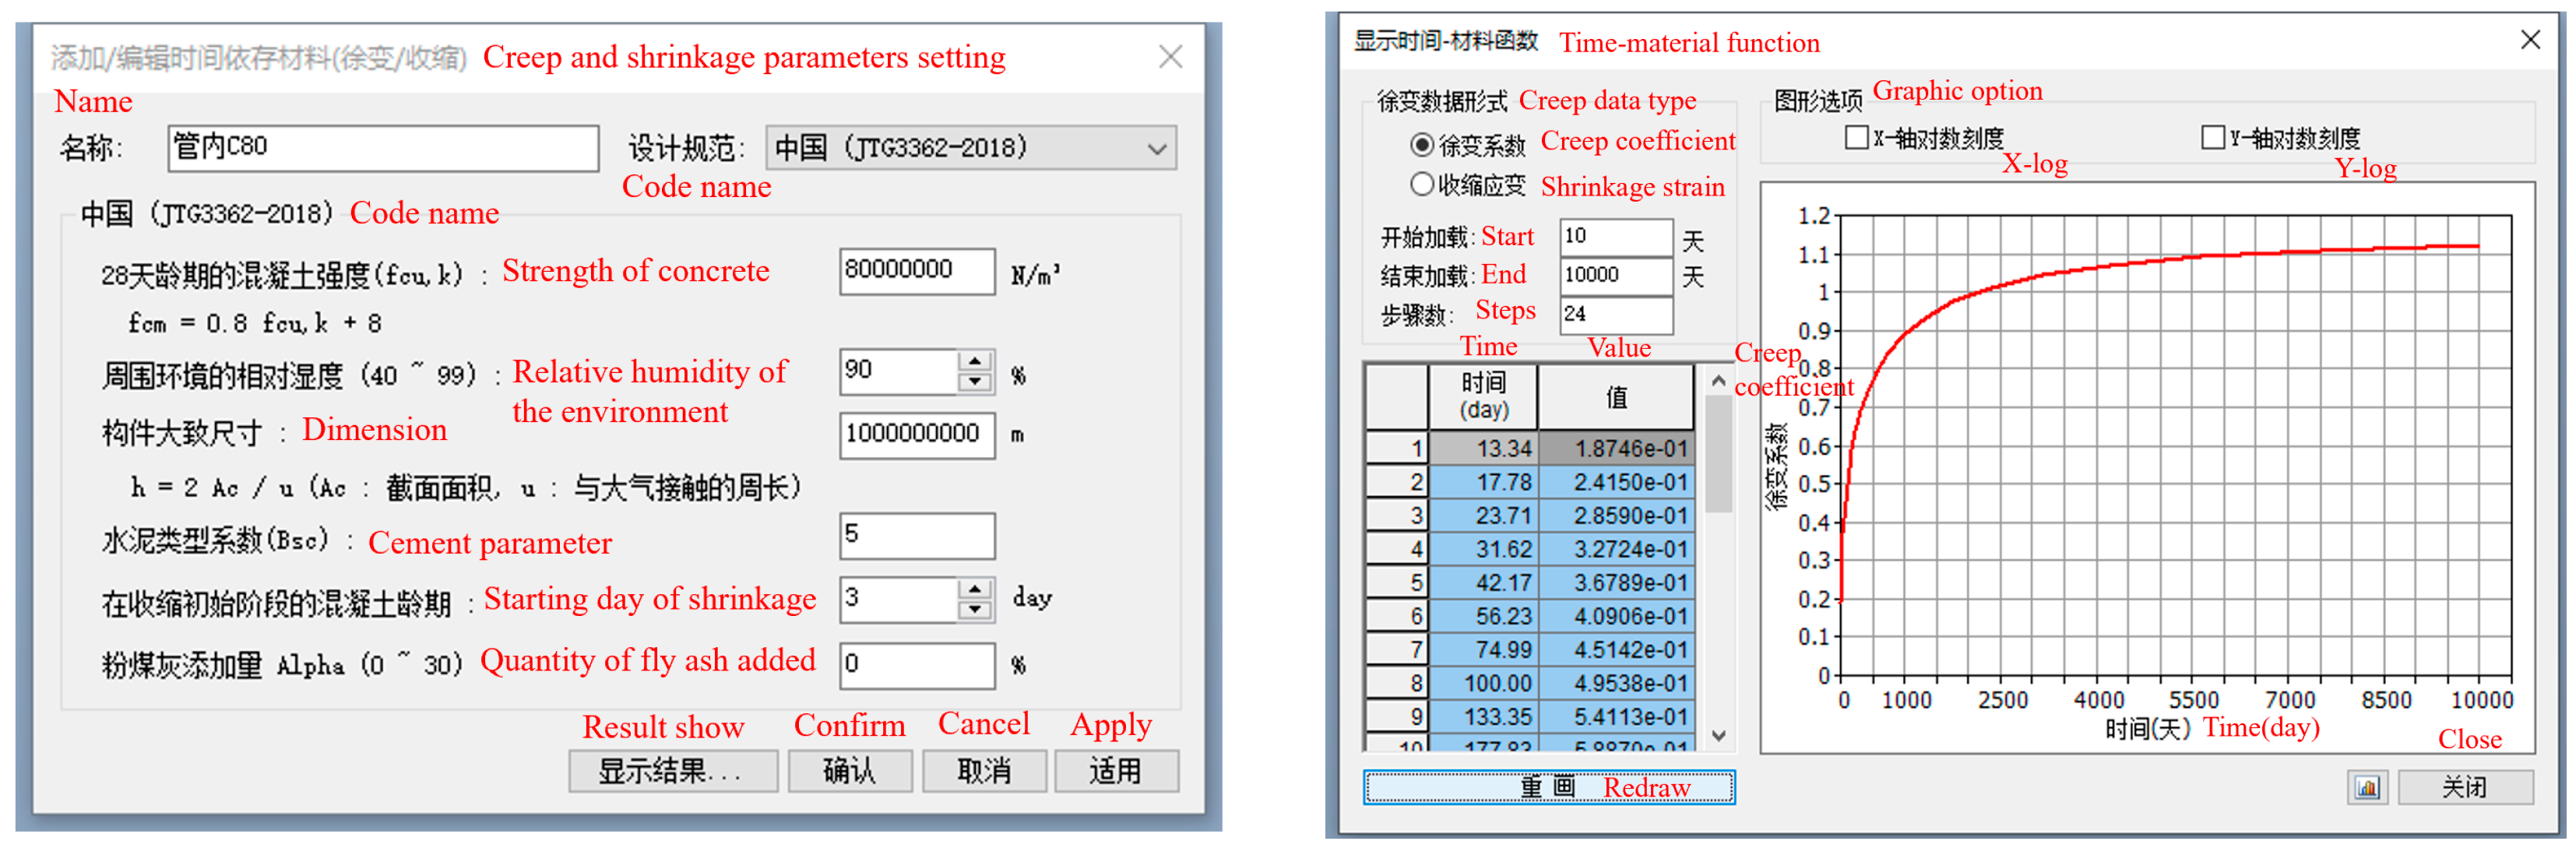
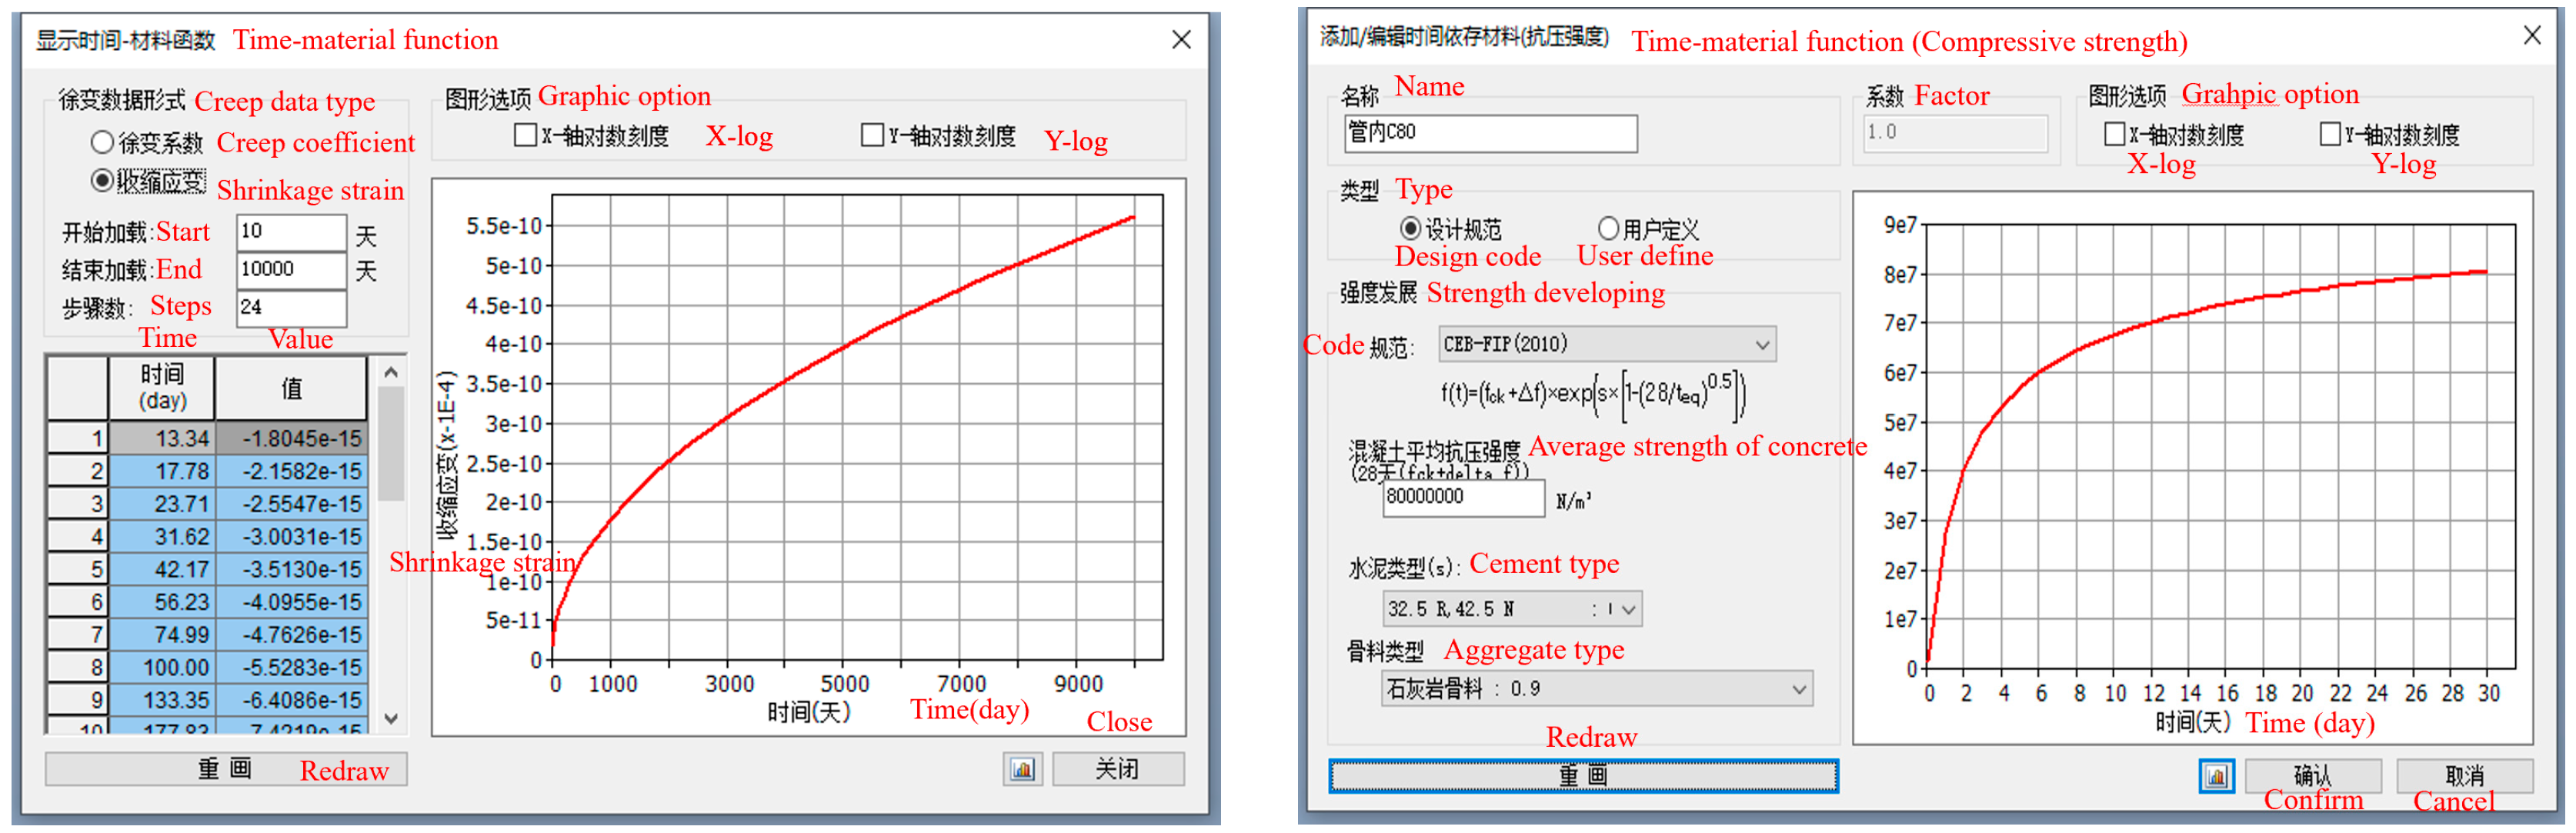
- Concrete time-varying model assumptions
- (2)
- Structural group divisions
- (3)
- Key indicators and floor division
4.2. Key FEM Definitions
- loads and load combinations
- (1)
- Dead Loads
- Self-Weight: Concrete and steel densities are 2500 kg/m3 and 7850 kg/m3, respectively. The software calculates self-weight based on material density and component geometry.
- Additional Dead Load: Partitions and curtain walls are applied as uniformly distributed loads on floor surfaces.
- (2)
- Live Loads
- Construction Live Load: 2.0 kN/m2, applied as uniformly distributed loads on floor surfaces, acting on the floor below the construction level.
- Wind Load: 10-year return period (basic wind pressure 0.30 kPa), considered along ±X and ±Y directions for structural force impact, not for deformation.
- (3)
- Load Combinations
- Strength Check: 1.3 × Dead Load + Live Load + Wind Load
- Deformation Calculation: 1.0 × Dead Load
- 2.
- Element types and boundary conditions
- 3.
- Material definitions
4.3. Construction Speed
4.4. The Closure Timing of Belt Trusses and Mega Braces
- (1)
- Synchronous closure with the frame,
- (2)
- 1 section lagging behind,
- (3)
- 2 sections lagging behind.
5. Parametric Analysis Results
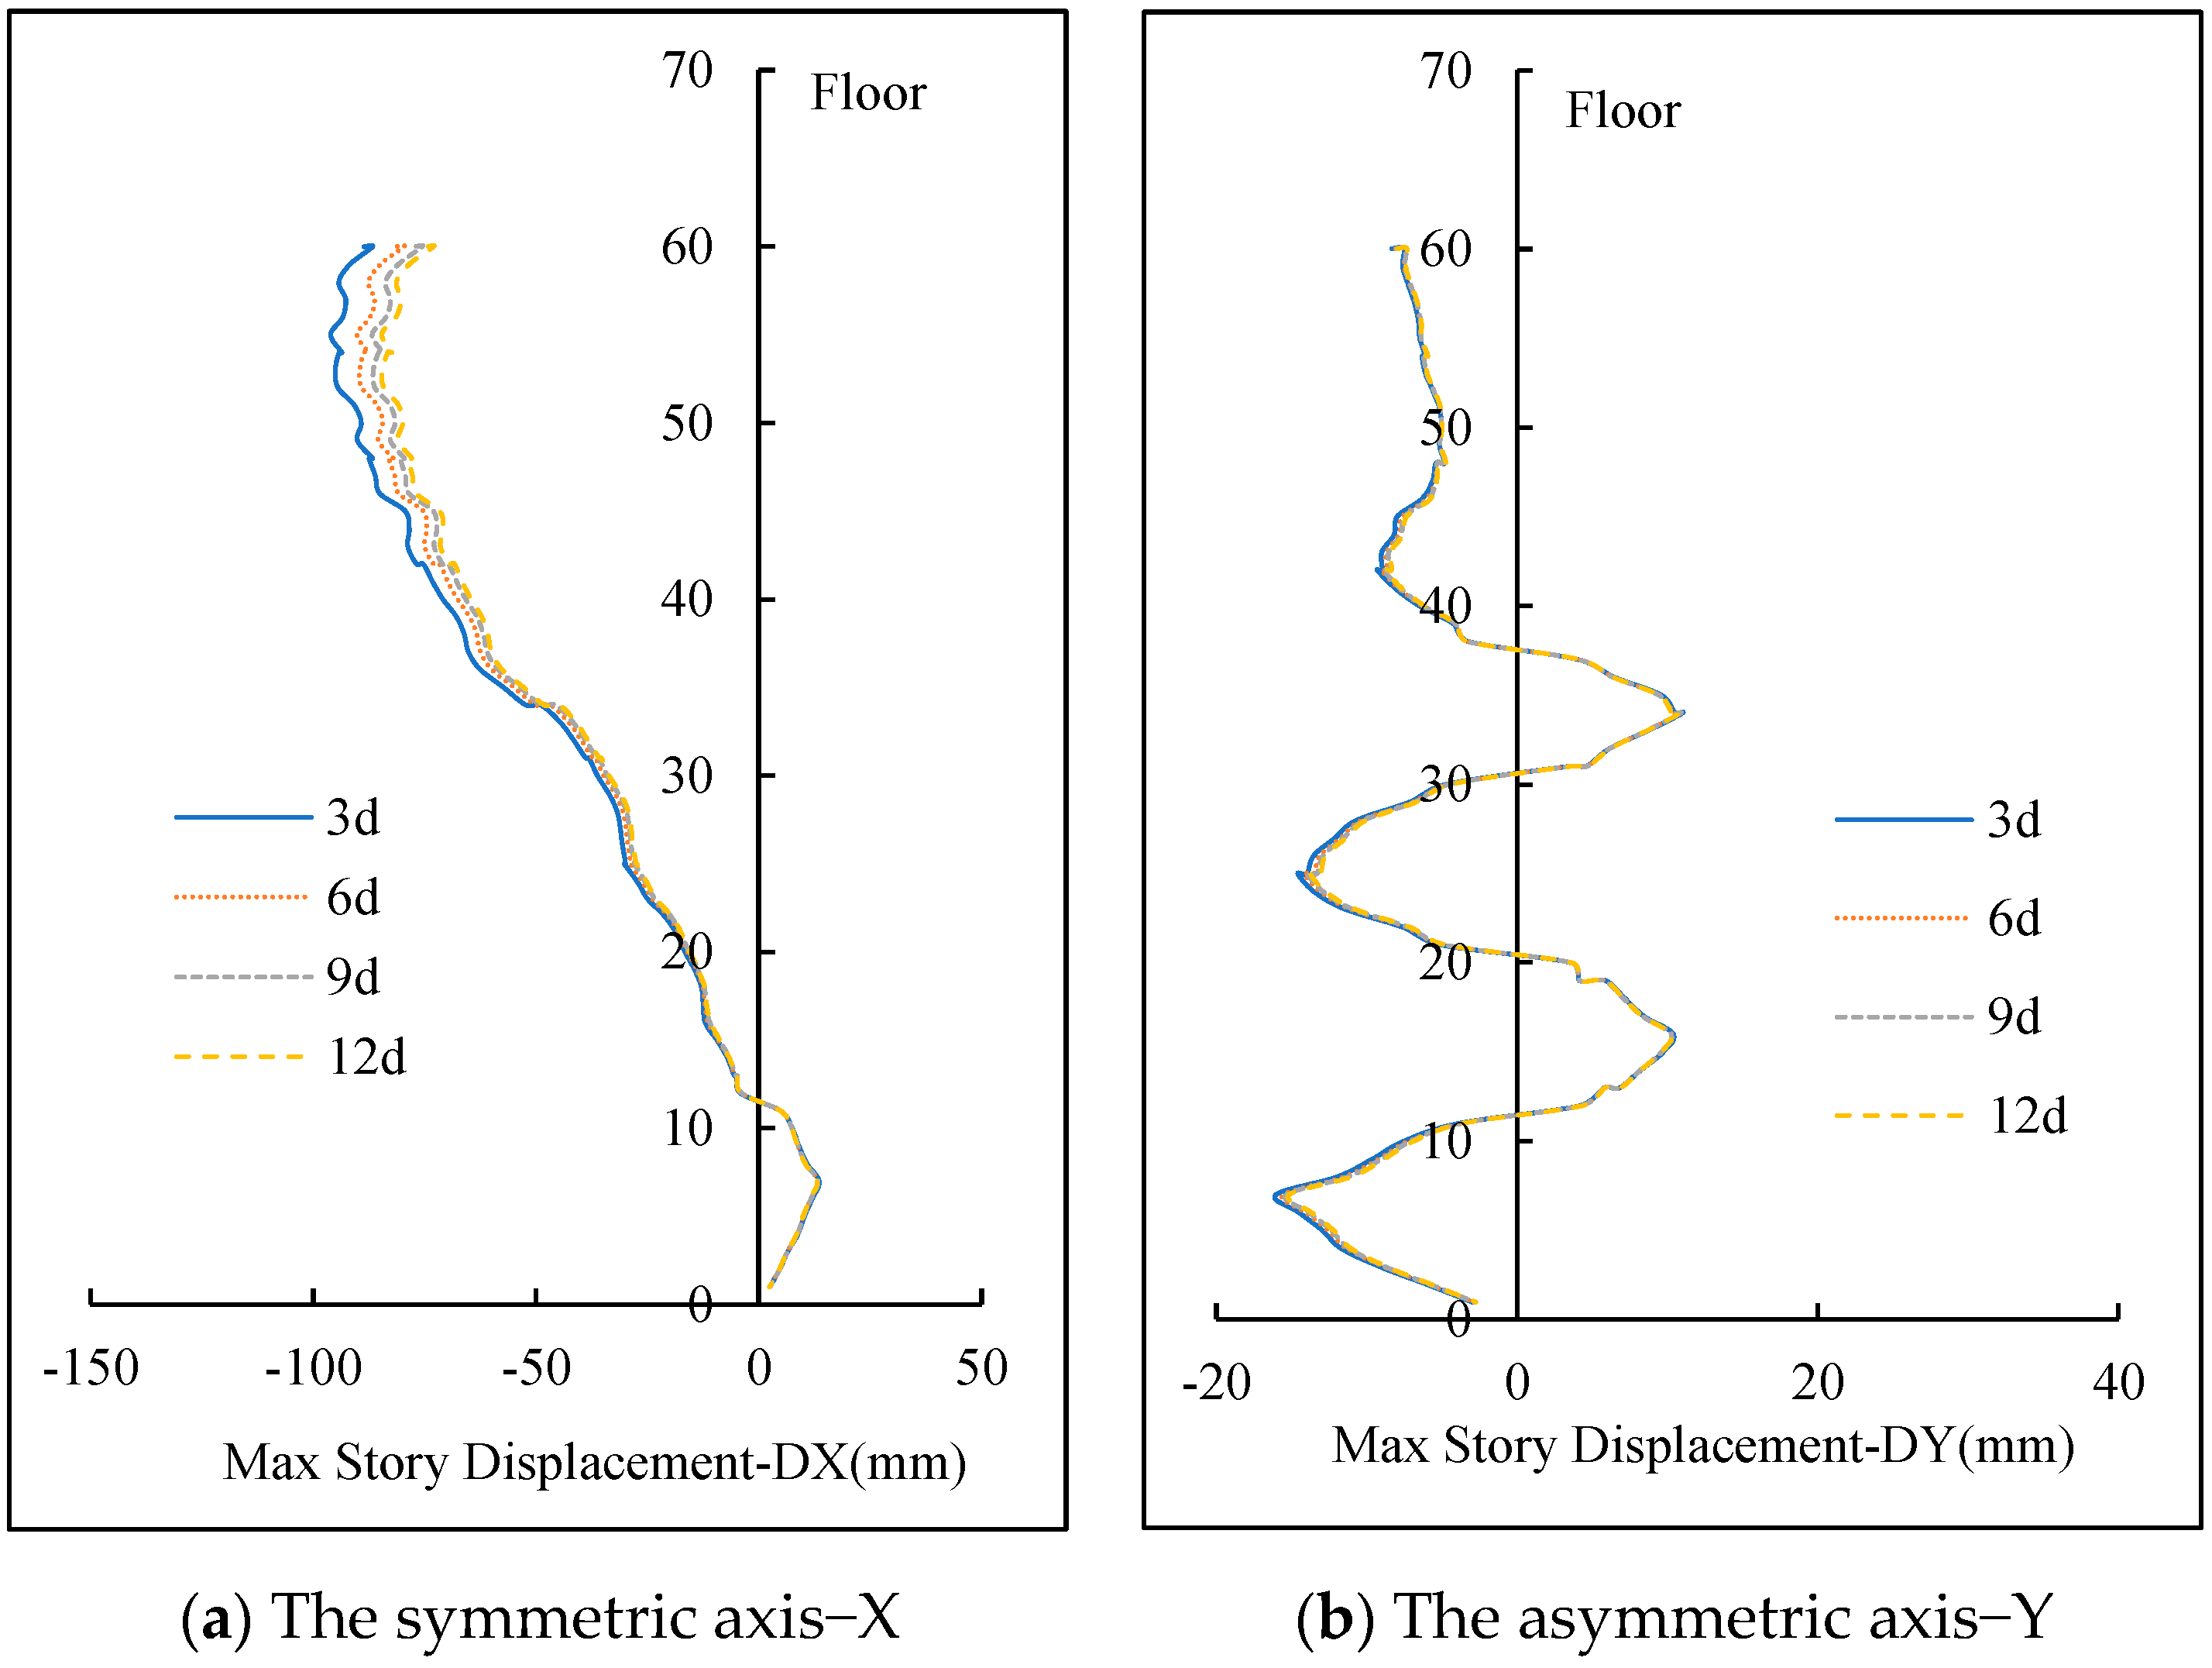
5.1. Influence of Construction Speed
- (1)
- On lateral displacement
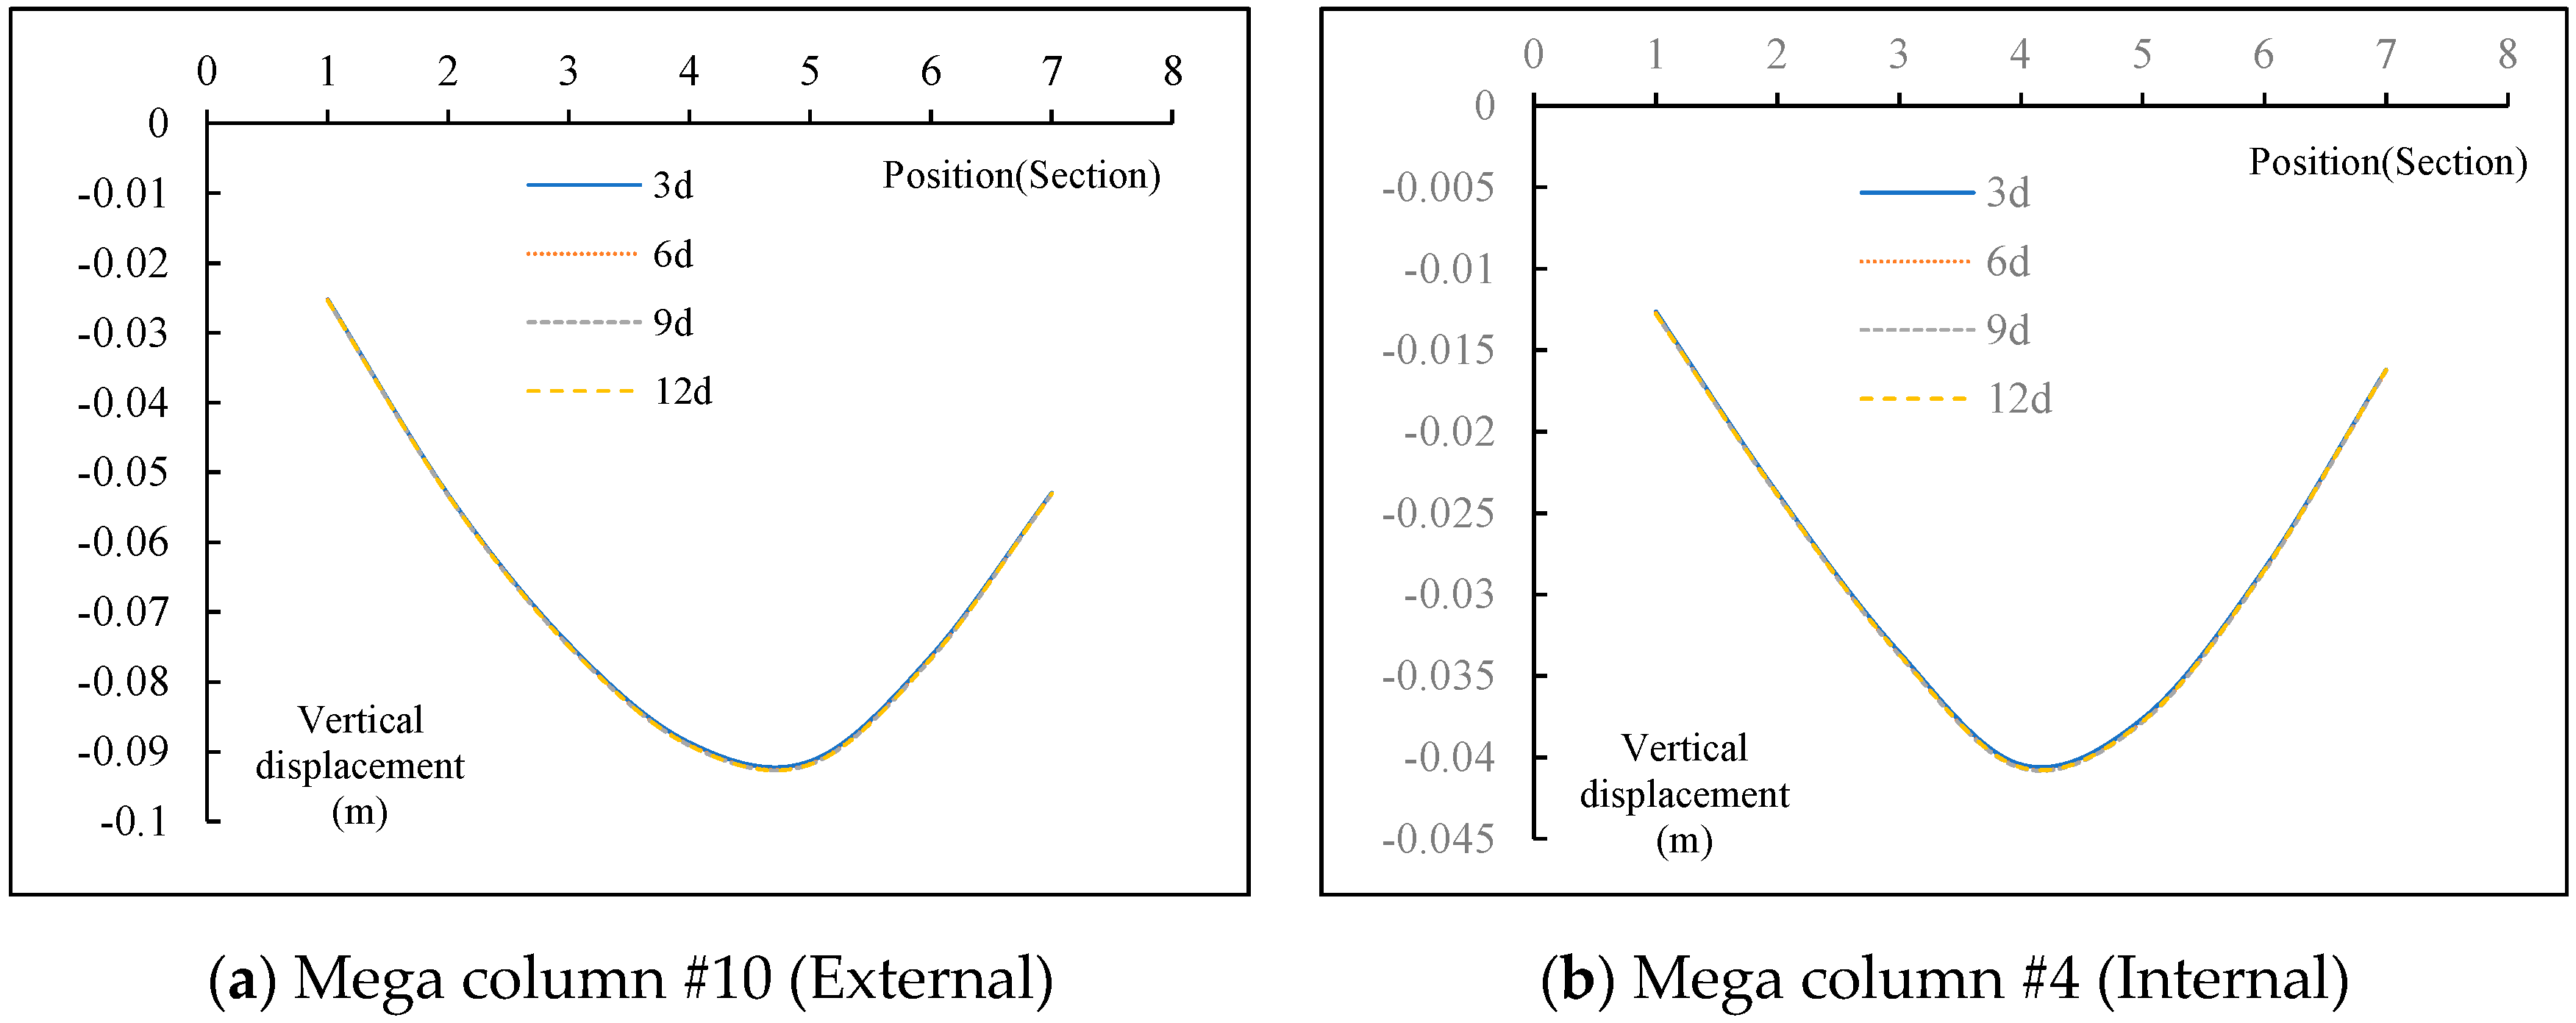
- (2)
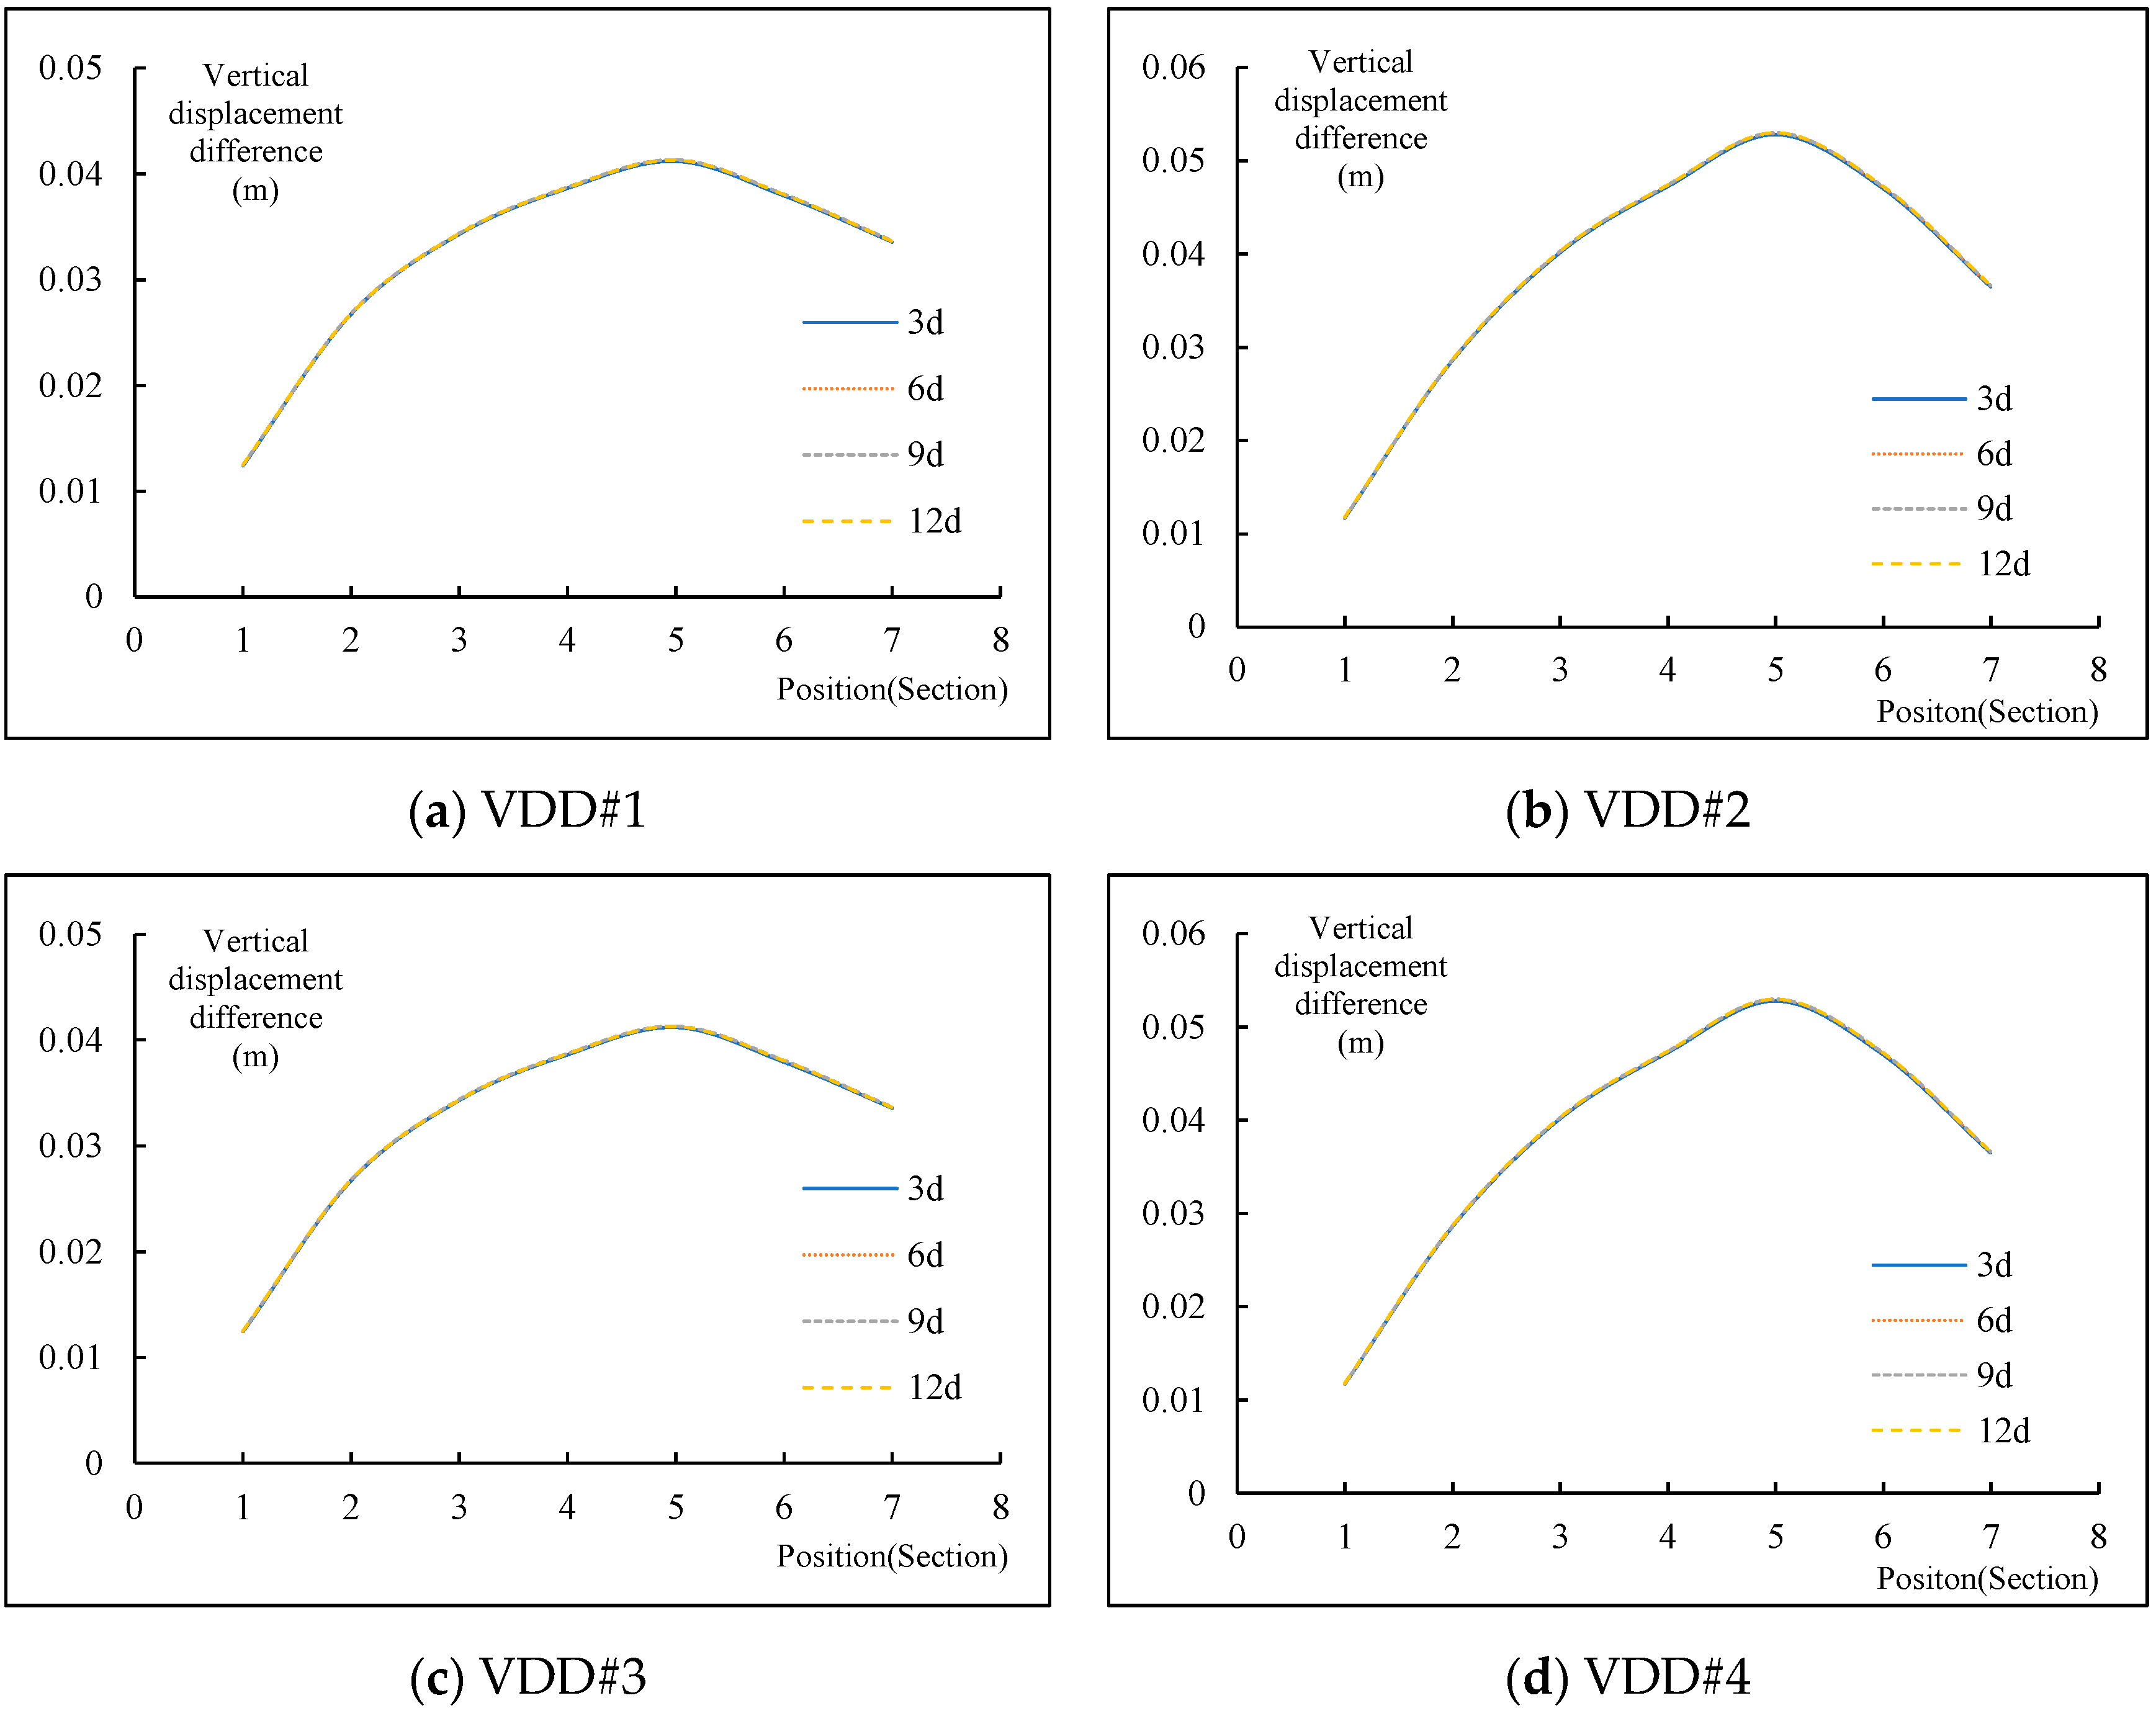
- On vertical displacement difference (VDD)
- (3)
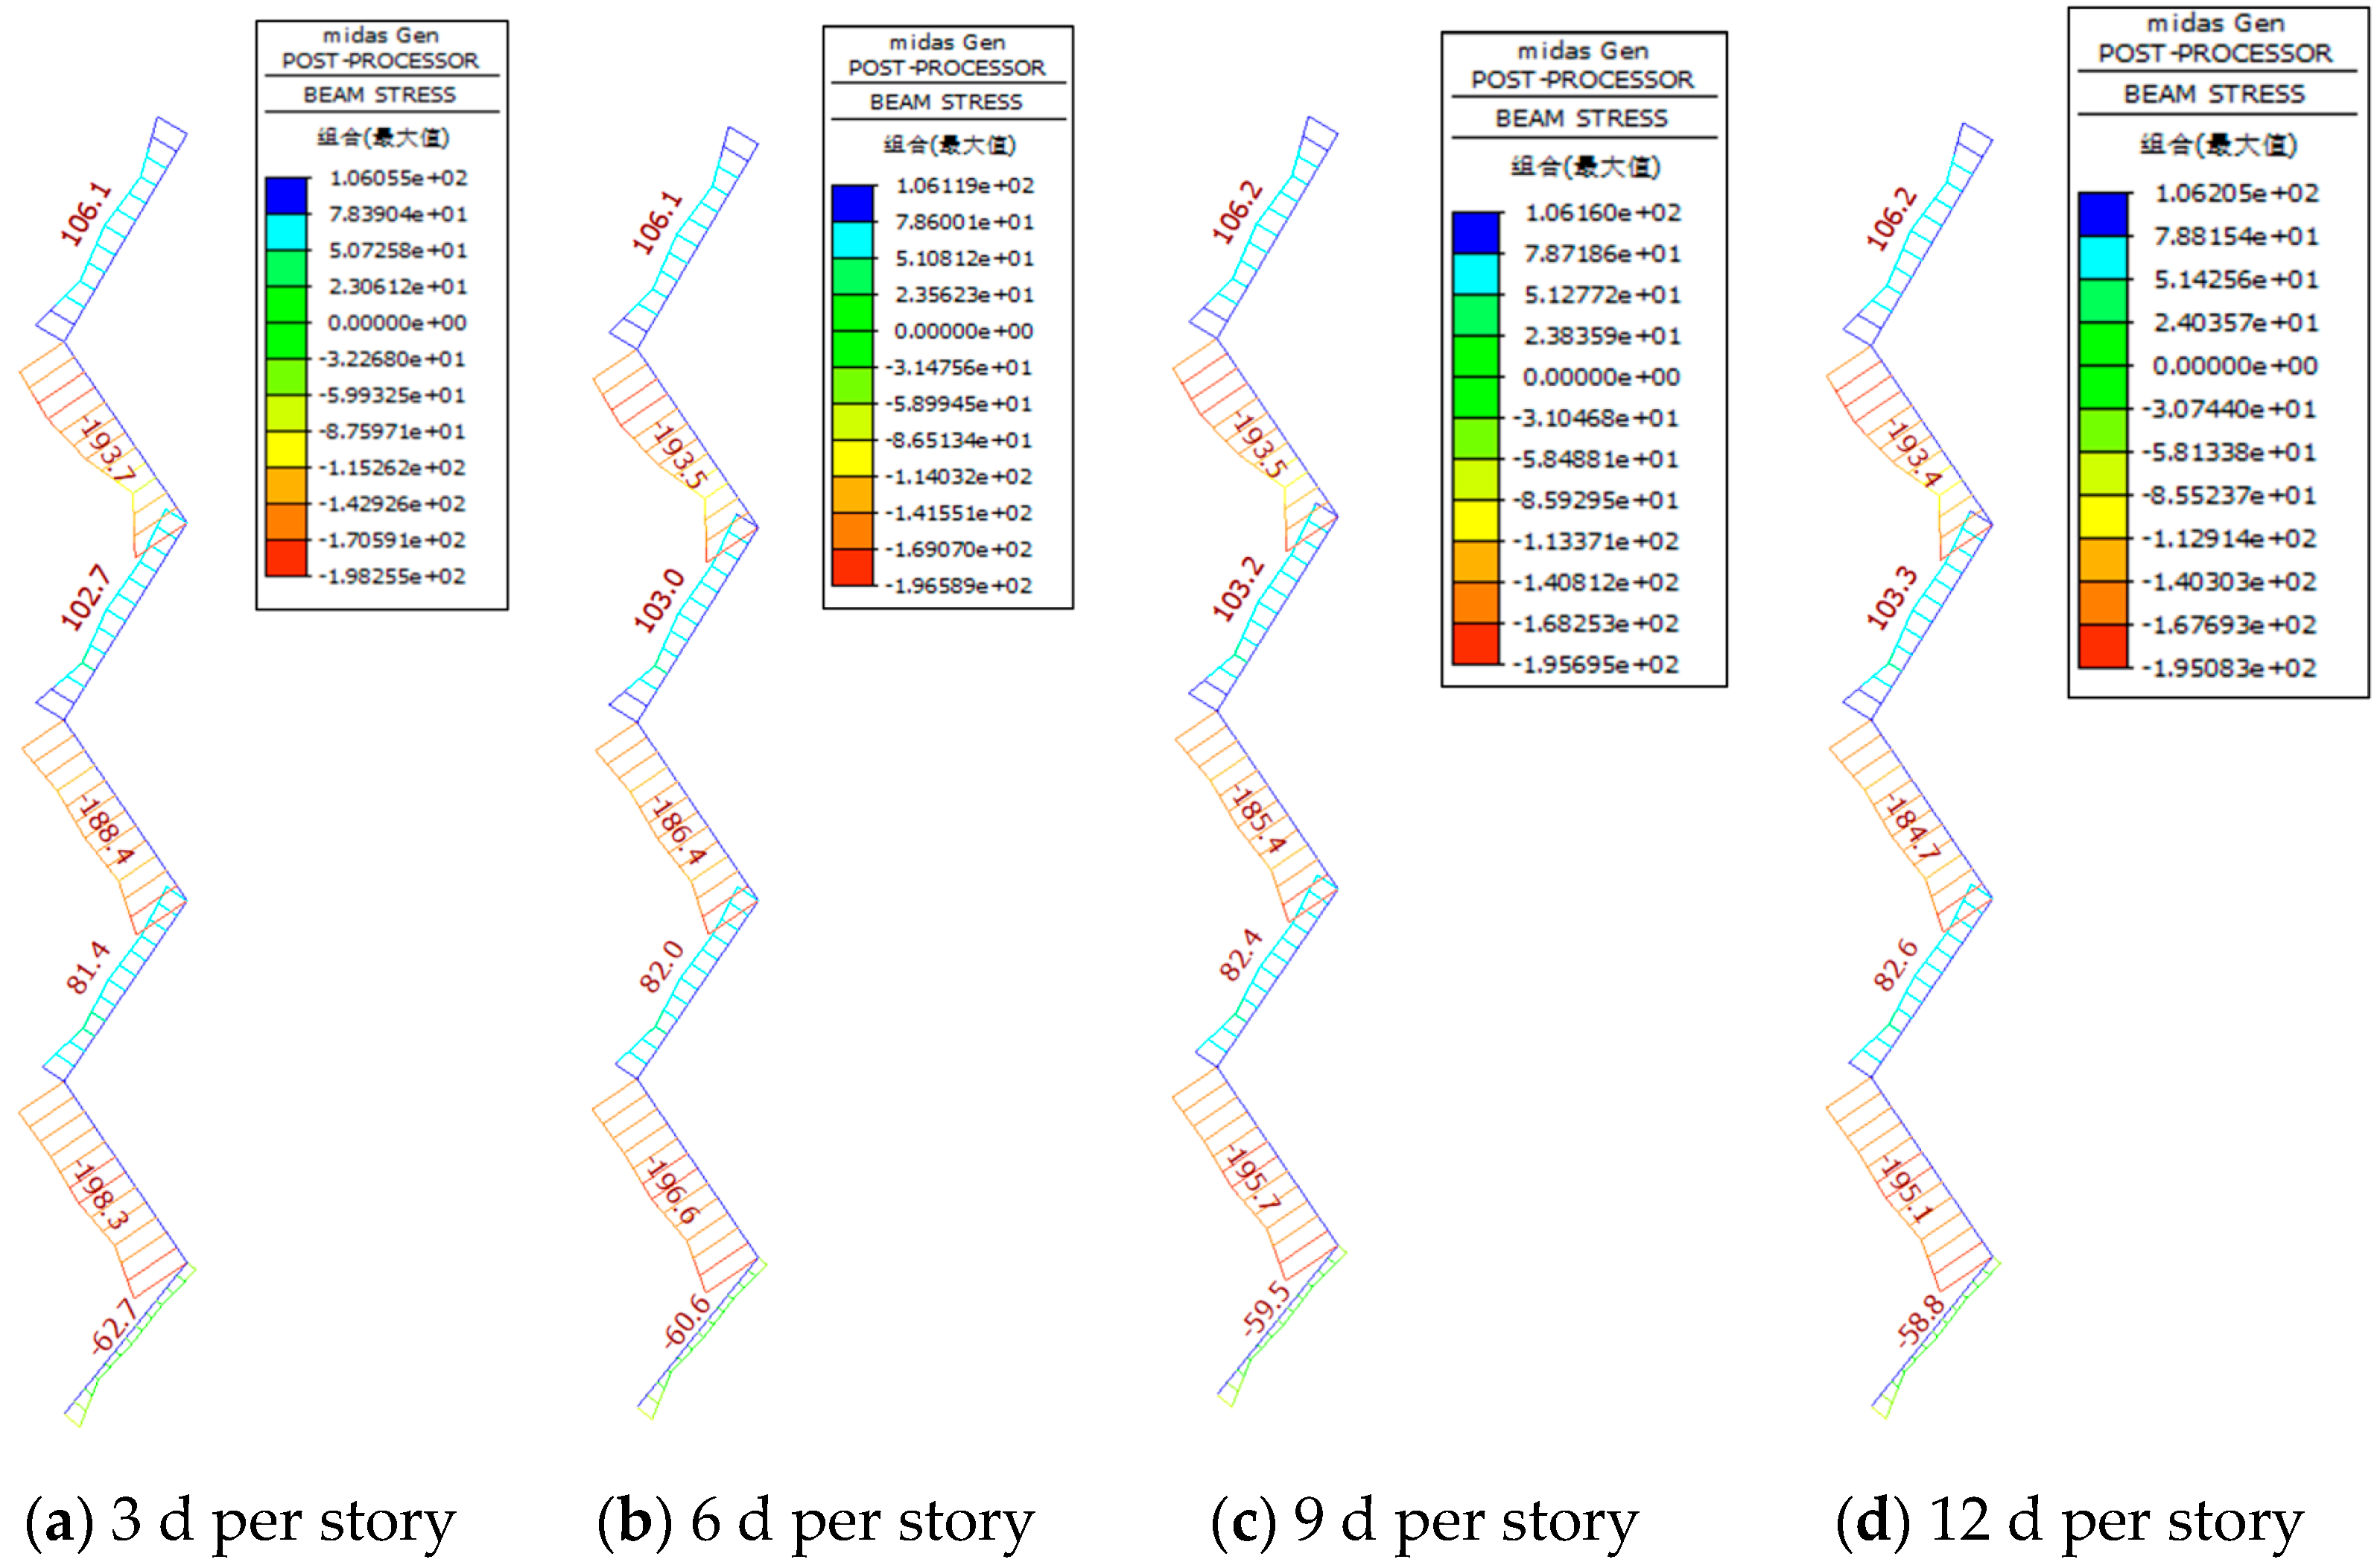
- On max stress of key components
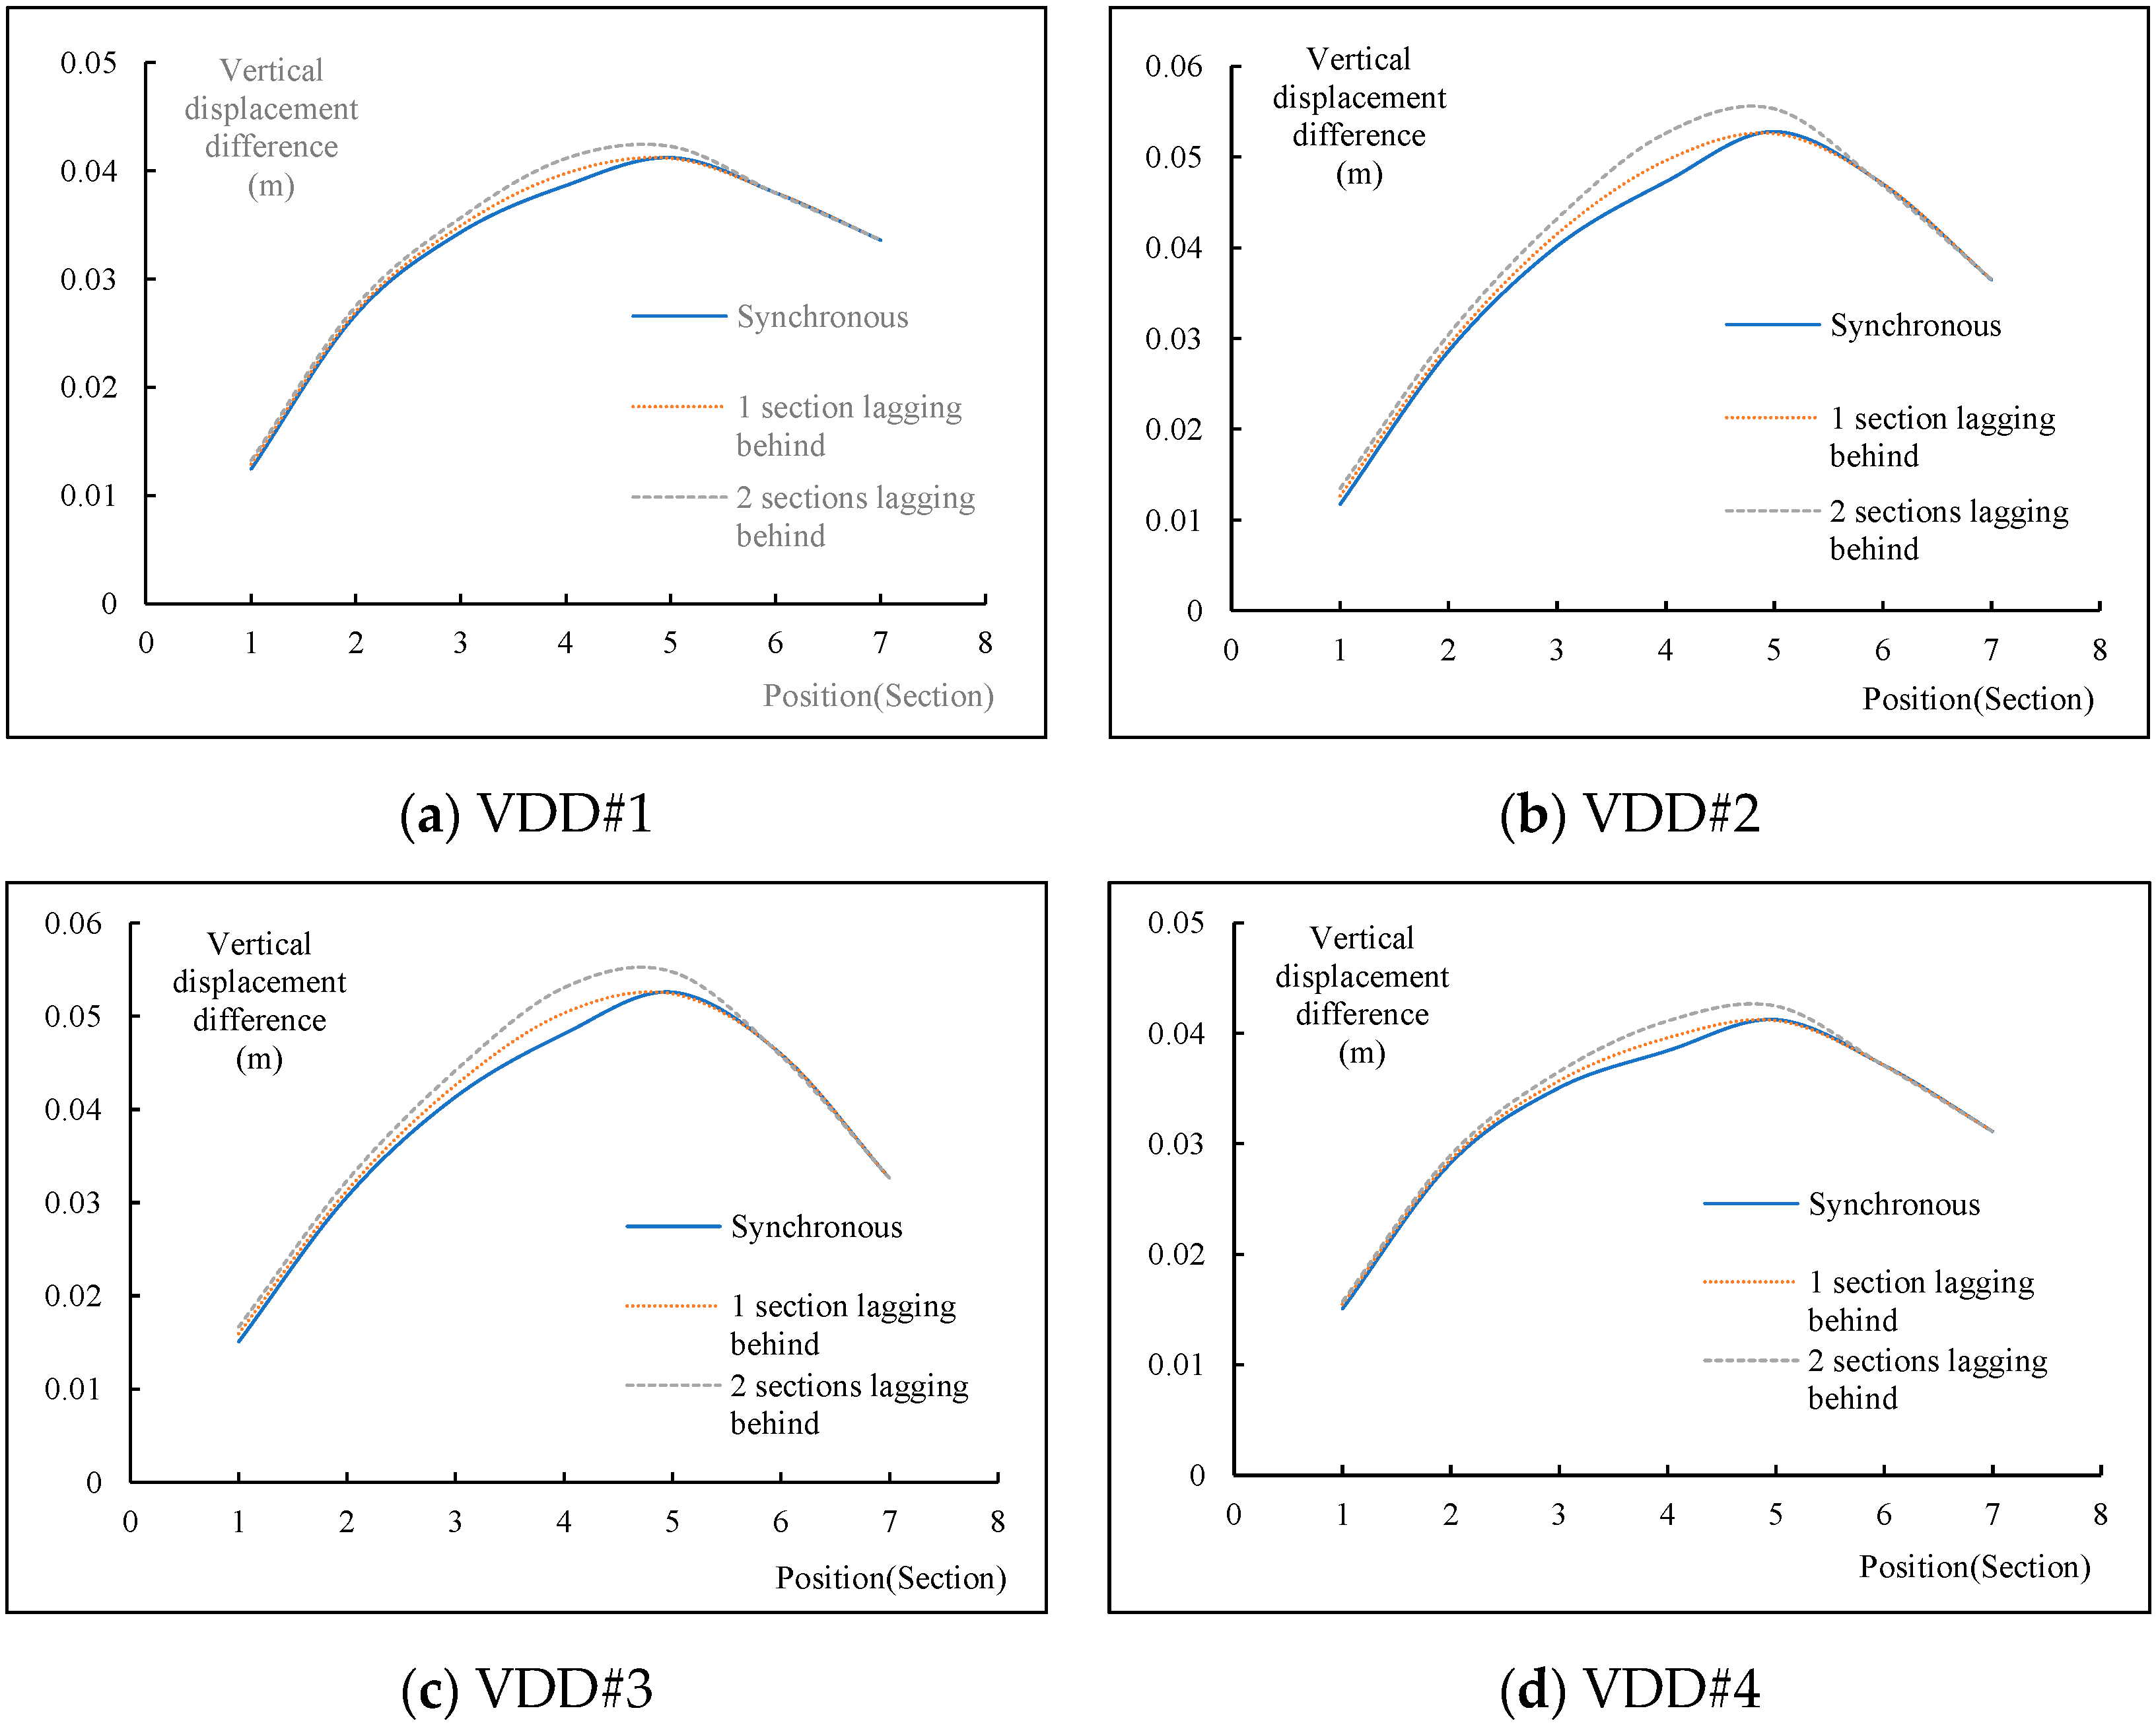
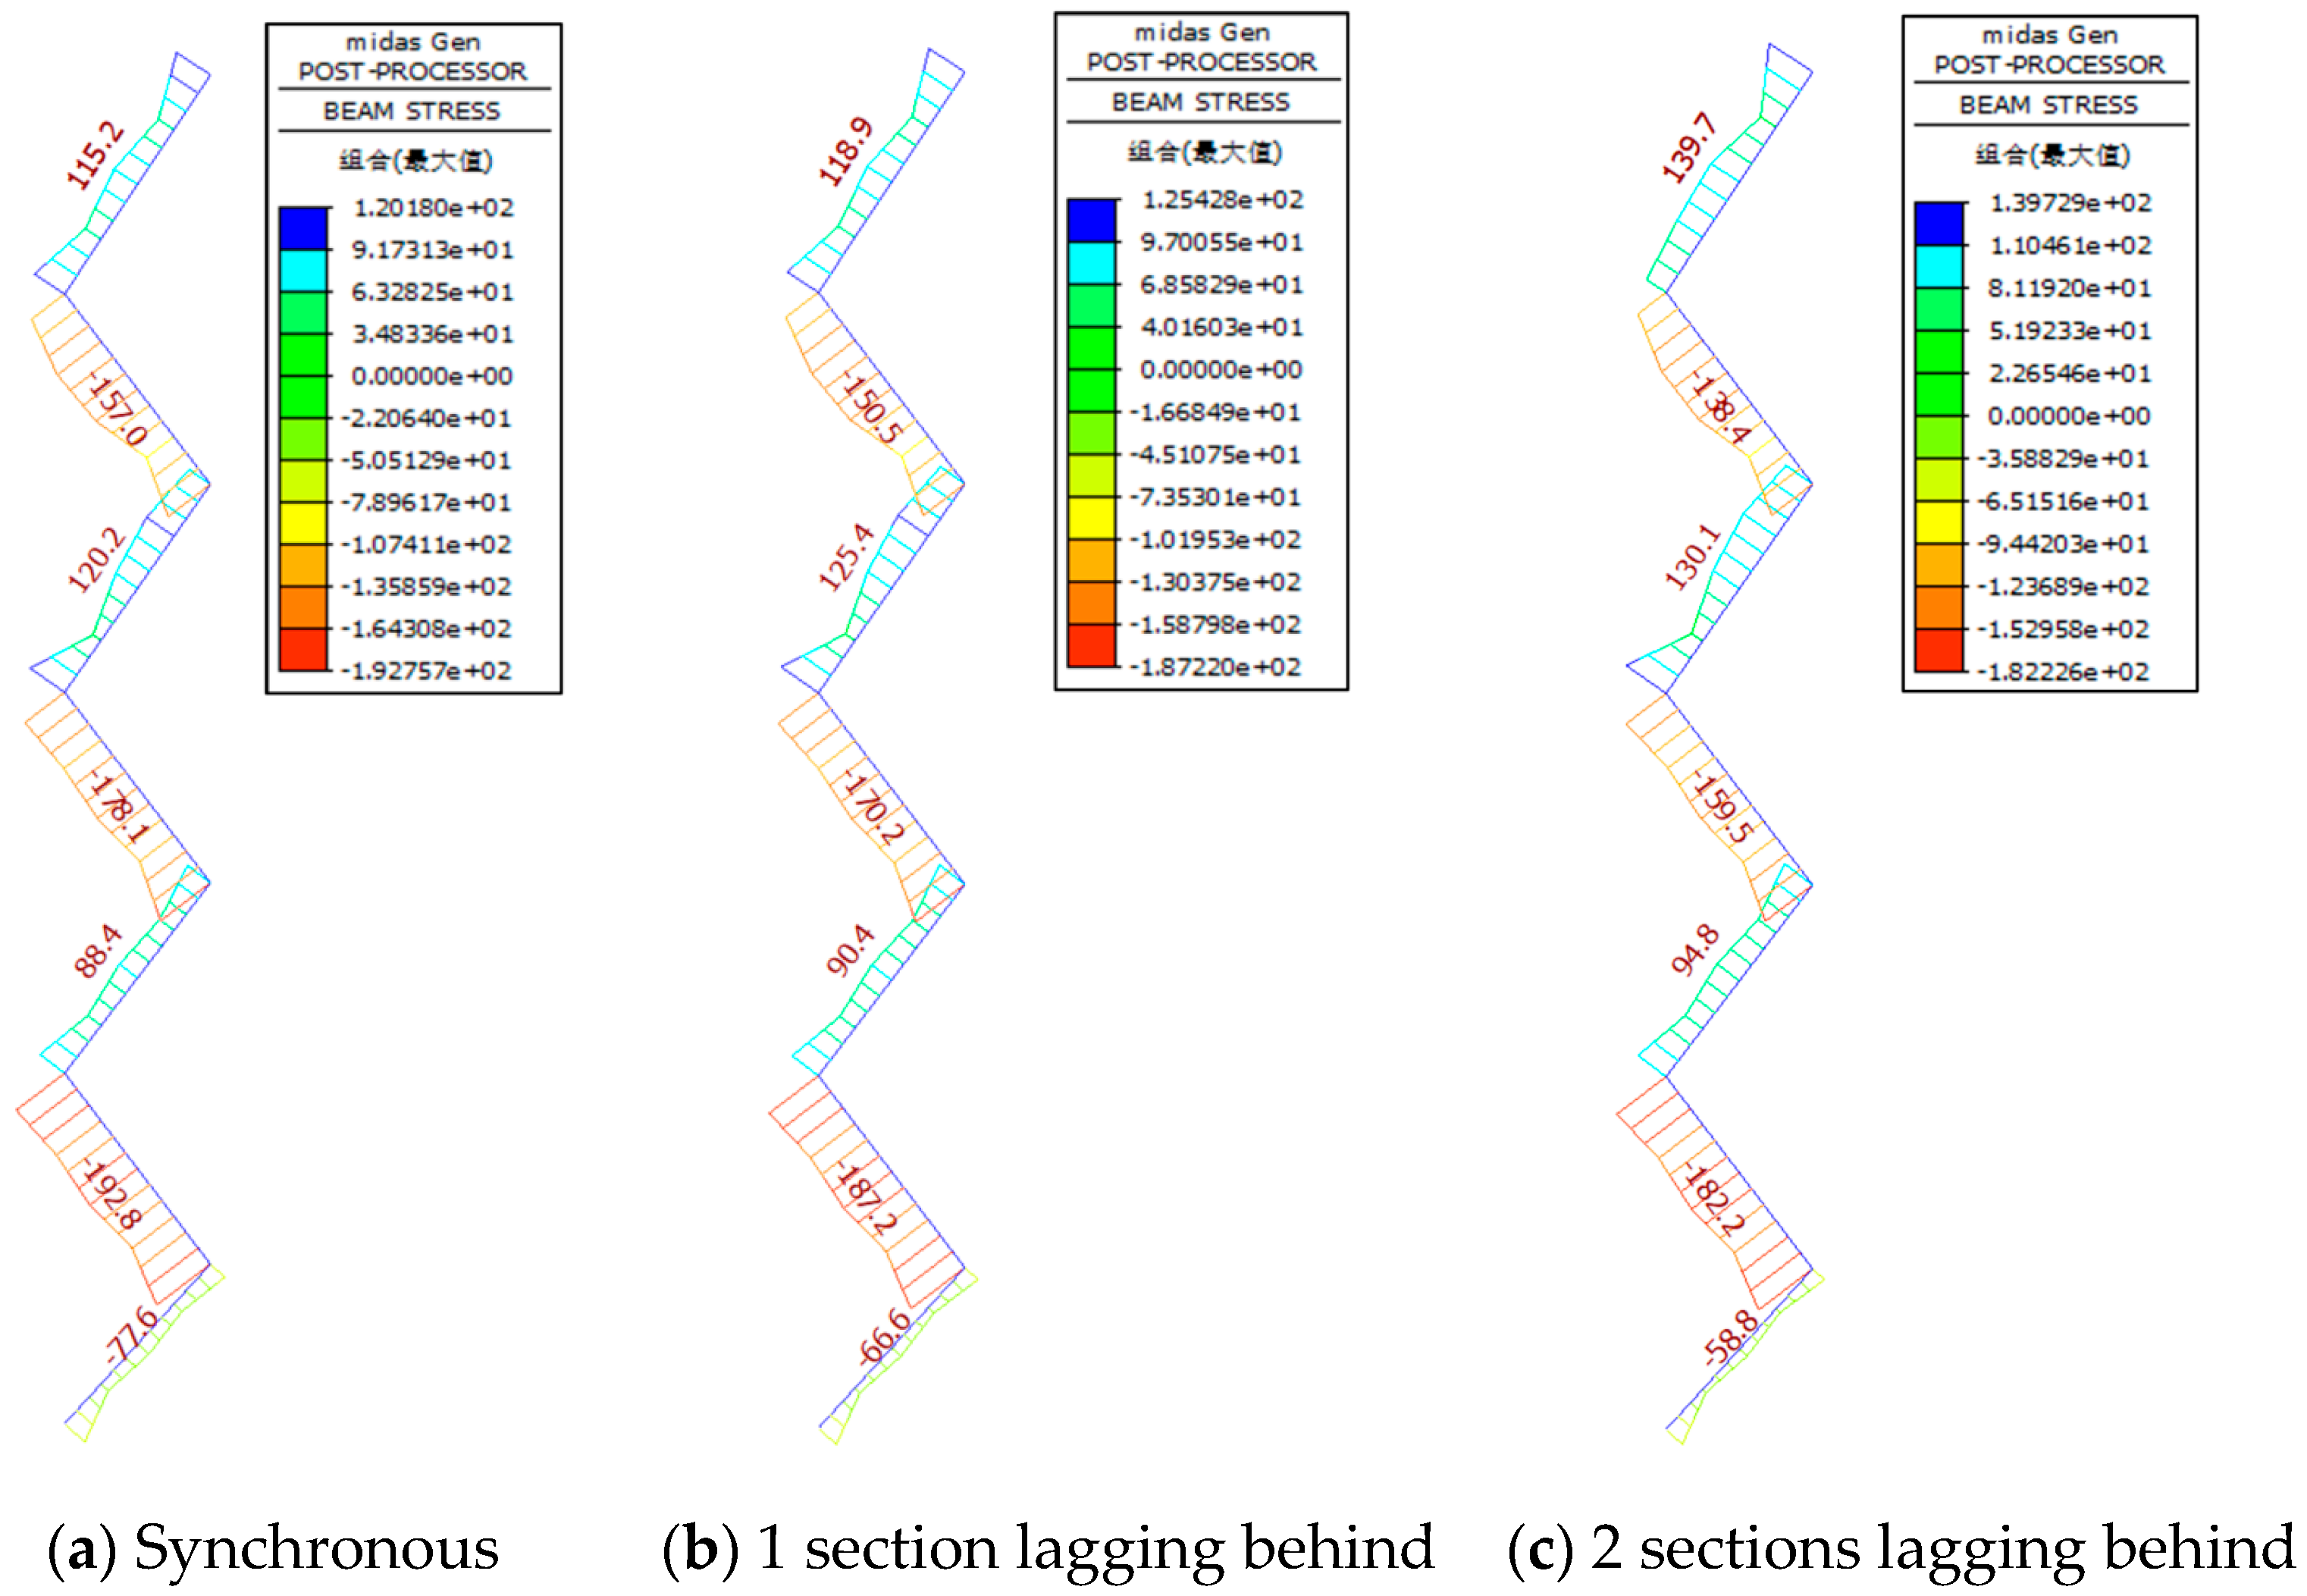
5.2. Influence of the Closure Timing of Belt Truss
- (1)
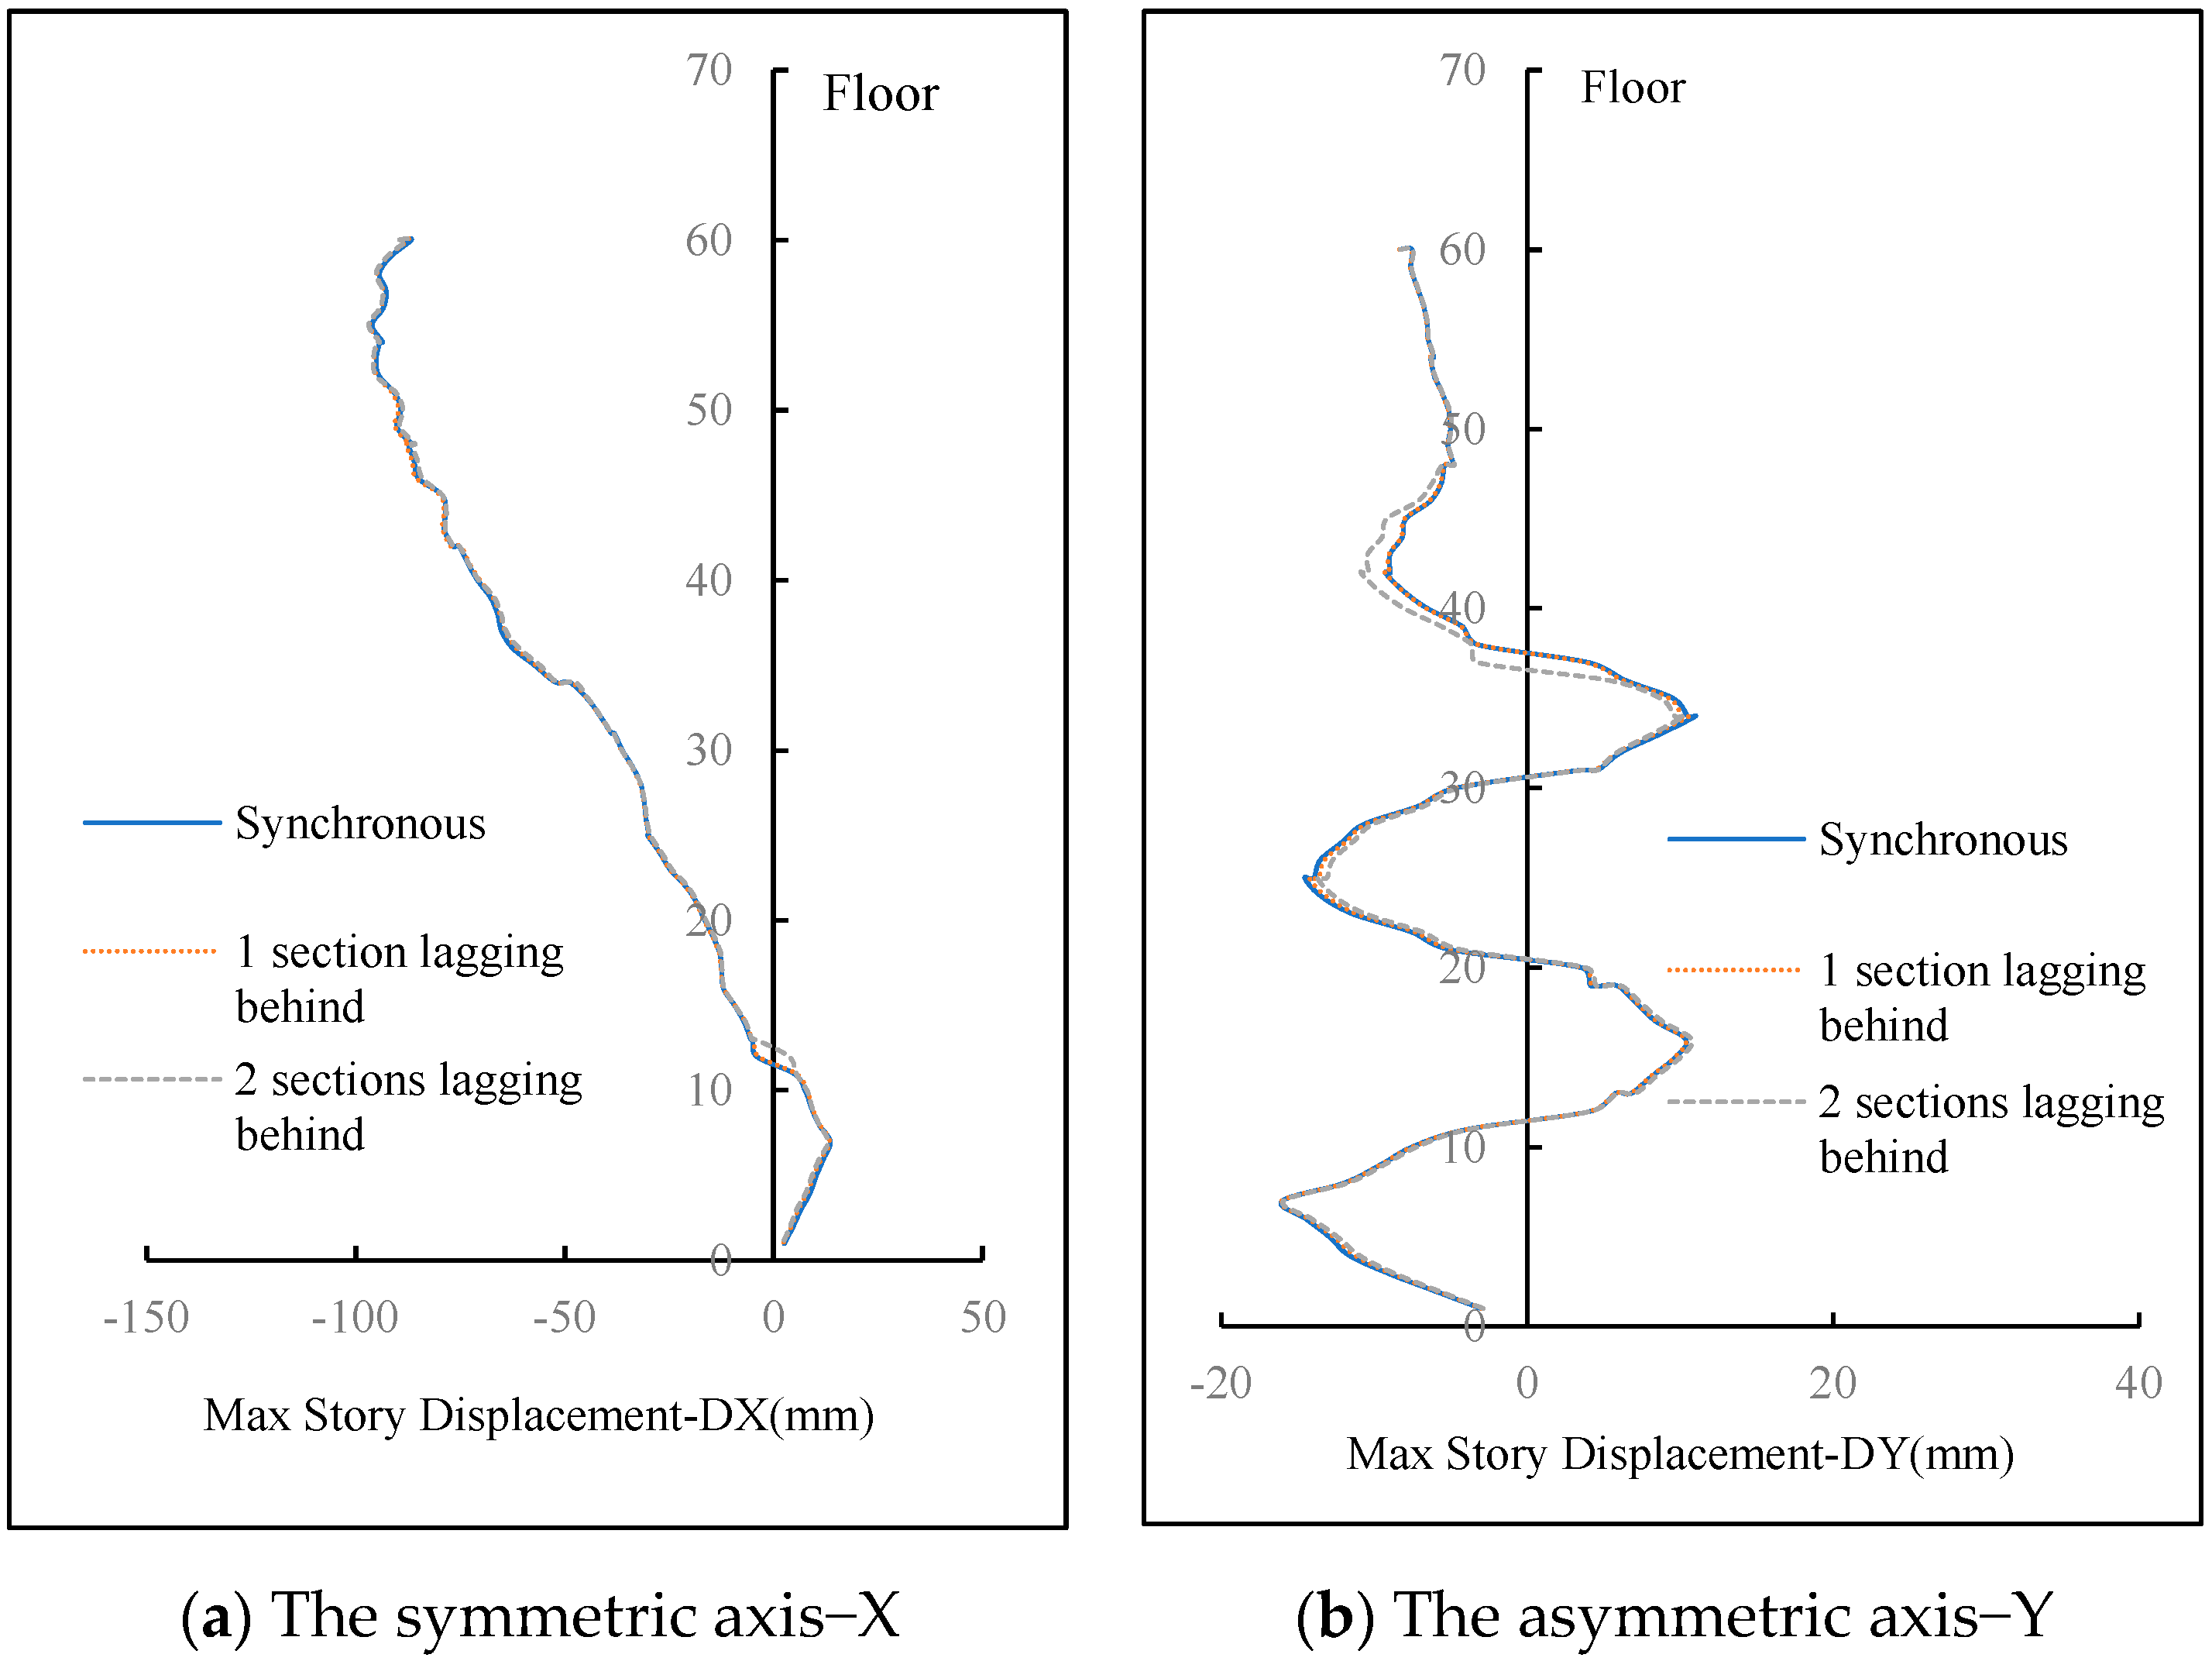
- On lateral displacement
- (2)
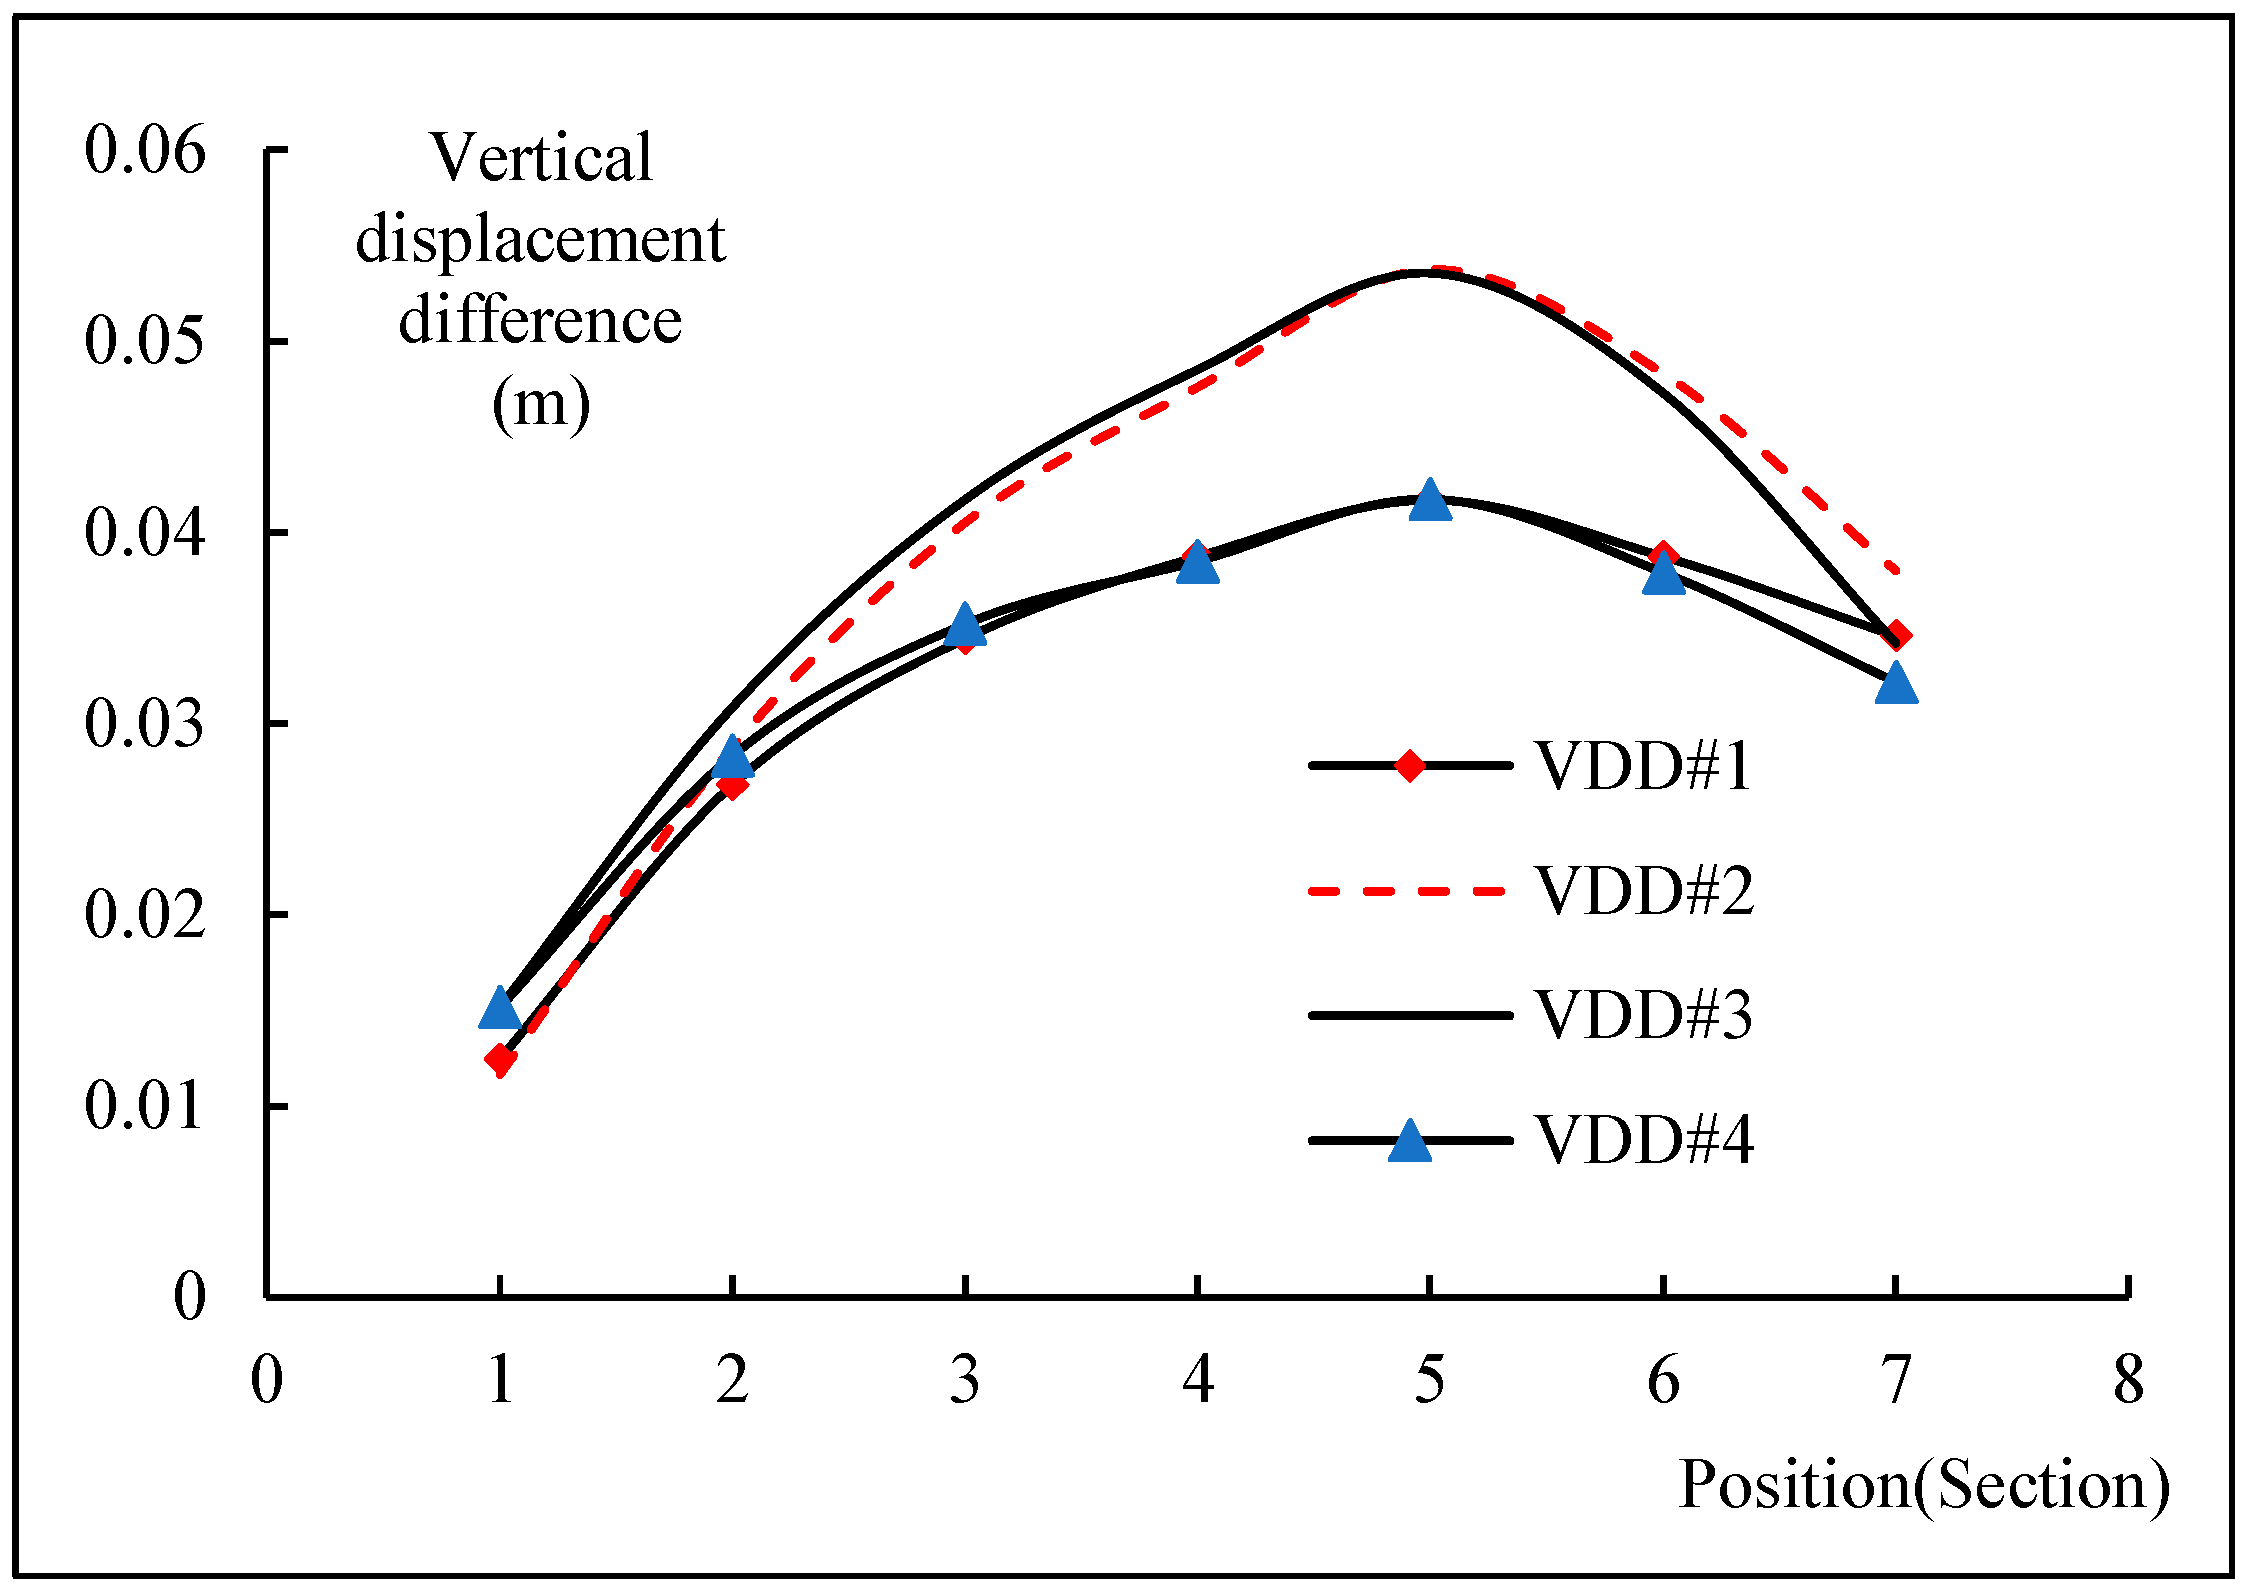
- On vertical displacement difference
- (3)
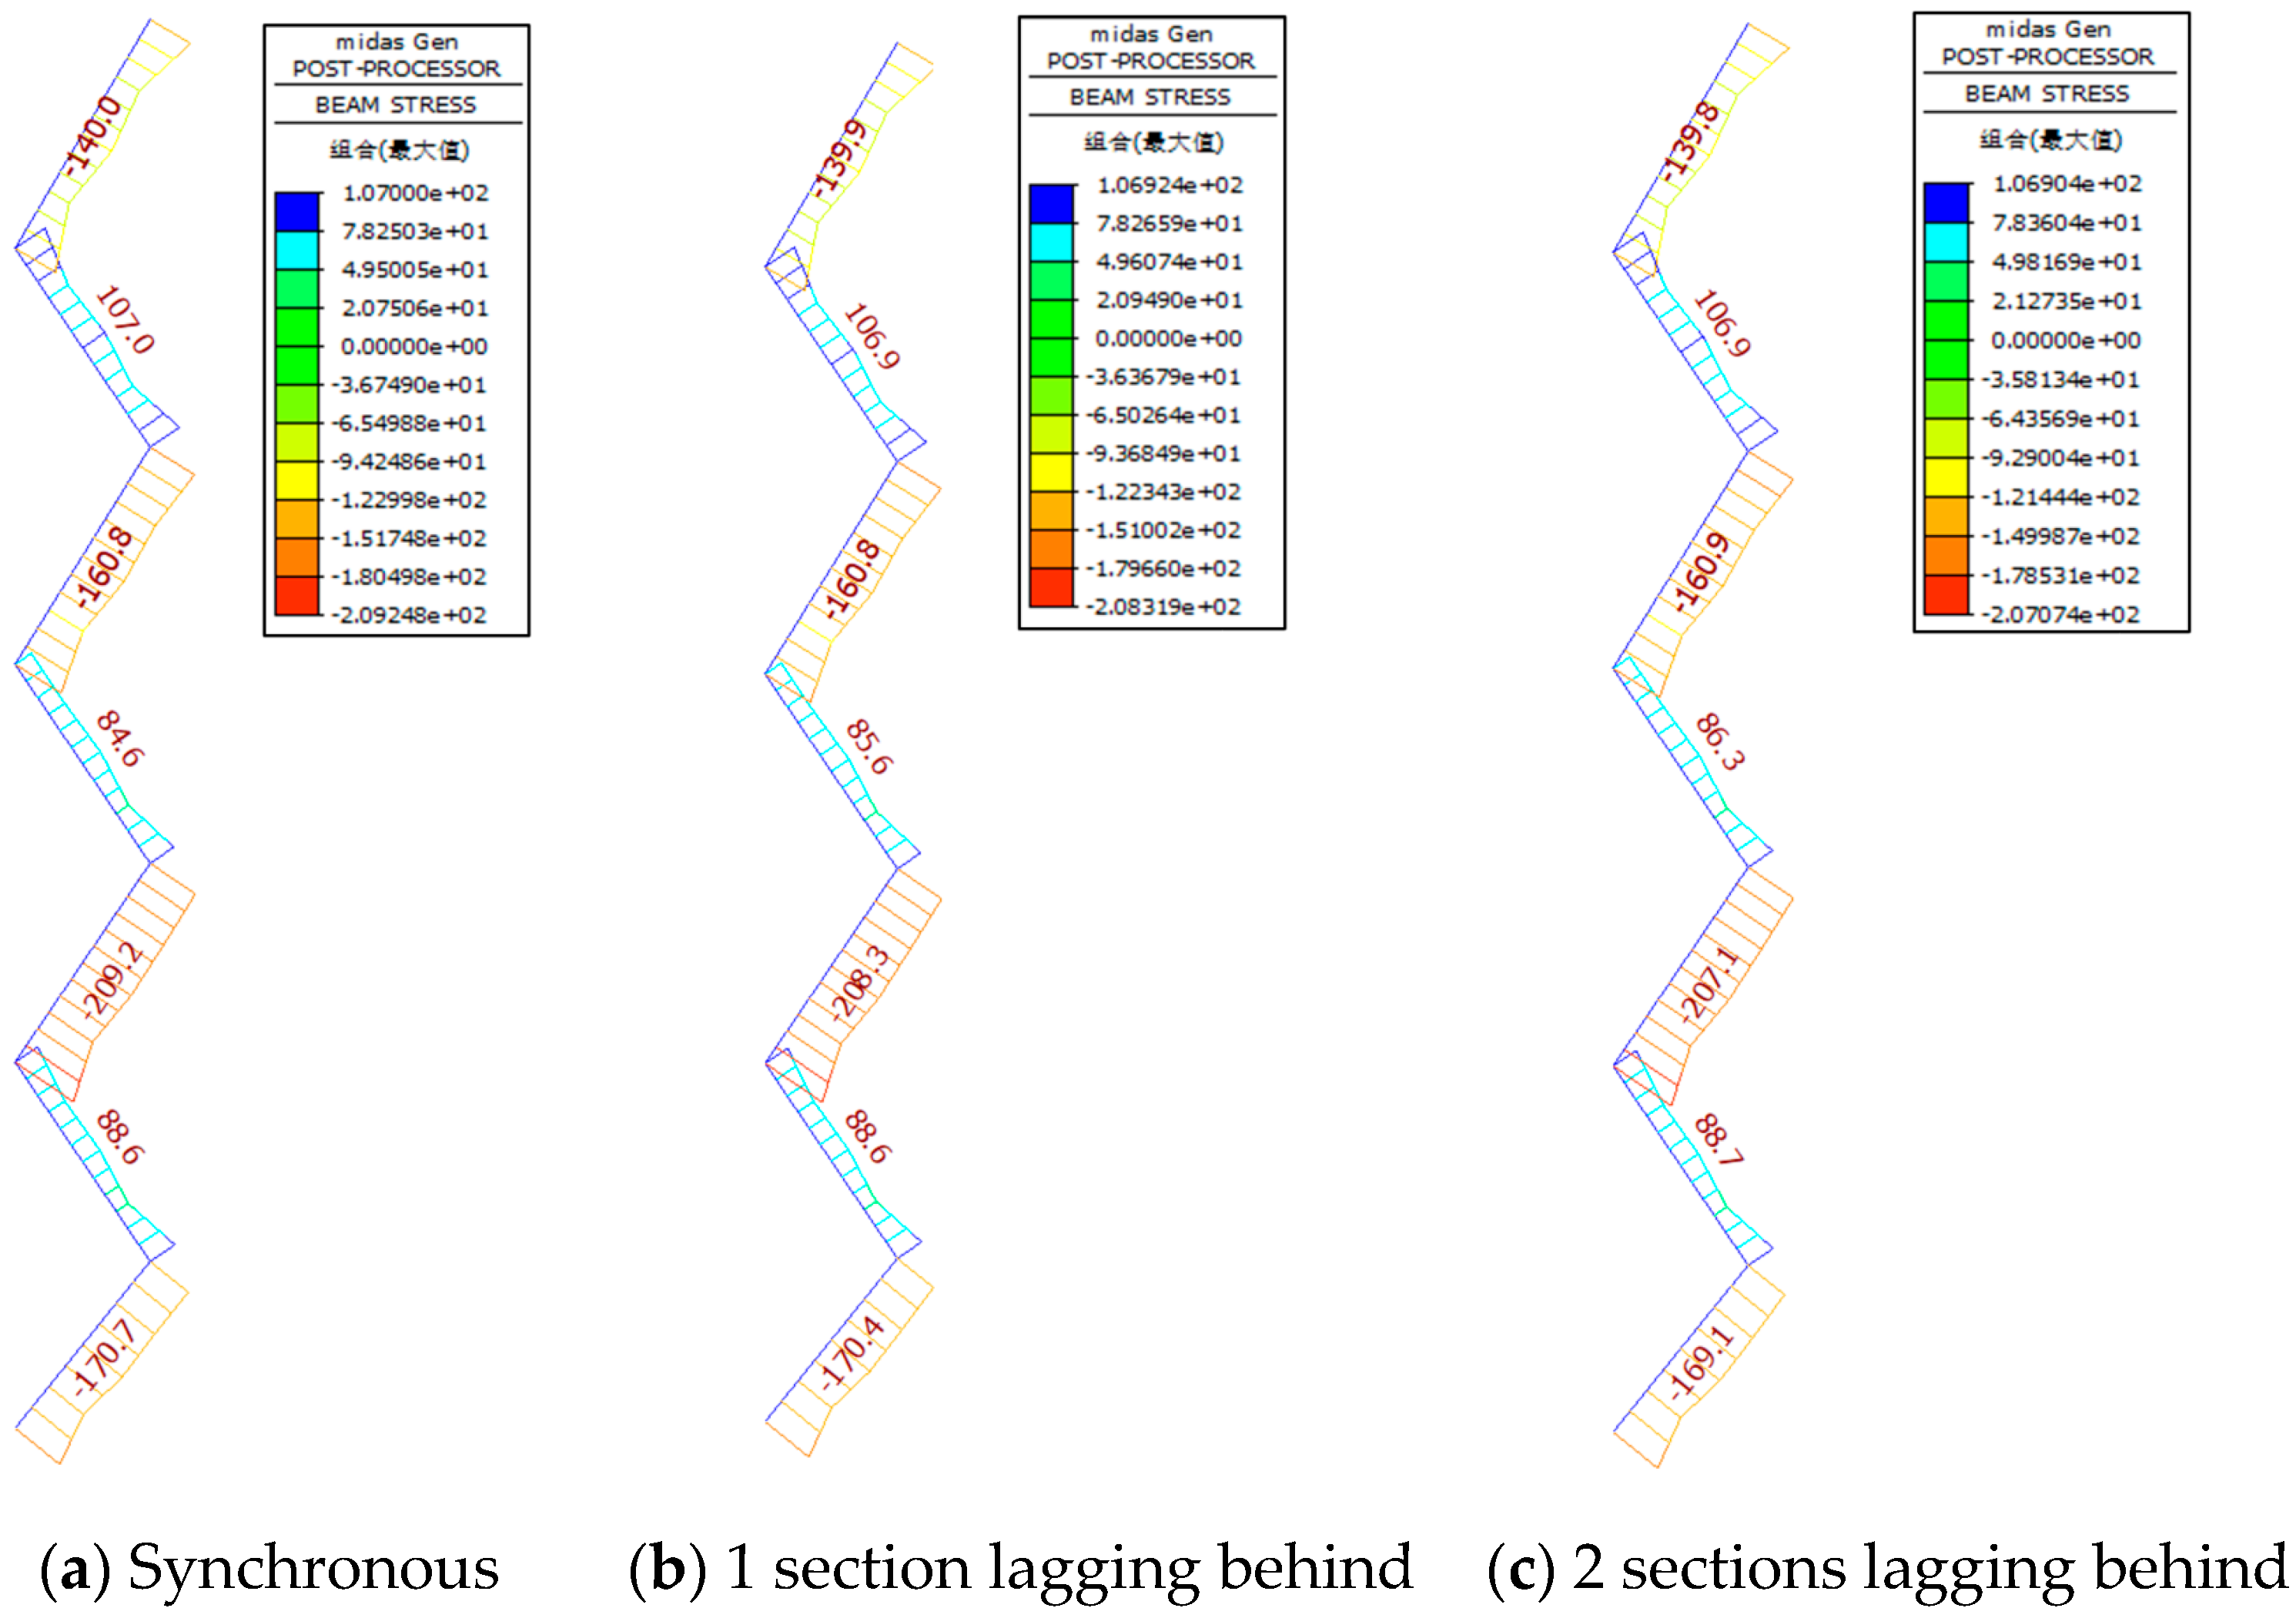
- On max stress of key components
5.3. Influence of the Closure Timing of Mega Braces
- (1)
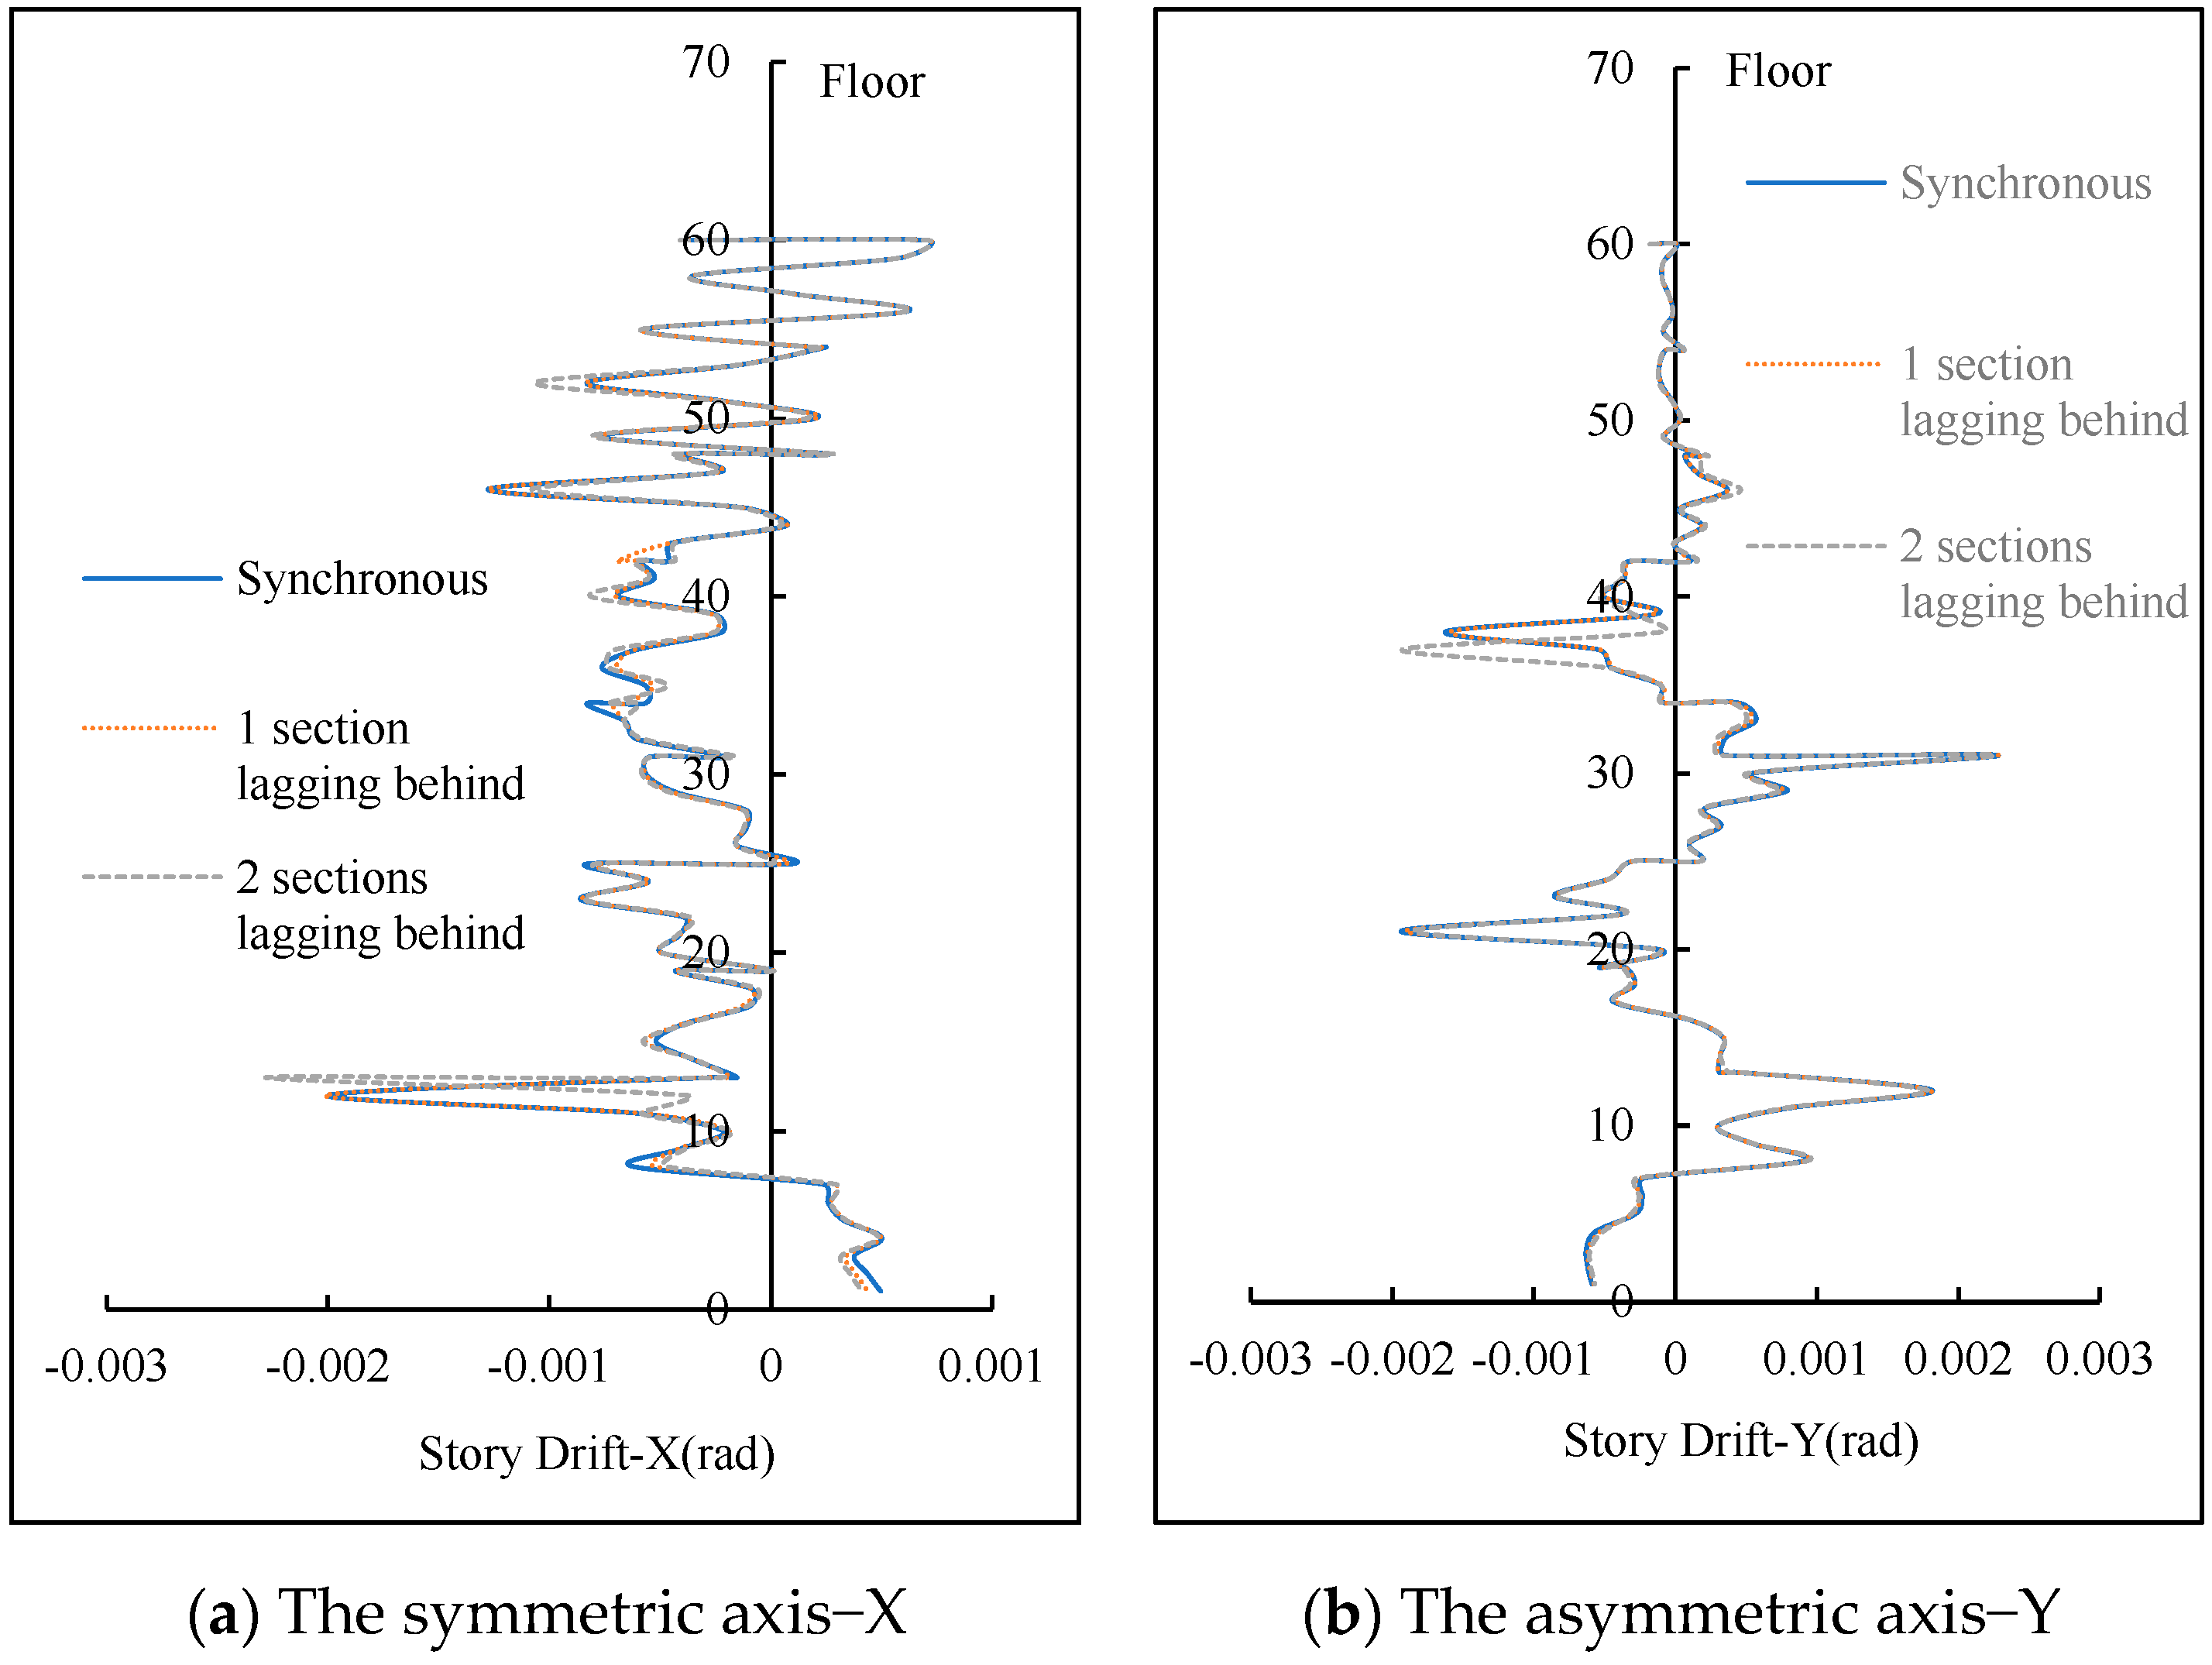
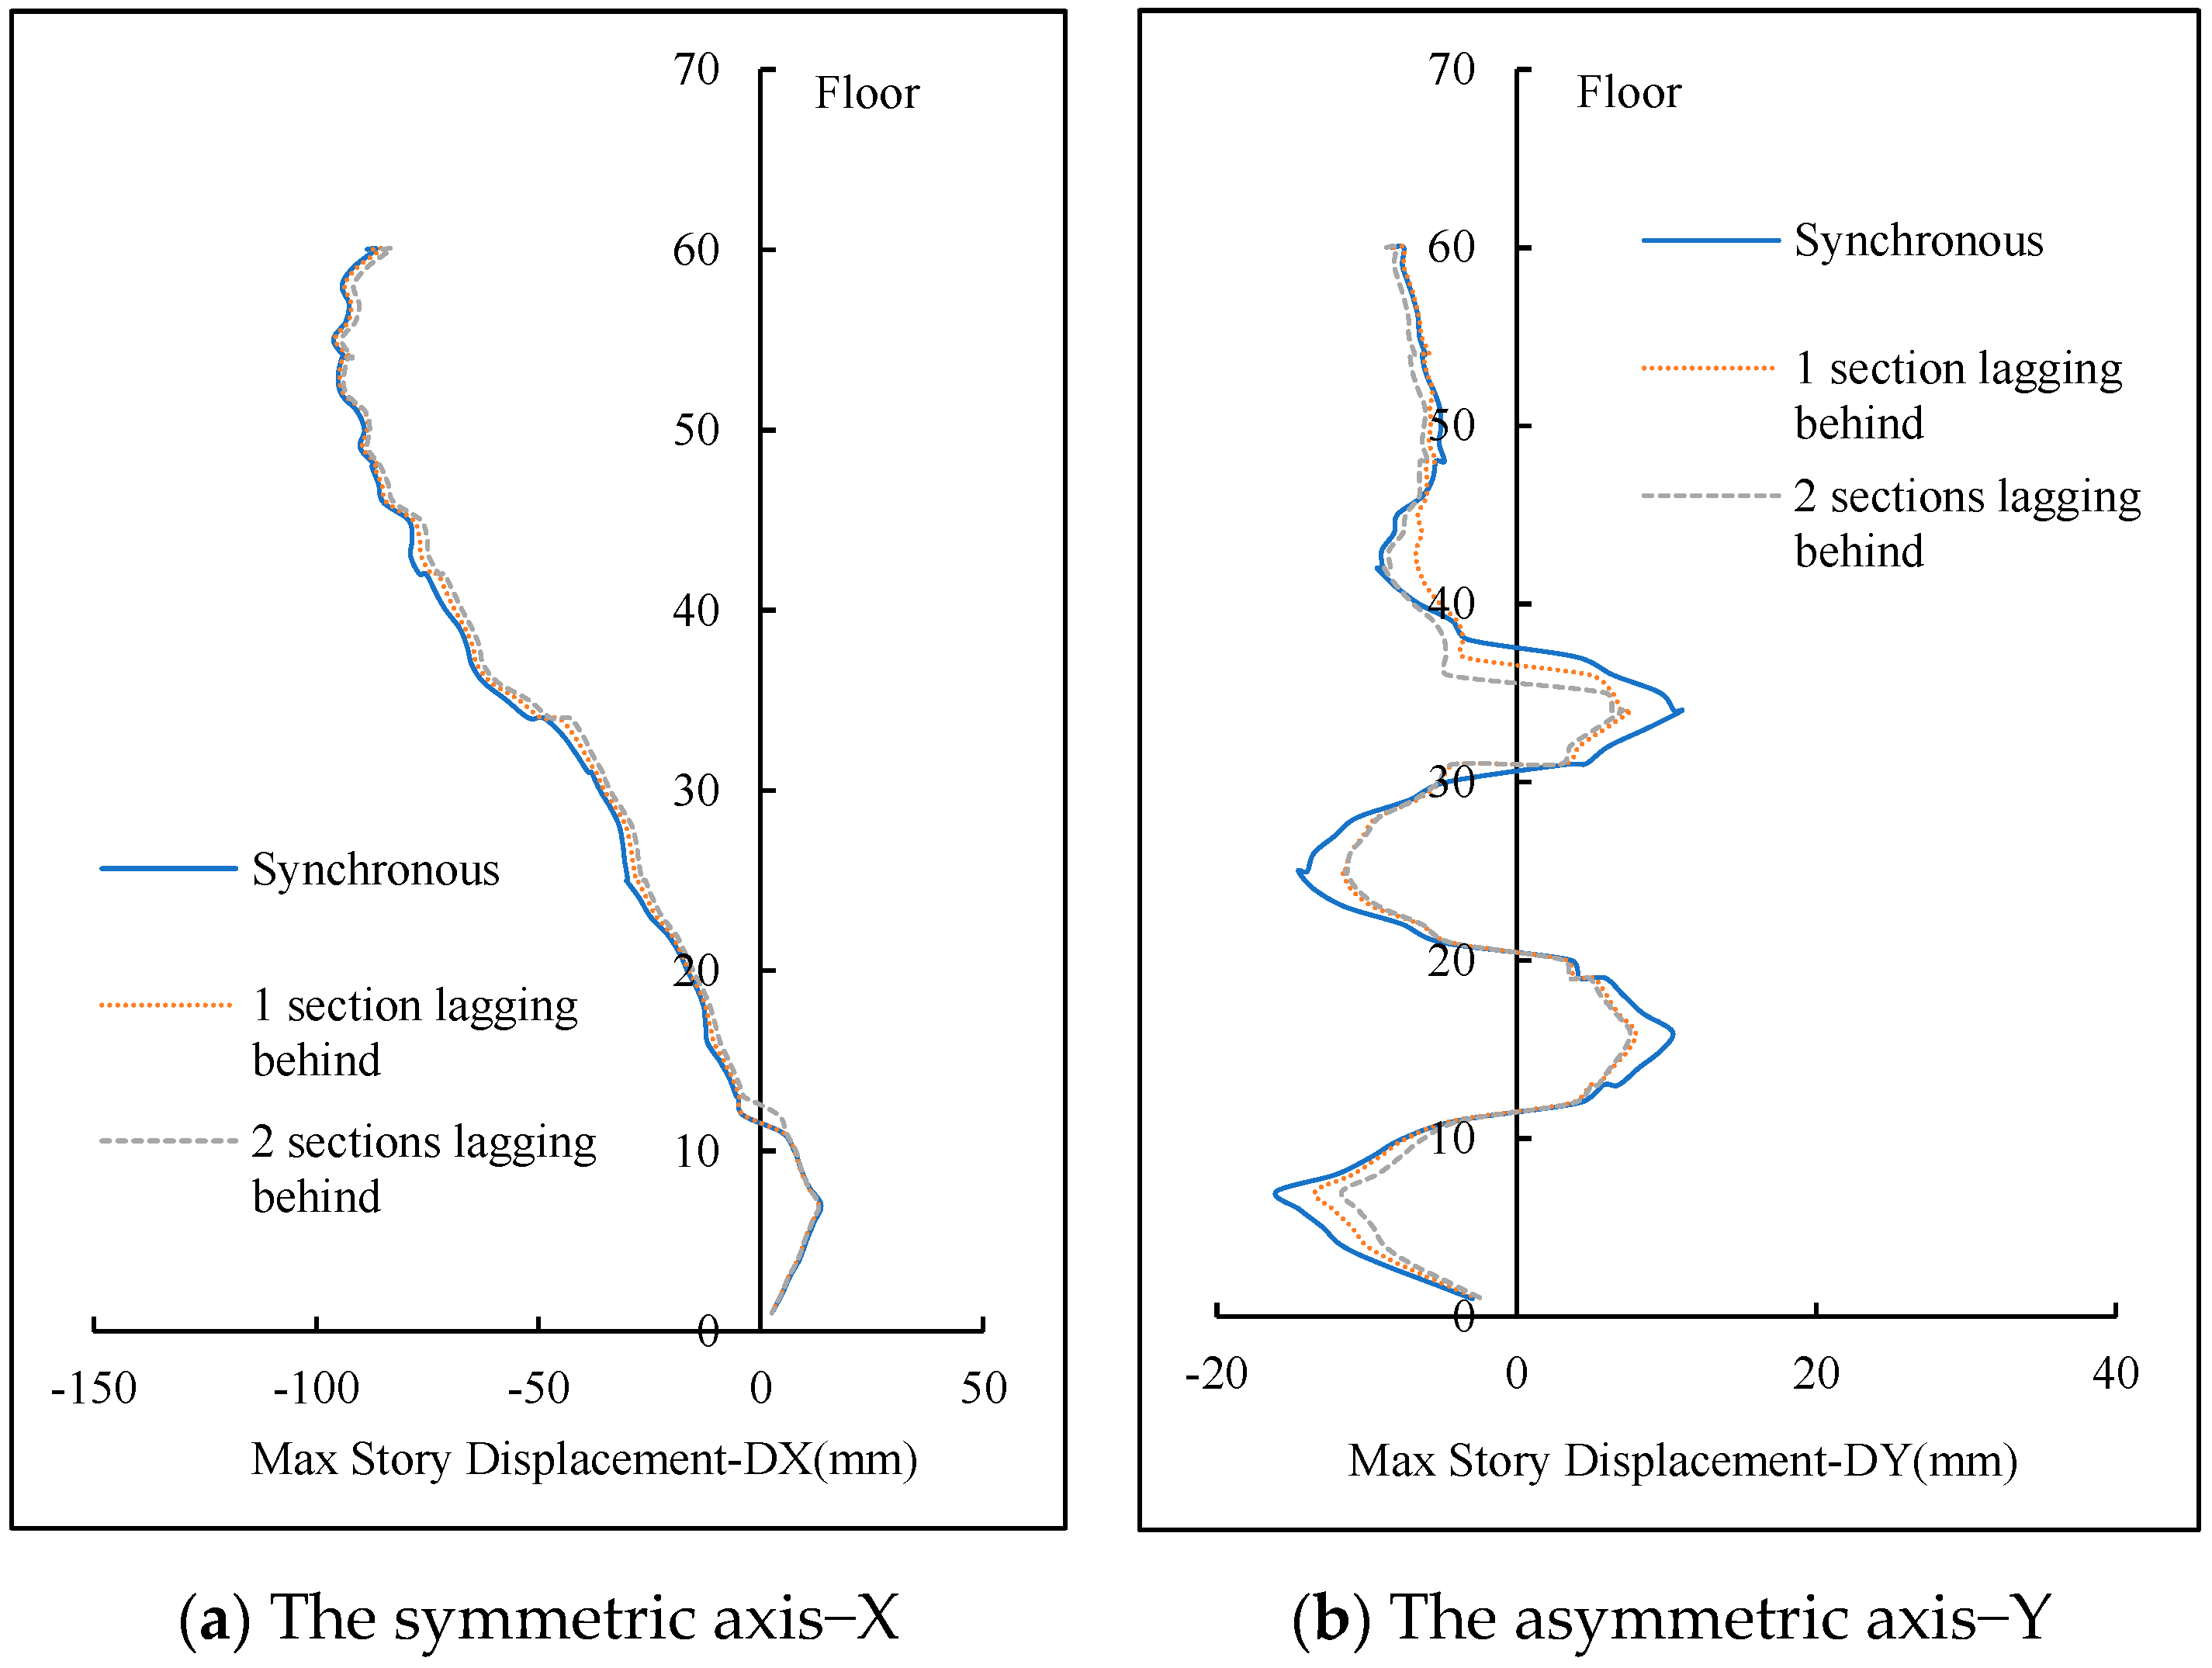
- On lateral displacement
- (2)
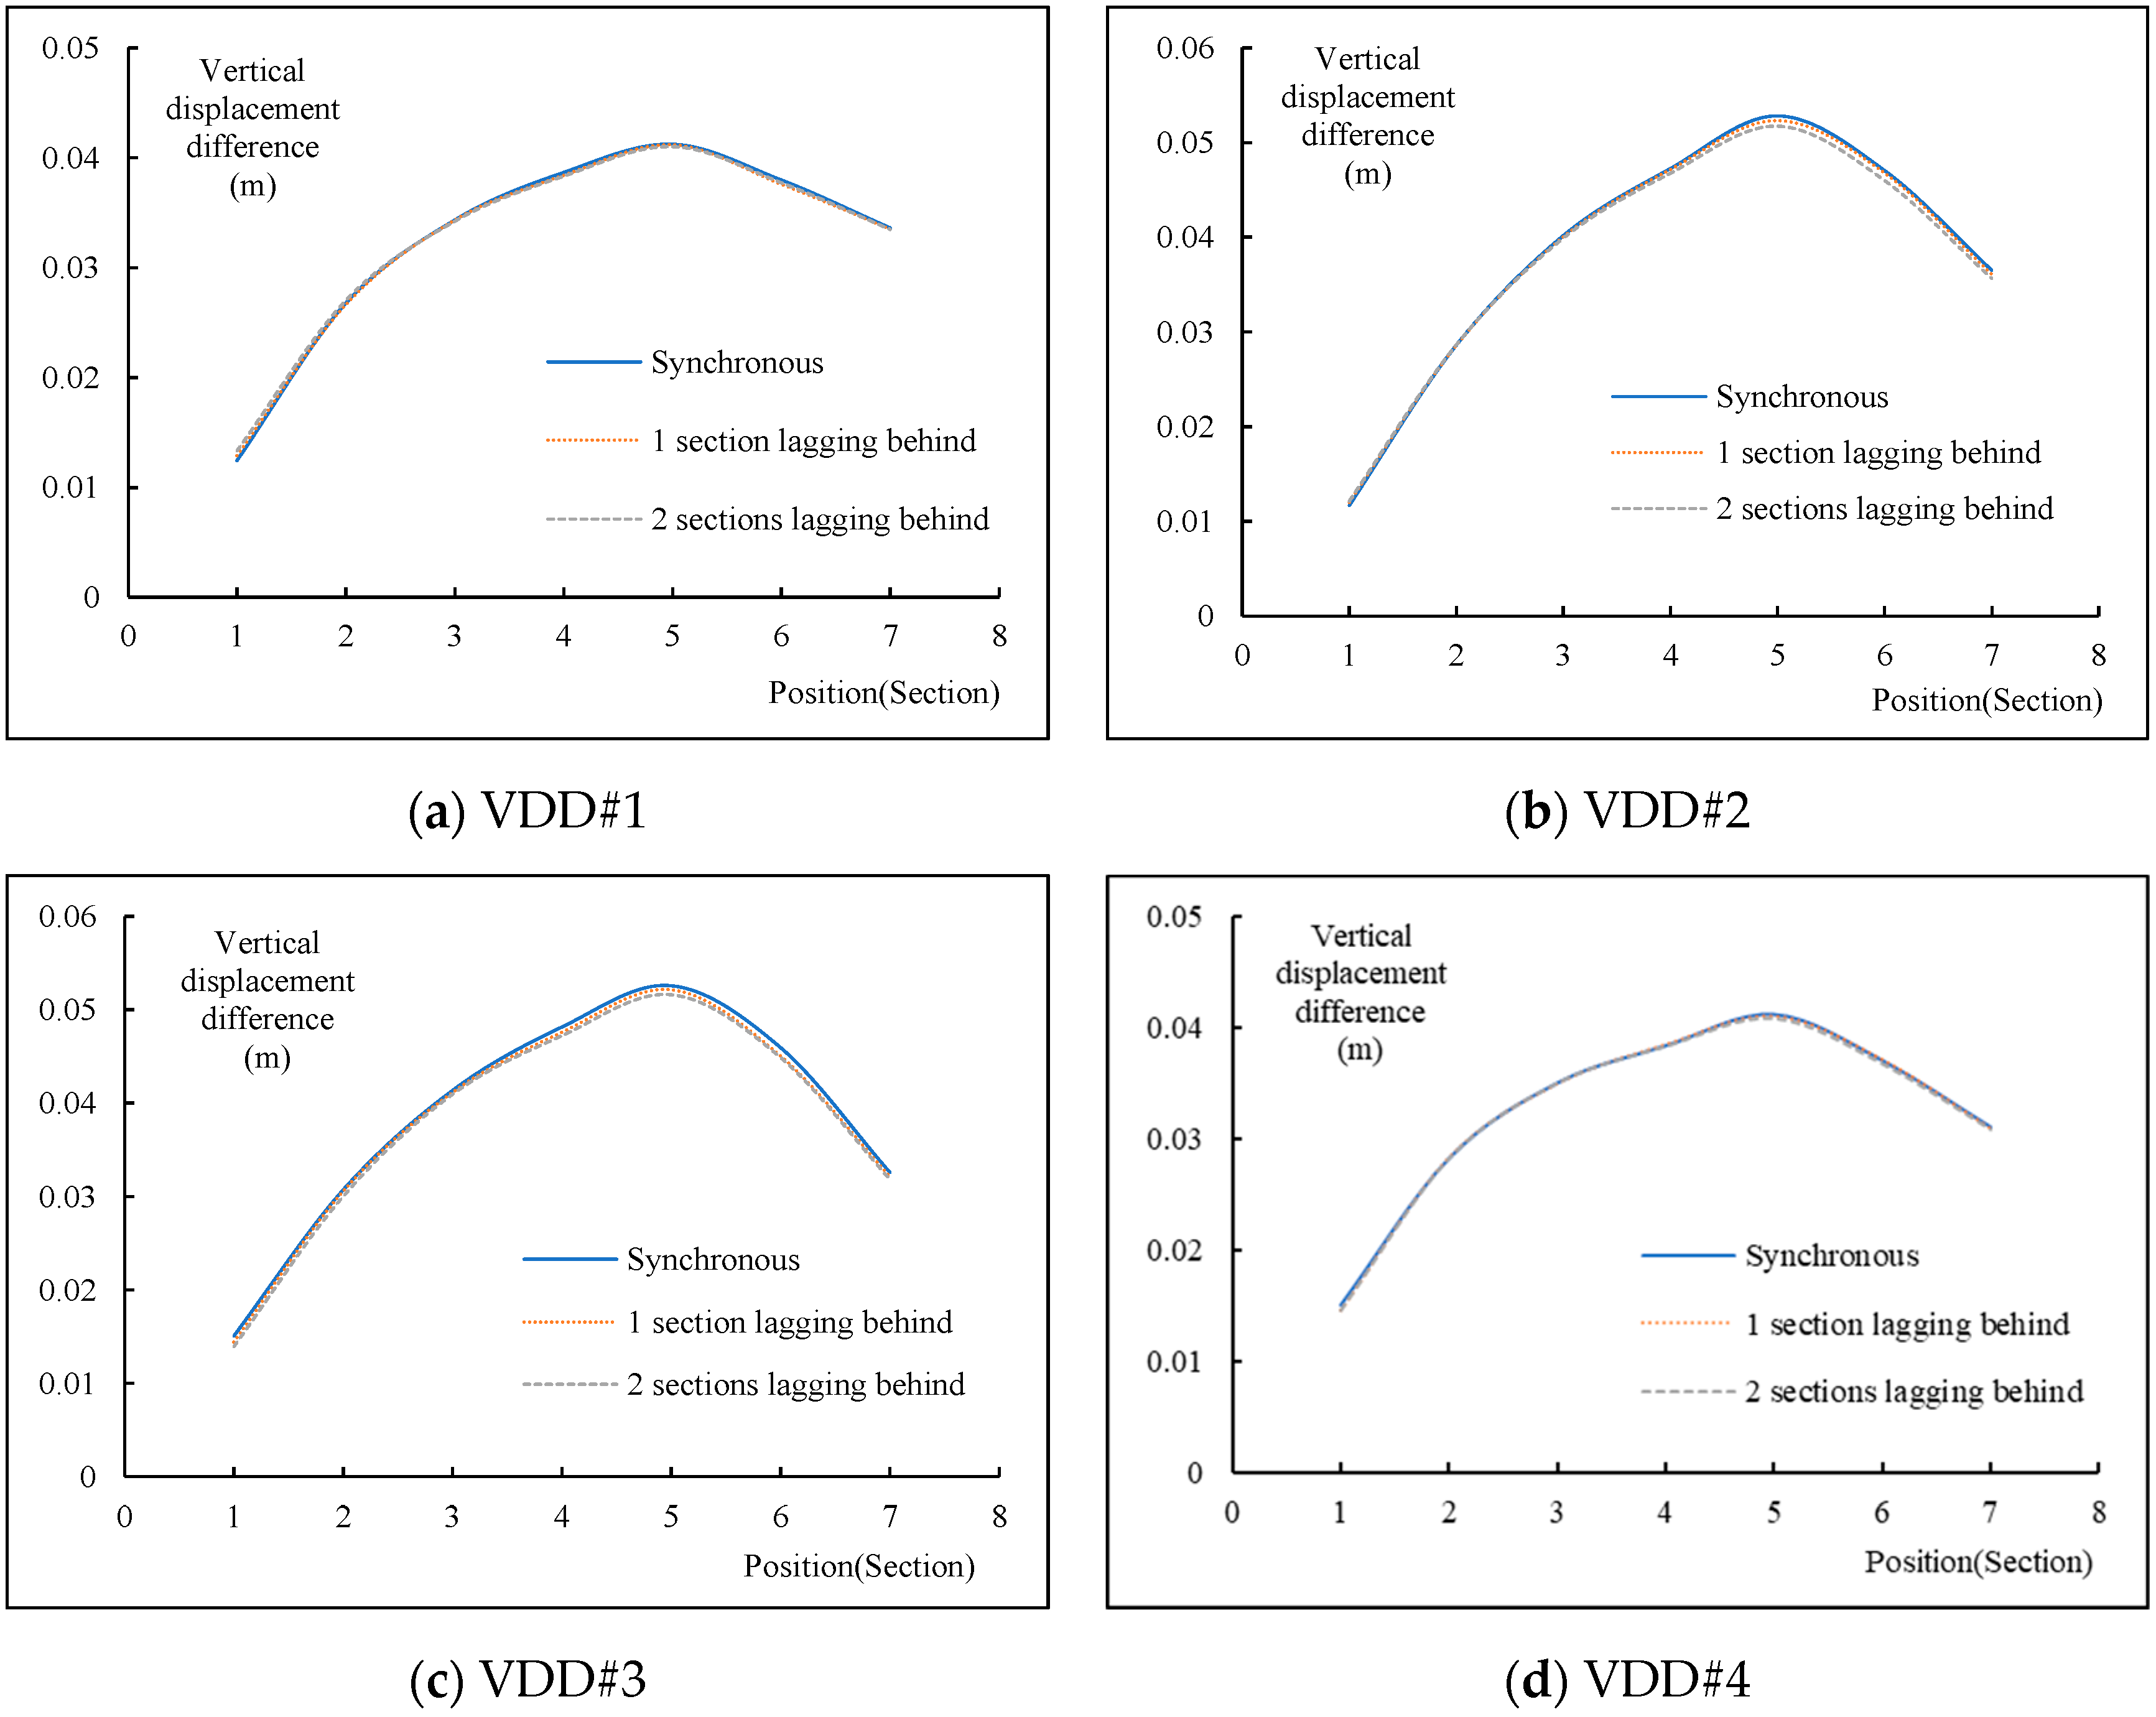
- On vertical displacement difference
- (3)
- On max stress of key components
6. Suggestions for Deformation Control
6.1. Construction Speed Suggestion
6.2. The Closure Timing of Belt Trusses Suggestion
6.3. The Closure Timing of Mega Braces Suggestion
7. Numerical Simulation-Practical Project
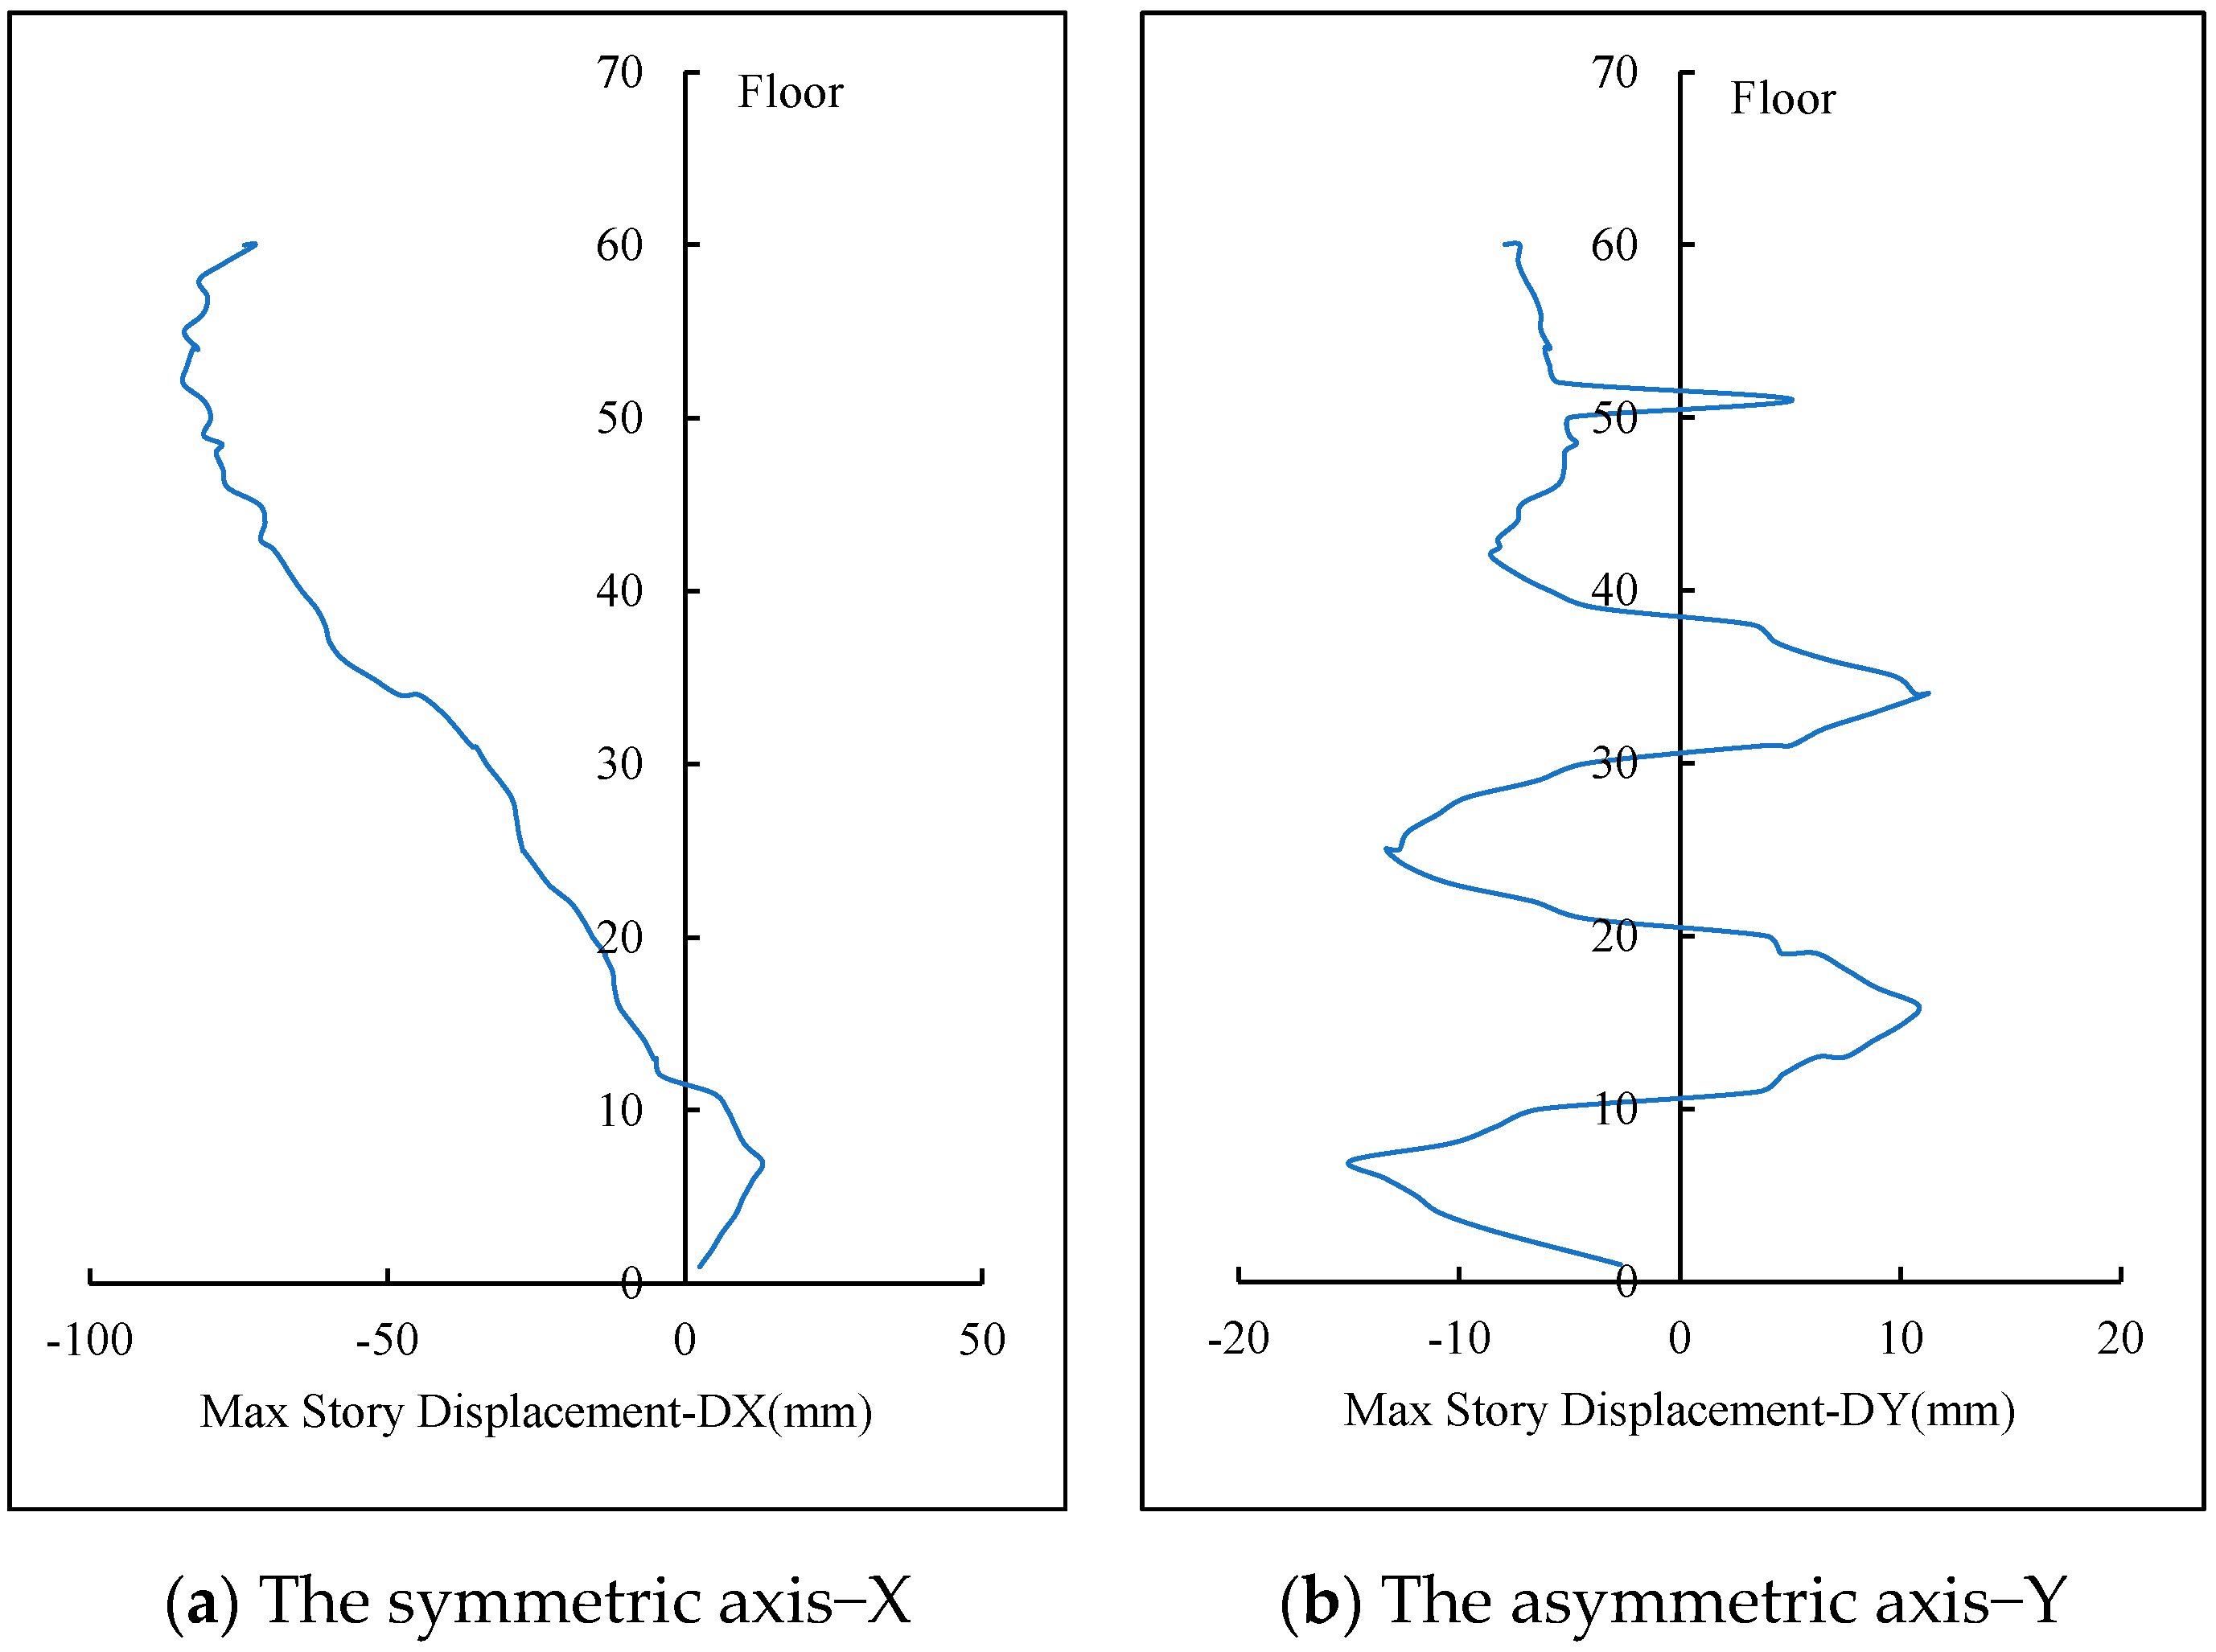
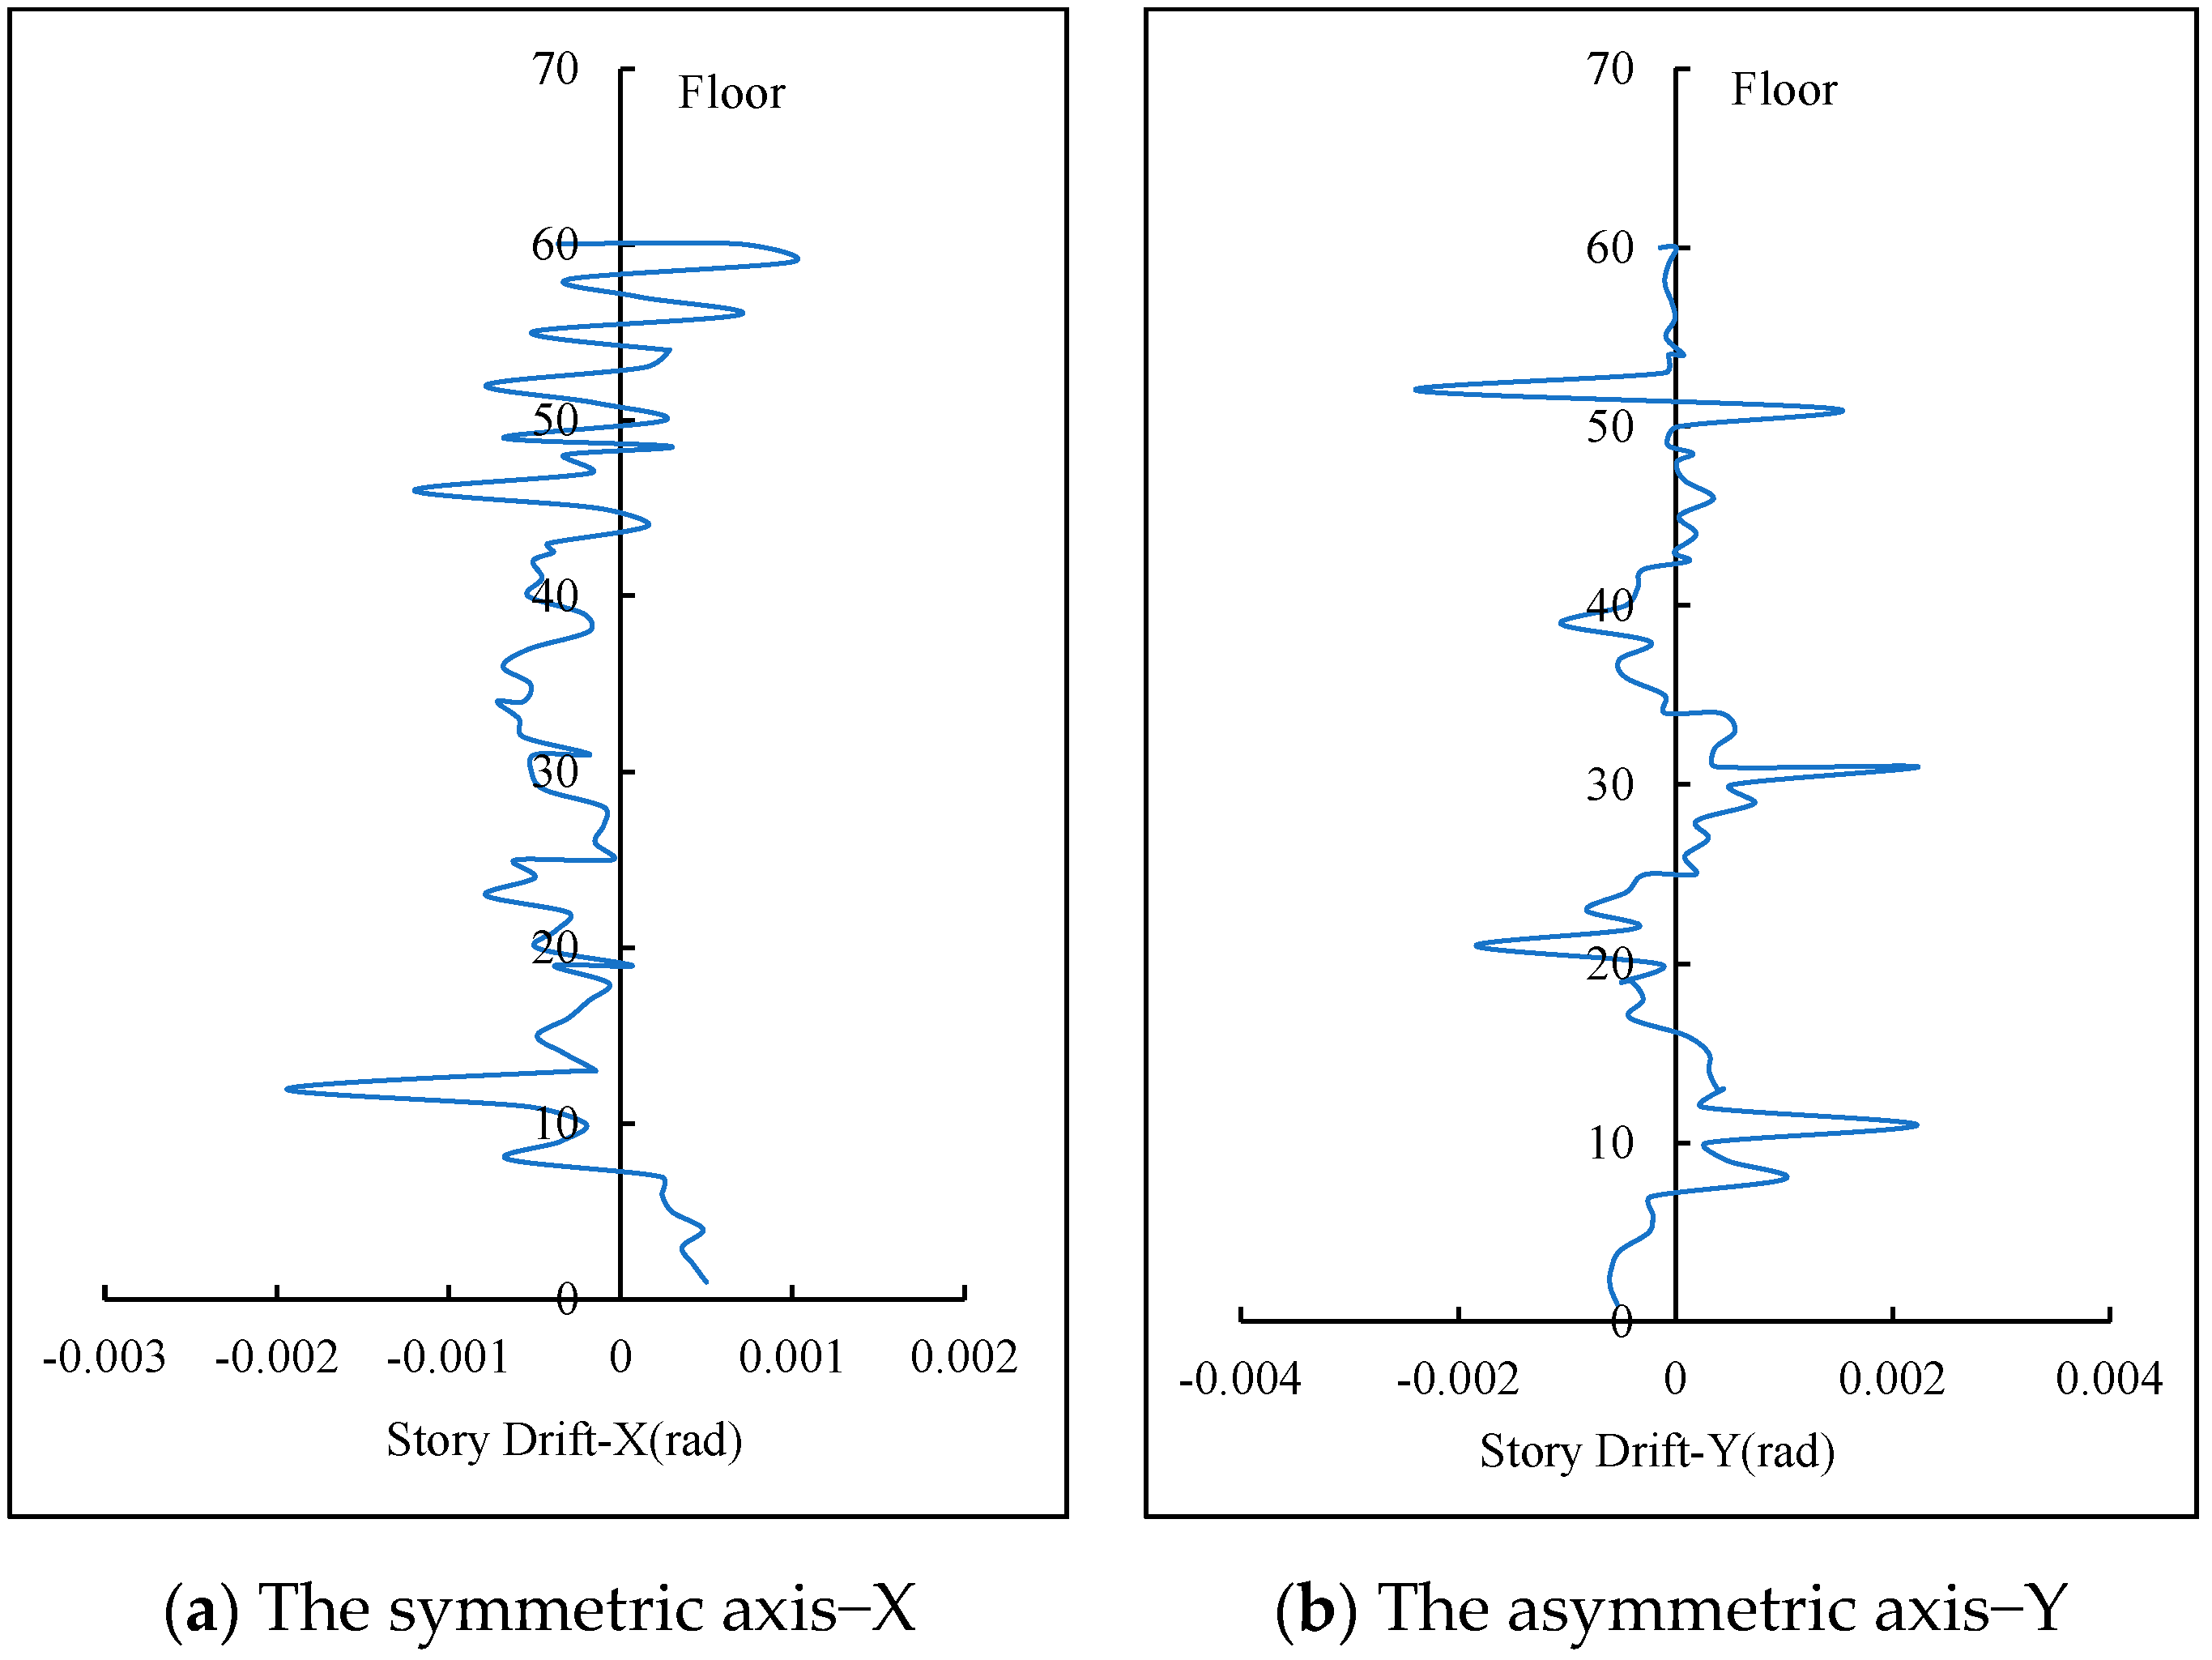
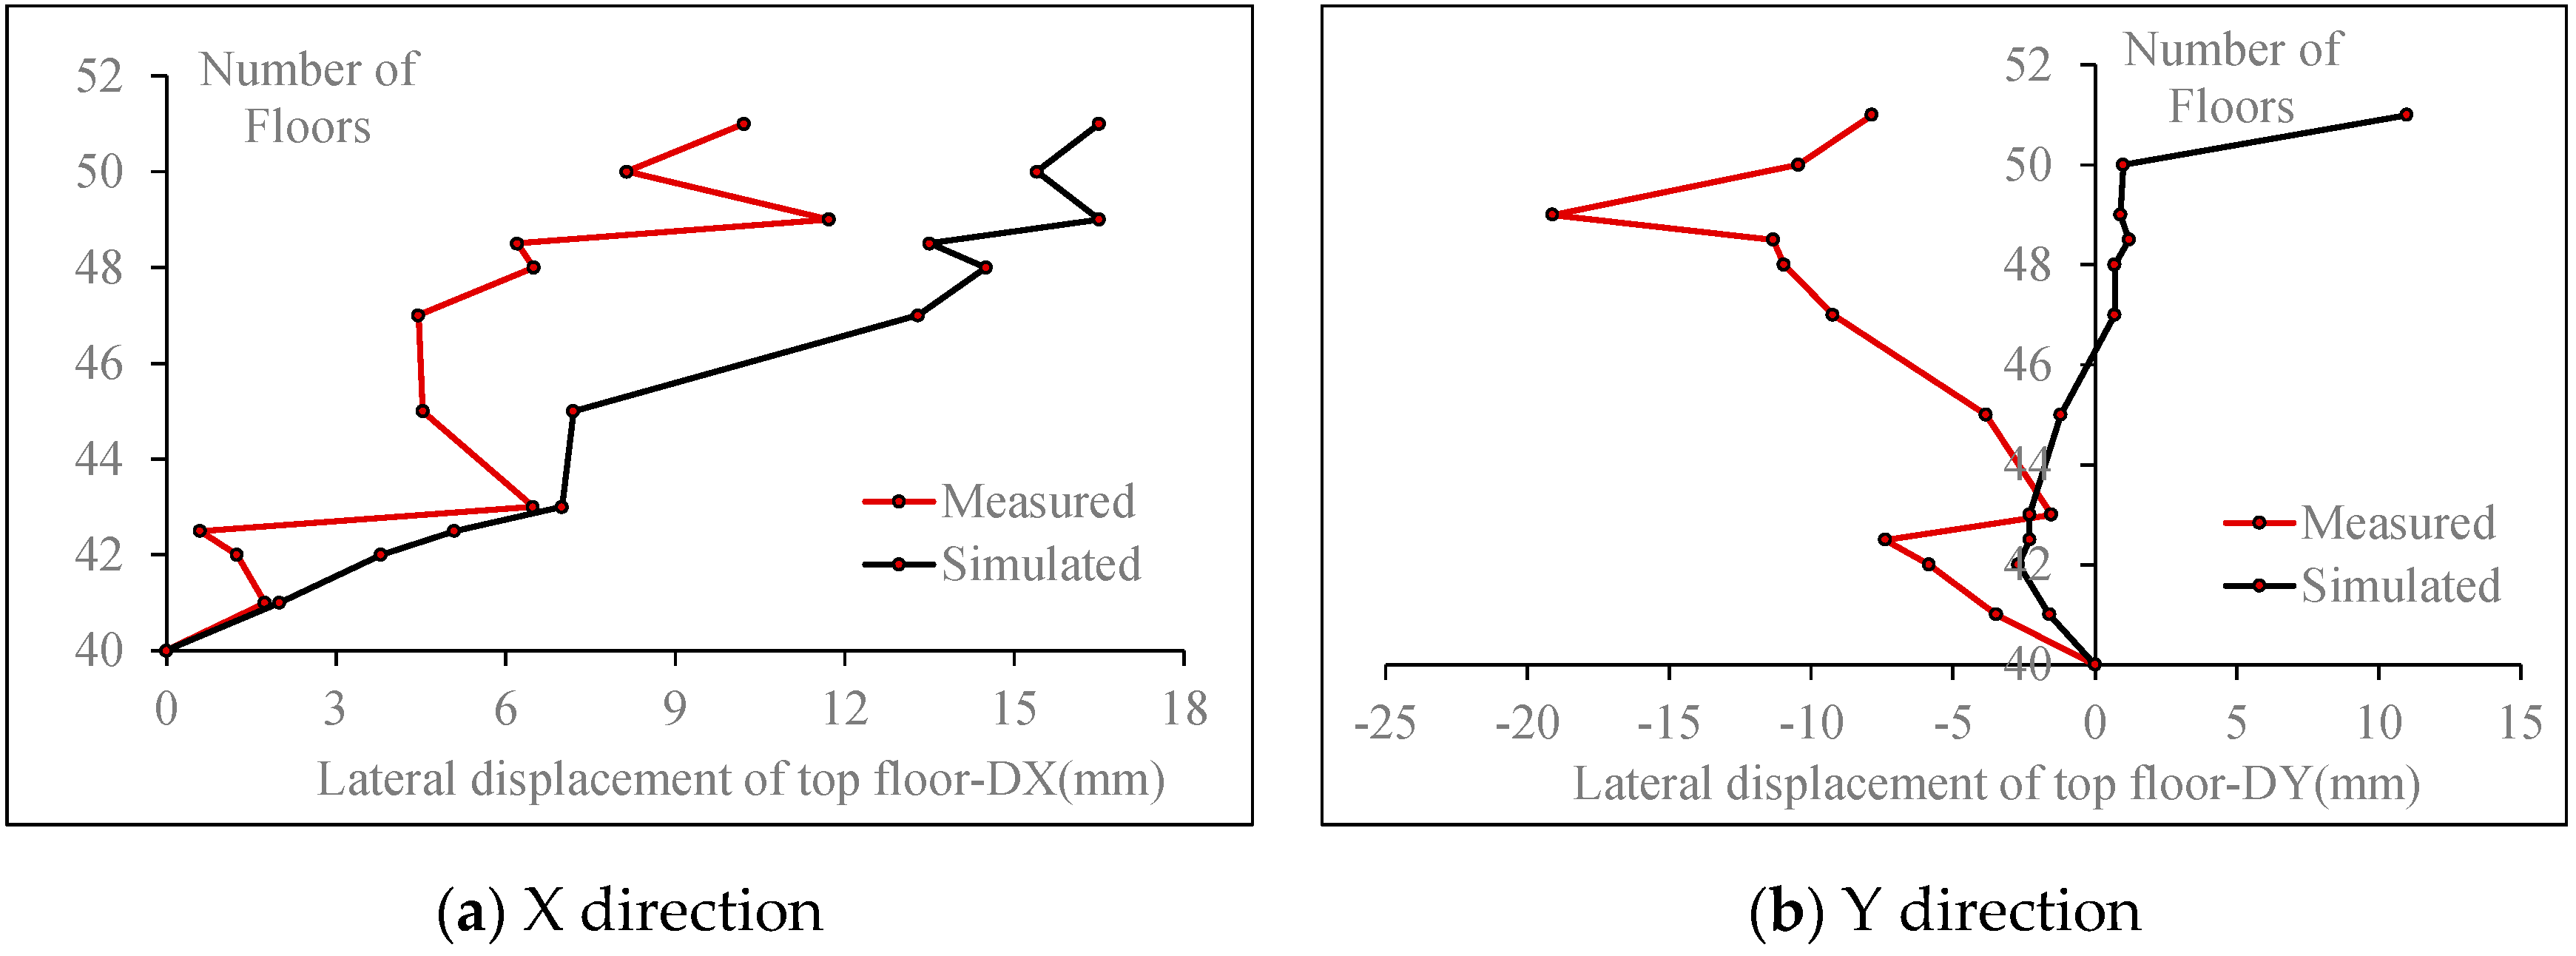
7.1. Lateral Displacement
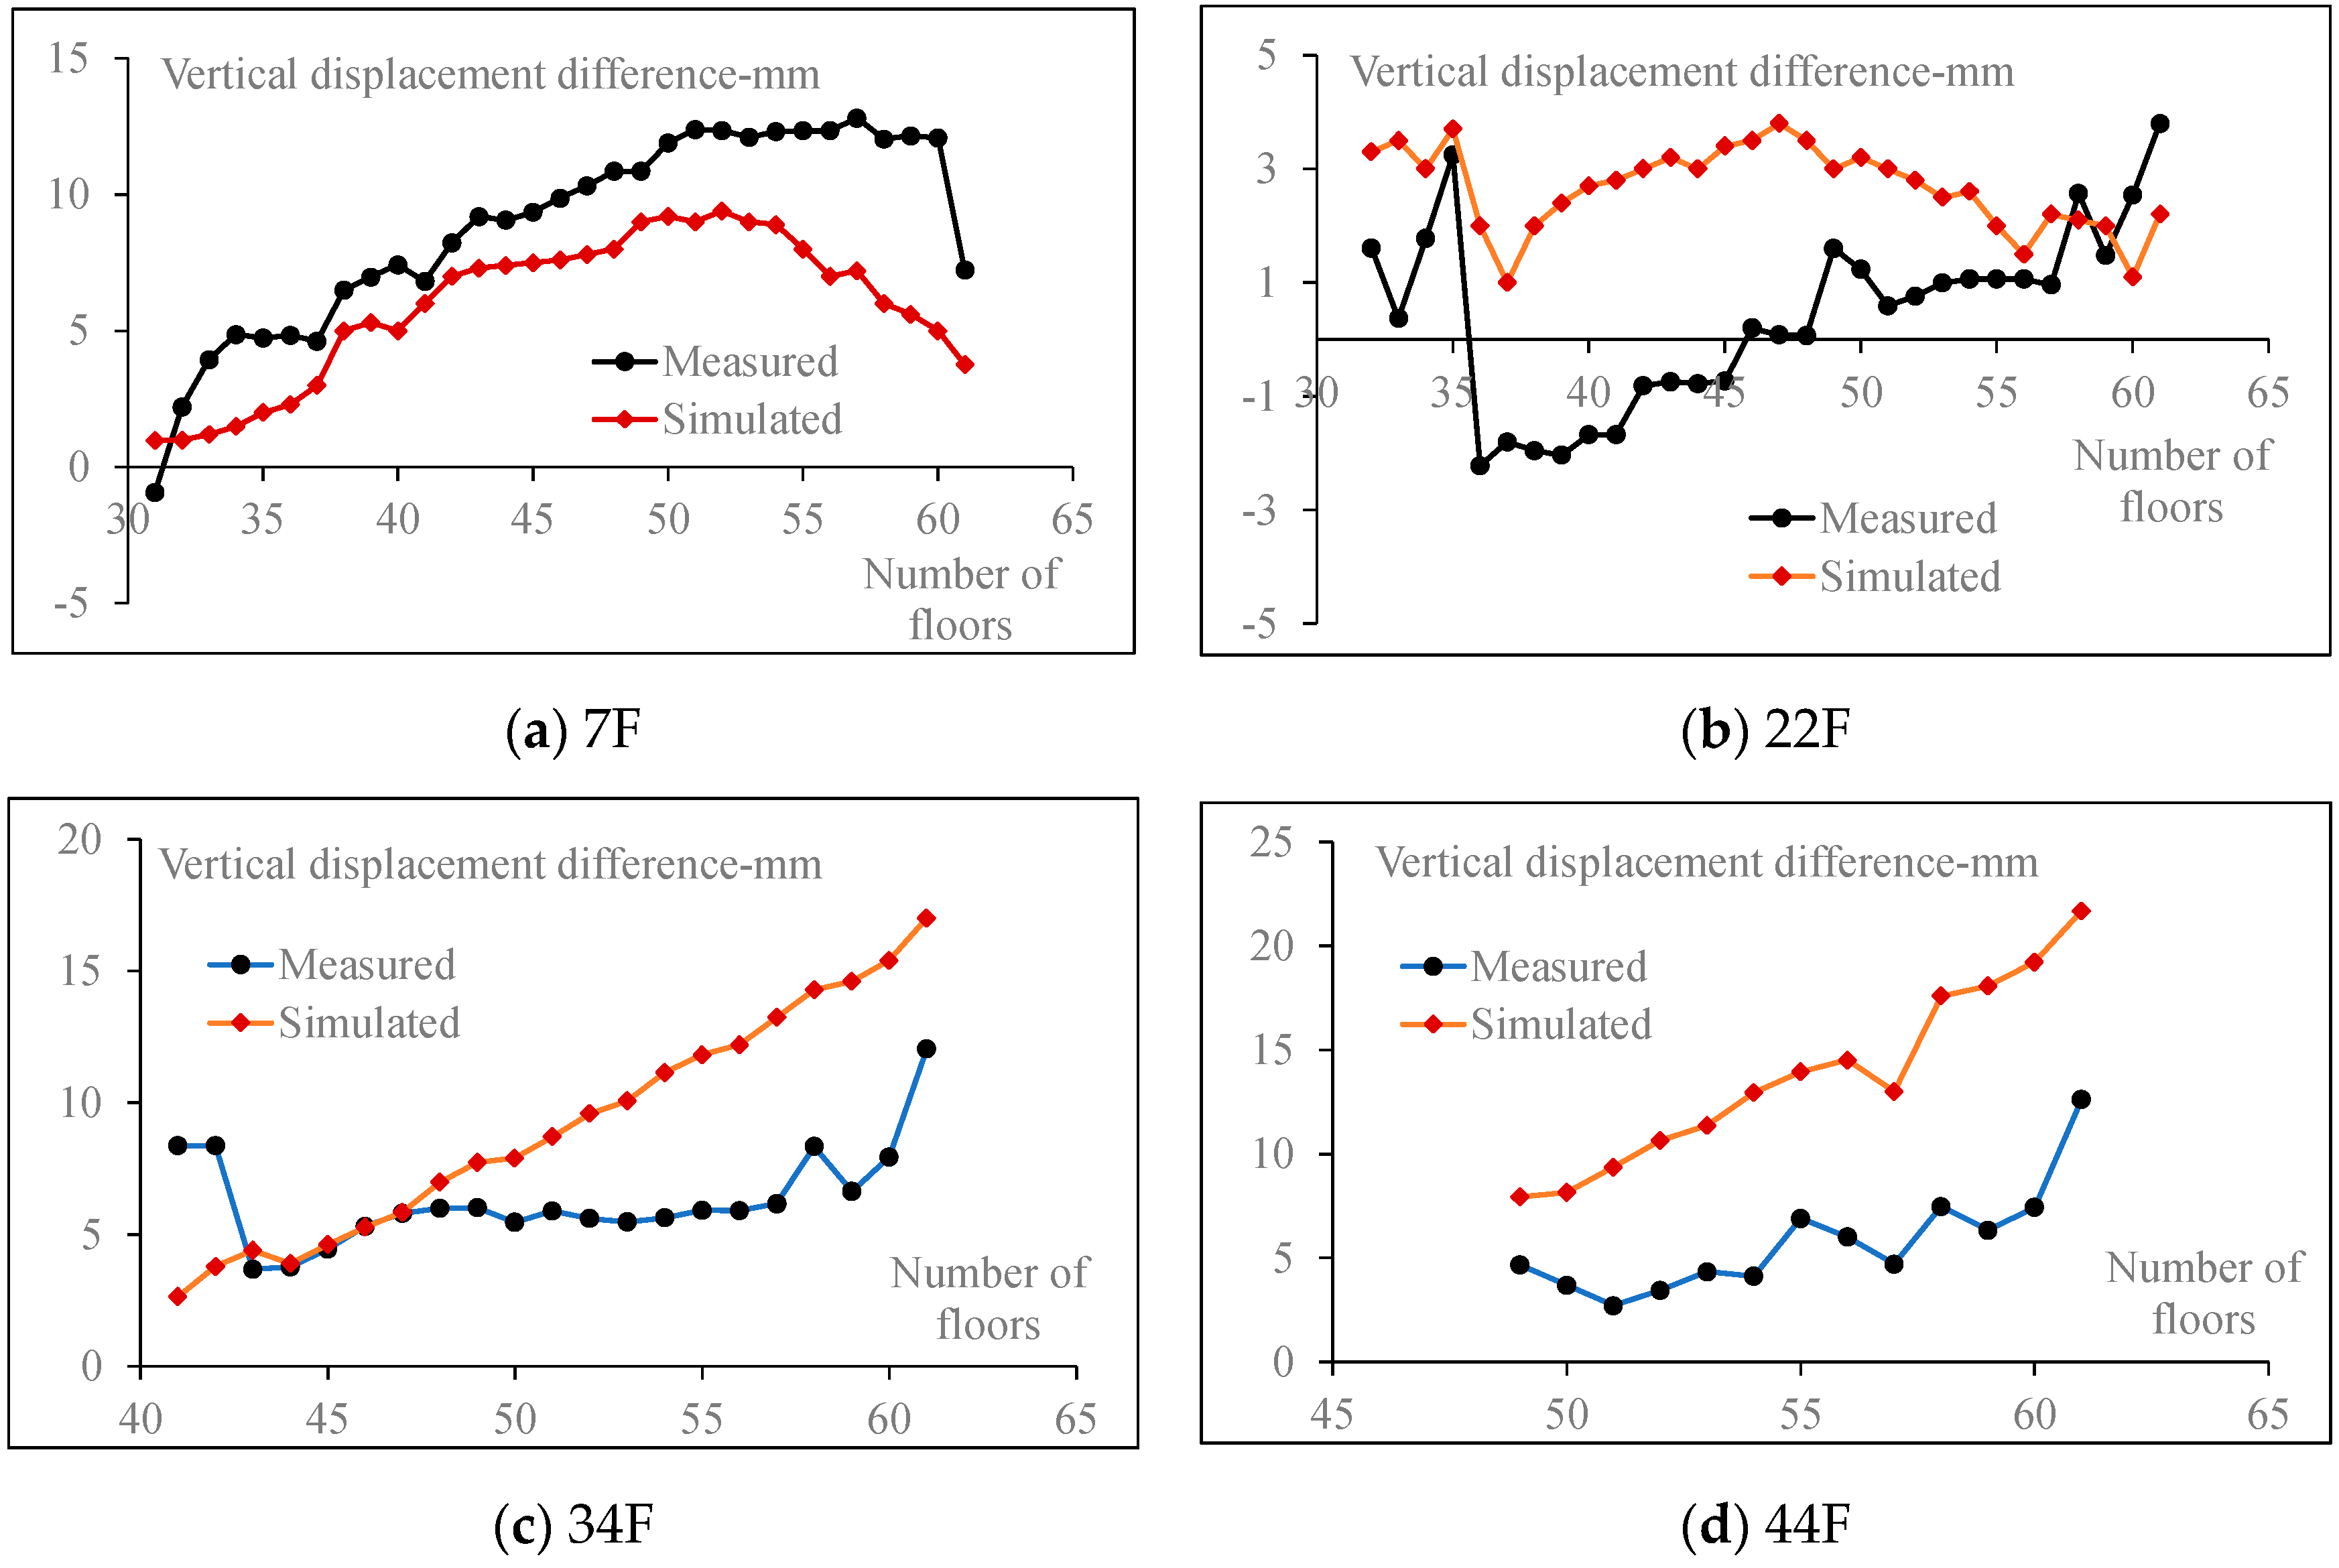
7.2. Vertical Displacement Difference
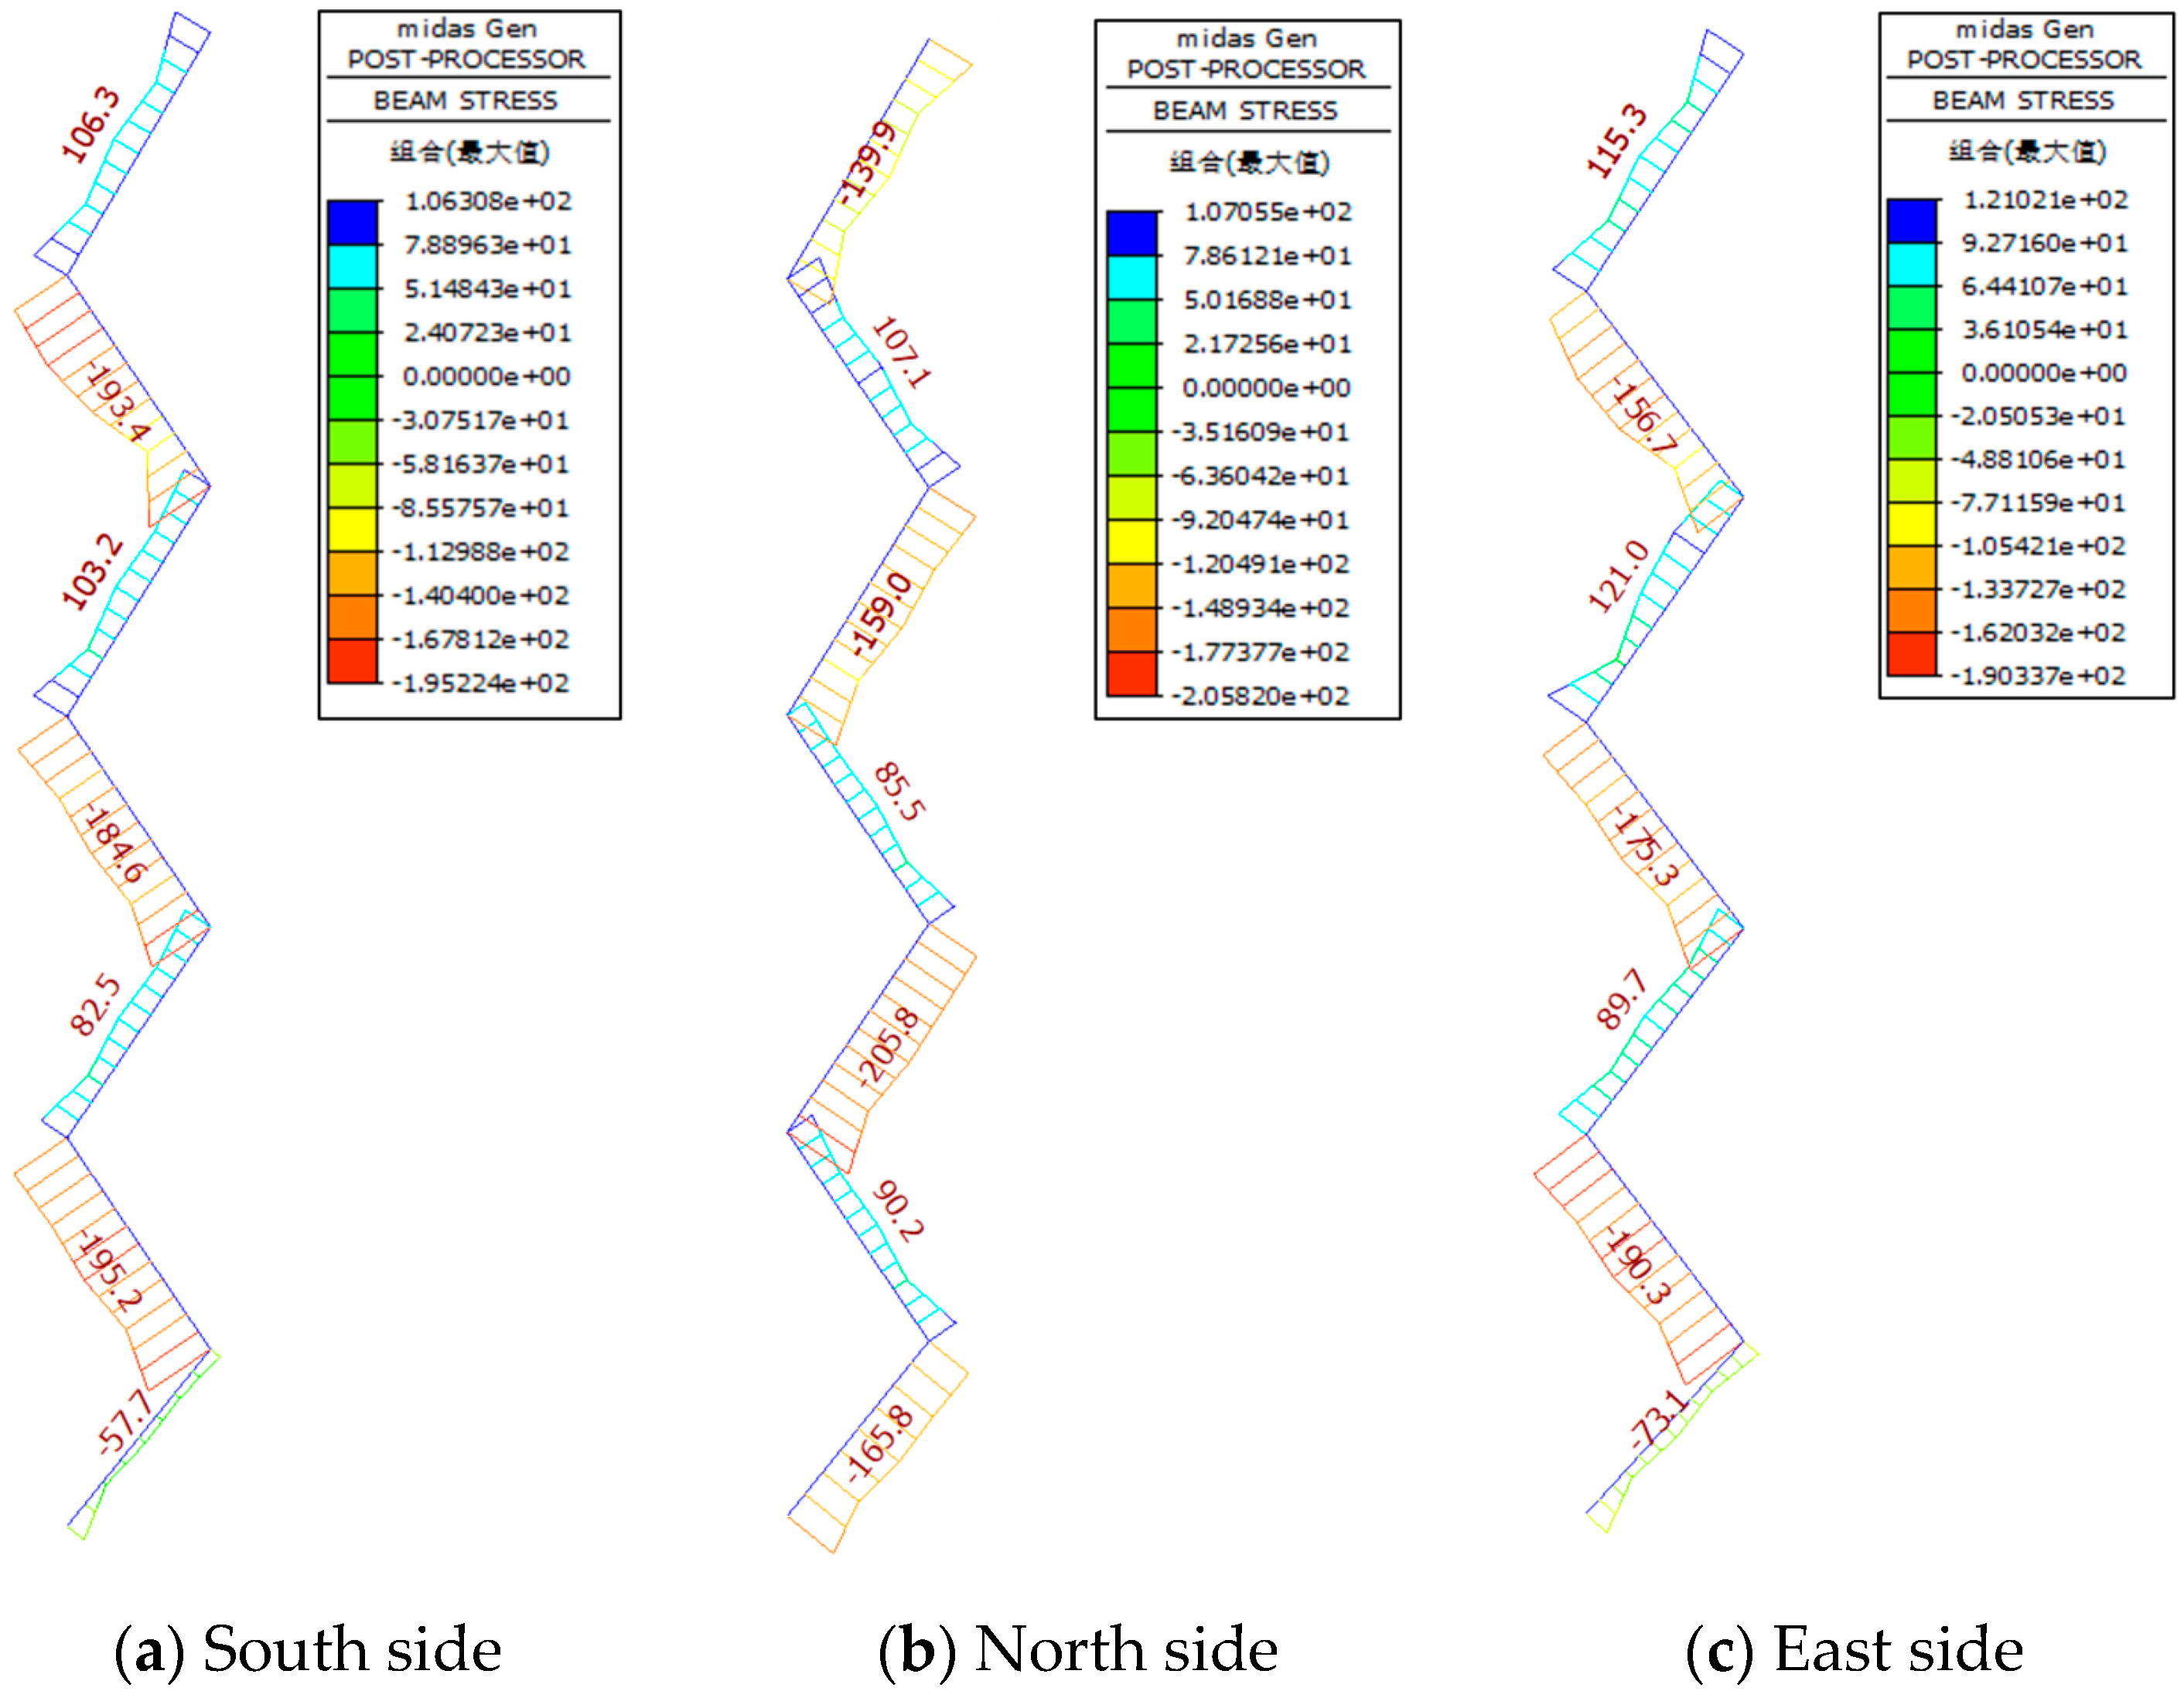
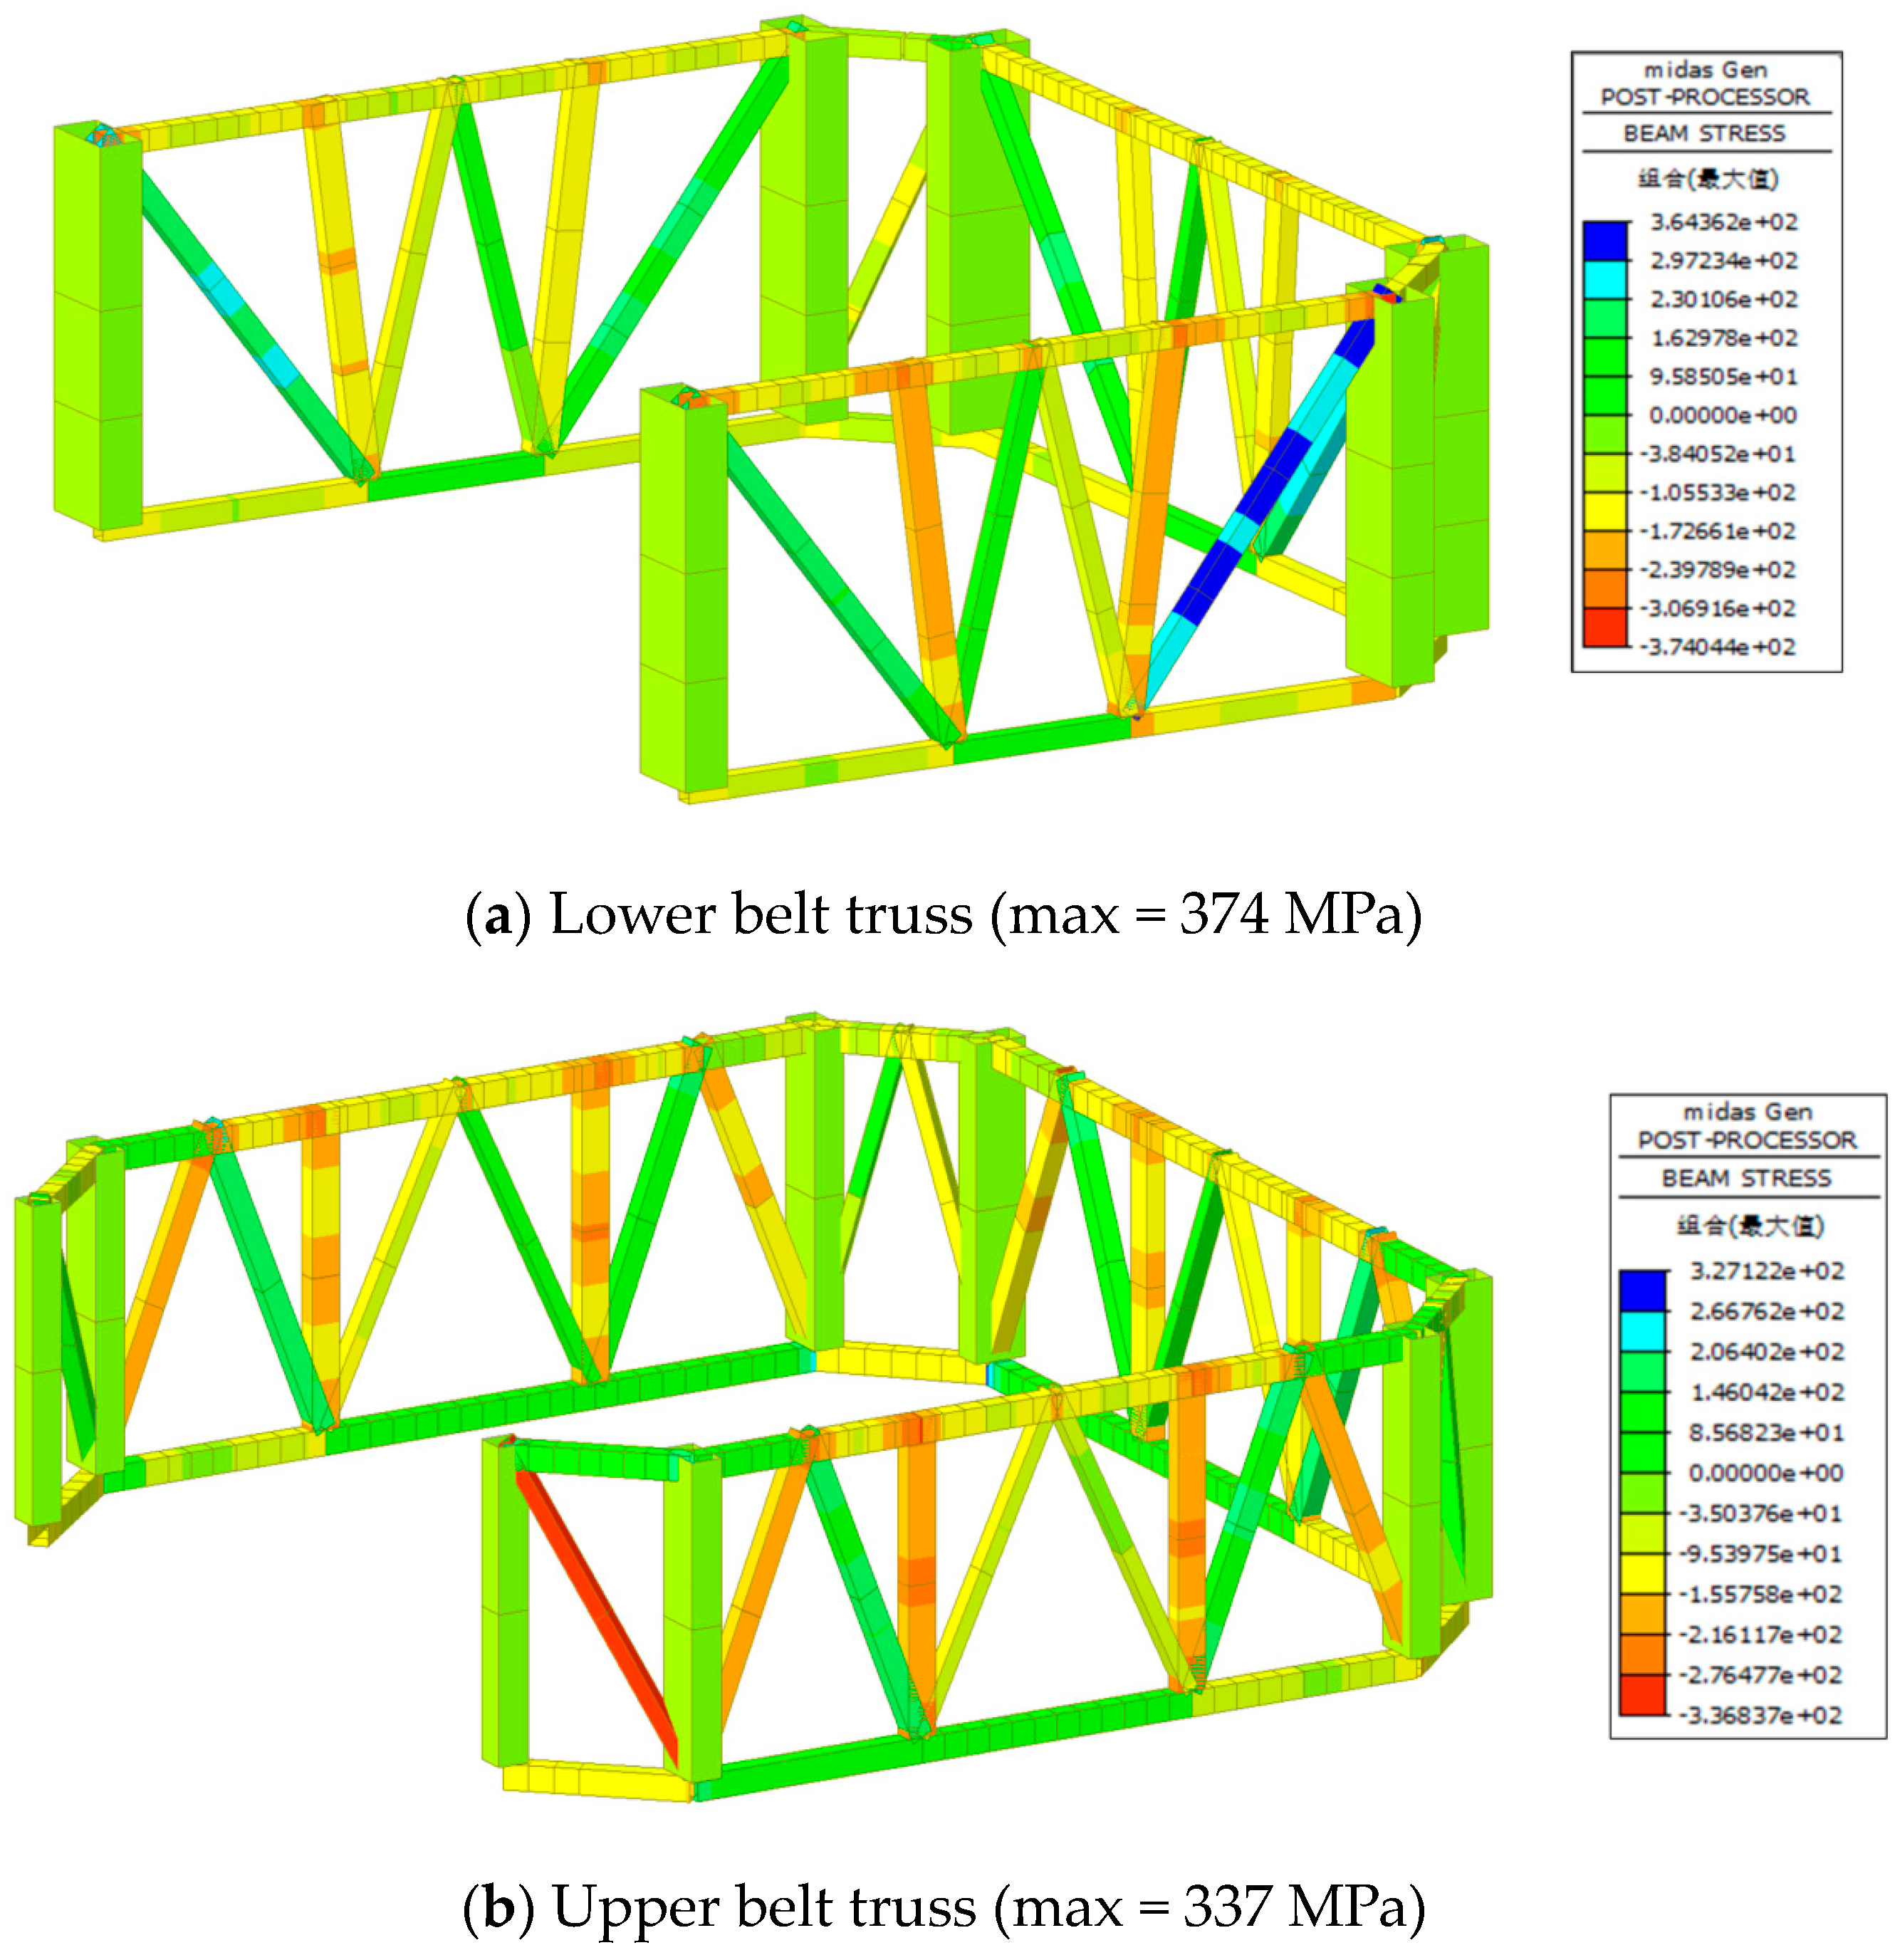
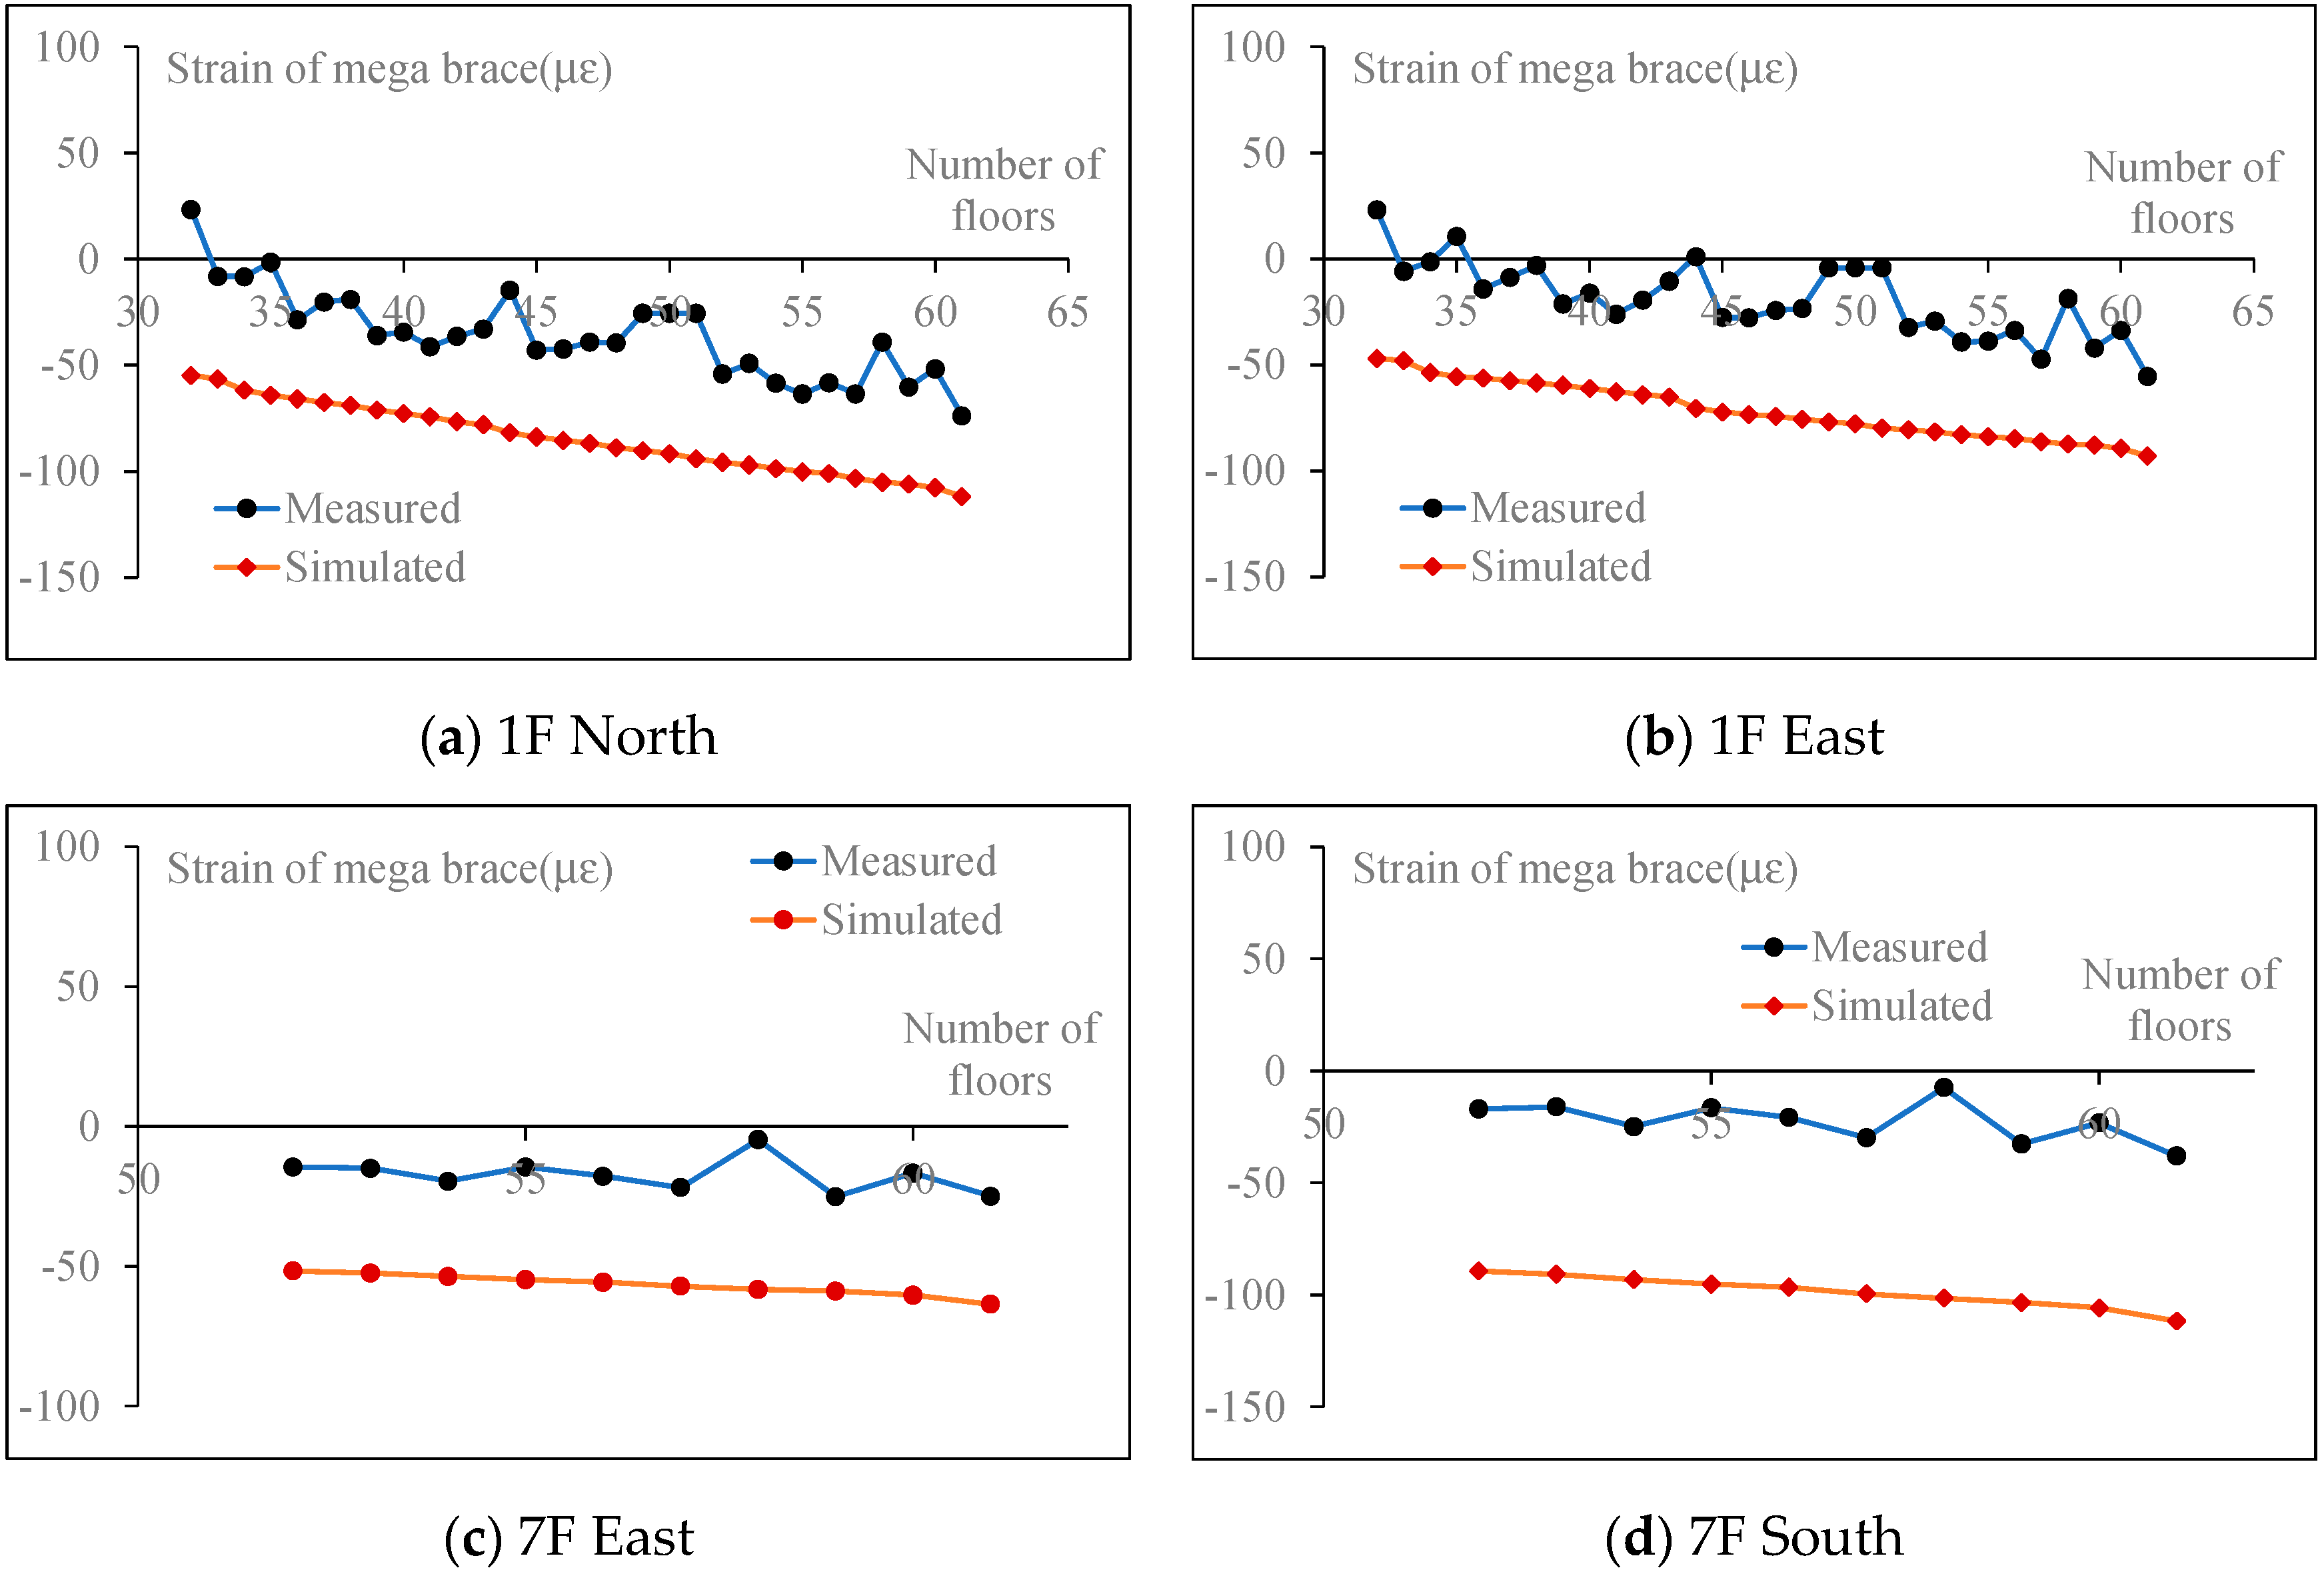
7.3. Stress of Key Components
8. Deformation Monitoring and Comparison with Simulation during Construction
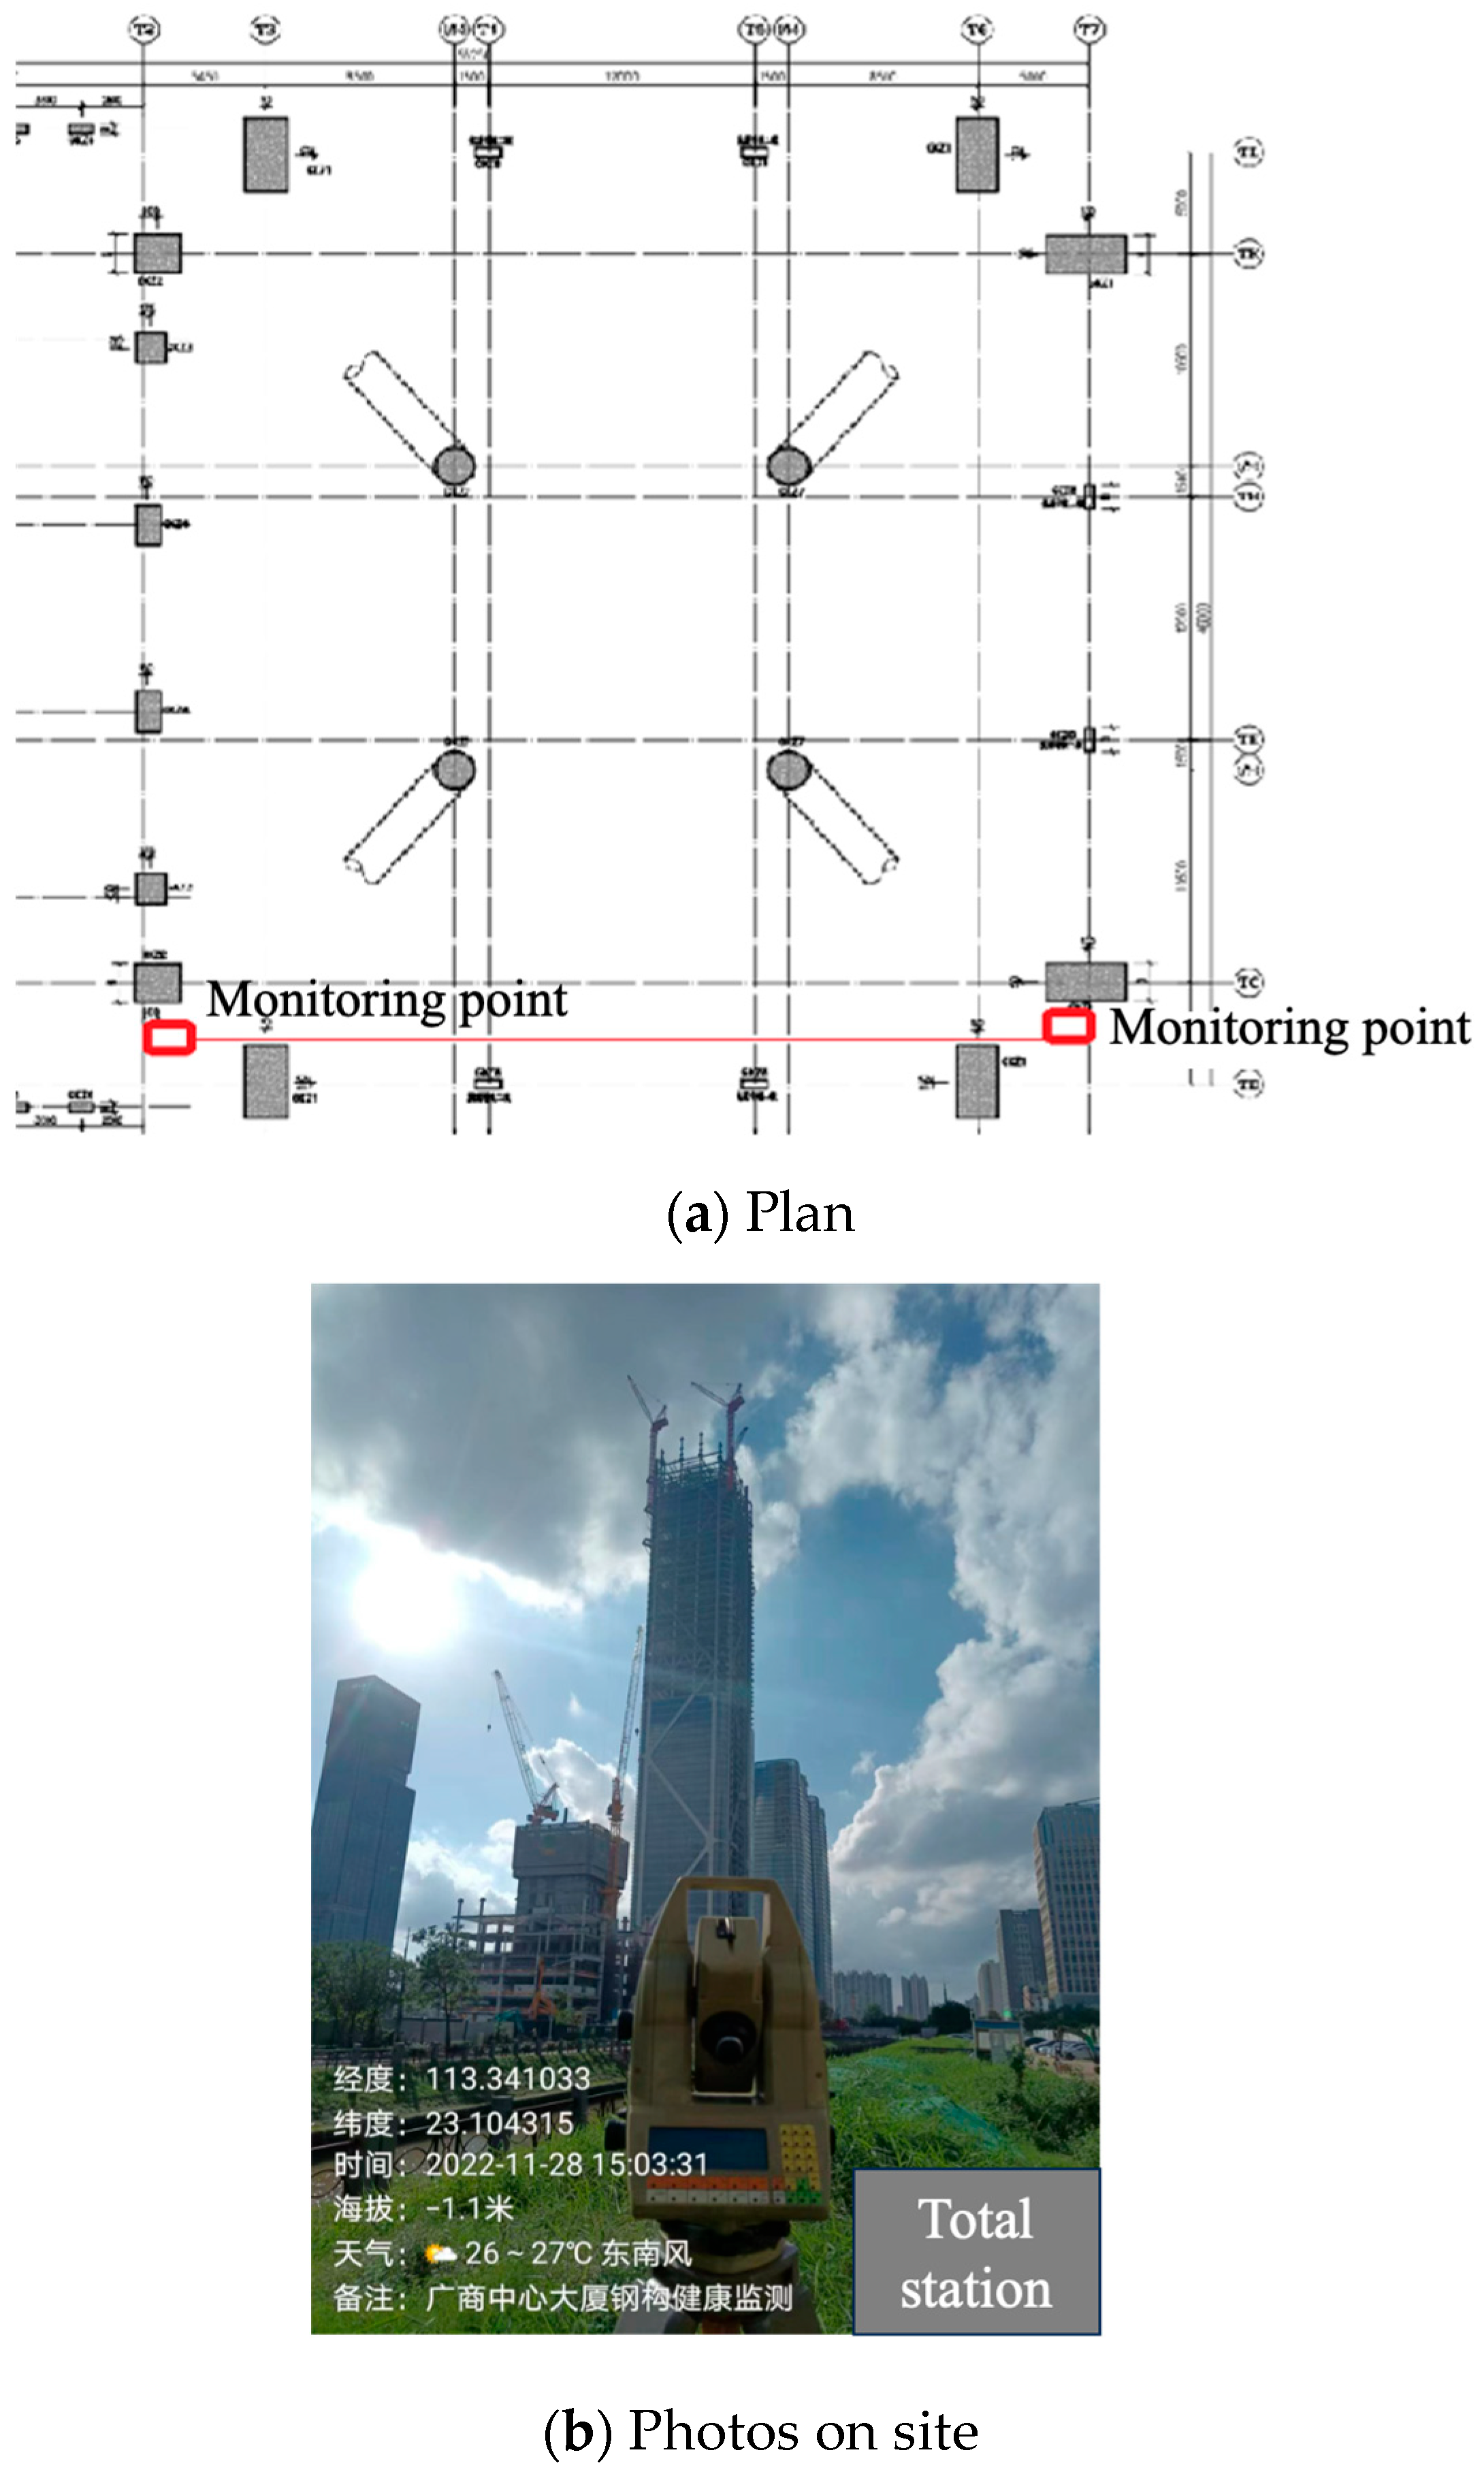
8.1. Monitoring Plan
- (1)
- Lateral displacement monitoring
- (2)
- Vertical displacement monitoring
- (3)
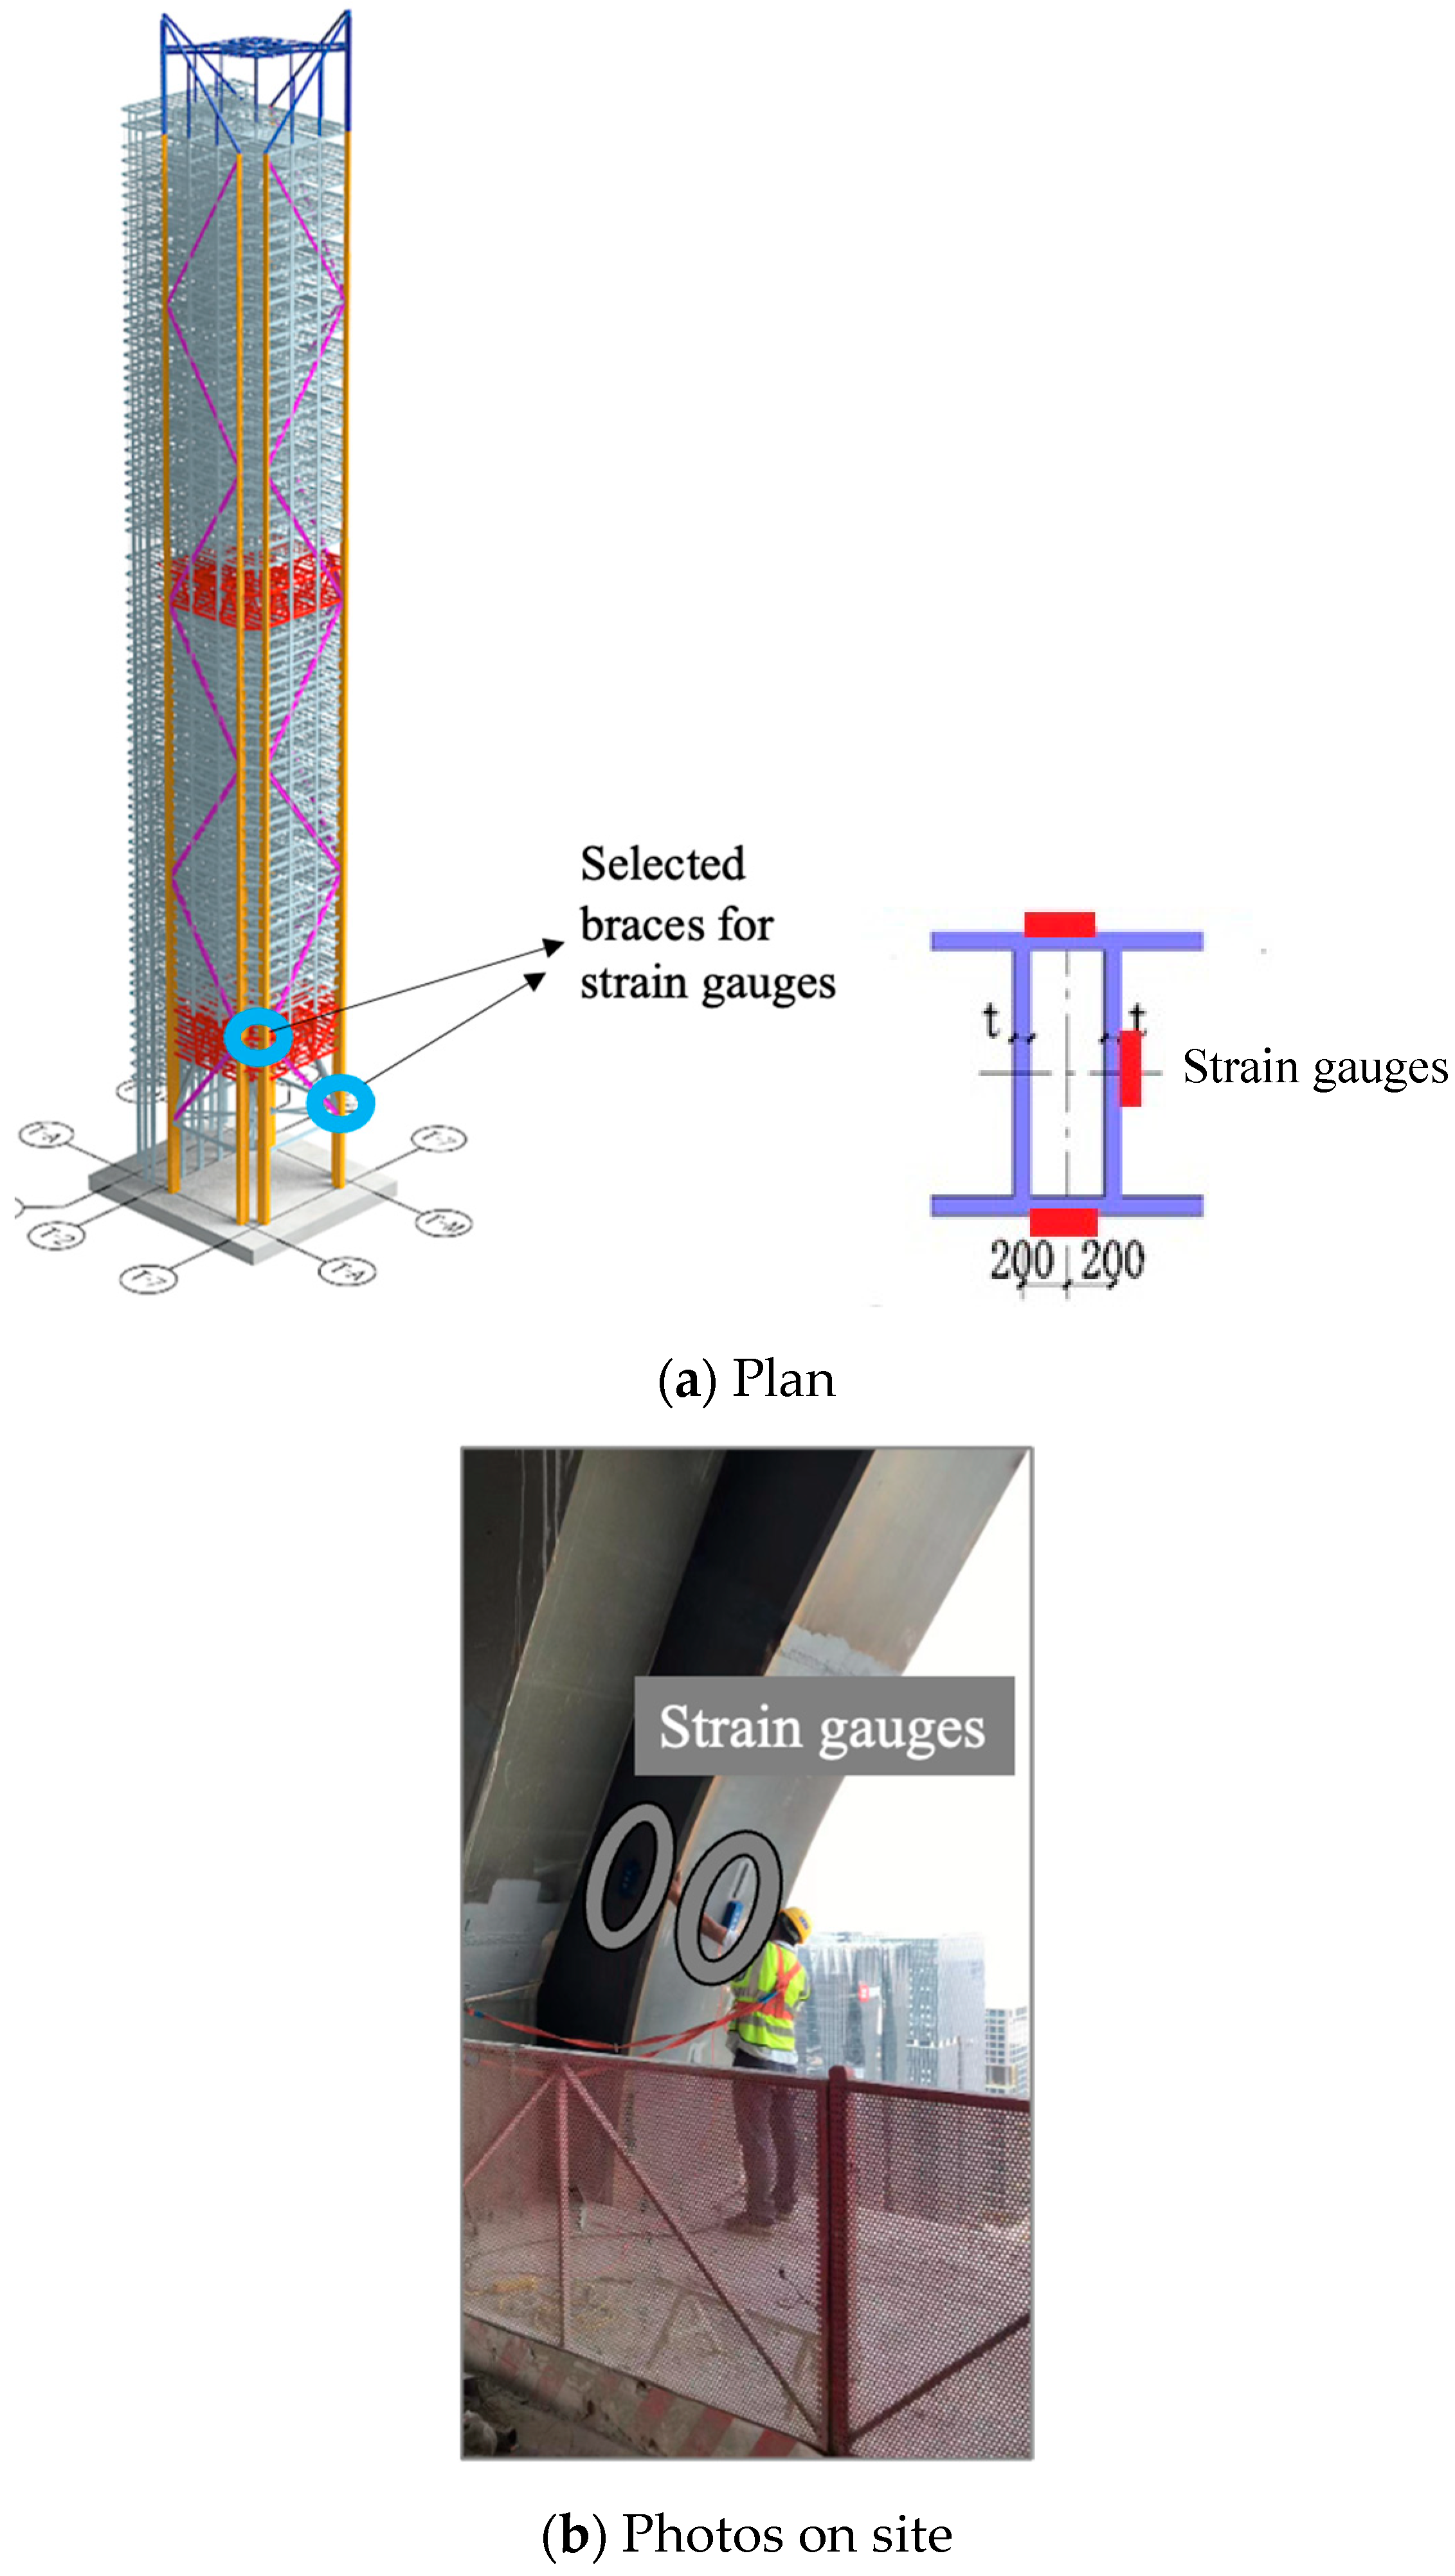
- Strain monitoring of key components
8.2. Monitoring Results of Lateral Displacement
8.3. Monitoring Results of Vertical Displacement
8.4. Monitoring Results of Key Components Strain
9. Conclusions
- The construction speed had a minimal impact on the horizontal and vertical deformation of super high-rise steel structures as well as the stress of key components. Therefore, the construction speed should be determined comprehensively by considering the factors such as project schedule, manpower, material resources, natural conditions, and costs.
- When the belt trusses were closed synchronously, the lateral displacement and vertical differences were relatively smaller, compared to the cases of one section and two sections lagging behind. And the maximum stresses of belt trusses were also the lowest. On the other hand, the closure timing had almost no impact on the stress of mega braces. Therefore, it was recommended that belt trusses would better be closed synchronously.
- The closure timing of mega braces had a minimal impact on the vertical displacement difference and the maximum stress of belt trusses. However, the later the braces were closed, the smaller the stress of mega braces, as well as the smaller story drift in the asymmetric axis direction. Therefore, it was recommended that mega braces could be closed with two sections lagging behind.
- The comparison between monitoring and simulation results indicated that the simulation could accurately predict the trends of lateral and vertical deformation during construction. The proposed deformation control measures could effectively manage the structural deformation during the construction period.
Author Contributions
Funding
Data Availability Statement
Conflicts of Interest
References
- Jia, H.; Song, Y.; Chen, X.; Liu, S.; Zhang, B. Seismic performance evaluation of a high-rise building with structural irregularities. Buildings 2022, 12, 1484. [Google Scholar] [CrossRef]
- Wang, M.; Nagarajaiah, S.; Sun, F.-F. Dynamic characteristics and responses of damped outrigger tall buildings using negative stiffness. J. Struct. Eng. 2020, 146, 04020273. [Google Scholar] [CrossRef]
- Wang, M.; Sun, F.; Koetaka, Y.; Chen, L.; Nagarajaiah, S.; Du, X. Frequency independent damped outrigger systems for multi-mode seismic control of super tall buildings with frequency independent negative stiffness enhancement. Earthq. Eng. Struct. Dyn. 2023, 52, 2731–2754. [Google Scholar] [CrossRef]
- Cao, X.Y.; Shi, J.; Xu, J.G.; Ji, E.; She, Y.; Wang, Z. The combined influence of bond–slip and joint-shear in the seismic upgrading via externally–attached BFRP-bar reinforced precast sub-frames. J. Build. Eng. 2023, 80, 107984. [Google Scholar] [CrossRef]
- Wang, M.; Nagarajaiah, S.; Sun, F. A novel crosswind mitigation strategy for tall buildings using negative stiffness damped outrigger systems. Struct. Control Health Monit. 2022, 29, e2988. [Google Scholar] [CrossRef]
- Wang, H.T.; Tang, C.; Chen, M.S.; Shi, J.; Cao, X.Y. Experimental study on the flexural performance of prestressed RC beams with post-tensioned CFRP strands. Eng. Struct. 2024, 309, 118118. [Google Scholar] [CrossRef]
- Cao, X.Y.; Wu, G.; Feng, D.C.; Wang, Z.; Cui, H.R. Research on seismic retrofitting performance of RC frames using SC-PBSPC BRBF sub-structures. Earthq. Eng. Struct. Dyn. 2020, 49, 794–816. [Google Scholar] [CrossRef]
- Sun, W.; Chen, W.; Long, Y. Monitoring and analysis of settlement and deformation status of high-rise buildings based on nonlinear regression. Meas. Sens. 2024, 35, 101287. [Google Scholar] [CrossRef]
- Zhou, K.; Duan, M.-G.; Wu, Z.-L.; Zhi, L.-H.; Hu, F. Dynamic behavior monitoring of twin supertall buildings during Super Typhoon Soksuri using social sensing data. J. Build. Eng. 2024, 95, 110119. [Google Scholar] [CrossRef]
- Huang, Y.; Feng, R.; Zhong, C.; Tong, X.; Shao, X.; Gu, L.; Hui, Z. Computer vision-based real-time deflection monitoring of complex and sizeable steel structures. Eng. Struct. 2024, 305, 117752. [Google Scholar] [CrossRef]
- Zhou, Y.; Luo, X.; Zhang, W.; Ye, P.; Chen, J.; Du, Z. Improvement of axial deformation prediction in high-rise buildings with field monitoring and adaptive unscented Kalman filter. J. Build. Eng. 2024, 83, 108432. [Google Scholar] [CrossRef]
- Zhang, H.; Shan, J.; Lu, X. Field testing and performance evaluation of AMD-controlled high-rise building structures with real-world validation. J. Build. Eng. 2023, 80, 108109. [Google Scholar] [CrossRef]
- Brownjohn, J.M.W. Structural health monitoring of civil infrastructure. Philos. Trans. R. Soc. A Math. Phys. Eng. Sci. 2007, 365, 589–622. [Google Scholar] [CrossRef]
- Brownjohn, J.M.W.; Pan, T.C.; Deng, X.Y. Correlating dynamic characteristics from field measurements and numerical analysis of a high-rise building. Earthq. Eng. Struct. Dyn. 2000, 29, 523–543. [Google Scholar] [CrossRef]
- Gao, F.; Zhou, H.; Liang, H.; Weng, S.; Zhu, H. Structural deformation monitoring and numerical simulation of a supertall building during construction stage. Eng. Struct. 2020, 209, 110033. [Google Scholar] [CrossRef]
- Vijayan, V.; Santhi, M.H.; Mohan, R. Seismic performance of high rise buildings with different types of shear wall. IOP Conf. Ser. Mater. Sci. Eng. 2020, 936, 012055. [Google Scholar] [CrossRef]
- Wang, M.; Liu, C.; Zhao, M.; Sun, F.-F.; Nagarajaiah, S.; Du, X.-L. Damping dissipation analysis of damped outrigger tall buildings with inerter and negative stiffness considering soil-structure-interaction. J. Build. Eng. 2024, 88, 109225. [Google Scholar] [CrossRef]
- Xiong, H.; Chen, J.; Ventura, C. Seismic fragility analysis of a high-rise concrete-wood hybrid structural system. In Proceedings of the 17th World Conference on Earthquake Engineering, Sendai, Japan, 13–18 September 2020. [Google Scholar]
- Zhu, H.; Gao, K.; Xia, Y.; Gao, F.; Weng, S.; Sun, Y.; Hu, Q. Multi-rate data fusion for dynamic displacement measurement of beam-like supertall structures using acceleration and strain sensors. Struct. Health Monit. 2019, 19, 520–536. [Google Scholar] [CrossRef]
- Liang, Z.S.; Han, L.H. Trussed concrete-filled steel tubular hybrid structures subjected to axial compression: Performance and design calculation. Eng. Struct. 2024, 302, 117465. [Google Scholar] [CrossRef]
- Azandariani, M.G.; Gholami, M. Seismic fragility investigation of hybrid structures BRBF with eccentric-configuration and self-centering frame. J. Constr. Steel Res. 2022, 196, 107300. [Google Scholar] [CrossRef]
- Cao, X.-Y.; Feng, D.-C.; Wang, C.-L.; Shen, D.; Wu, G. A stochastic CSM-based displacement-oriented design strategy for the novel precast SRC-UHPC composite braced-frame in the externally attached seismic retrofitting. Compos. Struct. 2023, 321, 117308. [Google Scholar] [CrossRef]
- Jia, M.; Lu, D.; Guo, L.; Sun, L. Experimental research and cyclic behavior of buckling-restrained braced composite frame. J. Constr. Steel Res. 2014, 95, 90–105. [Google Scholar] [CrossRef]
- Yan, J.-B.; Fan, J.; Ding, R.; Nie, X. Steel-concrete-steel sandwich composite structures: A review. Eng. Struct. 2024, 302, 117449. [Google Scholar] [CrossRef]


| Group 1 | 1F–7F + mega brace (section #1) + belt truss | Group 29 | 36F |
| Group 2 | 8F | Group 30 | 37F |
| Group 3 | 9F | Group 31 | 38F |
| Group 4 | 10F | Group 32 | 39F |
| Group 5 | 11F | Group 33 | 40F |
| Group 6 | 12F | Group 34 | 41F |
| Group 7 | 13F | Group 35 | 42F + mega brace (section #5) |
| Group 8 | 14F + 13M | Group 36 | 43F + 42M |
| Group 9 | 15F | Group 37 | 44F |
| Group 10 | 16F+mega brace (section #2) | Group 38 | 45F |
| Group 11 | 17F | Group 39 | 46F |
| Group 12 | 18F | Group 40 | 47F |
| Group 13 | 19F | Group 41 | 48F |
| Group 14 | 20F + 19M | Group 42 | 49F+48M |
| Group 15 | 21F | Group 43 | 50F |
| Group 16 | 22F | Group 44 | 51F + mega brace (section #6) |
| Group 17 | 23F | Group 45 | 52F |
| Group 18 | 24F | Group 46 | 53F |
| Group 19 | 25F + mega brace (#3) | Group 47 | 54F |
| Group 20 | 26F + 25M | Group 48 | 55F + 54M |
| Group 21 | 27F | Group 49 | 56F |
| Group 22 | 28F | Group 50 | 57F |
| Group 23 | 29F | Group 51 | 58F |
| Group 24 | 30F | Group 52 | 59F |
| Group 25 | 31F | Group 53 | 60F |
| Group 26 | 32F + 31M | Group 54 | 60M + mega brace (section #7) |
| Group 27 | 33F | Group 55 | Roof top |
| Group 28 | 34F–35F + mega brace (section #4) + belt truss |
| Model ID | Construction Speed | Duration |
|---|---|---|
| SGDU-1 | 3 days/floor | 180 days |
| SGDU-2 | 6 days/floor | 360 days |
| SGDU-3 | 9 days/floor | 540 days |
| SGDU-4 | 12 days/floor | 720 days |
| Construction speed (d/floor) | 3 | 6 | 9 | 12 |
| Max stress (MPa) | 382 | 378 | 376 | 375 |
| Closure Timing | Synchronous | 1 Section Lagging Behind | 2 Sections Lagging Behind |
|---|---|---|---|
| Max stress (MPa) | 382 | 569 | 636 |
| Closure Timing | Synchronous | 1 Section Lagging Behind | 2 Sections Lagging Behind |
|---|---|---|---|
| Max stress (MPa) | 382 | 376 | 372 |
Disclaimer/Publisher’s Note: The statements, opinions and data contained in all publications are solely those of the individual author(s) and contributor(s) and not of MDPI and/or the editor(s). MDPI and/or the editor(s) disclaim responsibility for any injury to people or property resulting from any ideas, methods, instructions or products referred to in the content. |
© 2024 by the authors. Licensee MDPI, Basel, Switzerland. This article is an open access article distributed under the terms and conditions of the Creative Commons Attribution (CC BY) license (https://creativecommons.org/licenses/by/4.0/).
Share and Cite
Wang, H.-P.; Xiao, Y.-Q. Research on the Deformation Control Measures during the Construction Period of Super High-Rise Buildings with an Asymmetric Plan. Buildings 2024, 14, 2904. https://doi.org/10.3390/buildings14092904
Wang H-P, Xiao Y-Q. Research on the Deformation Control Measures during the Construction Period of Super High-Rise Buildings with an Asymmetric Plan. Buildings. 2024; 14(9):2904. https://doi.org/10.3390/buildings14092904
Chicago/Turabian StyleWang, Hua-Ping, and Yi-Qing Xiao. 2024. "Research on the Deformation Control Measures during the Construction Period of Super High-Rise Buildings with an Asymmetric Plan" Buildings 14, no. 9: 2904. https://doi.org/10.3390/buildings14092904
APA StyleWang, H.-P., & Xiao, Y.-Q. (2024). Research on the Deformation Control Measures during the Construction Period of Super High-Rise Buildings with an Asymmetric Plan. Buildings, 14(9), 2904. https://doi.org/10.3390/buildings14092904