Article

A Comparative Study of Energy Performance Certificates across Europe

by
David P. Jenkins
1,*,
Mahsa Sayfikar
1,
Antonio Gomez
2 and
Norberto Fueyo
2
1
School of Energy, Geoscience, Infrastructure, and Society, Heriot-Watt University, Edinburgh EH14 4AS, UK
2
Fluid Mechanics Group, University of Zaragoza, 50018 Zaragoza, Spain
*
Author to whom correspondence should be addressed.
Buildings 2024, 14(9), 2906; https://doi.org/10.3390/buildings14092906 (registering DOI)
Submission received: 5 August 2024 / Revised: 10 September 2024 / Accepted: 12 September 2024 / Published: 14 September 2024

Abstract

:
Using a sample of buildings across chosen European countries, this study compares different EPC frameworks in terms of their published methodologies and generated outputs. The work demonstrates that, despite all emanating from a common central point of the Energy Performance of Buildings Directive, EPC frameworks across Europe exhibit clear differences in their methodologies, use of inputs/outputs, assessment processes, and assessor protocols. A process is proposed for comparing EPCs of a building when utilising EPC frameworks from different countries, whilst noting that direct comparisons of fundamentally different processes can be challenging and itself requires a designed methodology. When applying this process, EPC ratings can appear similar (when comparing EPCs designed for similar climate zones) in many buildings, but this can underestimate the differences in generating those EPC ratings in the first place. As further innovations are designed for EPCs at the EU level, this study demonstrates why incorporating a bottom-up understanding of country-specific EPCs will be necessary for successful implementation.

1. Introduction

The use of Energy Performance Certificates (EPCs) in assessing the energy efficiency of buildings across Europe has been established for some time. With the introduction of the Energy Performance of Buildings Directive (EPBD) in 2003 and subsequent recasts and updates [1], strategies for decarbonising the European building stock are now very much linked to the energy ratings and guidance emanating from EPC assessments.
However, the common genesis of these EPCs (and, in some cases, aesthetic of the certificate documents) can give an illusion of harmonisation across the energy rating systems in Europe. When the approaches of different countries are dissected—to account for calculation engine, inputs gathered for assessment, assessment protocols, training/background of assessors, metrics/outputs used—then it is clear that there is a notable divergence of EPCs across Europe. At one level, this is not necessarily a problem; individual countries have their own building stock and energy policy, and it is natural (as discussed in the paper) for energy assessment schemes to be developed with that in mind. Where this becomes a potential problem is when changes are made to the EPBD with a view to updating all EPC approaches across Europe. Rather than updating a single, universal method of building energy compliance, this will require alterations to many individual, and different, approaches; and it is unlikely that such changes will translate in the same way across these different frameworks.
In a positive sense, the range of different approaches to energy assessment seen across different countries provides a series of case studies, data, and experiences for how to run EPC-type schemes, even within the boundaries of a common starting point (of the EPBD). As well as comparing technical assumptions (around inputs and modelling), these different approaches can help us understand what EPCs are for (and what they are not), whether the differences have any consequence on results generated, and whether there is a route (or a need) for a more harmonised, best-practice approach to energy assessment in Europe.
It is worth noting that many other countries outside of Europe adopt similar schemes for assessing energy performance of buildings and there is scope for widening a comparative study to share good practice. However, this study (helped by the EPBD as a common factor) focuses on European countries and the implementation of EPCs. This makes the comparison more appropriate but, also, makes the differences (despite being within a constrained, centralised European policy) more revealing. The paper achieves this comparison through (i) overviewing EPC methodologies across chosen countries (linked to partners of the crossCert project [2]), (ii) comparing results of applying these methodologies for a selected sample of buildings, and (iii) providing an approach for applying “foreign” EPC methodologies to “local” buildings.

2. Methodologies across Europe

The EPC frameworks described here are centred around the ten countries involved with the crossCert project—but this provides a good sample of the different methods in use across Europe that comply with the EPBD. The detail of, for example, calculation methods can be found from the referenced documents but this paper will overview key aspects of the approaches that help summarise the difficulties in achieving harmonisation of EPCs across Europe. These partner countries are Austria [3], Bulgaria [4], Croatia [5], Denmark [6], Greece [7], Malta [8], Poland [9], Slovenia [10], Spain [11], and the UK [12]. Further comparison work is noted elsewhere [13]. The findings discussed below are informed by these references and other highlighted sources.
When comparing these approaches for this study, the overall EPC framework is considered to include:
  • Inputs gathered during assessment;
  • The protocols of the assessment itself (influencing the role and requirements of the assessor);
  • A calculation engine used for generating energy/carbon metrics;
  • The specific output metrics generated.
The following review is based on available information at the time of writing (influenced by the aforementioned references and discussions with project partners from their respective countries)—though many of these approaches are regularly updated and altered. Specifically, the review is focusing on areas of difference; but, as the EPC methodologies have the common starting point of the EPBD, there will clearly be a large amount of similarity to the purpose and function of EPCs across all European countries.

2.1. Software and Calculations

The EPBD gives some flexibility for the calculation required for an EPC. Options include steady-state modelling (generally the favoured choice in most EPCs across Europe), dynamic thermal simulation, or measured energy consumption data—and, for some countries, the EPC assessor can choose from these options. In some countries, the regulations set clear guidance for this choice; for example, in the UK, the EPC methodology for residential and most categories of non-residential buildings uses steady-state modelling, whereas dynamic simulation is only used for non-residential buildings with complex features. The accredited calculations can be accessed through various platforms provided by different commercial providers, but the overall process is generally standardised.
In Spain, the calculation methodology has been implemented in seven official software options with a range of calculation engines, including DOE2 [14], TAS [15], TRNSYS [16], and EnergyPlus [17]. All of these tools can be used for any building type, including new or existing residential and non-residential buildings. The same applies to Bulgaria and Austria, where several types of software are available for accessing EPC calculations.
The availability of official software is another variable across different countries. For example, in Poland and Slovenia, rather than a state-approved piece of software, there are calculation protocols that are linked to certain ISO standards. This could lead to differences in assessments depending on the software selected by the assessor. However, it is not a given that those countries with more standardised software will always produce more consistent results, as seen in a study comparing multiple energy assessments of the same buildings in the UK, where standardisation of process and calculation is quite high [18].
With steady-state modelling being very common across building sectors, a simplified version of a methodology can be applied to certain building types. Examples of this include the use of RdSAP [8] for existing residential buildings in the UK and a simplified methodology in Spain which uses inference for some input values instead of recorded values. This allows for more straightforward calculations to be carried out for some, usually older, buildings where data relating to the building envelope is less accessible, and so look-up tables of input assumptions (e.g., U-values by property age) can be used.
The use of real energy consumption data is relatively uncommon for generating formal EPC ratings, though an Operational Energy Rating (based on real energy data) is currently being tested for inclusion with EPCs [19]. This deviates from the concept of EPCs being used to describe an “asset” rating (referring to the building and technologies within) rather than reflecting real operation and behaviour. However, some countries do provide a route for the use of real energy data, depending on the availability of such data; in Denmark, Poland, and Slovenia (with non-residential buildings for the latter), monitored energy data can be used to form an energy rating. In Bulgaria, although the EPC rating is based on a set calculation of building physics, the assessor can use measured energy consumption to re-calibrate the final EPC outputs. In the UK, although not directly part of the EPC, a Display Energy Certificate [20] can be produced for some public, non-residential buildings. The DEC is based on measured energy consumption and should be displayed alongside the EPC rating.

2.2. Site Visits and Building Description

It may be imagined that a visit to the site of a building will be a standard requirement for all EPCs. Whilst this is, in practice, true for most assessments, there are examples of default or inferred values being used in EPCs that do not necessarily require in situ surveying. Austria does not mandate a site visit, and Denmark and Croatia allow for off-site assessment in buildings of a certain age, size, and fuel type. Poland recommends, rather than mandates, site visits. For the other countries studied, EPC assessors would be required to visit the property being assessed.
The EPBD does not enforce a particular level of detail on how the building being assessed should be described. An example of this would be the approach to zoning different parts of a building, so that different thermal conditions, activities, or building services can be assigned within the same property. Whilst the majority of the studied countries use single zone models for residential buildings, their approaches for non-residential buildings are more diverse. In the Austrian methodology, dividing a space into zones is only necessary if less than 80% of the building floor area is supplied by the same HVAC or lighting system, if there are parts of the building that should meet different regulations, or if there is a temperature difference higher than 4 °C between internal spaces [3]. Denmark and Greece also use the proportion of floor area served by different systems to set the criteria for zoning buildings. In Malta and the UK, where the same methodology is used for non-residential buildings [21], the assessor is required to divide the building into zones based on activity type, and use the default activity-related values provided for temperature setpoints. In addition, sub-zones can be specified for zones with large variations in certain parameters (e.g., different levels of daylight within a room). Similarly, Bulgaria, Spain, and Poland have more options to apply zoning, but in a way that suggests two assessors may zone the building in two slightly different ways.

2.3. Categories of Energy Consumption

Building energy consumption is usually associated with well-defined categories for heating, cooling, ventilation, domestic hot water, lighting, and appliances. Whilst heating, ventilation, and hot water are included as categories for all EPCs involved in this study, there are differences that make direct comparison of EPC outputs difficult. Lighting energy use is not considered in the EPC rating in Croatian, Polish, and Spanish residential EPCs—and in Denmark, only the lighting in the communal parts of multi-family homes is considered. Electrical appliances’ energy consumption is not considered in the EPC rating in most studied countries, with the exception of Bulgaria (all buildings) and Austria (non-residential). Of the ten countries studied, the UK and Austria were the only ones where cooling was not included within EPC ratings for residential buildings—though an informal calculation is documented in the appendices of the UK methodology [12].

2.4. Specifying Building Systems

With EPCs used to judge energy compliance, rather than detailed building design, most associated software does not require detailed descriptions of heating, ventilation, and air-conditioning (HVAC) systems. Efficiencies tend to be specified as averages over a period of time (e.g., annual or heating/cooling season), and transient operation of systems are either ignored or highly simplified (e.g., total hours of use per average day).
Even when using a similar level of detail for inputs such as system efficiency or coefficient of performance, the source of that information can be different. All the studied countries have a route that involves using manufacturer-provided information for performance parameters. The UK provides an independent database of standard [22], such that an assessor would not have to use manufacturer specifications. Poland allows using default values for efficiency parameters, which are defined based on system type, power, and age [9]. Bulgaria, where manufacturer estimates are not available, requires on-site measurements by the assessor (the only country in this selection noted to do so).
For HVAC systems’ operation schedules, default values are provided by the methodology in Austria, Greece, Malta, Slovenia, and the UK—linked to activity description. Denmark uses a different approach where the assessor is required to, manually, specify the fraction of time that a system is used based on information gathered from the building. Bulgaria requires the assessor to collect information on site and make an assumption (influenced by building activity) on operation schedules. Poland and Spain have a similar option for assessors, but with default assumptions available should that more tailored information not be forthcoming.

2.5. Internal Activity and Occupancy

Steady-state models, using inputs that are averaged over long periods of time (e.g., monthly or annually), by their very nature do not allow for detailed characterisation of building occupancy; and, as already stated, it is generally not the purpose of the asset-focussed EPC to do this (though for some approaches, such as the use of dynamic simulation with more complex UK non-residential buildings, HVAC scheduling can be specified at hourly resolution). If information is required that summarises activity or operation, it is more common to see total hours per average day of occupation being specified (with an option for distinguishing between weekday and weekend).
This provides some similarity across countries in terms of level of simplification of those inputs, but assessors are given slightly different guidance around how to source that information. In Bulgaria and Poland, assessors collect on-site information (for existing buildings) and then apply personal judgement to support assumptions around occupancy schedules—with an expectation that this may differ between two assessors. For most other countries, the assessor is required to use default hours of operation (which cannot be modified). Residential buildings are often assumed to have 24 h occupation, though the UK and Spain provide occupancy hours based on floor area of the building.
Schedules for lighting and electrical equipment (which will be used for calculating internal heat gains, even if not used towards the energy consumption estimate of the EPC report) are usually based on similar assumptions as mentioned above and use default values provided in methodologies. As with other input categories, Bulgaria is an exception to this, where default values are not available and the assessor collects information about the usage of lighting and appliances on site. In addition, electricity bills are used to calibrate power density values.

2.6. Air Exchanges and Temperature Setpoints

A common approach for specifying infiltration rates is to provide default values based on age (which can be further altered by recording the presence of openings, chimneys, and flues in a building). The correlations used for linking age and infiltration rates may be country-specific, but the overall approach is similar across most European countries. For ventilation rates, most methodologies allow this to be linked to generic activity categories. Deviating from this rule-of-thumb approach are Denmark, which provides default values for infiltration rates based on the level of weatherproofing for residential buildings instead of activity type, and some countries (e.g., Malta, Poland, Slovenia, and the UK) allowing empirical measurements using blower door tests (but default assumptions would still be allowed as an alternative to that).
As with some other inputs and choices of methodology, the additional freedom that the EPBD allows is implemented in the Bulgarian assessment. The assessor in Bulgaria can run a model using a 0.5 AC/h value for infiltration rate and a measured ventilation rate using a thermo-anemometer. However, where measurement is not possible, e.g., for new buildings, the assessor can use other values using their own judgement. As part of the assessment, the assessor calibrates this model against actual energy consumption data; and the infiltration rate is usually used as the calibration parameter (within an acceptable range) to match the modelled results to measured data.
Temperature setpoints for heating and cooling are country-specific (reflecting cultural approaches to thermal comfort) but there is a similarity in the form of these setpoints. Static values over relatively long periods of time (e.g., a year) that are not corrected for the season will generally be used in the (mostly) steady-state calculations for EPCs.
The default setpoints themselves can differ and can be adjusted for activity as well as building type in some countries—this is seen in Austria, Greece, Malta, Slovenia, Spain, and the UK. Denmark has a default temperature setpoint of 20 °C, but adjusted values are provided based on the type of temperature control. Bulgaria has no default values, but separate official guidelines are available for some office buildings. Assessors can also use their judgement for most other building types. Poland provides default setpoints based on level of clothing and the time spent in a space. This indicates a more tailored approach that depends on the actual operation of the building, rather than using general assumptions applied to all buildings.
Across all these noted input categories, Table 1 summarises the expected approach of the assessor in sourcing information for these inputs—ranging from the use of provided look-up tables to bespoke measurements on site.

3. Categorising and Comparing EPC Methodologies

The previous section detailed the fundamental differences across EPC methodologies in chosen European countries. When thinking of future innovations and changes to EPCs, it can be difficult to summarise how these alterations may work for specific countries, with Section 2 implying that it is unlikely all EPC methodologies will adapt to such changes in the same way. Categorising EPC methodologies (as opposed to considering an EPC as a harmonised, Europe-wide standard) could simplify this process, providing an indication of whether certain types of EPC approach are appropriate for accommodating specific innovations.

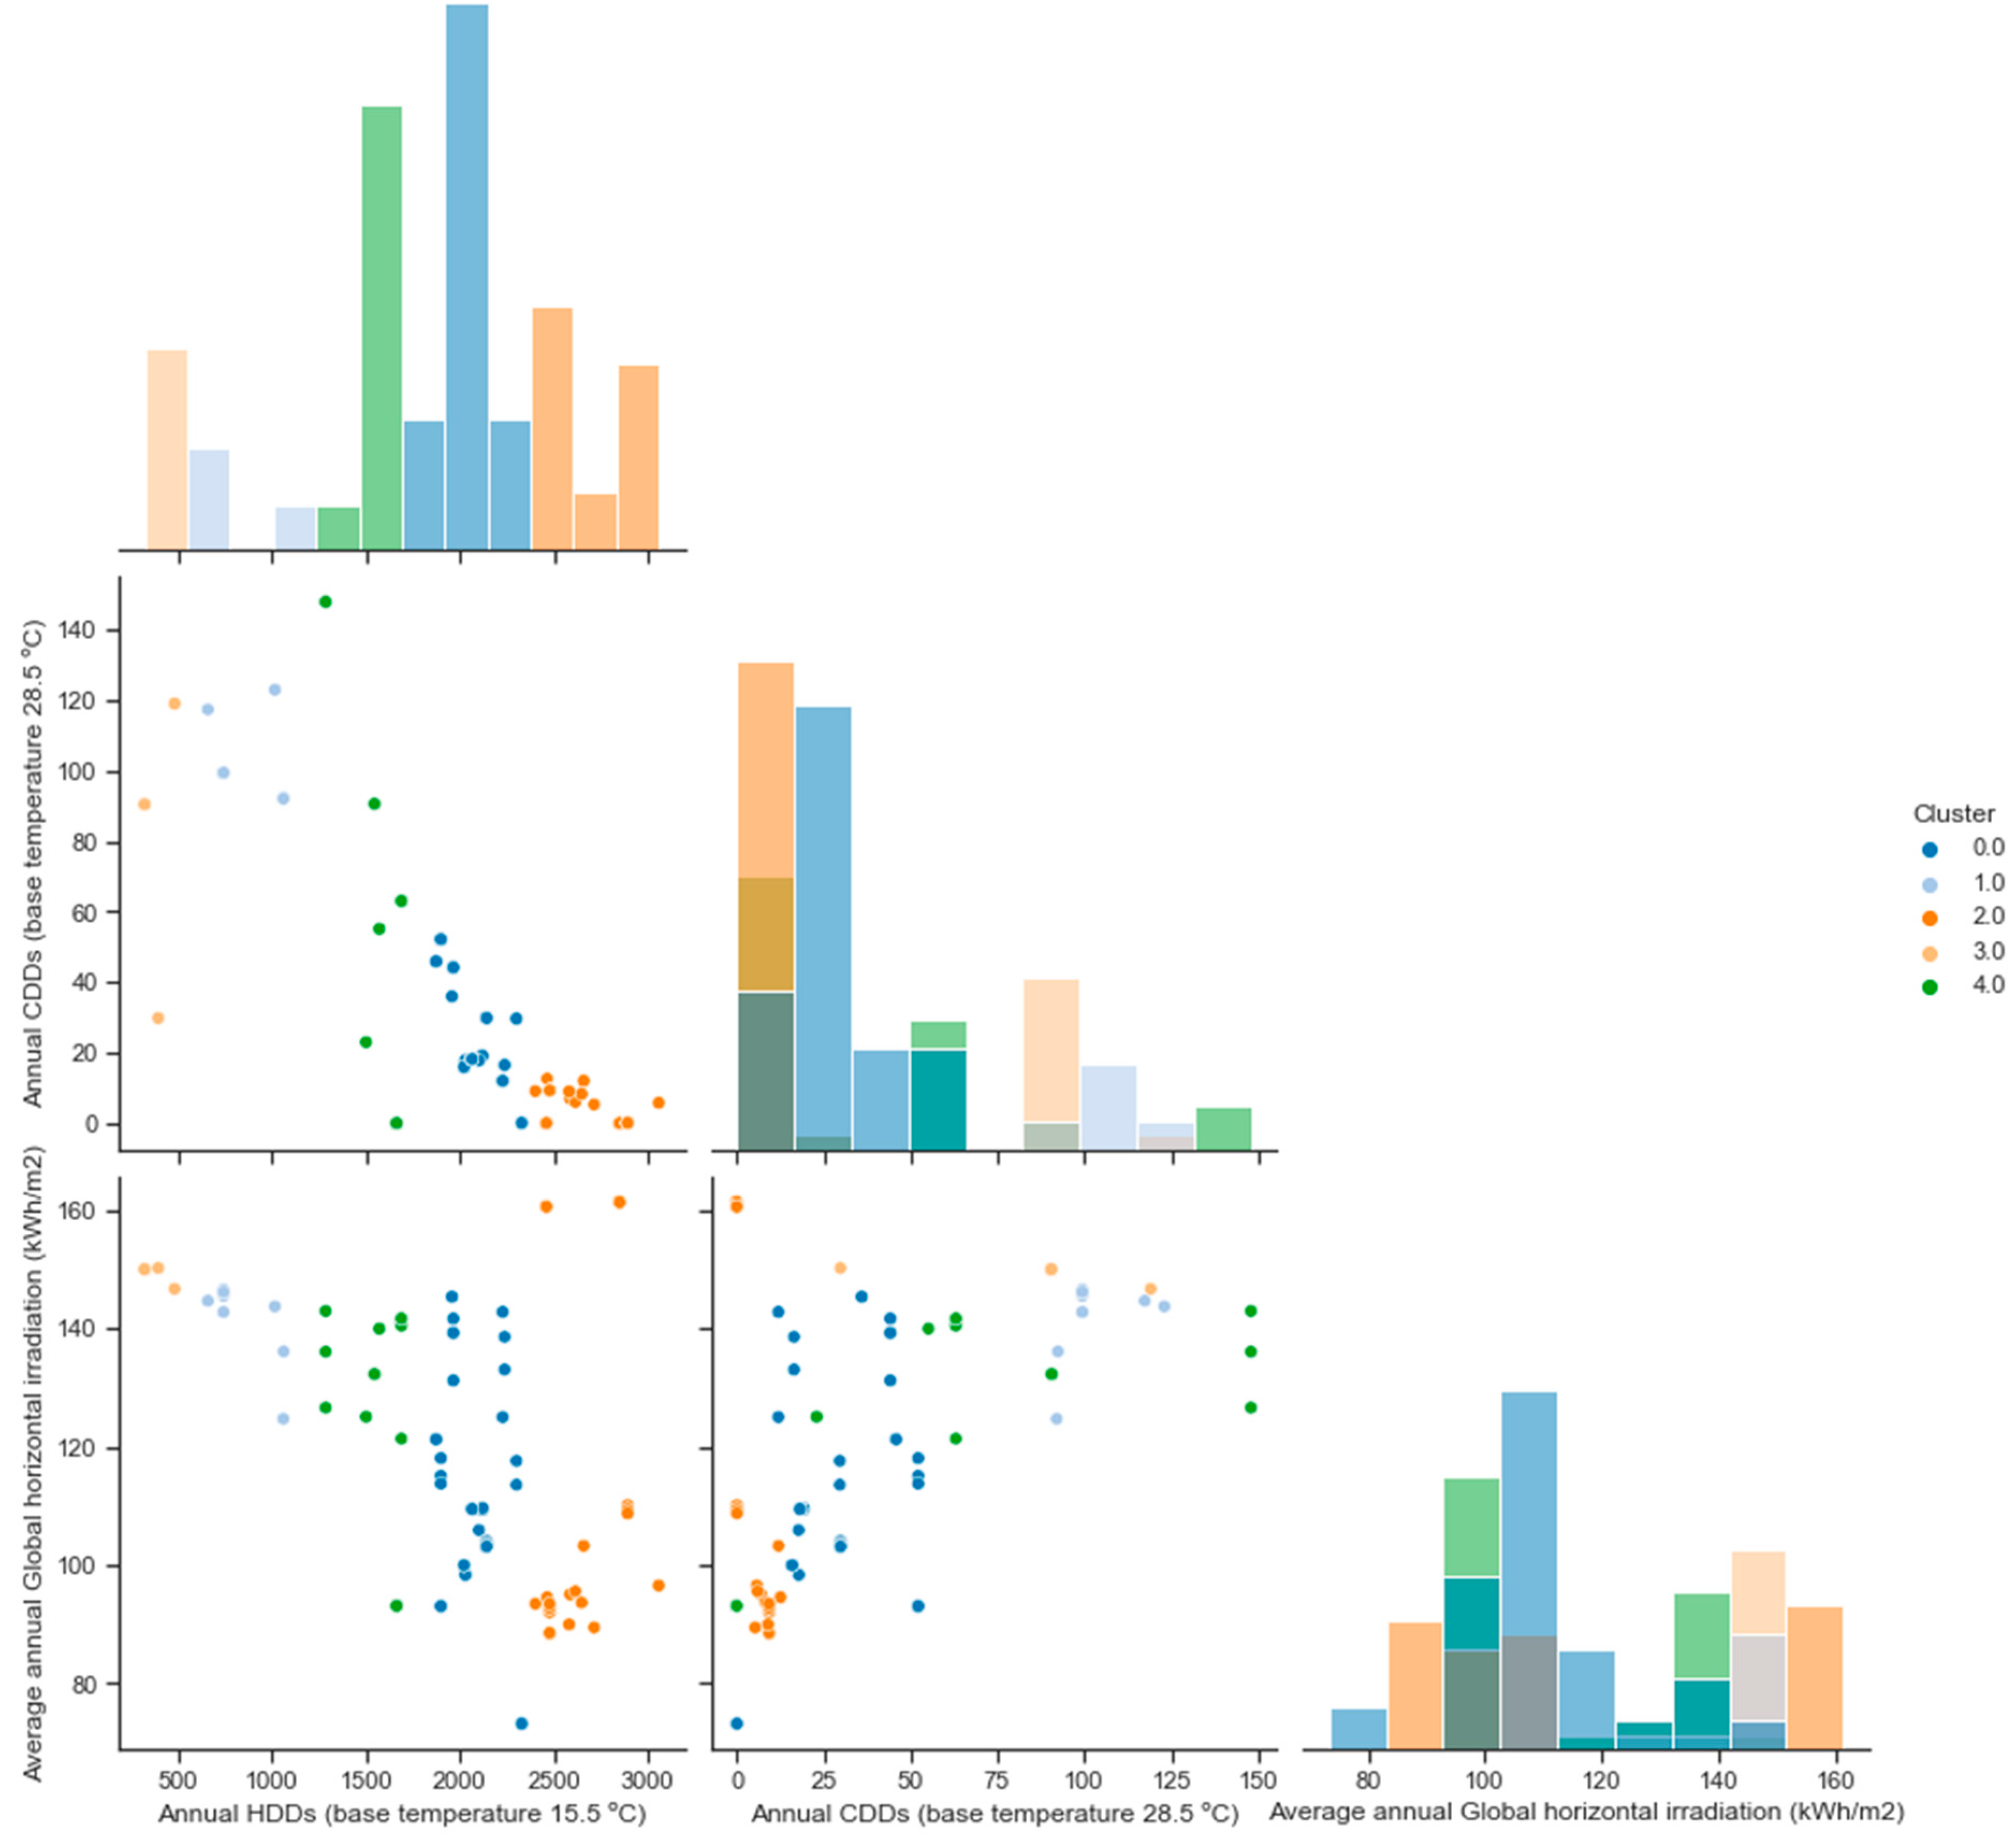
3.1. Grouping EPC Approaches

There are various ways of defining EPC approaches, but Section 2 has noted, in particular, different calculation methodologies, input assumptions, and output metrics (where even “kWh/m2” may not refer to the same measure of kWh).
Calculation methodologies may be steady-state or dynamic in nature, or use real energy data for some form of calibration. Whilst it is a given that typical building archetypes in each country will be different depending on local vernacular design and cultural factors, the way those buildings are defined by inputs is also different—for example, in the Slovenian methodology, the assessor should provide the heating power and efficiency at 30% operation and the heat loss in the standby mode, in addition to the commonly required information in other methodologies, such as the Coefficient of Performance (COP), Energy Efficiency Ratio (EER), and Seasonal Energy Efficiency Ratio (SEER). The assessors charged with applying these methodologies do not go through the same training regime [23]—and, indeed, the assessment framework itself may have been developed with a particular type of assessor education in mind. Finally, countries have some flexibility in the output metrics that they use in the EPCs—including the metric used to formulate the EPC rating itself. Not only does this mean a combination of energy, carbon, and cost metrics are being used, but it is not necessarily the case that (for example) two EPCs displaying an energy metric are defining the same quantities—some EPCs focus more on primary energy rather than final energy consumption, and there are also differences in the category of energy used (e.g., the use, or not, of end-use appliance energy consumption).
Table 2 presents an example of categorising methodologies based on key factors of difference. In this table, for the sake of consistency, only the methodologies for residential buildings are considered. However, the same approach for categorisation can be applied to any methodology. Such a categorisation approach can facilitate the implementation of next-generation EPC metrics and calculation methodologies, taking into account the frameworks already in place in countries to make the transition process smoother and more feasible. Categorisation of methodologies based on more detailed criteria is included in crossCert reports [24].
Based on each categorisation criterion, the studied countries can be grouped as presented in Table 3.
It is worth noting that categorising methodologies using criteria such as standardisation is a partly subjective exercise and does not necessarily capture variations of approaches across different countries in, for example, use of all input parameters. Country-specific approaches to such parameters vary from one input to the next, making it difficult to assign them to one category. For example, while the Maltese methodology treats most inputs in a standardised way, it does not provide default U-values for residential buildings and requires the assessors to perform calculations separately. Likewise, for the UK, infiltration rates should be measured on site for new buildings but there is considerable standardisation and approximation of other inputs. Therefore, in the categorisation presented above, the overall approach of each methodology has been considered, rather than a methodology’s approach to each individual input.

3.2. External Differences

One argument for the described differences in EPC methodologies is that, fundamentally, each country is different. Whilst there may be agreement in the philosophy behind how and why to assign energy ratings to buildings, it should not be surprising to find different versions of this philosophy being tailored to specific parts of Europe. Or, to frame this a different way, even if a fully harmonised, Europe-wide EPC methodology was constructed, would that be appropriate or fair when applied to each European country? If using EPCs to generate meaningful change through retrofit recommendations (and new build options), the assessment of buildings must account for differences in the following:
  • Climate, and how this impacts the balance between heating and cooling;
  • Building stock definition, and how country-specific vernacular architecture defines the baseline from which improvements have to be made;
  • Cultural approaches to energy use and how (if at all) that can be accommodated into an assessment that generally views occupants in a simplistic way;
  • Maturity of markets around heating and cooling technologies, in relation to recommended improvements in EPCs;
  • Economies and the building owner’s ability to pay (and financial support for doing this), again related to the tailoring of any energy efficiency recommendations;
  • Policy targets around the energy efficiency of buildings (and use of EPCs in those policies).
For some of these factors, it is not necessarily the case that these can be reflected in simple changes of inputs. For example, when representing climate, two countries could adopt identical methodologies that merely require different standard weather data as input. However, if the result of those different climates is that one country has negligible cooling loads in their building stock, it is unlikely that a methodology would be developed that centres on cooling load calculation.

4. Quantifying Implications of Difference

One way of judging the ability of an EPC assessment to represent a building is to relate it to the modelled Performance Gap [25] when compared to measured energy consumption. This is an imperfect way of critiquing what is fundamentally a compliance approach (for standardising energy ratings), rather than an accurate predictor of energy bills. However, looking at whether some methods are more prone to large Performance Gaps than others can tell us something about the method itself.
Sixty-five case study buildings across nine crossCert partner countries were selected for this study. The selection of these case study buildings is based on the availability of both measured and calculated (from EPCs) annual energy consumption (Table 4). Due to the data requirements of these buildings (and needing standardized energy assessments completed for each building), achieving a larger sample of buildings across the target countries is difficult. These buildings are presented as individual cases that demonstrate the application of different EPC approaches, not as country-representative samples of buildings. The Performance Gap was calculated for each building using Equation (1) and the results are shown in Figure 1, noting the following:
P e r f o r m a n c e   g a p i = e i r i e i × 100
where ei is the annual actual energy consumption per m2 value, and ri is the calculated value based on the EPC certificate for building number i.
It is worth noting that variation in EPC approaches extends to the definition of Performance Gap as well—that is, this definition for an EPC varies with the metrics used for that country. For example, in Denmark, heating is a significant part of a building’s energy consumption, and the main EPC indicator is based on the heating energy consumption. In addition, many of the studied buildings use district heating as their source of heating, which provides heating energy consumption without the need for sub-metering (and is thus provided for the Danish case study buildings). Therefore, it was possible to calculate the Performance Gap for the Danish buildings based on the heating energy consumption. However, it should be highlighted that excluding other categories of energy consumption might lead to lower (or higher) Performance Gaps compared to other countries. Another example is the UK4 case study, a non-residential building in England. The EPC approaches are slightly different across the UK, and EPCs in England and Wales only provide the carbon emissions for non-residential buildings. Therefore, in order to calculate the Performance Gap for this building, the actual carbon emissions were calculated using the measured energy data. This leads to the Performance Gap for this building being based on the carbon emissions rather than the final energy values. Another example is the inclusion of electrical appliances usage in EPC calculations for non-residential Bulgarian buildings (BG5, 6, 7, 8, 9, and 10) or the exclusion of lighting usage in Spanish residential EPCs (ESR 2, 3, and 4). Provided Performance Gaps (in Figure 1) should therefore be seen as a measure of how close the chosen EPC metric in that country is to an empirical measurement of the same metric. Comparisons across countries should be carried out with this in mind.
The Performance Gap values for this set of buildings range from 0.77% to 859%, showing a wide range of variation. Based on the results in Figure 1, 57% of EPCs in this sample overestimate the energy consumption values, leading to negative values for the Performance Gap. Hence, in order to use the Performance Gap as a comparison metric between methodologies, the coefficient of variation for the root mean square error (CV(RMSE)) for all case studies in each country is calculated (Equation (2)) and presented in Figure 2.
CV ( RMSE ) = i = 1 65 ( e i r i ) 2 65 e ¯
where e ¯ is the average energy consumption per m2 for all the buildings in each country. Figure 2 shows the calculated CV(RMSE) for the studied countries’ methodologies.
Possible links between the Performance Gap and the general assessment approach can be explored by assigning each building to a category based on certain features of the calculation methodology used for the EPC assessment (as described in Table 3). Figure 3 depicts the distribution of the Performance Gap for the case study buildings based on standardisation levels in the methodologies used for EPC calculations in each country.
Although there is no conclusive trend between the assessment approach and the Performance Gap in the results, it appears that for the studied sample, the median values of the gap are generally lower for methodologies with lower levels of standardisation. The exception is Bulgaria, which is a highly tailored methodology, and has a higher gap than other tailored methodologies. Further studies on a larger sample of buildings are necessary to conclude the relationship between the methodology approach and the Performance Gap, but these outputs do support the earlier observations about the different input and calculation approaches of the studied countries.

5. Challenges of Direct Comparison of Methods

When reviewing multiple EPC assessment approaches, it might be considered that there is the potential to share best-practice and create composite methods that combine aspects of different approaches across Europe. As already discussed in this paper, the differences in methods mean that they are not always directly transmutable with each other. Applying the same methods to different buildings (and modelling the same building under several methods) can illustrate this—not just in the comparison of end results, but the process a modeller might have to go through.
The crossCert project has attempted to test some of these methods against each other for a sample of buildings across Europe, aiming to discern the impact of different decisions made across different methods. A designed comparative exercise is documented below to demonstrate some of the challenges in comparing these different methods.

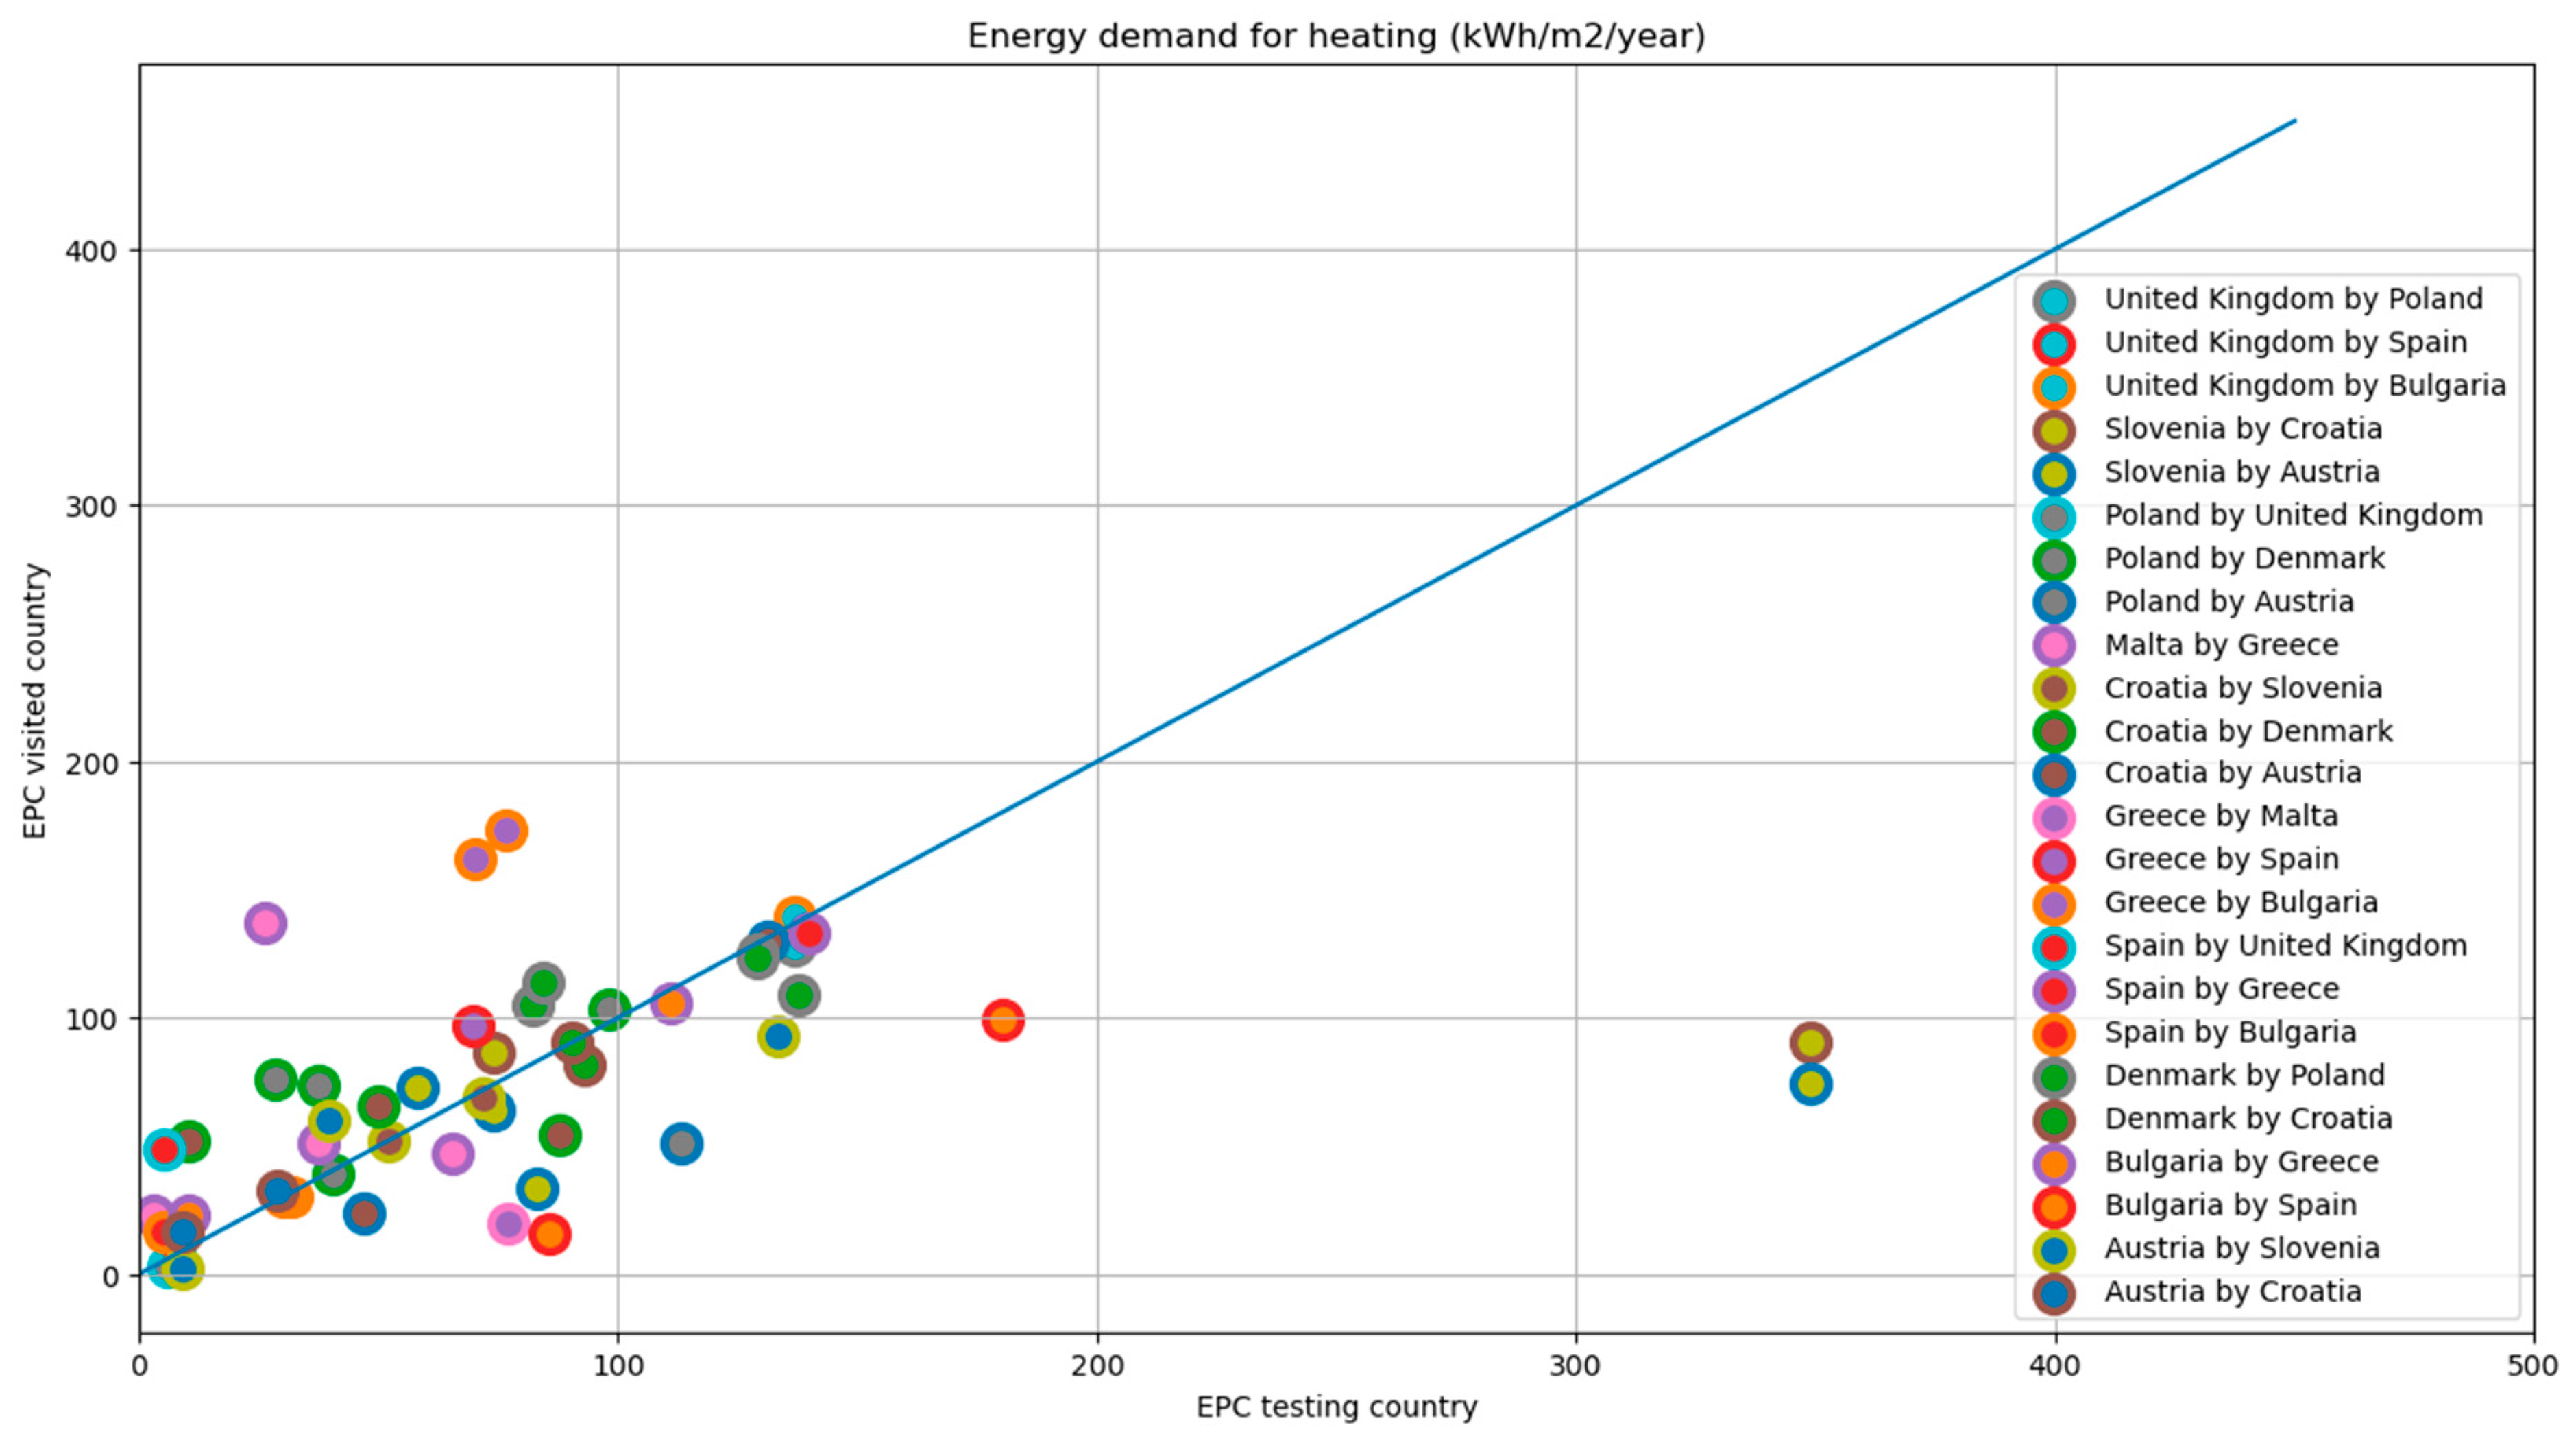
5.1. Cross-Testing Buildings

The cross-testing method of crossCert involved applying an EPC method from one country to a building of another, and then comparing that with the native EPC assessment of that building. Firstly, such a comparison is subject to the difficulties noted in Section 3. There is therefore a need to, at least, standardise the output metric being used, which may require converting some output metrics into something consistent across two different assessments (e.g., primary to final energy). There is then the question of what constitutes “the EPC method”: is it (a) just the calculation procedure, (b) the calculation procedure and all input assumptions, or (c) calculation, inputs, and the actions of the assessor? The comparison described here assumes option (b), therefore including some of the default input assumptions that an EPC assessor must use in a given country.
One clear difficultly is how to account for weather data. In many countries, an EPC assessor will have to use a set of design weather data when modelling the building. This may include several climate zones for that country, or an average weather file for all buildings in that country. If that is a key part of the overall assessment (and this study argues that it is), then applying a “foreign” EPC assessment to a “native” building poses a challenge. The approach taken by crossCert is to assign climate clusters to a selection of European countries involved with the project. This ensures that similar weather data, which are embedded in the EPC approach of a country, can be applied to buildings of another country (note that most EPC methodologies do not easily allow, or allow at all, the user to change the weather parameter assumptions even if this was desired). The full approach of this is documented elsewhere [26] but the climate clusters are shown in Table 5. One defence of this assumption is that, even within single countries applying local EPC methods, generalisations are already made about climate regions over quite large areas for the purposes of standardisation. Therefore, the current weather parameters adopted by official EPC calculations are not necessarily representing accurate, local weather data.
The sample buildings used in the cross-testing are provided by project partners across European countries. They are indexed by country and identified by the country’s ISO 3166-1 [27] alpha-2 two-letter code and a generic number, for Austria (AT), Bulgaria (BG), Denmark (DK), Spain (ES), Greece (GR), Croatia (HR), Malta (MT), Poland (PL), Slovenia (SL), and the United Kingdom (UK). To identify buildings that share similar climatic conditions in different countries, climate information at the building location is used; specifically, Heating Degree Days (HDDs), Cooling Degree Days (CDDs), global horizontal irradiation, and annual average ambient temperature. These parameters were recorded for all building locations in a harmonised manner.
Once the weather at each building location was characterised using the above information, a K-Means Clustering algorithm was used to cluster the sample buildings into five groups. K-Means Clustering [28] is an unsupervised Machine Learning algorithm that partitions a dataset (of local climates in this case) into K non-overlapping clusters. The method assigns each data point to a cluster such that the sum of the squares of the distances between the data points and their respective cluster centroids is minimised. The objective of K-means is to segregate groups with similar traits and assign them into clusters, which makes it a powerful tool for data analysis in various applications ranging from market segmentation to pattern recognition. The decision to use five clusters in the present work was made by inspecting the building grouping in the clustering space; that is, the clustering approach provides the indication of the grouping rather than being predetermined.
Figure 4 shows the results of this clustering process. In the scatterplots, each dot represents a building; its colour indicates the cluster number to which the building is allocated (where this cluster numbering does not have any physical meaning). The three scatter plots are two-dimensional projections of the three climate dimensions used for classification: HDDs, CDDs, and global horizontal irradiation. The scatter plots are indicative of the wide range of climatic conditions prevailing at the building locations. The bar graphs indicate the building distribution in each of the three dimensions: the bar height is proportional to the number of buildings, and the colour indicates the cluster number. Table 5 presents a list of the buildings that are included in each cluster. All participating countries share a cluster with another country, making it possible to cross-test all countries with another country within that cluster. Cluster 1 has only Greek buildings, but Greece also has some buildings in other clusters, and therefore it was still possible to cross-test buildings from Greece.

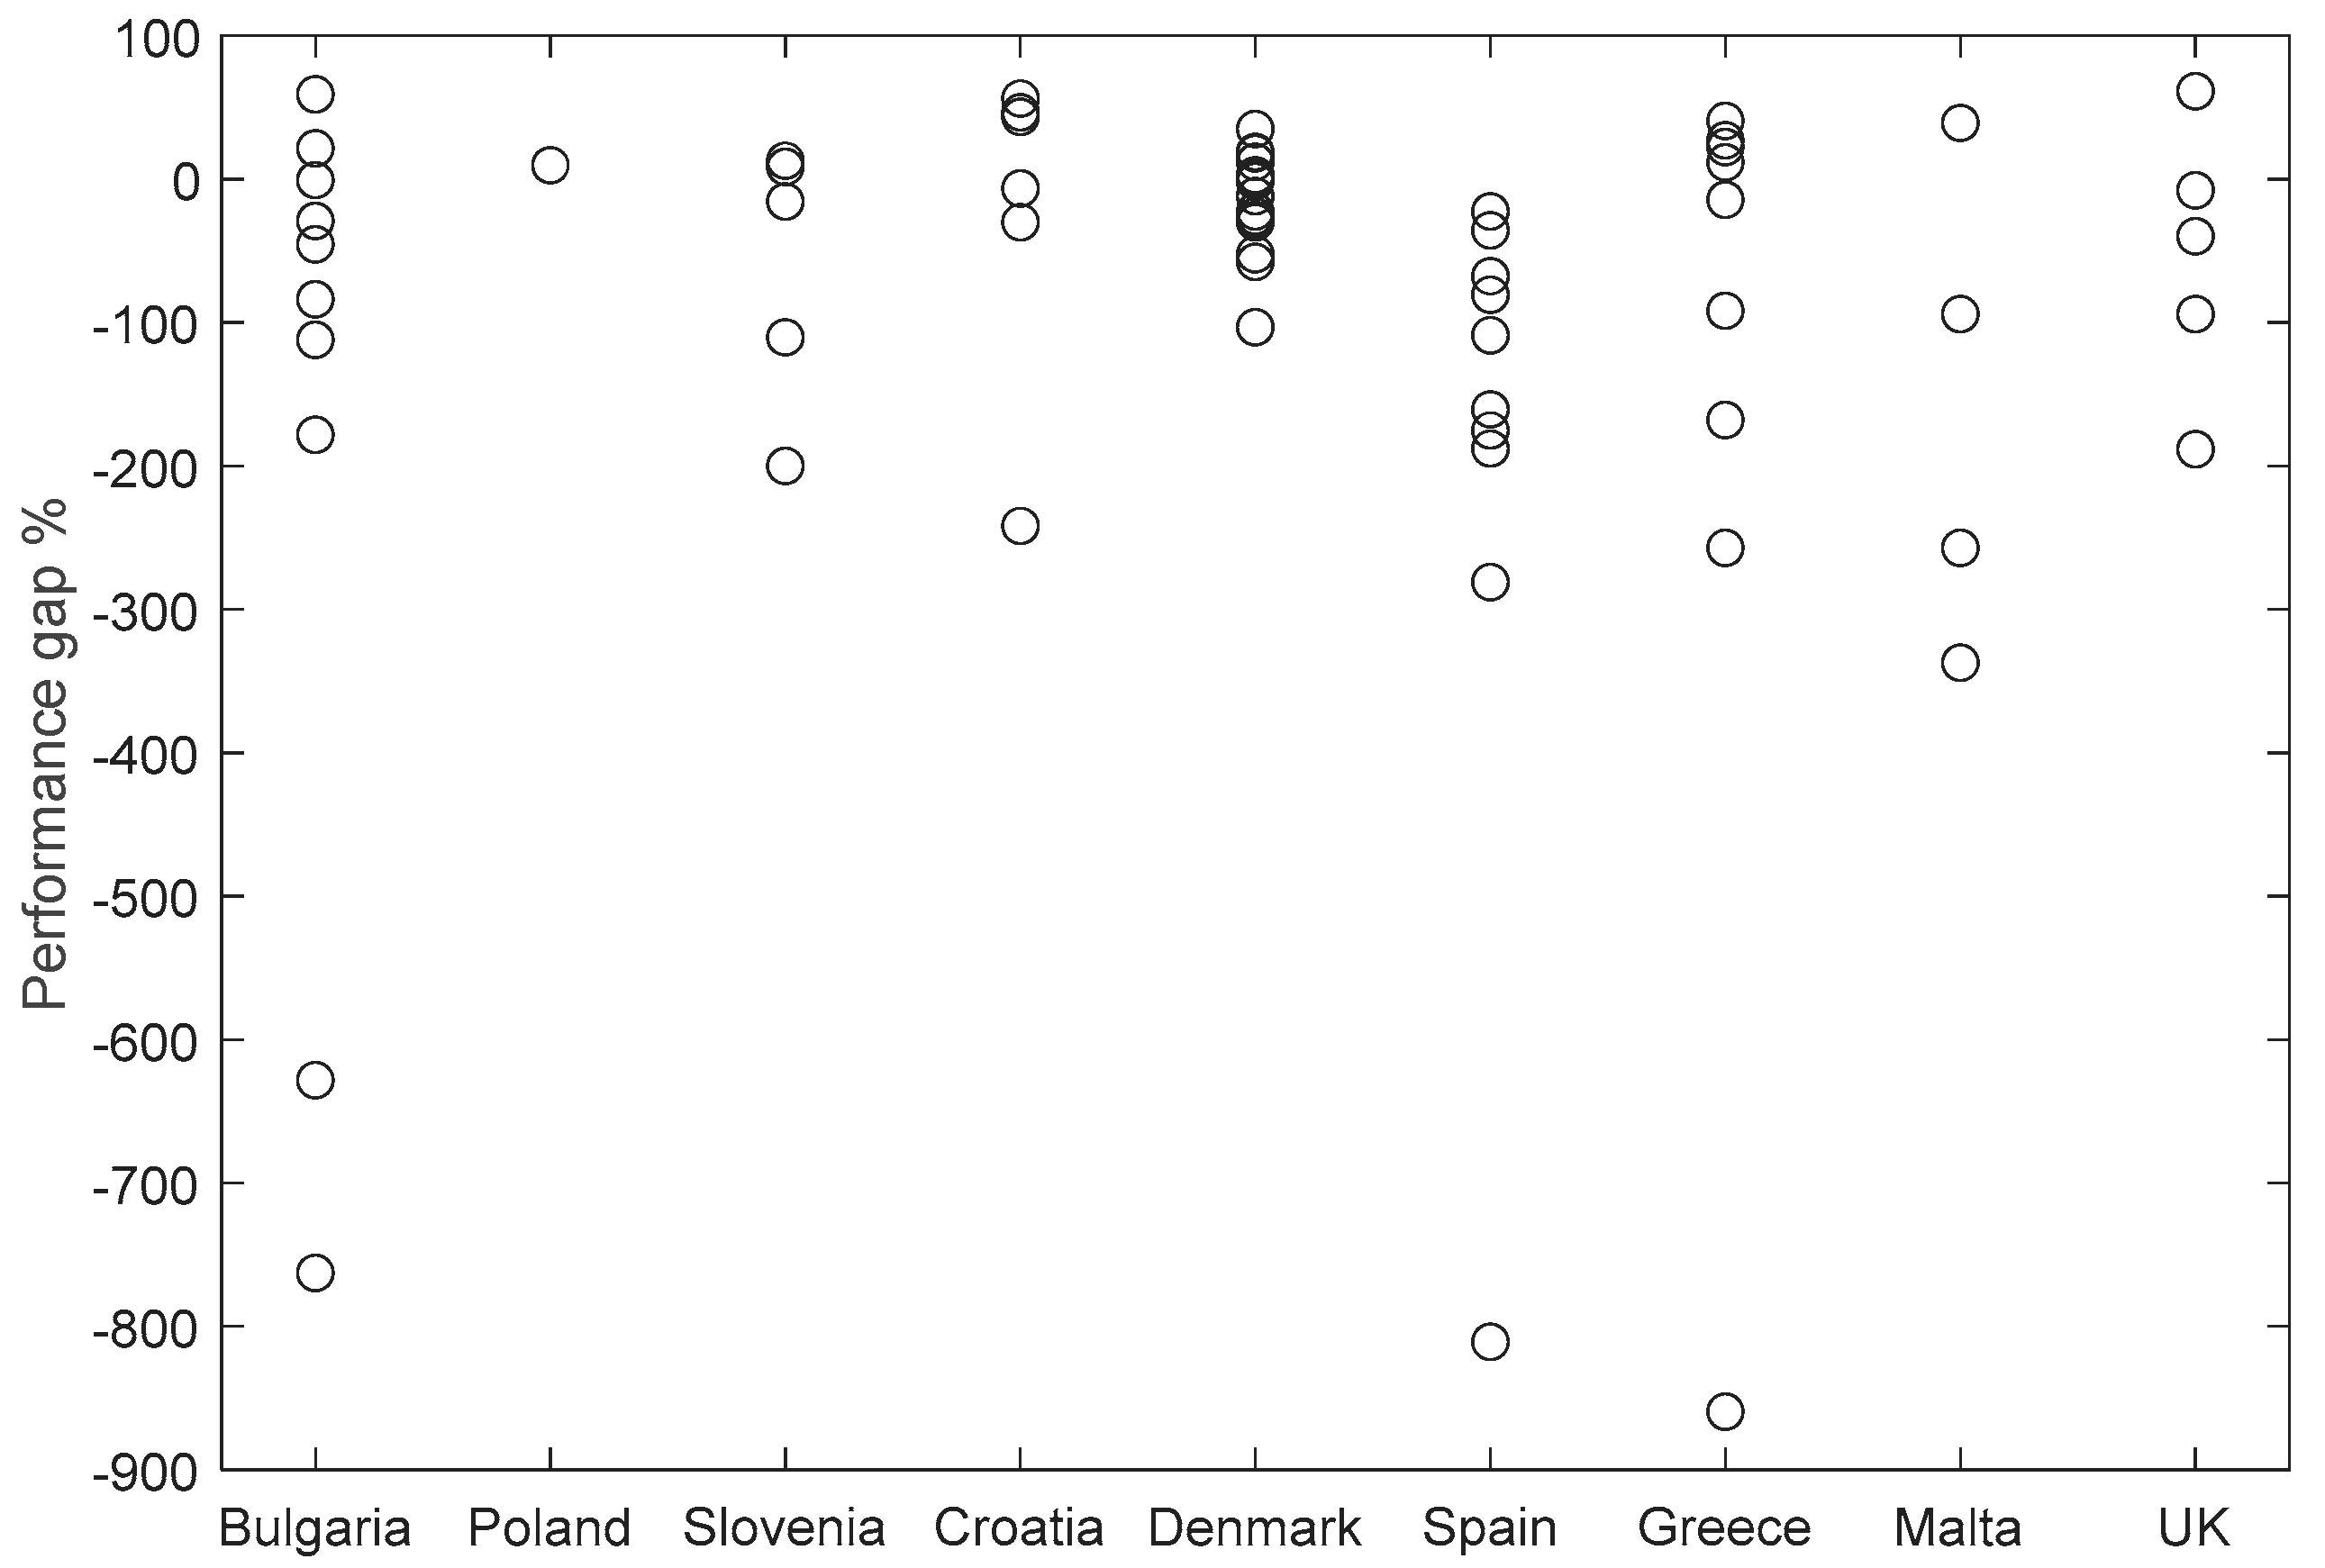
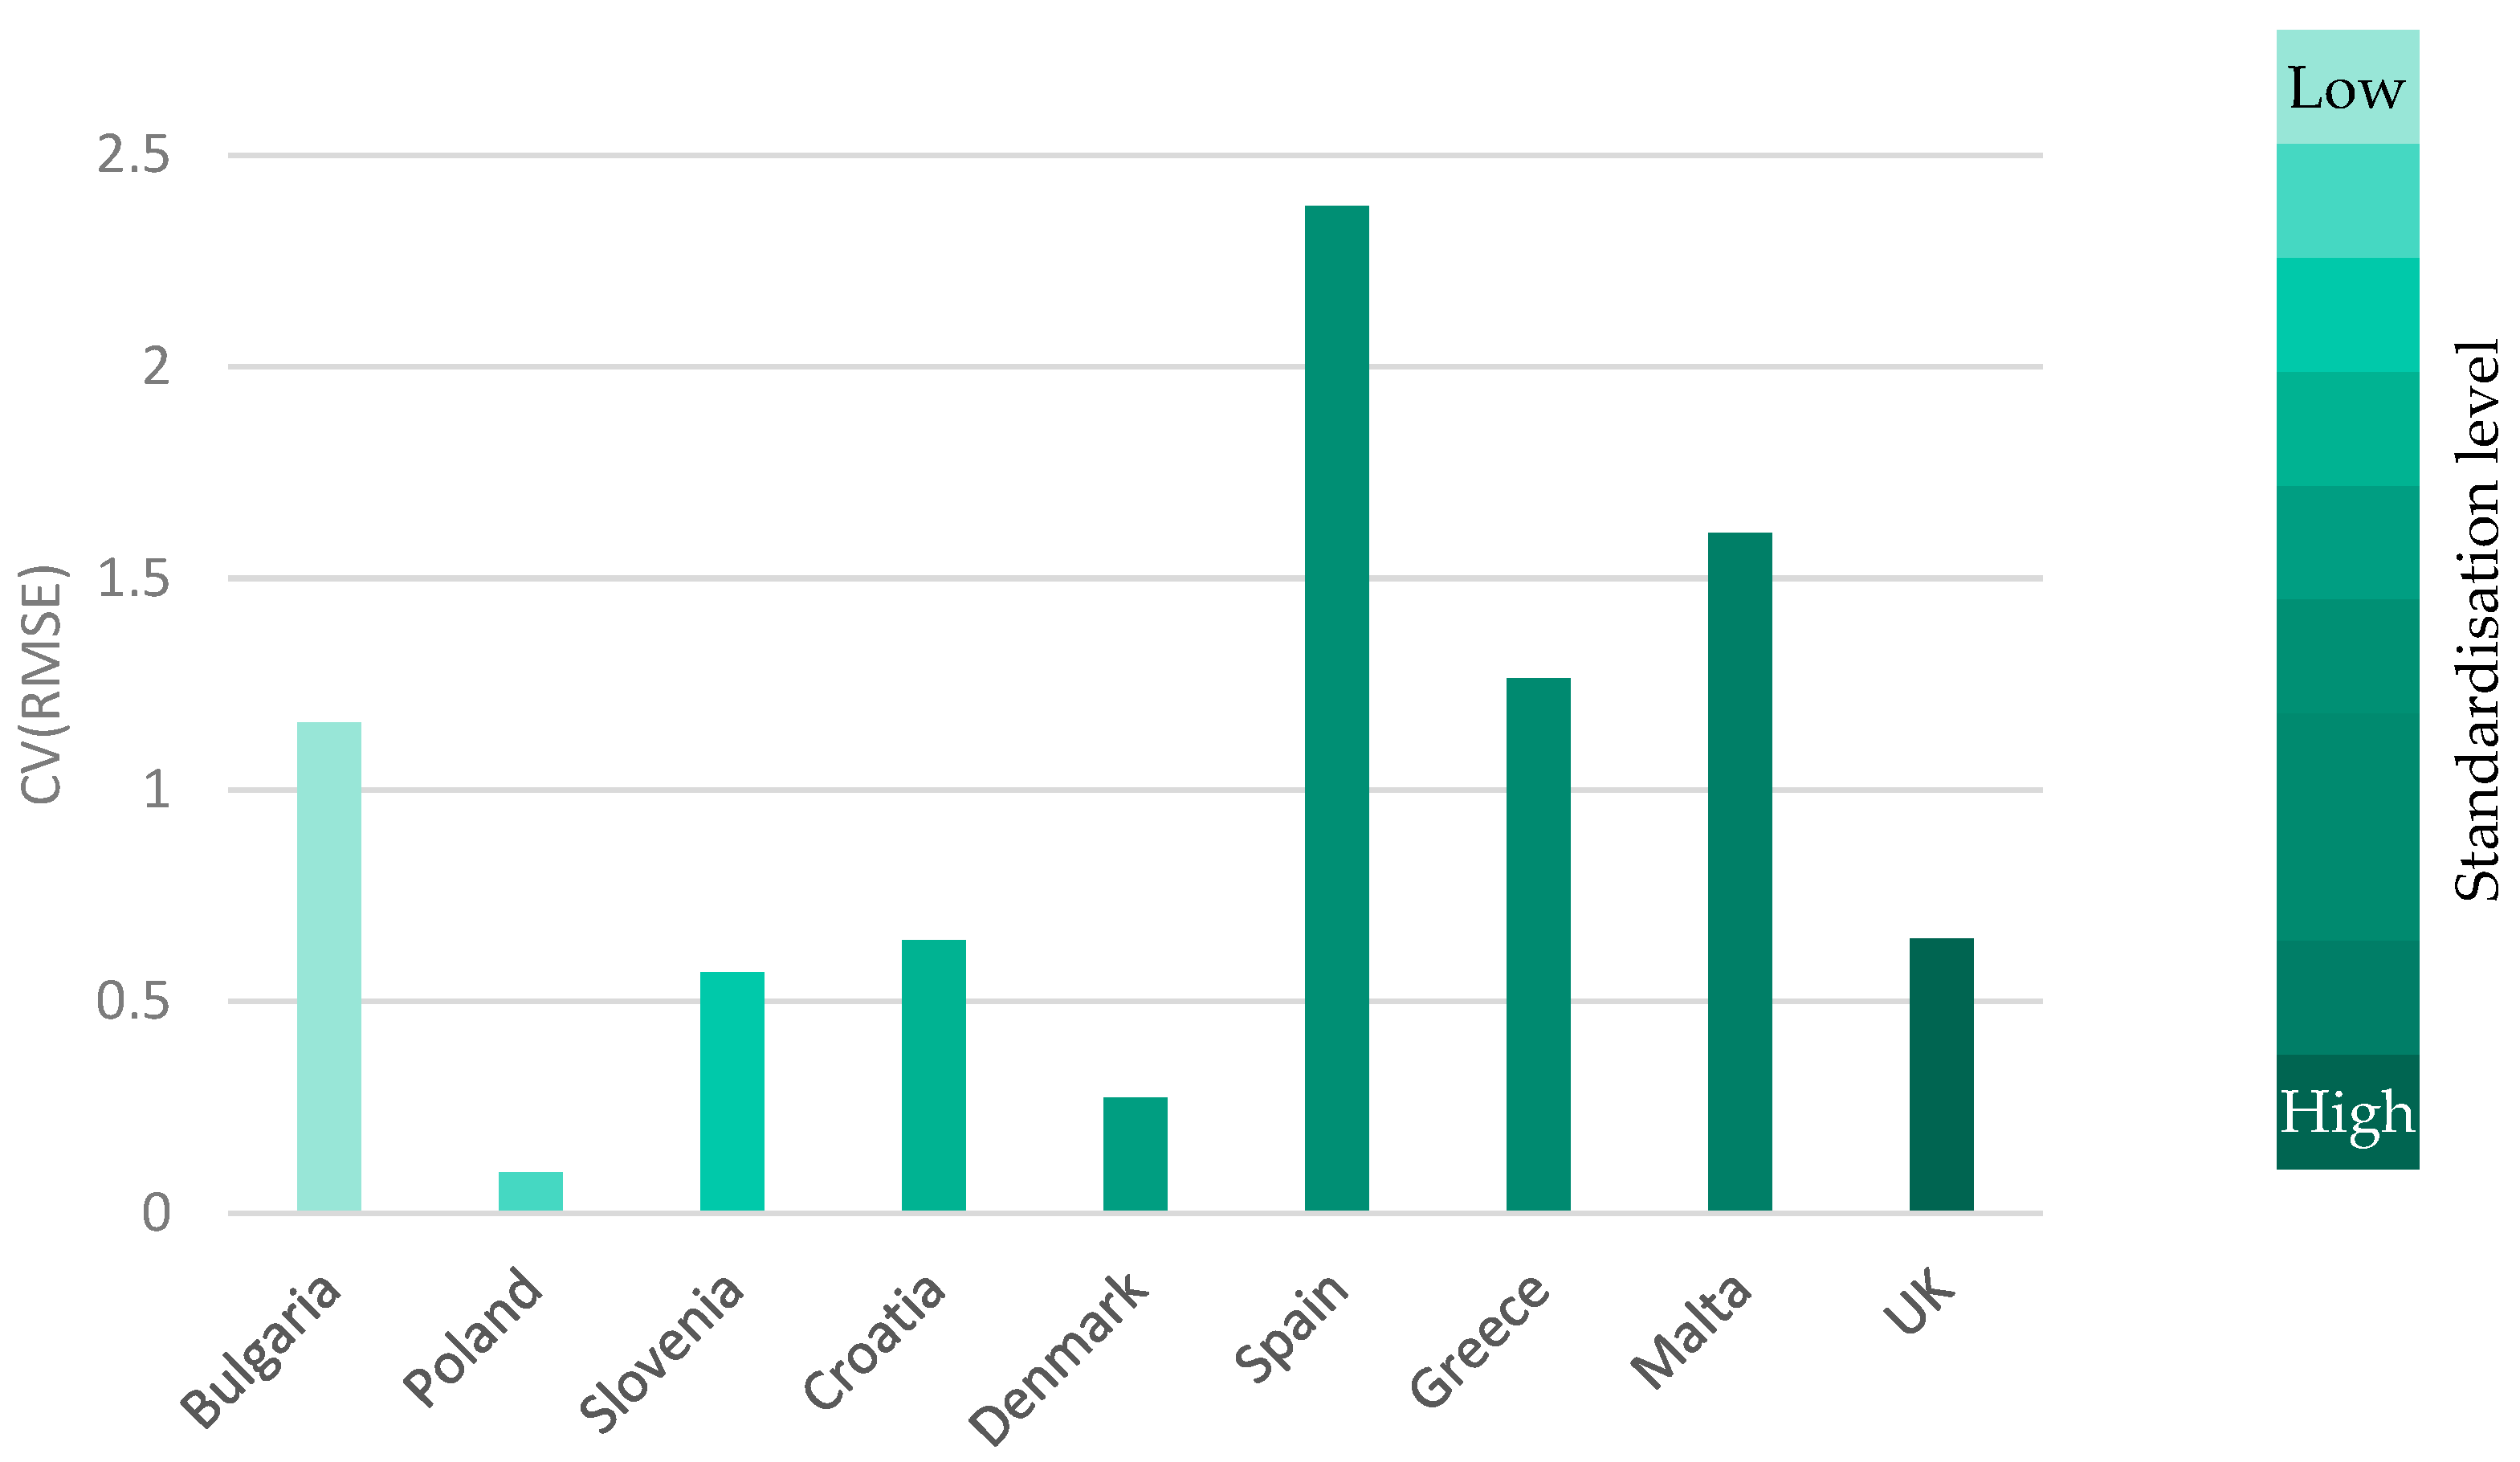
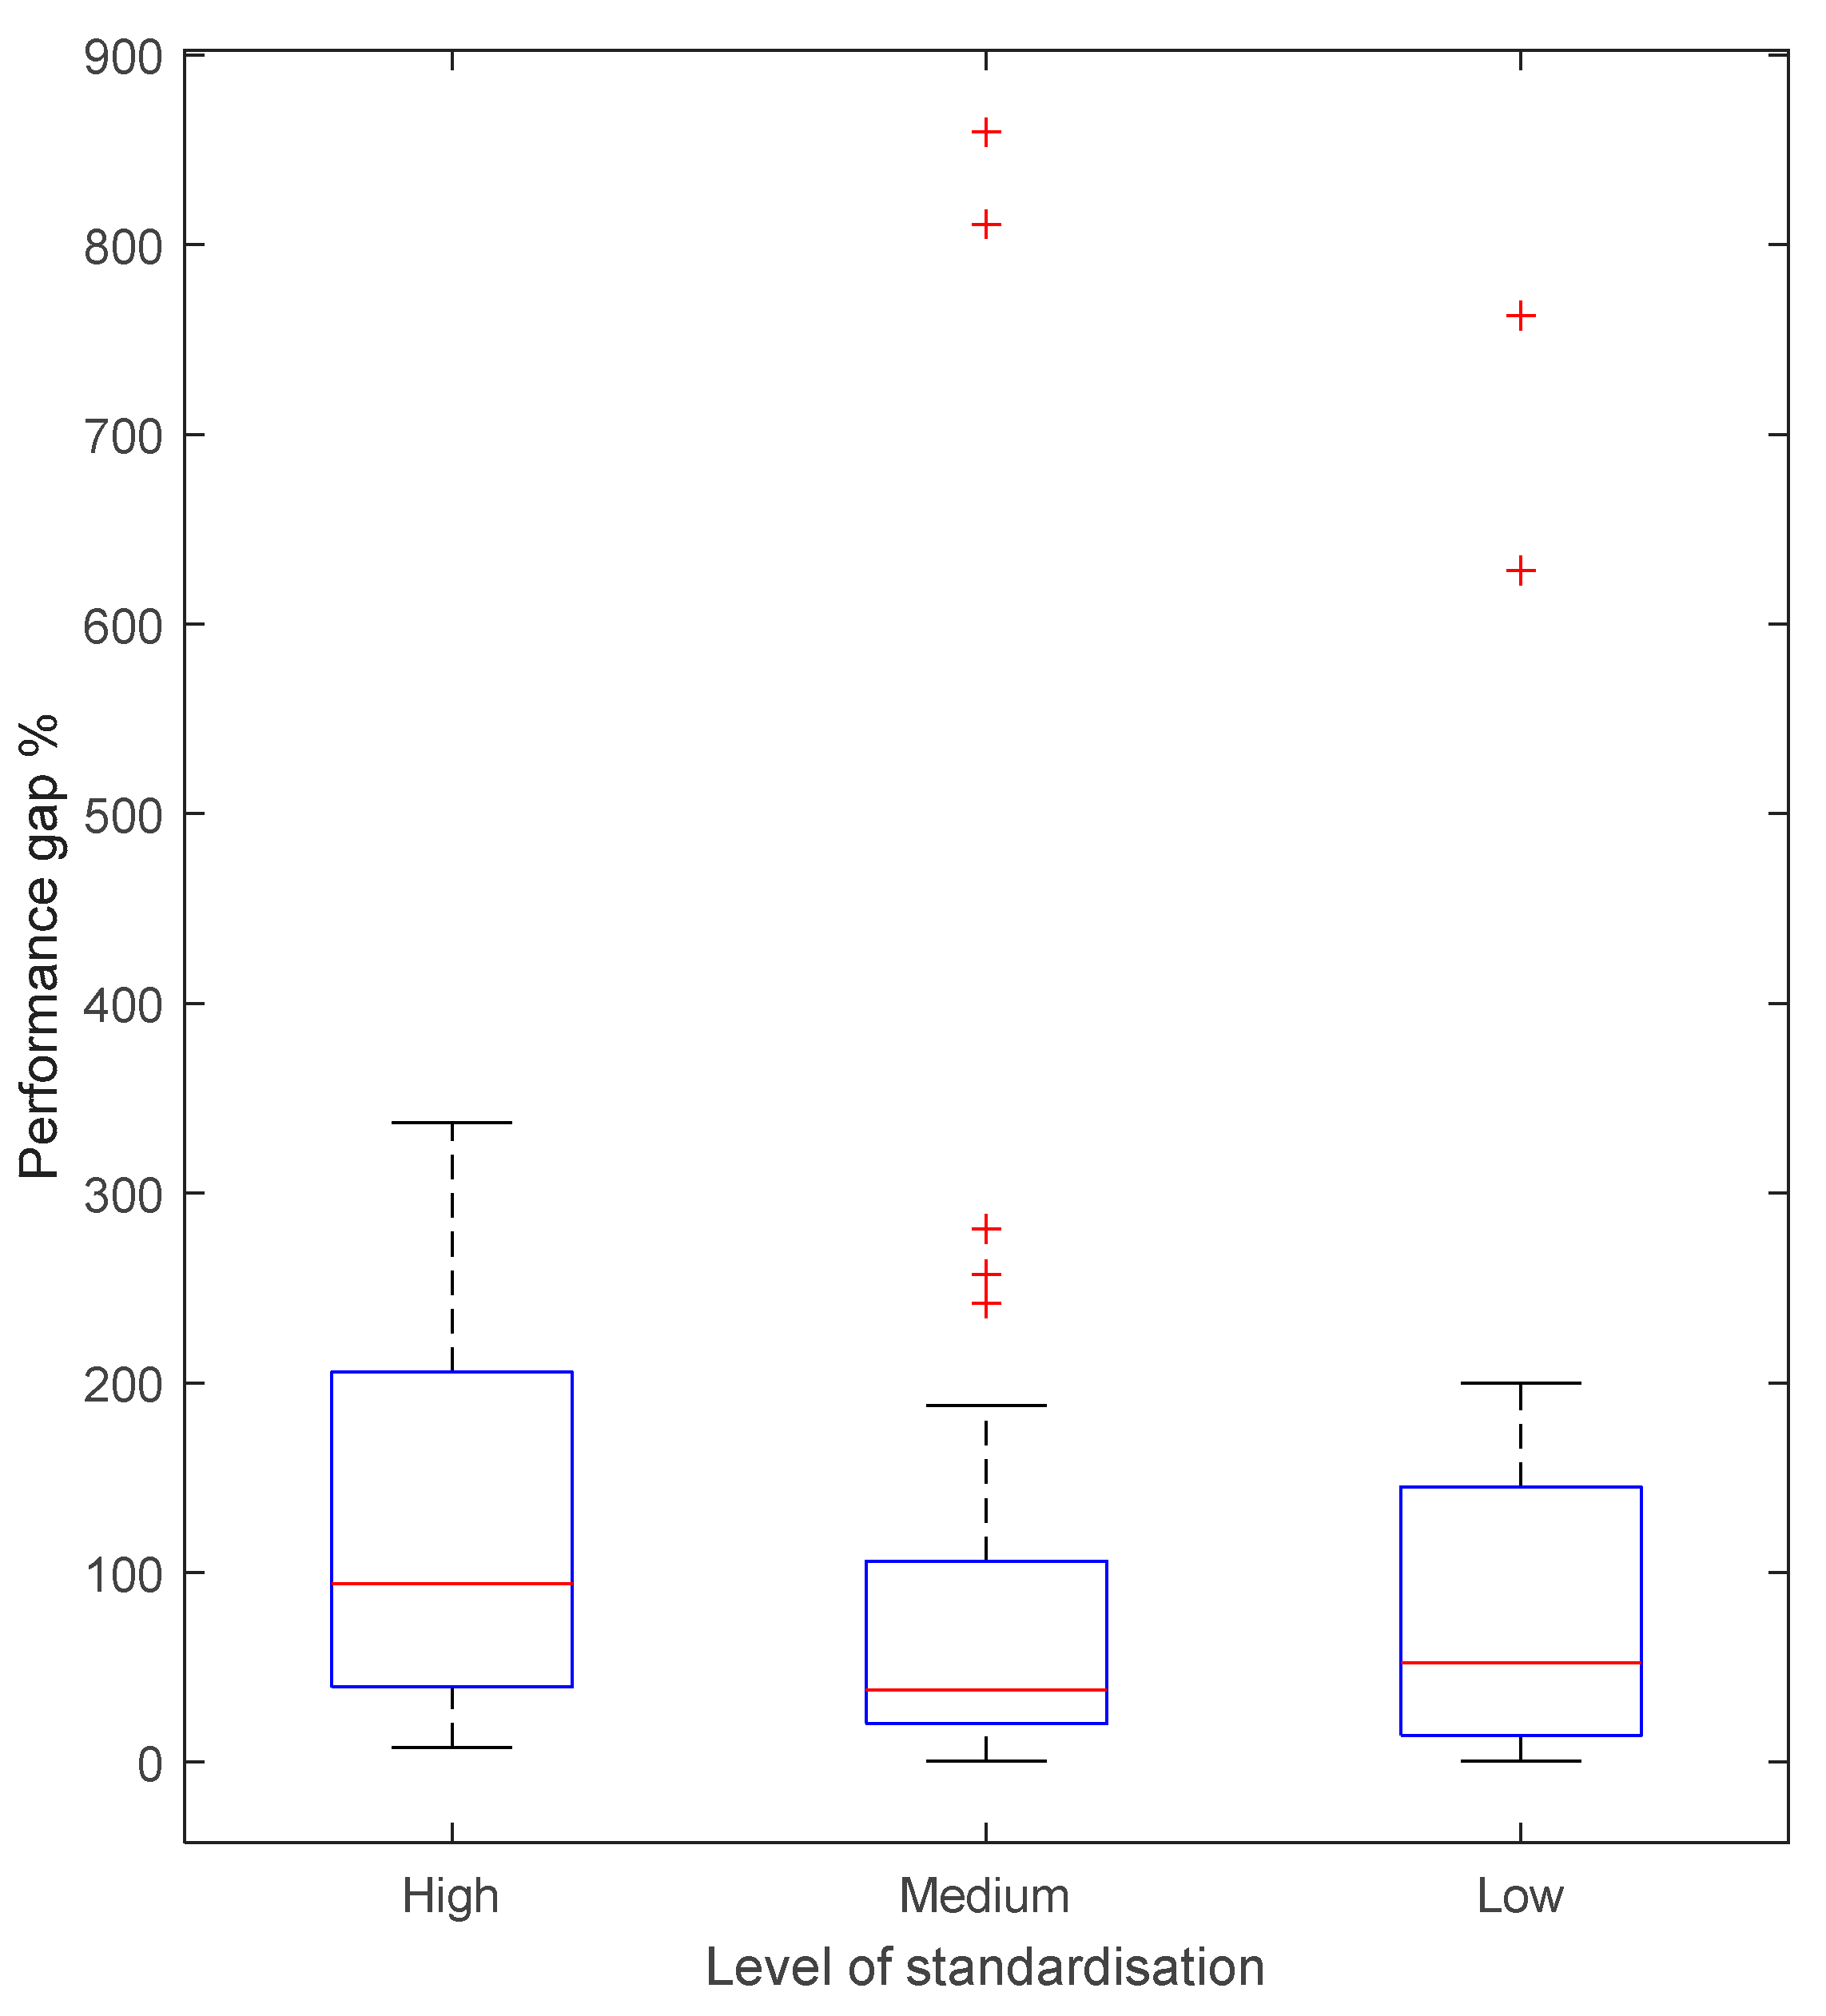
5.2. Cross-Testing Results

With each building assigned a climate cluster, the next stage was to run each building with a foreign EPC methodology to compare to the native EPC already generated. Members of the crossCert team were tasked with running these models for the sample buildings. Whilst some countries adopt relatively black-box modelling that can accommodate quite simple input instructions, other methods required more nuance and judgement to the calculation approach to ensure that, as best as the data would allow, the building was being correctly modelled in each case. This required the members of the project team to maintain dialogue through the calculation process, including a workshop activity where many of the buildings were input into the respective software.
Figure 5 presents a summary of the cross-testing results. The vertical axis represents the energy label resulting from the native EPC assessment for each building; the horizontal axis represents the energy category resulting from a foreign EPC assessment. The numbers indicate the number of times that a building with each native category was given each of the foreign categories. For instance, the number 5 in row B, column C indicates that five buildings that were labelled as B in their native assessments were labelled as C in a paired foreign assessment.
Figure 5 shows high frequencies generally clustered along the diagonal. This would indicate that, despite the difference in methodologies highlighted in Section 2, the energy labelling of buildings is reasonably consistent across countries (though clear outliers can be seen, such as low frequencies along the bottom, G row). Figure 6 presents a similar picture but using the kWh/m2 energy demand returned by the generated EPCs (noting the paired countries used in each case).
Due to the requirement to carry out climate clustering analysis and then manually apply an EPC assessment to a building outside the native country, generating a large sample size is difficult (with EPC assessments generally configured to require an actual energy assessor rather than something run off a more automated approach). However, the 42 buildings presented in these results are adequate for illustrating the designed comparison process and indicating the challenges of genuine comparative exercises between different EPC frameworks.
It should also be noted that the comparison of Figure 5 and Figure 6 relate to the final EPC rating and total kWh/m2 value, respectively. These are key (and indeed the main) outputs of an EPC but are the product of a large range of input data. A typical EPC will also provide additional outputs to complement this EPC rating. Therefore, an agreement in the EPC rating from two different methodologies does not necessarily indicate near-identical EPC frameworks (and, as discussed in Section 2 and Section 4, EPC ratings and definitions of kWh metrics vary with methodology and so are not always indicating precisely the same information). The results do, however, suggest that for the majority of the buildings, the compared EPC methodologies are judging that building to a similar level of overall energy efficiency when compared to the rest of the building stock of that country. Specifically, 38% of the sampled buildings, when assessed using different certification methodologies, obtained the same energy class. For 45% of the buildings, the energy rating differed by one energy class, depending on the national methodology used. In 14% of the cases, the energy rating differed by two energy classes; and in about 3% of the cases, the energy rating was three classes or more apart.
An analysis was conducted on the few buildings exhibiting significant deviations in their energy ratings under different methodologies (i.e., those being apart in the two assessments by two or more energy classes). Most of the buildings showing these differences are those used for the cross-testing between Slovenia and Austria. The discrepancies stem from documented differences in the certification methods of both countries, namely:
The Slovenian calculation software requires more detailed input data than the Austrian one, and default values were assumed in the Slovenian software when the data were not available in the Austrian certificate. For example, the Austrian methodology allows the input of U-values for building envelope areas, including doors and windows, while the Slovenian software requires specifying materials and thickness.
User behaviour cannot be tailored in the Austrian software; it is enforced as built-in values. Replicating the same user behaviour (schedules, setpoints, occupancy) in the Slovenian software is not always feasible.
The methodologies for calculating thermal bridges differ in the Slovenian and Austrian procedures, potentially resulting in disparities in the result.
There is a discrepancy in the definition of the reference area. The Slovenian methodology considers the net area, while the Austrian methodology uses the gross area. This difference can significantly impact the indicators calculated on a per-area basis.
Internal heat gains in the Austrian software are predefined and cannot be modified. Accurate replication of these internal heat gains in the Slovenian software may not always be possible.
These differences in calculation methodology have led to differing energy ratings when both approaches are applied to the same building. Another case with a significant deviation is the energy rating of an educational building in Slovenia. While the Croatian methodology assigns it a C energy rating, the Slovenian methodology rates it as G. The main reason for the substantial difference in the building energy demand is the considerable variation in heat gains (both internal and solar) and ventilation heat losses calculated in each methodology. This variation is again due to the different calculation methodologies used in each software. In the Croatian methodology, the parameters for internal and solar heat gains, as well as ventilation heat losses, are built-in values associated with the building typology and cannot be modified.
Some Bulgarian buildings display deviations (of two energy classes) when calculated using the Spanish and Greek methodologies. These buildings achieve better energy ratings when calculated using the Bulgarian national methodology than with the Spanish and Greek methodologies. This is most likely due to the Bulgarian EPC being calibrated with actual energy consumption measurements, which potentially corrects deviations that cannot be rectified using other EPC methodologies.
These very specific examples indicate the level of methodological detail that must be understood when comparing different EPC approaches and attempting to explain discrepancies. The sample size does not allow for definitive judgements to be made on wider trends (e.g., what specific deviations may be typical between two countries), but the case studies quantify this for the buildings studied and provide a methodology that can be replicated elsewhere.

6. Discussion

Whilst good-practice sharing of EPC methods can be constructive for identifying possible improvements in assessment, testing individual aspects of those methods (to judge which is most effective by some measure) is difficult. It should also be recognised that an EPC approach will tend to be tailored to a specific country over time. It is likely to, directly or indirectly, reflect the building stock, the main energy uses in that country (e.g., heating vs. cooling), and also the type of assessor tasked with carrying out those assessments—where training and education background of assessors differ considerably across European countries [23].
Although the noted EPC methodological differences of this study illustrate a range of approaches for assessing energy use in European buildings with great learning potential, the flipside is that, despite emanating from a common starting point (of the EPBD), there is a clear lack of harmonisation across EPC methods around Europe. This must be fully understood before implementing changes that are designed to be applied to all European assessments—such as the desire to introduce new output metrics within the EPC itself [29].
For areas where there is a degree of harmonisation across countries, such as the use of energy ratings themselves, it still needs to be understood that these ratings are generated in different ways and, even when agreement is shown through the cross-testing exercise presented here, the metrics being produced may not be directly comparable. This research argues that, actually, such differences in EPC methods and the buildings are not necessarily a problem if those methods are able to achieve demonstrable impact on that target country. The EPBD is applying a harmonised philosophy towards energy efficiency assessment, and how to use resulting energy ratings in local energy policy and carbon targets; but the EPBD allows those methods to be quite distinct geographically.
When attempting to compare these methods numerically, there are clearly challenges that reinforce the suggestion that like-for-like comparisons for EPC methods across Europe will always be limited. This raises further questions, particularly when designing new innovations and metrics for future EPCs, around what harmonisation is desirable in EPCs (as governed by the EPBD), and what is feasible with the EPC frameworks currently in use across Europe.

7. Conclusions

This study has carried out a comparative exercise of chosen EPC methodologies in Europe based on (i) a bottom-up understanding of the EPC frameworks themselves and how they can be categorised, (ii) the ability of a given EPC approach to reflect some form of reality, and (iii) an indication of differences in outputs when applying multiple EPC frameworks to the same building.
The work catalogues the differences of EPC assessments and, in doing so, proposes future classes of EPCs that are distinguished by given criteria. The extent of these differences suggests that EPCs cannot be thought of as consistent, Europe-wide documents that are transmutable by location. The Performance Gap of such methods is presented as one way of quantifying the differences in numerical performance of EPC methodologies, albeit with several caveats relating to how empirically accurate EPCs should be expected to be. This illustrates that the quantitative gap with real energy data varies with EPC, but also that the metric for making this comparison is inconsistent in its definition.
Furthermore, through the use of case-study buildings and to generate quantitative comparative output, the presented research demonstrates a replicable procedure for comparing EPC methods from different (but climatically similar) countries. The results suggest some level of similarity in output (for such aligned countries), but in a way that may hide the significant differences in the generation of such outputs.
In totality, the paper presents a diverse set of EPC methods that are likely to require different implementation approaches as and when current ambitions for EPCs evolve, accounting for the proposals of next-generation EPCs. Likewise, this work suggests that there will be limits to how harmonised EPCs can, and should, be across European countries.

Author Contributions

Conceptualization, D.P.J. and N.F.; methodology, M.S., D.P.J. and A.G.; formal analysis, M.S. and A.G.; investigation, D.P.J. and M.S.; writing—original draft preparation, D.P.J. and M.S.; writing—review and editing, D.P.J., M.S., A.G. and N.F.; project administration, N.F. and A.G.; funding acquisition, N.F. All authors have read and agreed to the published version of the manuscript.

Funding

This research was funded by EU Horizon2020 grant number 101033778 and the APC was waived by the journal.

Data Availability Statement

All supporting data, including building case-studies and review documents, can be found at the crossCert project Knowledge Exchange Centre https://crosscert.unizar.es/.

Acknowledgments

The work described in this paper has been funded through the Horizon2020 project crossCert (Grant 101033778).

Conflicts of Interest

The authors declare no conflict of interest.

References

  1. European Commission. Directive (EU) 2024/1275 of the European Parliament and of the Council of 24 April 2024 on the Energy Performance of Buildings (Recast); European Commission: Brussels, Belgium; Luxembourg, 2024. [Google Scholar]
  2. crossCert. crossCert Project Website. 2024. Available online: www.crosscert.eu (accessed on 31 July 2024).
  3. OIB. OIB Guidelines|OIB. 2019. Available online: https://www.oib.or.at/en/oib-guidelines (accessed on 5 February 2024).
  4. Bulgarian Ministry of Regional Development and Public Work. Ordinance No. 7 for the Energy Efficiency of Buildings; SG No. 93; Bulgarian Ministry of Regional Development and Public Work: Sofia, Bulgaria, 2017. [Google Scholar]
  5. Stapic, Z.; Mijac, M.; Dzeko, M.; Primorac, J.; Tudjan, M.; Bagaric, T.; Jedjud, D. Korisnička Dokumentacija za Rad u Računalnom Programu MGIPU Energetski Certifikator; Sveuculiste u Zagrebu: Zagreb, Croatia, 2017. [Google Scholar]
  6. Danish Energy Agency. Håndbog for Energikonsulenter (HB2021); Danish Energy Agency: Copenhagen, Denmark, 2021.
  7. Technical Chamber of Greece. Detailed National Parameter Specifications for the Calculation of the Energy Performance of Buildings and the Issuance of the Energy Performance Certificate; Technical Chamber of Greece: Athens, Greece, 2017. [Google Scholar]
  8. BRE. Appendix S: Reduced Data SAP for Existing Dwellings; BRE: Hertfordshire, UK, 2012; Available online: https://www.bre.co.uk/filelibrary/SAP/2012/RdSAP-9.93/RdSAP_2012_9.93.pdf (accessed on 10 September 2024).
  9. Rozporządzenie Ministra Infrastruktury I Rozwoju. Sprawie Metodologii Wyznaczania Charakterystyki Energetycznej Budynku Lub Części Budynku Oraz Świadectw Charakterystyki Energetycznej. 2015. Available online: https://eli.gov.pl/eli/DU/2015/376/ogl (accessed on 10 September 2024).
  10. PIS. Rulebook on the Methodology for Producing and Issuing Energy Certificates for Buildings (Official Gazette of the Republic of Slovenia); PIS: Ljubljana, Slovenia, 2014. [Google Scholar]
  11. IETcc-CSIC. Condiciones Técnicas de los Procedimientos para la Evaluación de la Eficiencia Energética; IETcc-CSIC: Madrid, Spain, 2019. [Google Scholar]
  12. BRE. Standard Assessment Procedure (SAP 10); BRE: Hertfordshire, UK, 2019. Available online: https://www.bregroup.com/sap/sap10/ (accessed on 4 August 2024).
  13. Gokarakonda, S.; Venjakob, M.; Thomas, S. Report on Local EPC Situation and Cross-Country Comparison Matrix; European Commission: Brussels, Belgium; Luxembourg, 2020. [Google Scholar]
  14. JJH Associates. DOE2—Website. Published 2024. Available online: https://www.doe2.com (accessed on 1 August 2024).
  15. EDSL. TAS Engineering Website. Published 2024. Available online: https://www.edsl.net/tas-engineering/ (accessed on 1 August 2024).
  16. TRNSYS. TRNSYS Tool Website. 2024. Available online: https://www.trnsys.com/ (accessed on 1 August 2024).
  17. NREL. EnergyPlus Website. 2024. Available online: https://energyplus.net/ (accessed on 1 August 2024).
  18. UK Government. Green Deal Assessment Mystery Shopping Research; Department of Energy and Climate Change: Whitehall Place, UK, 2014. Available online: https://www.gov.uk/government/publications/green-deal-assessment-mystery-shopping-research (accessed on 30 June 2020).
  19. D2EPC. D2EPC Manual; European Commission: Brussels, Belgium; Luxembourg, 2022; Available online: https://www.d2epc.eu/en/Project%20Results%20%20Documents/D5.1.pdf (accessed on 4 August 2024).
  20. UK Government. Display Energy Certificates and Advisory Reports for Public Buildings; UK Government: London, UK, 2015. Available online: https://www.gov.uk/government/publications/display-energy-certificates-and-advisory-reports-for-public-buildings (accessed on 15 November 2023).
  21. BRE. Simplified Building Energy Model—iSBEM download; BRE: Hertfordshire, UK, 2024. Available online: https://www.uk-ncm.org.uk/disclaimer.jsp (accessed on 1 August 2024).
  22. Products Characteristics Database. Building Energy Performance Assessment—Support Website: SAP Appendix Q Database. 2020. Available online: https://www.ncm-pcdb.org.uk/sap/page.jsp?id=18 (accessed on 2 July 2020).
  23. Jenkins, D.; Sayfikar, M. Investigating the Relationship between Energy Assessor Training and Assessment Methodology in Standardised Energy Assessments in Europe. In Proceedings of the 18th IBPSA Conference on Building Simulation, Shanghai, China, 4–6 September 2023. [Google Scholar]
  24. Sayfikar, M.; Jenkins, D. CrossCert Project Deliverable 3.1—Review of Approaches to EPC Assessment across Chosen Member States; European Commission: Brussels, Belgium; Luxembourg, 2023; Available online: https://www.crosscert.eu/fileadmin/user_upload/crossCert_D3.1_Review_of_approaches_to_EPC_assessment_v4.4.pdf (accessed on 5 February 2024).
  25. de Wilde, P. The gap between predicted and measured energy performance of buildings: A framework for investigation. Autom. Constr. 2014, 41, 40–49. [Google Scholar] [CrossRef]
  26. Fueyo, N.; Herrando, M.; Gomez, A. CrossCert Project Deliverable 2.4—EPC Cross-Testing Procedure; European Commission: Brussels, Belgium; Luxembourg, 2022. [Google Scholar]
  27. International Organisation for Standardisation (ISO). ISO—ISO 3166—Country Codes; ISO: Geneva, Switzerland, 2020; Available online: https://www.iso.org/iso-3166-country-codes.html (accessed on 16 November 2021).
  28. MacQueen, J. Some methods for classification and analysis of multivariate observations. In Proceedings of the Fifth Berkeley Symposium on Mathematical Statistics and Probability, Volume 1: Statistics; University of California Press: Oakland, CA, USA, 1967; pp. 281–297. Available online: https://projecteuclid.org/euclid.bsmsp/1200512992 (accessed on 4 August 2024).
  29. Jenkins, D.; McCallum, P.; Patidar, S.; Semple, S. Accommodating new calculation approaches in next-generation energy performance assessments. J. Build. Perform. Simul. 2024, 17, 1–16. [Google Scholar] [CrossRef]
Figure 1. Performance Gap variations for the case study buildings.
Buildings 14 02906 g001
Figure 2. Comparison of the Performance Gaps across crossCert countries.
Buildings 14 02906 g002
Figure 3. Relationship between the Performance Gap and the general methodology approach.
Buildings 14 02906 g003
Figure 4. Building clustering according to the Heating Degree Days, Cooling Degree Days, and annual global horizontal irradiation [26].
Buildings 14 02906 g004
Figure 5. Summary of cross-testing results: energy labels with “native” vs. “foreign” EPC protocols.
Buildings 14 02906 g005
Figure 6. Sample building EPC energy demand (kWh/m2) by foreign and native assessment.
Buildings 14 02906 g006
Table 1. Overview of input assumptions across different European EPC methodologies [23].
HVAC SchedulesHVAC Spec.Lighting and Equipment SchedulesOccupancyConstruction Thermal ParametersVentilation RatesInfiltration RateSetpoints
AustriaDefault based on building typeDefault values availableDefault valuesDefault valuesDatabase availableDatabase availableDefault values availableFixed
BulgariaAssessorActual valuesAssessorAssessorDatabase availableMeasurement/assessor’s knowledgeMeasurement/assessor’s knowledgeAssessor
DenmarkAssessorDefault values availableDefault valuesDefault valuesDatabase availableDatabase availableDefault values availableDepends on use type/
activitylevel/
control
GreeceDefault based on zone activity typeDefault values availableDefault valuesDefault valuesDatabase availableDatabase availableDefault values availableDepends on use type/
activity level/
control
MaltaDefault based on zone activity typeDefault values available for some building categoriesDefault valuesDefault valuesDatabase available/
Inference based
Database availableDefault values availableDepends on use type/
activity level/
control
PolandAssessorDefault values availableDefault values or assessorAssessorDatabase available but outdatedDatabase availableDefault values availableDepends on use type/
activity level/
control
SloveniaDefault based on zone activity typeActual valuesDefault valuesDefault values or assessorDatabase availableDatabase availableMeasurement/assessor’s knowledgeDepends on use type/
activity level/
control
SpainDefault based on building typeActual valuesDefault valuesDefault valuesDatabase available/
Inference based
Database availableDefault values availableFixed
UKDefault based on zone activity typeDefault values available for some building categoriesDefault valuesDefault valuesDatabase available/
Inference based
Database availableDefault values available for some buildingsDepends on use type/
activity level/
control
Table 2. Categories of assessment methodologies.
Standardisation LevelBasis of EPC MetricRating Type
LowTotal primary energyCalibrated asset rating
MediumHeating energyOperational rating and asset rating
HighCostOnly asset rating
Table 3. Categorisation of methodologies applied to chosen countries.
CountryStandardisation LevelBasis Of EPC MetricRating Type
BulgariaLowTotal primary energyCalibrated asset rating
PolandLowTotal primary energyOperational rating and asset rating
SloveniaLowHeating energyOperational rating and asset rating
CroatiaMediumHeating energyOnly asset rating
DenmarkMediumHeating energyOperational rating and asset rating
SpainMediumTotal primary energyOnly asset rating
GreeceMediumTotal primary energyOnly asset rating
MaltaHighTotal primary energyOnly asset rating
AustriaHighHeating energyOnly asset rating
UKHighCostOnly asset rating
Table 4. Measured and calculated annual energy consumption on EPC certificates for the case study buildings.
CodeMeasured Total Final Energy Consumption (kWh/m2/year)EPC Final Energy Consumption (kWh/m2/year)CountryCodeMeasured Total Final Energy Consumption (kWh/m2/year)EPC Final Energy Consumption (kWh/m2/year)Country
GR100207.8183.8GreeceESR5189.6395.9Spain
GR101170.4124.5GreeceHR-3103.855.5Croatia
GR102194.2222.4GreeceHR-672.677.3Croatia
GR103232621.9GreeceHR-1045.3154.9Croatia
GR10445.286.7GreeceHR-1186.849.2Croatia
GR10567.440GreeceHR-12148192.4Croatia
GR10687310.7GreeceHR-20183.180.3Croatia
GR10728.3271.5GreecePL-23128Poland
GR108198.3154.1GreeceMT-015533.5Malta
DK3 160.2162.5DenmarkMT-1030.4108.5Malta
DK5 68.988.6DenmarkMT-0326.3114.9Malta
DK11 104.8128.6DenmarkMT-1247.892.8Malta
DK12 97.4122.8DenmarkSI-137111Slovenia
DK13 57.975.3DenmarkSI-2145305Slovenia
DK14 114.174.4DenmarkSI-3133116Slovenia
DK15 120.4119.5DenmarkSI-4313362Slovenia
DK16 85.5134.9DenmarkSI-79587Slovenia
DK17 125.4102.8DenmarkUK1137265.9UK
DK18 59.958.3DenmarkUK23292.3UK
DK201 142.4115.6DenmarkUK4 51.419.9UK
DK21 124.2109.5DenmarkUK22140151UK
DK22 114.6128.3DenmarkUK23247.44346UK
DK23 92.3140.8DenmarkBG08187.01147.2Bulgaria
DK24 34.971.1DenmarkBG157.41159.8Bulgaria
ES0170.8645.2SpainBG260.3987.8Bulgaria
ES0231.1742.3SpainBG386.99159.9Bulgaria
ES03132.4162.3SpainBG4321.95131.7Bulgaria
ES13114.69315.7SpainBG514.77127.4Bulgaria
ES1565.5109.8SpainBG698.36208.5Bulgaria
ES178.0330.6SpainBG733.9434.2Bulgaria
ESR274.22134.1SpainBG964.8583.9Bulgaria
ESR3152.57439.2SpainBG1028.88210.3Bulgaria
ESR4170.29443.7Spain
Table 5. Buildings in each climatic cluster.
CountryCluster 0Cluster 1Cluster 2Cluster 3Cluster 4
AT—AustriaAT1-AT7, AT10 AT8, AT9
BG—BulgariaBG1, BG3-BG10 BG2
DK—Denmark DK1-DK10
ES—SpainES3, ES4, ES7, ES8, ES9, ES10, ES12, ES14, ES16 ES1, ES2, ES5, ES6, ES11, ES13, ES15, ES17
GR—GreeceGR11, GR15GR3, GR4, GR7, GR9, GR10, GR12, GR14, GR17, GR18, GR20 GR6, GR16GR1, GR2, GR5, GR8, GR13, GR19
HR—CroatiaHR2, HR4, HR5, HR11-HR22 HR1, HR3, HR6, HR7, HR8, HR9, HR10
MT—Malta MT1-MT12
PL-Poland PL1-PL15
SI—SloveniaSL1-SL10
UK—United KingdomUK1-UK3 UK4-UK22
Disclaimer/Publisher’s Note: The statements, opinions and data contained in all publications are solely those of the individual author(s) and contributor(s) and not of MDPI and/or the editor(s). MDPI and/or the editor(s) disclaim responsibility for any injury to people or property resulting from any ideas, methods, instructions or products referred to in the content.

