Article

Experimental and Numerical Study on the Performance of Steel–Coarse Aggregate Reactive Powder Concrete Composite Beams with Uplift-Restricted and Slip-Permitted Connectors under Negative Bending Moment

Department of Civil Engineering, Tsinghua University, Beijing 100084, China
*
Author to whom correspondence should be addressed.
Buildings 2024, 14(9), 2913; https://doi.org/10.3390/buildings14092913
Submission received: 19 August 2024 / Revised: 12 September 2024 / Accepted: 13 September 2024 / Published: 14 September 2024
(This article belongs to the Special Issue High-Performance Steel–Concrete Composite/Hybrid Structures)

Abstract

:
An innovative form of steel–concrete composite beam, the steel–coarse aggregate reactive powder concrete (CA-RPC) composite beam with uplift-restricted and slip-permitted (URSP) connectors, is introduced in this paper. The aim is to enhance the cracking resistance under negative bending moments, which is a difficult problem for traditional composite beams, and to make the cost lower than using ordinary reactive powder concrete (RPC). An experimental investigation of the behavior of six specimens of simply supported steel–CA-RPC composite beams with URSP connectors under negative bending moments is presented in this paper. The test results validated that the cracking load of steel–CA-RPC composite beams could be approximately three times that of the ordinary steel–concrete composite beams while the bearing capacity and stiffness are almost the same. A numerical model, using the concrete damaged plasticity (CDP) model to simulate the behavior of the CA-RPC material, was proposed and successfully calculated the overall load–displacement relationship of the composite beams with sufficient accuracy compared with the experimental results, and the distribution of cracks and the failure mode of the beams could also be captured by this model. Furthermore, a parametric analysis was carried out to find out how the application of prestress, CA-RPC, and URSP connectors could affect the cracking resistance of the composite beams, and the results indicated that using CA-RPC and prestress made the main contributions and that the usage of URSP could boost the effect of the other two factors. The plastic resistance moment of the beams was also compared with the calculation results using the methods introduced in Eurocode 4, and it was proved that the calculation results were lower than the experimental results by approximately 10%, which meant that the method was reliable for this kind of composite beam.

1. Introduction

Steel–concrete composite beams have been widely used in practice in the bridge industry due to their excellent mechanical properties, convenience of construction, and high economic efficiency [1].
Some existing studies have indicated that the cracking resistance of the ordinary type of steel–concrete composite beam under negative bending moments was insufficient [2,3,4]. In the research carried out by Su et al. [2], two specimens of steel–concrete composite box girder were tested under hogging moment, and the results indicated that the cracking load of the two beams were only 11.0% and 13.4% of their load-carrying capacity relatively. An experiment of a total of nine simply supported composite beams under negative bending moments was reported by Jiang et al. [3], and the results indicated that for every tested specimen, the first crack occurred at approximately 10–15% of failure load during the loading process. According to the study of Xu et al. [4], for the two specimens of ordinary steel–concrete composite tested under negative moment with ultimate loads of 143.7 kN and 161.0 kN, their cracking loads were only 21.1 kN and 26.0 kN, respectively. The ratios were, respectively, 14.7% and 16.1%. Therefore, under negative bending moments, the ordinary concrete slab of the composite beams is vulnerable to cracking due to high tensile stress in the concrete slab, which leads to a decline in the durability of the structure [5].
Increased thickness of the concrete slab and enhanced reinforcement are applied as ordinary measures to control the width of cracks within a safe threshold. However, these methods usually result in a sharp rise in the self-weight of the structure and construction cost, which may be unacceptable for engineering practice and obstruct the mass application of composite structures.
In order to improve the cracking resistance of steel–concrete composite beam, several alternative methods have been proposed, such as using ultra-high-performance concrete (UHPC) to increase the tensile strength of the concrete slab [4,6,7,8], applying prestress in the negative bending moment zone [9,10], and improving the connectors, which can reduce the tensile stress of the concrete slab [11,12,13,14,15].
This paper introduced an innovative form of steel–concrete composite beam, named the steel–coarse aggregate reactive powder concrete (CA-RPC) composite beam with uplifting-restricted slip-permitted (URSP) connectors, containing two leading-edge components, CA-PRC [16], and URSP connectors [11], which was expected to have high cracking-resisting performance under hogging moment combined with the application of prestress.
CA-RPC is a kind of high-performance concrete with a high modulus of elasticity, high cracking strength, low total shrinkage, and low creep [16,17]. Unlike ordinary RPC, which requires steam curing to achieve high performance [18], CA-RPC can obtain excellent material performance through conventional curing. Due to the addition of coarse aggregate components, its cost of manufacture is greatly reduced, and shrinkage is easier to control, which makes it suitable for large-scale application in the bridge industry [19].
The concept of URSP connectors is to eliminate the shear resistance of the connectors while maintaining the uplift resistance, which allows the steel–concrete interface to slide freely without separation [10]. URSP connectors facilitate the release of tensile stress in the concrete slab so that its crack resistance can be greatly enhanced. The scheme of this type of connector is shown in Figure 1. Compared to ordinary studs, the material and installation methods are almost the same. The distinctive feature of URSP connectors is that they are wrapped with a material with a low elastic modulus, which can help release shear-resistant effects in any direction [12].
The purpose of this study is to investigate the overall mechanical performance of steel–CA-RPC composite beams with URSP connectors, as well as the crack resistance of the CA-RPC slab and the slip performance between steel and CA-RPC. Furthermore, corresponding modeling and calculation methods are proposed as a guideline for the design of this kind of composite beam in order to support actual engineering applications.

2. Experimental Program
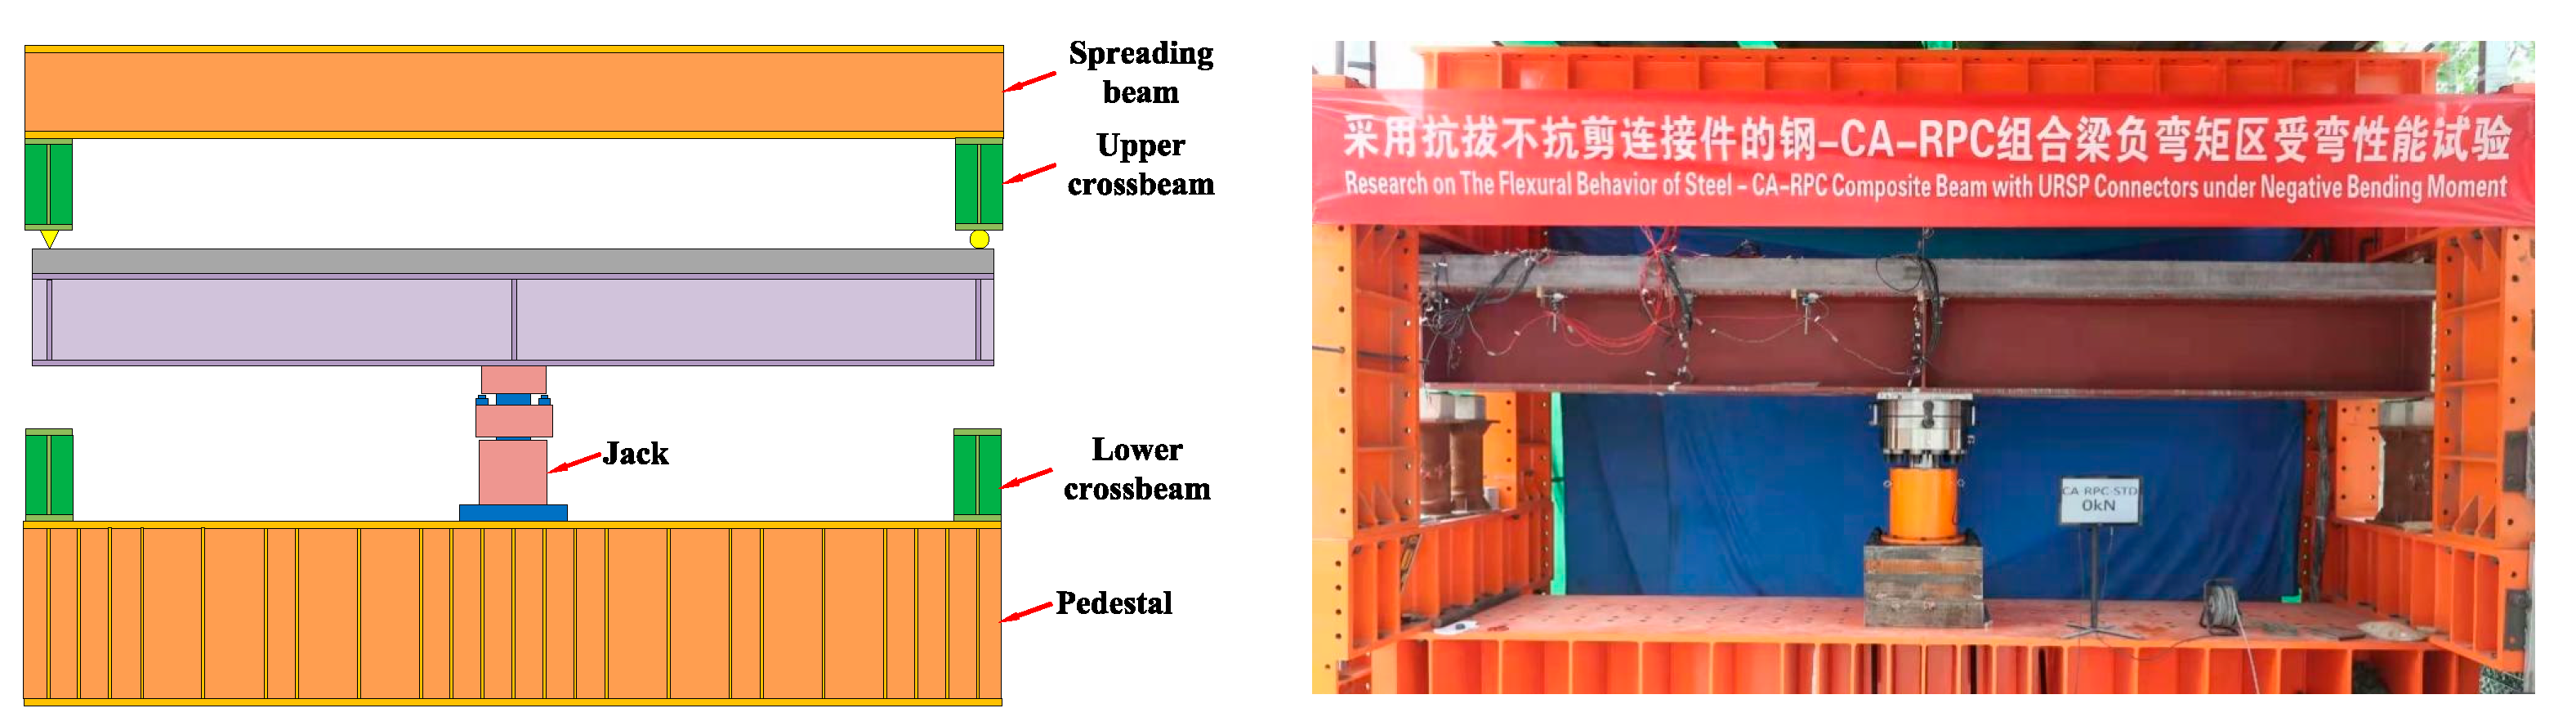
2.1. Test Setup

The specimens designed for this experiment were all simply supported beams under negative bending moments. The loading device for the experiment is shown in Figure 2. A self-balancing frame and a 500-ton jack were selected, with one end using a roller support and the other using a triangular support to ensure that the specimens were simply supported. To prevent stress concentration in certain parts of the steel beam during upward loading, stiffeners were set at the loading point and the position of support.
The loading process was divided into several stages, and the loading speed was controlled to prevent the specimens from brittle failure. In the early stages, loading was controlled by force, with each interval set at 50 kN. When the load reached 1/6 of the anticipated ultimate load (3000 kN), the load interval was adjusted to 100 kN. Crack-monitoring devices were used to measure the development of cracks during loading. Once a significant turning point in the load–deflection curve was observed, which meant the structure had entered the elastoplastic stage, loading was performed through displacement control until the structure failed.

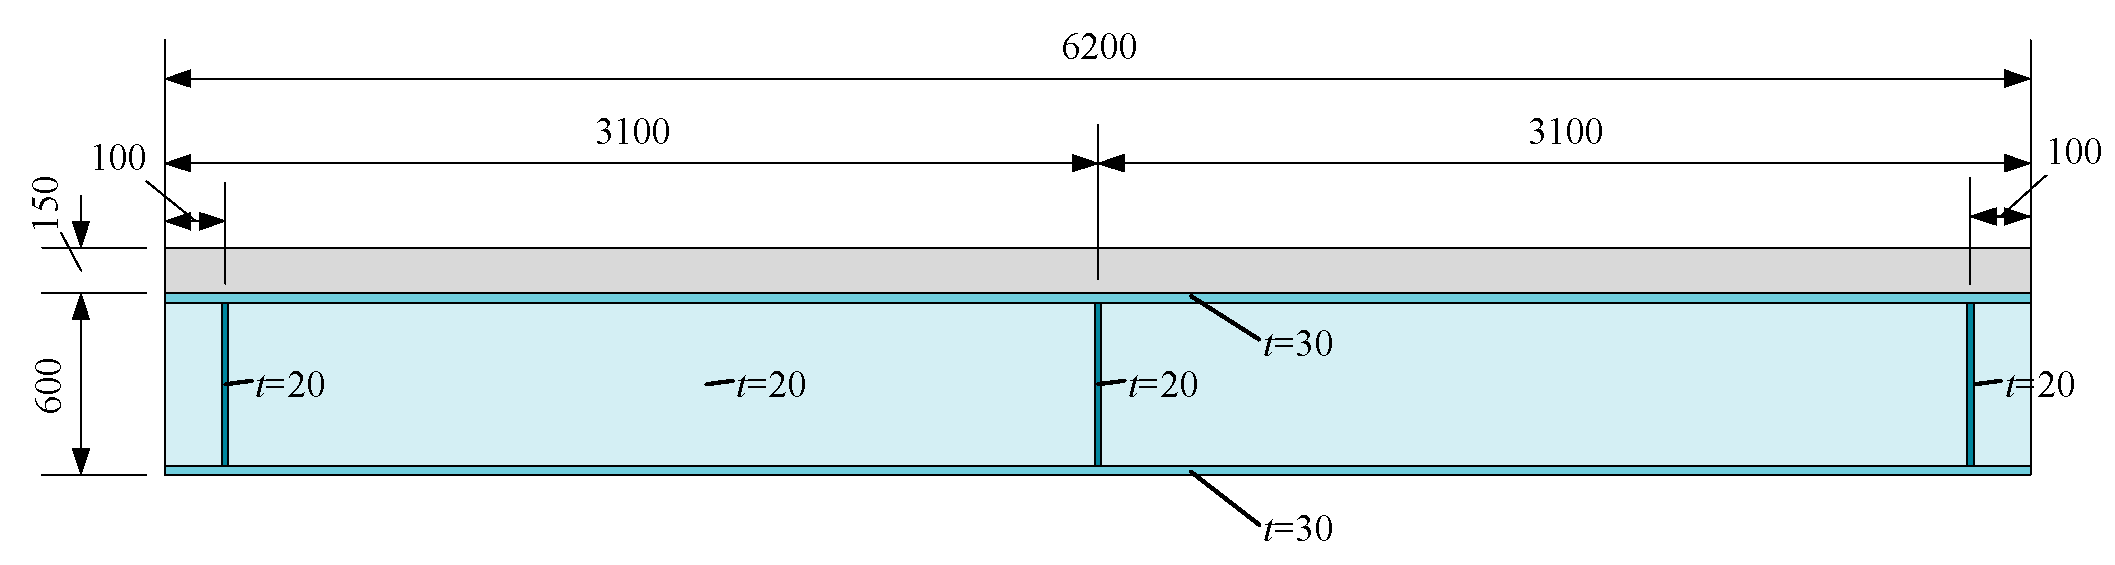
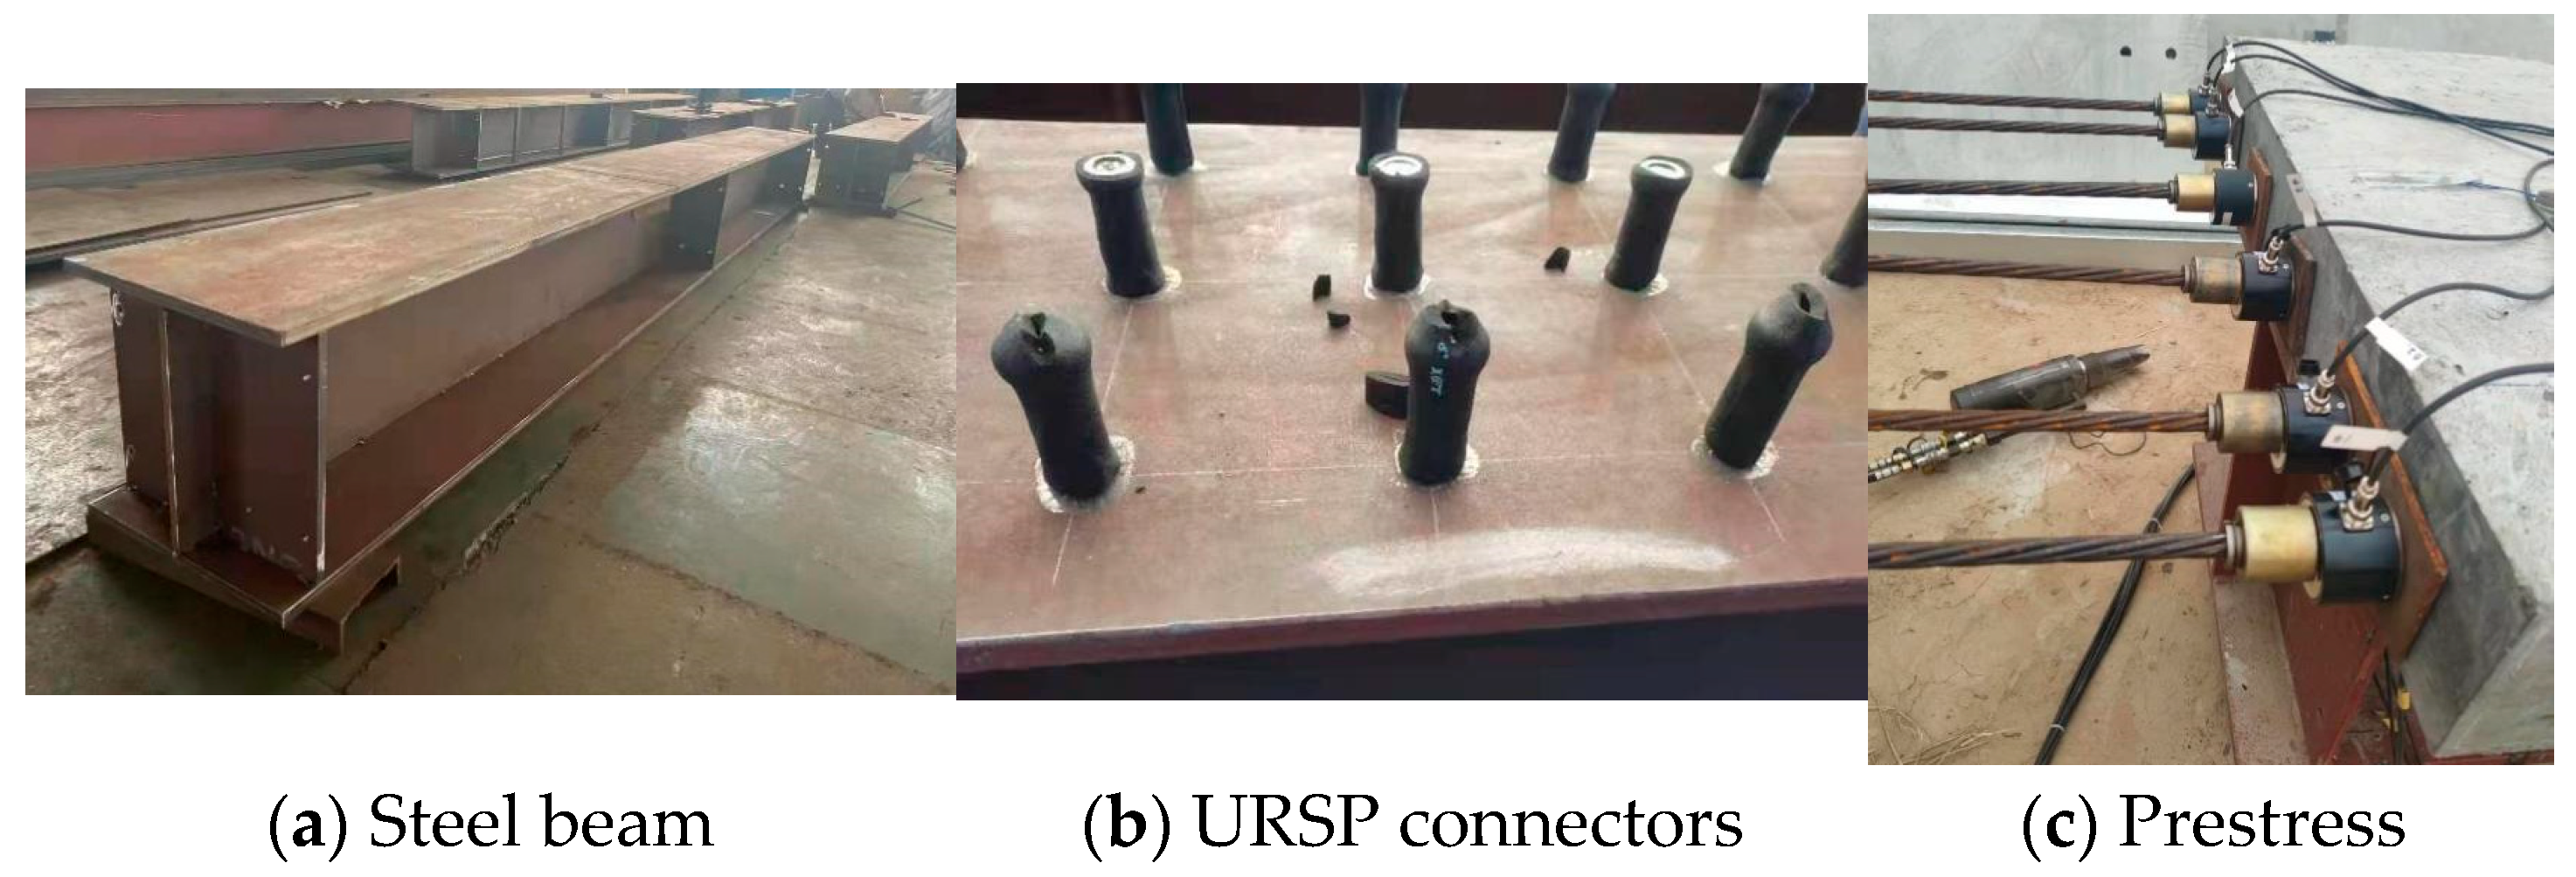
2.2. Specimens and Materials

A total of 6 sets of steel–CA-RPC composite beams were designed, named CA-RPC-STD, CA-RPC-SR, CA-RPC-NPS, CA-RPC-NNS, CA-RPC-ER, and C50-NPS. All specimens were single-span simply supported beams.
The details of all specimens are listed in Table 1. In the CA-RPC-SR specimen, ordinary studs with a diameter of 22 mm were used in the whole area of the interface between steel and concrete. In the CA-RPC-ER specimen, URSP connectors were welded in the central area of the interface, and M22 bolt connectors were set at the edge. The C50-NPS, CA-RPC-NNS, CA-RPC-NPS, and CA-RPC-STD specimens used URSP connectors throughout the full length of the interface. The main dimensions of the steel beams and the concrete flanges were kept consistent in all specimens, shown in Figure 3. Figure 4 displayed the process of the constructions of the specimens.
The design purposes of the specimens with different parameters were as follows:
(1)
The standard specimen CA-RPC-STD used a CA-RPC slab and applied a post-tensioning prestress of 900 kN with URSP connectors. The aim of the design was to observe the ultimate flexural capacity, flexural stiffness, relative slip between steel and concrete, and crack development in the concrete flange under negative bending moments. This specimen served as the standard for comparison with the other ones.
(2)
The specimen CA-RPC-SR used conventional studs at the interface between the steel beam and the concrete slab, while the other parameters were the same as the standard specimen. By comparing this specimen with CA-RPC-STD, the effect of URSP connectors on the mechanical performance of the beam was expected to be found.
(3)
The specimen CA-RPC-NPS removed the prestress, while the other parameters were the same as the standard specimen. By comparing this specimen with CA-RPC-STD, the effect of prestress on the mechanical performance of the beam was expected to be found.
(4)
In the specimen CA-RPC-NNS, a plastic film was set at the interface between the steel beam and the concrete slab to eliminate the bonding of the two materials, while the other parts were the same as the standard specimen. By comparing this specimen with CA-RPC-STD, the effect of bonding at the interface on the mechanical performance of the beam was expected to be found.
(5)
The specimen CA-RPC-ER also removed the prestress, and conventional studs were set at both ends of the beam instead of a part of URSP connectors. The only difference between this specimen and CA-RPC-NPS was that conventional bolt connectors were set at both ends of the beam instead of a part of URSP connectors in order to find out whether the URSP connector could still work well when the slip was restricted at both ends of the beam, which is an ordinary condition for continuous beams.
The specimen C50-NPS used ordinary C50 concrete slabs without prestress, which was to be compared with CA-RPC-NPS to find out how CA-RPC affected the performance of the composite beam.
The steel beams of each specimen were constructed by Q355. During the fabrication of the steel beams, specimens used for material property testing were retained. The results of the material property tests are presented in Table 2.
In all specimens, the type of both the longitudinal and transverse rebars were HRB400 with a diameter of 10 mm and a spacing of 100 mm. In the material property tests of rebar, the strain was measured by an extensometer. The results are presented in Table 3.
The CA-RPC material utilized in the experiment exhibited high strength; hence, cubic specimens with a side length of 100 mm were selected for the material property tests. The results for each group of concrete specimens are listed in Table 4.

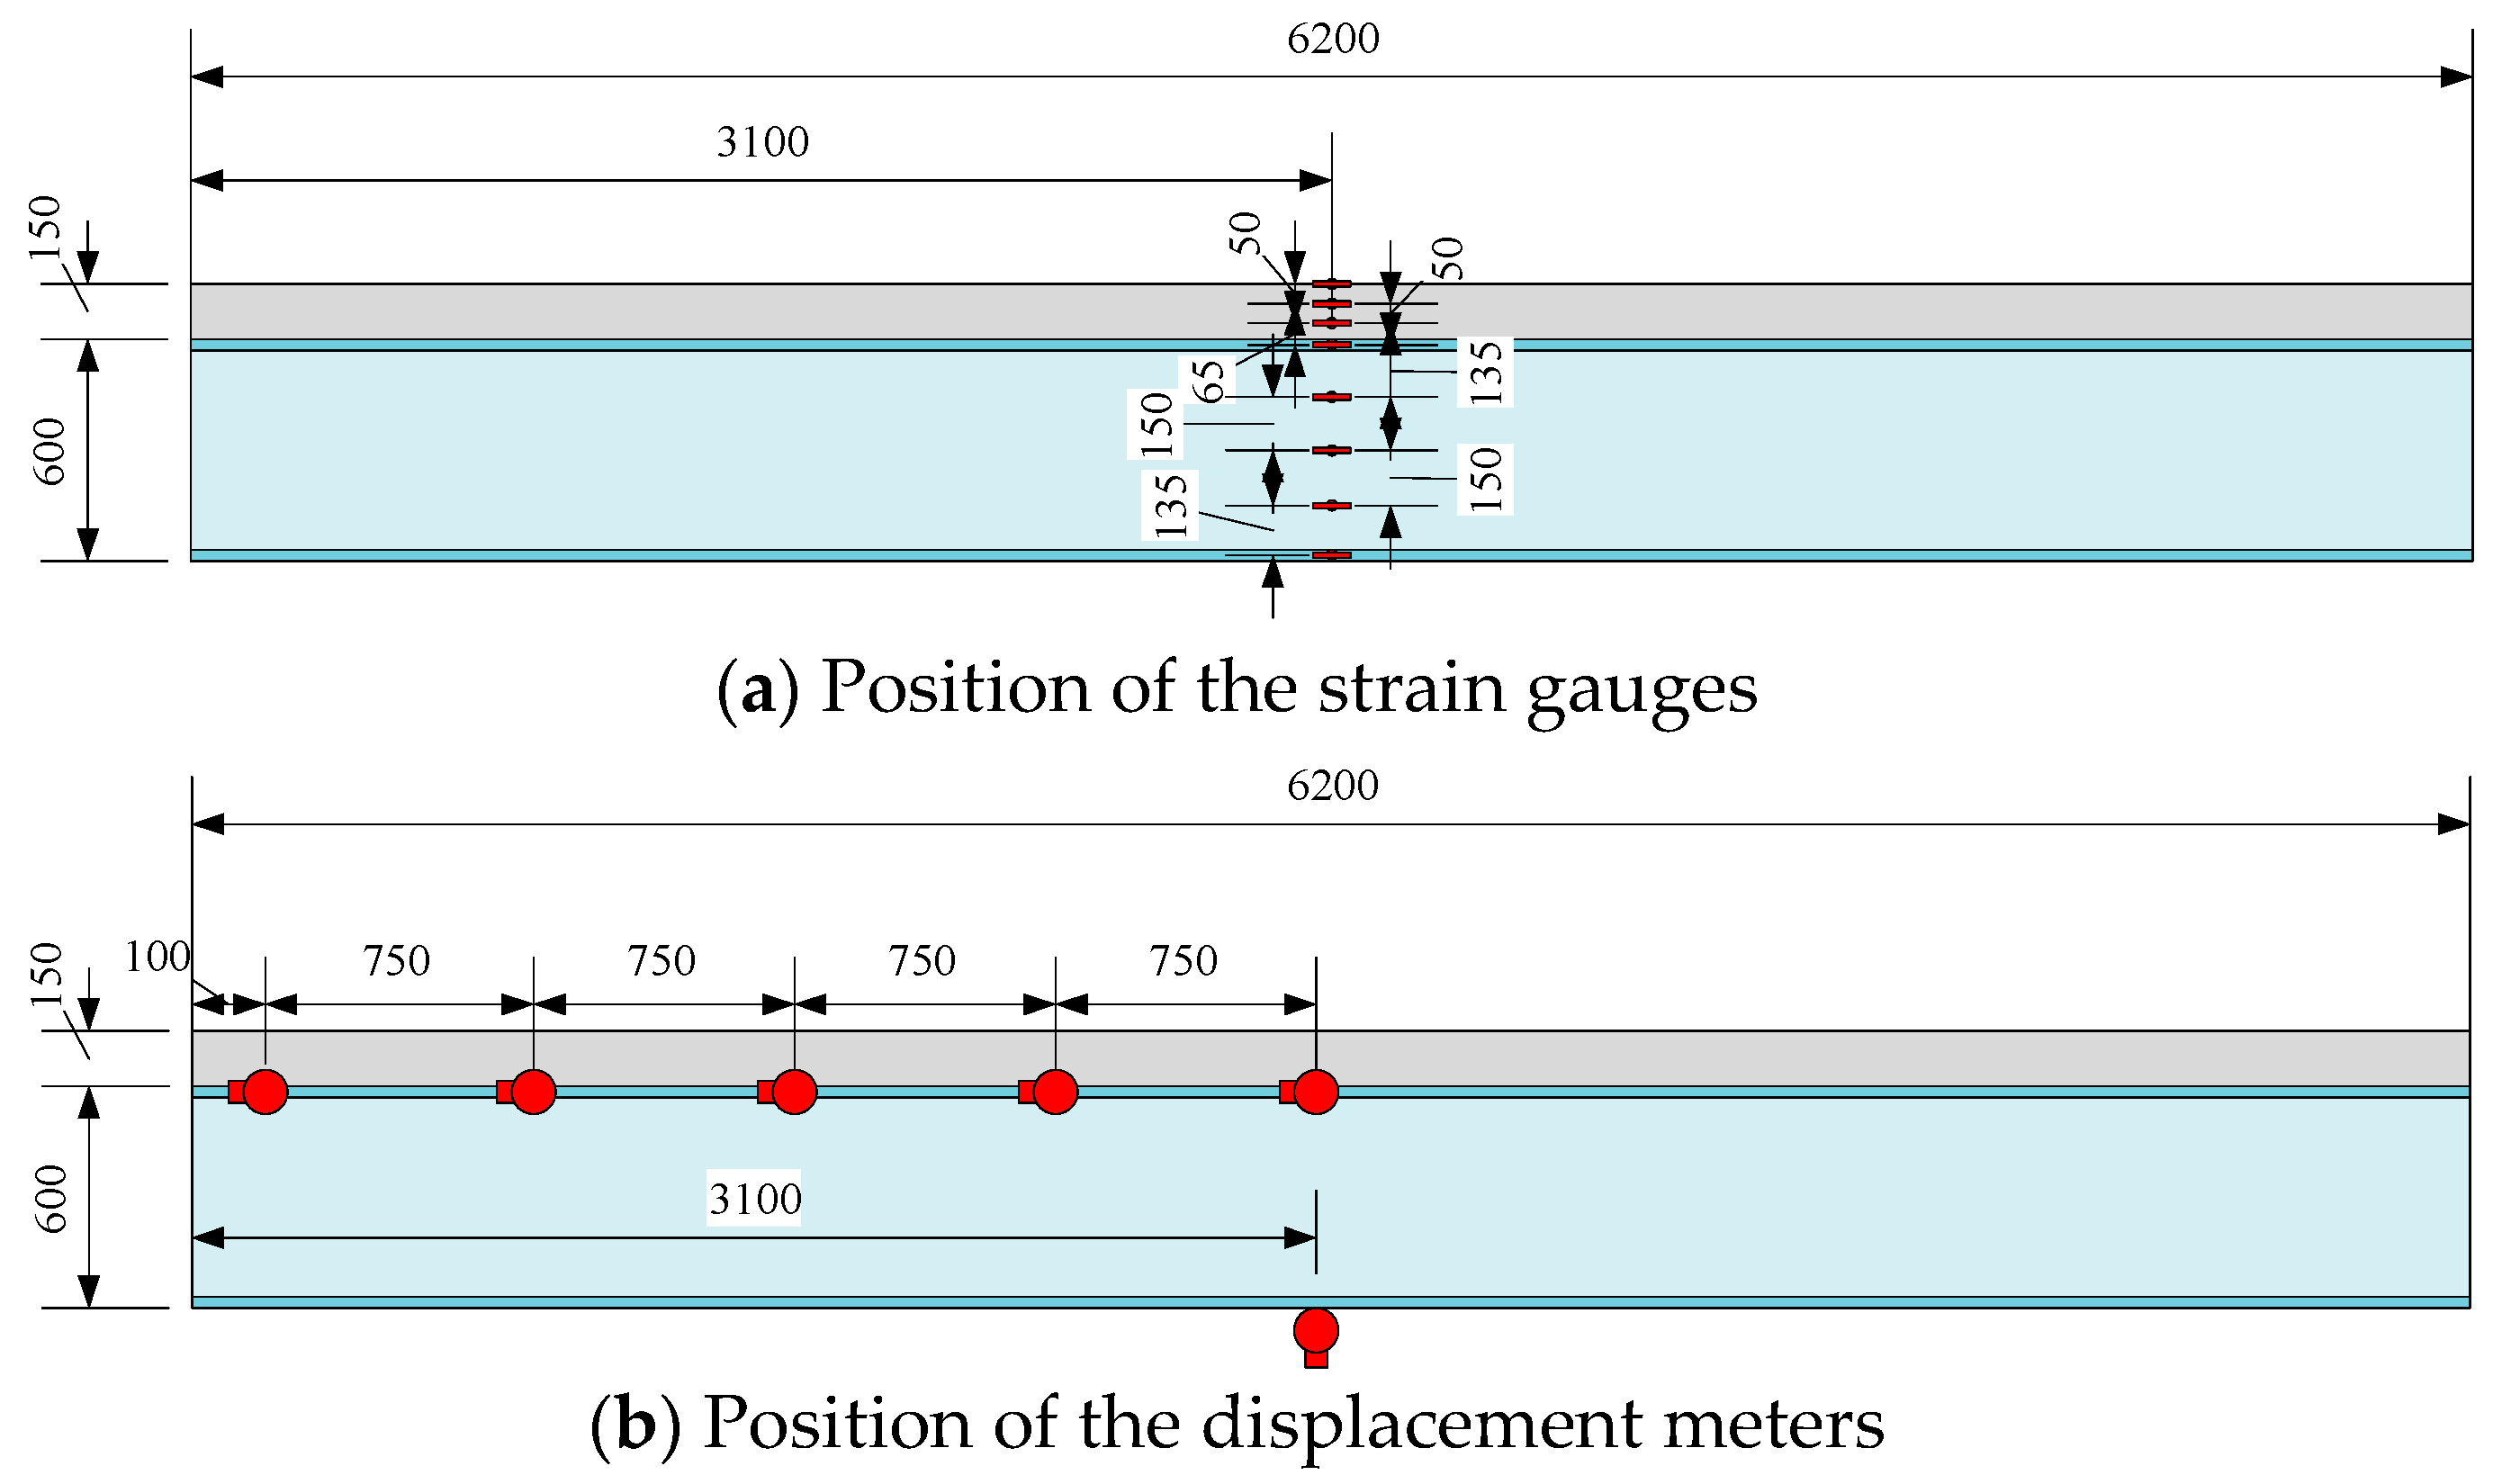
2.3. Measurement Device

In this experiment, all specimens were subjected to static loading. The data required to be measured and recorded during the test primarily fell into three categories: force, displacement, and strain. These three types of data were measured, respectively, by load cells, displacement meters, and strain gauges. The arrangement of the measurement points was led by the following rules, as shown in Figure 5:
(1)
A cross-section at the point of the maximum bending moment was selected to set the strain gauges. Additionally, a load cell was installed on the jack in order to monitor the magnitude of the applied load in real time.
(2)
A displacement meter was installed at the mid-span of the specimen to measure the deflection.
(3)
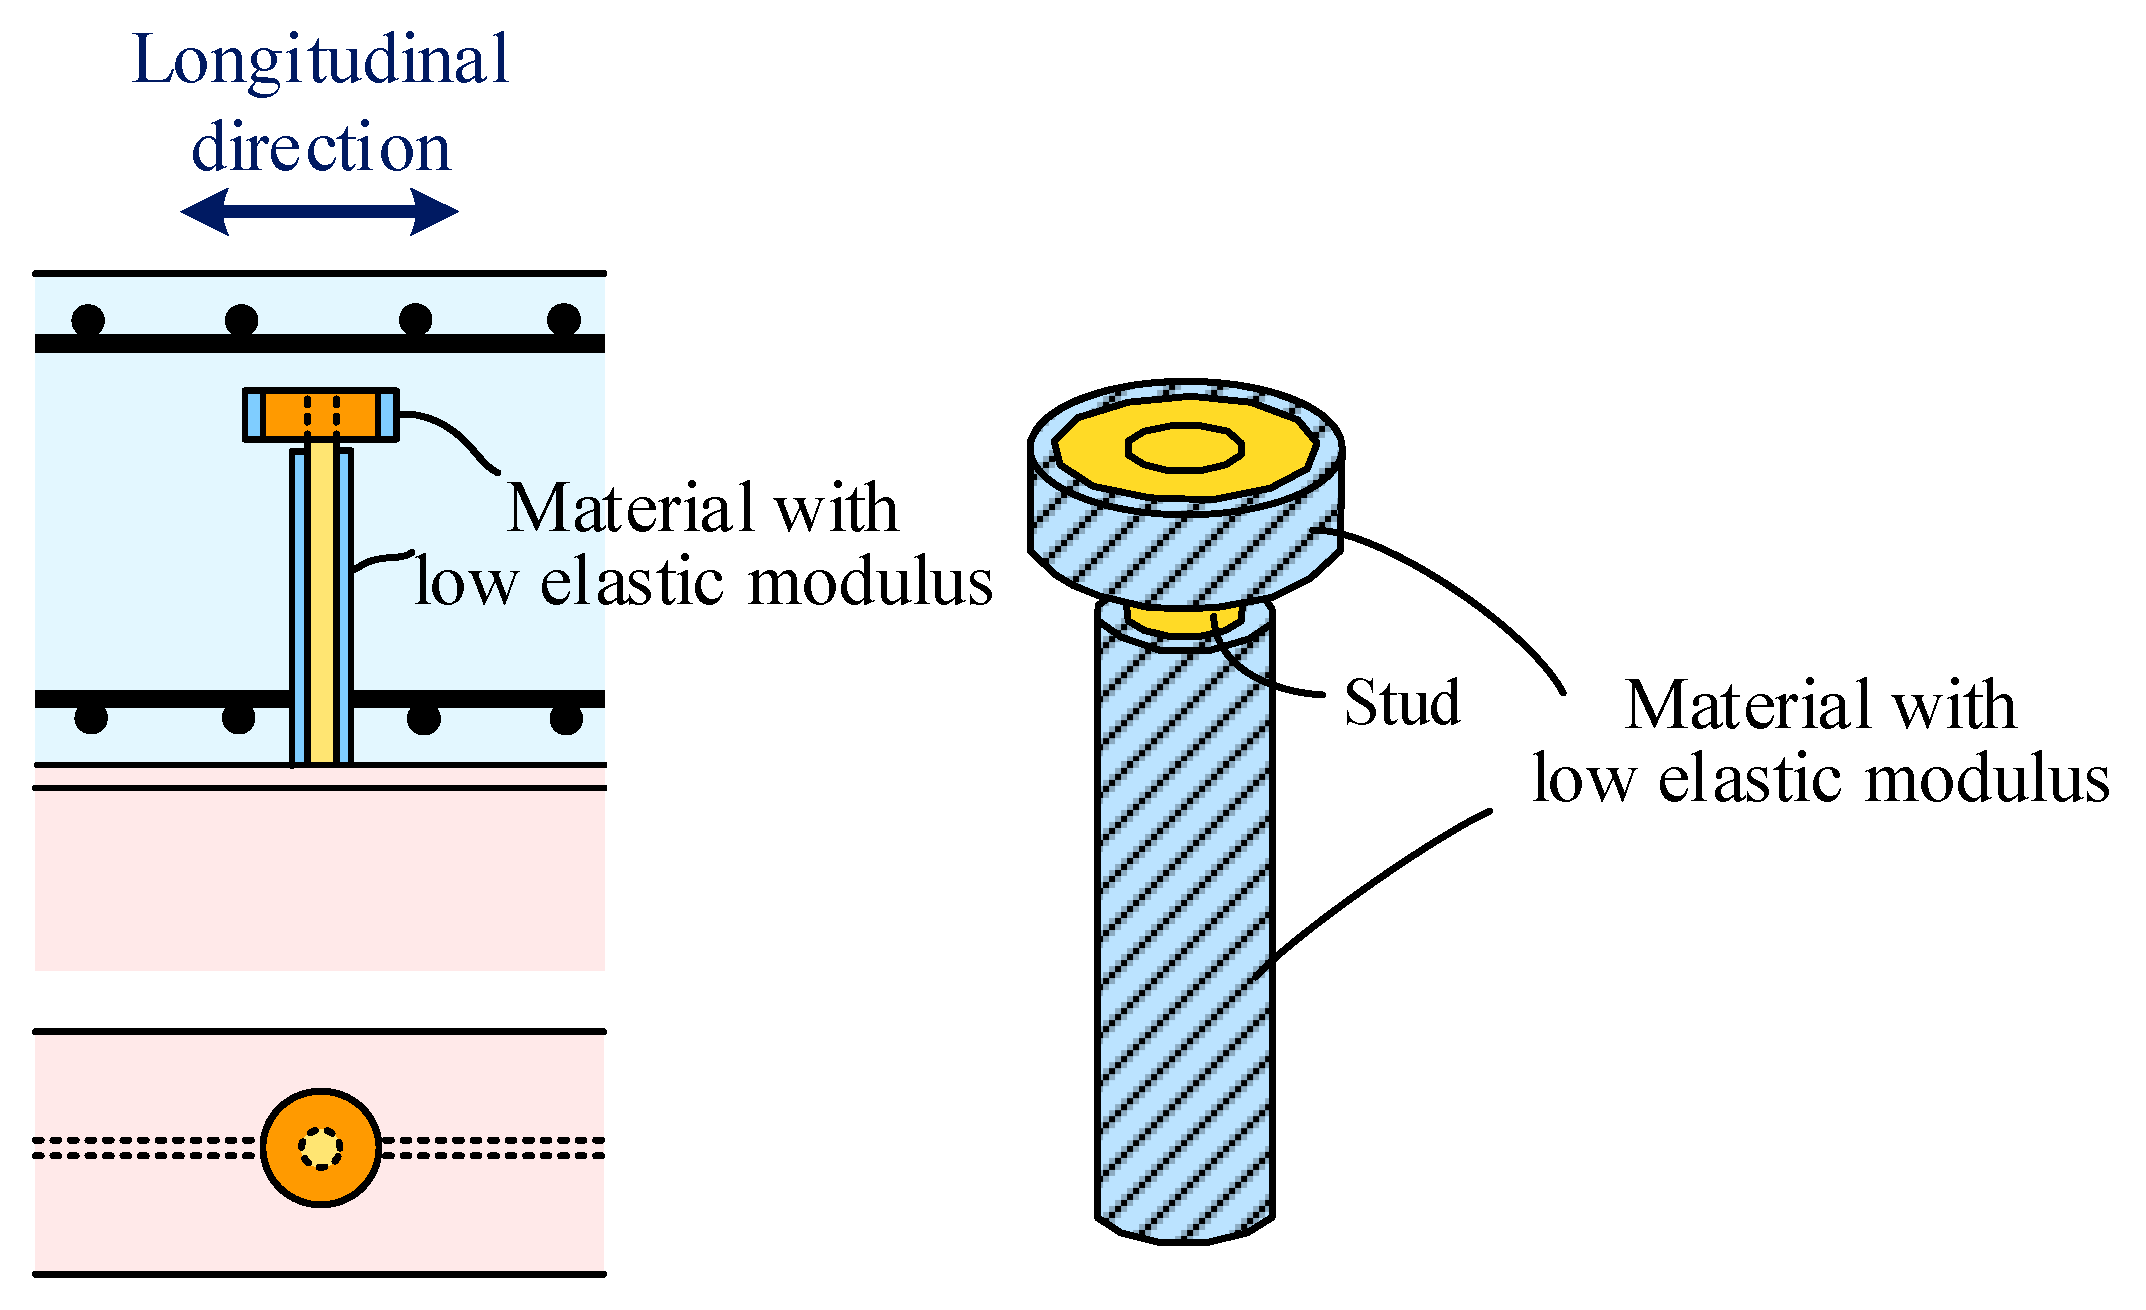
Several displacement meters were installed at the interface between the steel beam and the concrete slab along the longitudinal direction of the beam to measure the relative slip distribution.

3. Experimental Results

The phenomenon observed in the experiment of the various simply supported composite beam specimens under negative bending moments was relatively similar and could be divided into the following four stages: (1) elastic stage, at which the concrete slab surface exhibited no or only a few subtle cracks, and the load–displacement relationship was approximately linear; (2) yield stage, at which cracks began to develop significantly, and the load–displacement curve began to bend; (3) reaching the ultimate bearing capacity, the stage at which the specimen underwent significant deformation; and (4) buckling of the steel plates, the stage at which the reinforcement fractured and the bearing capacity gradually decreased.
When the specimens completely failed, the web and the lower flange of the steel beam at the mid-span exhibited significant local buckling, while notable separation from the concrete slab could be demonstrated at the interface of the upper flange of the steel beam and the concrete slab, as shown in Figure 6a,b. There was only a single critical crack that appeared on the surfaces of the CA-RPC slab at the mid-span location with a relatively large width, whereas cracks on the surface of the C50 slab were uniformly distributed with a certain interval within the central 1/2 span, as depicted in Figure 6c and Figure 6d, respectively.

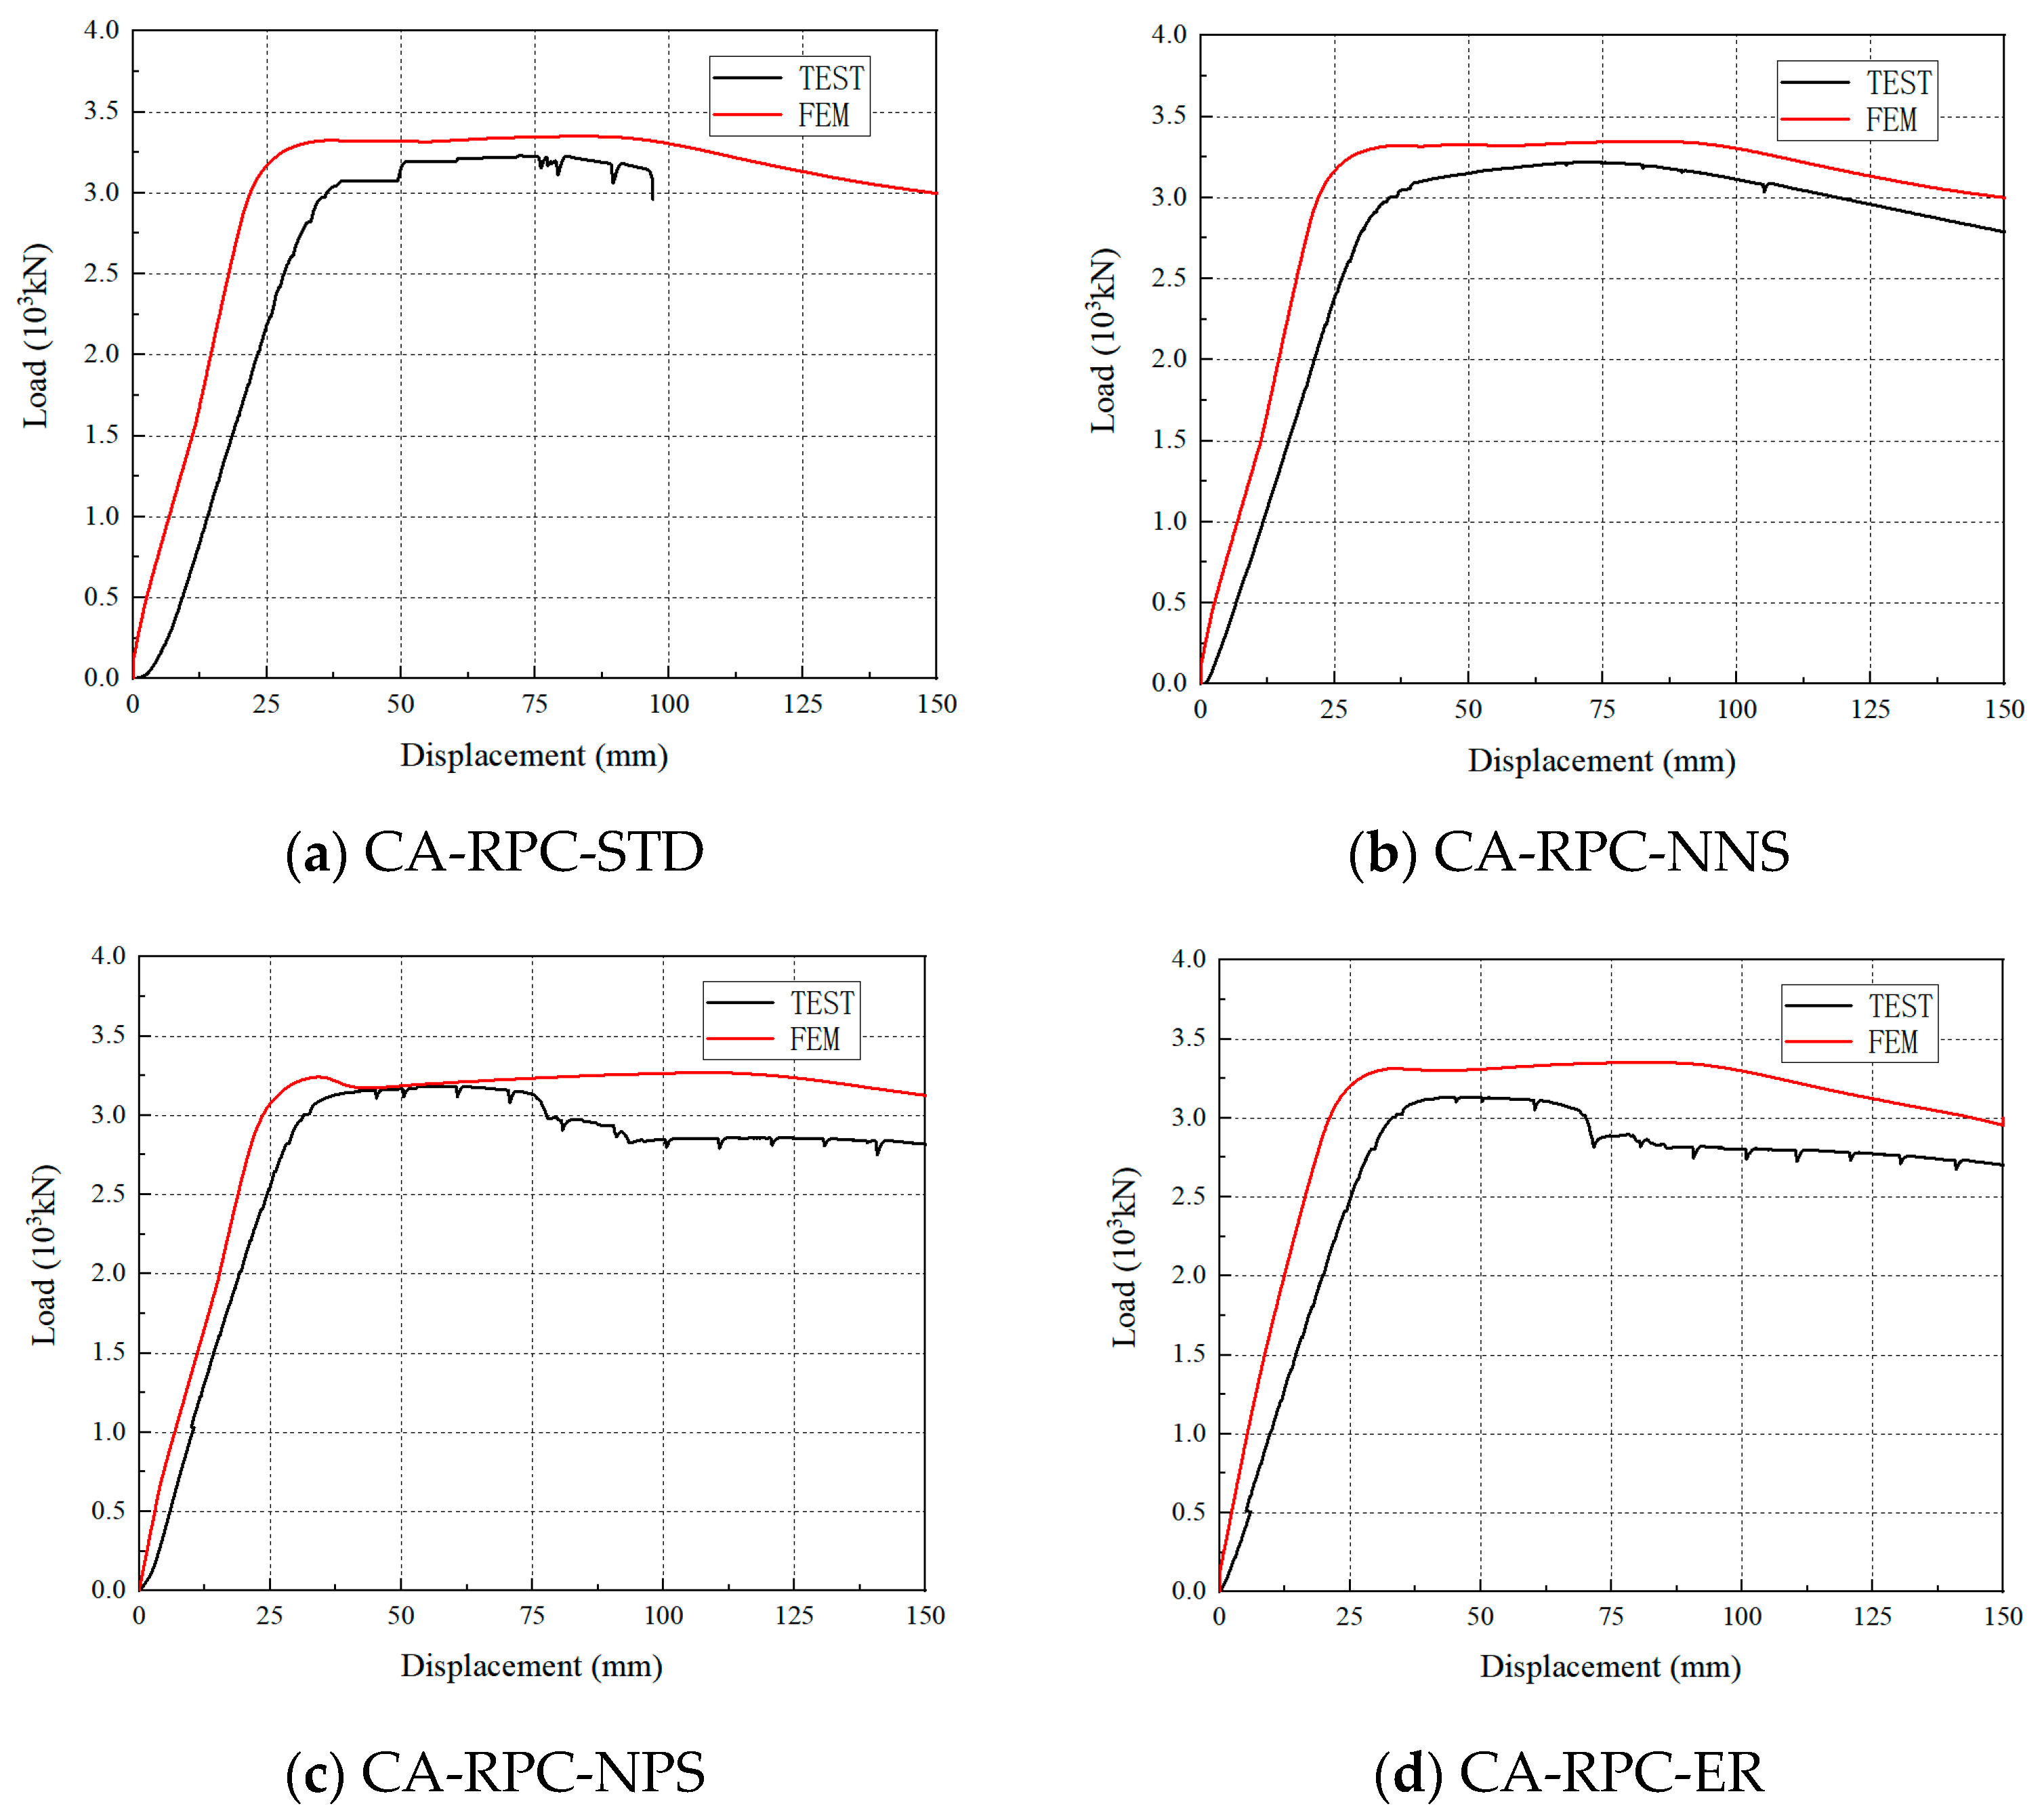
3.1. Force–Displacement Curves

The load–displacement curves of the six specimens are shown in Figure 7 and share the following common characteristics:
(1)
Elastic stage. The corresponding load of this stage is approximately 0 to 0.85 Pu. The load–displacement curve is approximately linear, and the overall stiffness remains essentially constant in this stage.
(2)
Elastoplastic stage. The corresponding load of this stage is approximately 0.85 to 1.0 Pu. After reaching the yield load (approximately 0.85 Pu), the overall stiffness of the specimen rapidly decreases to nearly zero, and the load–displacement curve enters a plastic plateau. The longitudinal tensile reinforcement and the lower flange of the steel beam yield almost at the same time.
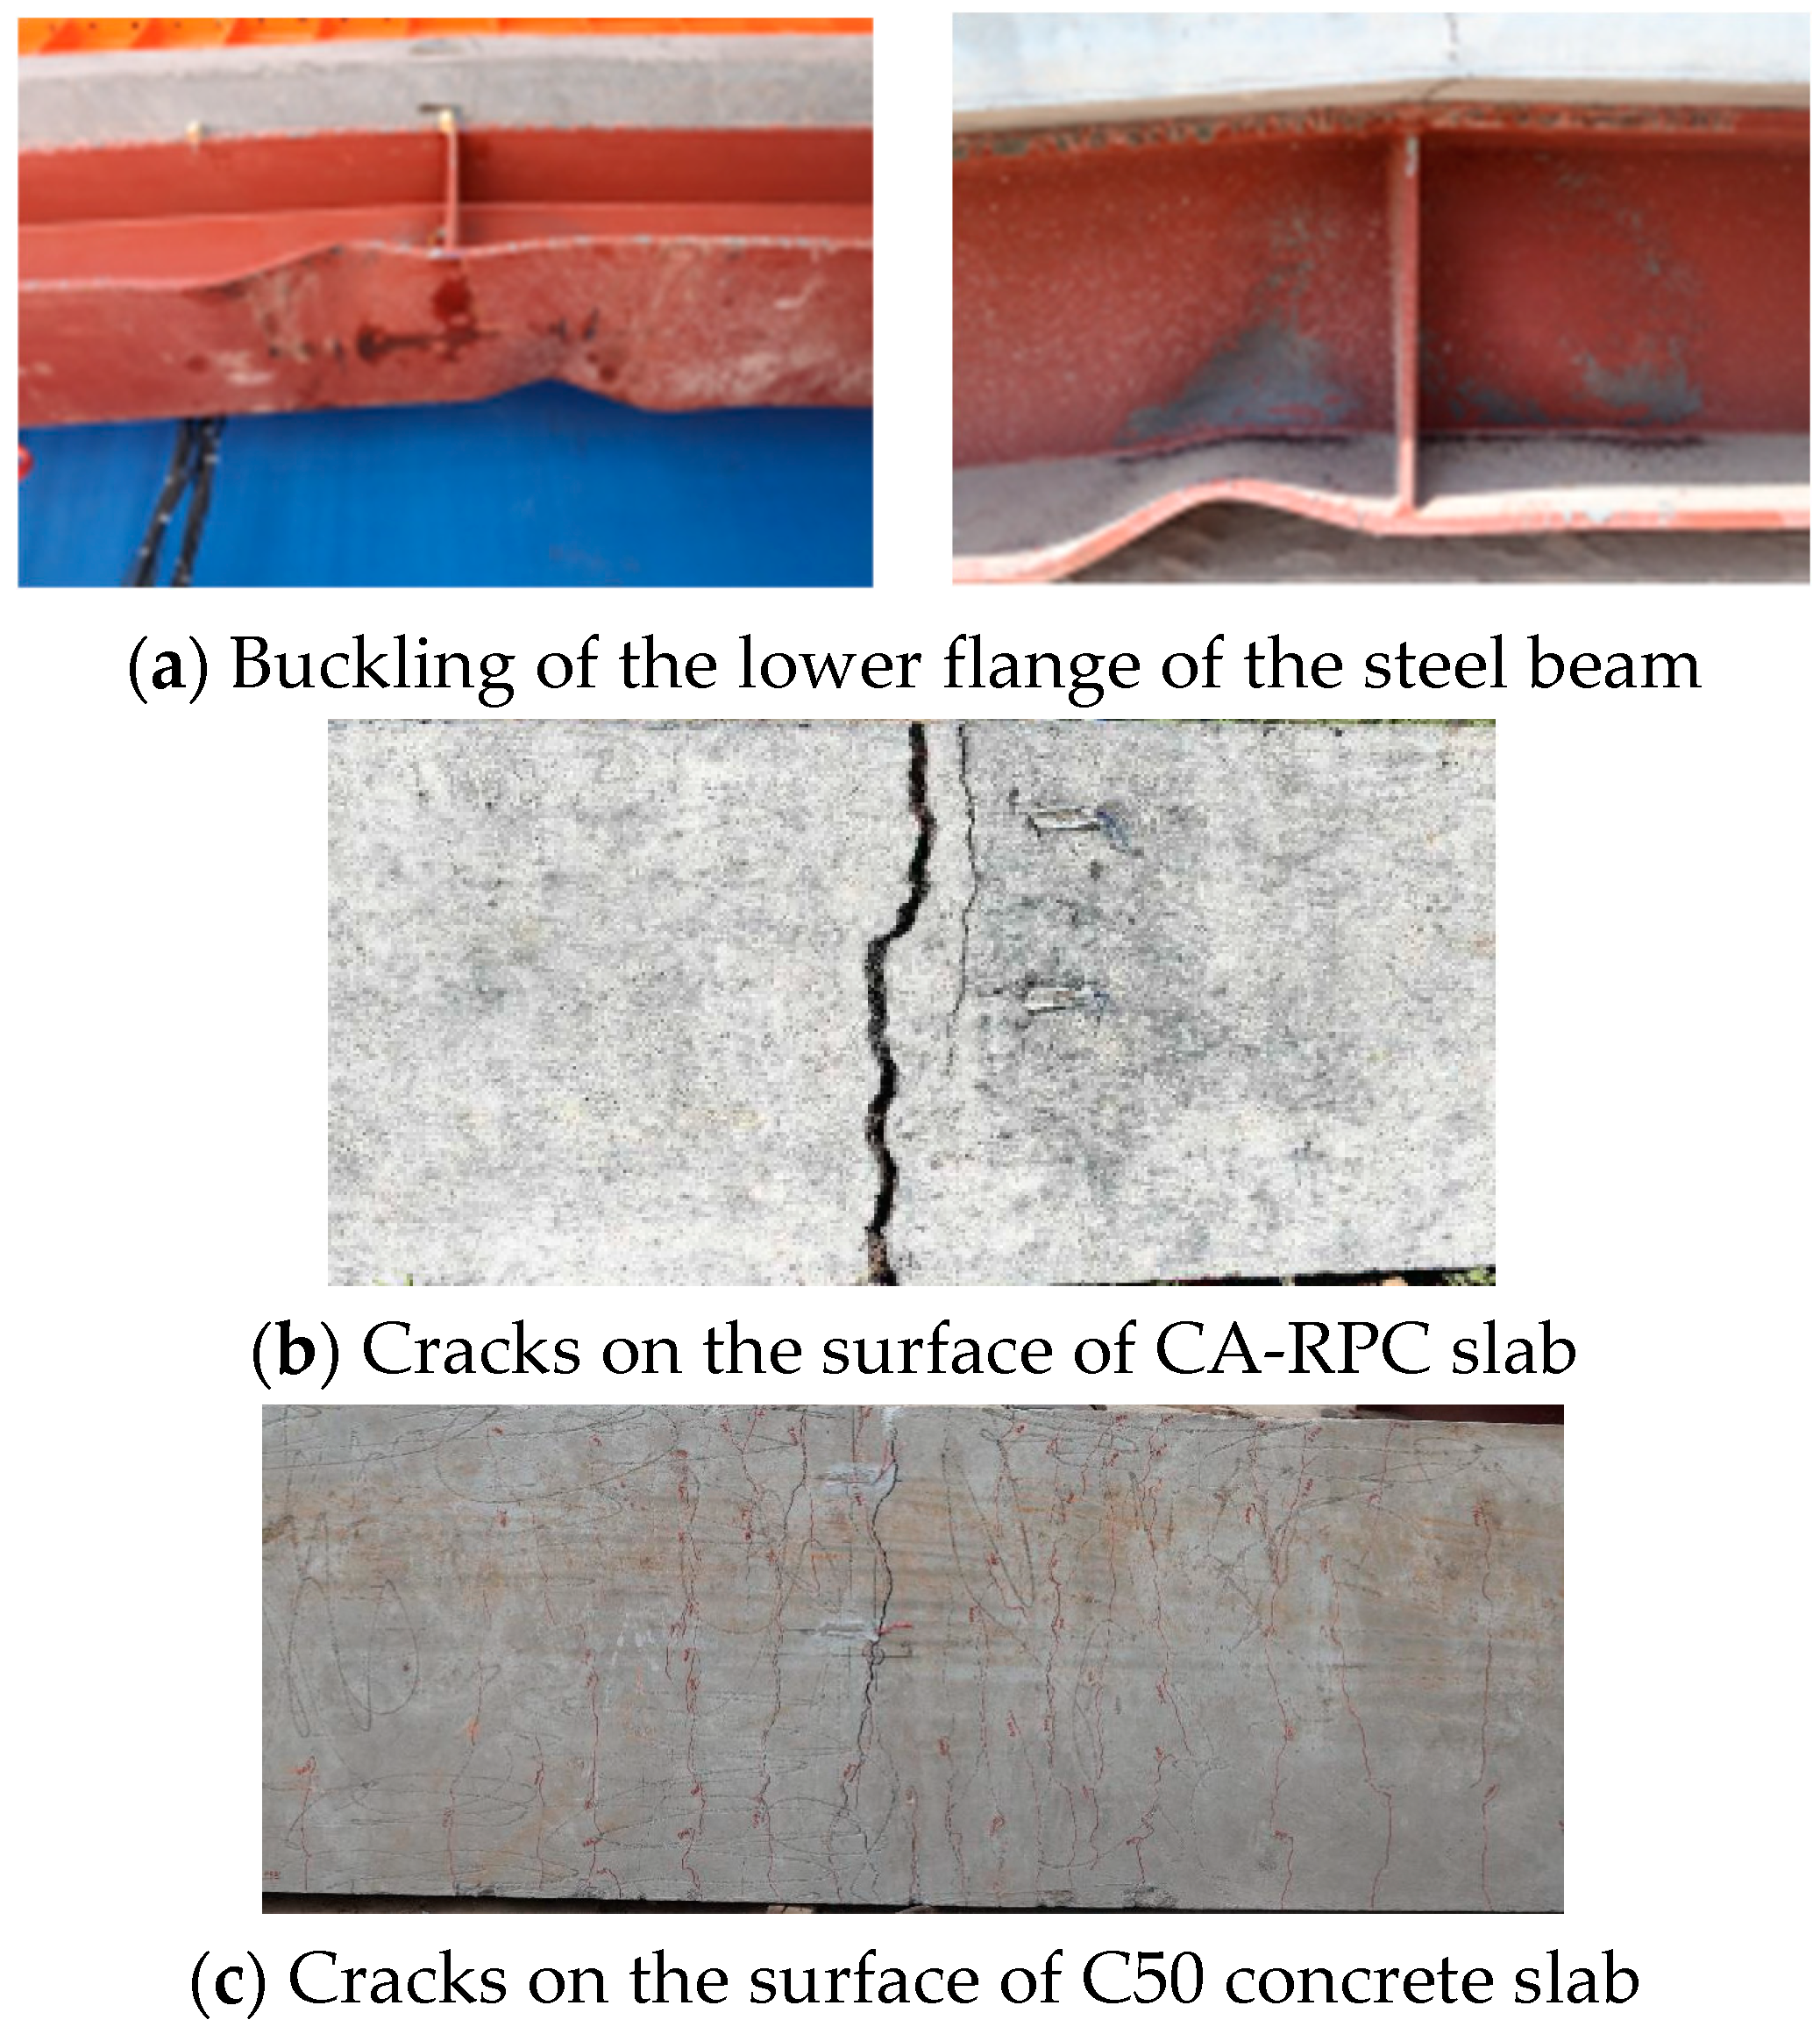
(3)
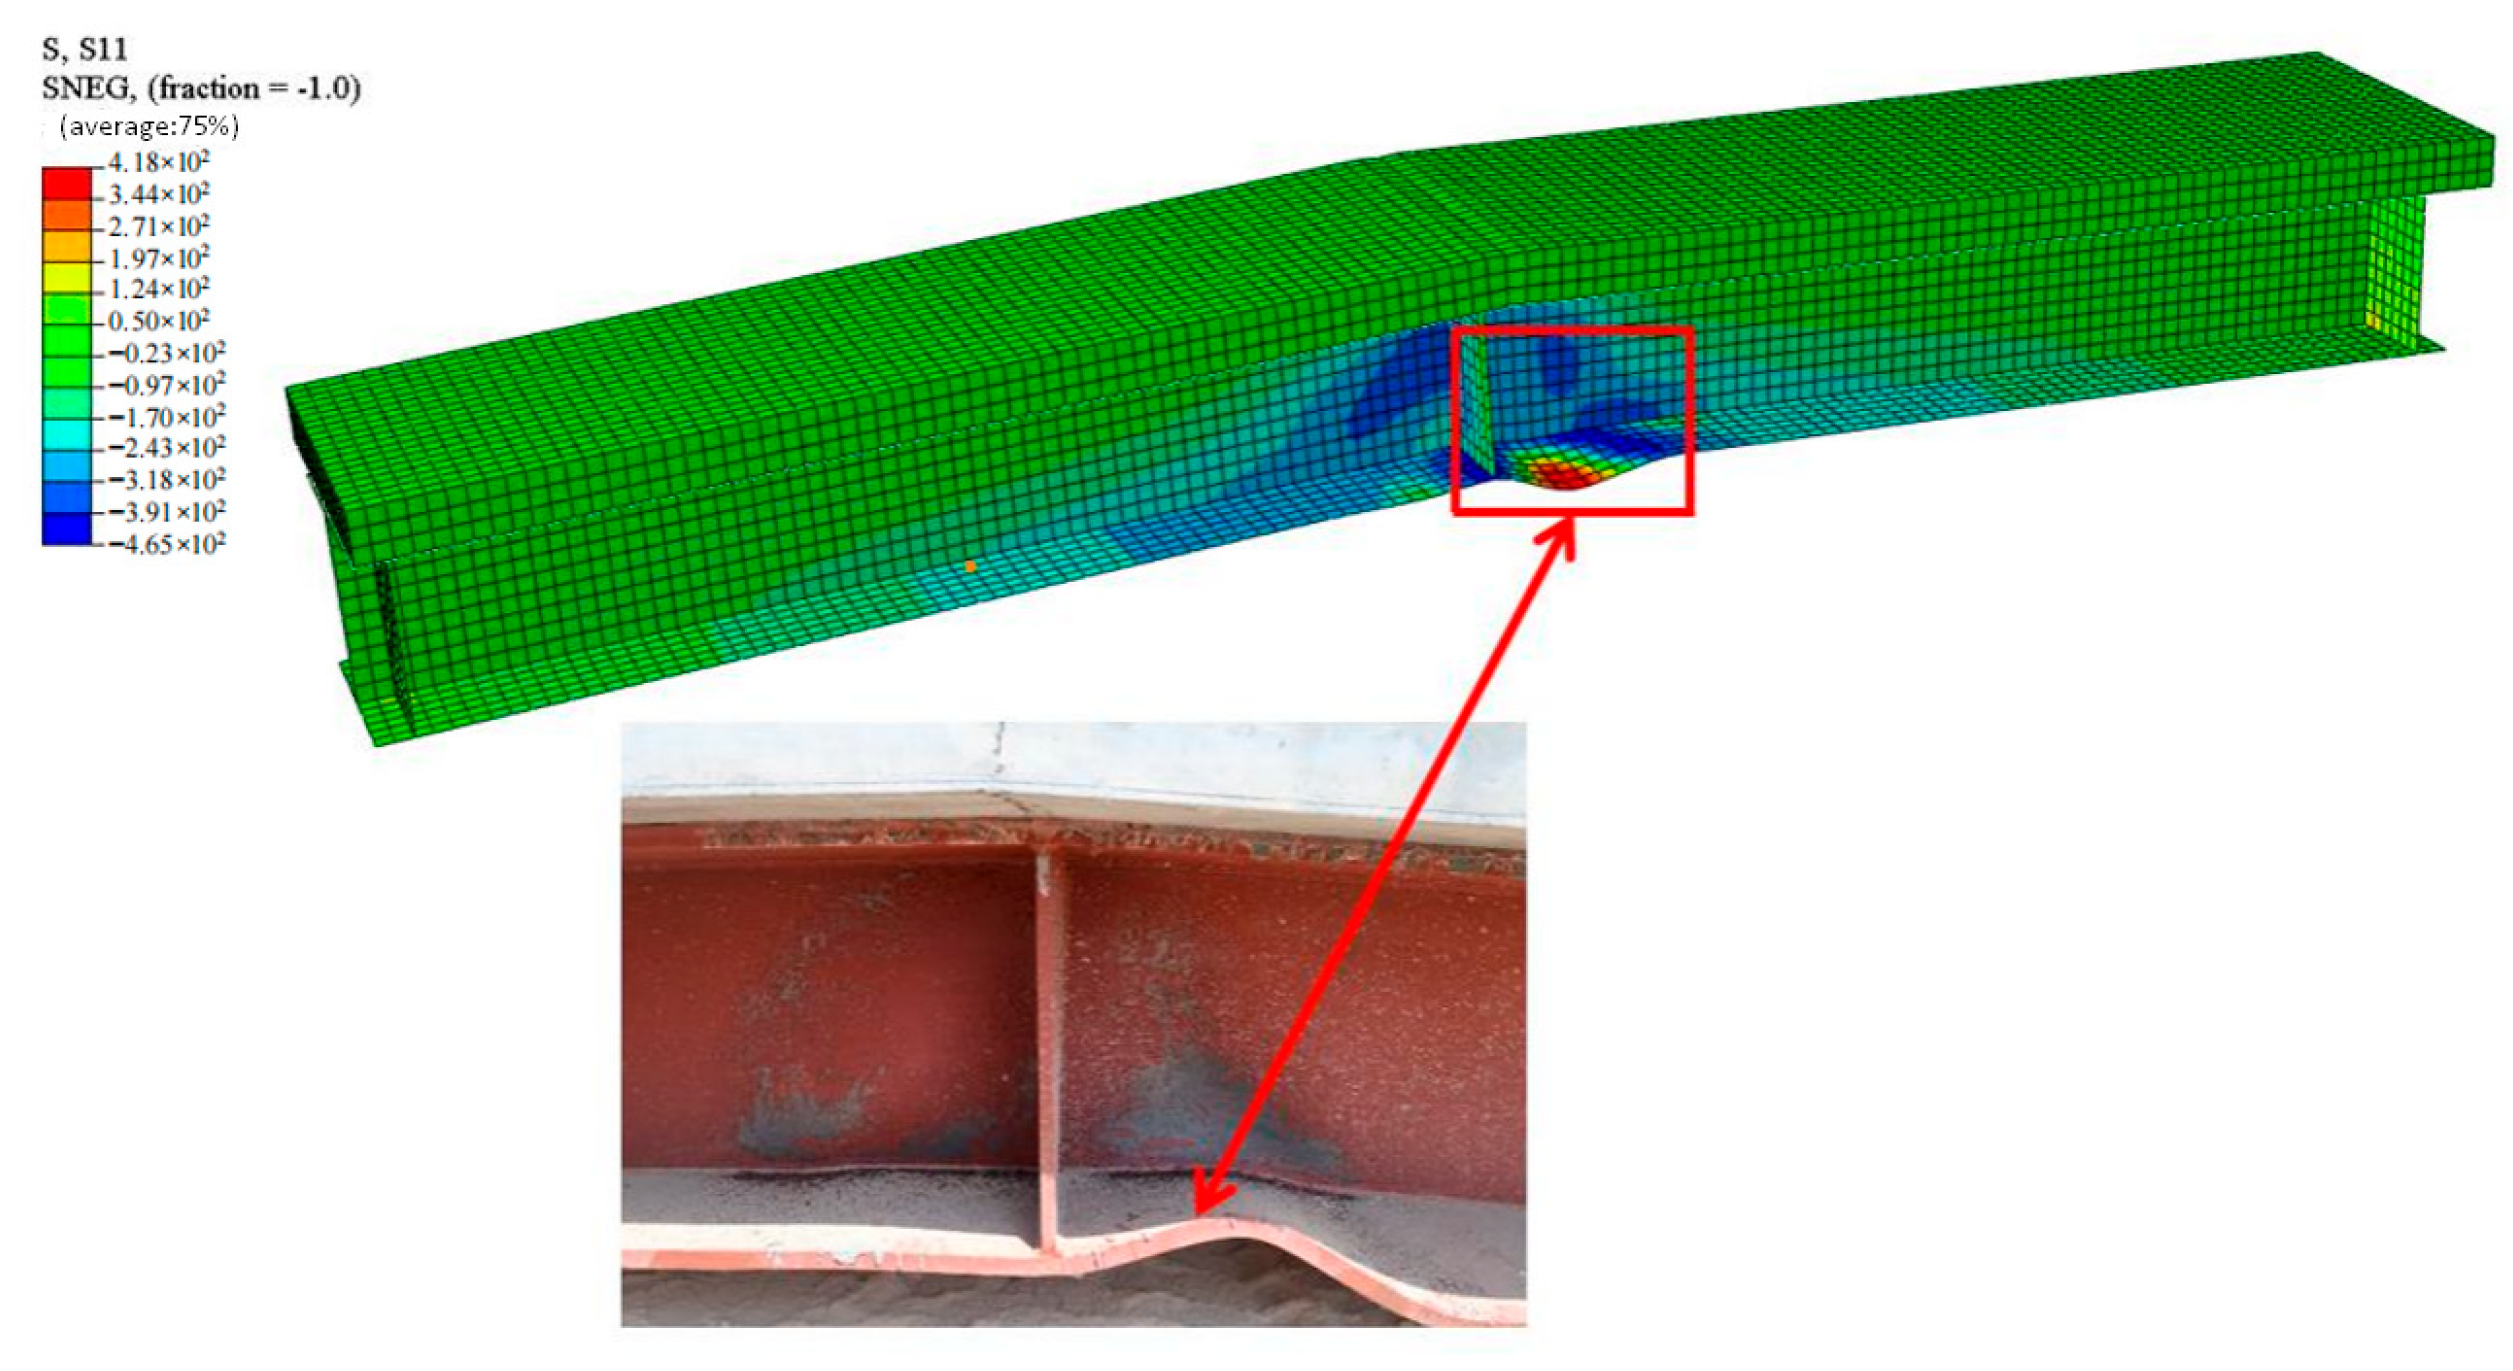
Stage of load-bearing capacity decrease. Once the load reaches the ultimate load-bearing capacity Pu, the lower flange of the steel beam undergoes buckling. Subsequently, the load begins to decrease with a low slope, which means that the specimen demonstrates good ductility.
The key data measured during the loading process are presented in Table 5, and the meaning the parameters were provided in Figure 8. The yield load was represented by the measured load corresponding to the occurrence of yield strain of the lower flange of the steel beam.
The comparison between CA-RPC-STD and CA-RPC-SR reveals that the use of URSP connectors results in a slight decrease of 4.5% of the ultimate load-bearing capacity yet increases the cracking load by 27.3%, which demonstrates the effect of the URSP connectors in improving the crack resistance.
Comparing CA-RPC-STD and CA-RPC-NPS, it can be indicated that the application of prestress has no significant impact on the load-bearing capacity of the component, since there was only a difference of 1.4% of Pu, but it does significantly enhance the cracking load by 75%.
The difference between CA-RPC-NPS and C50-NPS demonstrates that the use of CA-RPC, compared to ordinary concrete, significantly increases the cracking load by 280%, while the effects on the specimen’s load-bearing capacity can be ignored.
The contrast between CA-RPC-NNS and CA-RPC-STD implies that eliminating interfacial bonding can only slightly improve the specimen’s cracking resistance by 4.9% while having almost no impact on the stiffness and load-bearing capacity. Therefore, it can be indicated that the effect of interfacial bonding can be ignored in the process of design and calculation.
The comparison between CA-PRC-NPS and CA-RPC-ER shows that constraints at the ends of the negative moment zone, which is a common condition in continuous beams, lead to a decrease in the cracking load by 15%.
Comprehensively, the application of CA-RPC, URSP connectors, and prestress can make great contributions to the cracking resistance of the composite beam up to 298%, while the ultimate load-bearing capacity only slightly fluctuates within a range of ±8%. And every specimen has good ductility since wu/wy is larger than 2.

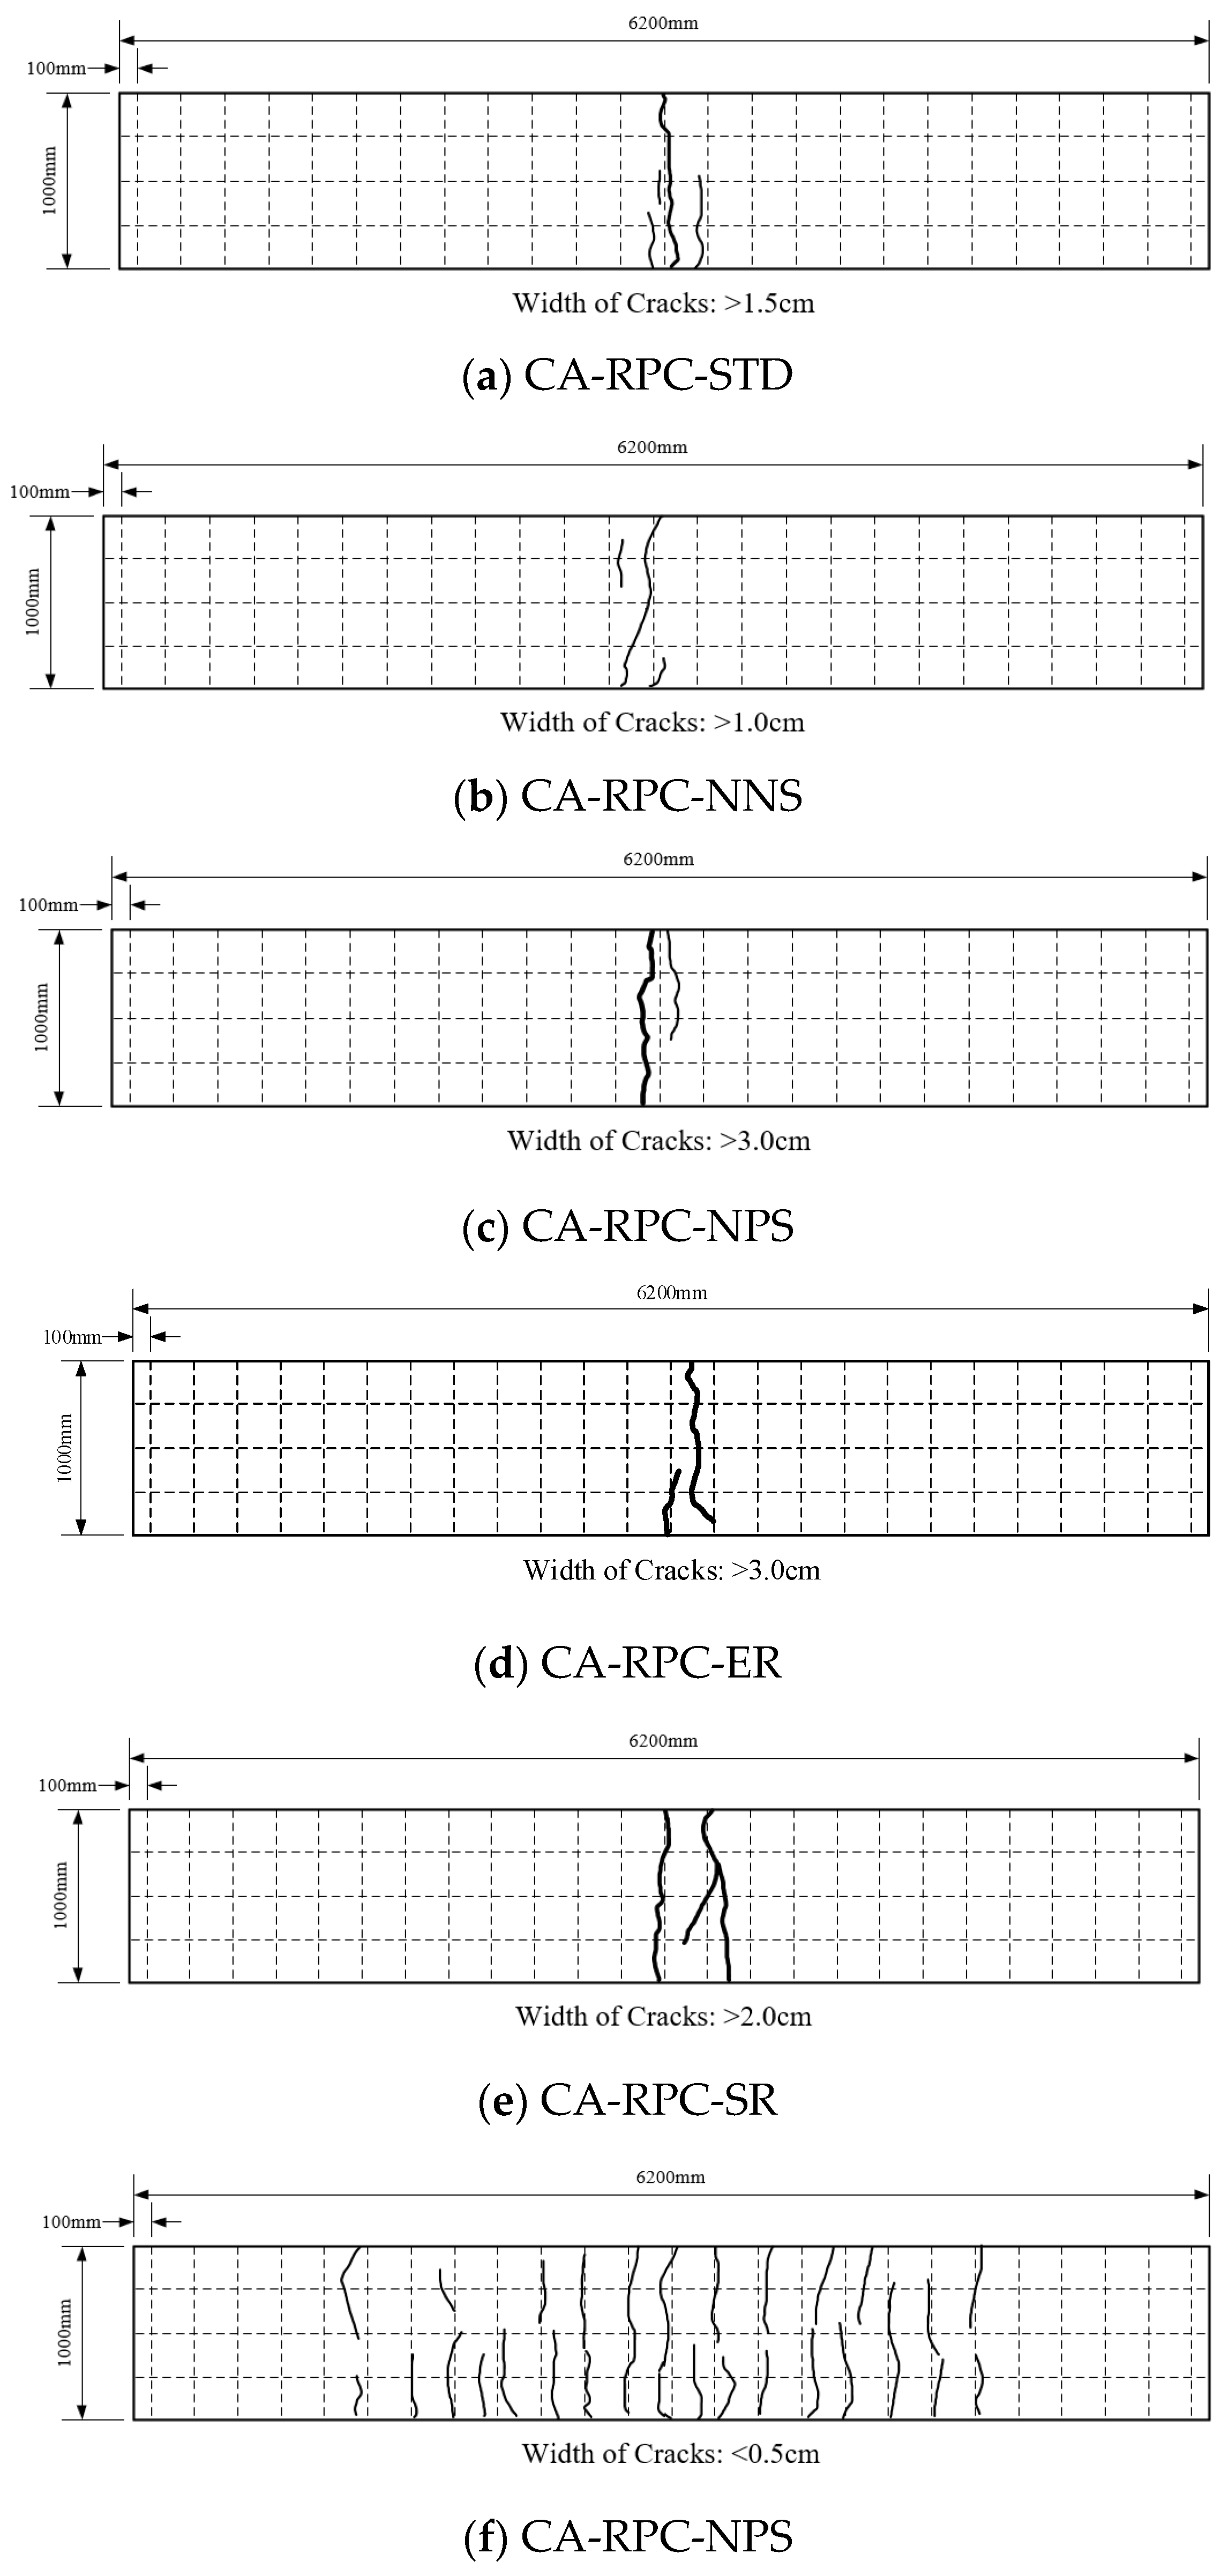
3.2. Cracking Patterns

Figure 9 depicts the distribution of cracks in the test specimens. When reaching the ultimate load, the specimen constructed with CA-RPC slabs exhibited a single critical crack in the mid-span, which was relatively wide, with few cracks observed in other areas. In contrast, the specimen constructed with ordinary C50 concrete slab displayed uniformly distributed cracks within a 1/4 span on either side of the mid-span, with a low average width.

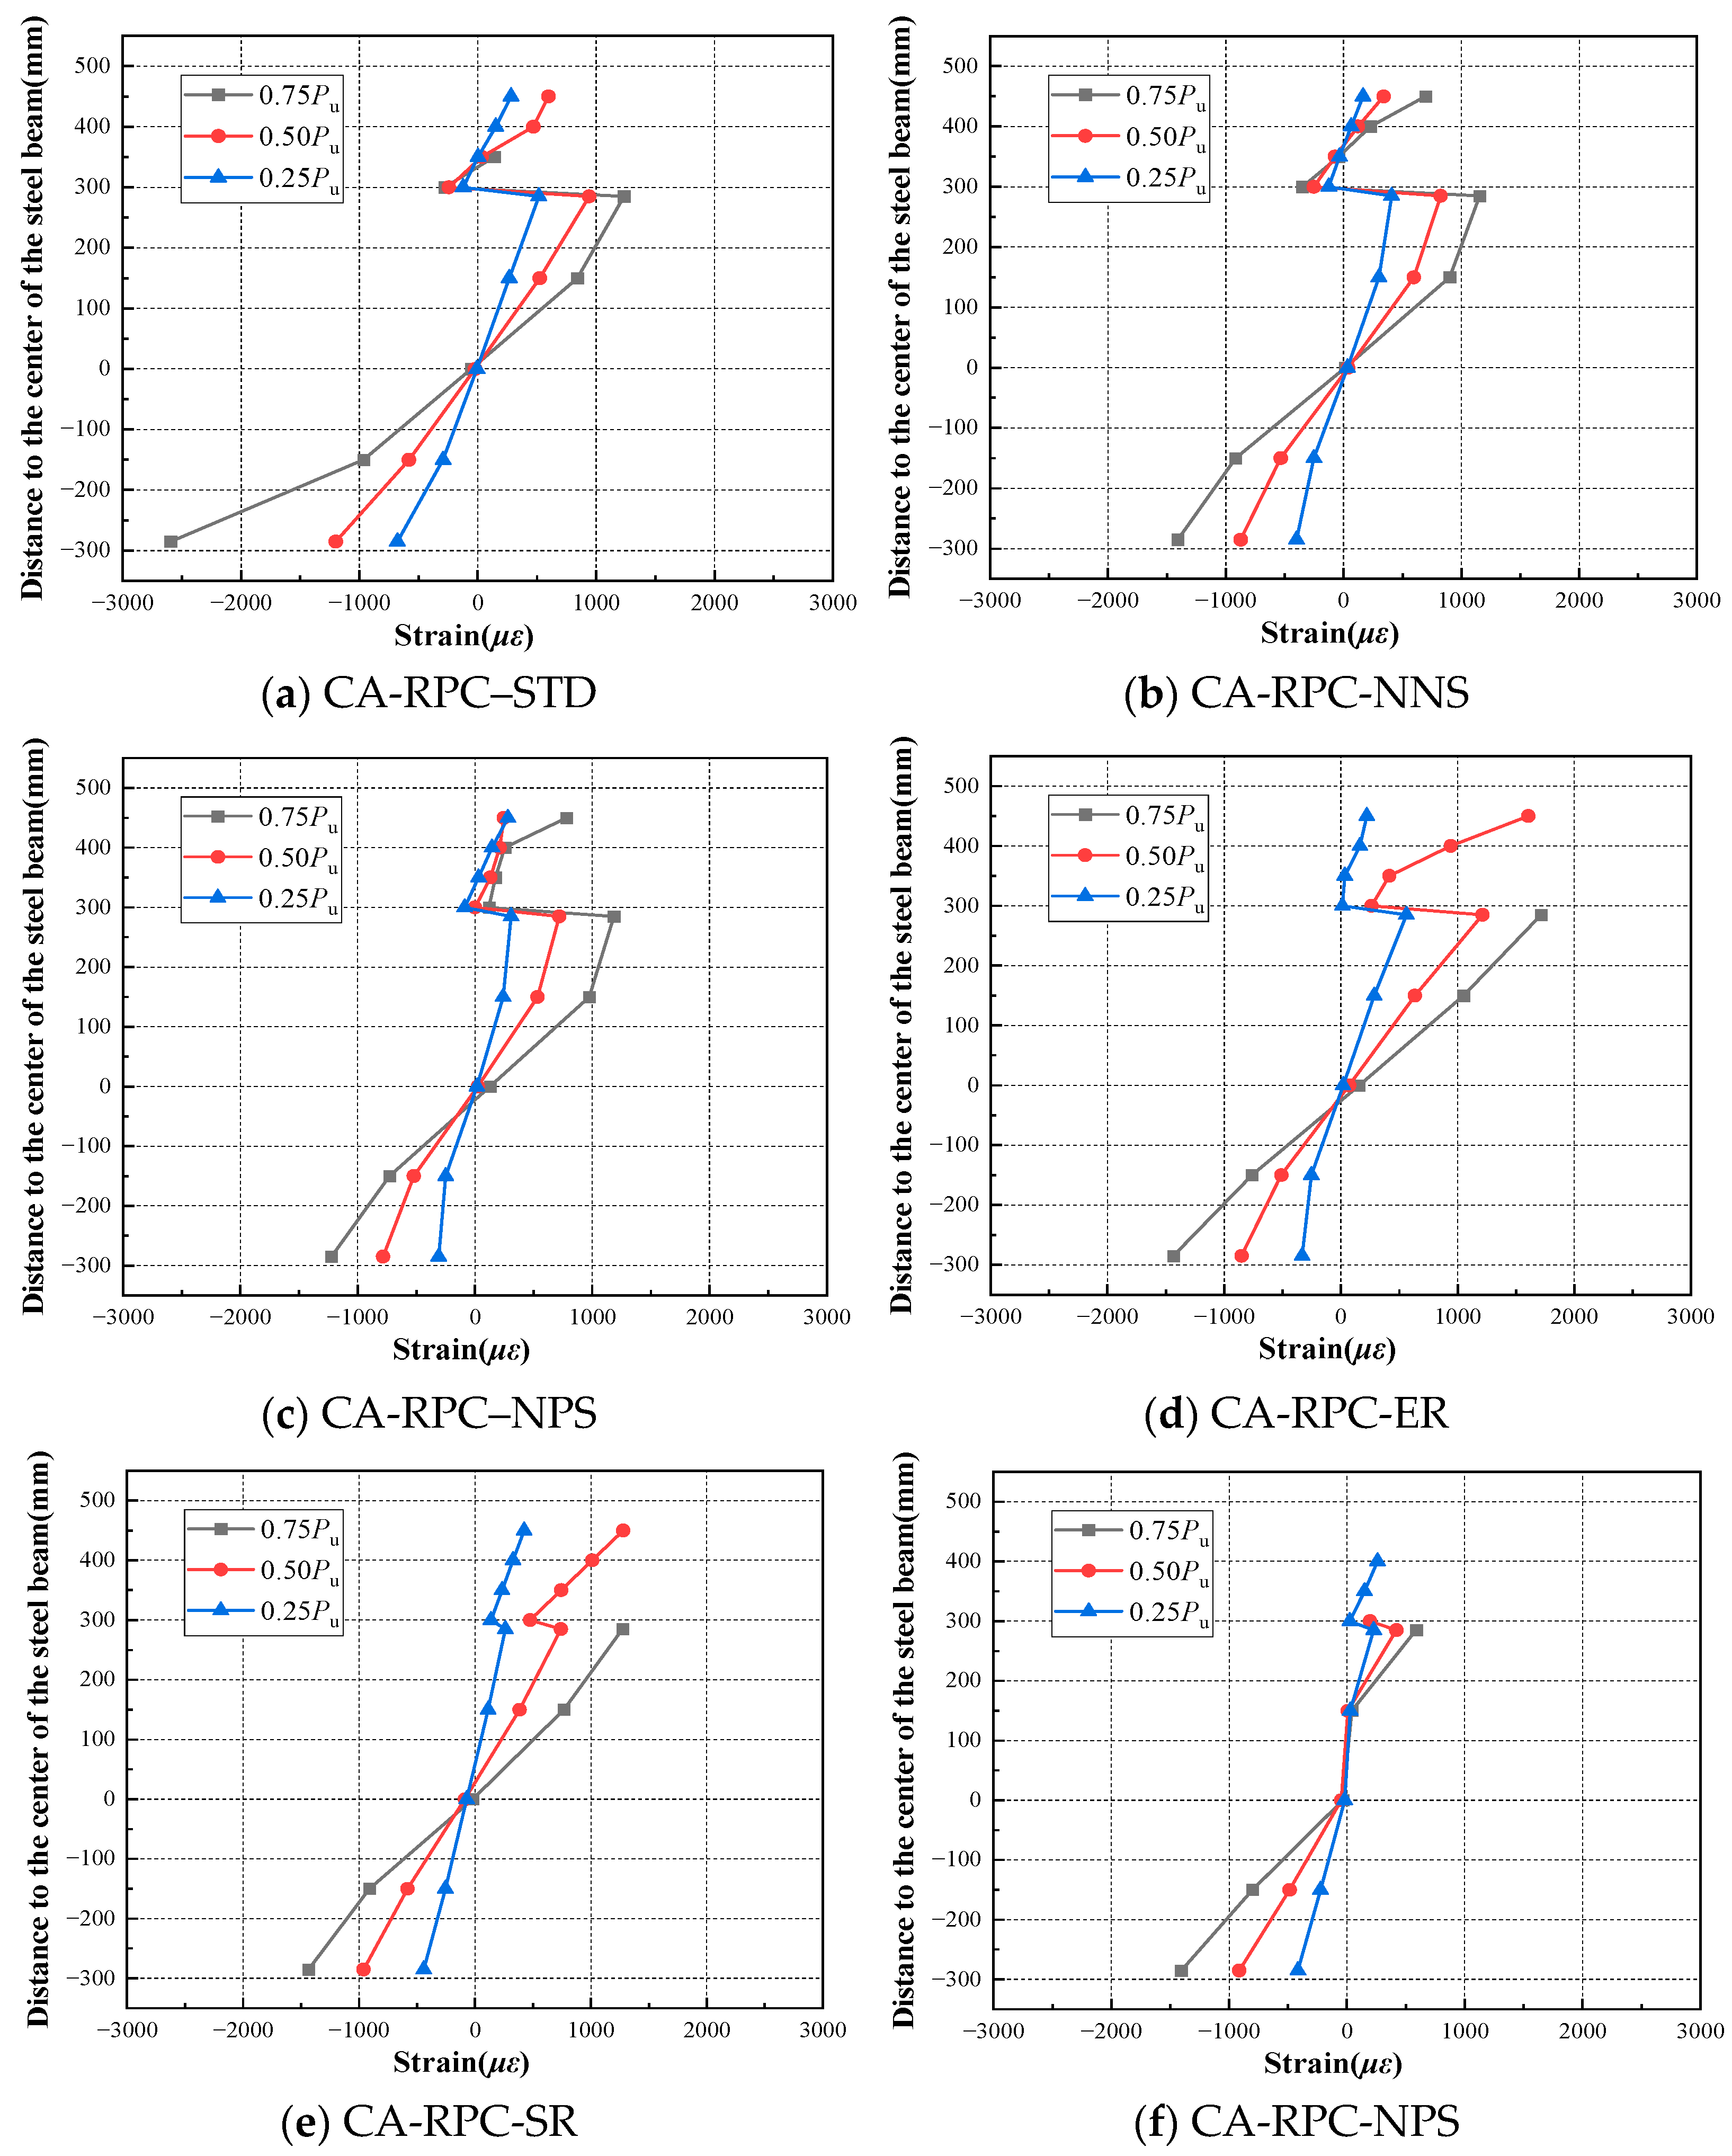
3.3. Strain of the Mid-Span Section

The strain distribution along the cross-section of each specimen at the mid-span under different load levels is shown in Figure 10. It can be observed that for specimens utilizing URSP connectors (CA-RPC-STD; CA-RPC-NPS; CA-RPC-NNS; and CA-RPC-ER), the distribution of strain did not conform to the plane section assumption. The CA-RPC slab and steel beam rotated along their respective neutral axes, which, to some extent, reduced the tensile strain at the top of the concrete. For specimens using ordinary connectors (CA-RPC-SR), the plane section assumption was followed under lower loads (0.25 Pu). However, as loading progressed, rapid crack development led to damage to the strain gauge set on the surface of the concrete slab, resulting in a lack of corresponding strain data. For ordinary concrete specimen C50-NPS, due to the same reason, concrete strain data are missing after the load grew to 0.5 Pu. The comparison between CA-RPC-STD and CA-RPC-NPS indicates that the addition of prestress has no significant impact on the strain distribution trend during the loading process.

3.4. Slip at the Steel–Concrete Interface
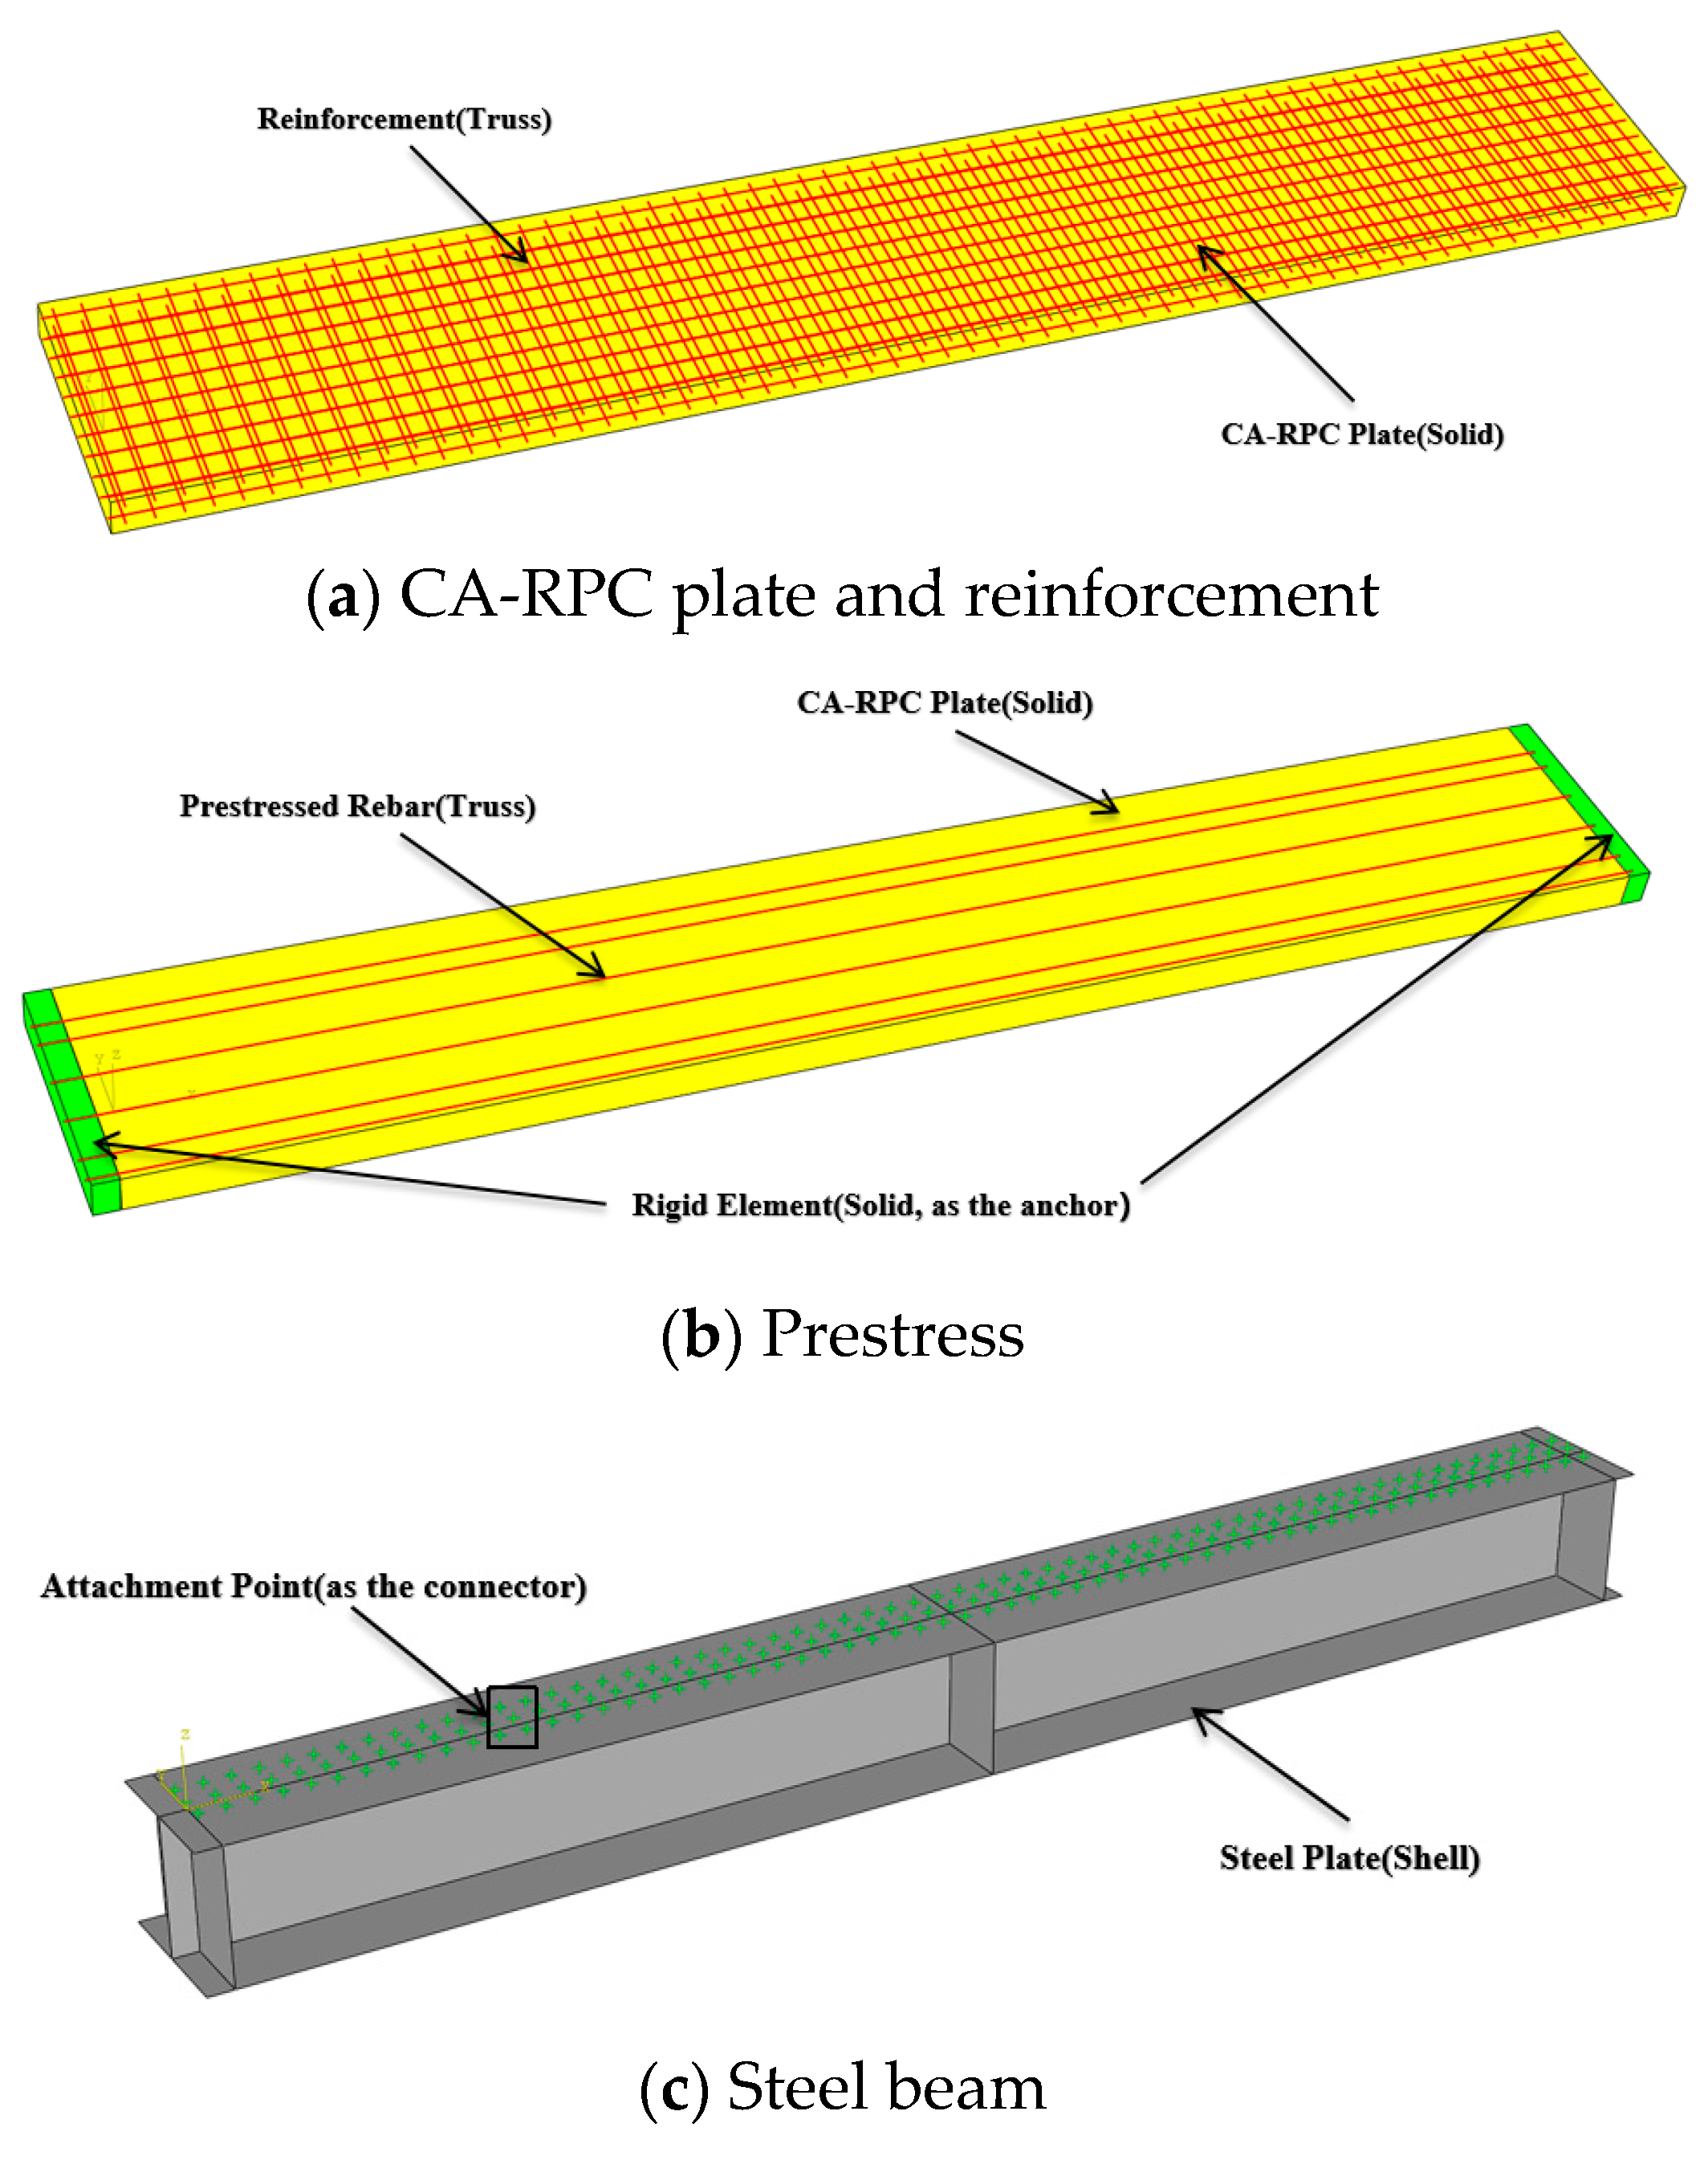
The distributions of slip at the steel–concrete interface along the beam length under various load levels for each specimen are illustrated in Figure 11. It can be observed that for specimens utilizing URSP connectors (CA-RPC-STD; CA-RPC-NPS; CA-RPC-NNS; CA-RPC-ER; and C50-NPS), the horizontal restraint at the interface was effectively released. During the loading process, the slip at the interface increased by an order of magnitude compared to the specimen using ordinary stud connectors (CA-RPC-SR). The comparison between CA-RPC-ER and CA-RPC-STD reveals that end constraints can significantly reduce the slip near the restricted locations. Similarly, comparing CA-RPC-NNS with CA-RPC-STD, it is indicated that eliminating the interfacial bonding can further amplify the slip effect. Furthermore, the contrast between C50-NPS and CA-RPC-NPS demonstrates that the material type of the concrete slab does not significantly affect the interfacial slip.

4. Numerical Model

Based on the experimental results, the composite beam was modeled in the general-purpose finite element analysis software Abaqus/CAE 2020. The model contained four primary materials: concrete (CA-RPC or C50), steel, regular rebar, and prestressed tendon.
The concrete slab was established by solid elements (shown in Figure 12a), while the longitudinal and transverse steel reinforcement meshes were represented by truss elements, which were embedded in the concrete elements (shown in Figure 12b).
To build the steel beam, plate elements were utilized (shown in Figure 12c), with the upper and lower flanges, the web, and the stiffeners modeled according to actual dimensions and locations. Attachment points were added on the top surface of the steel beam based on the actual arrangement of connectors, and fastener constraints were set up, defining their influence radius as the radius of the ordinary studs or URSP connectors, which was 11 mm. Furthermore, in order to simplify the calculation, based on the main stress characteristics of the connectors in the tests, the three rotational degrees of freedom of the fastener constraint were fixed, while the translational degrees of freedom were set to slot type, only allowing displacement in the longitudinal direction of the beam. The vertical direction represented the separation between the concrete slab and the steel beam, and constraining its degrees of freedom could achieve the “uplift restricted” effect.
The prestressed tendons were represented by truss elements and embedded in the rigid solid elements established at both ends of the concrete slab (simulating the prestress anchors). The prestress is simulated by applying initial tensile stress to the prestressed tendon elements.

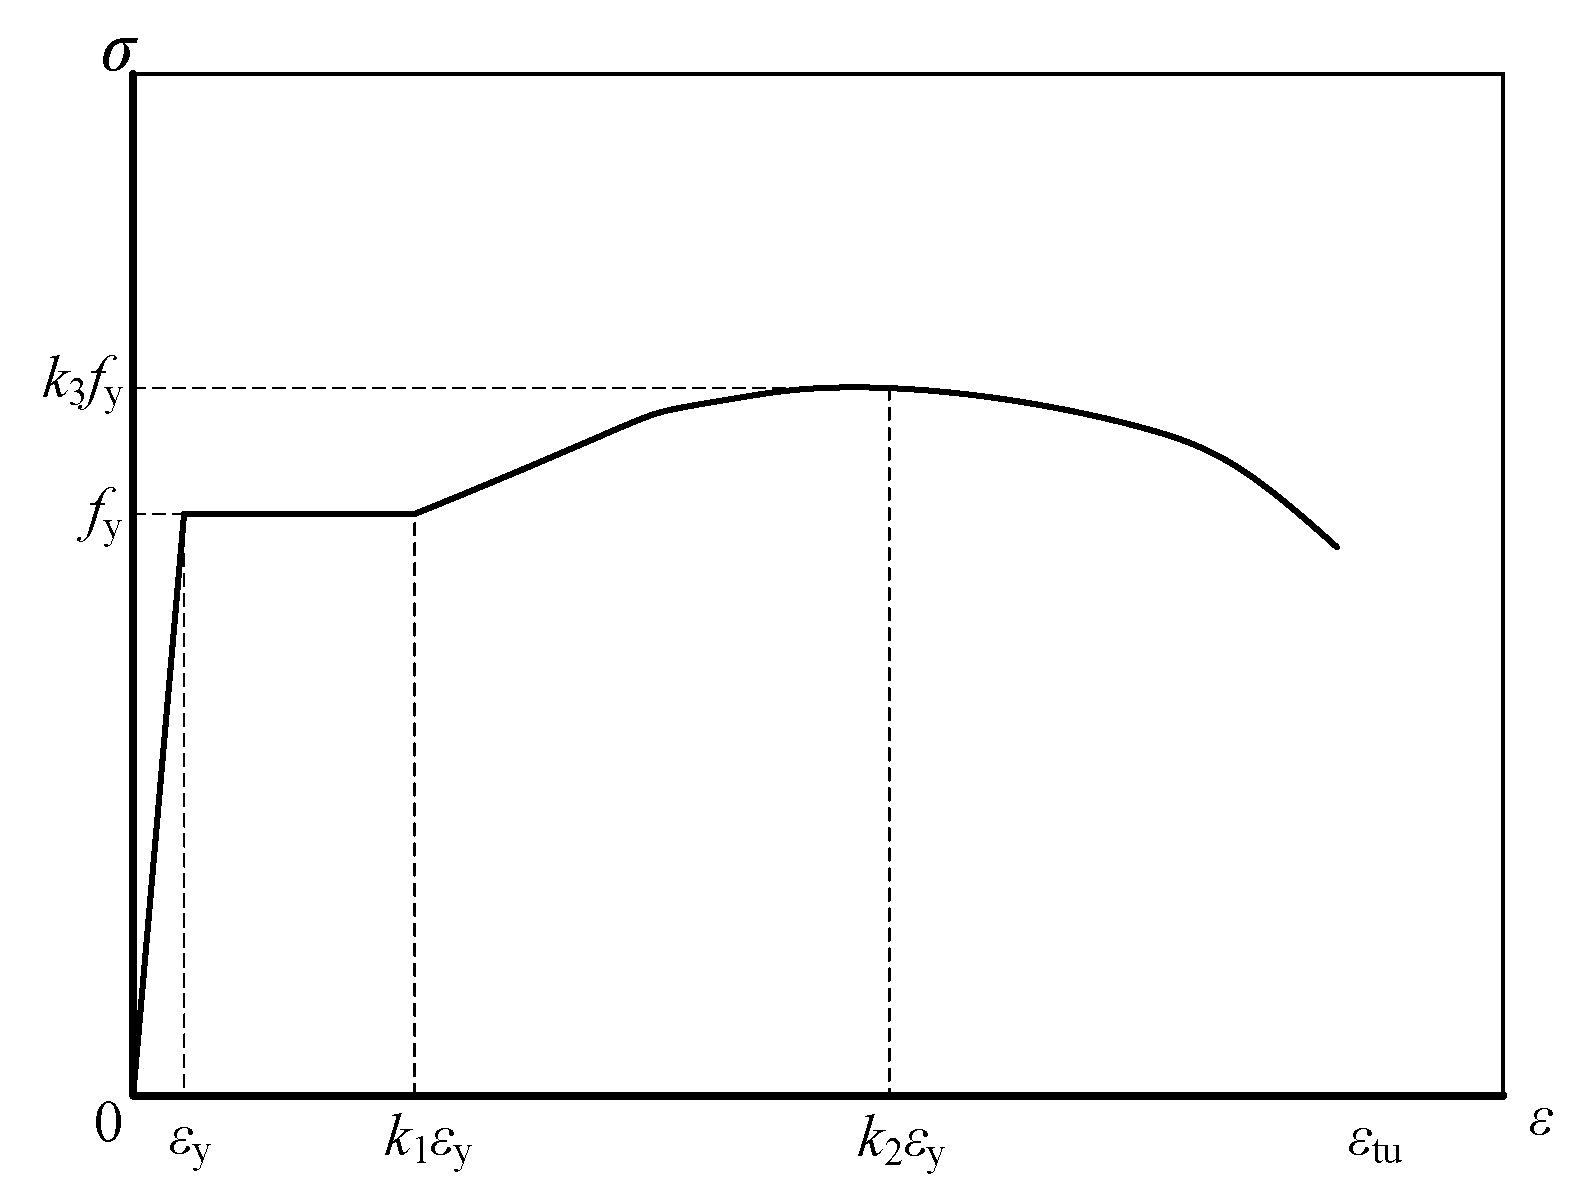
4.1. Material Models

The CA-RPC material was simulated using the Concrete Plastic Damage (CDP) model [20,21,22], and the key parameters required was listed in Table 6. Based on existing research, the uniaxial compression stress–strain curve for CA-RPC (as shown in Figure 13a) could be determined by Equations (1) and (2) [23,24], for which the peak compressive stress f0 was determined by material property tests. The elastic modulus E was taken as 44 GPa. The steel fiber volume fraction Vf was 2.5%, and the ultimate compressive stress σu was 15.48 + 7.61Vf. The ultimate compressive strain, εu, was 0.035.
σ = f 0 β ε ε 0 β 1 + ε ε 0 β . β = 1 1 f 0 ε 0 E .
where f0 represents the peak compressive stress; ε0 represents the peak compressive strain; and E represents the elastic modulus of CA-RPC.
σ = m ( ε ε 0 ) + f 0 ( ε 0 < ε < ε ip ) n ( ε ε ip ) + σ ip ( ε ip < ε < ε u ) .
where σip represents the stress corresponding to the turning point of the softening segment; εip represents the strain corresponding to the turning point of the softening segment; εu represents the ultimate compressive strain; and m and n represent the slopes of the corresponding linear descent stage.
The uniaxial tensile stress–strain curve (as shown in Figure 13b) could be determined by Equation (3) [25], for which the peak tensile stress ft was determined by material property tests. εcr was the crack strain, which was set as 2 × 10⁻⁴, and εt was the peak tensile strain, whose value equaled to 6.4εcr. εu was the tensile strain corresponding to the start of the softening segment, taken as 25εcr. fum and εum were the residual tensile stress and ultimate tensile strain, respectively, with fum = 0.34ft and εum = 2 × 10⁻².
σ = E ε ( 0 < ε < ε cr ) f t f t f cr ( ε t ε cr ) 2 ( ε ε t ) 2 ( ε cr < ε < ε t ) f t ( ε t < ε < ε u ) f t ε um ε ε um ε u + f um ε ε u ε um ε u ( ε u < ε < ε um ) .
where εcr represents the crack strain; fcr represents the initial crack tensile stress related to εcr; ft represents the peak tensile stress; εt represents the peak tensile strain; εu represents the tensile strain corresponding to the start of the softening segment; fum represents the residual tensile stress; and εum represents the ultimate tensile strain.
The constitutive law of steel and rebar can be found in Figure 14. The yield stress of steel or rebar, denoted as fy, was measured through the material property tests. The elastic modulus Es was taken as 200 GPa, and the yield strain εy was calculated as fy/Es. Taking into account material hardening, the hardening segment adopted a quadratic parabolic form, with the strain at the peak set at k2εy (k2 = 120) and the stress at k3fy (k3 = 1.2).
URSP connectors or ordinary studs were simulated by slot-type fastener constraints, allowing relative displacement along the interface in accordance with a preset shear–slip curve, as illustrated in Figure 15. The curve was determined by Equation (4) [26,27], while contact was employed for the remaining areas [28] in order to prevent the concrete slab and the upper flange of the steel beam from interference in the vertical direction, which might result in a mistake of displacement and transmission of force. The contact was defined as rigid face-to-face contact with finite sliding.
V = δ k 0 δ δ 0 δ 0 k 0 δ 0 < δ t s 3 δ 0 k 0 + V u 1 e δ t s 3 0.558 V u t s 3 < δ δ u V u 1 δ δ u 20 δ f δ u δ u < δ < δ f V u = 0.43 A s E c f c 0.7 A s γ f δ u d s = 0.41 0.0030 f c + t s 3 d s δ f d s = 0.45 0.0021 f c + t s 3 d s
where δ0 represents the maximum slip restrained by the interfacial bonding effect; k0 represents the stiffness of the interfacial bonding effect; Vu represents the ultimate shear capacity of the stud; ts represents the thickness of the material with a low elastic modulus; δu represents the slip corresponding to Vu; δf represents the ultimate slip; ds represents the diameter of the stud; As represents the section area of the stud; and f represents the yield stress of the stud.

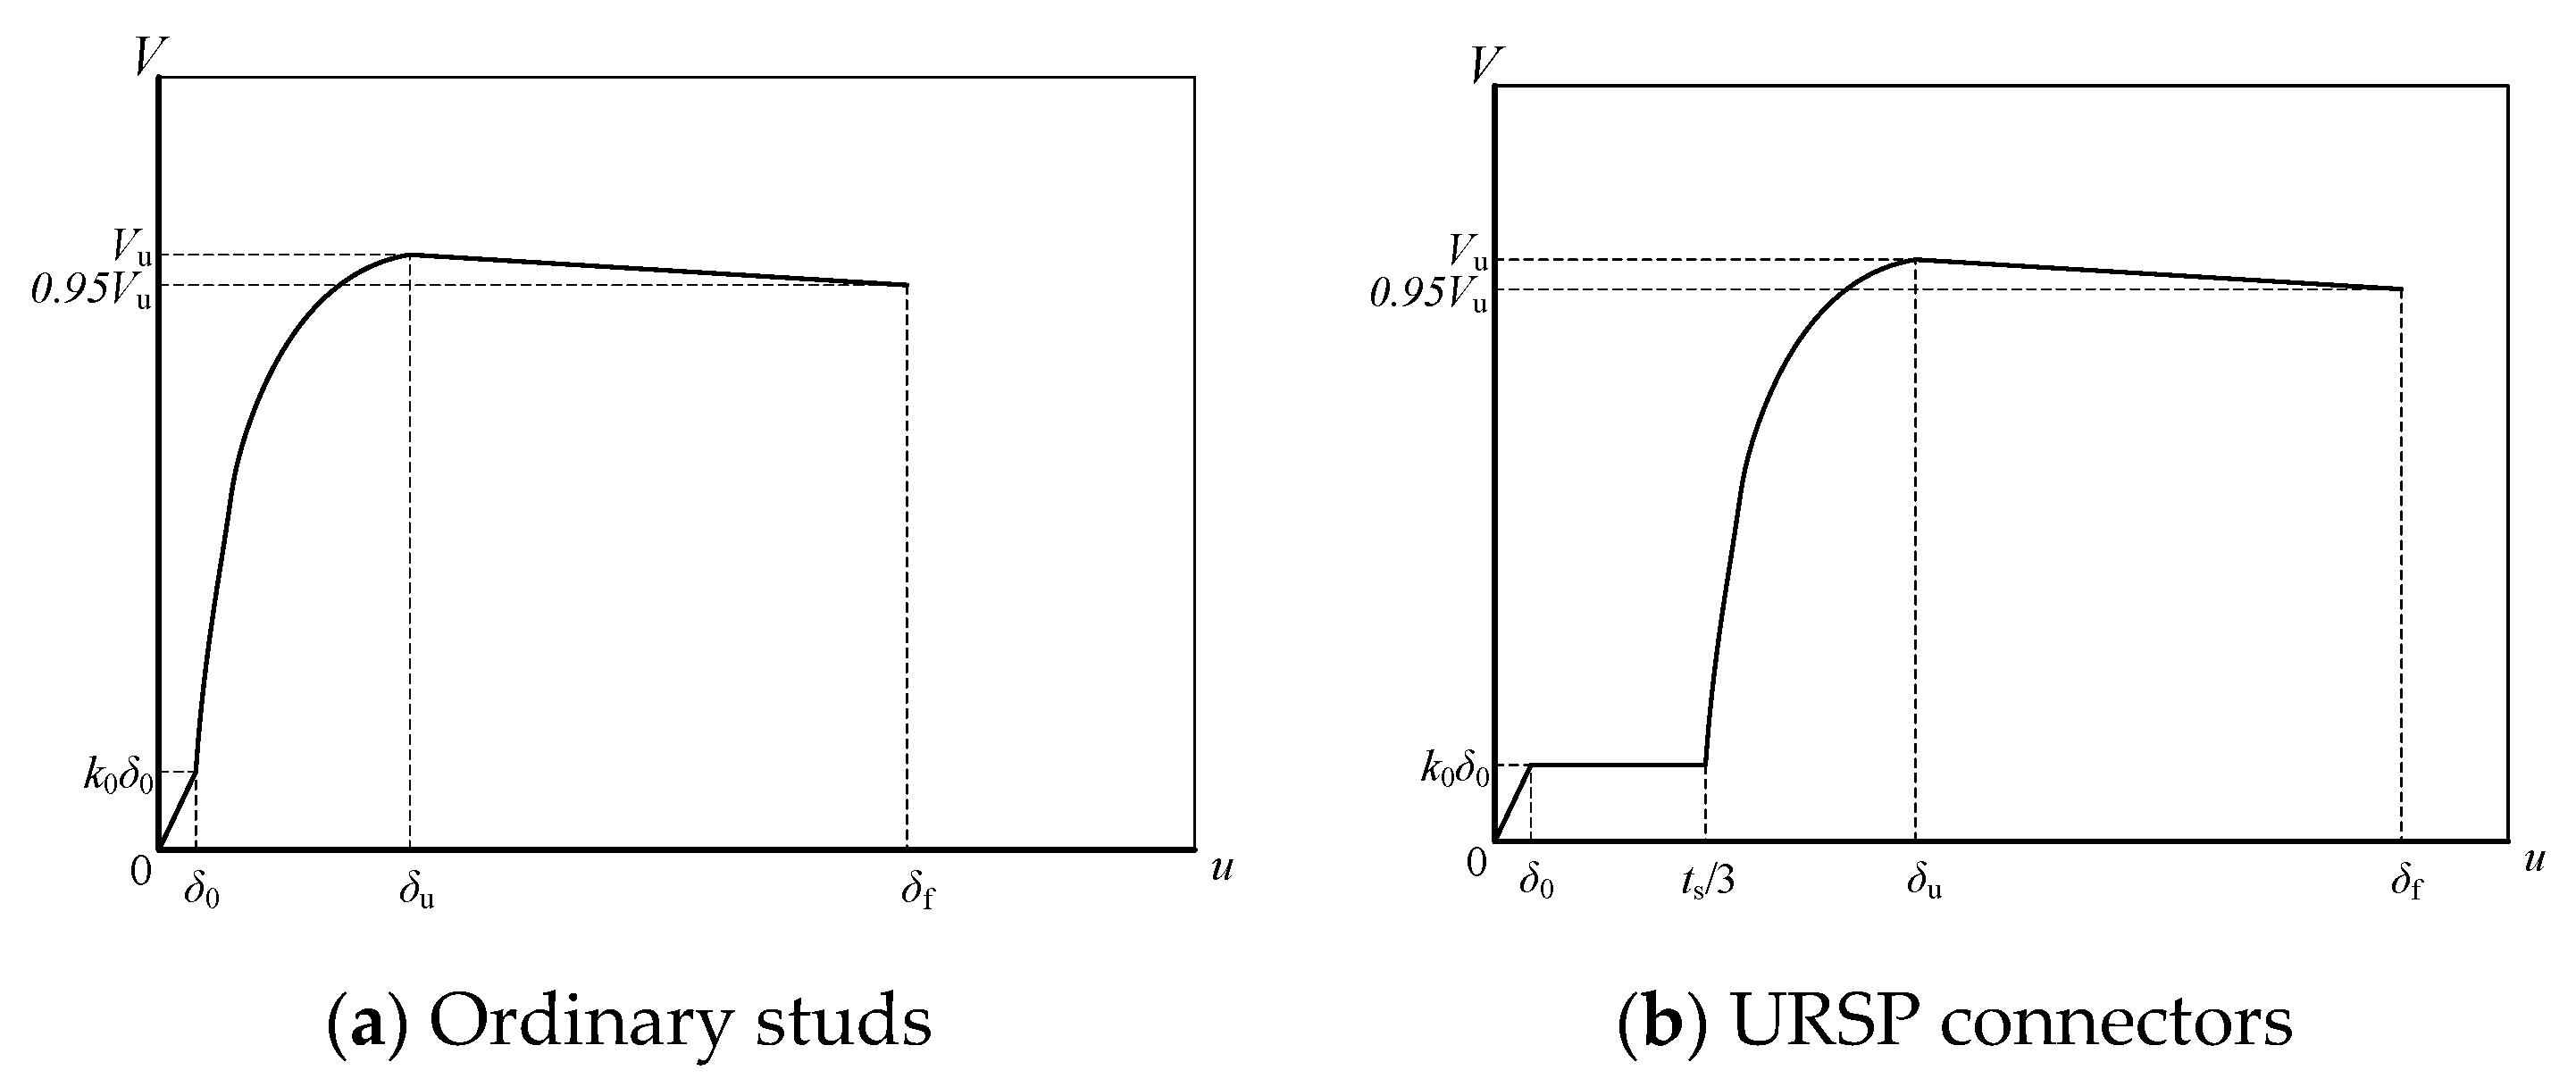
4.2. Force–Displacement Relationship

The load–displacement curves predicted by the finite element model are illustrated in Figure 7. It is evident that the results of finite element modeling can coincide well with the experimental data. Comparing the curves of the simulation of each specimen, the trends of the force–displacement relationship are essentially identical, with minimal differences in stiffness during the elastic stage. The use of URSP connectors results in a slight decrease in the ultimate load compared to the model using ordinary studs.

4.3. Cracking Load

Table 7 lists the cracking load obtained by the finite element models. The cracking load defined in the FEM is determined by the load related to when the maximum principle tensile strain of the concrete elements reaches the crack strain (2 × 10⁻⁴). The data can accord with the experimental results and prove that the application of URSP connectors, prestress, and CA-RPC is beneficial to increasing the cracking resistance of the composite beam.

4.4. Failure Mode

As shown in Figure 16, the buckling of the lower flange of the steel beam plate could be depicted when the finite element model reached the ultimate load, which was consistent with the experimental observation.
As illustrated in Figure 17a, the distribution of the cracking strain on the top surface of the CA-RPC slab was presented when the finite element model reached the ultimate bearing capacity. The figure demonstrated that the cracking in the CA-RPC slab was concentrated at the mid-span, with no cracking occurring in other positions, which was consistent with experimental results.
As shown in Figure 17b, the distribution of strain due to cracking on the top surface of the C50 slab was depicted when the finite element model load reached the ultimate load. From the figure, it was evident that the cracking in the C50 slab was uniformly distributed within a certain range near the mid-span, which could be in accord with the experimental results.

4.5. Parameter Analysis

To find out the effect of the application of CA-RPC, URSP connectors, and prestress on the cracking resistance, eight sets of FE models were established based on the model of CA-RPC-STD, and the changes in the parameters of each model are listed in Table 8.
The crack load of each model is shown in Figure 18 It is indicated that prestress played the most important role in enhancing the cracking resistance, with an increase in the crack load of 336.7 kN (66.7%) comparing CR-9-U with CR-0-U, 247.3 kN (61.8%) comparing CR-9-S with CR-0-S, 316.51 kN (132.8%) comparing C-9-U with C-0-U, and 239.9 kN (127.8%) comparing C-9-S with C-0-S. Further, it should be pointed out that using URSP connectors could boost the effect of prestress, while this effect might be independent of the change in the concrete material.
Comparing CR-0-U with CR-0-S (or C-0-U with C-0-S), it was evident that the application of URSP connectors could effectively release a part of tensile stress in the concrete slab, which resulted in an increase of 104.57 kN (26.2%) for CR-0-U (or 50.65 kN (27.0%) for C-0-U). However, such an effect was relatively minor.
Comparing CR-0-U with C-0-U, CR-0-S with C-0-S, CR-9-U with C-9-U, and CR-0-U with C-0-U, the increase in the crack load was, respectively, 286.28 kN (51.6%), 266.08 kN (111.6%), 219.58 kN (51.4%), and 212.16 kN (113.0%). It seemed that the effect of using the CA-RPC material instead of C50 ordinary concrete also benefited the cracking resistance to a great extent, and using URSP connectors could also enhance the effect of CA-RPC.

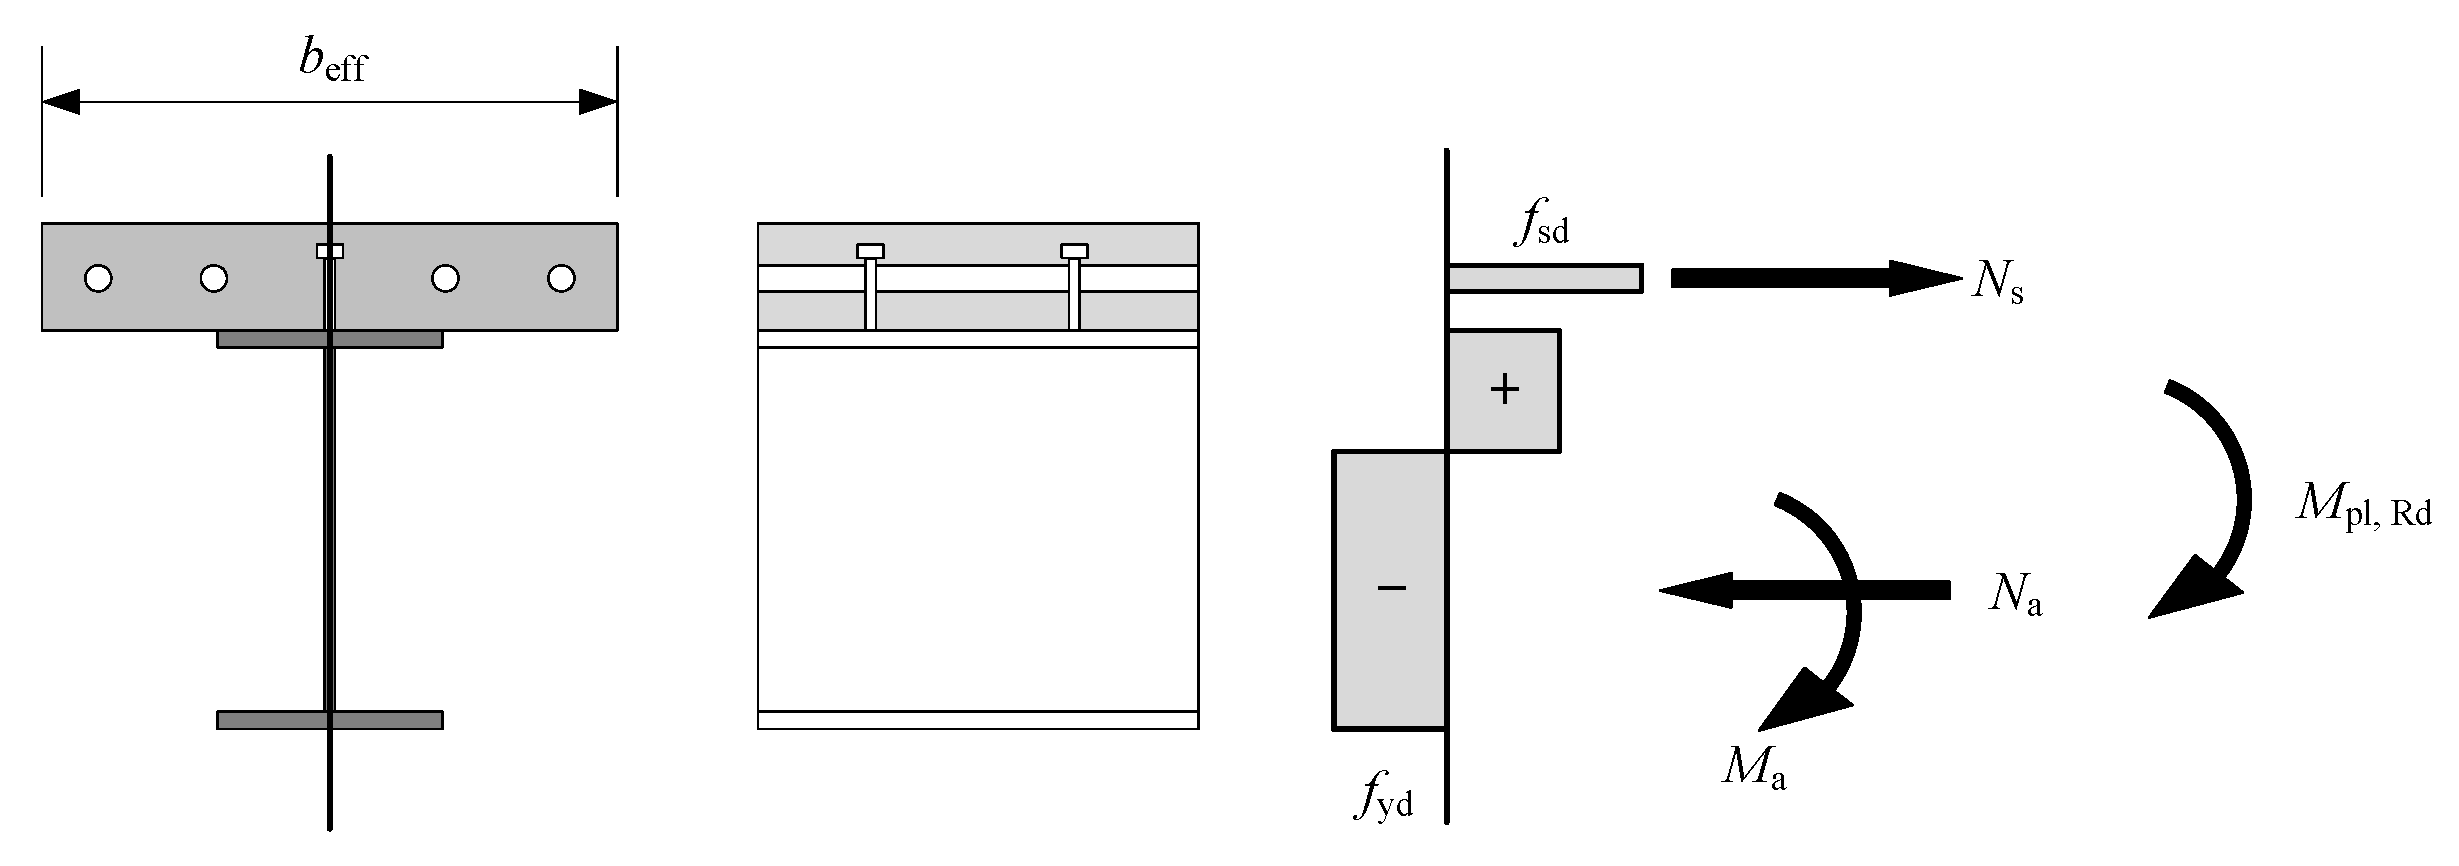
4.6. Calculation of Ultimate Strength by Eurocode 4

In the design of composite beams, the plastic resistance moment (Mpl,Rd) is a crucial technical parameter. The experimental results presented in this paper indicated that for the steel–CA-RPC composite beams with URSP connectors, Mpl,Rd is essentially consistent with that of composite beams with ordinary studs in the negative moment zone.
A potential reason is that when the beam reaches the ultimate load, the slip capacity of the URSP connectors has been exhausted. Under such a condition, the shear transfer performance at the interface of the composite beams with URSP connectors is essentially identical to that of beams with ordinary studs.
Meanwhile, when the composite beams reach their ultimate bending-bearing capacity, the CA-RPC slabs at the mid-span have already completely cracked and ceased to work, which can be considered to make no contribution to the bending resistance of the composite beam. Therefore, the ultimate bending-bearing capacity is just similar to that of the beams using ordinary concrete.
Therefore, Mpl,Rd of steel–CA-RPC composite beams with URSP connectors under the hogging bending moment can be calculated by the methods for the conventional composite beam provided in Eurocode 4 [29] (shown in Figure 19).
Comparing the calculation results of the composite beams mentioned in this paper with the experimental data, as listed in Table 9, it can be proved that the calculated bending-bearing capacity results are essentially consistent with the experimental values and are more conservative.

5. Conclusions

The main subject of this study is to investigate the structural mechanism of steel–CA-RPC composite beams with URSP connectors. Six simply supported beam specimens were designed, fabricated, and subjected to negative moment tests. The study examined the impact of different connectors on the performance of composite beams in terms of crack resistance, cross-sectional strain distribution, and interfacial slip. Based on the experimental results and existing research findings, numerical simulations were conducted on the test specimens. From the experimental results and the finite element modeling, the following conclusions can be drawn:
(1)
In the experiment, under negative bending moments, the utilization of CA-RPC materials, URSP connectors, and prestress all could enhance the cracking load of the beams. In addition, the combination of CA-RPC and URSP connectors would not cause a sharp increase in the cost and the difficulty of construction, which would be an optimized selection for the bridge industry.
(2)
The results of the strain distribution of the section at the mid-span of the beams indicated that with the use of URSP connectors instead of ordinary studs, there was a large slip at the interface of the two materials. Neutral axes were generated in the steel beam and the concrete slab, which could effectively reduce the tensile strain in the concrete. The measurement of interfacial slip also indicated that the application of URSP connectors allowed for greater slip at the interface.
(3)
By setting appropriate parameters, such as material constitutive properties and connection conditions, the numerical models could achieve computational results that are consistent with the experiment with enough accuracy. The models also show good simulation of the phenomenon observed in the experiment, so they can serve as a foundation for parameter analysis in subsequent research.
(4)
A parameter analysis of the FEM was carried out to study the influence of the application of the CA-RPC material, URSP connectors, and prestress on the cracking resistance of the composite beams, and it was indicated that using the CA-RPC material and prestress made great contributions, and the usage of URSP connectors could enhance the effect of the other two factors.
(5)
According to the experimental results and existing research, suggestions were proposed for the calculation method of the bearing capacity of steel–CA-RPC composite beams with URSP connectors. The computational results obtained by using the methods proposed in Eurocode 4 coincided with the experimental data and were more conservative.
In summary, the steel–CA-RPC composite beams with URSP connectors, rather than ordinary studs, exhibit almost no change in bending stiffness and ultimate load-bearing capacity, while there is a significant improvement in crack resistance under the action of negative bending moments, with a relatively lower cost than using ordinary UHPC.

Author Contributions

Conceptualization, X.-Y.Z. and M.-X.T.; methodology, X.-Y.Z. and R.D.; software, X.-Y.Z.; validation, L.-D.Z.; formal analysis, X.-Y.Z. and L.-D.Z.; investigation, X.-Y.Z.; resources, L.-D.Z.; data curation, X.-Y.Z.; writing—original draft preparation, X.-Y.Z.; writing—review and editing, X.-Y.Z., R.D. and M.-X.T.; visualization, X.-Y.Z.; supervision, M.-X.T.; project administration, M.-X.T.; funding acquisition, M.-X.T. All authors have read and agreed to the published version of the manuscript.

Funding

The authors gratefully acknowledge the financial support provided by the National Natural Science Foundation of China (Grant No. 52121005).

Data Availability Statement

All data, models, and codes generated or used during the study are included in the submitted article.

Conflicts of Interest

The authors declare no conflicts of interest.

Nomenclature

Fcrcracking load;
Fyyield load;
Puultimate load-bearing capacity;
f0peak compressive stress of CA-RPC;
ε0peak compressive strain of CA-RPC;
Eelastic modulus of CA-RPC;
Vfsteel fiber volume fraction;
εcrcrack strain of CA-RPC;
fcrcrack tensile stress of CA-RPC;
ftpeak tensile stress of CA-RPC;
εtpeak tensile strain of CA-RPC;
fyyield stress of steel or rebar;
Eselastic modulus of steel or rebar;
δ0maximum slip restrained by interfacial bonding effect;
k0stiffness of interfacial bonding effect;
Vuultimate shear capacity of the stud;
tsthickness of the material with low elastic modulus;
δfultimate slip;
dsdiameter of the stud;
Asthe section area of the stud;
fyield stress of the stud;
Mpl,Rdplastic resistance moment.

References

  1. Zhang, Q.; Jia, D.; Bao, Y.; Dong, S.; Cheng, Z.; Bu, Y. Flexural behavior of steel–concrete composite beams considering interlayer slip. J. Struct. Eng. 2019, 145, 04019084. [Google Scholar] [CrossRef]
  2. Su, Q.; Yang, G.; Wu, C. Experimental Investigation on Inelastic Behavior of Composite Box Girder under Negative Moment. Int. J. Steel Struct. 2012, 12, 71–84. [Google Scholar] [CrossRef]
  3. Jiang, A.; Chen, J.; Jin, W. Experimental Study of Innovative Steel-Concrete Composite Beams Under Hogging Moment. Adv. Struct. Eng. 2013, 16, 877–886. [Google Scholar] [CrossRef]
  4. Xu, B.; Liu, Y.; Zhu, W. Comparative study on flexural behavior of steel-UHPC composite beams and steel-ordinary concrete composite beams in the negative moment zone. Structures 2023, 57, 105288. [Google Scholar] [CrossRef]
  5. Wu, W.; Dai, J.; Chen, L.; Liu, D.; Zhou, X. Experiment analysis on crack resistance in negative moment zone of steel-concrete composite continuous girder improved by interfacial slip. Materials 2022, 15, 8319. [Google Scholar] [CrossRef] [PubMed]
  6. Zhang, Y.; Cai, S.; Zhu, Y.; Fan, L.; Shao, X. Flexural responses of steel-UHPC composite beams under hogging moment. Eng. Struct. 2020, 206, 110134. [Google Scholar] [CrossRef]
  7. Wei, C.; Zhang, H.; Yang, Z.; Li, M.; Cheng, Z.; Bao, Y. Flexural cracking behavior of reinforced UHPC overlay in composite bridge deck with orthotropic steel deck under static and fatigue loads. Eng. Struct. 2022, 265, 114537. [Google Scholar] [CrossRef]
  8. Lin, J.; Lin, L.; Peng, Z.; Xu, R. Cracking performance in the hogging-moment regions of natural curing steel–UHPC and Steel–UHTCC continuous composite beams. J. Bridge Eng. 2022, 27, 04021106. [Google Scholar] [CrossRef]
  9. Cao, G.; Han, C.; Dai, Y.; Zhang, W. Long-term experimental study on prestressed steel–concrete composite continuous box beams. J. Bridge Eng. 2018, 23, 04018067. [Google Scholar] [CrossRef]
  10. Xiong, G.; Feng, L.; Zou, Y.; Wang, X.; Xie, J. Experimental study of high-strength steel-precast prestressed concrete composite beams under hogging moment. J. Constr. Steel Res. 2024, 219, 108784. [Google Scholar] [CrossRef]
  11. Nie, J.; Li, Y.; Tao, M.; Nie, X. Uplift-restricted and slip-permitted T-shape connectors. J. Bridge. Eng. 2015, 20, 04014073. [Google Scholar] [CrossRef]
  12. Nie, J.; Wang, J.; Gou, S.; Zhu, Y.; Fan, J. Technological development and engineering applications of novel steel–concrete composite structures. Front. Struct. Civ. Eng. 2019, 13, 1–14. [Google Scholar] [CrossRef]
  13. Duan, L.; Chen, H.; Nie, X.; Han, S. Experimental study on steel-concrete composite beams with uplift-restricted and slip-permitted screw-type (URSP-S) connectors. Steel Compos. Struct. 2020, 35, 261–278. [Google Scholar]
  14. Chen, Y.; Yan, Q.; Yu, X.; Jia, B.; Wu, Y.; Luo, Y. Experimental and Numerical Research on Uplift-Restricted and Slip-Permitted Screw-Shaped Connectors. Int. J. Steel Struct. 2022, 22, 225–239. [Google Scholar] [CrossRef]
  15. Jiang, Y.; Nie, X.; Yan, A.; Zeng, J.; Nong, X.; Fan, J. Experimental research on the structural performance of continuous composite beams with uplift-restricted and slip-permitted connectors. Eng. Struct. 2023, 289, 116291. [Google Scholar] [CrossRef]
  16. Cui, B.; Wu, H.; Zhao, C.; Liu, J.; Guo, Z. Steel-concrete composite cable-stayed bridge-main bridge of the Jiangxinzhou Yangtze River Bridge at Nanjing. Sturct. Eng. Int. 2021, 33, 107–114. [Google Scholar]
  17. Liu, Z.; Alsomiri, M.; Li, M.; Chen, X.; Meng, J. Experimental investigation on the flexural behavior of coarse aggregate reactive powder concrete (CA-RPC) bridge deck. Eng. Struct. 2022, 271, 114951. [Google Scholar] [CrossRef]
  18. Yazici, H.; Yardımcı, M.; Aydın, S.; Karabulut, A. Mechanical properties of reactive powder concrete containing mineral admixtures under different curing regimes. Constr. Build. Mater. 2009, 23, 1223–1231. [Google Scholar] [CrossRef]
  19. Sultan, K.; Al-Husainy, A.; Anshari, B. Comparative investigations on reactive powder concrete with and without coarse aggregate. In Proceedings of the 1st Mandalika International Multi-Conference on Science and Engineering 2022, MIMSE 2022 (Civil and Architecture), Matalam, Indonesia, 23 December 2022. [Google Scholar]
  20. Lubliner, J.; Oliver, J.; Oller, S.; Oñate, E. A plastic-damage model for concrete. Int. J. Solids Struct. 1989, 25, 299–326. [Google Scholar] [CrossRef]
  21. Nie, J.; Wang, Y. Comparison study of constitutive model of concrete in ABAQUS for static analysis of structures. Eng. Mech. 2013, 30, 59–67, 82. (In Chinese) [Google Scholar]
  22. Genikomsou, A.; Polak, M. Finite element analysis of punching shear of concrete slabs using damaged plasticity model in ABAQUS. Eng. Struct. 2015, 98, 38–48. [Google Scholar] [CrossRef]
  23. Wu, Z.; Shi, C.; He, W.; Wang, D. Uniaxial compression behavior of ultra-high performance concrete with hybrid steel fiber. J. Mater. Civ. Eng. 2016, 28, 06016017. [Google Scholar] [CrossRef]
  24. Shafieifar, M.; Farzad, M.; Azizinamini, A. Experimental and numerical study on mechanical properties of Ultra High Performance Concrete (UHPC). Constr. Build. Mater. 2017, 156, 402–411. [Google Scholar] [CrossRef]
  25. Xiao, J.; Yang, T.; Nie, X.; Li, B.; Fan, J.; Shu, B. Experimental and numerical investigation on mechanical performance of continuous steel-UHPC composite slabs. Eng. Struct. 2022, 270, 114804. [Google Scholar] [CrossRef]
  26. Nie, J.; Li, Y.; Tao, M. Slip performance and hysteresis model of a new type of uplift restricted-slip free connectors. Eng. Mech. 2014, 31, 46–52. (In Chinese) [Google Scholar]
  27. Han, S. Experimental Study on Steel-Concrete Composite Beam with Uplift-Restricted and Slip-Permitted Connectors. Master’s Thesis, Tsinghua University, Beijing, China, 2016. (In Chinese). [Google Scholar]
  28. Nassiraei, H. Probabilistic Analysis of Strength in Retrofitted X-Joints under Tensile Loading and Fire Conditions. Buildings 2024, 14, 2105. [Google Scholar] [CrossRef]
  29. European Committee for Standardization. Eurocode 1: Design of Composite Steel and Concrete Structures—Part 1-1: General Rules and Rules for Buildings; European Committee for Standardization: Brussels, Belgium, 2004. [Google Scholar]
Figure 1. URSP connectors.
Buildings 14 02913 g001
Figure 2. Test setup.
Buildings 14 02913 g002
Figure 3. Standard specimen.
Buildings 14 02913 g003
Figure 4. Construction procedure of the specimens.
Buildings 14 02913 g004
Figure 5. Arrangement of the measurement points.
Buildings 14 02913 g005
Figure 6. Failure mode.
Buildings 14 02913 g006
Figure 7. Force–displacement curves.
Buildings 14 02913 g007aBuildings 14 02913 g007b
Figure 8. Definition of key parameter of force–displacement.
Buildings 14 02913 g008
Figure 9. Distribution of cracks.
Buildings 14 02913 g009
Figure 10. Strain distribution of the mid-span section.
Buildings 14 02913 g010
Figure 11. Distribution of slip at the interface between steel and concrete.
Buildings 14 02913 g011
Figure 12. Numerical model.
Buildings 14 02913 g012
Figure 13. Stress–-strain curve of CA-RPC.
Buildings 14 02913 g013
Figure 14. Stress–strain curve of steel (or rebar).
Buildings 14 02913 g014
Figure 15. Shear–slip curves of connectors.
Buildings 14 02913 g015
Figure 16. Deformation of the steel beam.
Buildings 14 02913 g016
Figure 17. Distribution of cracking of the numerical model.
Buildings 14 02913 g017
Figure 18. Results of the parameter analysis.
Buildings 14 02913 g018
Figure 19. Calculation of plastic resistance moment for a composite beam under hogging bending.
Buildings 14 02913 g019
Table 1. Details of the specimens.
SpecimensType of ConcretePrestress (kN)Type of Connectors
CA-RPC-STDCA-RPC900URSP
CA-RPC-NNSCA-RPC900URSP,
eliminating interfacial bonding
CA-RPC-NPSCA-RPC0URSP
CA-RPC-ERCA-RPC0URSP in the center,
ordinary studs at the edges
CA-RPC-SRCA-RPC900Ordinary studs
C50-NPSC500URSP
Table 2. Results of the material property tests of steel.
No.PositionThickness
(mm)
Width
(mm)
Cross-Sectional Area (mm2)Yield Load
F (kN)
Yield Strength
fy (MPa)
Ultimate Load
Fu (kN)
Ultimate Strength
fu (MPa)
1Flange3020600190.8318.1281.7469.5
2Flange3020600227.6379.3314.3523.9
3Flange3020600231.9386.5313.8523.0
Average value216.8 361.3303.3 505.5
4Web2020400166.1415.2215.5538.7
5Web2020400169.3423.2220.7551.8
6Web2020400169.5423.9217.9544.8
Average value168.3 420.8218.0 545.1
Table 3. Results of the material property tests of rebar.
Diameter
(mm)
TypeNo. Yield Strength
fy (MPa)
Ultimate Strength
fu (MPa)
fu/fy
10HRB40014145941.44
24276061.42
34175981.44
44226011.42
54236061.43
64166011.44
Average value4206011.43
Table 4. Results of the material property tests of CA-RPC.
TypeCompressive Strength
Fcu (MPa)
Average Value of
Compressive Strength fcu,m (MPa)
Tensile Strength
fts (MPa)
Average Value of Tensile Strength
fts,m (MPa)
CA-RPC129.9138.1131.8134.88.29.19.08.8
143.0139.6126.48.98.88.7
Table 5. Key data of the experiment.
Name of
the Specimen
Fcr (kN)Fy (kN)Pu (kN)Pu/FcrPu/Fywy (mm)wu (mm)wu/wy
C50-NPS210.32275030156.01.1049.2163.43.24
CA-RPC-ER388.22254631322.61.2367.0152.12.27
CA-RPC-NNS838.62282432191.11.1440.2160.13.98
CA-RPC-NPS456.52265231832.01.2057.3160.12.79
CA-RPC-SR627.87312733775.61.0858.9150.32.55
CA-RPC-STD799.54248532301.51.3032.198.03.05
Note: Fcr = cracking load; Fy = yield load; Pu = ultimate load-bearing capacity; wy = deflection corresponding to Fy; wu = deflection corresponding to Pu.
Table 6. Parameters of material in CDP model.
ParametersValue
Dilation Angle30°
Eccentricity0.1
fb0/fc01.05
Kc2/3
Viscosity Parameter0.0001
Poisson’s Ratio0.2
Table 7. Cracking load of the specimens.
Name of the SpecimenFcr, FEM (kN)Fcr, test (kN)Fcr, FEM to Fcr, test Ratio
C50-NPS238.37210.321.13
CA-RPC-ER434.25388.221.12
CA-RPC-NNS854.74838.621.02
CA-RPC-NPS504.45456.521.10
CA-RPC-SR747.16727.871.03
CA-RPC-STD841.16799.541.05
Table 8. Set of the models in the parameter analysis.
Name of the ModelConcrete MaterialPrestress (kN)Type of Connectors
CR-9-UCA-RPC900URSP connectors
CR-0-UCA-RPC0URSP connectors
CR-9-SCA-RPC900Ordinary studs
CR-0-SCA-RPC0Ordinary studs
C-9-UC50900URSP connectors
C-0-UC500URSP connectors
C-9-SC50900Ordinary studs
C-0-SC500Ordinary studs
Table 9. Comparison of plastic resistance moment between calculation and experiment results.
Name of the SpecimenExperimental Results
Mexp (kN·m)
Calculation Results
Mcal (kN·m)
Mcal to Mexp Ratio
C50-STD4522.44288.00.948
CA-RPC-ER4698.04288.00.913
CA-RPC-NNS4828.54288.00.888
CA-RPC-NPS4774.24288.00.898
CA-RPC-SR5065.14288.00.847
CA-RPC-STD4845.74288.00.885
Average value0.897
Disclaimer/Publisher’s Note: The statements, opinions and data contained in all publications are solely those of the individual author(s) and contributor(s) and not of MDPI and/or the editor(s). MDPI and/or the editor(s) disclaim responsibility for any injury to people or property resulting from any ideas, methods, instructions or products referred to in the content.

