Article

Effect of Preload on Box-Section Steel Columns Filled with Concrete under Axial Load: A Numerical Study

by
Ahmed Mohamed Sayed
1,2
1
Department of Civil and Environmental Engineering, College of Engineering, Majmaah University, Al-Majmaah 11952, Saudi Arabia
2
Department of Civil Engineering, College of Engineering, Assiut University, Assiut 71511, Egypt
Buildings 2024, 14(9), 2924; https://doi.org/10.3390/buildings14092924
Submission received: 13 August 2024 / Revised: 28 August 2024 / Accepted: 14 September 2024 / Published: 15 September 2024
(This article belongs to the Special Issue Advances in Steel–Concrete Composite Structures)

Abstract

:
External loads applied to a box-section steel column before it is filled with concrete to increase its efficiency due to modifications in structural systems or design errors may reduce its ultimate capacity and change its structural behavior. To examine this effect, finite element modeling (FEM) has been used to simulate these columns under preloading at different ratios with many variables in the geometric dimensions of the columns. The FEM results have been investigated using 38 experimental specimens obtained from previous studies without preloading. The results demonstrated high accuracy in modeling these columns in structural behavior and ultimate load capacity. After verifying the results, 84 Concrete-Filled Steel Columns (CFSC) were modeled under different preload ratios. The results indicated that some variables have directly affected the value of the decrease in column capacity in terms of its height, wall thickness, yield stress, and preload ratios, while others were inversely proportional in terms of the cross-section dimensions and concrete strength. The preload effect ratio had two separate limits, where when it reached 70%, the maximum value of the decrease in column capacity was 10.90%. The value increased sharply reaching 19.90% when there was a preload equal to 80%. New equations have been proposed to predict the ultimate capacity of CFSC under preloading with suitable accuracy with a correlation coefficient of no less than 0.949.

1. Introduction

Steel columns in structural systems may be defined as the backbone of steel buildings and great attention during design is given to them. Many shapes are used as steel columns, including I-sections, boxes (rectangles and squares), and built-up sections of angles or channels. These sections can be bonded to concrete by filling or encasing them to form a composite section. It might encounter certain problems that appear in the steel construction sites as a result of an increase in loads on the box columns as a result of a change in the structural system or an error in the design. It is categorically pivotal to build up these steel columns to resist any increase in the loads applied to them. Therefore, one of the strengthening methods is to use concrete to fill the box columns though they are under the influence of the already existing loads (preloading). Through literature review, it has been found out that many studies and even existing codes (ANSI/AISC 360-22 [1] and Eurocode-4 [2]) focused on this type of column labeled (composite section), but no preloading has been applied. That is, the column is just filled with concrete and then exposed to loads. This method of loading does not represent the application in reality if the columns are filled with concrete while they are under the influence of existing loads due to their presence in the current construction system.
Recently, many studies have paid attention to studying the behavior of Concrete-Filled Steel Columns (CFSC), whether it is a normal-strength [3,4,5] or high-strength concrete [6,7,8]. Among the normal-strength concrete studies was Schneider [9]. A number of 14 steel columns with different cross-sections consisting of 3 circular, 6 rectangular, and 5 square were tested under axial load. The concrete cylinder strength used ranged from 24 to 31 MPa and the yield stress ranged from 312 to 537 MPa. Different column wall thicknesses were used, which resulted in column width- or diameter-to-thickness ratios ranging from 17 to 50.8. The most important results are that the axial load behavior is greatly affected by the cross-section shape and the ratio of column dimensions to wall thickness. Uy [10] performed an experiment testing 19 square CFSC with concrete strength ranging from 28 to 32 MPa and a steel yield stress of 750 MPa. The test results indicated that the Eurocode-4 [2] approach was unsafe for the specimens exposed to pure axial load or bending. The reason was the Eurocode-4, which assumes concrete to be plastic (fully crushed) and steel to be elastic (fully yielded). Han [11] conducted experimental tests on 24 steel columns consisting of 20 rectangles and 4 squares tested under axial load. The concrete strength was 48.3 MPa and the steel yield stress ranged from 194 to 228 MPa. Han [11] concluded that the steel column behavior was influenced by the tube width ratio and material properties. Dondo [12] has conducted experimental studies on the behavior of 29 square steel tubes filled with concrete under compression load. The cross-section of the steel tubes ranges from 60 × 60 × 3.0 mm to 150 × 150 × 4.5 mm. The slenderness ratio ranges from 6.67 to 27.0, while the depth-to-wall column thickness ranges from 33.87 to 50.00. Specimens with high depth-to-wall thickness ratios (b/t) had more local buckling or bulging compared to those with small b/t ratios. All concrete-filled square columns experienced a decrease in their strength with an increase in the slenderness ratio. Further tests have been conducted by Shaker-Khalil and Molly [13] on concrete-filled rectangular hollow sections with 3 to 9 m heights with dimensions of 120 × 80 × 5 mm and 150 × 100 × 5 mm. The concrete strength ranged from 40.8 to 47.2 MPa while the steel yield stress ranged from 340 to 363 MPa. The conclusion showed that filling the section with concrete increased the capacity of the cross sections of columns 120 × 80 × 5 mm and 150 × 100 × 5 mm by 12% and 65%, respectively. Column failure occurred due to overall flexural buckling of the column with no sign of local buckling. Zhu et al. [14] have investigated the behavior of 30 square CFSC with concrete strength ranging from 24.47 to 26.58 MPa and yield stress ranging from 235 to 345 MPa. Five different cross-section designs, including unstiffened and stiffened cross-sections, have been identified. The results concluded that the inner stiffeners more significantly affected the failure mode, deformability, and overall strength of the composite columns. To study this type of composite columns with stiffened cross-section, Tao et al. [15,16,17] and Liu et al. [18,19] conducted experimental and numerical studies on thin-walled tube columns where the steel walls were stiffened to improve their structural behavior. Some other studies, including experimental tests [20,21,22,23,24] and numerical analysis [25,26,27], took the effect of concrete filling on double-skin steel tubular columns into consideration. Zhang et al. [28,29] studied the static and dynamic loads of steel columns with unstiffened and stiffened cross-sections with thicknesses of 1.25 to 1.48 mm. It was also observed that the ultimate capacity increased with the number of stiffeners, and the columns with more stiffeners had better ductility.
In recent years, much attention has been paid to the behavior of composite columns constructed from high-strength concrete and steel [30,31,32,33,34]. Based on the experimental test results of 41 circular steel columns with yield stress ranging from 410 to 435 MPa and concrete strength ranging from 58 to 96 MPa. Kilpatrick and Rangan [35] confirmed that the slenderness and load eccentricity significantly affected the strength of columns. Experimental testing of 22 specimens under axial compressive load was performed by Liu [36]. The test variables include a cross-section aspect ratio of 1.0 to 2.0, a steel-to-concrete volume ratio of 0.13 to 0.17, a steel yield stress of 495 MPa, and a concrete strength of 60 to 89 MPa. The confinement achieved by the steel section increases the strength of the concrete. Strength improvement is negatively affected by the section aspect ratio. Sakino et al. [37] axial loading tests have been performed on 48 square and 36 circular steel columns. The test parameters were material strengths with yield stress ranging from 262 to 853 MPa, concrete strength ranging from 25 to 91 MPa, and volumetric steel-to-concrete ratio from 0.09 to 0.26. The rest results showed that the strength improvement was attributed to the strain hardening of the steel section instead of the confinement effect. The concrete filling increased the strength of square columns more than the circular ones. In addition, some studies [10,38,39,40] have mainly focused on investigating the reliability of various existing codes, ANSI/AISC 360-22 [1] and Eurocode-4 [2], in predicting the ultimate capacity of CFSC.
For several reasons, many studies in the last three decades have relied directly on using a finite element modeling (FEM) system. It saved time and effort and reduced the costs of preparing experimental tests. There were some special tests such as preload or load cycle tests that were difficult to perform in the laboratory due to the unavailability of testing machines or preload systems. Added to this difficulty were the long duration of the tests and the lack of a safety factor while conducting these tests. Therefore, the researchers selected FEM programs with the highest accuracy in modeling structural elements to obtain the required reliability. FEM analysis was used to model steel tube columns whether unfilled [41,42,43] or filled with concrete [44,45,46,47,48,49,50] under the influence of axial load, or with the use of flexural load [51,52,53]. Wang et al. [43] conducted FEM analysis on 20 specimens of steel tube columns without concrete filling, and the results compared to experimental tests were very accurate. The average ultimate capacity ratio was 1.016 with a Coefficient of Variation, COV, equal to 5.66%. Dai and Lam [46] carried out FEM simulations on 21 specimens of concrete-filled steel tube columns with elliptical hollow sections. The results of comparing the FEM analysis with experimental tests were an excellent match in both structural behavior (load-axial shortening curve), failure mode, and ultimate load capacity. The average ultimate capacity ratio was 1.013 with COV equal to 2.75%. Tao et al. [49] have conducted a FEM analysis on 340 samples collected from previous studies. The results showed great accuracy using FEM analysis, as the average ultimate capacity reached 1.024, 1.009, and 1.037 for each of the 142 circular columns, 154 square columns, and 44 rectangular columns with a standard deviation equal to 0.065, 0.078, and 0.079, respectively. One of the applications of FEM analysis was the preload modeling. Sayed [54] has conducted a FEM study on reinforced concrete columns under preloading, which were strengthened using steel jacketing. The average ultimate capacity ratio of columns with or without strengthening was 1.003, with COV = 3.16% and a correlation coefficient, r, of 0.987. These results demonstrated the accuracy and reliability of using the FEM simulation system in modeling these structural elements. From the literature review, it was found that it was difficult to conduct experimental tests of these columns under the influence of preload due to the long time of the test and the method of representing the loads required for this. It was also found that using the FEM system had great accuracy in modeling this type of structural elements in obtaining the behavior of these elements and their ultimate capacity.
In this study, the FEM analysis will be applied to simulate these concrete-filled columns with or without preloading. Many of the previously mentioned variables will be used specifically compared to those that are likely to have an impact on the ultimate capacity of the steel columns under preload. These variables will be modeled in terms of column height, column wall thickness, yield stress, cross-section dimensions, and concrete strength under the influence of preload ratios equal to 40%, 60%, 70%, and 80% of the ultimate capacity of the steel column without concrete filling. First, the results of the FEM analysis will be verified through comparison with specimens available from previous studies [12,14,36,38,39] without preloading. Also, the results will be compared with the prediction of existing codes, ANSI/AISC 360-22 [1] and Eurocode-4 [2], to obtain the accuracy of their use in such columns and the extent of safety in the design. Second, the effect of preload ratios will be obtained with all these variables on the ultimate axial load capacity of CFSC. Thirdly, the possibility of proposing a new model that can predict the ultimate axial load capacity of CFSC under preloading is tangible, taking into account all the variables under study.

2. Existing Models

Many existing models, including international codes [1,2] or scientific papers, have provided equations that could predict the ultimate capacity of these types of structural elements, especially CFSC. The model is available through the ANSI/AISC 360-22 [1] in the chapter on designing composite elements, as in Equation (1). This model can predict the plastic axial compressive strength of CFSC without consideration of the column length effect.
N P = f y A s + K f c A c
where fy is steel column yield stress, As is the steel column cross-section, fc is the compressive strength of the concrete-filled steel column, Ac is the area of the concrete section, and K is a coefficient that depends on the cross-sectional shape of the steel column equal to 0.95 for columns with a round cross-section and 0.85 for other shapes. Some conditions have been set for using this model, as the concrete strength must not be less than 21 MPa and not more than 69 MPa. The yield stress of the steel column must not be more than 525 MPa. To take the column length into account, Equation (2) must be used to calculate the critical elastic buckling load.
N e = π 2 ( E I ) e f f / L 2 c
where Lc is the effective column length, (EI)eff is the effective stiffness of composite section calculated by Equation (3), Es and EC are the modulus of elasticity of steel and concrete, respectively, Is and Ic are the moment of inertia of steel and concrete column, respectively, and C3 is the coefficient for effective rigidity.
( E I ) e f f = E s I s + C 3 E c I c
C 3 = 0.45 + 3 A s A c 0.9
There are two column conditions based on the ratio between the width and the thickness of the steel column wall. The first is that the column is a compact section, when the ratio (λ = b/t) is less than Equation (5), in which the column nominal axial compressive strength Nno = NP. The second case is that the column section is noncompact, when the ratio (λ = b/t) is less than Equation (6), so the Nno calculation is based on Equation (7).
λ P = 2.26 E s f y
λ r = 3.00 E s f y
N n o = N P ( N P N y λ r λ P λ λ P 2 )
N y = f y A s + 0.7 f c A c
To calculate the ultimate axial load capacity of the CFSC, two cases where the ratio between the column’s nominal axial compressive strength and the critical elastic buckling column load (Nno/Ne) are used, and their comparison is 2.25 where
N n = N n o ( 0.658 ( N n o N e ) )   When N n o N e   2.25  
N n = 0.877 N e   When N n o N e > 2.25  
To use the Eurocode-4 [2] in designing such a case, Equation (11) can be used. The axial compressive plastic resistance load of the composite column can be obtained as follows:
N n = f y A s + 0.85 f c A c
Equation (11) applies to concrete partially and encased steel sections. For CFSC, the coefficient of 0.85 is replaced with 1.0. Therefore, the Equation (11) is modified to
N n = f y A s + f c A c

3. Finite Element Model Study

3.1. Concrete Modeling and Properties

To perform the numerical analysis process, the ANSYS program was used. To model the concrete used to fill steel columns, the element SOLID65 is accordingly used [55]. This element contains eight points each containing three degrees of freedom (DOFs) in the X, Y, and Z directions. It can also provide high-accuracy modeling in deforming the plastic, breaking, and crushing in three directions. For the ANSYS program to employ the characteristics required for concrete modeling, some important characteristics must be defined. The stress–strain relationship for the concrete is used, as well as the shear transfers coefficient β, uniaxial tensile stress, modulus of elasticity, and Poisson’s ratio. The modulus of elasticity can be calculated from Equation (13), and through it, the rest of the characteristics of the stress–strain relationship in the elastic and plastic stages can be obtained [49,56].
E c = 4700 f c
f e l = 0.30   f c  
E c = f e l / ε e l  
  ε 0 = 2 f c E c
  f = E c ε 1 + ( ε / ε o ) 2
wherein
  • fel = the stress at the elastic strain (εel) in the elastic range.
  • εo = the strain at the ultimate cylinder compressive strength.
  • f = the stress at any strain ε.
Regarding the shear transfer coefficient β [55], the values range from 0.0 for a smooth crack to 1.0 for a rough crack [57,58]. By reviewing previous studies [56,59], the best shear transfer coefficient was obtained, with the coefficient of open crack at, βt = 0.2, and the coefficient of closed crack, βc = 0.8. Also, the uniaxial tensile stress, fr, can be calculated from Equation (18), and Poisson’s ratio of 0.2 for concrete was applied [49]. Through these equations, the stress–strain relationship for different grades of concrete can be calculated, which will be used in the FEM analysis process, as listed in Table 1.
f r = 0.623 f c

3.2. Steel Column Modeling and Characteristics

To model the steel columns, element SOLID185 was used [55]. This element contains eight points with 3-DOFs in three directions: x, y, and z. There are many properties of this element that it is capable of plasticity, creep, hyperelasticity, large deflection, and larger capabilities of strain. This is also suitable for asymmetric meshes and the ability to simulate deformations of elastic–plastic materials. The properties of the steel used to model the steel columns are introduced from the relationship between stress and strain, as well as the modulus of elasticity, based on the values included in previous studies from experimental tests [12,14,36,38,39]. A Poisson’s ratio of 0.3 for steel was used. Table 2 shows the stress–strain relationship available in previous studies and used in modeling steel in the FEM analysis process.
The contact elements of TARGE170 and CONTA174 [55] were used to model the contact between the steel column wall and the filling concrete that functions as Coulomb’s friction model. CONTA174 applies to 3D geometrical elements with an 8-node intended for flexible–flexible and rigid–flexible contact analysis, which can be applied to the contact between solid bodies or shells. The CONTA174 contact element is associated with the 3D target segment element TARGE170 located on the surface of 3D solid elements. It has the same geometric characteristics as the underlying elements. TARGE170 was applied with 3D surface-to-surface contact elements with the CONTA174. In the basic Coulomb friction model (τlim = μP + b), two surfaces in contact can carry shear stresses, where μ = isotropic friction coefficient, p = normal contact pressure, and b = contact cohesion. Through the CONTA174 element, an option can be provided to specify the maximum equivalent frictional stress τmax. Therefore, sliding will occur if the magnitude of the equivalent frictional stress reaches this value, and when the equivalent shear stress is less than the limit of frictional stress, no motion occurs between the two surfaces, which is known as sticking.

3.3. Model Studies of Structure

Using the ANSYS program, 122 specimens were modeled, as they contain many of the variables that were taken in this study. These specimens were divided into two main groups.
The first group numbers 38 specimens obtained through data available in previous studies from experimental tests [12,14,36,38,39], as listed in Table 3. Modeling of these steel columns was performed, whether they were filled with concrete (30 specimens) or not (8 specimens). These specimens contain many variables, including cross-section dimensions, height, concrete strength, yield stress, and wall thickness of the steel columns. All these specimens were tested to the failure point under axial load. This group will verify the accuracy of FEM analysis results in modeling this type of structural element under the influence of many variables.
The second group consists of 84 specimens that were selected based on some available data conducted as a literature review [12,14,36,38,39] and were modeled with dimensions similar to reality. These specimens were tested under three stages of axial load. The first stage is based on a hollow steel column without a concrete filling. The second stage uses CFSC without preloading. In the third stage, these columns were tested at four percentages of preload, where there was 40%, 60%, 70%, and 80% of the ultimate load of the steel column without concrete filling. Then, add concrete to the steel column after reaching this percentage of preload until the failure load. Table 4 contains all the variables in terms of dimensions and characteristics of the materials used in this study.

3.4. Choosing the Optimal Mesh Convergence

The size of the elements used in FEM analysis plays a major role in the accuracy of the results and in the time taken to perform the analysis. Therefore, this section aims to determine the appropriate element mesh size in FEM analysis to obtain acceptable accuracy in the results with the least possible number of elements. To obtain this result, the density of the mesh was changed by changing the size of the elements from 2.5 mm to 20 mm, while monitoring the effect of this on the ultimate load capacity. The CFSC (S3-150-4.5/2.7) [12] was chosen as the largest specimen dimension for this operation. The relationship between the number of elements and the corresponding ultimate axial load capacity resulting from the FEM analysis is plotted, as shown in Figure 1. It is clear from Figure 1 that after the number of elements equals 389,680, the effect on the ultimate load capacity is not noticeable. From this result, the mesh dimensions corresponding to this number of elements can be adopted in conducting FEM analysis tests on the remaining specimens. Therefore, the FEM analysis model was divided into small elements with maximum typical dimensions of 5 mm in width, length, and height, respectively.

4. Verify the FEM Results and Existing Codes with Experimental Tests

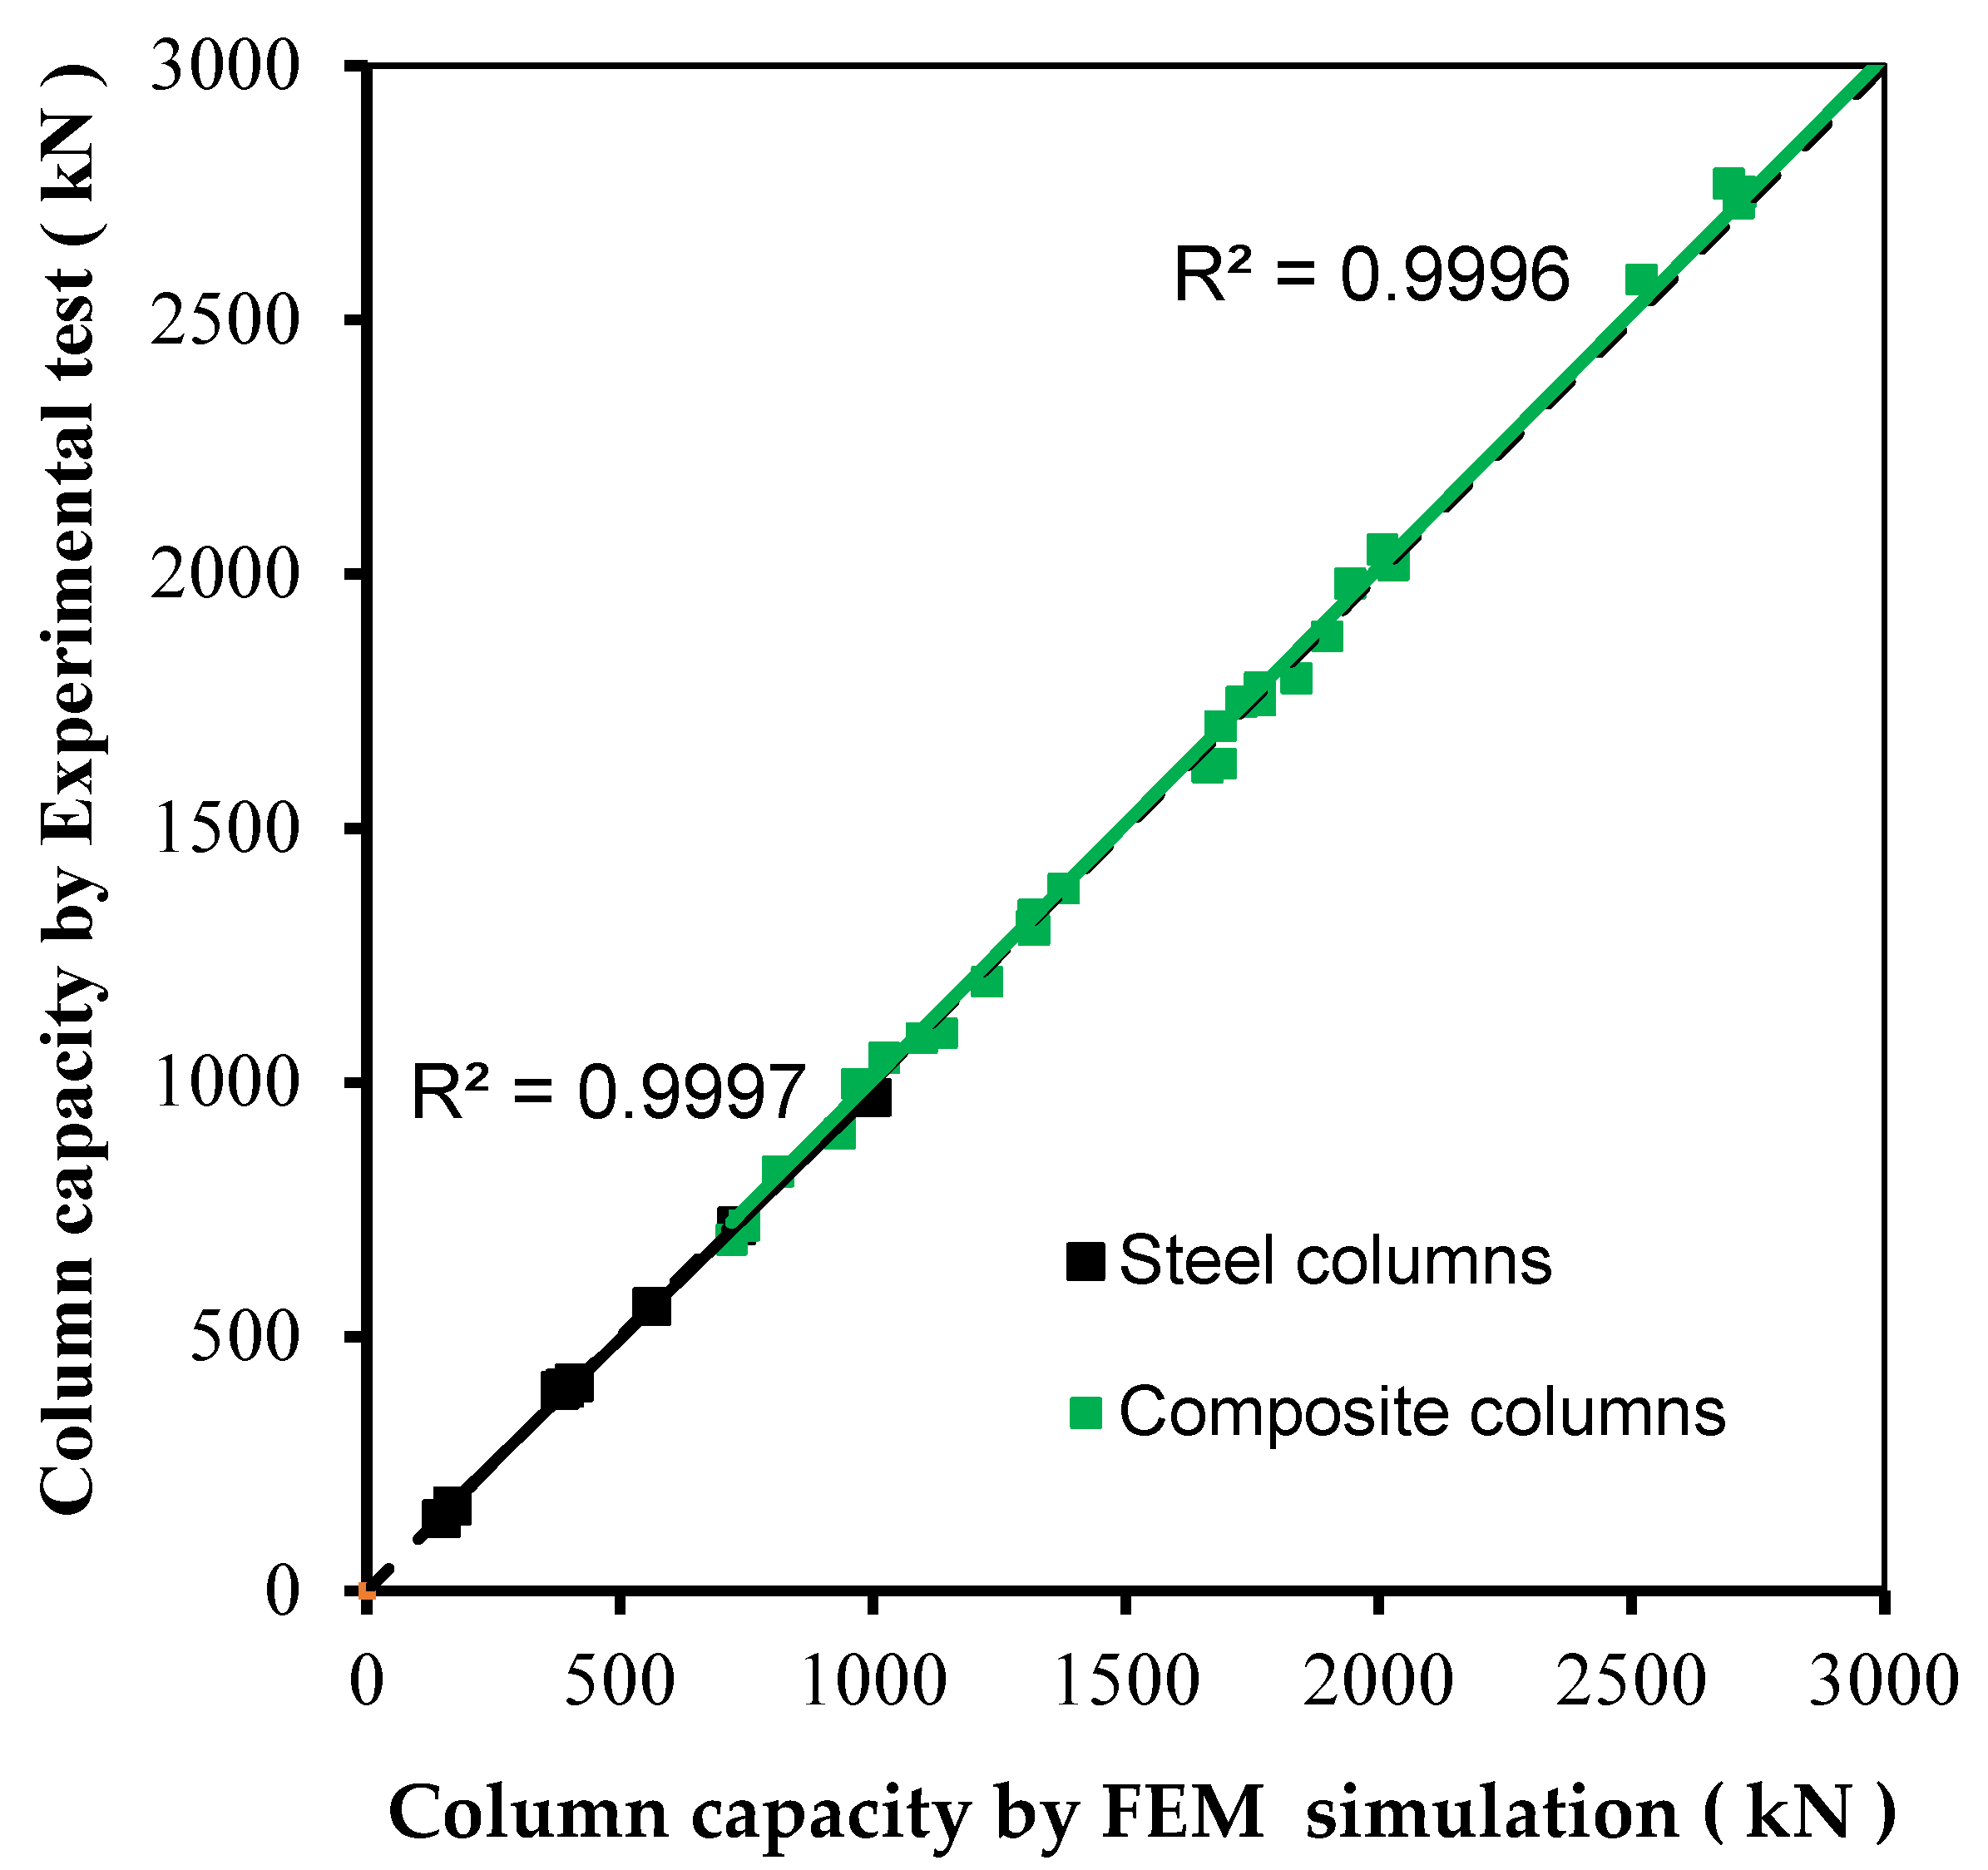
4.1. Verify the FEM Results

The ultimate strength of structural elements is often the most important thing that can be obtained from testing and analyzing specimens. To verify the reliability and validity of the FEM analysis results, the ultimate axial load capacity results were compared with the experimental test results, as shown in Table 5, for CFSC while Table 6 for steel columns is not filled (with concrete).
Table 5 shows the values of the ultimate axial load for both FEM analysis and experimental tests and the ratio between them, NFEM/NExp, and the relationship is drawn in Figure 2. From Figure 2 and Table 5 for CFSC, the average ratio of NFEM/NExp equals 1.002, with COV = 2.25% and r equal to 0.999. Also, according to Table 6 and Figure 2, for steel columns not filled with concrete, the average ratio of NFEM/NExp equals 1.005, with COV equal to 2.41% and r equal to 0.999. From a statistical perspective, whether steel columns are filled with concrete or not, the reliability and validity of the results measured from the FEM analysis are an excellent match. This high accuracy and agreement in the results are consistent with the results of previous studies [43,44,45,46,47,48,49,50,51,52,53,54] that used FEM analysis in modeling such structural elements.
Through the load and axial shortening curves measured from the experimental tests and resulting from the FEM analysis of these specimens, the relationship between the load and axial shortening was drawn, as shown in Figure 3 and Figure 4. These specimens represent many considered variables. Where the compressive strength of concrete ranges from 26.6 to 89 MPa, the yield stress of steel ranges from 382 to 495 MPa, and the dimensions of columns range in ratios from 1.0 to 2.0; whereas, the wall thickness of columns ranges from 4.0 to 10.1 mm, as well as the height of the columns, which ranges from 360 to 600 mm. Figure 3 represents the relationship between load and axial shortening resulting from the FEM analysis, which has a very high accuracy when compared with the same experimental test results for these specimens (R1-1, R2-2, R3-2, R7-1, R8-1, and R9-1) provided in Liu [36]. Figure 4 represents the load-strain relationship obtained from FEM analysis, which is in excellent agreement with the same experimental test specimens Pa-6-1 and Pa-10-1 provided in Zhu et al. [14]. From Figure 3 and Figure 4, the accuracy resulting from comparing experimental results and FEM analysis of the behavior of the columns in applied load and axial shortening curves is an excellent match.
Here are the deformations and locations of the failure modes available through previous studies [14,36] from experimental tests and the same failure modes that can be obtained from FEM analysis. The degree of similarity between experimental tests and FEM analysis is an excellent match, as shown in Figure 5. A similar match of the deformation shape in Figure 5a was found with the same specimen Pa-6-1 available in Zhu et al. [14], and also in Figure 5b with the same specimen R4-2 available in Liu [36]. It clearly shows that the failure location most observed in these columns filled with concrete is the occurrence of local buckling, which is in the upper third of the column at the location of the applied load.

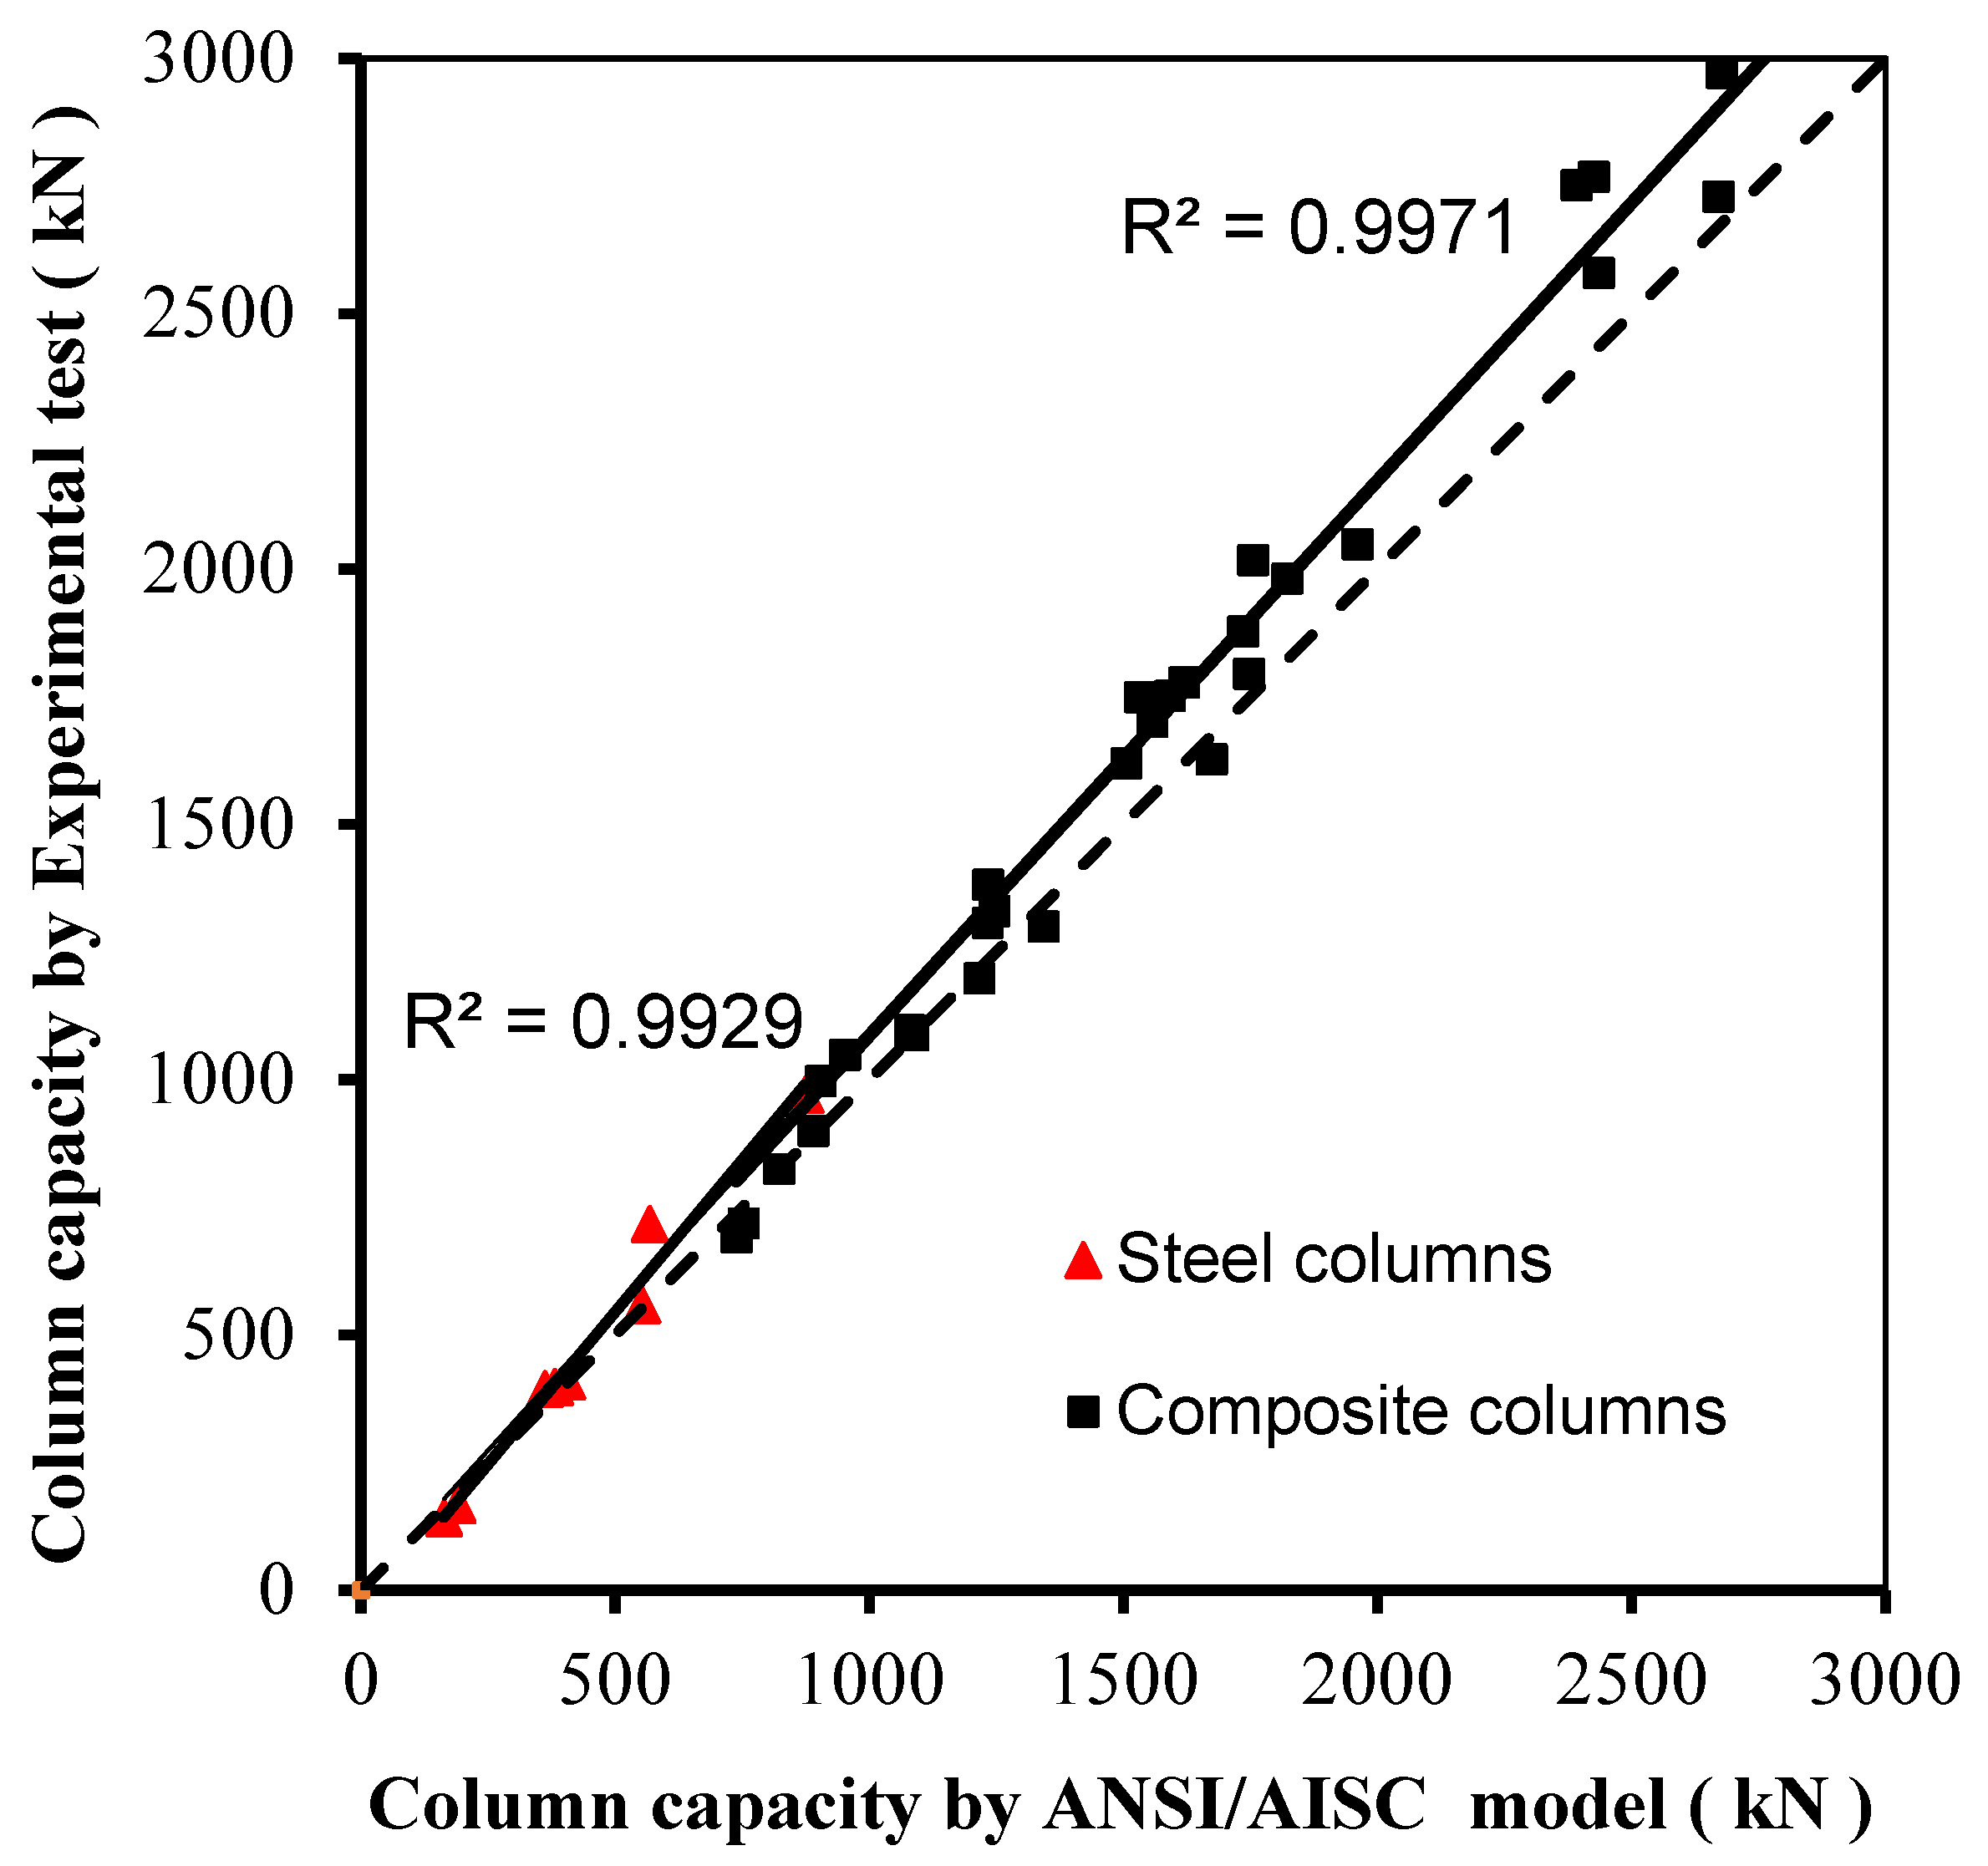
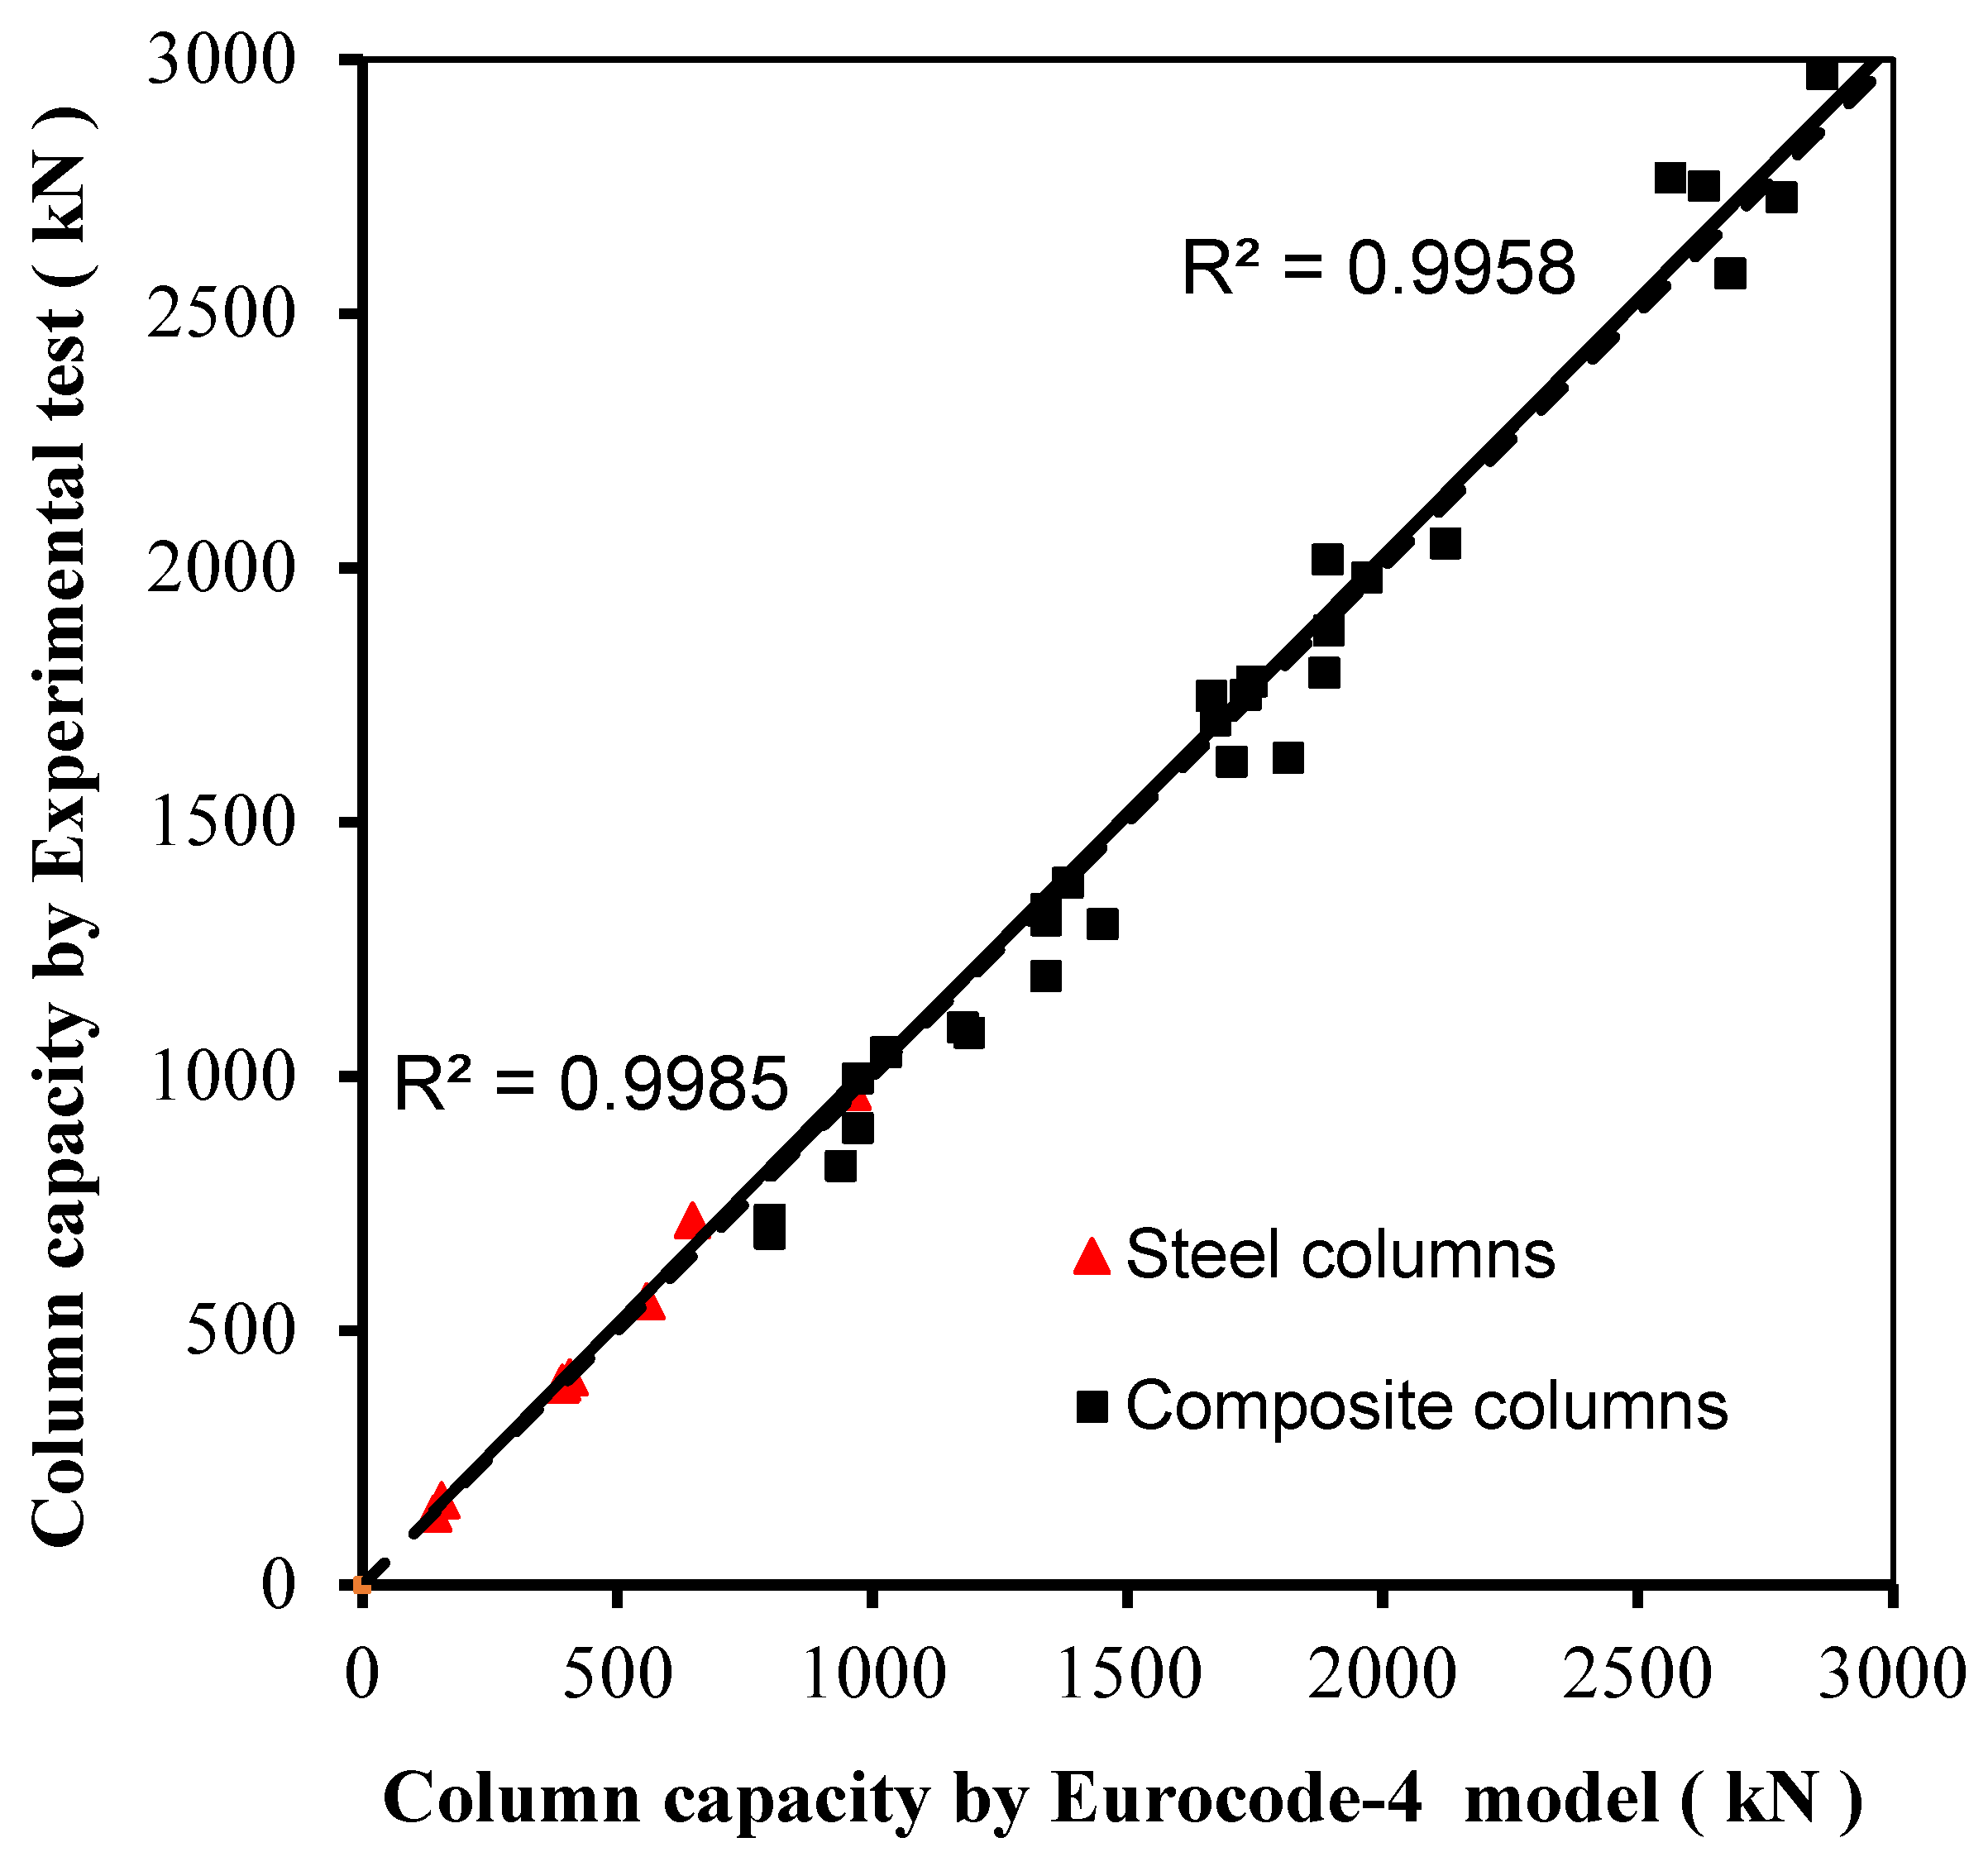
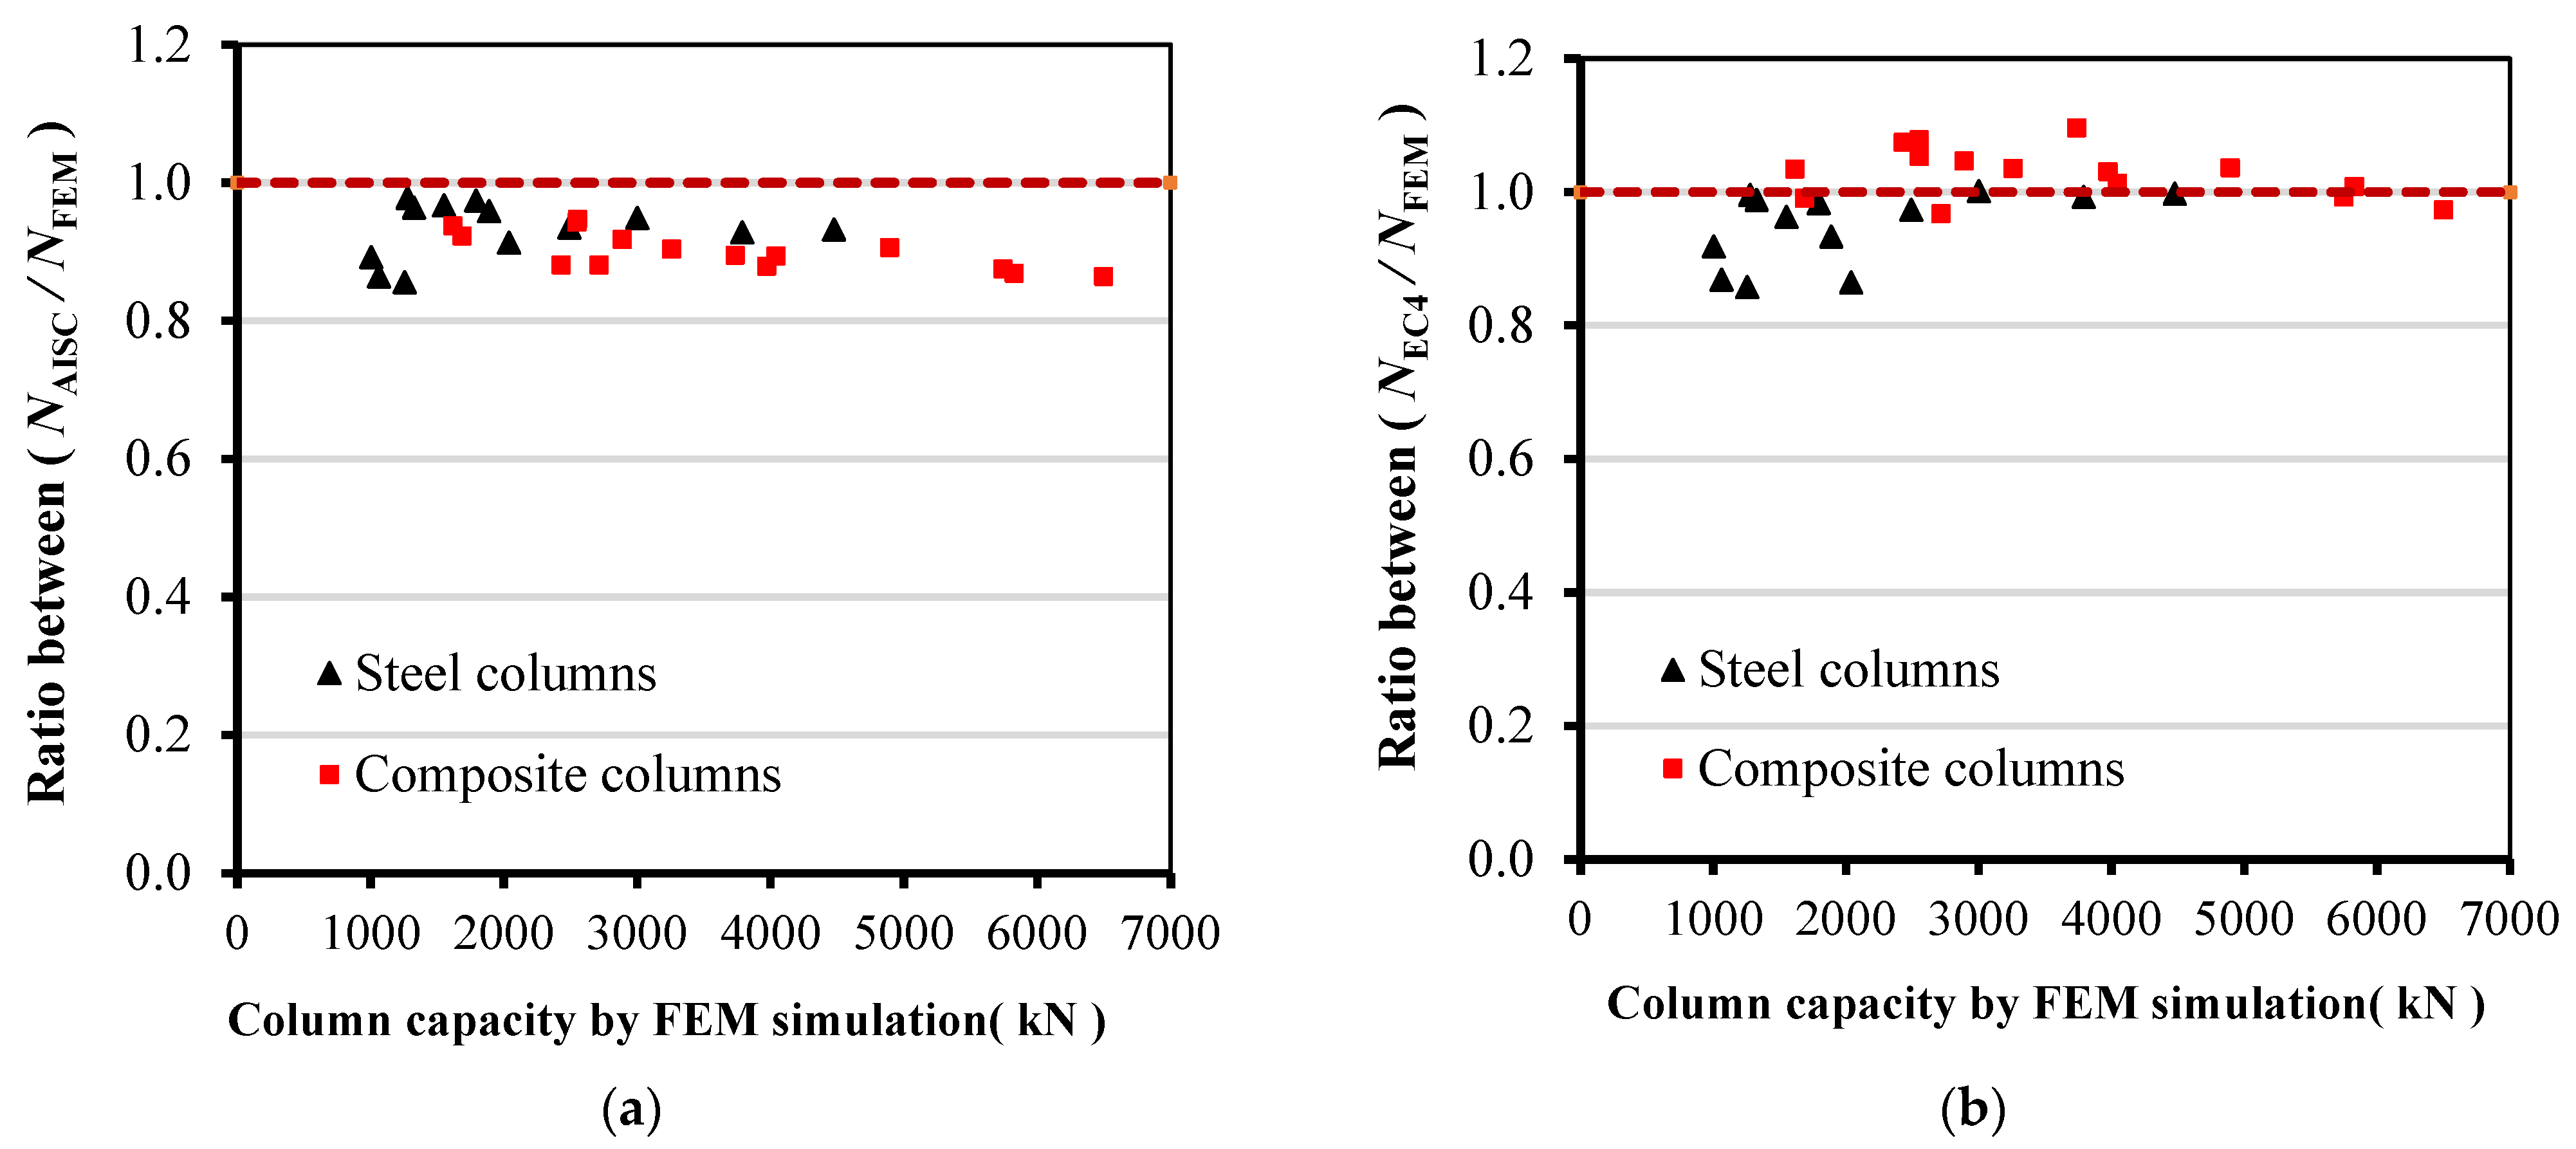
4.2. Verify the Existing Code Results

The most two important codes were selected from the existing codes, ANSI/AISC 360-22 [1] and Eurocode-4 [2], on which most models in studies or other codes are based, namely, ANSI/AISC 360-22 and Eurocode 4. The ultimate axial load of these steel columns was calculated through the equations provided in these codes, which appear in this study as Equations (1)–(12). These values were listed in Table 3 and Table 4, and a relationship was drawn between the calculated load and the experimental test results, as shown in Figure 6 for the ANSI/AISC 360-22, and Figure 7 for the Eurocode 4.
The tables and figures show that according to the ANSI/AISC 360-22, the ultimate capacity of columns filled with concrete can be predicted with an average ratio NAISC/NExp equal to 0.945, with COV equal to 6.08% and r equal to 0.998. As for columns not filled with concrete, the average ratio NAISC/NExp is equal to 0.980, with COV equal to 12.25%, and r equal to 0.996. From a statistical perspective, in most cases, the values calculated from the ANSI/AISC 360-22 are less than the ultimate capacity of steel columns, whether filled with concrete or not. This means that it is on the safe side of the design.
As for the Eurocode-4, the ultimate capacity of columns filled with concrete can be predicted with an average ratio NEC4/NExp equal to 1.024, with COV equal to 6.65% and r equal to 0.997. As for columns not filled with concrete, the average ratio NEC4/NExp is equal to 0.970, with COV equal to 3.73% and r equal to 0.996. It is clear from these results that Eurocode 4 predicts values greater than the ultimate capacity of CFSC, i.e., on the unsafe side of the design. However, it predicts values less than the ultimate capacity of steel columns not filled with concrete, i.e., on the safe side of the design. All these results relate to steel columns without preload.

5. Results and Discussion

To evaluate the effect of preload on the ultimate axial load capacity of CFSC, FEM analysis was performed on 84 specimens. Preloading was performed on the columns at ratios equivalent to 40%, 60%, 70%, and 80% of the ultimate load capacity of the steel columns not filled with concrete. In other words, these preload ratios were applied to the columns with several variables, cross-section dimensions, column height, concrete strength, yield stress, and wall thickness of steel columns. Meanwhile, existing codes, ANSI/AISC 360-22 and Eurocode-4, were used to compare with these results from preload, as shown in Table 7.

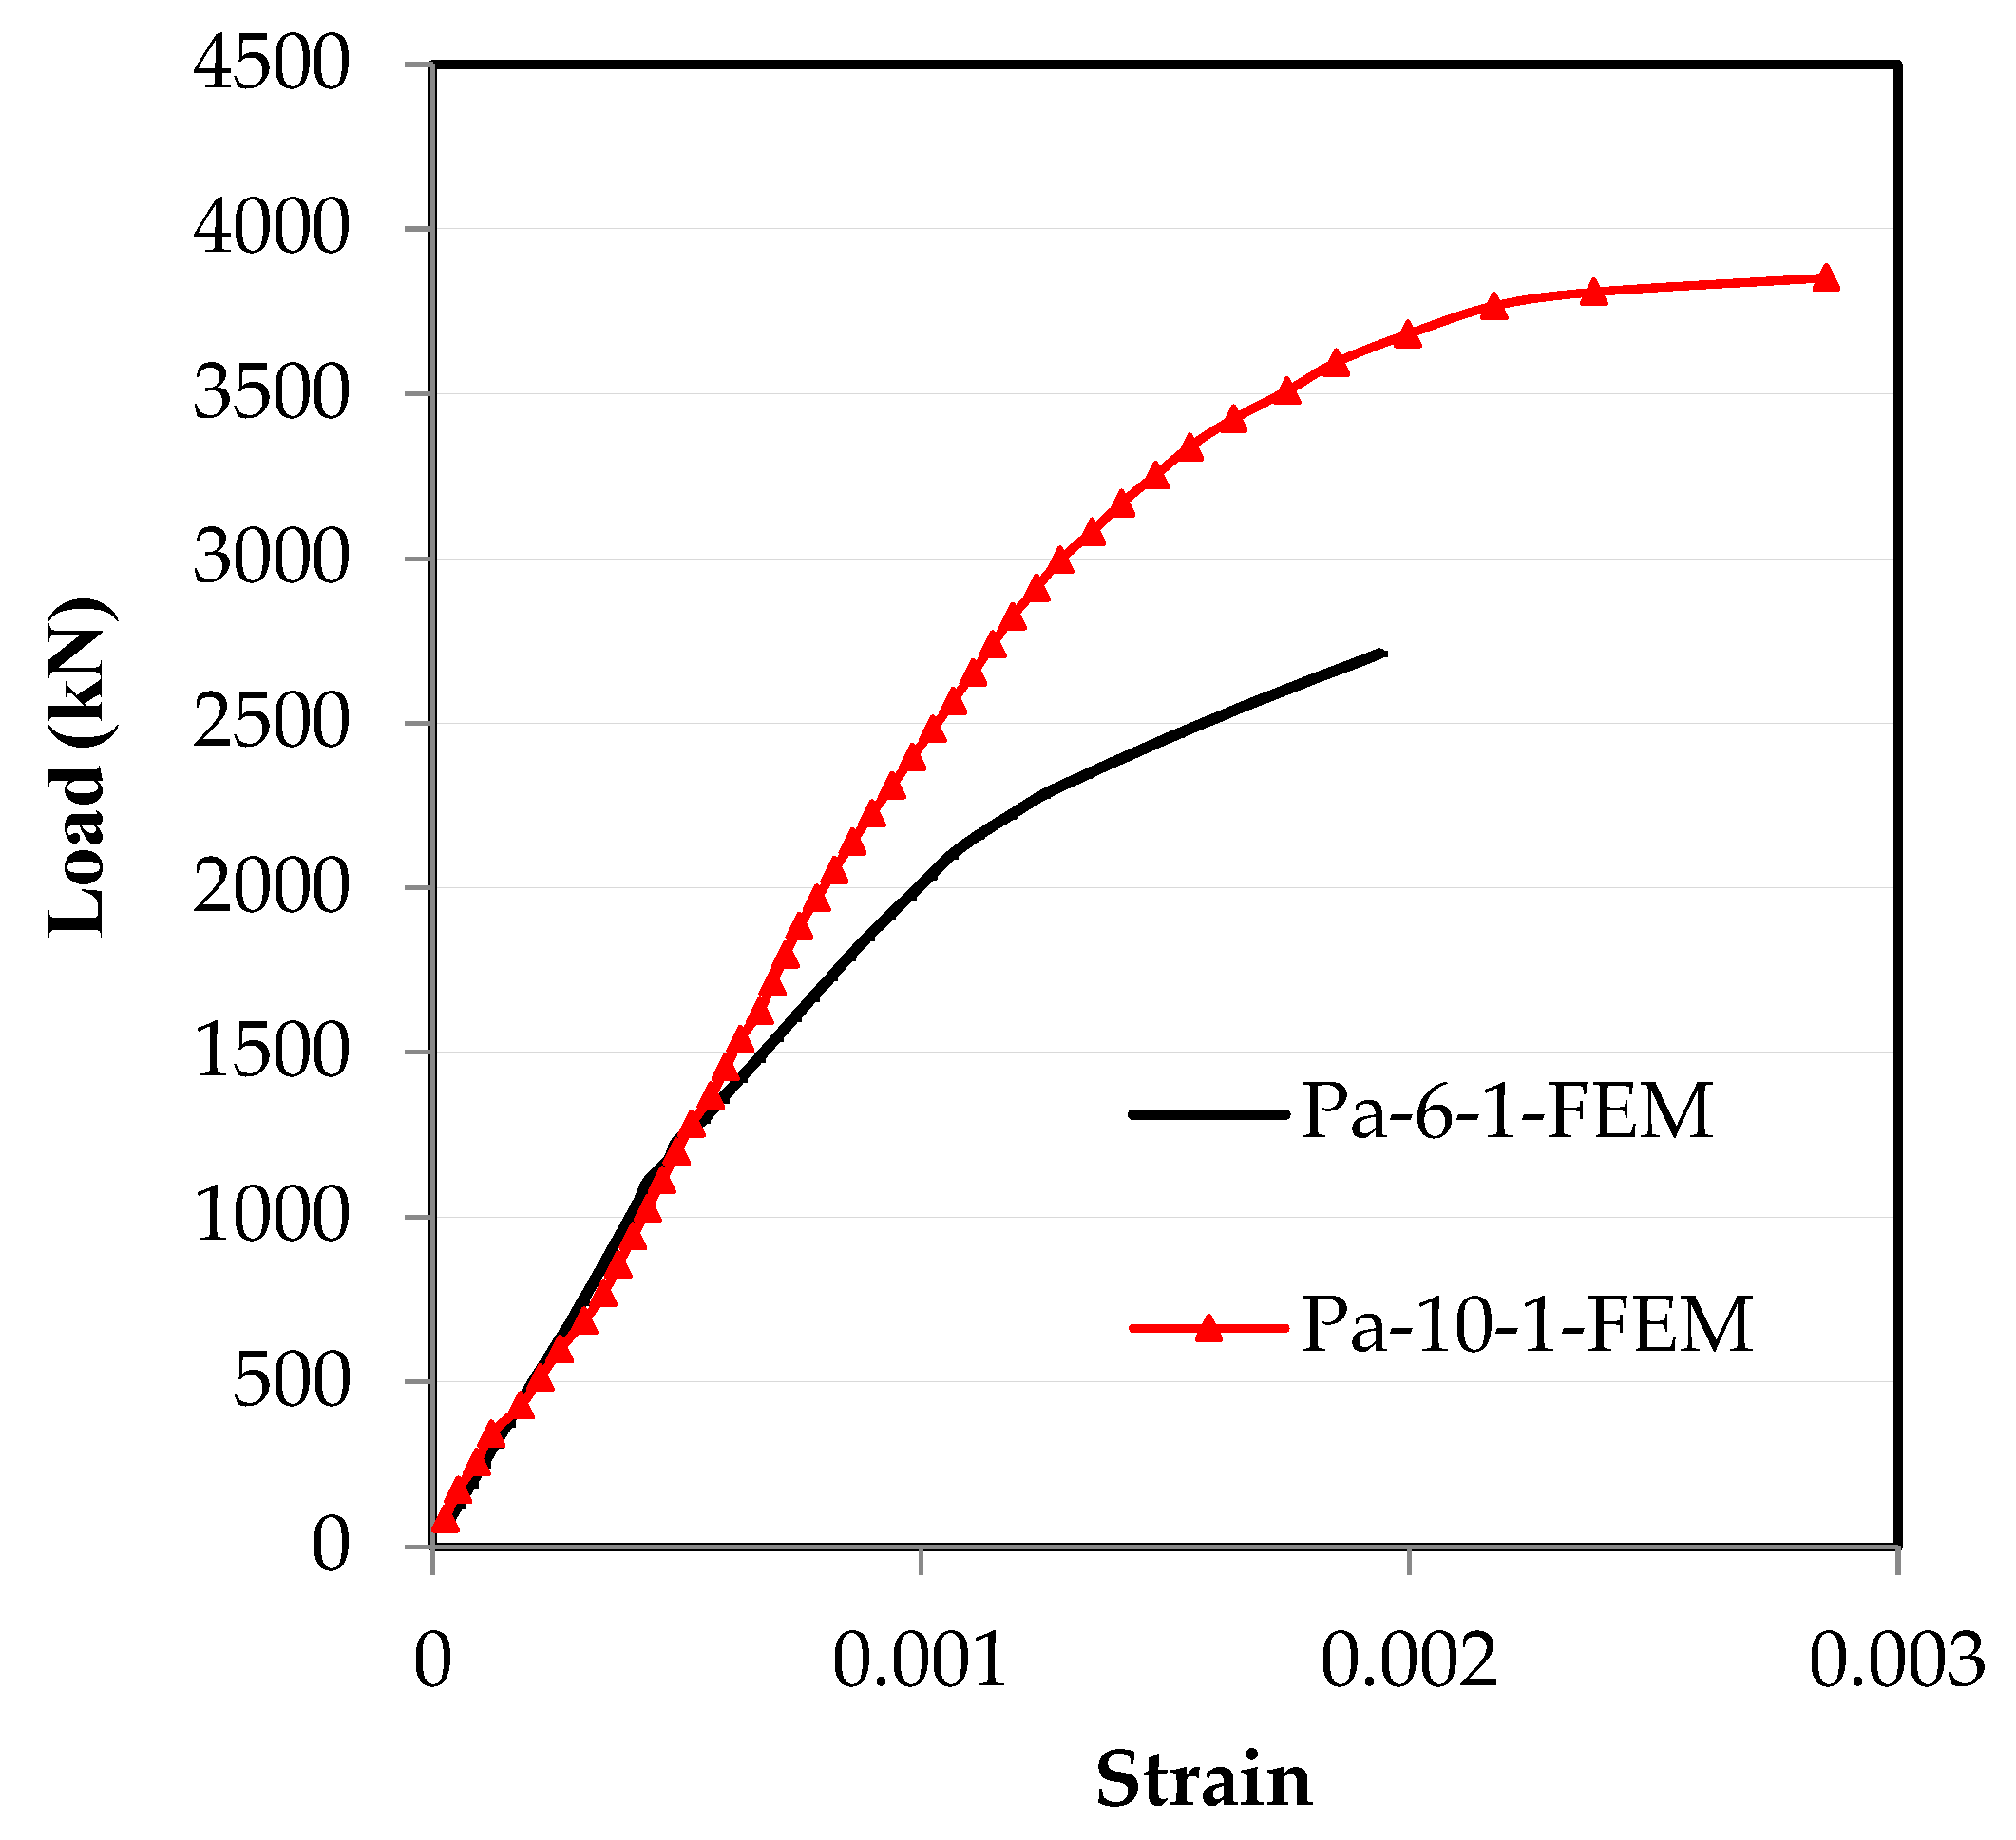
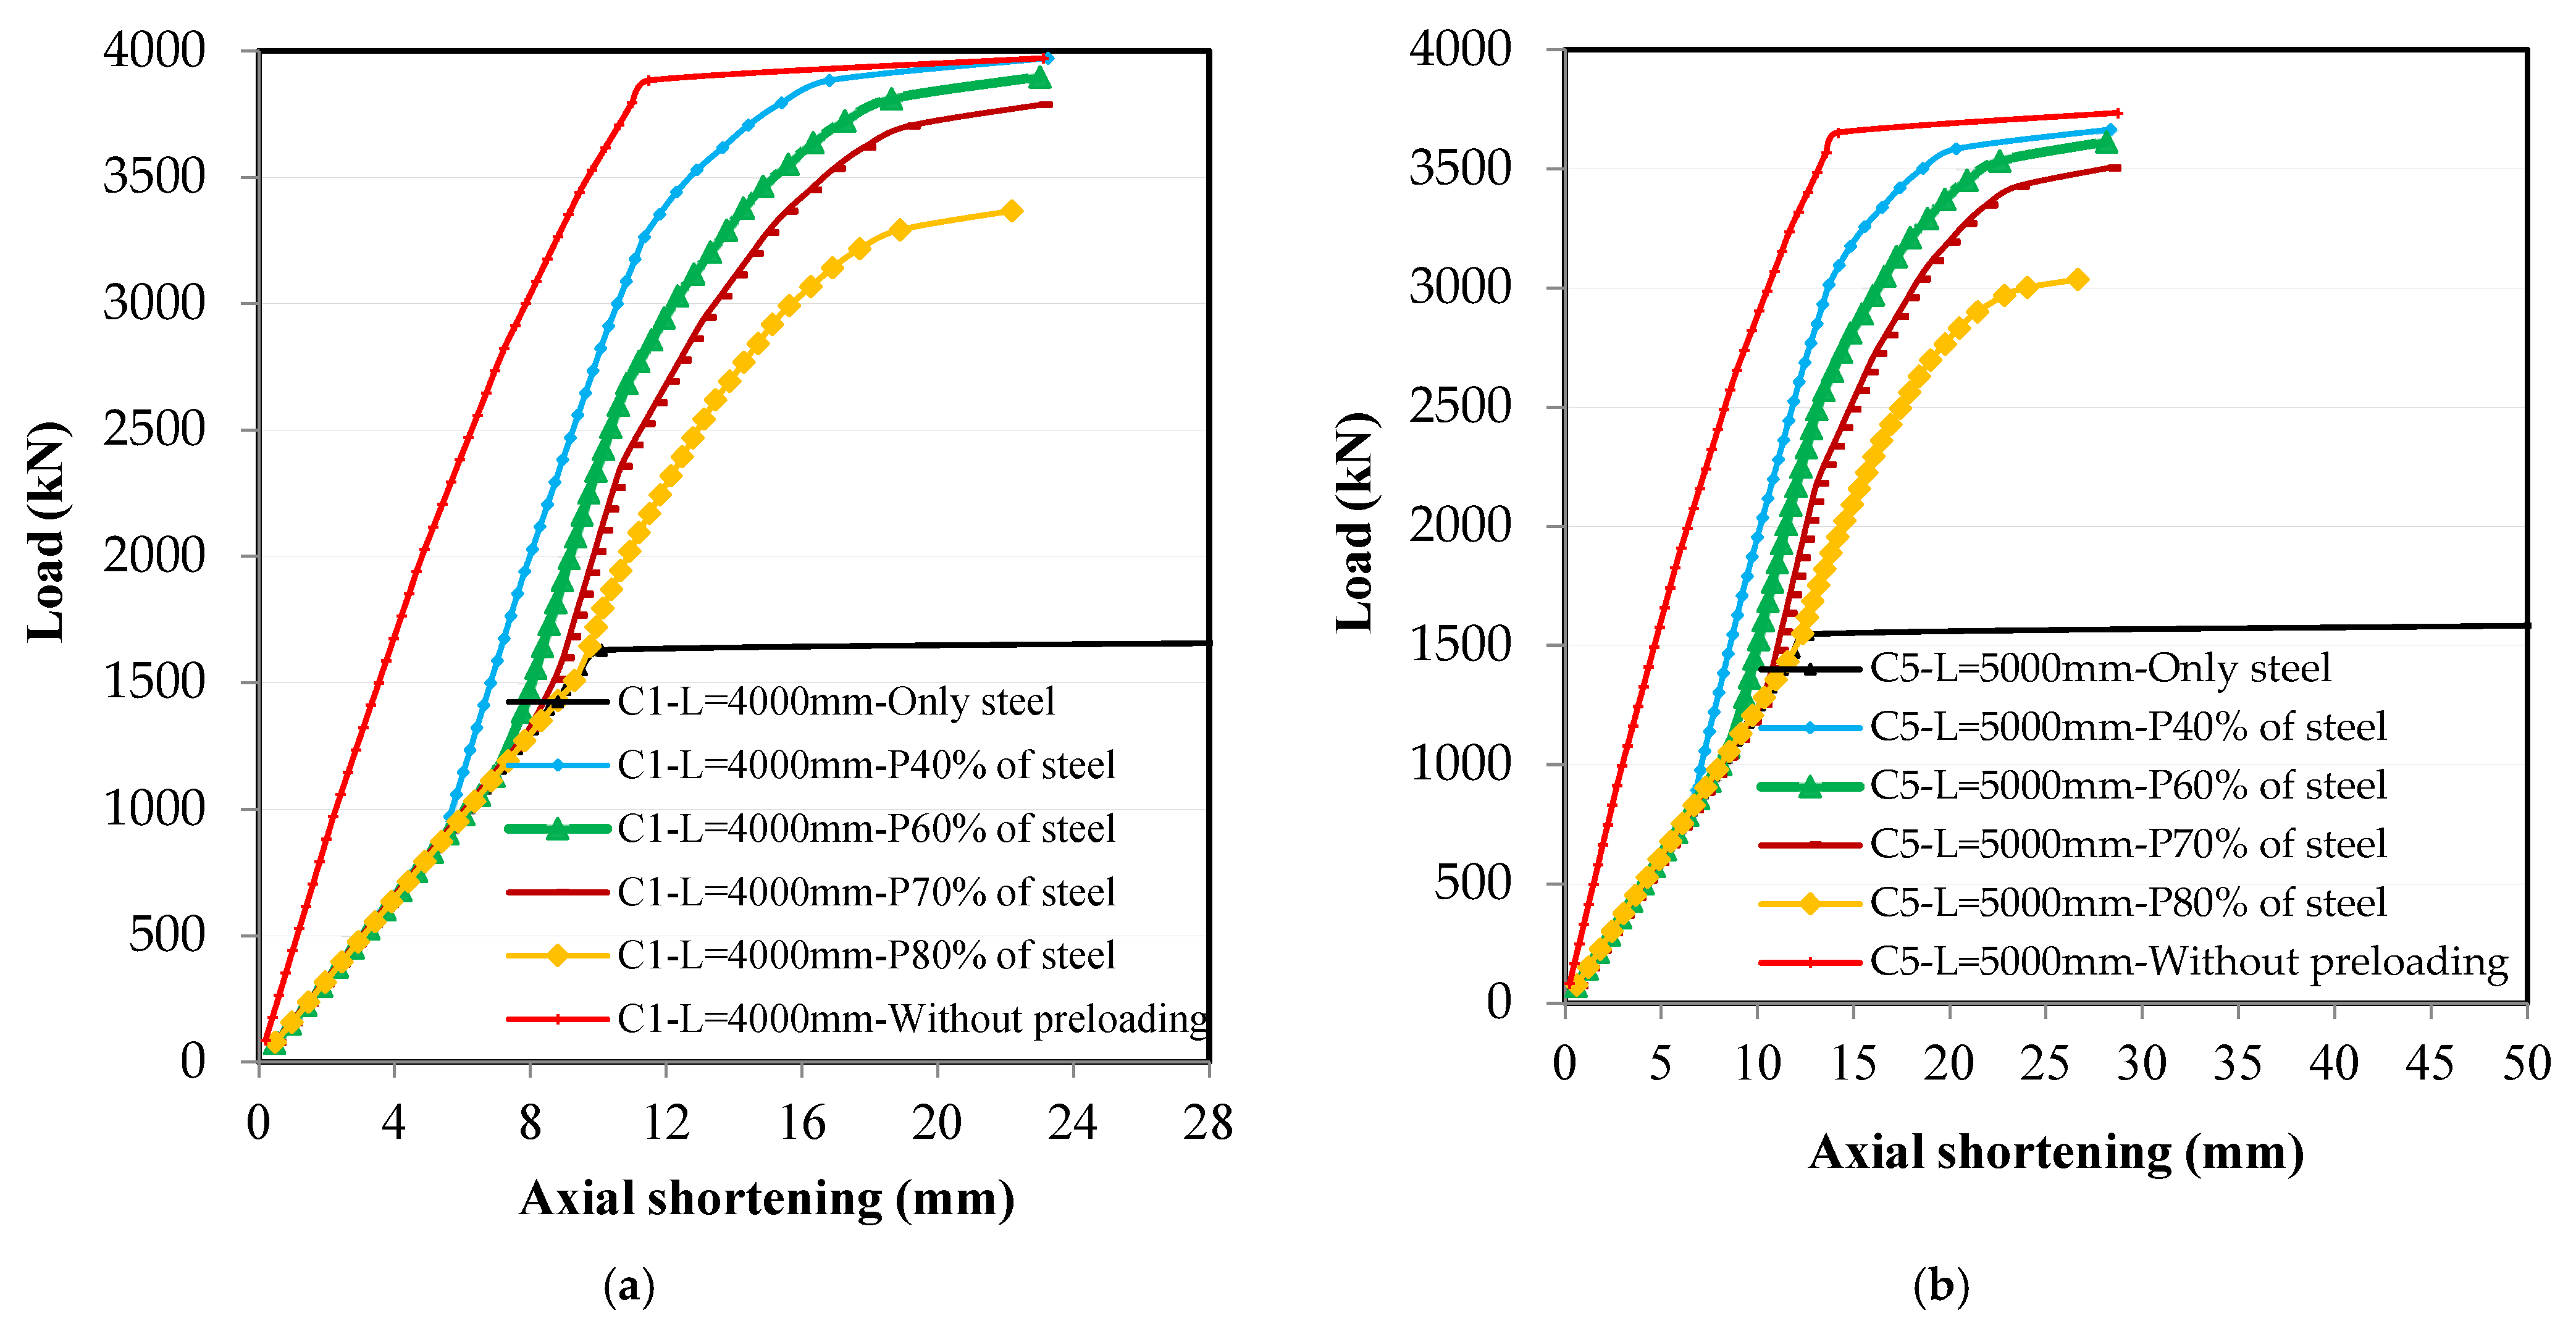
5.1. The Behavior of Applied Load and Axial Shortening

The behavior of steel columns is directly explained through the relationship between load and axial shortening. In general, the ultimate load increases when concrete is used to fill steel columns. This increase tends to subside when there is preload on steel columns not filled with concrete. However, the decrease in the ultimate capacity of the columns does not occur at all with preload ratios or the same value, as the variables mentioned above affect the value of this effect. For example, when using preload ratios of 40%, 60%, 70%, and 80% on a column C1 with a height of 3000 mm, the load decrease was 1.00, 0.982, 0.954, and 0.848, respectively, of the ultimate capacity of the column filled with concrete without preload, as shown in Figure 8a. The value of this decrease in load entirely changes when using column C5 with a height of 5000 mm. The value of load decreases at the same preload ratios and becomes 0.982, 0.968, 0.938, and 0.813, respectively, as shown in Figure 8b.

5.2. The Effect of Variables and the Preload Ratio on the Efficiency of Columns

To obtain the effect of different variables and preload ratio on the efficiency of CFSC, Figure 9, Figure 10, Figure 11, Figure 12 and Figure 13 were drawn. Figure 9, Figure 10, Figure 11, Figure 12 and Figure 13 show the relationship between the ultimate capacity of preloaded columns to the ultimate capacity of columns without preload and the ratios of the effect of preload for each variable separately.

5.2.1. Effect of Column Cross-Section Dimensions

Figure 9 shows this relationship regarding changing the dimensions of the cross-section of the steel column, as was changed from 150 to 250 mm. It precisely shows that the effect of the cross-section dimensions is inversely proportional to the effect of the preload ratio. As the dimensions of the column’s cross-section increase, the effect of the preload ratio on the ultimate capacity of the column decreases. In addition, not all preload ratios have the same effect when the column’s cross-section varies. With preload ratios of 40%, 60%, 70%, and 80% and a column with dimensions of 150 mm, the ratios (NPL/Nuf) were 0.986, 0.961, 0.940, and 0.840, respectively, and through changing the column dimensions to 250 mm, they were 1.00, 1.00, 0.970, and 0.881, respectively. Through this, as the cross-section of the steel column increases, the efficiency and effect of the concrete fill increases.
Figure 9. The relationship between the ratio of the capacity with to without preload for the effect of cross-section dimensions.
Buildings 14 02924 g009

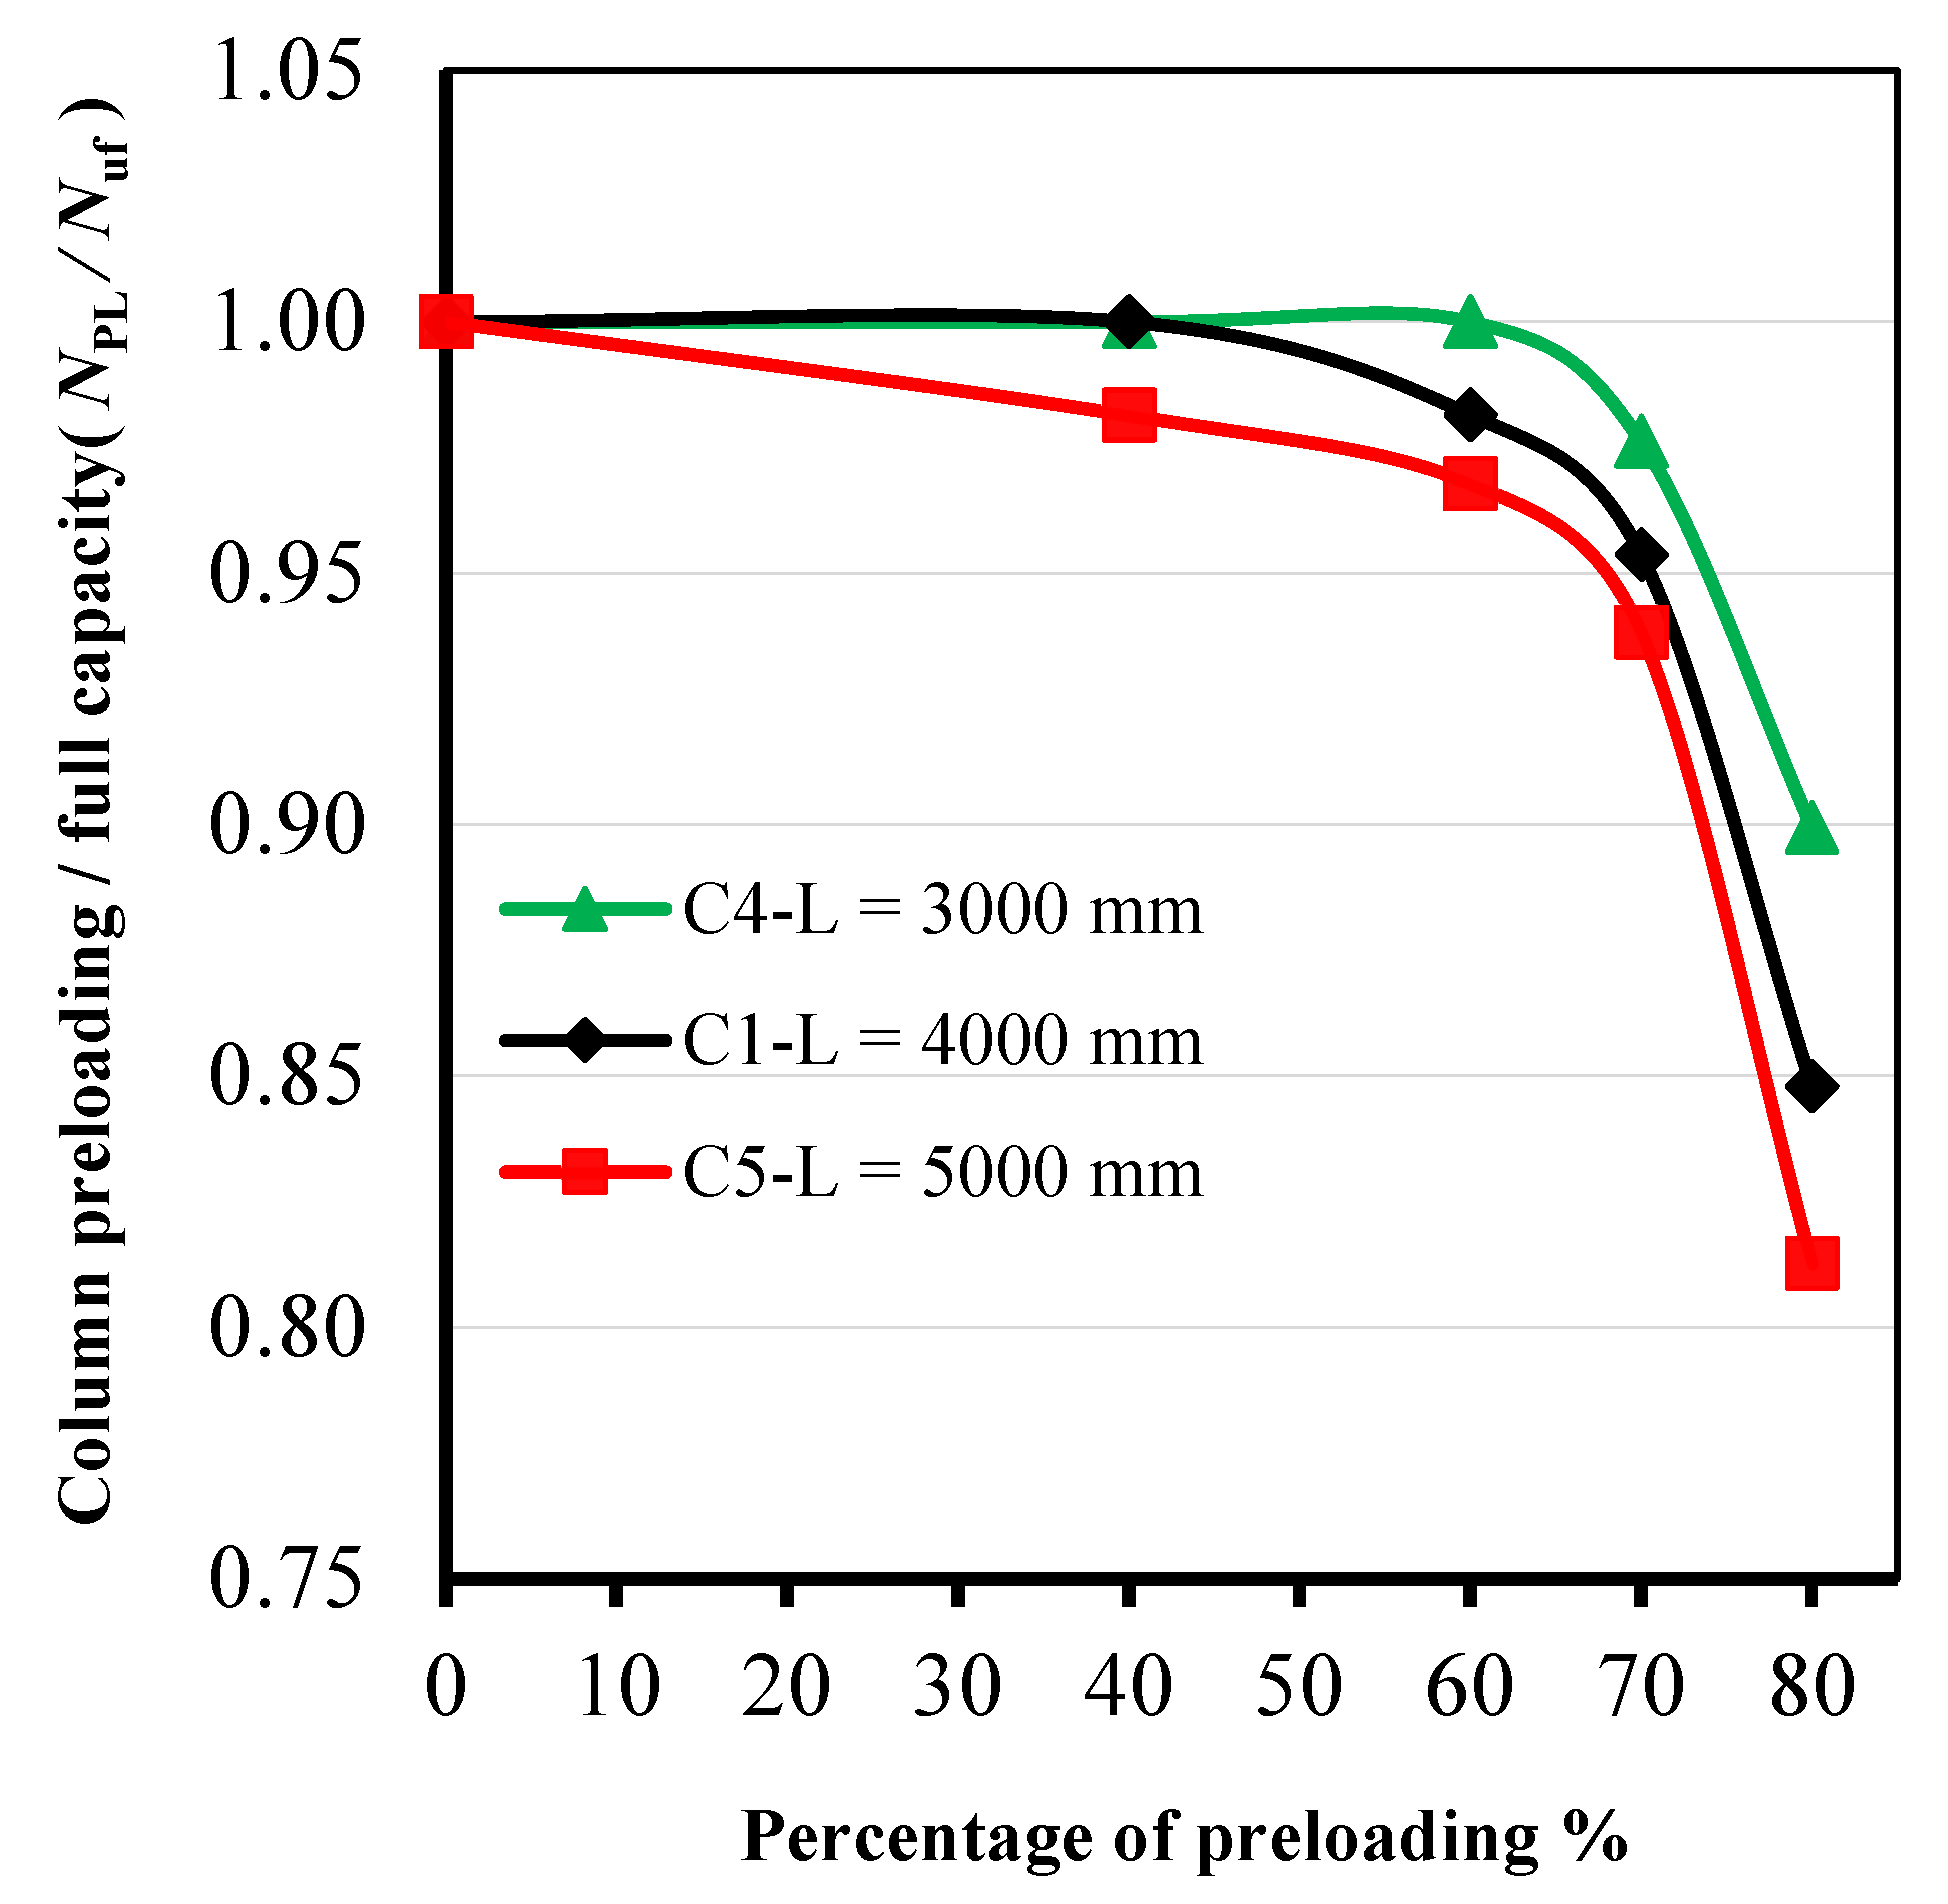
5.2.2. Effect of Column Height

Figure 10 shows this relationship regarding changing the steel column height, as it was changed from 3000 to 5000 mm. It clearly shows that the effect of column height is directly proportional to the effect of the preload ratio. As the height of the column increases, the impact of the preload ratio on the ultimate capacity of the column increases. With preload ratios of 40%, 60%, 70%, and 80% and with a column height of 3000 mm, the ratios NPL/Nuf were 1.00, 1.00, 0.976, and 0.900, respectively, and by changing the column height to 5000 mm, they were 0.981, 0.968, 0.938, and 0.813, respectively. From this, as the height of the steel column increases, the efficiency and effect of the concrete fill decreases.
Figure 10. The relationship between the ratio of the capacity with to without preload for the effect of column height.
Buildings 14 02924 g010

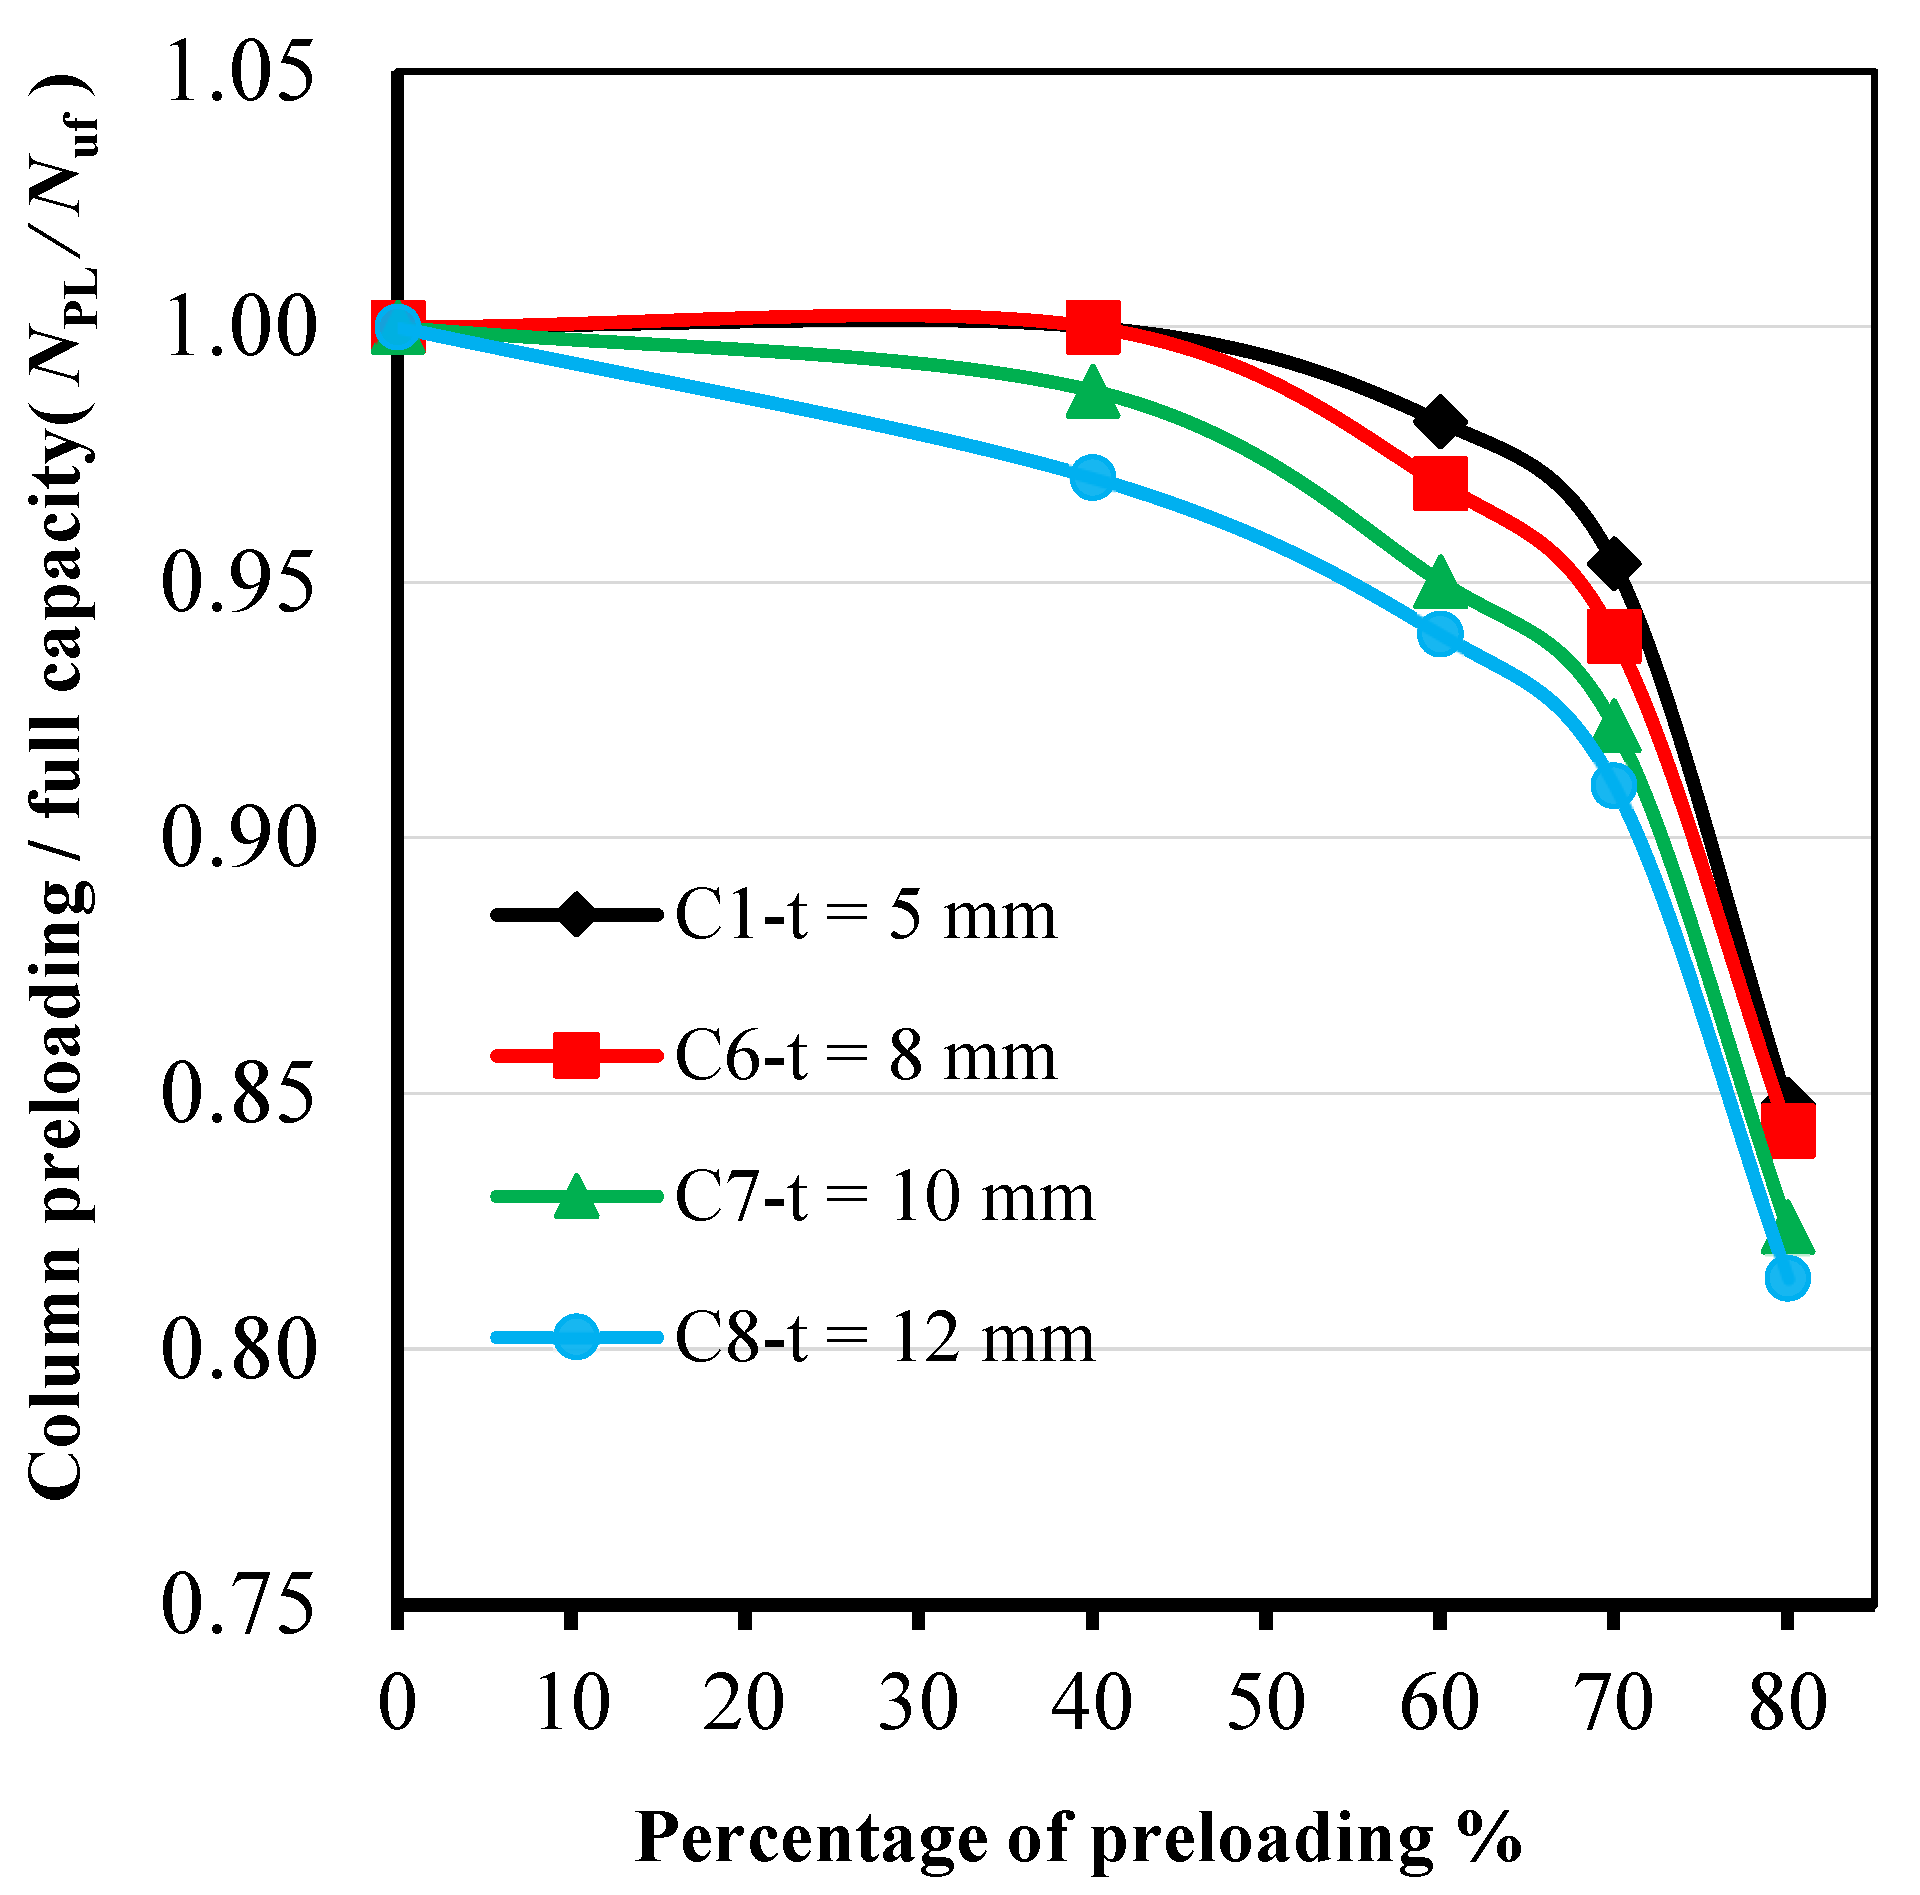
5.2.3. Effect of Column Wall Thickness

Figure 11 shows this relationship regarding changing the steel column wall thickness, as it was changed from 5.0 to 12.0 mm. The effect of the column wall thickness is directly proportional to the effect of the preload ratio. As the wall thickness of the column increases, the impact of the preload ratio on the ultimate capacity increases. With preload ratios of 40%, 60%, 70%, and 80% and with a column wall thickness of 5.0 mm, the ratios NPL/Nuf were 1.00, 0.982, 0.954, and 0.848, respectively, and by changing the column wall thickness to 12.0 mm, they were 0.971, 0.940, 0.910, and 0.814, respectively. Therefore, as the wall thickness of the steel column increases, the efficiency and effect of the concrete fill decreases.
Figure 11. The relationship between the ratio of the capacity with to without preload for the effect of column wall thickness.
Buildings 14 02924 g011

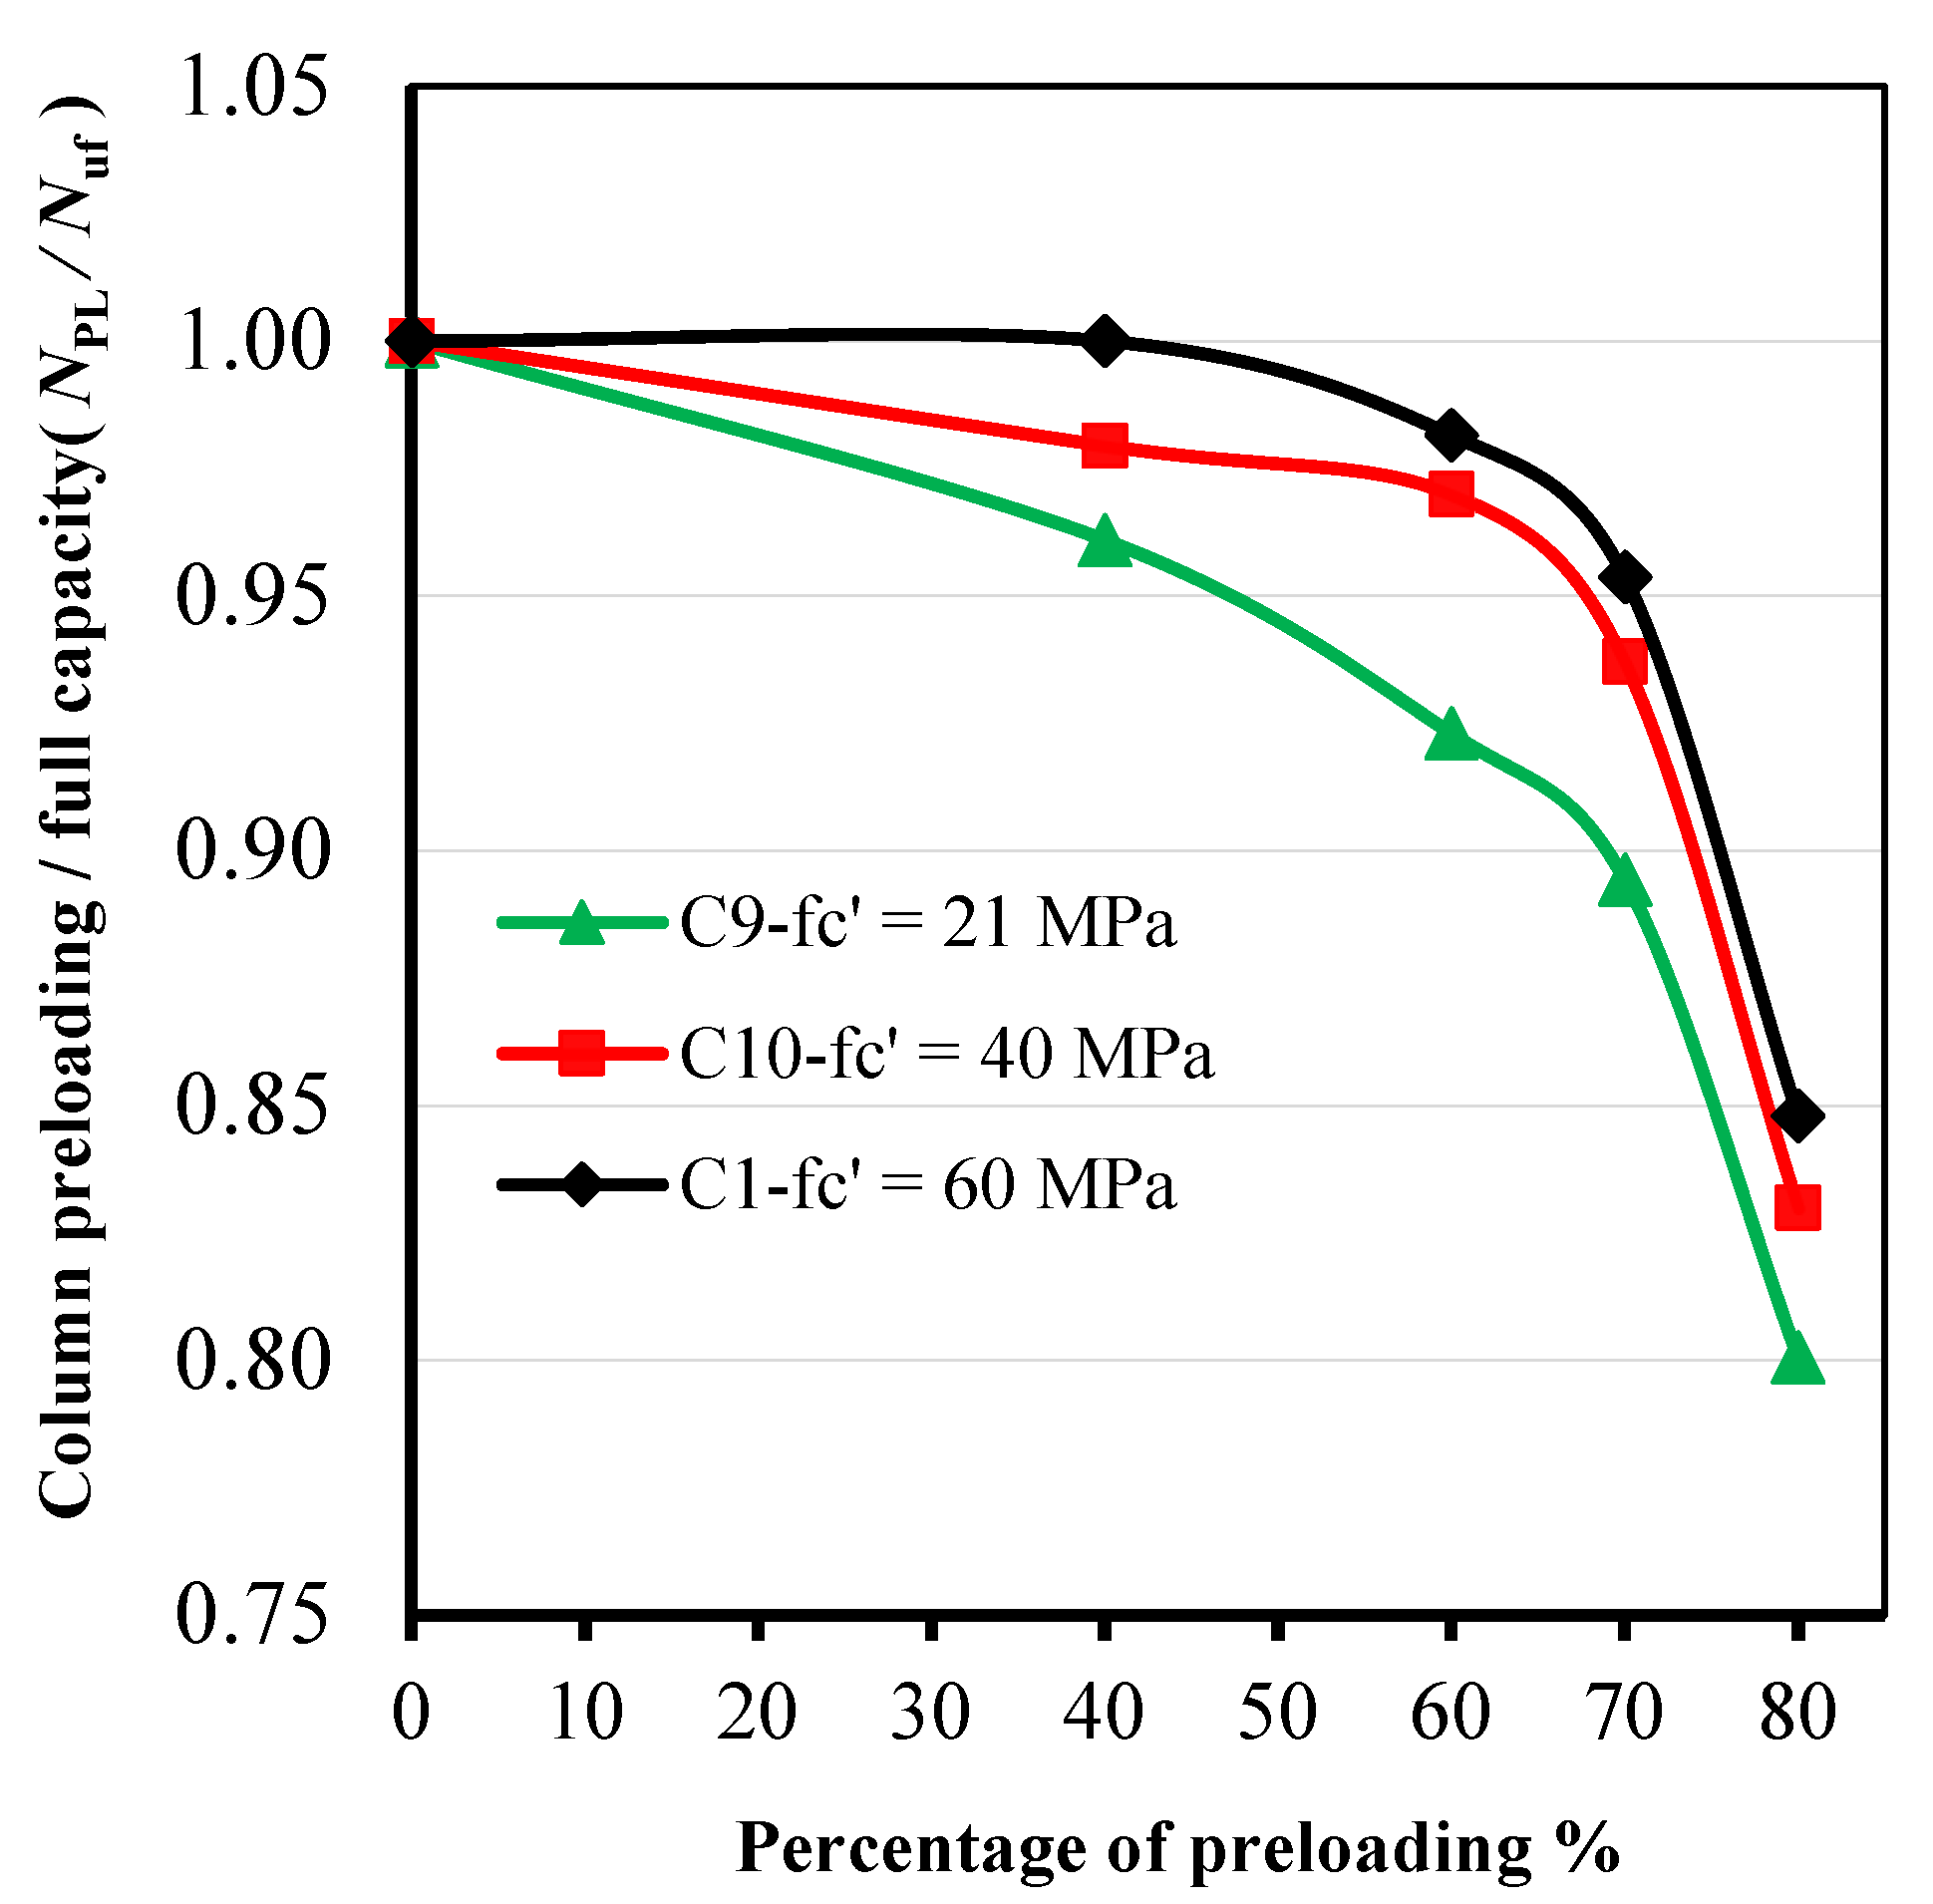
5.2.4. Effect of Concrete Strength

Figure 12 shows this relationship regarding changing the concrete compressive strength, as it was changed from 21 to 60 MPa. Concrete compressive strength 21 MPa was chosen as it is the lowest value that can be used according to the ANSI/AISC 360-22. The effect of the concrete strength is inversely proportional to the effect of the preload ratio. As the concrete strength increases, the impact of the preload ratio on the ultimate capacity decreases. With preload ratios of 40%, 60%, 70%, and 80% and with concrete compressive strength of 21 MPa, the ratios NPL/Nuf were 0.961, 0.923, 0.894, and 0.801, respectively, and by changing it to 60 MPa, they were 1.00, 0.982, 0.954, and 0.848, respectively. Accordingly, as the concrete compressive strength increases, the efficiency and effect of the concrete fill increases.
Figure 12. The relationship between the ratio of the capacity with and without preload for the effect of concrete strength.
Buildings 14 02924 g012

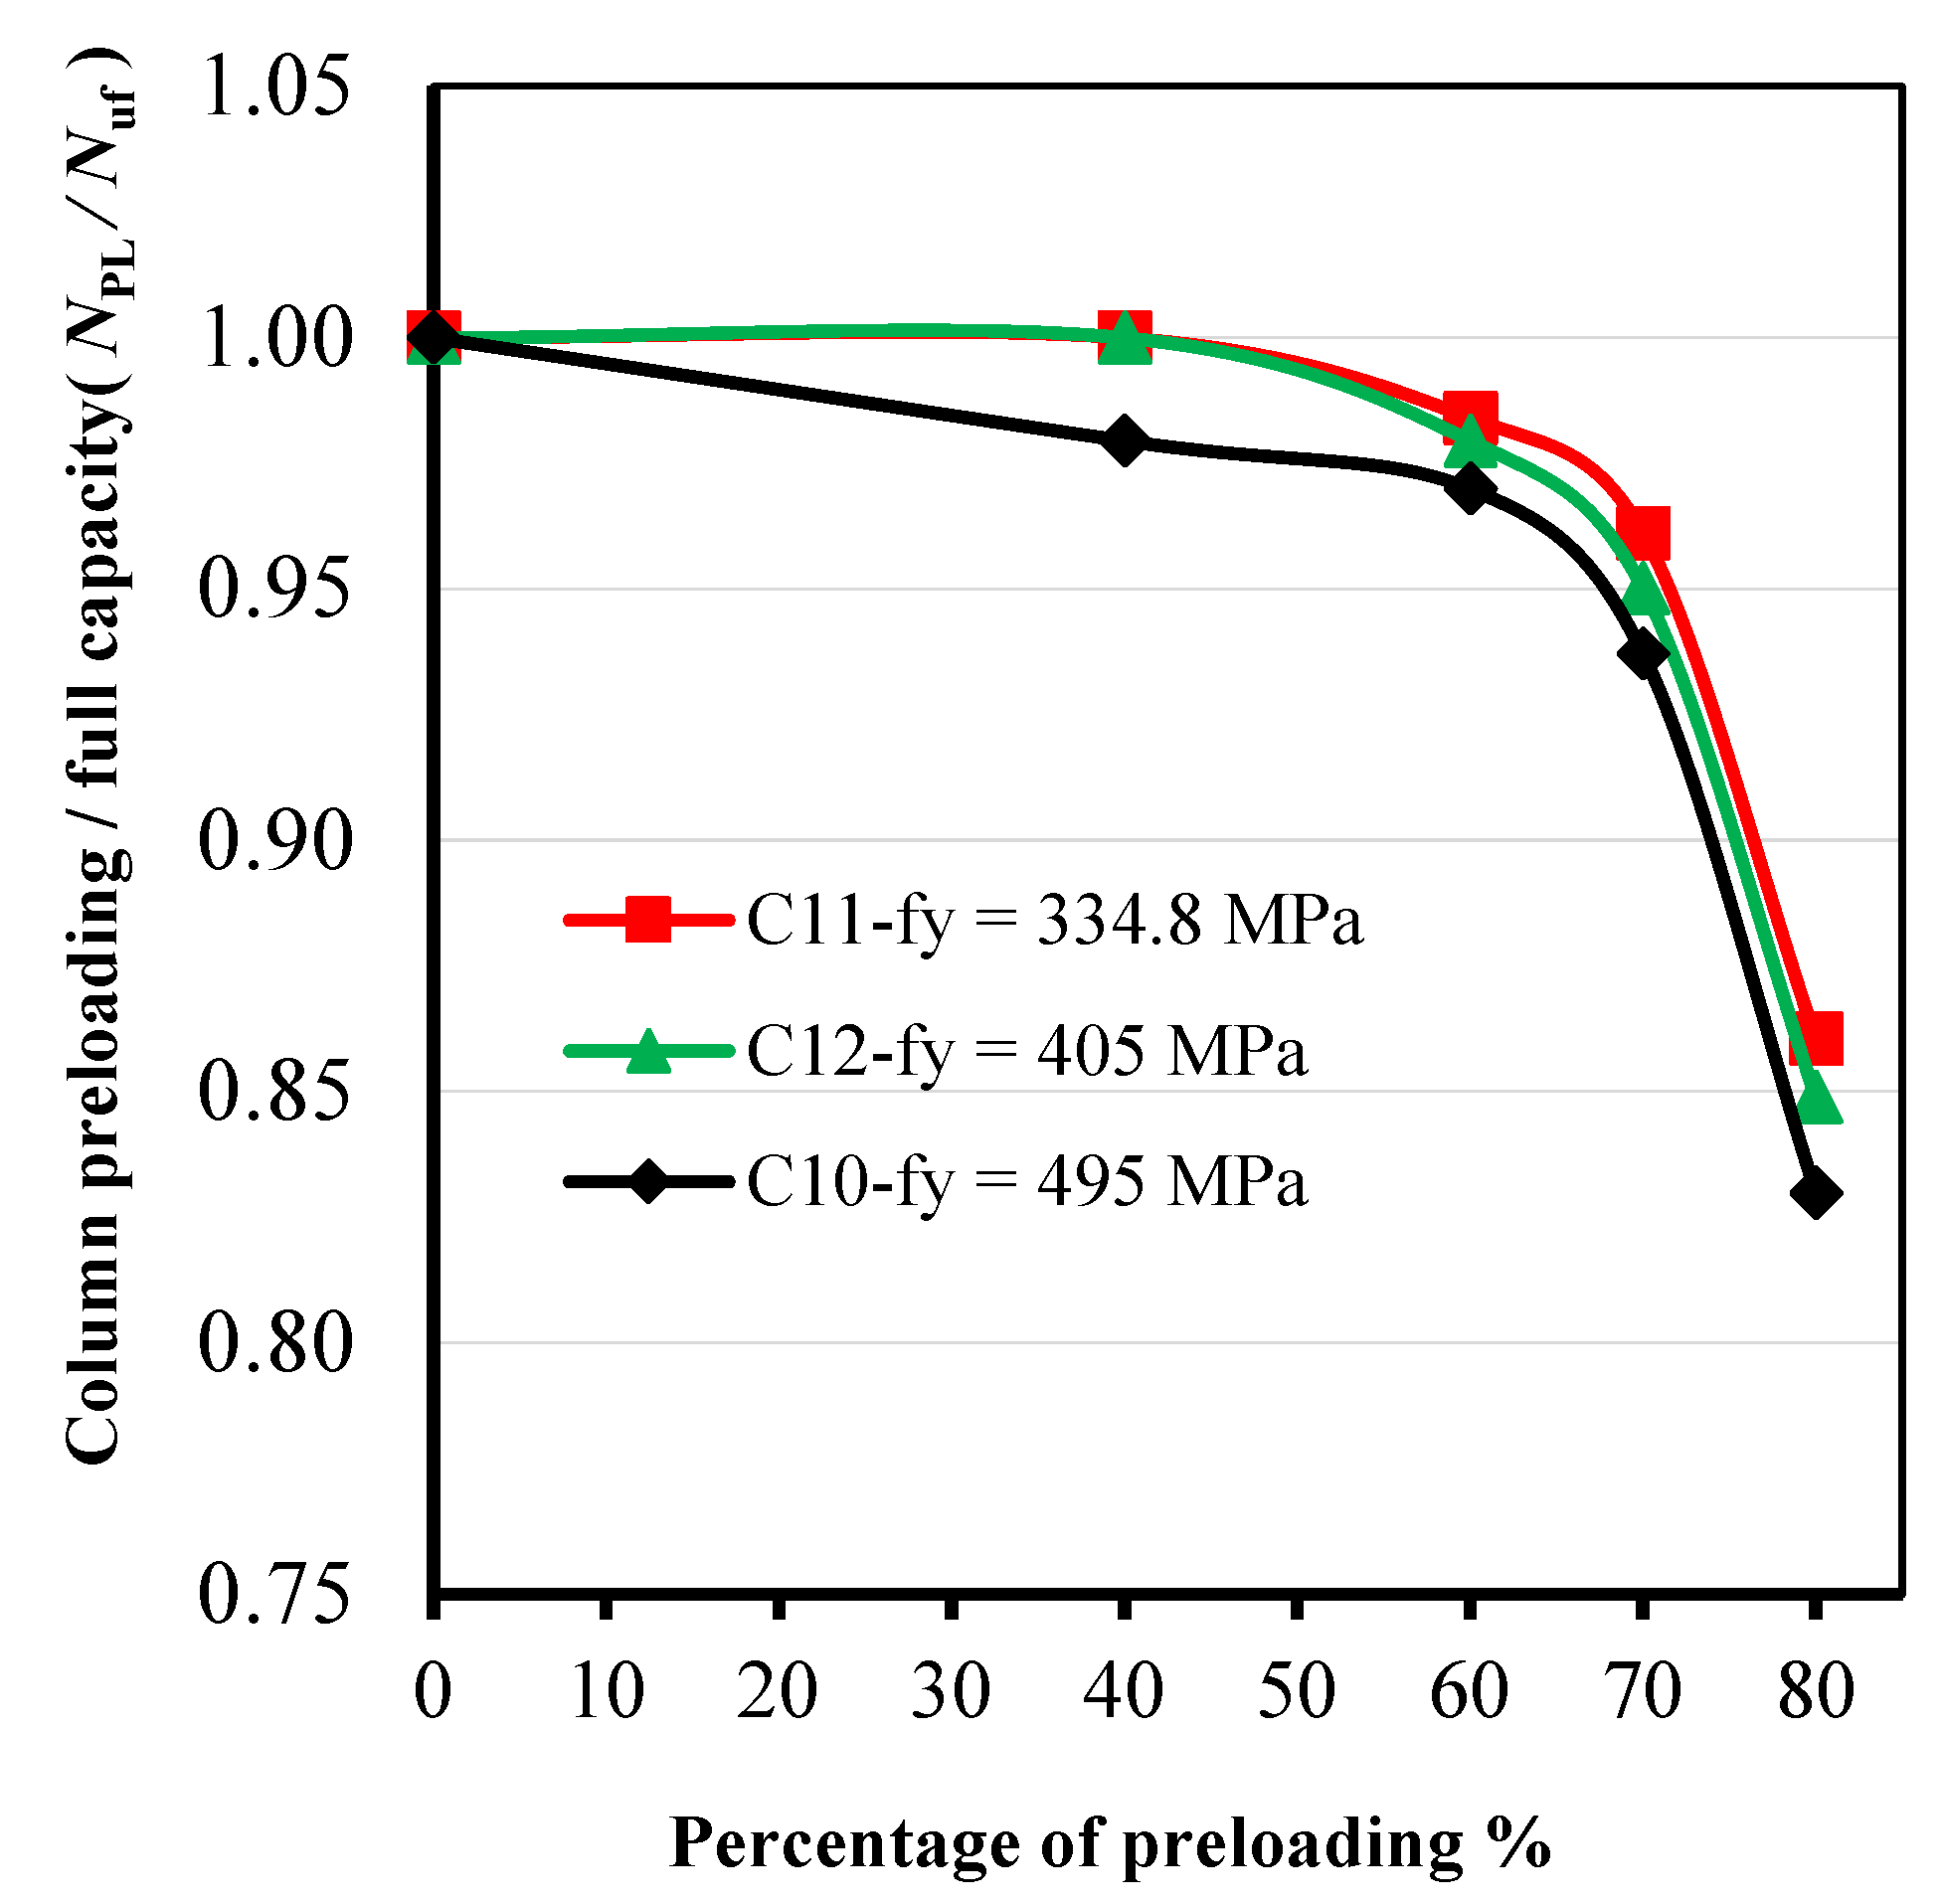
5.2.5. Effect of Steel Column Yield Stress

Figure 13 shows this relationship regarding changing the steel column yield stress, as it was changed from 334.8 to 495 MPa. The effect of the steel column yield stress is directly proportional to the effect of the preload ratio. As the steel column yield stress increases, the impact of the preload ratio on the ultimate capacity increases. With preload ratios of 40%, 60%, 70%, and 80% and with a yield stress of 334.8 MPa, the ratios NPL/Nuf were 0.979, 0.970, 0.937, and 0.830, respectively, and by changing it to 495 MPa, they were 1.00, 0.984, 0.961, and 0.861, respectively. Thus, as the steel column yield stress increases, the efficiency and effect of the concrete fill decreases.
Figure 13. The relationship between the ratio of the capacity with to without preload for the effect of steel yield stress.
Buildings 14 02924 g013

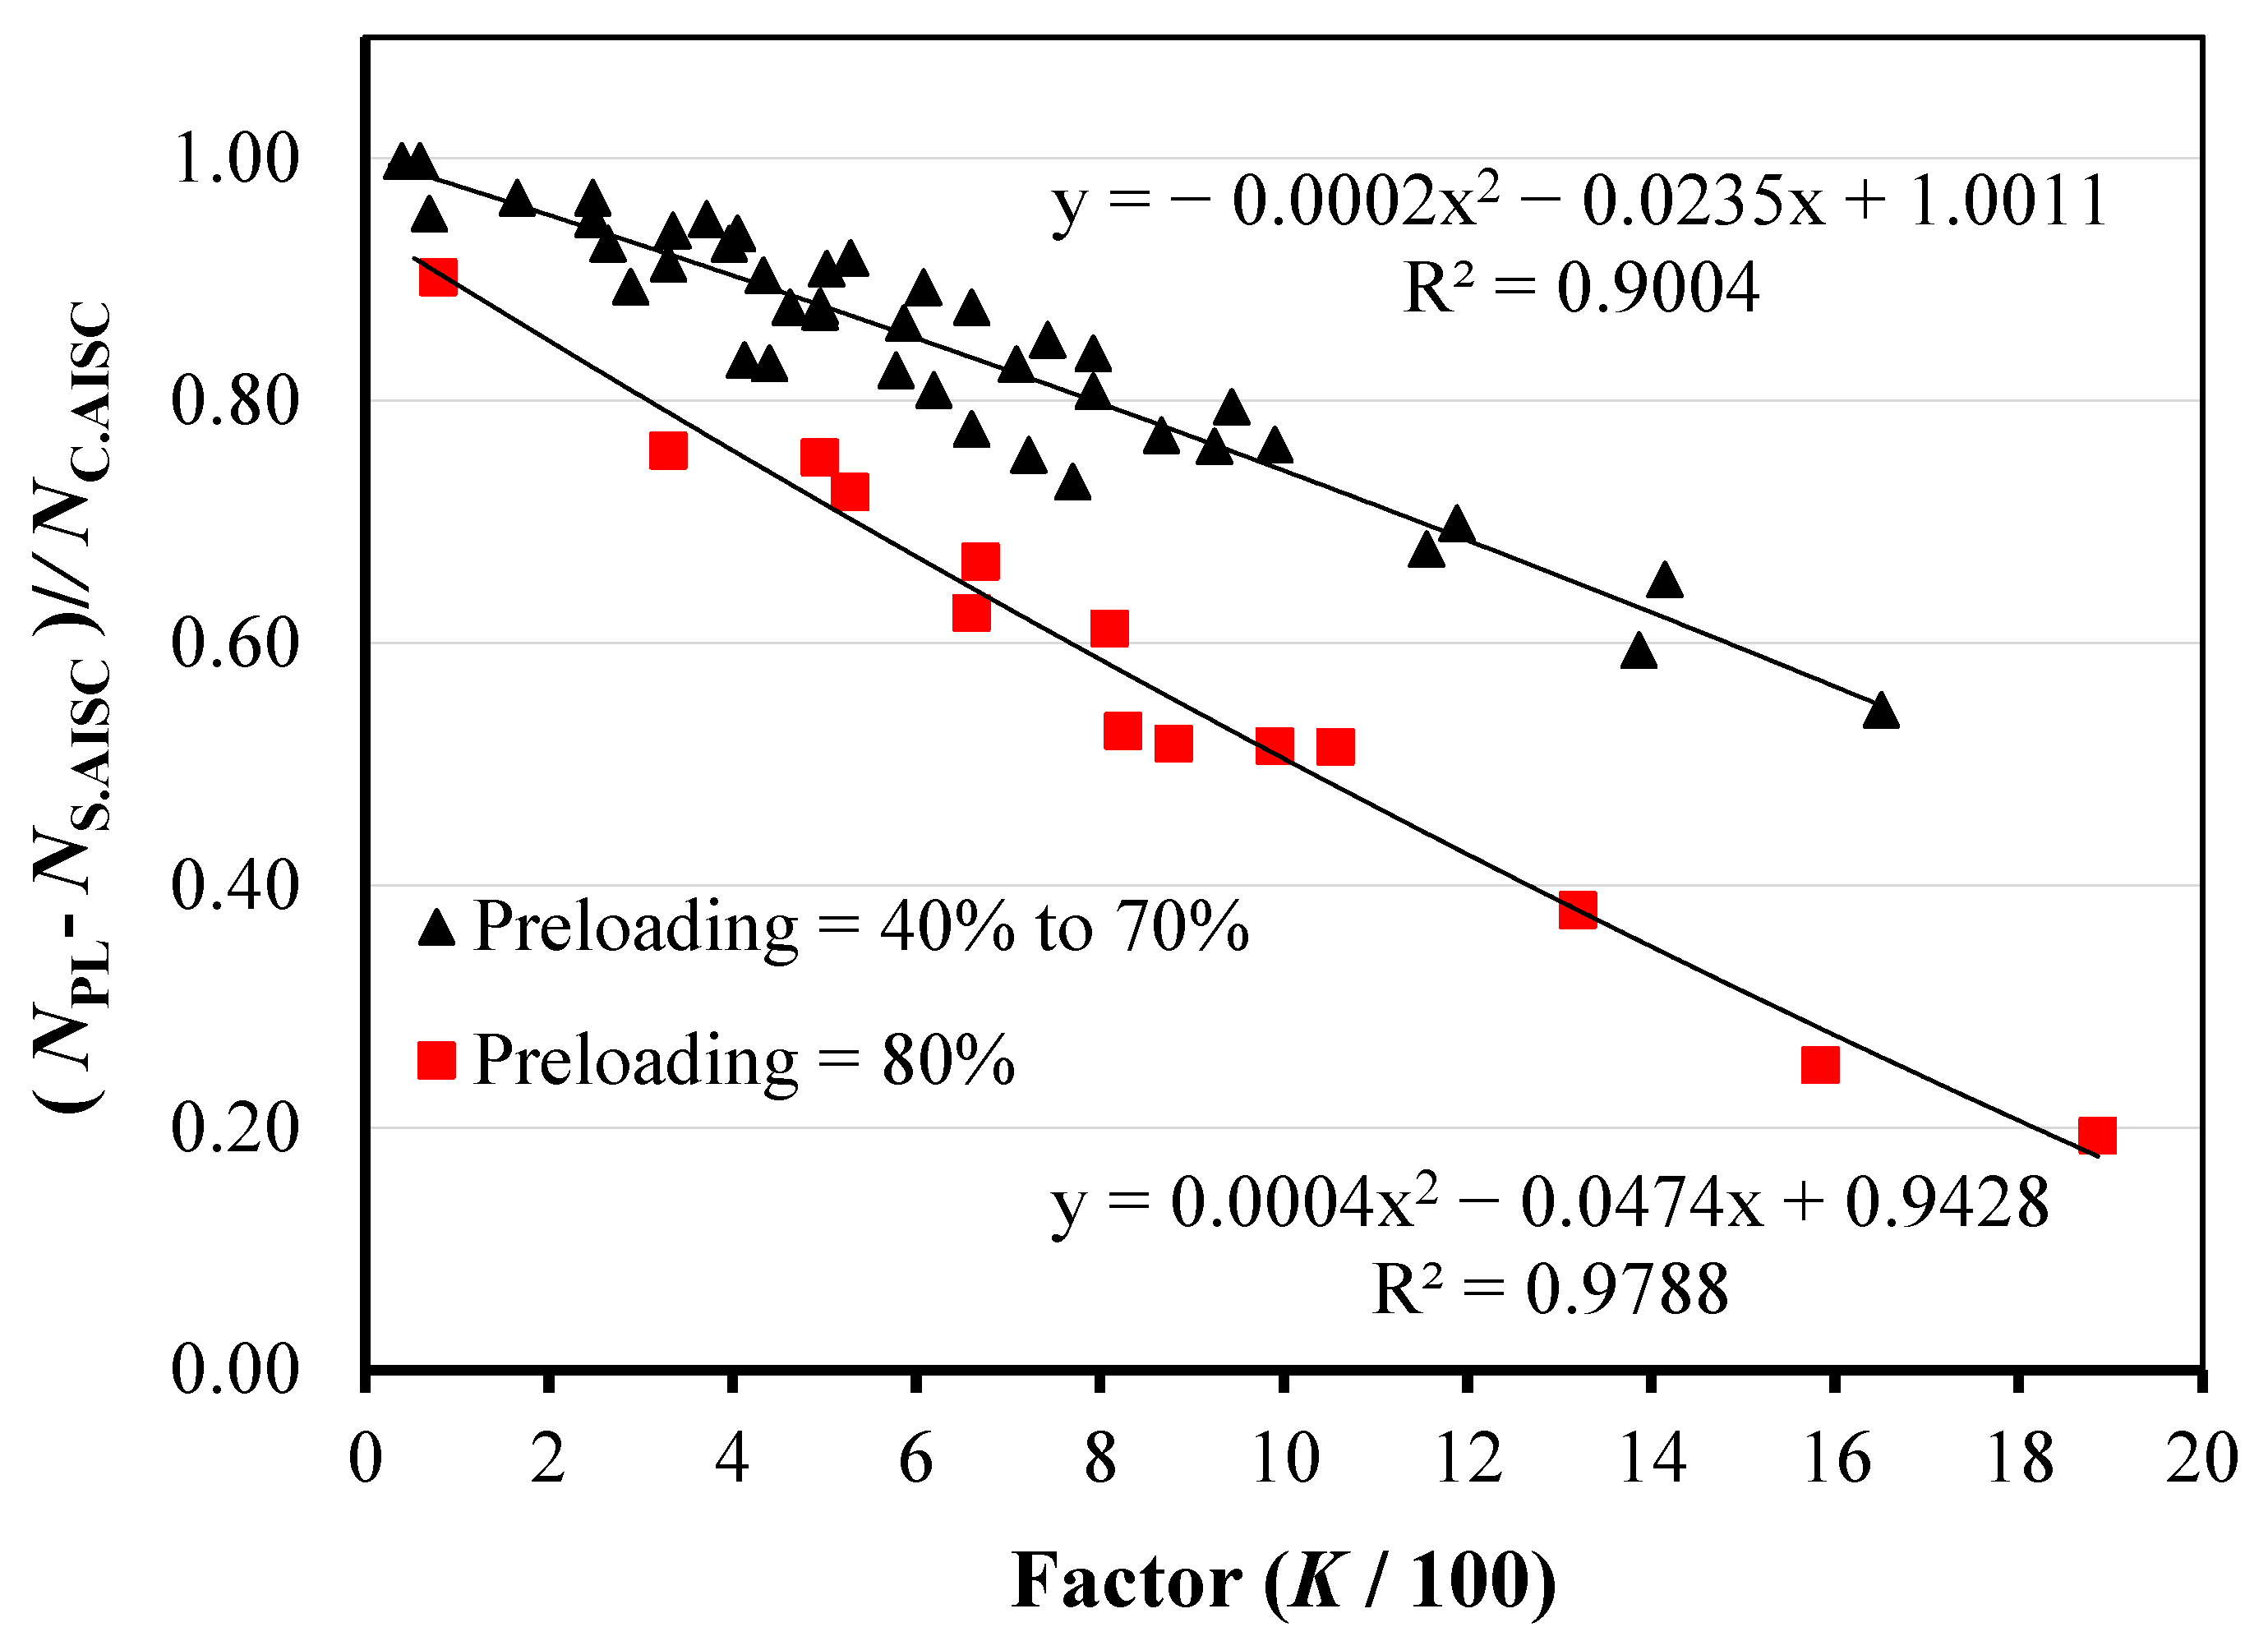
6. Prediction of Ultimate Axial Load Capacity under Preload

The second group of FEM analysis, which contains 84 specimens, was used to determine the effect of preload on the ultimate capacity of CFSC. By considering all of the variables taken into account, all of the results are listed in Table 7, which also contains the values calculated from existing codes (ANSI/AISC 360-22, and European-4).
First stage: Through the results of steel columns that were modeled with or without concrete fill and without preload, these results were used to verify the reliability of the existing codes, ANSI/AISC 360-22 [1] and Eurocode-4 [2], as shown in Figure 14. Through Figure 14a, where the ratio between the values calculated from the ANSI/AISC 360-22 and the results of FEM analysis, all specimens, whether columns filled or not filled with concrete, fall on the safe side of the design, where the values are less than the ultimate capacity of the columns. The average ratio NAISC/NFEM was equal to 0.918 with a COV of 4.05%. In Eurocode-4, the calculated values for columns filled with concrete mostly fall in the unsafe zone, i.e., the calculated values are greater than the ultimate capacity of the column, as shown in Figure 14b. The average ratio NEC4/NFEM was equal to 1.030 with COV of 3.71%, while in steel columns not filled with concrete, the calculated values fall on the safe side of the design. The average ratio NEC4/NFEM was equal to 0.947 with a COV of 5.38%. This result is completely consistent with the same result when comparing these codes with the experimental test results available from previous studies.
Second stage: Through Table 7, the ultimate capacity of the columns was obtained under the influence of preload (NPL). Hence, the ratio (NPL/Nuf) of decrease in this capacity was obtained relative to the CFSC without preload. It is also possible to obtain the contribution of concrete (NC.) in increasing the load of CFSC with or without preloading. This is determined by the difference between the ultimate capacity of a CFSC and an unfilled steel column. Also, from Figure 9, Figure 10, Figure 11, Figure 12 and Figure 13, the effect of preload is almost linear in reducing the capacity of the column up to a percentage equal to 70% of the load of the steel column that is not filled with concrete. Then, this effect suddenly decreases with a preload percentage equal to 80%. This is due to the fact that the preload percentages of up to 70% of the steel column that are not filled with concrete fall within the elastic region of the stress–strain relationship for the steel used. When the preload percentage reaches 80%, it falls within the elastic–plastic region, where the strains increase and the contribution of steel strength to increasing the column capacity decreases. Therefore, the effect of preload ratios will be divided into two groups. The first group preloads at rates from 40% to 70%. The second group is at a preload equal to 80%. Through Table 7, the percentage decrease in the contribution of concrete with preload was obtained relative to the contribution of concrete for columns without preload. Through these ratios, the effect of preload on the contribution of concrete is greater than the effect on the total capacity of CFSC. The largest percentage decrease in ultimate capacity was recorded at 80% preload for specimen C9 at a rate of 0.801, while for the same specimen, the value of the decrease in concrete contribution was equal to 0.234.
From Figure 9, Figure 10, Figure 11, Figure 12 and Figure 13, factor K was determined to take the effect of all variables into account. This factor was basically imposed on the effect of each variable on the value of a decrease in the ultimate capacity of the column. It was found out that the effect of each of the variables, such as column height, column wall thickness, yield stress, and preload ratios, RPL, is directly proportional to the value of the decrease in column capacity. The variables such as the cross-section dimensions and the concrete strength are inversely proportional. Therefore, all these variables are collected in one factor, K, as in Equation (19).
K = L × t × f y × R P L b × f c
The relationship between the ratios of decrease in concrete contribution resulting from preloading and the factor K was drawn as shown in Figure 15. So, this figure clearly shows that as the value of the factor K increases, the value of the concrete contribution is reduced. Through the polynomial relationship between these ratios, an obtained equation can predict the ultimate capacity of columns filled with concrete under the influence of preload on the steel column. Equation (20) is used with preload ratios not exceeding 70% of the capacity of the steel column not filled with concrete, with r equal to 0.966. Whereas, Equation (21) is used with preload ratios equal to 80% with r equal to 0.992.
N P L . F E M N S . F E M N C . F E M = 0.0014 K 2 0.0022 K + 1.00
N P L . F E M N S . F E M N C . F E M = 0.0006 K 2 0.0236 K + 0.9001
Through previous relationships, Equations (20) and (21), it is extremely difficult to perform an FEM analysis when there is a need to calculate the application of these equations. Therefore, one of the existing codes was used, and the ANSI/AISC 360-22 was selected to assist in the application. Its selection was based on previous analysis results and comparison with specimens, whether experimental or FEM results. It turns out that in all cases, these predictions fall on the safe side of the design. However, all these applications were without any preloading on steel columns. Through the results of the FEM analysis, the deficiency percentages were obtained for each preload case. The ANSI/AISC 360-22 model was used to calculate the concrete contribution according to Equation (22).
N c . A I S C = 0.85 f c A c
The ultimate capacity of the steel column with or without concrete filling and without preload was calculated according to Section 2. Then, the deficiency ratios resulting from the FEM analysis were used to find the ultimate remaining capacity for these specimens. The relationship between the ratio of concrete contribution of the specimens under preloading relative to the contribution of concrete without preloading was drawn with factor K, as shown in Figure 16. By applying the same polynomial relationship, Equations (23) and (24) were obtained to be used to determine the ultimate capacity of columns under preload.
N P L N S . A I S C N C . A I S C = 0.0002 K 2 0.0235 K + 1.00
Equation (23) is used with preload ratios not exceeding 70% of the capacity of the steel column not filled with concrete, with r equal to 0.949. Whereas, equation 24 is used with preload ratios equal to 80% with r equal to 0.989. Through the value of the correlation coefficient, r, whether accompanying the FEM analysis equations or accompanying the results of the ANSI/AISC 360-22, these new models can predict the ultimate capacity of CFSC under preload as a percentage of the capacity of the steel column without concrete with high accuracy.

7. Conclusions

There is a high possibility of using concrete to fill an existing steel column exposed to external loads to increase the efficiency of resisting external loads resulting from structural modifications or design errors. When such columns are difficult to implement in experimental tests, FEM analysis is performed to model these types of columns under preload. First, the FEM results were verified by comparing them with specimens available in previous studies of columns without preload. The results were very accurate in simulating these columns, as the average capacity ratio reached 1.002, COV was 2.25%, and r equal to 0.999. Secondly, FEM analysis was performed on the steel columns with several variables under different preload ratios. Through the proposed new models, the ultimate axial load capacity of CFSC under preload can be predicted. In light of this research, the conclusions drawn are presented below:
  • For steel columns without concrete filling, prediction values calculated from existing codes, ANSI/AISC 360-22 and Eurocode-4, were always less than the actual ultimate capacity, average ratio is 0.951, whether resulting from experimental or FEM tests. This is a result of the existing codes relying only on the elastic region of the steel, while the behavior of the columns uses the actual properties of the available steel, as it enters the elastic–plastic region;
  • Through the behavior of columns under preload, some variables are directly proportional to the value of the decrease in column capacity, in terms of column height, column wall thickness, yield stress, and preload ratios, while others are inversely proportional, in terms of cross-section dimensions and concrete strength;
  • With some limits in the values of the geometric properties of steel columns and with preload ratios up to 60%, they do not affect the ultimate capacity of CFSC;
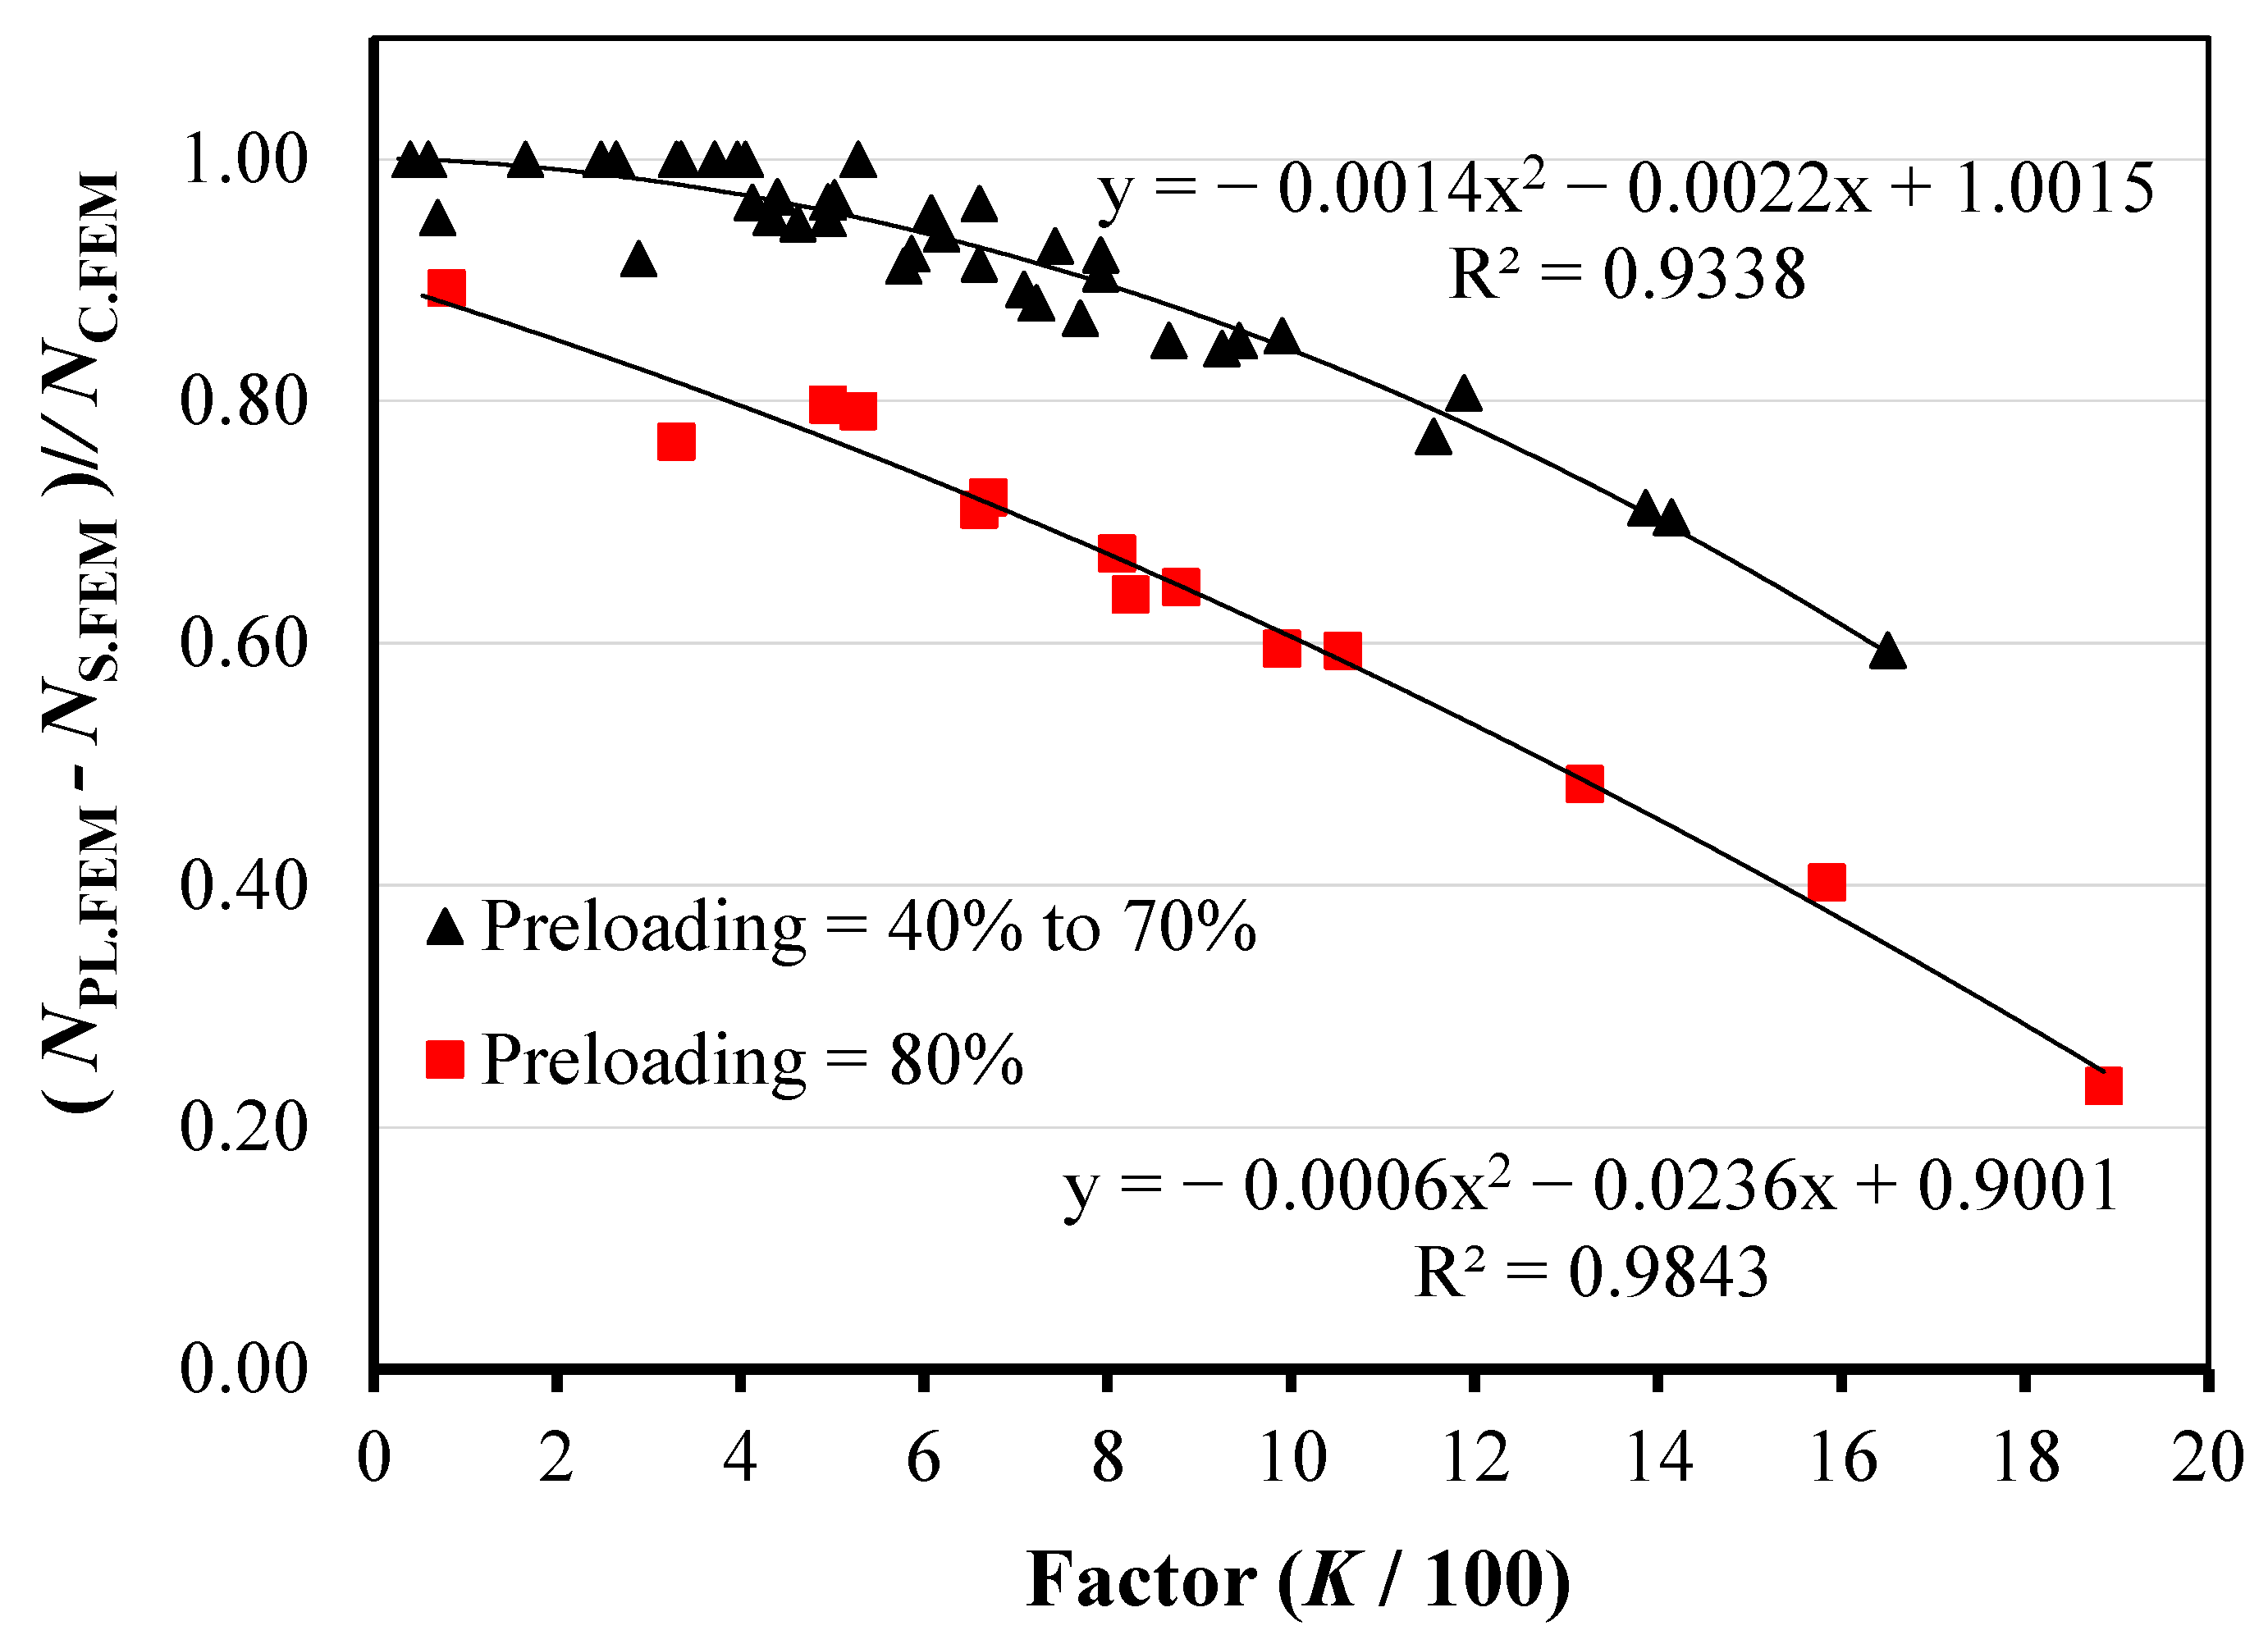
  • In the case of a preload ratio not exceeding 70%, the value of the decrease in column capacity is approximately linear, and in small values, where the largest decrease ratio was equal to 0.891;
  • With a preload ratio equal to 80%, there is a significant decrease in the percentage of remaining capacity of the columns reaching 0.801. This obviously affects the contribution of concrete, as the decreased value reaches 0.234;
  • The proposed new models, Equations (23) and (24), using the ANSI/AISC 360-22 models, can predict the ultimate capacity of the axial load of CFSC under preloading. These models have appropriate accuracy, with r of 0.949 and 0.989 for preload ratios not exceeding 70% and equal to 80%, respectively.
Future research could focus on studies that can address the drawbacks of this new model. One of the drawbacks of this new model is the lack of diversity in the cross-sectional shape, such as the fact that rectangular, circular, double-skin, and sections of steel columns stiffened internally or externally remain to be studied. The reliability and accuracy of the new model have not been verified, so experimental tests on these columns under preload should be carried out and the results compared with FEM analysis. This model also relates to axial load only, so other types of preloading, such as eccentric and cyclic loads, can be used.

Funding

This research received no external funding.

Data Availability Statement

Data will be made available on request.

Acknowledgments

The author would like to thank the Deanship of Scientific Research at Majmaah University for supporting this work under project no. R-2024-1296.

Conflicts of Interest

The authors declare no conflicts of interest.

References

  1. ANSI/AISC 360-22; Specification for Structural Steel Buildings. American Institute of Steel Construction: Chicago, IL, USA, 2022.
  2. EN 1994-1-1: 2004; Design of Composite Steel and Concrete Structures, Part 1.1 General Rules and Rules for Buildings. European Committee for Standardization: Brussels, Belgium, 2004.
  3. Liu, J.; Gao, P.; Lin, X.; Wang, X.; Zhou, X.; Chen, Y.F. Experimental assessment on the size effects of circular concrete-filled steel tubular columns under axial compression. Eng. Struct. 2023, 275 Pt A, 115247. [Google Scholar] [CrossRef]
  4. Lei, M.; Li, Y.-L.; Li, Y.-Q.; Zhang, J.; Liu, D. Behavior of concrete-filled T-shaped steel tubular beam-columns under biaxial compressive loads. Eng. Struct. 2023, 277, 115409. [Google Scholar] [CrossRef]
  5. Wang, J.; Yang, Z.-M.; Zheng, X.-L.; Ding, Y. Axial compression behavior of square section concrete-filled steel tubes reinforced with internal latticed steel angles. J. Constr. Steel Res. 2024, 213, 108414. [Google Scholar] [CrossRef]
  6. Yang, Z.Y.; Liu, M.; Sun, L.; Shen, M.S. Size effect of axial compressive bearing capacity of high-strength concrete filled high-strength square steel tubular short columns. Structures 2024, 60, 105978. [Google Scholar] [CrossRef]
  7. Wang, Y.-B.; Song, C.; Xiong, M.-X.; Liew, J.Y.R. Mechanical behavior and design applicability of ultra-high-performance concrete-filled circular steel tubular short columns under axial compression. Eng. Struct. 2024, 299, 117112. [Google Scholar] [CrossRef]
  8. Hu, H.-S.; Yang, Z.-J.; Xu, L.; Zhang, Y.-X.; Gao, Y.-C. Axial compressive behavior of square concrete-filled steel tube columns with high-strength steel fiber-reinforced concrete. Eng. Struct. 2023, 285, 116047. [Google Scholar] [CrossRef]
  9. Schneider, S.P. Axially loaded concrete-filled steel tubes. J. Struct. Eng. 1998, 124, 1125–1138. [Google Scholar] [CrossRef]
  10. Uy, B. Strength of short concrete filled high strength steel box columns. J. Construct. Steel Res. 2001, 57, 113–134. [Google Scholar] [CrossRef]
  11. Han, L.-H. Tests on stub columns of concrete-filled RHS sections. J. Construct. Steel Res. 2002, 58, 353–372. [Google Scholar] [CrossRef]
  12. Dundu, M. Column buckling tests of hot-rolled concrete filled square hollow sections of mild to high strength steel. Eng. Struct. 2016, 127, 73–85. [Google Scholar] [CrossRef]
  13. Shakir-Khalil, H.; Mouli, M. Further tests on concrete-filled rectangular hollow-section columns. J. Struct. Eng. 1990, 68, 405–413. [Google Scholar]
  14. Zhu, A.; Zhang, X.; Zhu, H.; Zhu, J.; Lu, Y. Experimental study of concrete filled cold-formed steel tubular stub columns. J. Constr. Steel Res. 2017, 134, 17–27. [Google Scholar] [CrossRef]
  15. Tao, Z.; Han, L.H.; Wang, Z.B. Experimental behaviour of stiffened concrete-filled thin-walled hollow steel structural (HSS) stub columns. J. Constr. Steel Res. 2005, 61, 962–983. [Google Scholar] [CrossRef]
  16. Tao, Z.; Han, L.H.; Wang, D.Y. Strength and ductility of stiffened thin-walled hollow steel structural stub columns filled with concrete. Thin Walled Struct. 2008, 46, 1113–1128. [Google Scholar] [CrossRef]
  17. Tao, Z.; Uy, B.; Han, L.H.; Wang, Z.B. Analysis and design of concrete-filled stiffened thin-walled steel tubular columns under axial compression. Thin Walled Struct. 2009, 47, 1544–1556. [Google Scholar] [CrossRef]
  18. Liu, Y.J.; Zhang, J.G.; Xu, K.L.; Yao, W. Experimental research on stub columns of concrete filled steel box with longitudinal stiffener under axial load. J. Build. Struct. 2011, 32, 159–165. [Google Scholar]
  19. Liu, Y.J.; Cheng, G.; Zhang, N.; Zhang, J. Experimental research on concrete-filled square steel tubular columns stiffened with PBL. J. Build. Struct. 2014, 35, 39–46. [Google Scholar]
  20. Zhu, W.; Wang, J.; Liu, Y.; Sun, L. Experimental study on axial compressive behavior of concrete-filled double-skin thin-walled steel box columns with and without PBL. Structures 2023, 47, 1927–1939. [Google Scholar] [CrossRef]
  21. Yuan, W.-b.; Yang, J.-j. Experimental and numerical studies of short concrete-filled double skin composite tube columns under axially compressive loads. J. Constr. Steel Res. 2013, 80, 23–31. [Google Scholar] [CrossRef]
  22. Chen, J.; Ni, Y.-Y.; Jin, W.-l. Column tests of dodecagonal section double skin concrete-filled steel tubes. Thin Walled Struct. 2015, 88, 28–40. [Google Scholar] [CrossRef]
  23. Liang, W.; Dong, J.; Wang, Q. Mechanical behaviour of concrete-filled double-skin steel tube (CFDST) with stiffeners under axial and eccentric loading. Thin Walled Struct. 2019, 138, 215–230. [Google Scholar] [CrossRef]
  24. Qiao, Q.; Ding, R.; Cao, W. Experimental investigation on axial local compressive behavior of square concrete-filled double tubular stub columns. Structures 2023, 55, 2157–2174. [Google Scholar] [CrossRef]
  25. Hassanein, M.F.; Elchalakani, M.; Karrech, A.; Patel, V.I.; Yang, B. Behaviour of concrete-filled double-skin short columns under compression through finite element modelling: SHS outer and SHS inner tubes. Structures 2018, 14, 358–375. [Google Scholar] [CrossRef]
  26. Ding, F.-x.; Wang, W.-j.; Lu, D.-r.; Liu, X.-m. Study on the behavior of concrete-filled square double-skin steel tubular stub columns under axial loading. Structures 2020, 23, 665–676. [Google Scholar] [CrossRef]
  27. Ayough, P.; Sulong, N.H.R.; Ibrahim, Z.; Hsiao, P.-C. Nonlinear analysis of square concrete-filled double-skin steel tubular columns under axial compression. Eng. Struct. 2020, 216, 110678. [Google Scholar] [CrossRef]
  28. Zhang, Y.C.; Chen, Y. Experimental study and finite element analysis of square stub columns with straight ribs of concrete-filled thin-walled steel tube. J. Build. Struct. 2006, 27, 16–22. [Google Scholar]
  29. Zhang, Y.C.; Xu, C.; Lu, X.Z. Experimental study of hysteretic behaviour for concrete filled square thin-walled steel tubular columns. J. Constr. Steel Res. 2007, 63, 317–325. [Google Scholar] [CrossRef]
  30. Varma, A.H.; Ricles, J.M.; Sause, R.; Lu, L.-W. Experimental behaviour of high strength square concrete-filled steel tube beam-columns. J. Struct. Eng. 2002, 128, 309–318. [Google Scholar] [CrossRef]
  31. Liu, D.; Gho, W.-M.; Yuan, J. Ultimate capacity of high-strength rectangular concrete-filled steel hollow section stub columns. J. Constr. Steel Res. 2003, 59, 1499–1515. [Google Scholar] [CrossRef]
  32. Gho, W.-M.; Liu, D. Flexural behaviour of high-strength rectangular concrete-filled steel hollow sections. J. Construct. Steel Res. 2004, 60, 1681–1696. [Google Scholar] [CrossRef]
  33. Li, G.-C.; Chen, B.-W.; Zhu, B.-W.; Yang, Z.-J.; Ge, H.-B.; Liu, Y.-P. Axially loaded square concrete-filled steel tubular long columns made of high-strength materials: Experimental investigation, analytical behavior and design. J. Build. Eng. 2022, 58, 104994. [Google Scholar] [CrossRef]
  34. Guo, L.H.; Wang, Y.Y.; Zhang, S.M. Experimental study of concrete-filled rectangular HSS columns subjected to biaxial bending. Adv. Struct. Eng. 2012, 15, 1329–1344. [Google Scholar] [CrossRef]
  35. Kilpatrick, A.E.; Rangan, B.V. Tests on high-strength concrete-filled steel tubular columns. ACI Struct. J. 1999, 96, 268–275. [Google Scholar]
  36. Liu, D. Tests on high-strength rectangular concrete-filled steel hollow section stub columns. J. Construct. Steel Res. 2005, 61, 902–911. [Google Scholar] [CrossRef]
  37. Sakino, K.; Nakahara, H.; Morino, S.; Nishiyama, I. Behaviour of centrally loaded concrete-filled steel-tube short columns. J. Struct. Eng. 2004, 130, 180–188. [Google Scholar] [CrossRef]
  38. Young, B.; Ellobody, E. Experimental investigation of concrete-filled cold-formed high strength stainless steel tube columns. J. Constr. Steel Res. 2006, 62, 484–492. [Google Scholar] [CrossRef]
  39. Young, B.; Liu, Y. Experimental investigation of cold-formed stainless steel columns. J. Struct. Eng. 2003, 129, 169–176. [Google Scholar] [CrossRef]
  40. Zeghichea, J.; Chaoui, K. An experimental behaviour of concrete-filled steel tubular columns. J. Construct. Steel Res. 2005, 61, 53–66. [Google Scholar] [CrossRef]
  41. Pavlovčič, L.; Froschmeier, B.; Kuhlmann, U.; Beg, D. Finite element simulation of slender thin-walled box columns by implementing real initial conditions. Adv. Eng. Softw. 2012, 44, 63–74. [Google Scholar] [CrossRef]
  42. Yang, D.; Hancock, G.J. Numerical simulation of high-strength steel box-shaped columns failing in local and overall buckling modes. J. Struct. Eng. 2006, 132, 541–549. [Google Scholar] [CrossRef]
  43. Wang, Y.-B.; Li, G.-Q.; Chen, S.-W.; Sun, F.-F. Experimental and numerical study on the behavior of axially compressed high strength steel box-columns. Eng. Struct. 2014, 58, 79–91. [Google Scholar] [CrossRef]
  44. Khan, M.; Uy, B.; Tao, Z.; Mashiri, F. Concentrically loaded slender square hollow and composite columns incorporating high strength properties. Eng. Struct. 2017, 131, 69–89. [Google Scholar] [CrossRef]
  45. Thai, H.-T.; Uy, B.; Khan, M.; Tao, Z.; Mashiri, F. Numerical modelling of concrete-filled steel box columns incorporating high strength materials. J. Construct. Steel Res. 2014, 102, 256–265. [Google Scholar] [CrossRef]
  46. Dai, X.; Lam, D. Numerical modelling of the axial compressive behaviour of short concrete-filled elliptical steel columns. J. Construct. Steel Res. 2010, 66, 931–942. [Google Scholar] [CrossRef]
  47. Ellobody, E.; Young, B. Nonlinear analysis of concrete-filled steel SHS and RHS columns. Thin Walled Struct. 2006, 44, 919–930. [Google Scholar] [CrossRef]
  48. Kumar, S.; Gupta, P.K.; Iqbal, M.A. Experimental and numerical study on self-compacting alkali-activated slag concrete-filled steel tubes. J. Constr. Steel Res. 2024, 214, 108453. [Google Scholar] [CrossRef]
  49. Tao, Z.; Wang, Z.-B.; Yu, Q. Finite element modelling of concrete-filled steel stub columns under axial compression. J. Construct. Steel Res. 2013, 89, 121–131. [Google Scholar] [CrossRef]
  50. Ali, L.; Isleem, H.F.; Bahrami, A.; Jha, I.; Zou, G.; Kumar, R.; Sadeq, A.M.; Jahami, A. Integrated behavioural analysis of FRP-confined circular columns using FEM and machine learning. Compos. Part. C Open Access 2024, 13, 100444. [Google Scholar] [CrossRef]
  51. Somodi, B.; Kövesdi, B. Flexural buckling resistance of welded HSS box section members. Thin Walled Struct. 2017, 119, 266–281. [Google Scholar] [CrossRef]
  52. Zhao, T. Bearing capacity studies on square steel tube confined steel reinforced concrete column under eccentric load. Adv. Civ. Eng. 2020, 2020, 4212049. [Google Scholar] [CrossRef]
  53. Lin, S.; Li, Z.; Zhao, Y.-G. Behavior of eccentrically loaded circular concrete-filled steel tube stub columns with localized corrosion. Eng. Struct. 2023, 288, 116227. [Google Scholar] [CrossRef]
  54. Sayed, A.M.; Diab, H.M. Modeling of the axial load capacity of RC columns strengthened with steel jacketing under preloading based on FE simulation. Model. Simul. Eng. 2019, 2019, 8653247. [Google Scholar] [CrossRef]
  55. ANSYS. ANSYS Help User’s Manual; Version 22; Swanson Analysis Systems, Inc.: Houston, PA, USA, 2022. [Google Scholar]
  56. Kachlakev, D.; Miller, T.; Yim, S. Finite Element Modeling of Reinforced Concrete Structures Strengthened with FRP Laminates. Oregon Department of Transportation: Washington, DC, USA, 2001. [Google Scholar]
  57. Terec, L.; Bugnariu, T.; Păstrav, M. Non–linear analysis of reinforced concrete frames strengthened with in filled walls. Rom. J. Mater. 2010, 40, 214–221. [Google Scholar]
  58. Kwan, A.K.H.; Dai, H.; Cheung, Y.K. Non-Linear seismic responce of reinforced concrete slit shear walls. J. Sound. Vibr. 1999, 226, 701–718. [Google Scholar] [CrossRef]
  59. Sayed, A.M.; Xin, W.; Zhishen, W. Finite element modeling of the shear capacity of RC beams strengthened with FRP sheets by considering different failure modes. Constr. Build. Mater. 2014, 59, 169–179. [Google Scholar] [CrossRef]
Figure 1. Evaluating the mesh sensitivity on the ultimate load capacity.
Buildings 14 02924 g001
Figure 2. A comparison of the FEM results with the experimental test for axial load capacity.
Buildings 14 02924 g002
Figure 3. Load and axial shortening curves generated by FEM results.
Buildings 14 02924 g003
Figure 4. Load and strain curves generated by FEM results.
Buildings 14 02924 g004
Figure 5. Deformations (axial shortening (mm)) and failure locations were obtained from FEM results (a) Specimen Pa-6-1 Zhu et al. [14] and (b) Specimen R4-2 Liu [36].
Buildings 14 02924 g005
Figure 6. A comparison of the ANSI/AISC 360-22 results with the experimental test.
Buildings 14 02924 g006
Figure 7. A comparison of the Eurocode-4 results with the experimental test.
Buildings 14 02924 g007
Figure 8. Load and axial shortening curves obtained from FEM simulation with different preload ratios. (a) Column C1 with L = 4000 mm; (b) Column C5 with L = 5000 mm.
Buildings 14 02924 g008
Figure 14. A comparison of the existing codes with the FEM results: (a) ANSI/AISC 360-22 and (b) Eurocode-4.
Buildings 14 02924 g014
Figure 15. The relationship between the concrete contribution ratio and the factor k obtained from FEM analysis.
Buildings 14 02924 g015
Figure 16. The relationship between the concrete contribution ratio and the factor k obtained from ANSI/AISC 360-22 [1].
Buildings 14 02924 g016
Table 1. The stress–strain relationships for concrete applied to the FEM analysis.
Concrete Grade 25Concrete Grade 26.6Concrete Grade 28.8Concrete Grade 46.6Concrete Grade 60
Stress (MPa)StrainStress (MPa)StrainStress (MPa)StrainStress (MPa)StrainStress (MPa)Strain
7.500.000327.980.000338.640.0003413.980.0004418.000.00049
19.250.001020.070.001021.160.001028.680.001033.340.0010
23.550.001524.780.001526.430.001538.000.001545.240.0015
24.950.002026.490.002028.550.002043.530.002053.220.0020
25.000.002126.600.002228.800.002346.080.002557.780.0025
25.000.002526.600.002528.800.002546.600.002959.740.0030
25.000.003026.600.003028.800.003046.600.003560.000.0033
60.000.0035
Ec (GPa)23.524.2425.2232.0861.41
fr (MPa)3.123.213.344.254.83
Table 2. The stress–strain relationships for steel applied to the FEM analysis.
Young and Liu [39] (R1L)Young and Liu [39] (R2L)Young and Liu [39] (R3L)Young and Liu [39] (R4L)Young and Ellobody [38] (SHS2)
Stress (MPa)StrainStress (MPa)StrainStress (MPa)StrainStress (MPa)StrainStress (MPa)Strain
3500.00184240.00223660.00194430.00234480.00224
3810.0094770.0113980.0134820.0114740.013
4120.055120.0584470.0565080.0525040.047
4490.095400.115140.145500.135740.13
5360.216040.235770.266080.276370.22
6260.456610.416290.436590.416760.31
6460.636750.556470.536760.516950.42
6490.726760.616480.646780.616990.5
6250.746340.646220.666420.636410.51
6010.755710.665810.685960.645960.52
Es (GPa)198194193194200
Table 3. Summary of columns on previous studies used to verify FEM results.
FE Model Based onColumn
Specimen
Steel Column Dimensions fy (MPa)Concrete
fc
(MPa)
a
(mm)
b
(mm)
t
(mm)
L (mm)a/b
Liu [36]R1-11201204.003601.049560.0
R2-11501004.004501.549560.0
R3-2180904.005402.049560.0
R4-21301304.003901.049560.0
R5-11601104.004801.549560.0
R6-11901004.005701.949560.0
R7-11061064.003201.049589.0
R8-1130904.003901.449589.0
R9-2160804.004802.049589.0
R10-11401404.004201.049589.0
R11-11601254.004801.349589.0
Zhu et al. [14]Pa-6-11971976.406001.043826.6
Pa-10-120120110.106001.038226.6
Young and Ellobody [38]SHS1C40150.5150.55.8344501.049746.6
SHS1C60150.6150.65.8294501.049761.9
SHS2C0150.5150.52.7966001.0448----
SHS2C40150.5150.52.7824501.044846.6
SHS2C60150.5150.52.7804501.044861.9
RHS1C40197.1109.54.0606001.850346.6
RHS3C0140.078.83.0756001.8486----
RHS3C40140.280.13.1004201.848646.6
RHS3C60140.280.13.1004201.848661.9
Dundu [12]S1-101/1101.6101.63.0010001.048425.0
S1-101/1.5101.6101.63.0015001.048425.0
S1-120/11201203.5015001.040125.0
S1-120/21201203.5020001.040125.0
S1-150/1.51501503.5015001.040525.0
S1-150/21501503.5020001.040525.0
S1-150/2.51501503.5025001.040525.0
S3-120/2.71201203.0027001.040128.8
S3-150-3/2.71501503.0027001.042928.8
S3-150-4.5/2.71501504.5027001.033528.8
Young and Liu [39]R1L1200120.1401.9411993.0350----
R1L2000120.2401.9520003.0350----
R2L1200119.739.95.3112003.0424----
R3L1200119.980.12.8212001.5366----
R3L2000120802.8020001.5366----
R4L2000120.180.46.0220001.5443----
Table 4. Summary of the columns created in this study by FEM analysis.
FEM SpecimenSteel Column Dimensionsfy
(MPa)
Concrete
fc
(MPa)
b
(mm)
t
(mm)
L (mm)b/tCompact limit
R1-112043603046.149560
R1-L = 1500120415003046.149560
C1200540004046.149560
C2150540003046.149560
C3250540005046.149560
C4200530004046.149560
C5200550004046.149560
C6200840002546.149560
C72001040002046.149560
C820012400016.746.149560
C9200540004046.149521
C10200540004046.149540
C11200540004055.3334.840
C12200540004050.640540
Table 5. Comparison of FEM results of CFSC and existing codes with experimental tests.
FE Model Based onColumn
Specimen
NExp (kN)FEM ResultsANSI/AISC 360-22Eurocode 4
NFEM (kN)NFEM/NExpNAISC (kN)NAISC/NExpNEC4 (kN)NEC4/NExp
Liu [36]R1-11701.01685.70.9911555.90.9151671.40.983
R2-21778.01764.50.9921618.90.9111742.20.980
R3-21795.01836.31.0231746.20.9731883.81.049
R4-22018.02028.11.0051754.10.8691891.00.937
R5-11982.01942.40.9801822.10.9191967.80.993
R6-12049.02006.00.9791959.70.9562121.41.035
R7-11749.01728.00.9881531.40.8761662.60.951
R8-11752.01764.31.0071590.30.9081729.90.987
R9-11878.01896.81.0101734.40.9241892.71.008
R10-12752.02713.50.9862390.50.8692627.90.955
R11-12580.02518.10.9762434.50.9442679.71.039
Zhu et al. [14]Pa-6-12730.02710.90.9932669.50.9782780.81.019
Pa-10-13980.03852.60.9683432.90.8633539.80.889
Young and Ellobody [38]SHS1C402768.12690.60.9722424.10.8762562.80.926
SHS1C602972.03037.41.0222675.90.9002859.80.962
SHS2C401381.51376.00.9961233.30.8931381.91.000
SHS2C601620.01660.51.0251505.30.9291702.71.051
RHS1C401627.21685.91.0361672.71.0281813.81.115
RHS3C401048.71021.40.974951.90.9081024.90.977
RHS3C601096.91135.31.0351079.20.9841175.81.072
Dundu [12]S1-101/1718.9745.51.037751.71.046797.11.109
S1-101/1.5691.2720.31.042738.11.068797.11.153
S1-120/1997.2968.30.971903.50.906970.10.973
S1-120/2899.7933.81.038889.20.988970.11.078
S1-150/1.51330.11316.80.9901245.00.9361338.61.006
S1-150/21307.61312.81.0041232.00.9421338.61.024
S1-150/2.51198.31224.61.0041215.41.0141338.61.117
S3-120/2.7825.2812.00.984821.40.995937.01.136
S3-150-3/2.71087.11095.81.0081085.60.9991187.91.093
S3-150-4.5/2.71300.41292.30.9941342.61.0321449.41.115
Average ratio 1.022 0.945 1.024
COV 2.25% 5.74% 6.81%
r 0.999 0.998 0.998
Table 6. Comparison of FEM results for unfilled concrete steel columns and existing codes with experimental tests.
FE Model Based onColumn
Specimen
NExp (kN)FEM ResultsANSI/AISC 360-22Eurocode 4
NFEM (kN)NFEM/NExpNAISC (kN)NAISC/NExpNEC4 (kN)NEC4/NExp
Young and Ellobody [38]SHS2C0408.6409.81.003405.20.992405.80.993
RHS3C0558.2563.21.009552.90.991557.00.998
Young and Liu [39]R1L1200167.0169.00.988189.61.135154.40.925
R1L2000141.3147.01.040162.91.153139.40.986
R2L1200717.4730.31.018567.60.791646.60.901
R3L1200398.3390.70.981381.10.957391.30.982
R3L2000394.0382.20.970361.40.917389.10.987
R4L2000970.4998.51.029873.60.900960.90.990
Average ratio 1.005 0.980 0.970
COV 2.41% 12.00% 3.62%
r 0.999 0.996 0.999
Table 7. Summary of FEM results for steel columns with and without concrete filling under preloading.
FEM
Specimen
% Preloadingof SteelFEM ResultsANSI/AISC 360-22Eurocode 4
NFEM (kN)NPL/NUfNC
(kN)
NCPL/NCNAISC (kN)NAISC/NFEMNEC4 (kN)NEC4/NFEM
R1-1-Without preloading01685.71.000623.81.0001555.90.9231671.40.991
R1-1-P40%401685.71.000623.81.0001555.90.9231671.40.991
R1-1-P60%601685.71.000623.81.0001555.90.9231671.40.991
R1-1-P70%701655.50.982593.60.9521555.90.9401671.41.010
R1-1-P80%801619.20.961557.30.8931555.90.9611671.41.032
R1-1-Only steel---1061.9---------917.40.864922.80.869
R1-L = 1500-Without preloading01614.21.000610.21.0001514.70.9381671.41.035
R1-L = 1500-P40%401614.21.000610.21.0001514.70.9381671.41.035
R1-L = 1500-P60%601614.21.000610.21.0001514.70.9381671.41.035
R1-L = 1500-P70%701564.00.969560.00.9181514.70.9681671.41.069
R1-L = 1500-P80%801471.80.912467.80.7671514.71.0291671.41.136
R1-L = 1500-Only steel---1004.0---------895.60.892922.80.919
C1-Without preloading03971.51.0002084.31.0003491.50.8794096.51.031
C1-P40%403971.51.0002084.31.0003491.50.8794096.51.031
C1-P60%603898.10.9822010.90.9653491.50.8964096.51.051
C1-P70%703787.60.9541900.40.9123491.50.9224096.51.082
C1-P80%803367.70.8481480.50.7103491.51.0374096.51.216
C1-Only steel---1887.2---------1810.20.9591762.60.934
C2-Without preloading02428.51.0001103.51.0002138.80.8812611.51.075
C2-P40%402394.30.9861069.20.9692138.80.8932611.51.091
C2-P60%602332.90.9611007.80.9132138.80.9172611.51.119
C2-P70%702283.50.940958.40.8692138.80.9372611.51.144
C2-P80%802038.00.840712.90.6462138.81.0492611.51.281
C2-Only steel---1325.1---------1277.90.9641310.50.989
C3-Without preloading05826.41.0003335.41.0005060.50.8695881.51.009
C3-P40%405826.41.0003335.41.0005060.50.8695881.51.009
C3-P60%605826.41.0003335.41.0005060.50.8695881.51.009
C3-P70%705648.70.9703157.70.9475060.50.8965881.51.041
C3-P80%805131.80.8812640.80.7925060.50.9865881.51.146
C3-Only steel---2491.0---------2328.60.9352425.50.974
C4-Without preloading04041.11.0002002.91.0003611.40.8944096.51.014
C4-P40%404041.11.0002002.91.0003611.40.8944096.51.014
C4-P60%604041.11.0002002.91.0003611.40.8944096.51.014
C4-P70%703945.10.9761906.90.9523611.40.9154096.51.038
C4-P80%803635.00.9001597.80.7983611.40.9934096.51.127
C4-Only steel---2038.2---------1861.90.9131762.60.865
C5-Without preloading03735.51.0001943.81.0003343.10.8954096.51.097
C5-P40%403666.10.9811874.40.9643343.10.9124096.51.117
C5-P60%603615.20.9681823.50.9383343.10.9254096.51.133
C5-P70%703504.80.9381713.10.8813343.10.9544096.51.169
C5-P80%803036.10.8131244.40.6403343.11.1014096.51.349
C5-Only steel---1791.7---------1745.90.9741762.60.984
C6-Without preloading04891.81.0001892.21.0004431.60.9065072.61.037
C6-P40%404891.81.0001892.21.0004431.60.9065072.61.037
C6-P60%604742.00.9691742.40.9214431.60.9355072.61.070
C6-P70%704596.10.9401596.50.8444431.60.9645072.61.104
C6-P80%804122.80.8431123.20.5944431.61.0755072.61.230
C6-Only steel---2999.6---------2846.60.9493005.61.002
C7-Without preloading05745.31.0001957.21.0005029.00.8755706.00.993
C7-P40%405673.40.9871885.40.9635029.00.8865706.01.006
C7-P60%605459.40.9501671.40.8545029.00.9215706.01.045
C7-P70%705297.10.9221509.00.7715029.00.9495706.01.077
C7-P80%804733.90.824945.80.4835029.01.0625706.01.205
C7-Only steel---3788.1---------3516.40.9283762.00.993
C8-Without preloading06497.51.0002022.31.0005611.40.8646325.40.974
C8-P40%406306.20.9711831.00.9055611.40.8906325.41.003
C8-P60%606107.20.9401632.00.8075611.40.9196325.41.036
C8-P70%705914.90.9101439.70.7125611.40.9496325.41.069
C8-P80%805288.40.814813.20.4025611.41.0616325.41.196
C8-Only steel---4475.2---------4169.40.9324466.90.998
C9-Without preloading02551.51.000664.31.0002417.10.9472688.61.054
C9-P40%402451.80.961564.60.8502417.10.9862688.61.097
C9-P60%602355.00.923467.80.7032417.11.0262688.61.142
C9-P70%702281.90.894394.70.5942417.11.0592688.61.178
C9-P80%802042.60.801155.40.2342417.11.1832688.61.316
C9-Only steel---1887.2---------1810.20.9591762.60.934
C10-Without preloading03255.81.0001368.61.0002942.80.9043374.51.036
C10-P40%403188.90.9791301.70.9512942.80.9233374.51.058
C10-P60%603157.80.9701270.60.9282942.80.9323374.51.069
C10-P70%703050.90.9371163.60.8502942.80.9653374.51.106
C10-P80%802702.00.830814.80.5952942.81.0893374.51.249
C10-Only steel---1887.2---------1810.20.9591762.60.934
C11-Without preloading02548.11.0001270.91.0002403.10.9432749.71.079
C11-P40%402548.11.0001270.91.0002403.10.9432749.71.079
C11-P60%602507.30.9841230.10.9682403.10.9582749.71.097
C11-P70%702448.80.9611171.60.9222403.10.9812749.71.123
C11-P80%802192.80.861915.50.7202403.11.0962749.71.254
C11-Only steel---1277.2---------1248.70.9781272.60.996
C12-Without preloading02886.51.0001336.81.0002649.20.9183023.51.047
C12-P40%402886.51.0001336.81.0002649.20.9183023.51.047
C12-P60%602827.20.9791277.90.9562649.20.9373023.51.069
C12-P70%702742.50.9501193.20.8932649.20.9663023.51.102
C12-P80%802450.40.849901.10.6742649.21.0813023.51.234
C12-Only steel---1549.3---------1497.60.9671491.40.963
Disclaimer/Publisher’s Note: The statements, opinions and data contained in all publications are solely those of the individual author(s) and contributor(s) and not of MDPI and/or the editor(s). MDPI and/or the editor(s) disclaim responsibility for any injury to people or property resulting from any ideas, methods, instructions or products referred to in the content.

