

Energy Monitoring and Analysis of a Residential House in China


Abstract
:1. Introduction
2. Building Information
2.1. Building Geometry
2.2. Building Construction
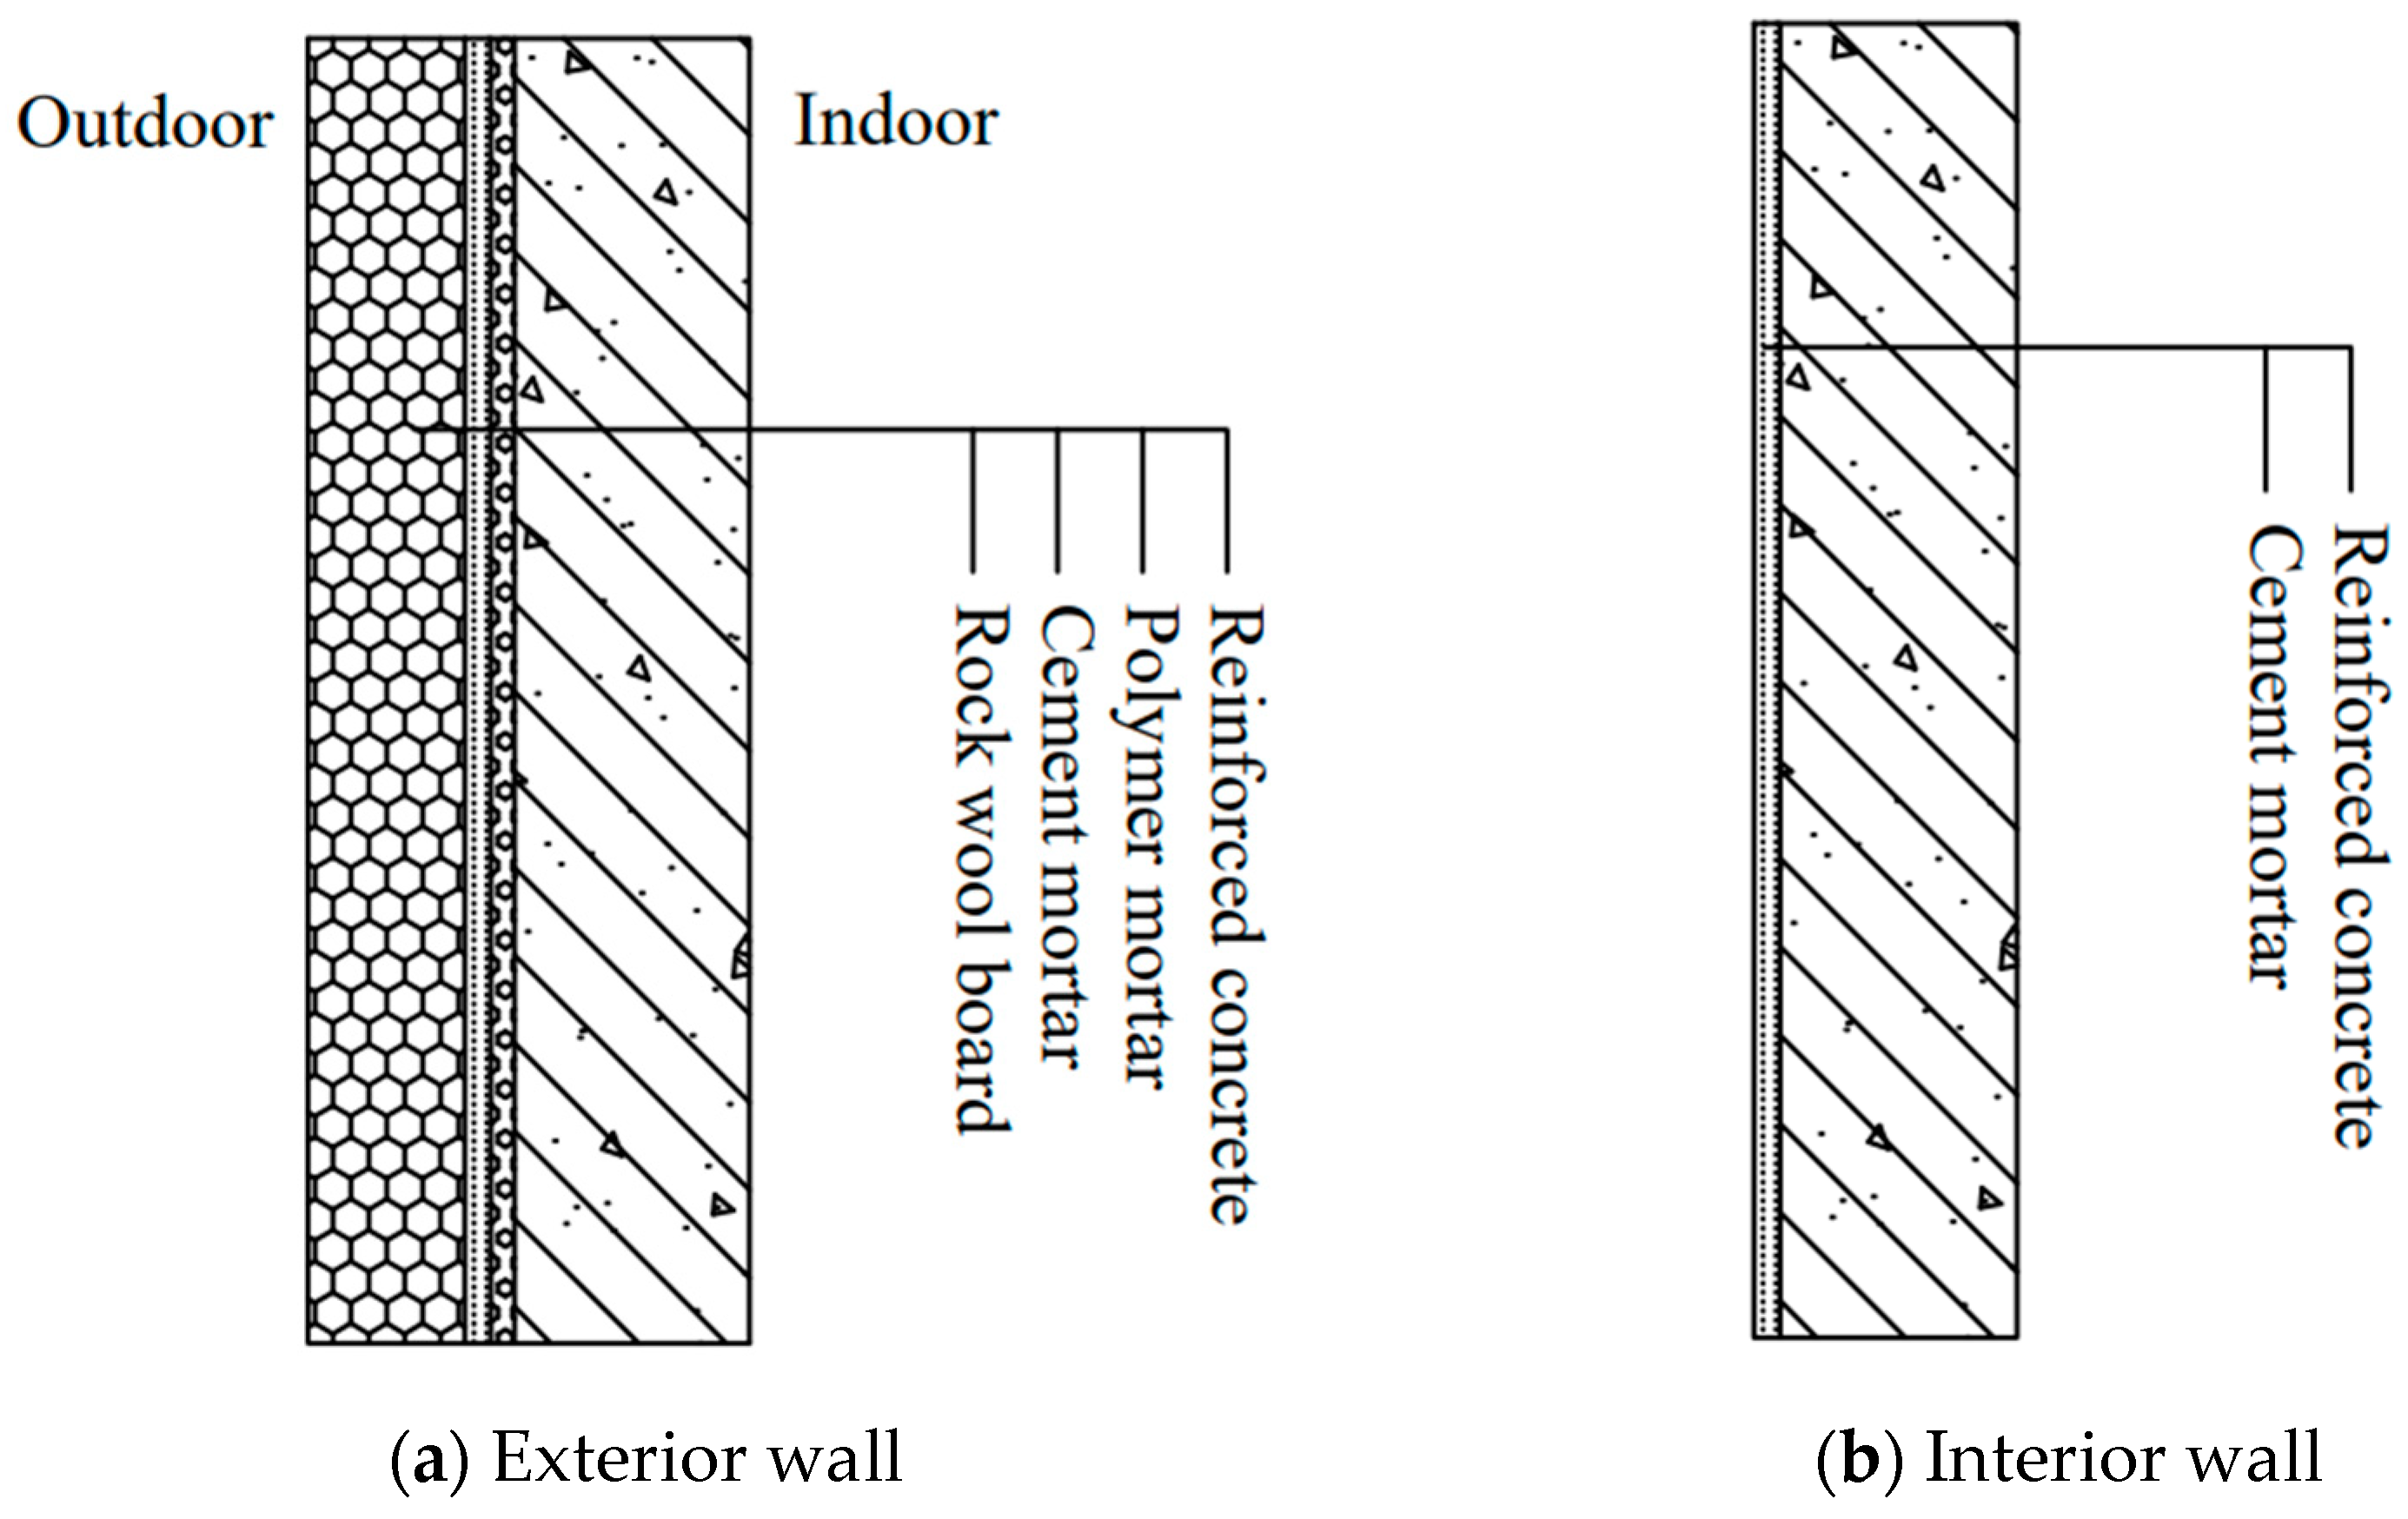
2.2.1. Wallboards
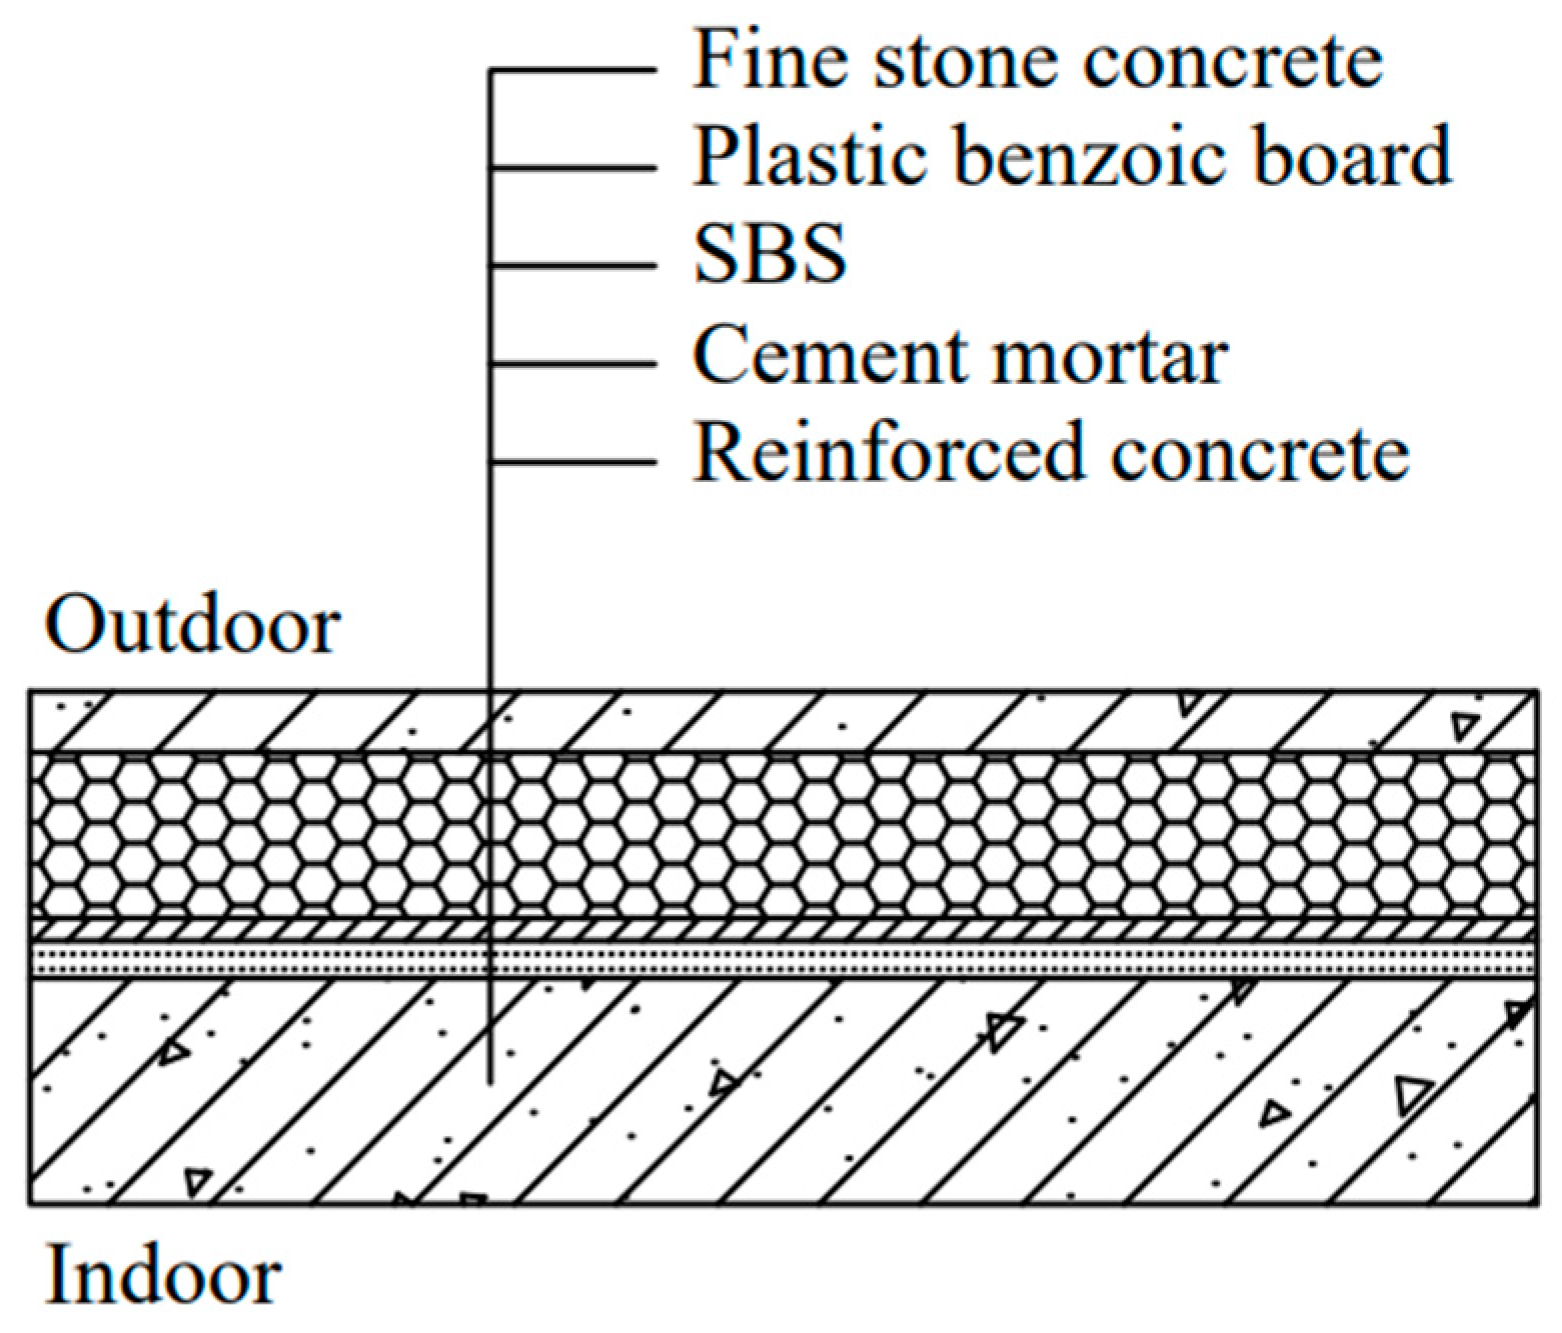
2.2.2. Roof
2.2.3. Floor
3. Methodology
3.1. Monitoring Methodology
3.1.1. Indoor Average Temperature
3.1.2. Outdoor Average Temperature
3.1.3. Temperature Control
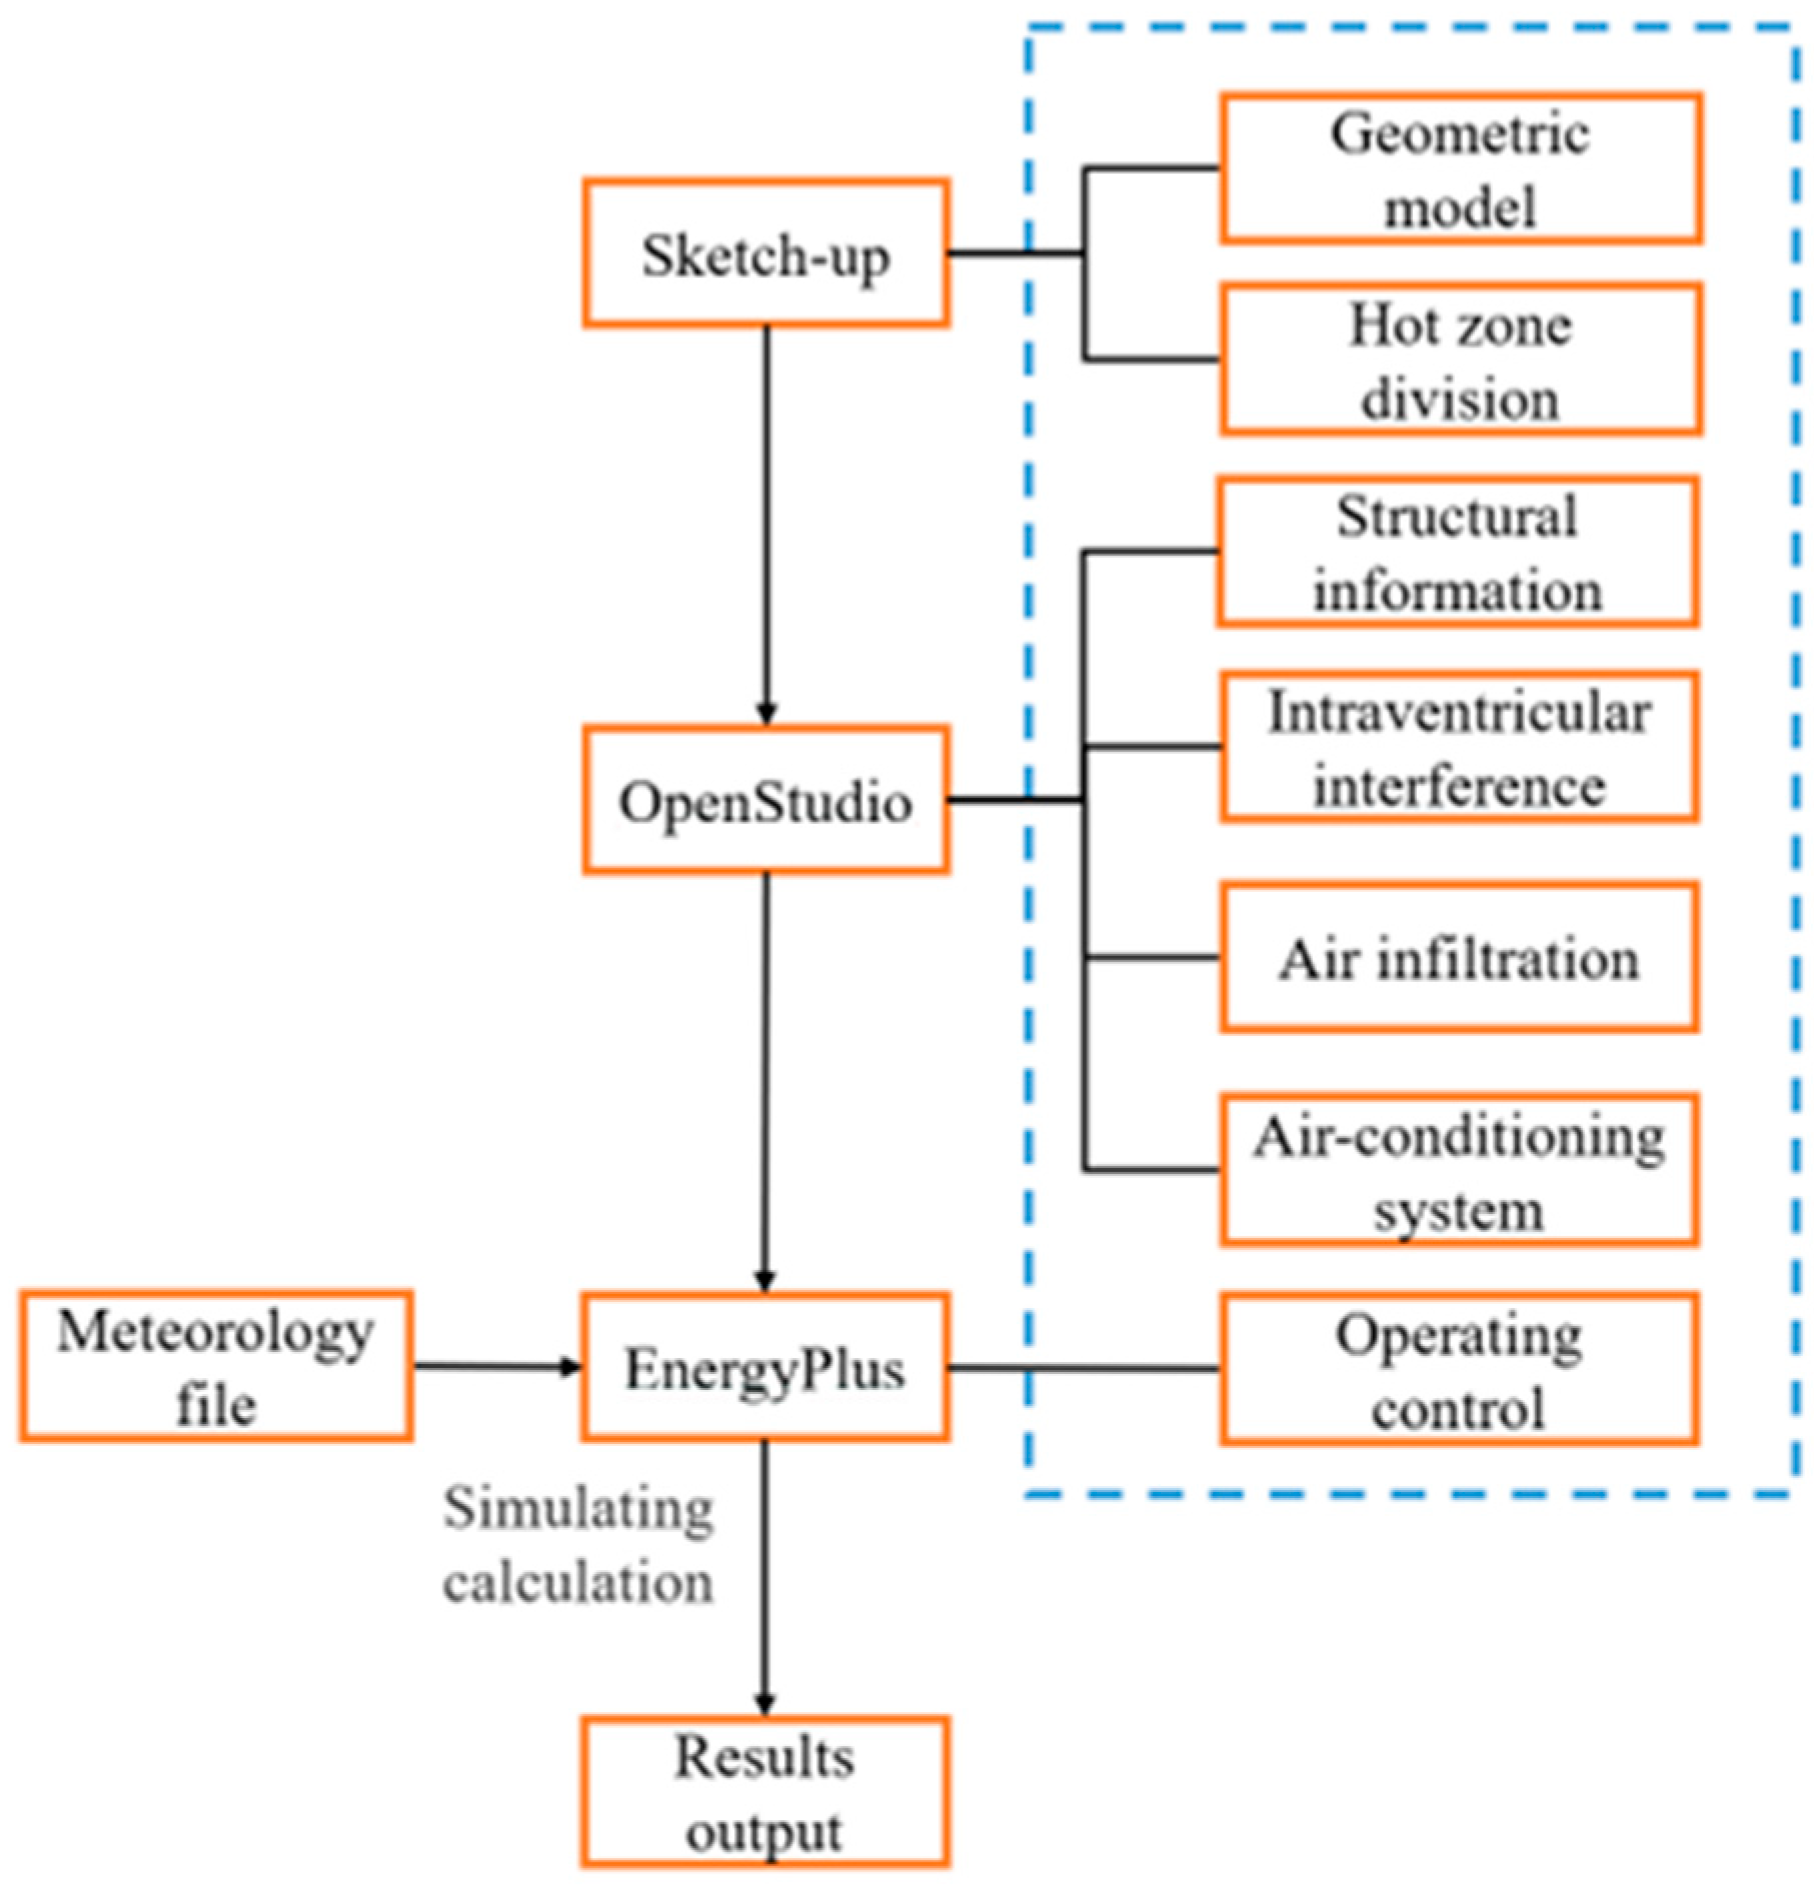
3.2. Modeling
4. Results and Discussion
4.1. Average Indoor Temperature Monitoring Results
4.2. Building Heating Energy Consumption
4.3. Parametric Analysis
4.3.1. Parameter Selection
4.3.2. Analysis of Simulation Results
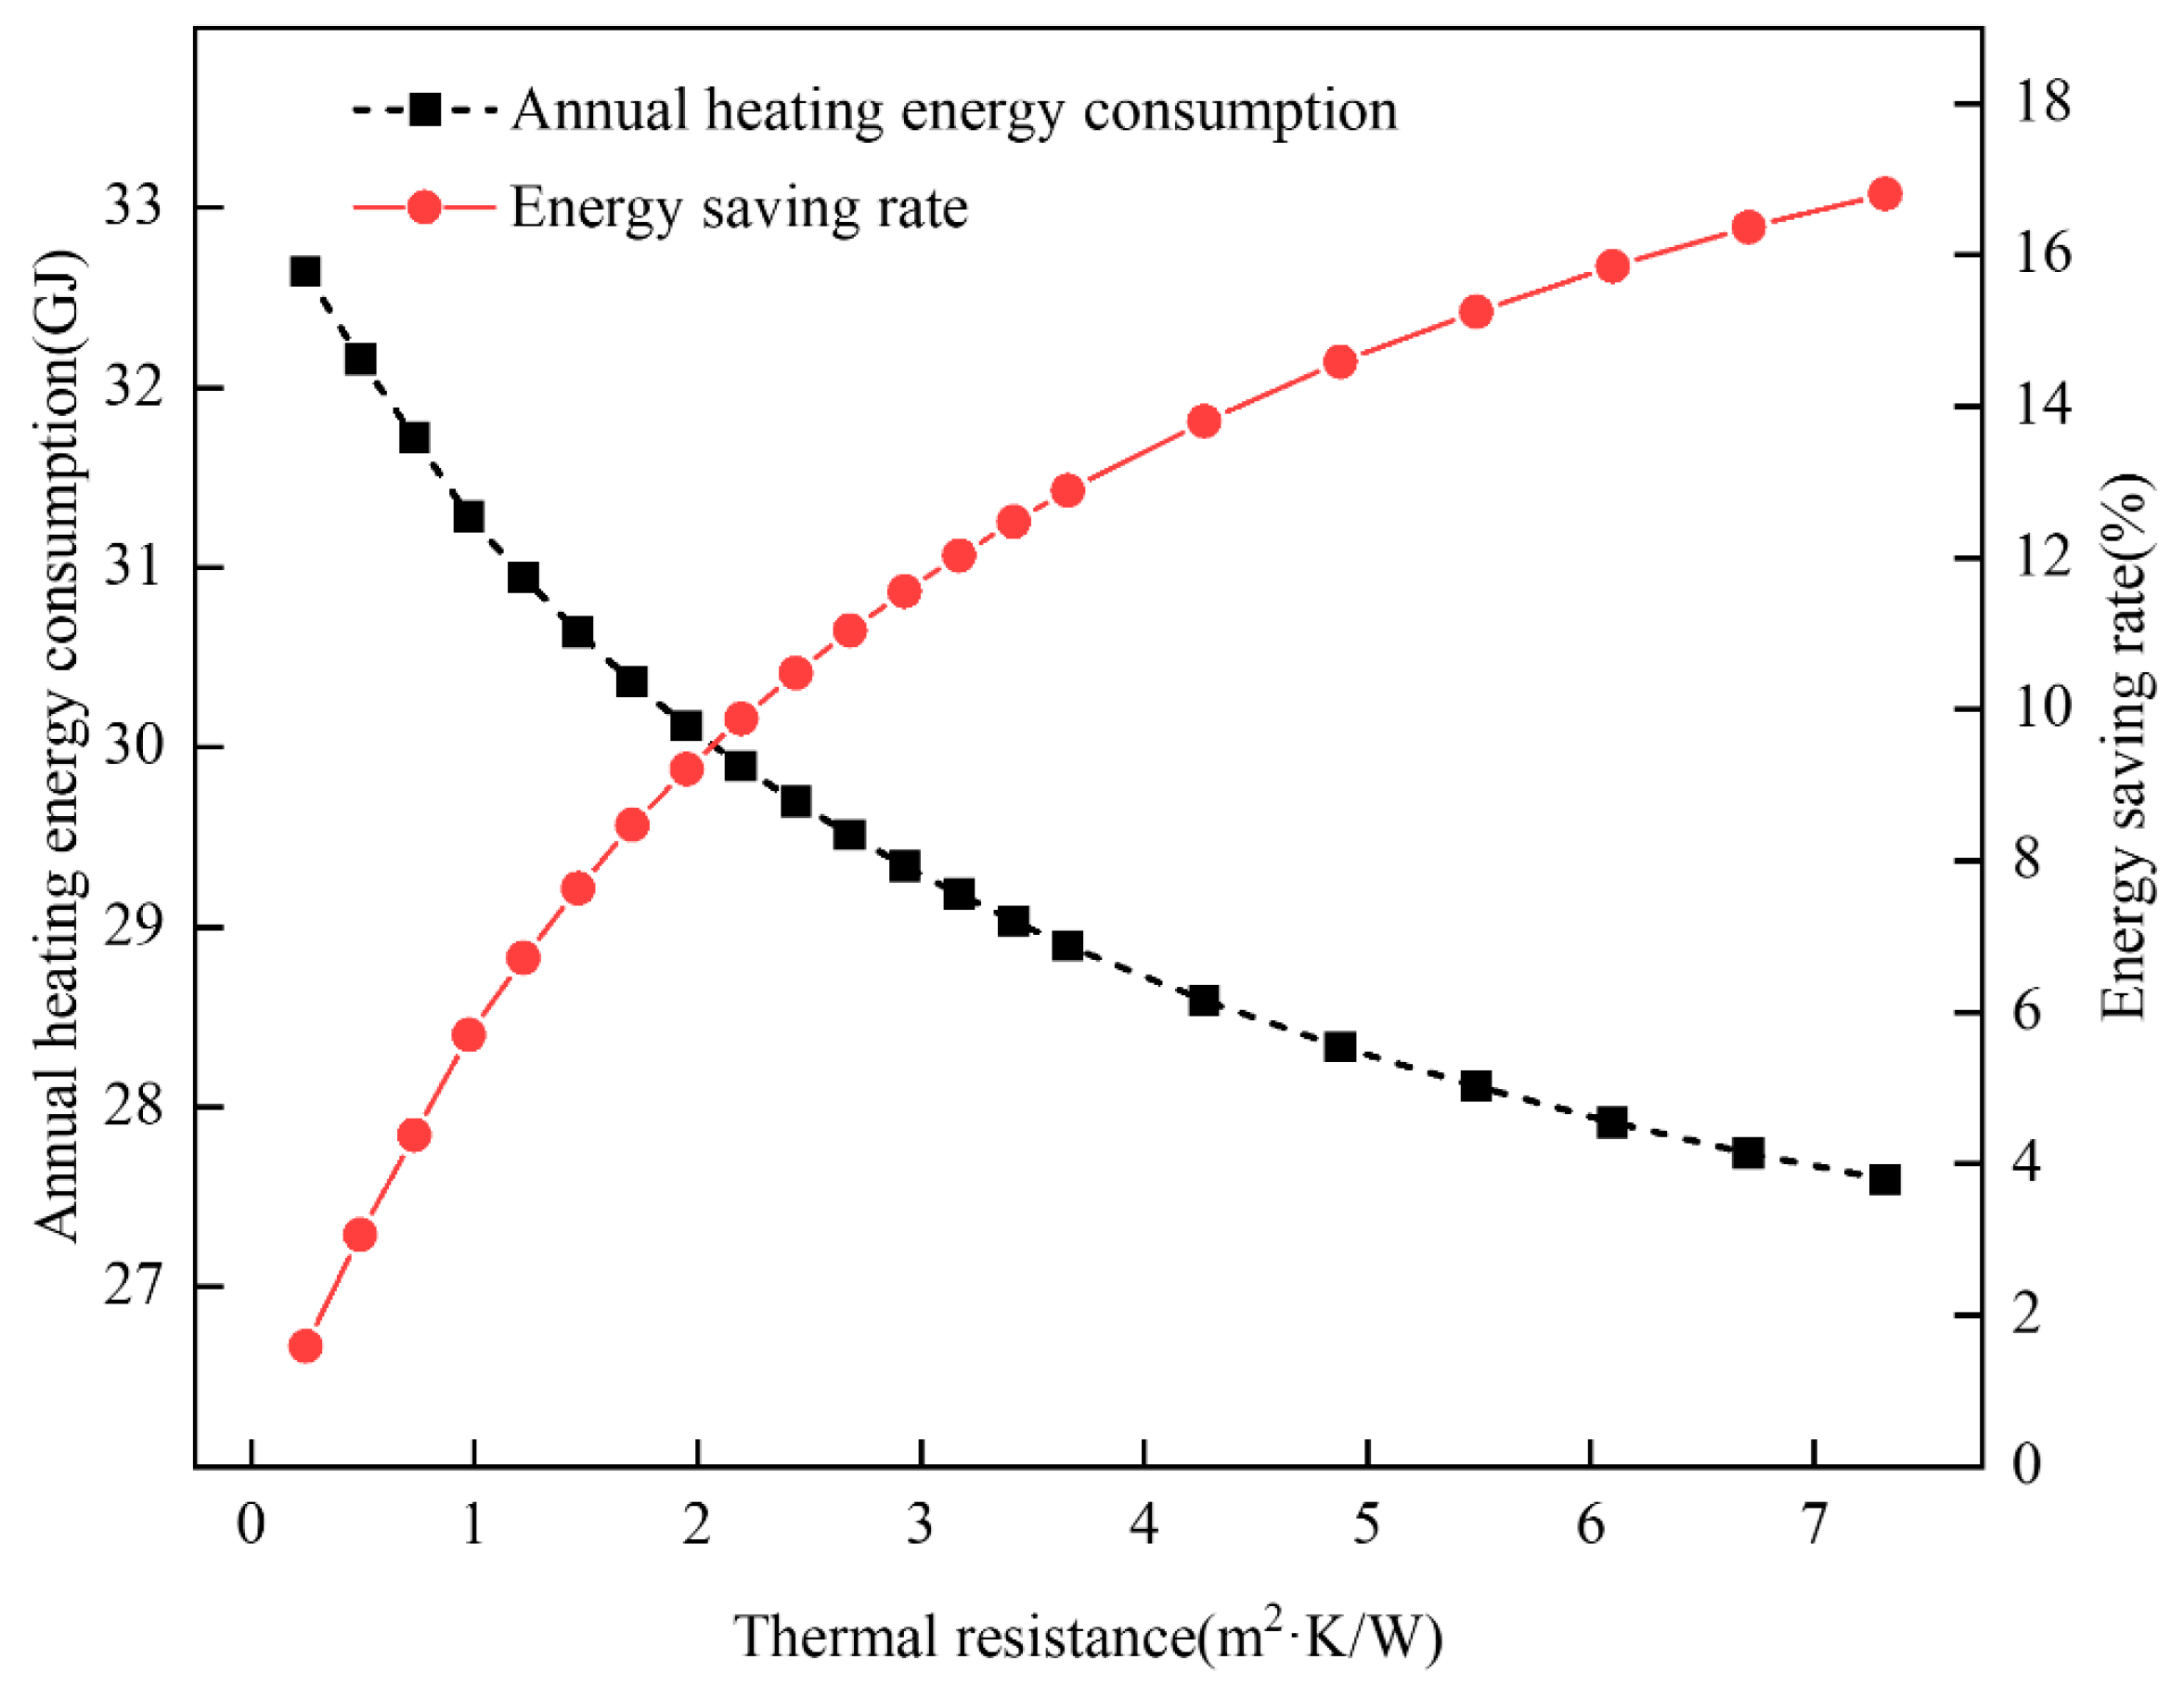
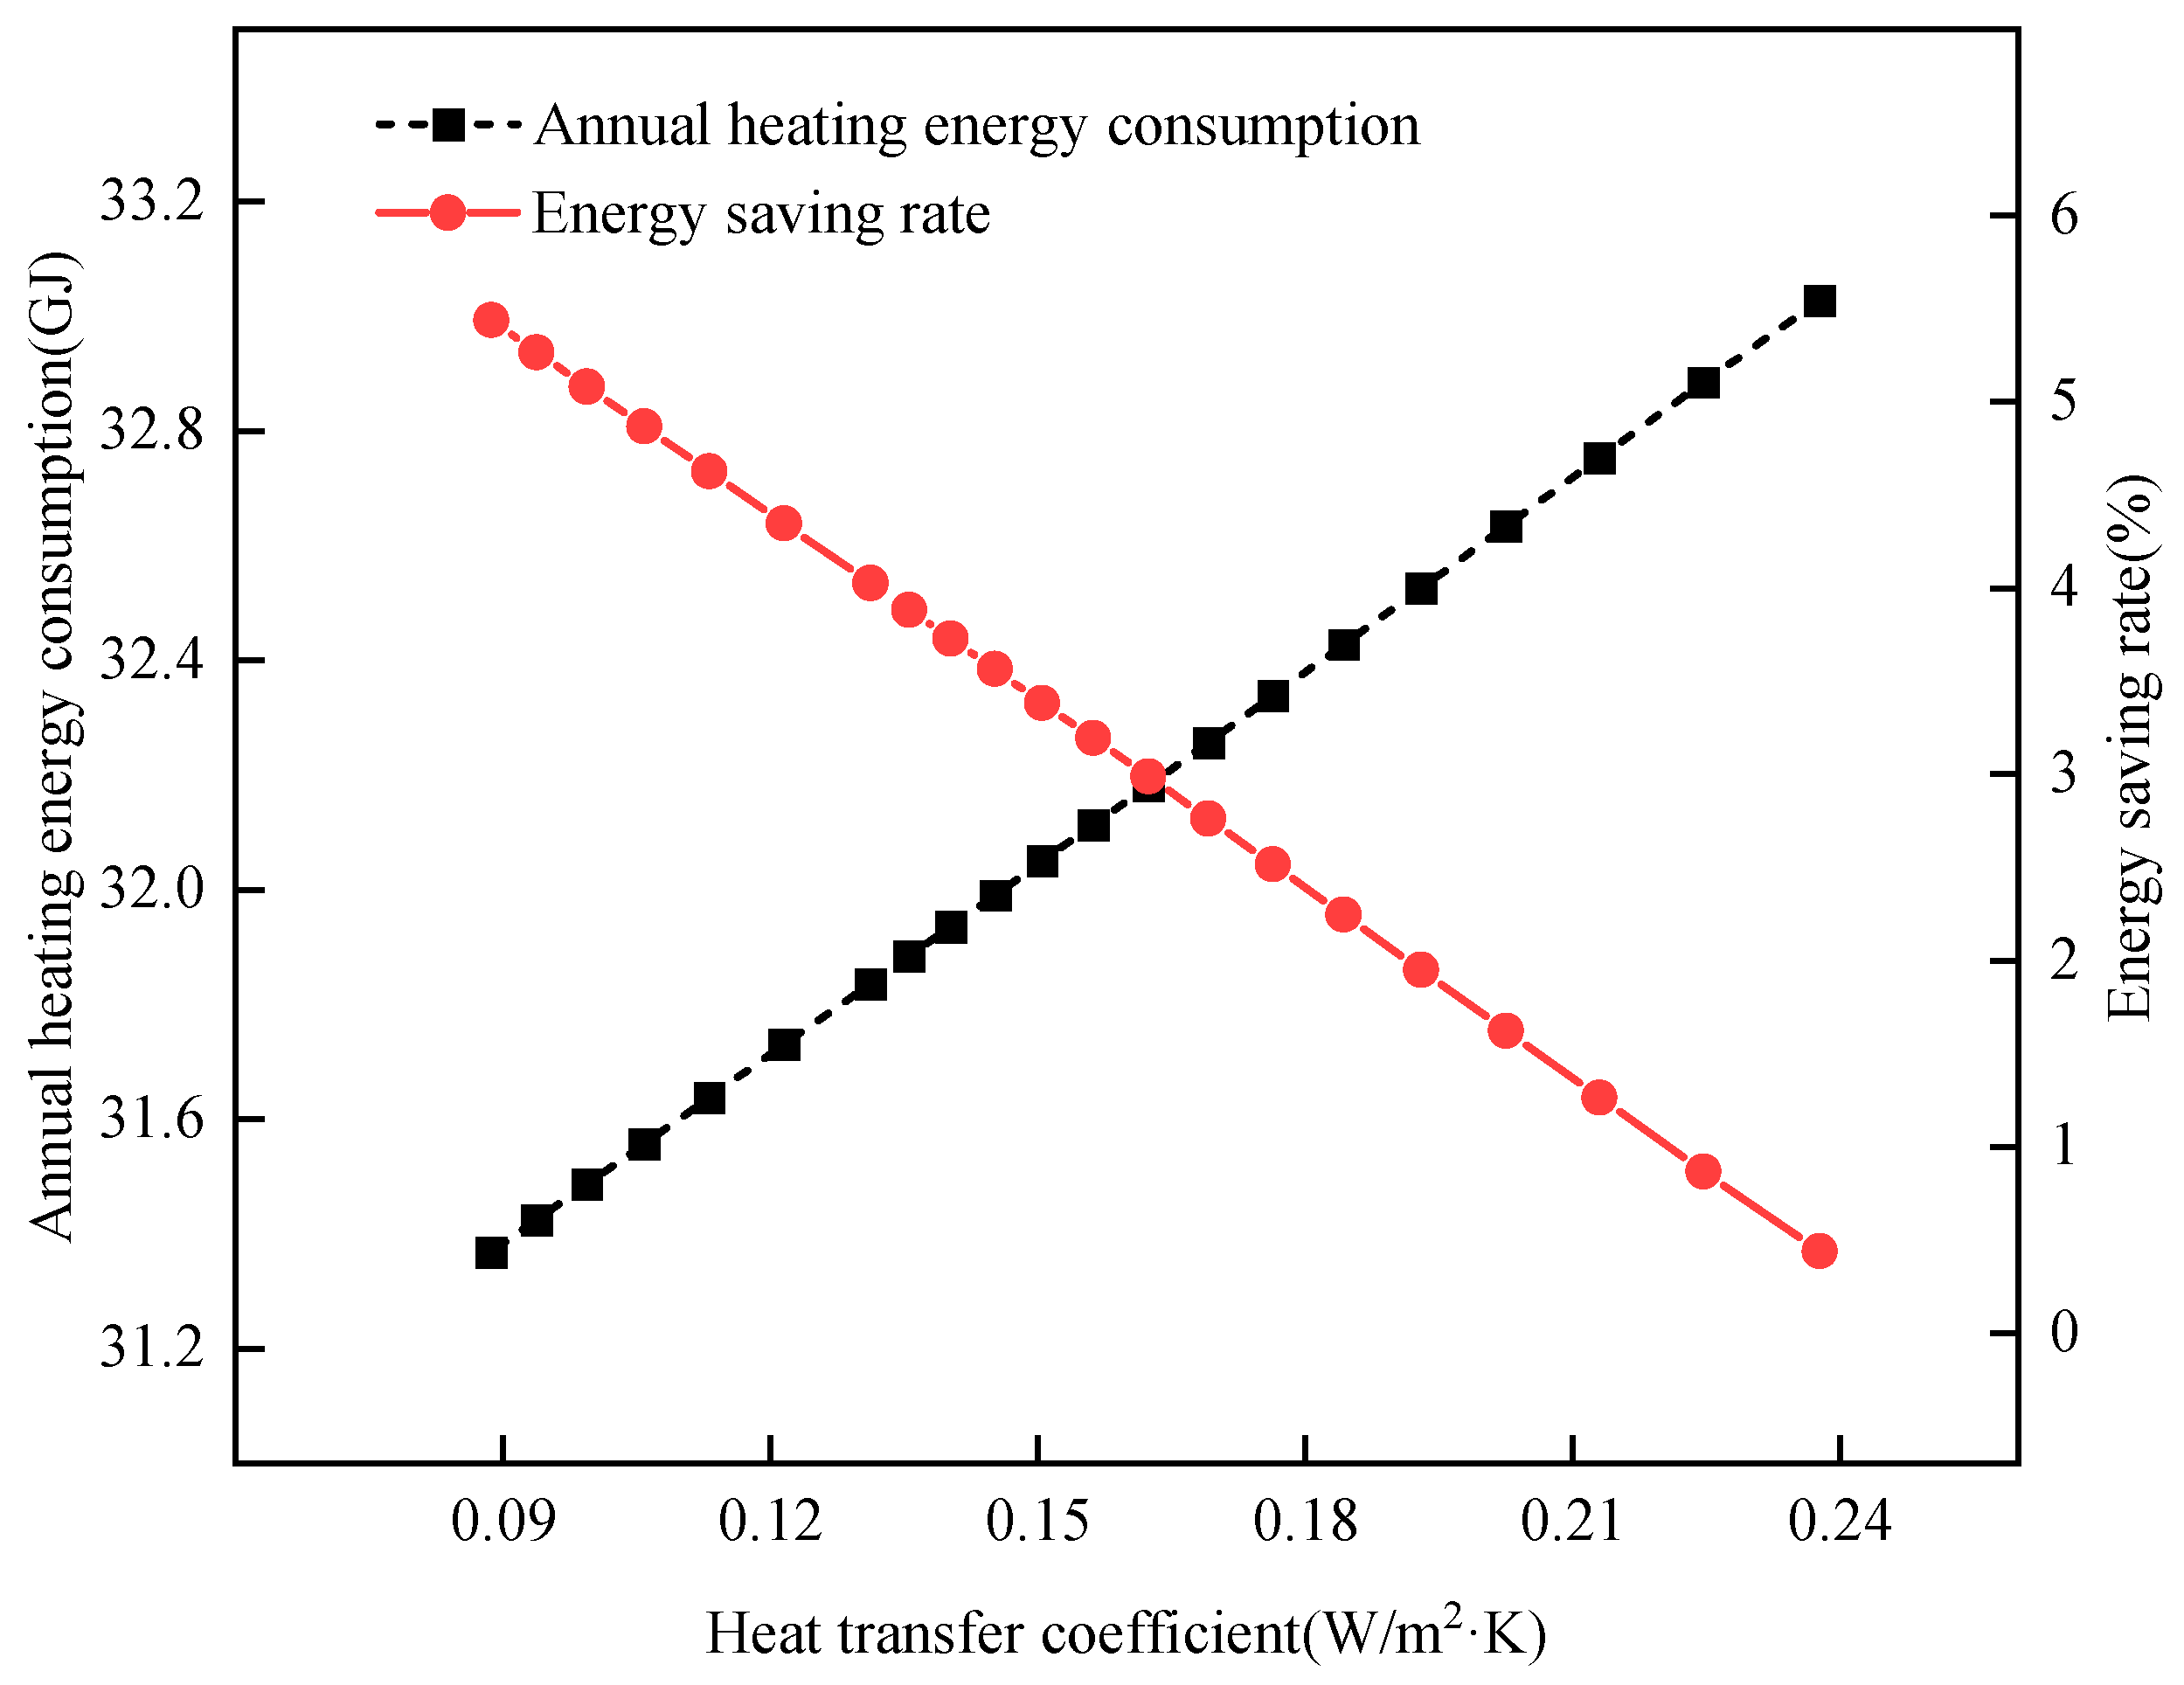
(1) Influence of Heat Transfer Coefficients of Exterior Walls on Building Heating Energy Consumption
(2) Influence of Roof Heat Transfer Coefficient on Building Heating Energy Consumption
(3) Influence of Exterior Window Solar Heat Gain Coefficient on Building Heating Energy Consumption
5. Conclusions
- The monitoring results showed that the indoor temperature on the south side of the building was higher than that on the north side, while the temperature on the southwest side was significantly higher than that on the southeast side, and the temperature difference between the northwest and northeast sides was small. This is related to the orientation of the building, the layout of the rooms, the position of the doors and windows, and the special structure of the ground floor.
- A 3D model of the building was constructed using EnergyPlus, and the building structural information, room temperature control, and other parameters were consistent with the actual situation. Comparing simulation results with actual energy consumption data, the error between the two values is around 10%, proving the accuracy of the EnergyPlus model.
- The results from the EnergyPlus model are more accurate when the outdoor temperature is based on the monitoring data, compared with those when the outdoor temperature is based on the typical meteorological year file.
- The EnergyPlus model was further employed to analyze the impact of enhancing the thermal resistance of the exterior envelope on the building’s energy efficiency. The results show that, after adding a certain thickness of thermal insulation to the building’s wall and roof, the energy saving effect produced by further increasing the thickness of the thermal insulation layer is limited.
- By analyzing the influence of exterior window solar heat gain coefficient on the building’s energy efficiency, it can be concluded that the use of building exterior windows with a higher solar heat gain coefficient can effectively reduce building energy consumption.
6. Limitations and Future Work
- Residential energy is a significant source of global growth in energy demand and carbon emissions. The location characteristics, housing characteristics, and unit size of a home all affect the energy use of residential buildings, which still needs to be explored.
- Some parameters, such as external window heat transfer coefficient, window-to-wall ratio, and humidity, also impact building energy consumption, but are not included in this study, which can be considered in future research.
- The specified air exchange value, which refers to the rate at which indoor air is replaced by outdoor air, is directly related to the thermal environment and energy consumption of a building. Appropriate air exchange rate helps maintain indoor air quality and provides a comfortable living and working environment. An excessively high air exchange rate can lead to significant energy loss through the ventilation system, thereby increasing the building’s energy consumption. Therefore, it is worth studying the impact of different air exchange rates on the energy consumption of buildings in future research.
Author Contributions
Funding
Data Availability Statement
Conflicts of Interest
References
- International Energy Agency. Energy Efficiency: Buildings. The Global Exchange for Energy Efficiency Policies, Data and Analysis; International Energy Agency: Paris, France, 2022. [Google Scholar]
- Du, X.; Wen, L.; Wei, P.; Yang, M. A systematic approach for analyzing building energy conservation and emission reduction policies based on the principle of WSR. Energy Build. 2024, 315, 114328. [Google Scholar] [CrossRef]
- Cai, W. China Building Energy Consumption Annual Report 2020; China Association of Building Energy Efficiency: Xiamen, China, 2020. [Google Scholar]
- Vartholomaios, A. A parametric sensitivity analysis of the influence of urban form on domestic energy consumption for heating and cooling in a Mediterranean city. Sustain. Cities Soc. 2017, 28, 135–145. [Google Scholar] [CrossRef]
- Al-Saggaf, A.; Nasir, H.; Taha, M. Quantitative approach for evaluating the building design features impact on cooling energy consumption in hot climates. Energy Build. 2020, 211, 109802. [Google Scholar] [CrossRef]
- Wang, R. Simulation and Prediction of Typical Building Energy Consumption in Beijing; Xi’an University of Architecture and Technology: Xi’an, China, 2018. [Google Scholar]
- Santana, B.O.; Torres-Quezada, J.; Coch, H.; Isalgue, A. Monitoring and Calculation Study in Mediterranean Residential Spaces: Thermal Performance Comparison for the Winter Season. Buildings. 2022, 12, 325. [Google Scholar] [CrossRef]
- Charai, M.; Mezrhab, A.; Moga, L. A structural wall incorporating biosourced earth for summer thermal comfort improvement: Hygrothermal characterization and building simulation using calibrated PMV-PPD Model. Build. Environ. 2022, 212, 108842. [Google Scholar] [CrossRef]
- Shan, Q.; Tong, K.; Zhang, X.; Li, Y. Field Test and Simulation Analysis of Thermal Performance of Bamboo Steel Composite Wall in Different Climate Regions. Adv. Civ. Eng. 2020, 2020, 1–10. [Google Scholar] [CrossRef]
- Yu, D.; Tan, H.; Ruan, Y. A future bamboo-structure residential building prototype in China: Life cycle assessment of energy use and carbon emission. Energy Build. 2011, 43, 2638–2646. [Google Scholar] [CrossRef]
- Seddik Hassan, A.M.; Abd El Aal, R.F.A.; Fahmi, A.A.E.; Ali, S.M.A.; Abdelhady, M.I. Courtyard geometry’s effect on energy consumption of AlKharga city residential buildings, Egypt. Sci. Rep. 2024, 14, 11149. [Google Scholar] [CrossRef]
- Cabeza, L.F.; Castell, A.; Medrano, M.; Martorell, I.; Pérez, G.; Fernández, I. Experimental study on the performance of insulation materials in Mediterranean construction. Energy Build. 2010, 42, 630–636. [Google Scholar] [CrossRef]
- Tunçbilek, E.; Arıcı, M.; Krajčík, M.; Li, Y.; Jurčević, M.; Nižetić, S. Impact of nano-enhanced phase change material on thermal performance of building envelope and energy consumption. Int. J. Energy Res. 2022, 46, 19313–20900. [Google Scholar] [CrossRef]
- Alyami, S.H.; Alqahtany, A.; Ashraf, N.; Osman, A.; Aldossary, N.A.; Almutlaqa, A.; Al-Maziad, F.; Alshammari, M.S.; Al-Gehlani, W.A.G. Impact of Location and Insulation Material on Energy Performance of Residential Buildings as per Saudi Building Code (SBC) 601/602 in Saudi Arabia. Materials. 2022, 15, 9079. [Google Scholar] [CrossRef] [PubMed]
- Guo, L.; Liao, Y.; Cheng, Z.; Zheng, H.; Guo, L.; Long, E. Experimental study on dynamic effect of exterior insulation on indoor thermal environment and energy consumption. Energy Build. 2022, 274, 112299. [Google Scholar] [CrossRef]
- Amani, N.; Kiaee, E. Developing a two-criteria framework to rank thermal insulation materials in nearly zero energy buildings using multi-objective optimization approach. J. Clean. Prod. 2020, 276, 122592. [Google Scholar] [CrossRef]
- Shibuya, T.; Croxford, B. The effect of climate change on office building energy consumption in Japan. Energy Build. 2016, 117, 149–159. [Google Scholar] [CrossRef]
- Li, D.H.W.; Lam, J.C.; Wong, S.L. Daylighting and its effects on peak load determination. Energy. 2005, 30, 1817–1831. [Google Scholar] [CrossRef]
- Dong, H.R.; Liu, J.P. Analysis of Thermal Performance and Energy Consumption of Residential Envelope Structures in Zhangjiakou City. Heat. Vent. Air Cond. 2003, 33, 3. [Google Scholar]
- Han, J.; Lu, X.; Gu, Y.; Liao, W.; Cai, Q.; Xue, H. Optimized data representation and understanding method for the intelligent design of shear wall structures. Eng. Struct. 2024, 315, 118500. [Google Scholar] [CrossRef]
- National Bureau of Statistics of China. China Statistical Yearbook; China Statistics Press: Beijing, China, 2020. [Google Scholar]
- Sowa, J.; Mijakowski, M. Humidity-Sensitive, Demand-Controlled Ventilation Applied to Multiunit Residential Building—Performance and Energy Consumption in Dfb Continental Climate. Energies 2020, 13, 6669. [Google Scholar] [CrossRef]
- Lou, R.; Hallinan, K.P.; Huang, K.; Reissman, T. Smart Wifi Thermostat-Enabled Thermal Comfort Control in Residences. Sustainability. 2020, 12, 1919. [Google Scholar] [CrossRef]
- Wang, Y.; Liu, K.; Liu, Y.; Wang, D.; Liu, J. The impact of temperature and relative humidity dependent thermal conductivity of insulation materials on heat transfer through the building envelope. J. Build. Eng. 2022, 46, 103700. [Google Scholar] [CrossRef]
- JGJ/T 449-2018; Standard for green performance calculation of civil buildings. China building industry press: Beijing, China, 2018.
- Efficiency Valuation Organization. International Performance Measurement & Verification Protocol: Concepts and Options for Determining Energy and Water Savings; Technical Report; Efficiency Valuation Organization: Washington, DC, USA, 2012. [Google Scholar]
- American Society of Heating, Refrigerating, and Air-Conditioning Engineers. ASHRAE Guideline 14-2014: Measurement of Energy, Demand, and Water Savings; Technical Report; American Society of Heating; Refrigerating, and Air-Conditioning Engineers: Atlanta, GA, USA, 2014. [Google Scholar]
- Pachano, J.E.; Bandera, C.F. Multi-step building energy model calibration process based on measured data. Energy Build. 2021, 252, 111380. [Google Scholar] [CrossRef]
- Sun, J.; Zhang, Q.; Chen, A.; Wu, Z. Energy performance of buildings with multi-ribbed composite wall structural system. J. Build. Eng. 2024, 91, 109614. [Google Scholar] [CrossRef]
- Manz, H.; Frank, T. Thermal simulation of buildings with double-skin façades. Energy Build. 2005, 37, 1114–1121. [Google Scholar] [CrossRef]
- Omrany, H.; Ghaffarianhoseini, A.; Ghaffarianhoseini, A.; Raahemifar, K.; Tookey, J. Application of passive wall systems for improving the energy efficiency in buildings: A comprehensive review. Renew. Sustain. Energy Rev. 2016, 62, 1252–1269. [Google Scholar] [CrossRef]
- Ginevičius, R.; Podvezko, V.; Raslanas, S. Evaluating the alternative solutions of wall insulation by multicriteria methods/Pastatų sienų šiltinimo variantų vertinimas taikant daugiakriterius metodus. J. Civ. Eng. Manag. 2008, 14, 217–226. [Google Scholar] [CrossRef]
- Zhu, J.; Chew, D.A.; Lv, S.; Wu, W. Optimization method for building envelope design to minimize carbon emissions of building operational energy consumption using orthogonal experimental design (OED). Habitat Int. 2013, 37, 148–154. [Google Scholar] [CrossRef]
- Maučec, D.; Premrov, M.; Leskovar, V.Ž. Use of sensitivity analysis for a determination of dominant design parameters affecting energy efficiency of timber buildings in different climates. Energy Sustain. Dev. 2021, 63, 86–102. [Google Scholar]
- Liao, W. Research on Energy Saving of Building Envelope Structure in Nanjing Area Based on DeST Simulation; Anhui University of Science and Technology: Huainan, China, 2018. [Google Scholar]
- Li, H. Research on Energy Simulation and Energy Saving of an Office Building in Hot Summer and Cold Winter Area; Harbin Institute of Technology: Harbin, China, 2020. [Google Scholar]


| Building Component | Configuration | Thickness (mm) | |
|---|---|---|---|
| Wallboards | Exterior wall | Reinforced concrete | 200 |
| Polymer mortar | 8 | ||
| Cement mortar | 10 | ||
| Rock wool board | 120 | ||
| Interior wall | Reinforced concrete | 200 | |
| Cement mortar | 10 | ||
| Roof | Fine stone concrete | 40 | |
| Plastic benzoic board | 110 | ||
| SBS | 4 | ||
| Cement mortar | 15 | ||
| Reinforced concrete | 150 | ||
| Floor | Cement mortar | 20 | |
| Pisolite concrete | 50 | ||
| Plastic benzoic board | 20 | ||
| Cement mortar | 20 | ||
| Reinforced concrete | 120 | ||
| Time | House State | Energy Source | ||
|---|---|---|---|---|
| Lighting | Domestic Hot Water | Heating | ||
| 2023/1/18–2023/1/20 | Occupied | Electricity | Electricity | Gas |
| Other time | Vacant | - | - | Gas |
| November | December | January and February | March | |
|---|---|---|---|---|
| Simulate building heating energy consumption (GJ) | 3.00 | 9.80 | 17.55 | 0.75 |
| Simulate building gas consumption (m3) | 105.37 | 344.22 | 616.43 | 26.34 |
| Actual building gas consumption (m3) | 124 | 396 | 657 | 32 |
| Percentage (%) | 84.98 | 86.92 | 94.37 | 82.32 |
| NMBE (%) | −12.57 | |||
| CV(RMSE) (%) | 12.18 | |||
| R2 (%) | 90 | |||
| Insulating Layer Thickness (mm) | Thermal Resistance (m2·K/W) | Heat Transfer Coefficient (W/(m2·K)) | |
|---|---|---|---|
| Exterior wall | 10~300 | 0.2439~7.317 | 0.2894~0.0950 |
| Roof | 10~300 | 0.2439~7.317 | 0.2277~0.0887 |
Disclaimer/Publisher’s Note: The statements, opinions and data contained in all publications are solely those of the individual author(s) and contributor(s) and not of MDPI and/or the editor(s). MDPI and/or the editor(s) disclaim responsibility for any injury to people or property resulting from any ideas, methods, instructions or products referred to in the content. |
© 2024 by the authors. Licensee MDPI, Basel, Switzerland. This article is an open access article distributed under the terms and conditions of the Creative Commons Attribution (CC BY) license (https://creativecommons.org/licenses/by/4.0/).
Share and Cite
Wang, Y.; Han, S.; Zhang, Q.; Sun, J.; Cheng, Z.; Chen, A. Energy Monitoring and Analysis of a Residential House in China. Buildings 2024, 14, 2930. https://doi.org/10.3390/buildings14092930
Wang Y, Han S, Zhang Q, Sun J, Cheng Z, Chen A. Energy Monitoring and Analysis of a Residential House in China. Buildings. 2024; 14(9):2930. https://doi.org/10.3390/buildings14092930
Chicago/Turabian StyleWang, Yanzhi, Shaotong Han, Qiuqi Zhang, Jing Sun, Zhibao Cheng, and An Chen. 2024. "Energy Monitoring and Analysis of a Residential House in China" Buildings 14, no. 9: 2930. https://doi.org/10.3390/buildings14092930