Abstract
Assessing the fragility of intake towers using a single damage index does not allow for accurate evaluation of the potential for structural damage under seismic conditions. In this study, based on the probabilistic seismic demand analysis method, the effects of ground motion intensity on maximum displacement, local damage index, and global damage index are considered, and the seismic fragility of an intake tower structure is analyzed. First, 10 natural ground motion records were selected from the ground motion database (PEER) and 2 artificial seismic waves were synthesized. These seismic waves were amplitude-modulated for incremental dynamic analysis (IDA). The trends of the IDA curves were analyzed to divide the performance levels of the intake tower structure. Furthermore, a two-dimensional fragility curve for the intake tower structure was plotted in this study. The maximum displacement in the direction of parallel flow and the damage index were taken into account in the two-dimensional fragility curve. The results show that, under the designed seismic acceleration, the two-dimensional fragility curve for the intake tower structure was lower than the one-dimensional curve. This indicates that the seismic design based on the one-dimensional performance index was unstable. This provides a theoretical reference for seismic optimization design and the strengthening of intake towers. Therefore, it is recommended to use multidimensional fragility analysis to study the seismic performance of intake tower structures in seismic design.
1. Introduction
The seismic safety of intake towers—an important component of reservoir dams—is critical. Scholars have studied the damage of intake towers under seismic action more and more extensively. Zheng et al. [1] analyzed the response of the joint seismicity of an intake tower–reservoir water base boundary coupled under the spatial oblique incidence angle of an SV wave, and it was shown that the dynamic response and the degree of damage of the intake tower were larger, seriously affecting the safety and stability of the intake tower. Chen et al. [2] and Teymouri et al. [3] investigated the dynamic response of intake towers under near-field impulsive and non-impulsive events using a three-dimensional finite element model with non-linearity in reinforced concrete materials. The results showed that the damage to the intake tower was more serious for the near-field impulse event. Zhang et al. [4] investigated the seismic response of a slender intake tower, considering the lift chamber–intake tower–backfill concrete interaction through shaking table tests, and the results were tabulated to determine the disconnection between the tower as a whole and the backfill concrete. The lift chamber was severely deformed and eventually failed. A number of water tower structures have suffered some degree of damage from China’s earthquakes. In the 5.12 Wenchuan earthquake, the upper opening frame of an intake tower at the Shapai Hydropower Station was damaged and cracked. Additionally, the intake tower at the Zipingpu Hydropower Station was subjected to a strong seismic effect of more than 9 degrees, and the top structure of the tower was seriously damaged. In the 1976 Tangshan earthquake, the barrel-wall water tower located at the Tangshan Railway Station was severely cracked in many places. Therefore, it is necessary to evaluate the performance of intake towers under seismic action and take timely measures to ensure their seismic safety.
Seismic fragility is an effective measure for evaluating the seismic performance of structures, and it has been widely used to evaluate various hydraulic buildings. In the field of research on the seismic fragility of gravity dams, both Aniket et al. [5] and Ashna et al. [6] have plotted analytical brittleness curves for various brittle states of gravity dams using crack length and energy dissipation as damage indicators. Li et al. [7] conducted a fragility study of a typical high gravity dam using displacement and dissipation energy as performance metrics. Hariri-Ardebili et al. [8] proposed a method to quantify the structural performance level of gravity dams using the nonlinear dynamic finite element method and the concrete damage plasticity (CDP) model to calculate crack length, maximum displacement, and dissipated energy.
In the field of research on the seismic fragility of arch dams, Liang et al. [9] selected the sliding volume and sliding area ratio as the EDP and established seismic fragility curves based on the corresponding overall average IDA curves by adopting rules based on the sliding volume and sliding area ratio to identify different damage levels. Kadkhodayan et al. [10] used the IDA method to obtain the seismic fragility curves of thin high-arc dams based on their determined limit states using Sa, PGA, and PGV parameters as the IM and the overstressed area as the engineering demand parameter. Wang et al. [11] defined the limit state of arch dams based on their damage distribution and joint openings. Chen et al. [12] selected relative displacement and transverse seam opening as the damage indicators for arch dam fragility analysis and established the fragility curves of two kinds of damage by fitting the results of their incremental dynamic analysis.
In the field of research on the seismic fragility of concrete-face rockfill dams, Chen et al. [13] used crest subsidence ratio, demand capacity ratio, and cumulative overstress duration as evaluation indices and plotted the fragility curves of each limit state. Zhou et al. [14] used the finite element method for a numerical simulation to obtain the corresponding damage measurements. Vertical displacements, plastic shear strains, and panel damage indices were considered in their study, and the fragility curves were calculated for different limit states. Muhammad et al. [15] examined the optimal intensity measurement considering the settlement ratio as the EDP for concrete-face rockfill dams in probabilistic seismic demand models.
IDA has been utilized as a method to assess the seismic demand and capacity of structures under earthquake excitations in recent years. Additionally, scholars have been conducting increasingly in-depth research on IDA methods. Adaptive incremental dynamic analysis (AIDA) was proposed by Lin and Baker [16] as a new method for record selection. Although the use of the AIDA method reduces computational effort and saves time compared to performing IDA, the consequence of this record selection method is the discontinuity of AIDA curves due to the use of different records at some, but not all, intensity levels. Mohammad et al. [17] proposed an approach called piecewise incremental dynamic analysis (PIDA) to select a suitable set of ground motions at each intensity level by considering the vector of intensity measures (IMs) correlated with an engineering demand parameter (EDP) and associated weight vectors. PIDA results can present a more reliable prediction of the seismic performance of buildings due to the higher accuracy of this method in selecting ground motions compared to AIDA. However, compared to AIDA and PIDA, traditional IDA results are the most accurate. Song et al. [18] used the double incremental dynamic analysis (D-IDA) method to establish the main aftershock fragility of surfaces of RC structures, but since there is only one IM in this study, D-IDA could not be applied.
Scholars have conducted fruitful research on the seismic fragility of structures, but only a single engineering demand parameter is typically considered. In order to be able to more rationally assess the possibility of structural damage under seismic action, multidimensional fragility has been increasingly proposed. Liu et al. [19] selected the maximum interstory drift ratio (MIDR) and peak floor acceleration (PFA) as 2D performance metrics to study the multidimensional fragility of RC frames. Jia et al. [20,21] also analyzed the fragility of RC frame–shear wall structures using MIDR and PFA as the engineering demand parameters, reflecting the structural and non-structural performance.
Most of the multidimensional fragility studies conducted by the above scholars selected interstory displacement and maximum acceleration as the two-dimensional performance indices, but intake tower structures will produce large displacements and more serious damage under the action of strong earthquakes. Therefore, in the study of the seismic performance of an intake tower structure, the maximum displacement at the top of the tower must be considered, in addition to the maximum displacement of the tower. A variety of damage indices also need to be considered in order to quantitatively characterize the fragility of the tower structure. In this study, based on the multidimensional probabilistic seismic demand analysis method, the CDP model was used to carry out an incremental dynamic analysis of an intake tower structure. The structural performance level of the intake tower was quantified by analyzing the slope mutation points of the IDA curve of the intake tower, selecting the displacement and damage indices as the engineering demand parameters, carrying out seismic fragility analysis of the two-dimensional performance limit state, and comparing this with the one-dimensional seismic fragility of the intake tower. This study compares the damage of each part of a tower under different performance levels, focusing on the parts that are prone to damage, thus providing a theoretical reference for optimal seismic design and the seismic reinforcement of intake towers.
2. Finite Element Modeling
2.1. Finite Element Model
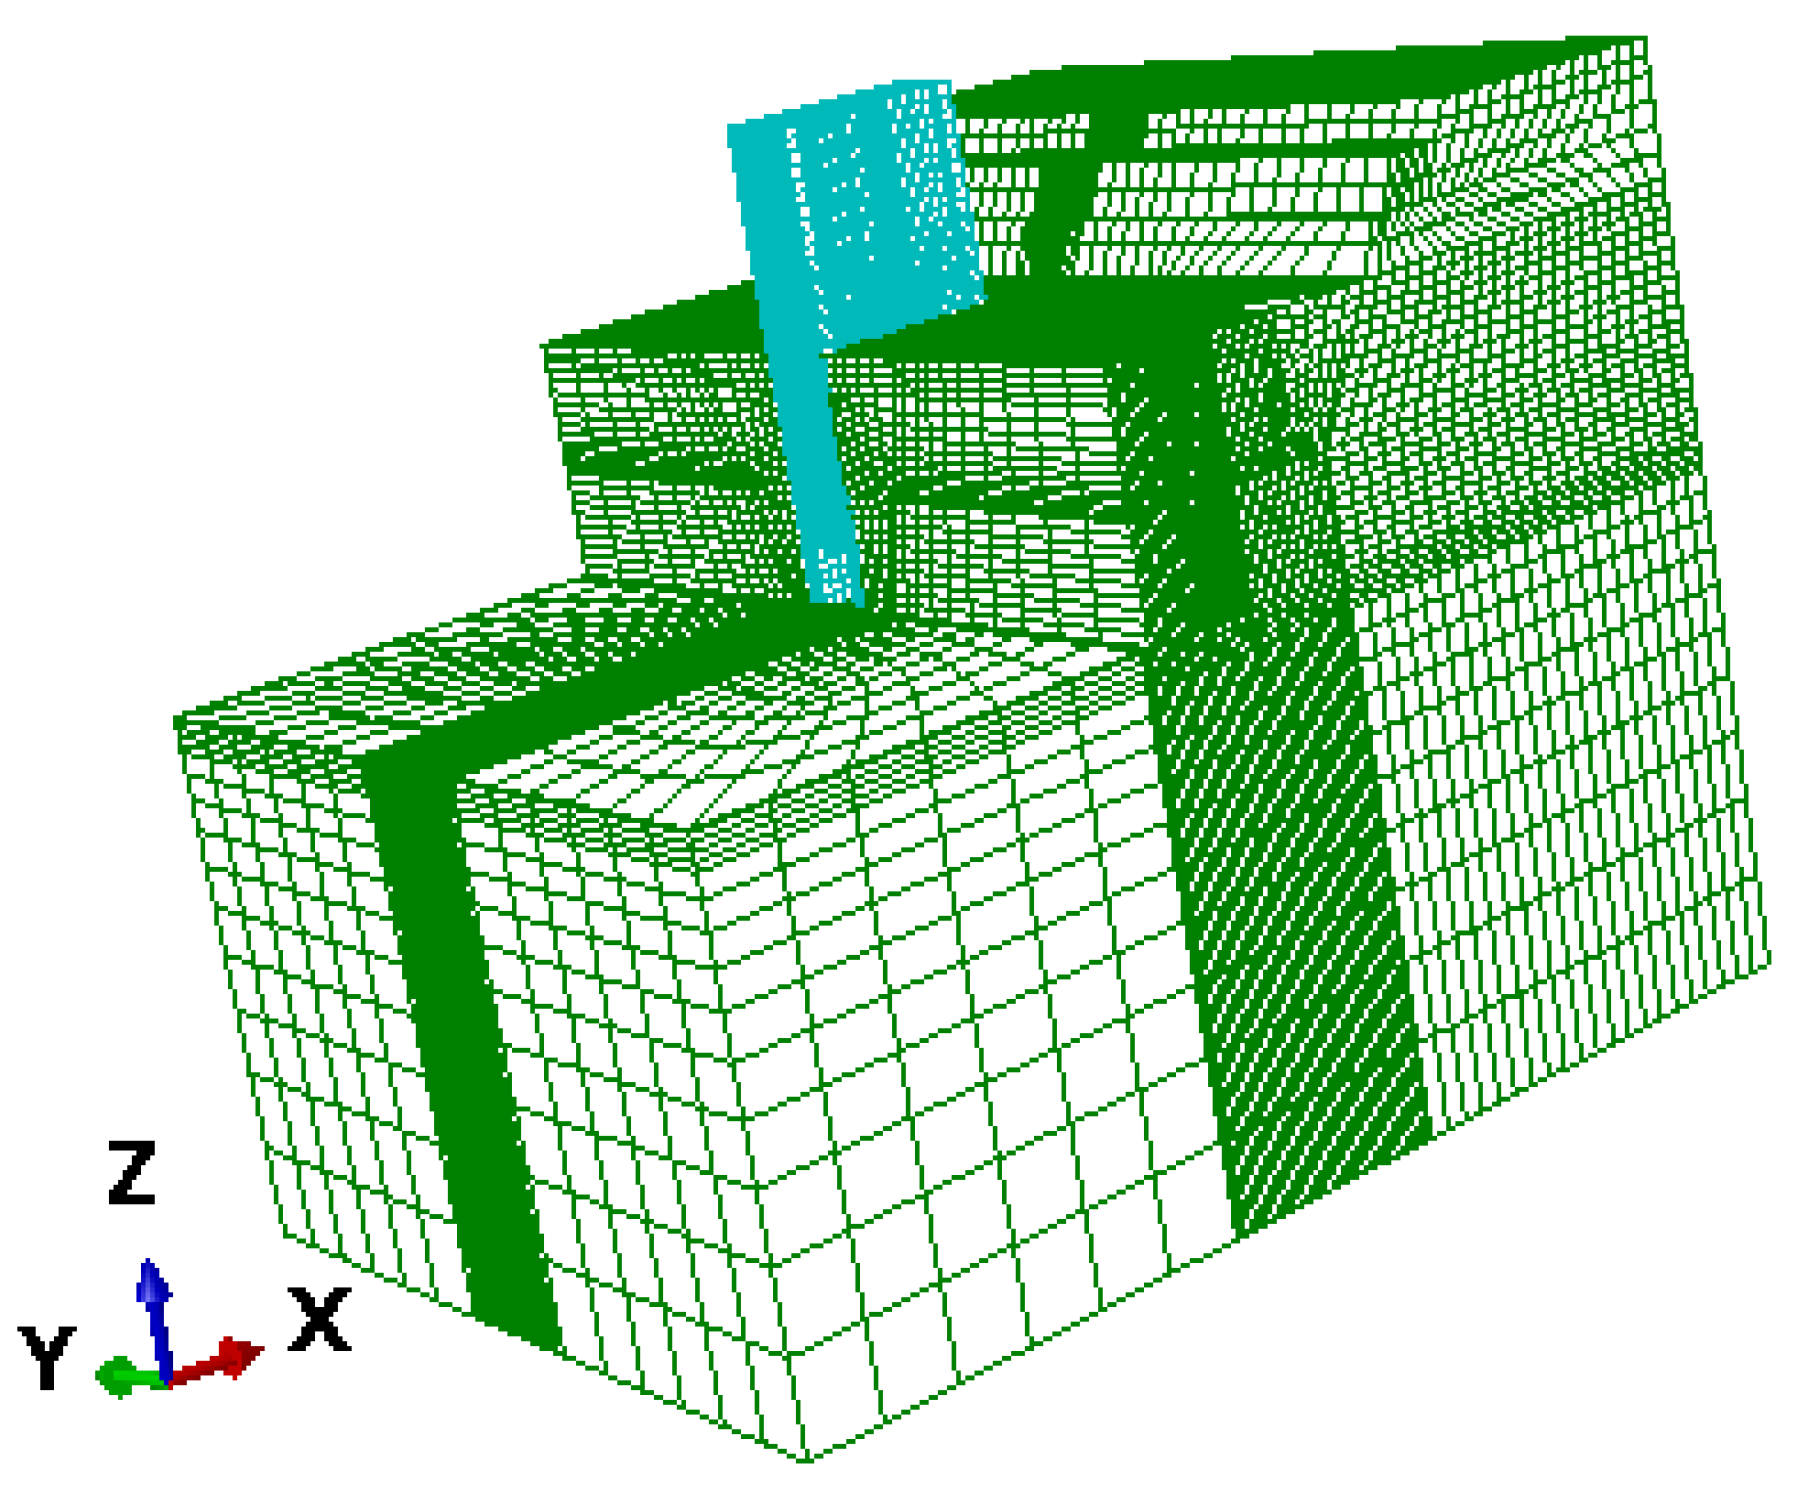
In this study, ABAQUS was used for 3D finite element modeling of the intake tower and foundation using a spatial right-angled coordinate system, where the X-axis is the parallel flow direction (the positive direction points downstream), the Y-axis is the perpendicular flow direction (the positive direction points to the left), and the Z-axis is the vertical direction (the positive direction points to the top of the tower). For the intake tower model, the foundation depth, upstream and downstream sides, and left and right sides are taken as 1 times the tower height; the tower body, perimeter foundation, and backfill concrete were discretized using hexahedral units; and the tie beams were discretized using beam units. For the boundary conditions, the front, back, and left and right boundaries of the foundation were normally constrained, and the bottom boundary was fully constrained, based on which the influence of the truncated boundary was simulated. The ground vibration input method was homogeneous input with a massless foundation. The loads considered in the calculation were the self-weight of the dam body, upstream and downstream hydrostatic pressures, lifting pressure, dynamic water pressure, and seismic effects. For dynamic water pressure loads, the additional mass was calculated, and the mass elements were distributed one layer at a time on the inner and outer surfaces of the tower, according to the elevation, to simulate the dynamic water pressure on the tower from the inner and outer water bodies. The internal and external water pressures of the intake tower structure were treated with additional mass, and the dynamic water pressure was calculated using the additional mass calculation method given in the Code for Seismic Design of Hydropower Engineering Hydraulic Buildings [22]. According to the site conditions where the water intake tower is located and the requirements of the code, a series of appropriate seismic waves was selected and, after amplitude modulation, incremental dynamic time-range analysis was performed on the water intake tower structure.
A water intake tower was used as an example in this study, and its three-dimensional overall finite element model is shown in Figure 1, with a total of 129,749 cells and 128,659 nodes after meshing. Figure 2 shows the finite element model and half of the finite element model of the tower body of the intake tower.
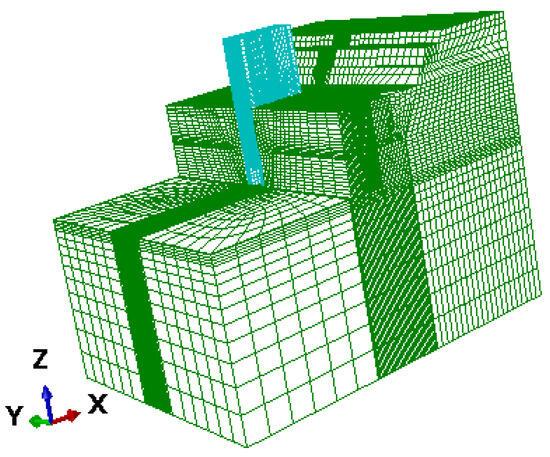
Figure 1.
The overall finite element meshing of the intake tower.
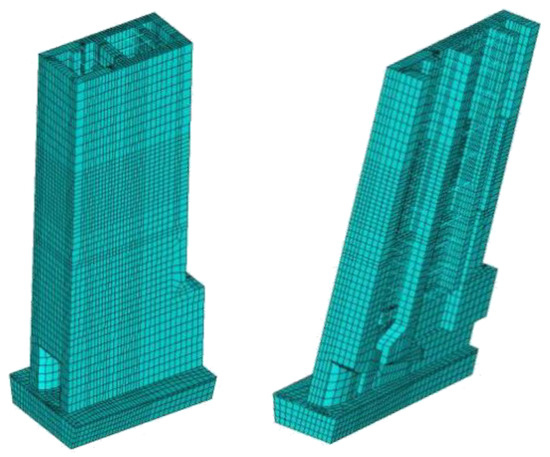
Figure 2.
Finite element meshing of intake tower body.
2.2. Model Parameters
The interactions among the tower body, the foundation, and the input of ground vibration were simulated with uniform input from the bottom of the massless foundation. The CDP model is able to simulate related mechanical phenomena of concrete material, such as tensile rupture and compressive crushing, and is usually applied in the implicit solution and explicit dynamic analysis of model structures.
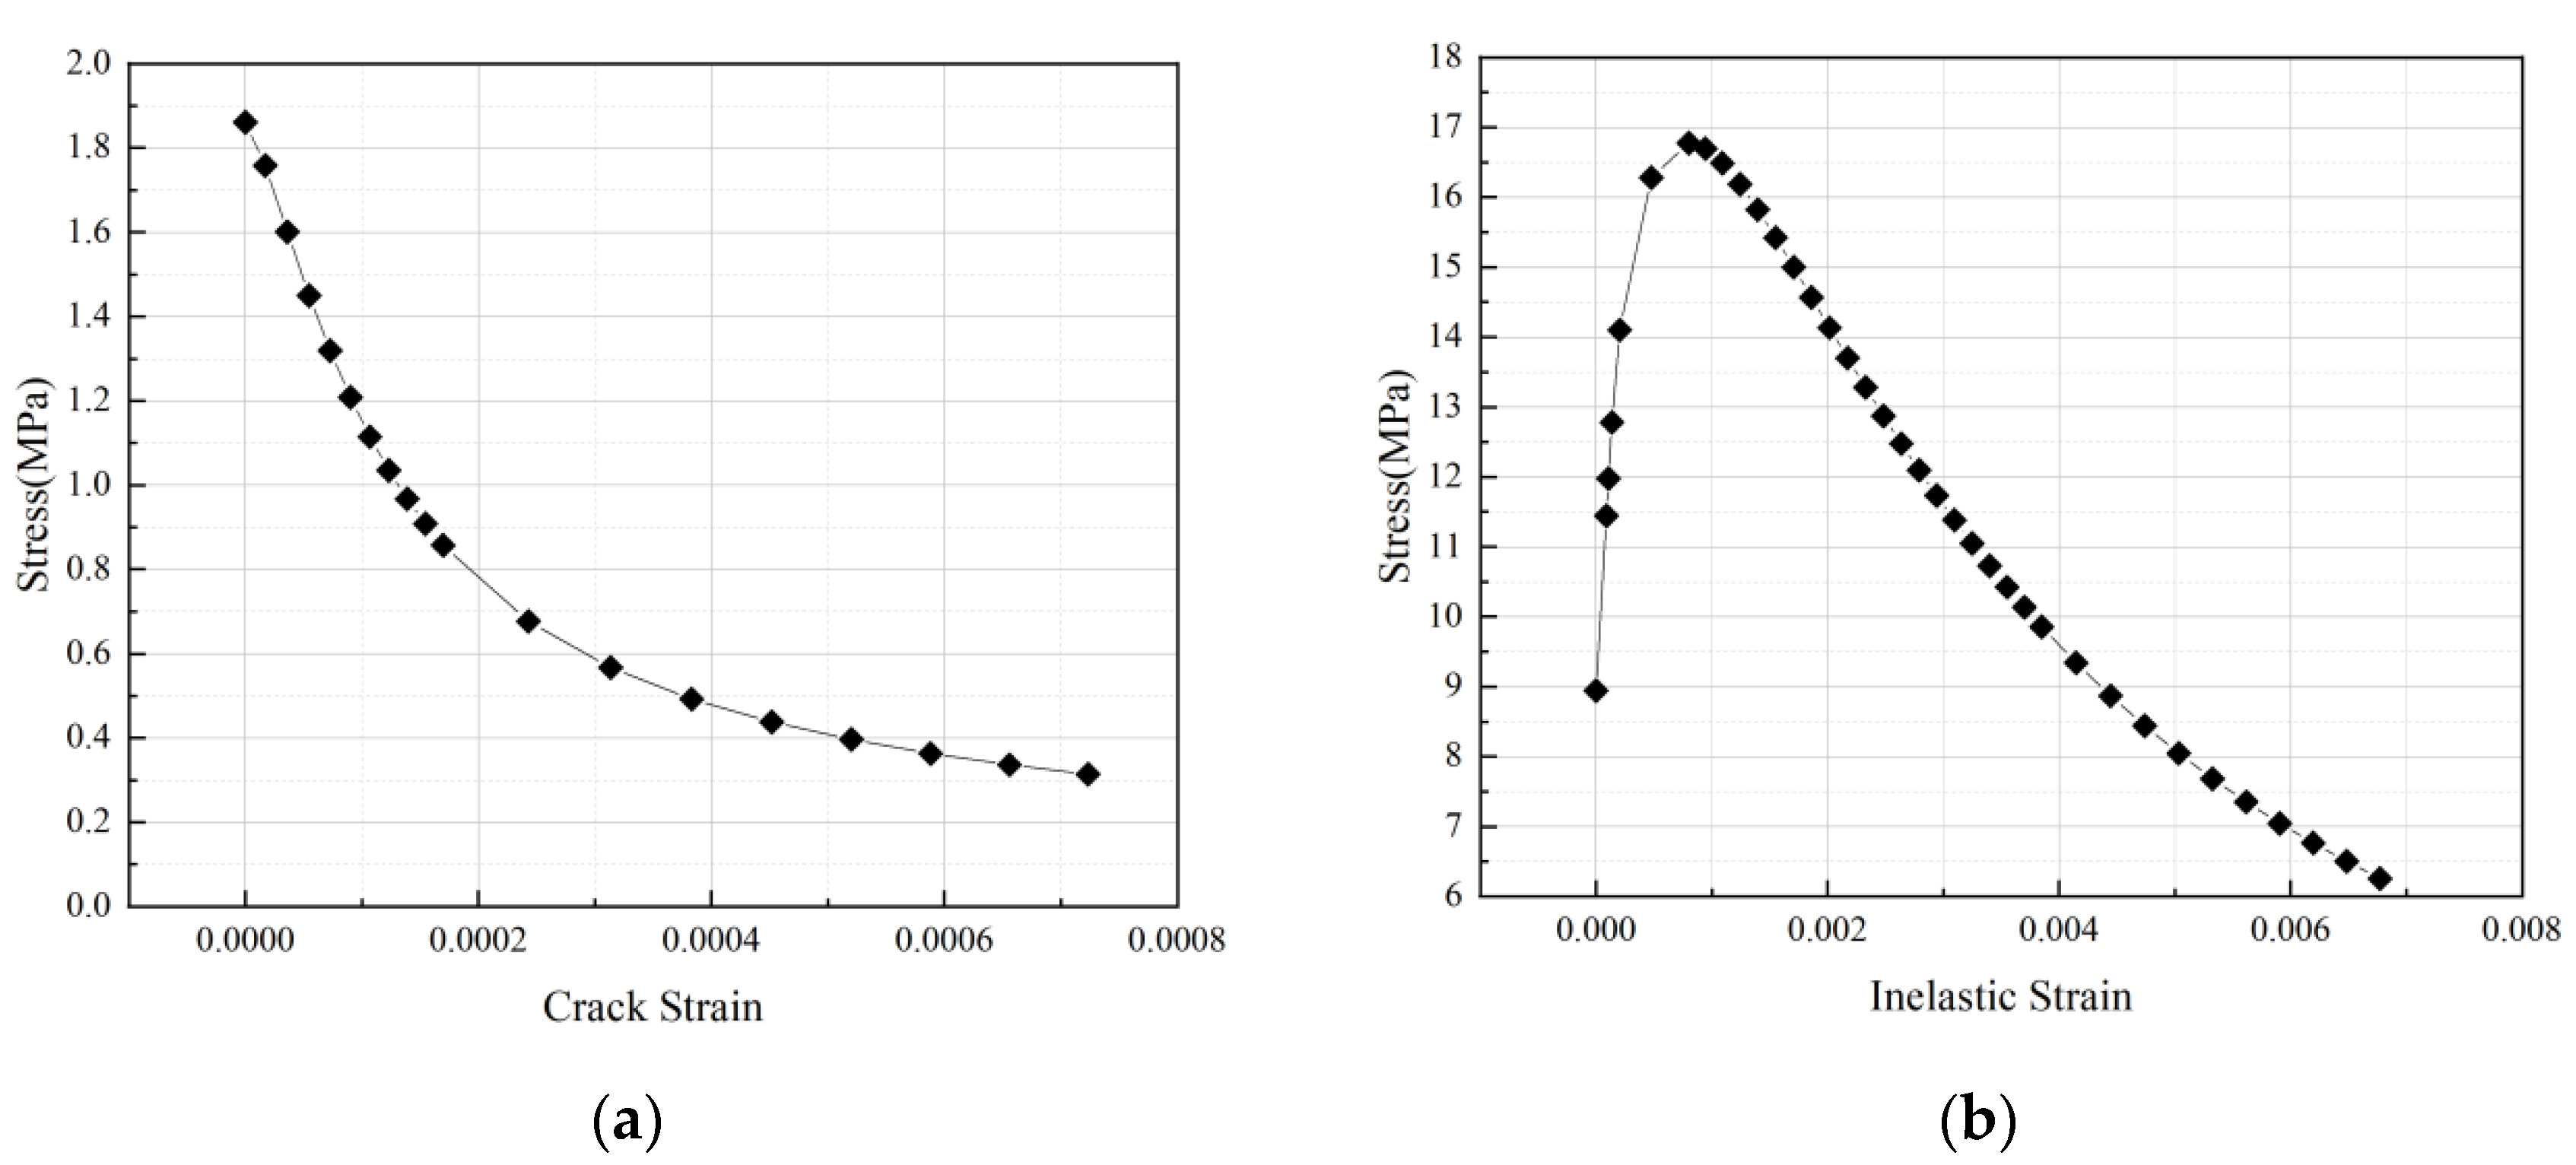
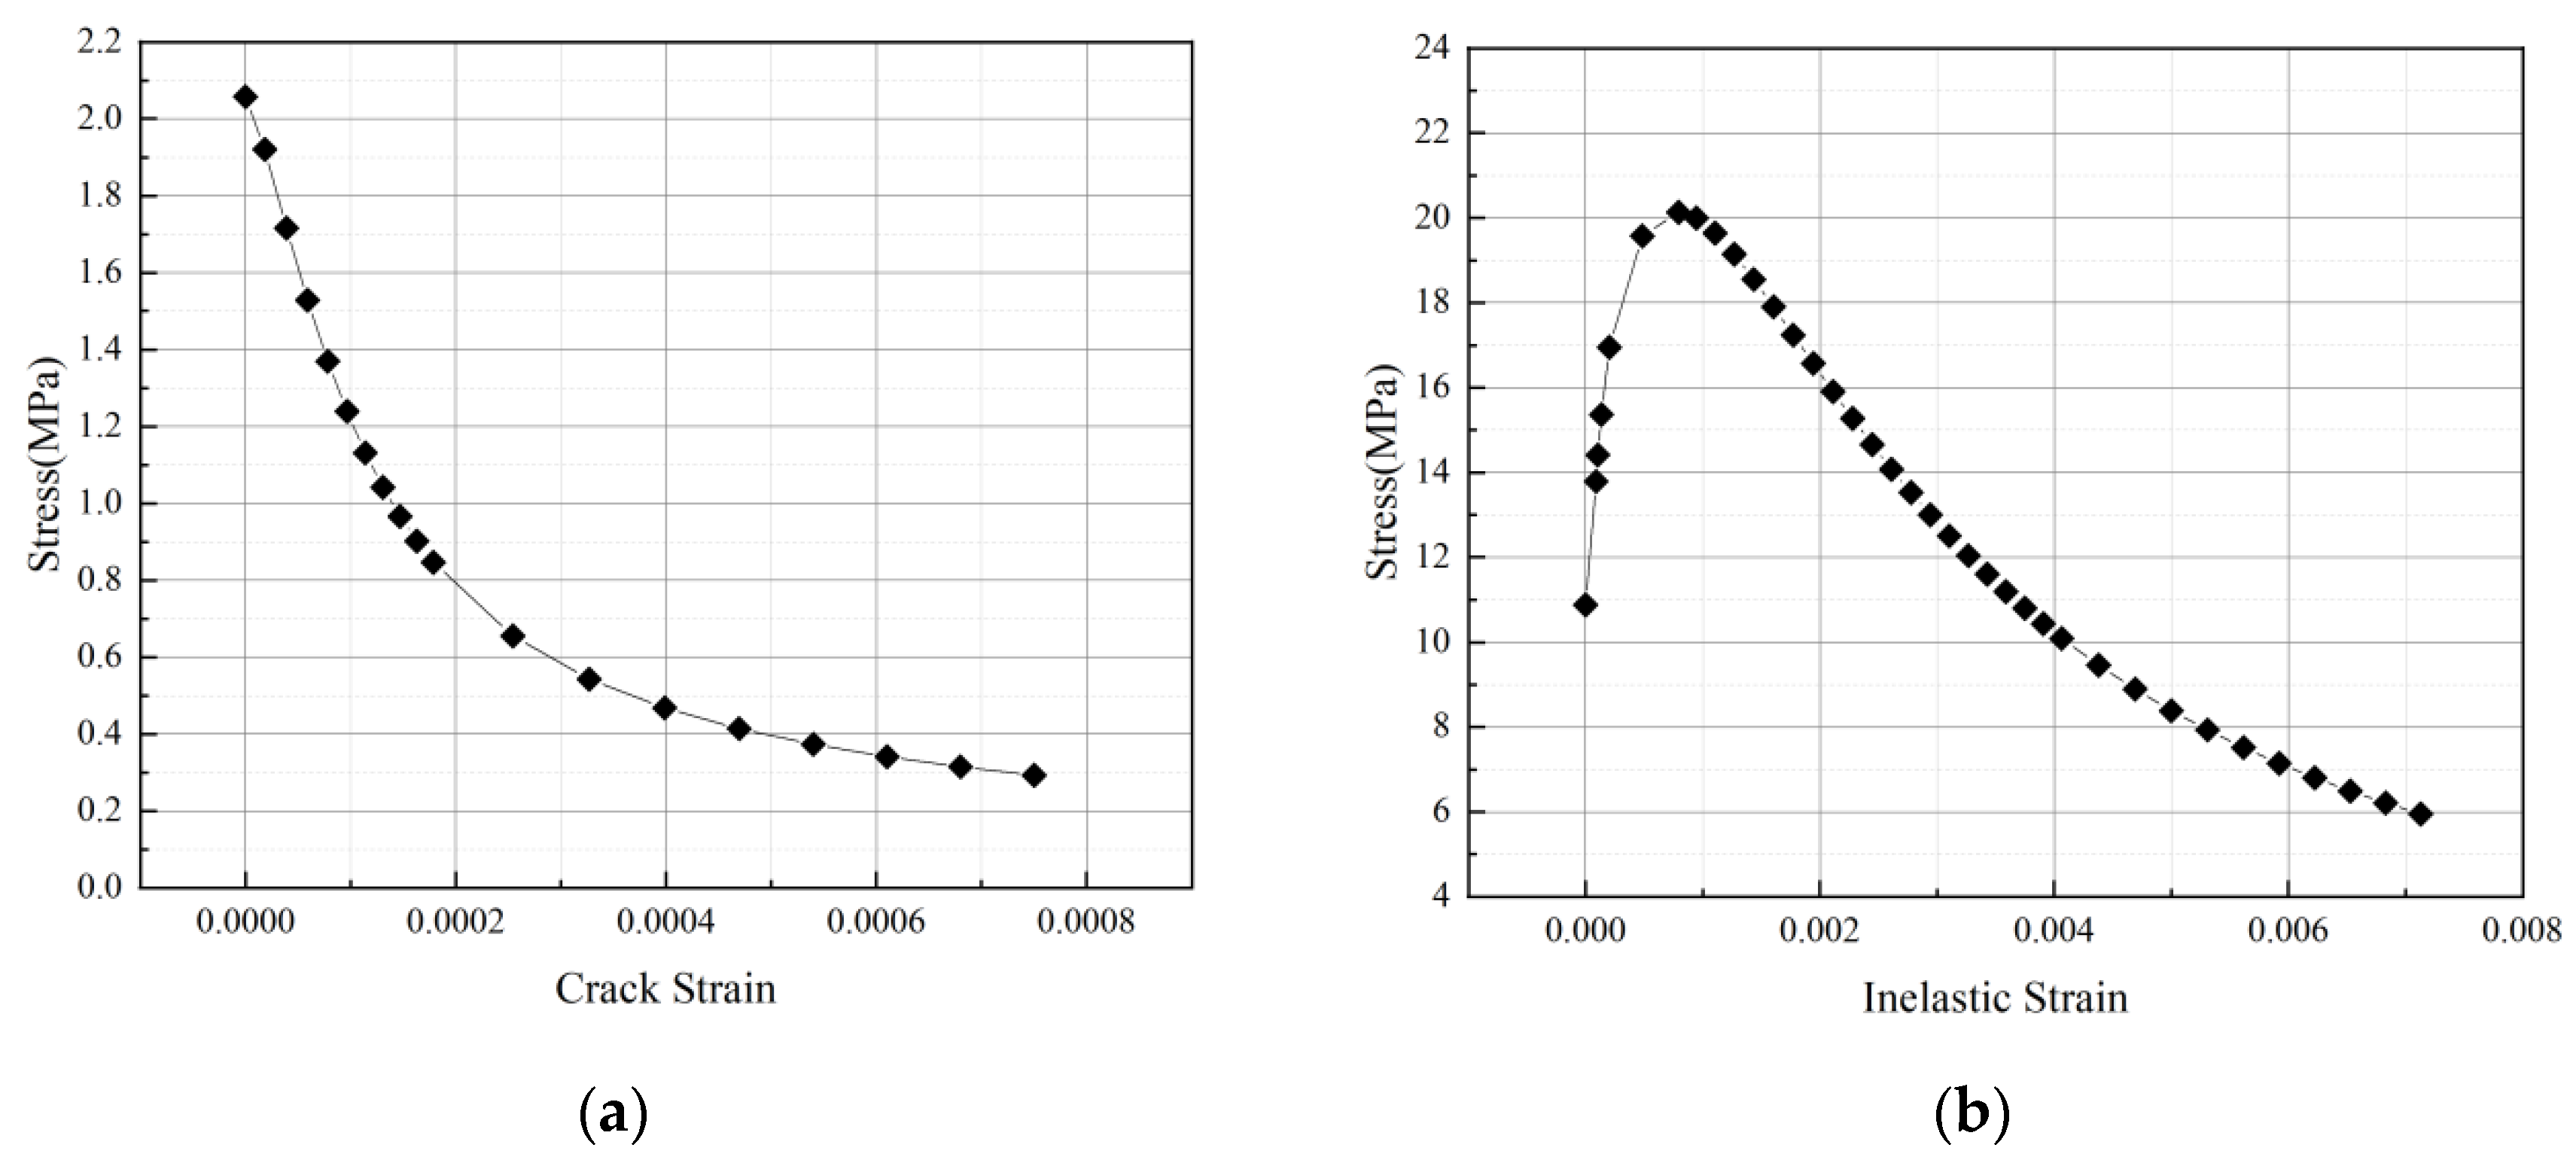
In this study, the CDP model in ABAQUS was used to consider the material nonlinearity of the tower and the backfill concrete of the intake tower structure. The uniaxial stress–strain relationship curve of the concrete was calculated according to the Code for Design of Concrete Structures, and the stress–inelastic strain relationship of the concrete material was obtained. Figure 3 shows the tensile and compressive damage evolution relationship of C25 concrete, and Figure 4 shows the tensile and compressive damage evolution relationship of C30 concrete. The parameters of the mechanical properties of the tower, backfill, and bedrock materials are shown in Table 1.

Figure 3.
Damage evolution relationship of C25 concrete. (a) Tensile stress constitutive relationship; (b) compressive stress constitutive relationship.
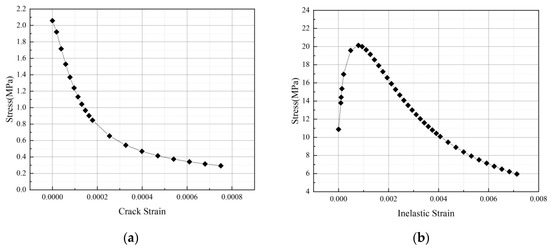
Figure 4.
Damage evolution relationship of C30 concrete. (a) Tensile stress constitutive relationship; (b) compressive stress constitutive relationship.

Table 1.
Concrete material parameters of backfill and tunnel lining.
3. Nonlinear Time-Course Analysis
3.1. Damage Index
For concrete structures, damage factors and damage ranges can be used to measure the degree of damage under seismic action; therefore, in the nonlinear time-range analysis of the intake tower structure, the local damage index was used to measure the degree of damage it sustained. The local damage index can be obtained by weighting the damage factors at the same elevation, as shown in Equation (1); which, in turn, assesses the extent of damage in a region.
where is the local damage index of the damage region at a certain elevation, is the damage factor of the first unit in the damage region, is the area of the first unit in the region, and is the weighting coefficient of the damage region at a certain elevation, which is related to whether or not the damage region of the structure meets the water surface, the degree of embeddedness of the cracks, the extent of crack propagation, and other factors.
The weighting factor can be expressed as follows:
where is the influence coefficient of the crack initiation location in the damage zone, taking 1.0 for the waterfront and 0.8 for other cases; and is the influence coefficient of the embeddedness degree of the cracks in the damage zone, taking the ratio of the length of the cracks to the length of the path where they are located.
To analyze the scope and extent of damage at the interface between the tower and the backfill of the intake tower structure, a weighting factor method was used to define an overall damage index to describe the damage of the intake tower structure as a whole. As the damage is directly proportional to the degree of energy dissipation, Park-Ang proposed defining the overall damage index using energy as the weighting coefficient of the local damage index:
where is the overall damage index of the structure, is the local damage index of the structure, is the weighting factor of the structure, is the energy dissipation of the structure under seismic action, and is the total energy dissipation of the structure.
Due to the uncertainty of the weighting coefficient method, scholars have also proposed the method of measuring the overall damage of the structure by the stiffness ratio. The most typical approach is the damage model proposed by Ghobarah with the stiffness degradation as the criterion:
where is the horizontal force at the base when not exposed to seismic action and is the horizontal force at the base of the structure after exposure to seismic action.
3.2. Modal Analysis
The self-oscillation frequency of a structure refers to the frequency when there is no water storage after construction. Intake tower structures need to be analyzed in dry and wet modes due to their unique force characteristics. The frequency magnitudes are shown in Table 2, and Figure 5 displays the variation in vibration modes in the wet mode.
Table 2.
Natural vibration frequencies of intake tower structure.
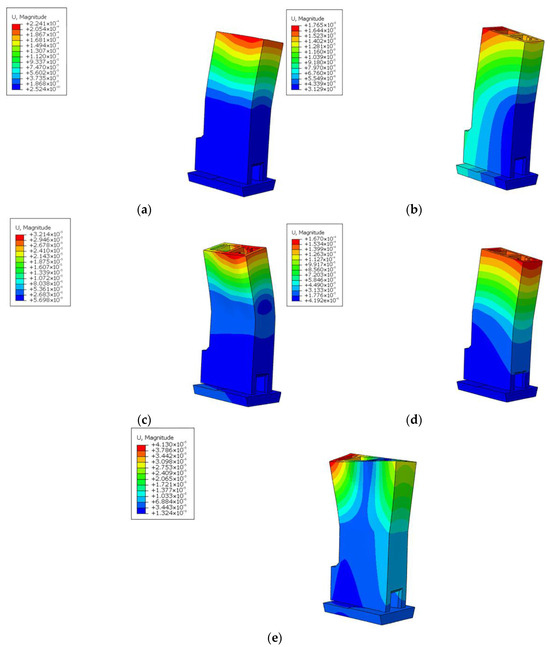
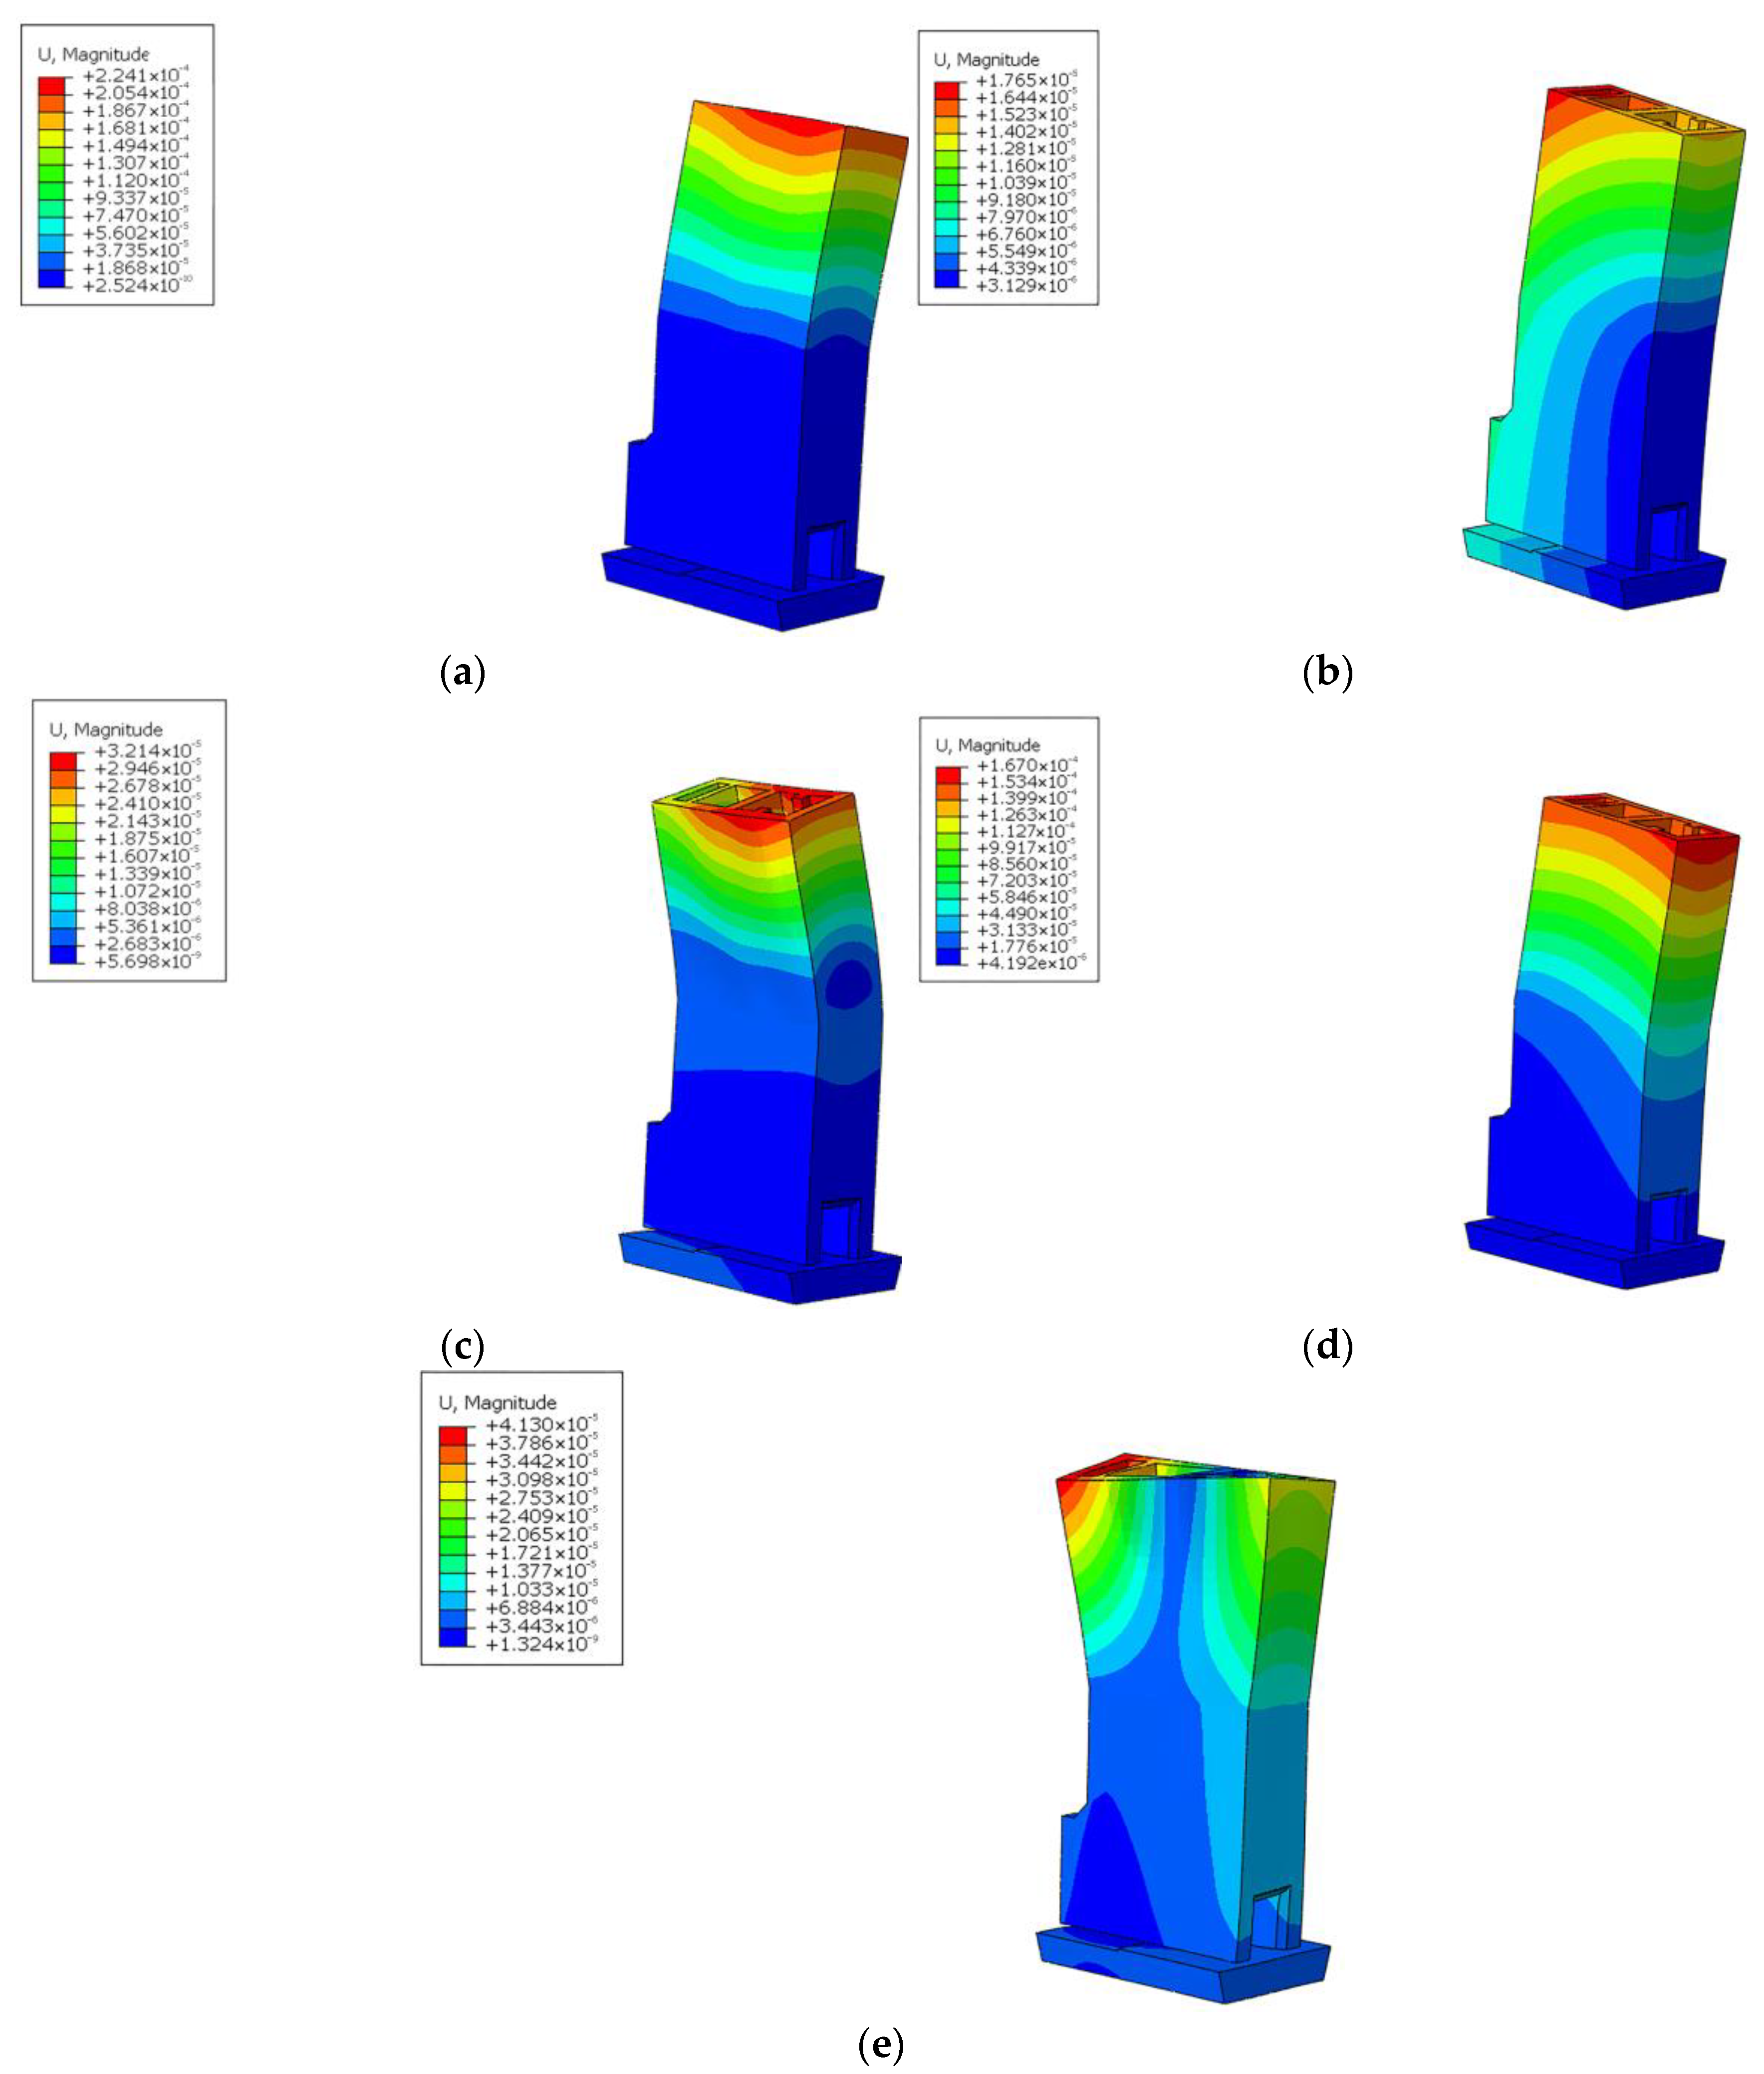
Figure 5.
The first to fifth modes of vibration of the intake tower structure. (a) First mode of vibration, (b) second mode of vibration, (c) third mode of vibration, (d) fourth mode of vibration, (e) fifth mode of vibration.
A comparative analysis of the wet and dry frequencies of the intake tower structure revealed that the wet frequency was lower than the dry frequency. This was due to the effect of the additional mass, which was relatively small. In the wet modal analysis, the inclusion of additional mass increased the model mass and decreased the frequency when the stiffness was constant.
3.3. Change Laws
- (1)
- Stress change law
In the study of the stress change law of the water intake tower structure, PGA values of 0.1–0.3 g were selected to carry out the nonlinear time-course analysis. Due to limited space, Table 3 only lists the moment and location where the stress maximum of the water intake tower structure appeared when the PGA was at 0.3 g. As can be seen in Table 3, when the peak acceleration of ground shaking reached 0.3 g, the intake tower structure started to show local irreversible plastic damage.
Table 3.
Time information table of intake tower structure and tower body stress maximum value.
- (2)
- Displacement change law
In the study of the displacement change rule of the water intake tower structure, the structural displacement response under a ground vibration peak acceleration of 0.3 g was taken as the focus to explore the change rule of ground vibration.
The magnitude and distribution of the maximum displacements of the critical points at the top of the tower are close to each other in the parallel flow direction, the perpendicular flow direction, and the vertical direction, and produce the largest permanent deformation of up to 3.0 cm. The perpendicular water flow direction and the permanent deformation produced by the vertical direction are relatively small. The horizontal displacement of the water intake tower structure is slightly smaller than the vertical direction of displacement. The maximum absolute displacement in the perpendicular direction appears 3 s later than that in the parallel direction, and the maximum absolute displacement in the parallel direction appears at the same time as that in the vertical direction. From a comprehensive point of view, the tower structure has a relatively large permanent displacement in the parallel direction. Therefore, in this study, we selected the maximum displacement of the top of the tower in the parallel direction as the engineering demand parameter.
- (3)
- Damage change law
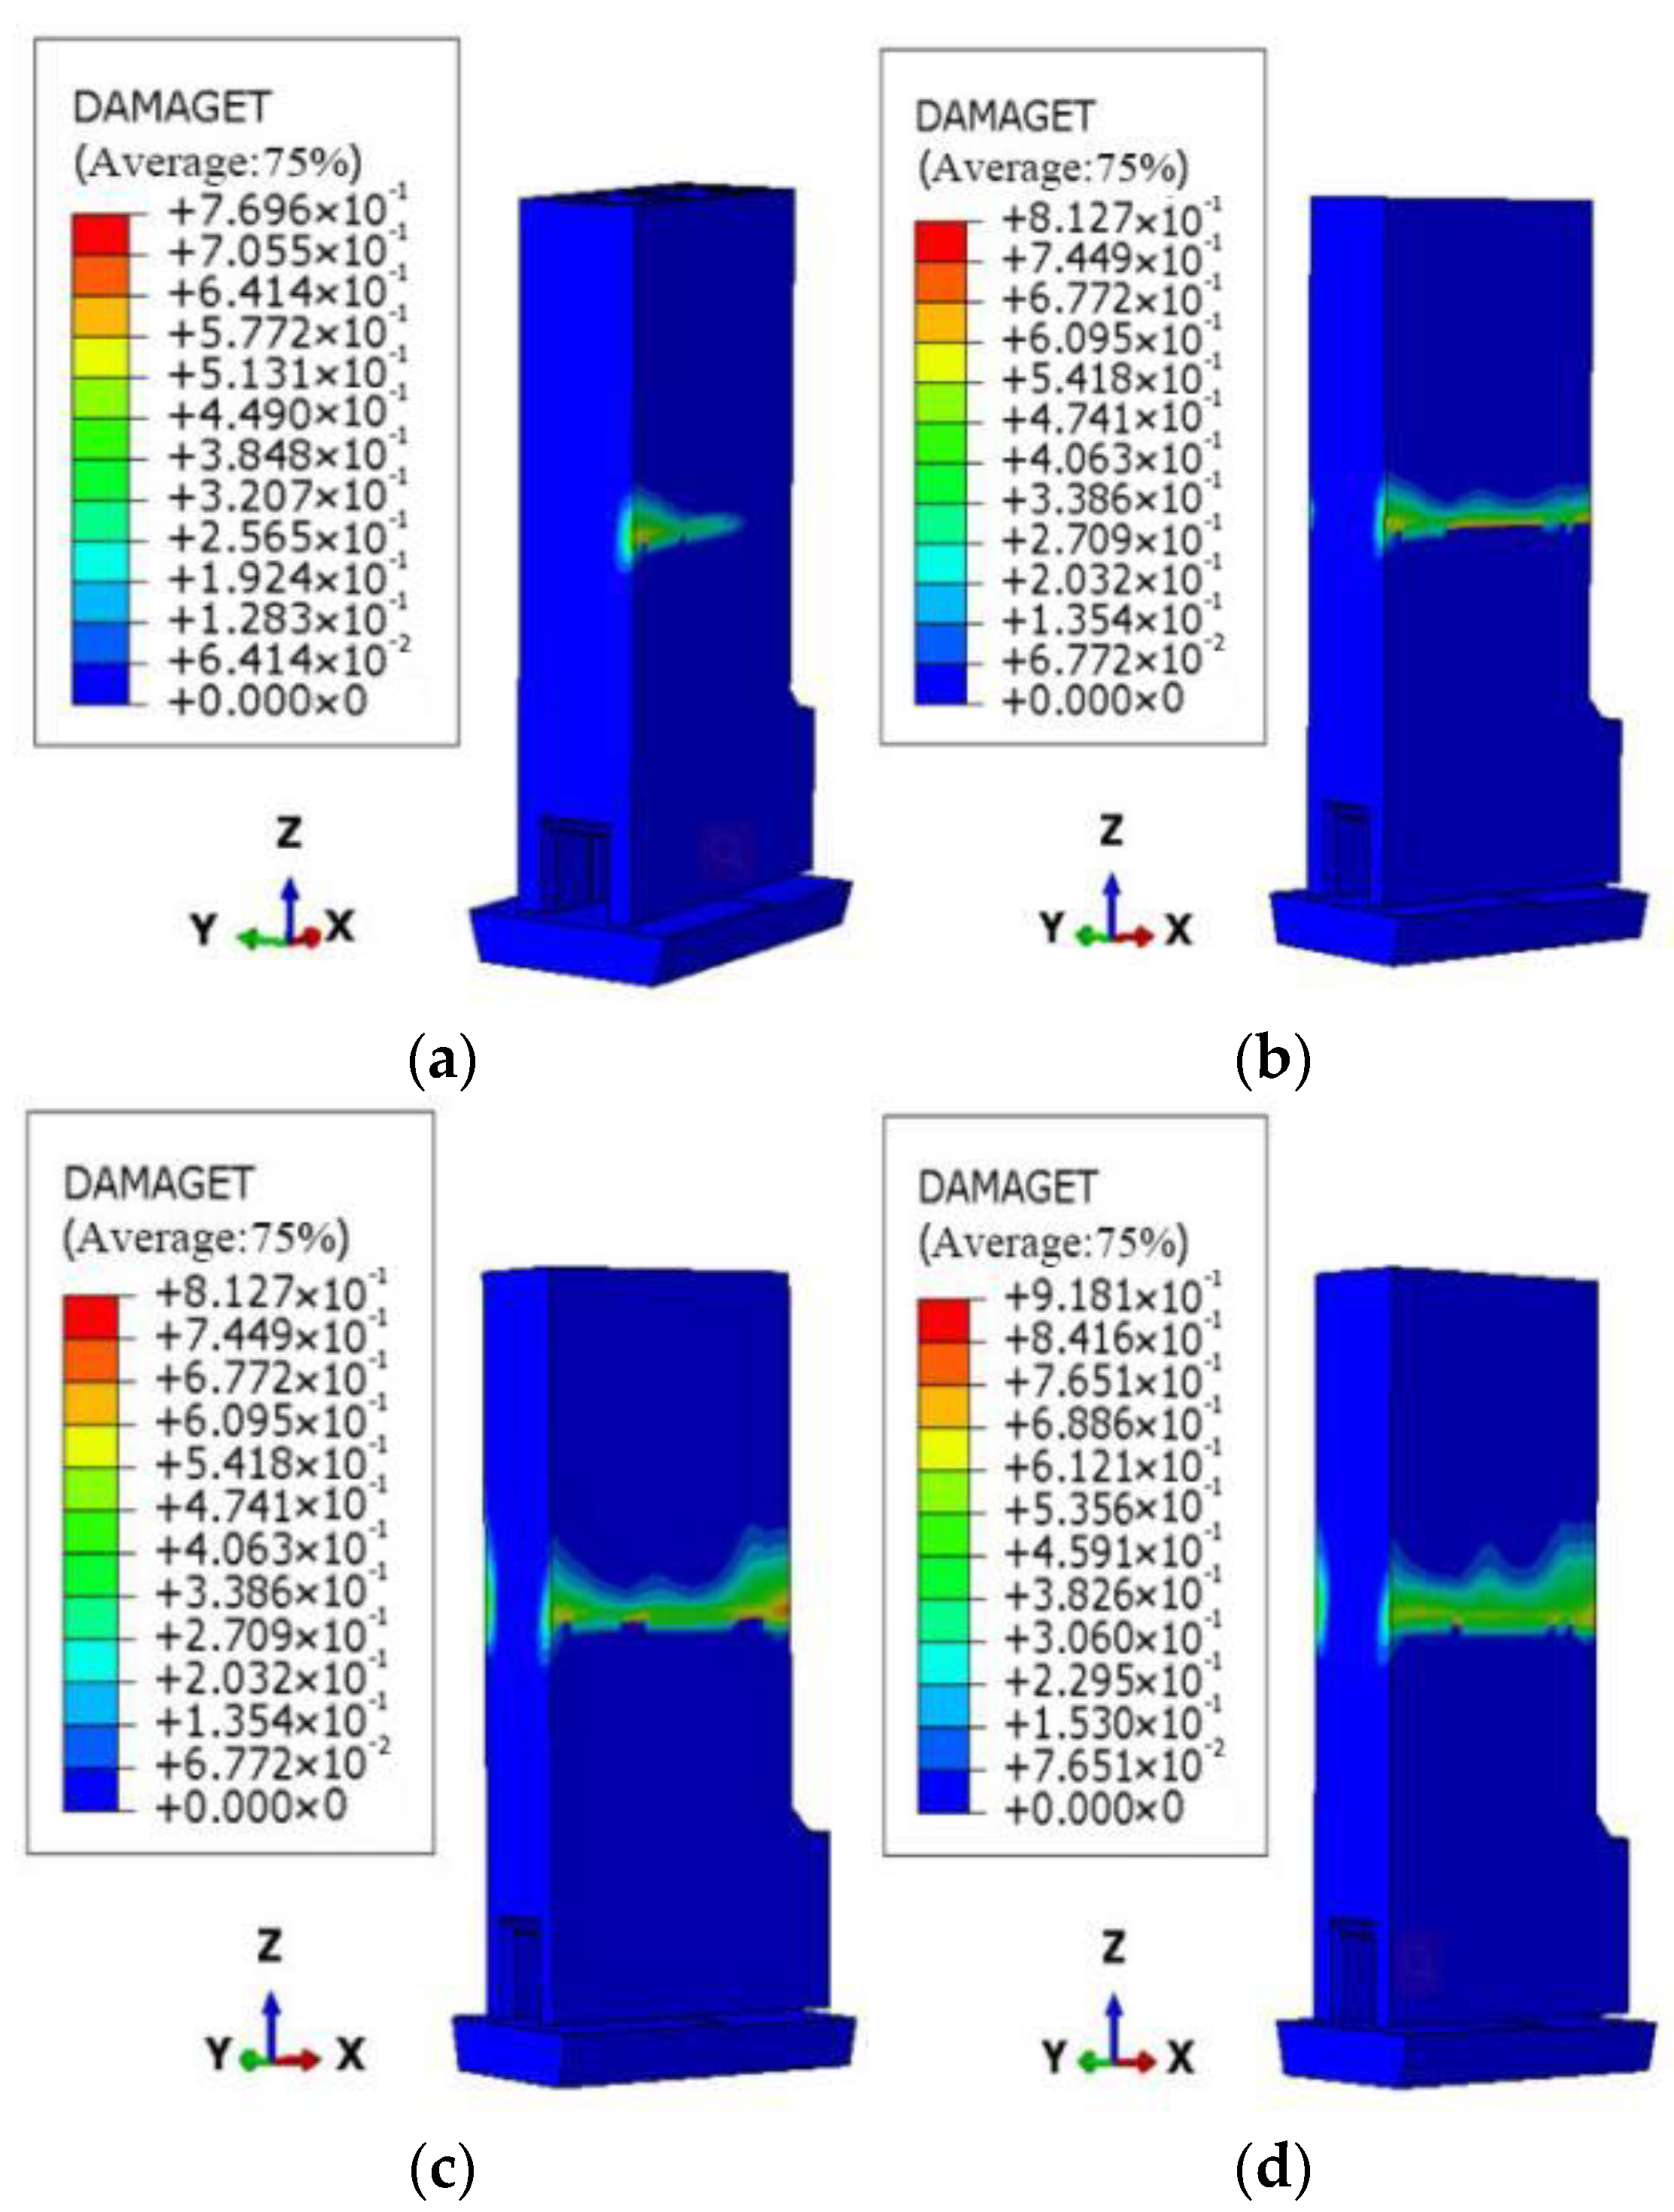
Figure 6 presents the tensile damage evolution pattern of the intake tower structure under dynamic action. At t = 2.4 s, tensile damage occurred in the upstream right-side and downstream left-side parts of the interface between the body and the backfill of the intake tower structure. When the seismic input was 10.0 s, the tensile damage factor reached a peak value of 0.92. The damage mainly occurred on both sides of the tower body and at the interface between the backfill concrete and the tower body behind the tower, extending upward. Considering the whole tower, tensile damage was only produced near the interface of the tower and the backfill. This area was also where stress concentration occurred, according to the finite element calculation.

Figure 6.
Tensile damage evolution process of the intake tower. (a) t = 2.4 s, (b) t = 2.8, (c) t = 7.8 s, (d) t = 10.0 s.
4. IDA Analysis
4.1. Ground Vibration Selection
Existing studies have shown [23] that, for the incremental dynamic analysis method, 10 to 20 ground-shaking events are sufficient to assess the effect of ground-shaking uncertainty on structural fragility. The ground-shaking parameters of the area where the project was located were queried via the “China Ground Shaking Parameter Zoning Map”, and the target response spectra were obtained according to specifications. In this study, 40 seismic waves equivalent to Class II sites were selected from the database of the Pacific Earthquake Research Center (PEER) to simulate the uncertainty of ground motion. Finally, from the 40 seismic waves, 10 seismic waves with magnitudes in the range of 5–7.5 and similar shapes to the target response spectra were selected. Two artificially synthesized seismic waves were obtained using seismic wave synthesis software to calculate seismic waves close to the target response spectra, synthesizing them through the random pulsation method, the natural regression method, and the triangular magnitude method, and finally making them match with the target response spectrum through continuous corrections and iterations. The PGAs of the 12 ground-shaking events were amplitude-modulated to 0.1–1.0 g, and the amplitude modulation step was set as 0.1. The selected seismic wave mean spectra of all the ground shocks fit well with the target spectra, as shown in Figure 7. The seismic waves selected in this study are listed in Table 4.
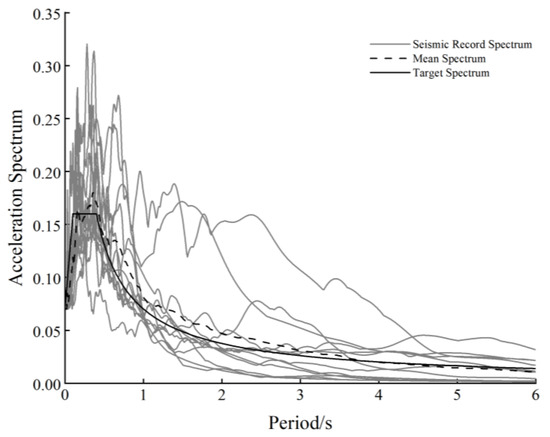
Figure 7.
Seismic wave response spectrum.
Table 4.
Seismic wave information table.
4.2. Multidimensional Probabilistic Seismic Demand Analysis
The probability of structural failure based on multidimensional performance indicators can be expressed as follows [24]:
where is the structural response parameter or engineering demand parameter and is the performance limit state of the structure; different performance limit states have different values.
According to Cornell et al. [25], the probabilistic seismic demand model conforms to the lognormal distribution, which can be expressed by Equation (7):
where is the logarithmic mean of D and is the log standard deviation of D.
Structural randomness has little effect on the results of fragility analysis when the randomness of ground shaking is considered. Capacity analysis is usually considered to be deterministic when structural randomness is not considered [26] and when the cumulative probability of reaching or exceeding a limit state is as follows:
Let and , representing the mean and standard deviation of the ground vibration IM, respectively.
In the two-dimensional probabilistic seismic demand analysis, it was assumed that the performance levels of the two engineering demand parameters were fixed values; therefore, the exceedance probability in the two-dimensional fragility analysis of the intake tower structure can be expressed as follows:
4.3. Quantification of Performance Levels
According to the “Classification of earthquake damage of buildings (structures)” (GB/T 24335-2009) [27] and the “China seismic intensity table” (GB/T 17742-2020) [28], the damage to water intake tower structures under seismic action can be categorized into five levels: basic intact, slight damage, moderate damage, severe damage, and destruction. The useability of the structure under each of the above standards is shown in Table 5.
Table 5.
Seismic damage classification of intake tower structure.
4.3.1. Quantification of the Performance Level of the Maximum Displacement Damage Index at the Top of the Tower
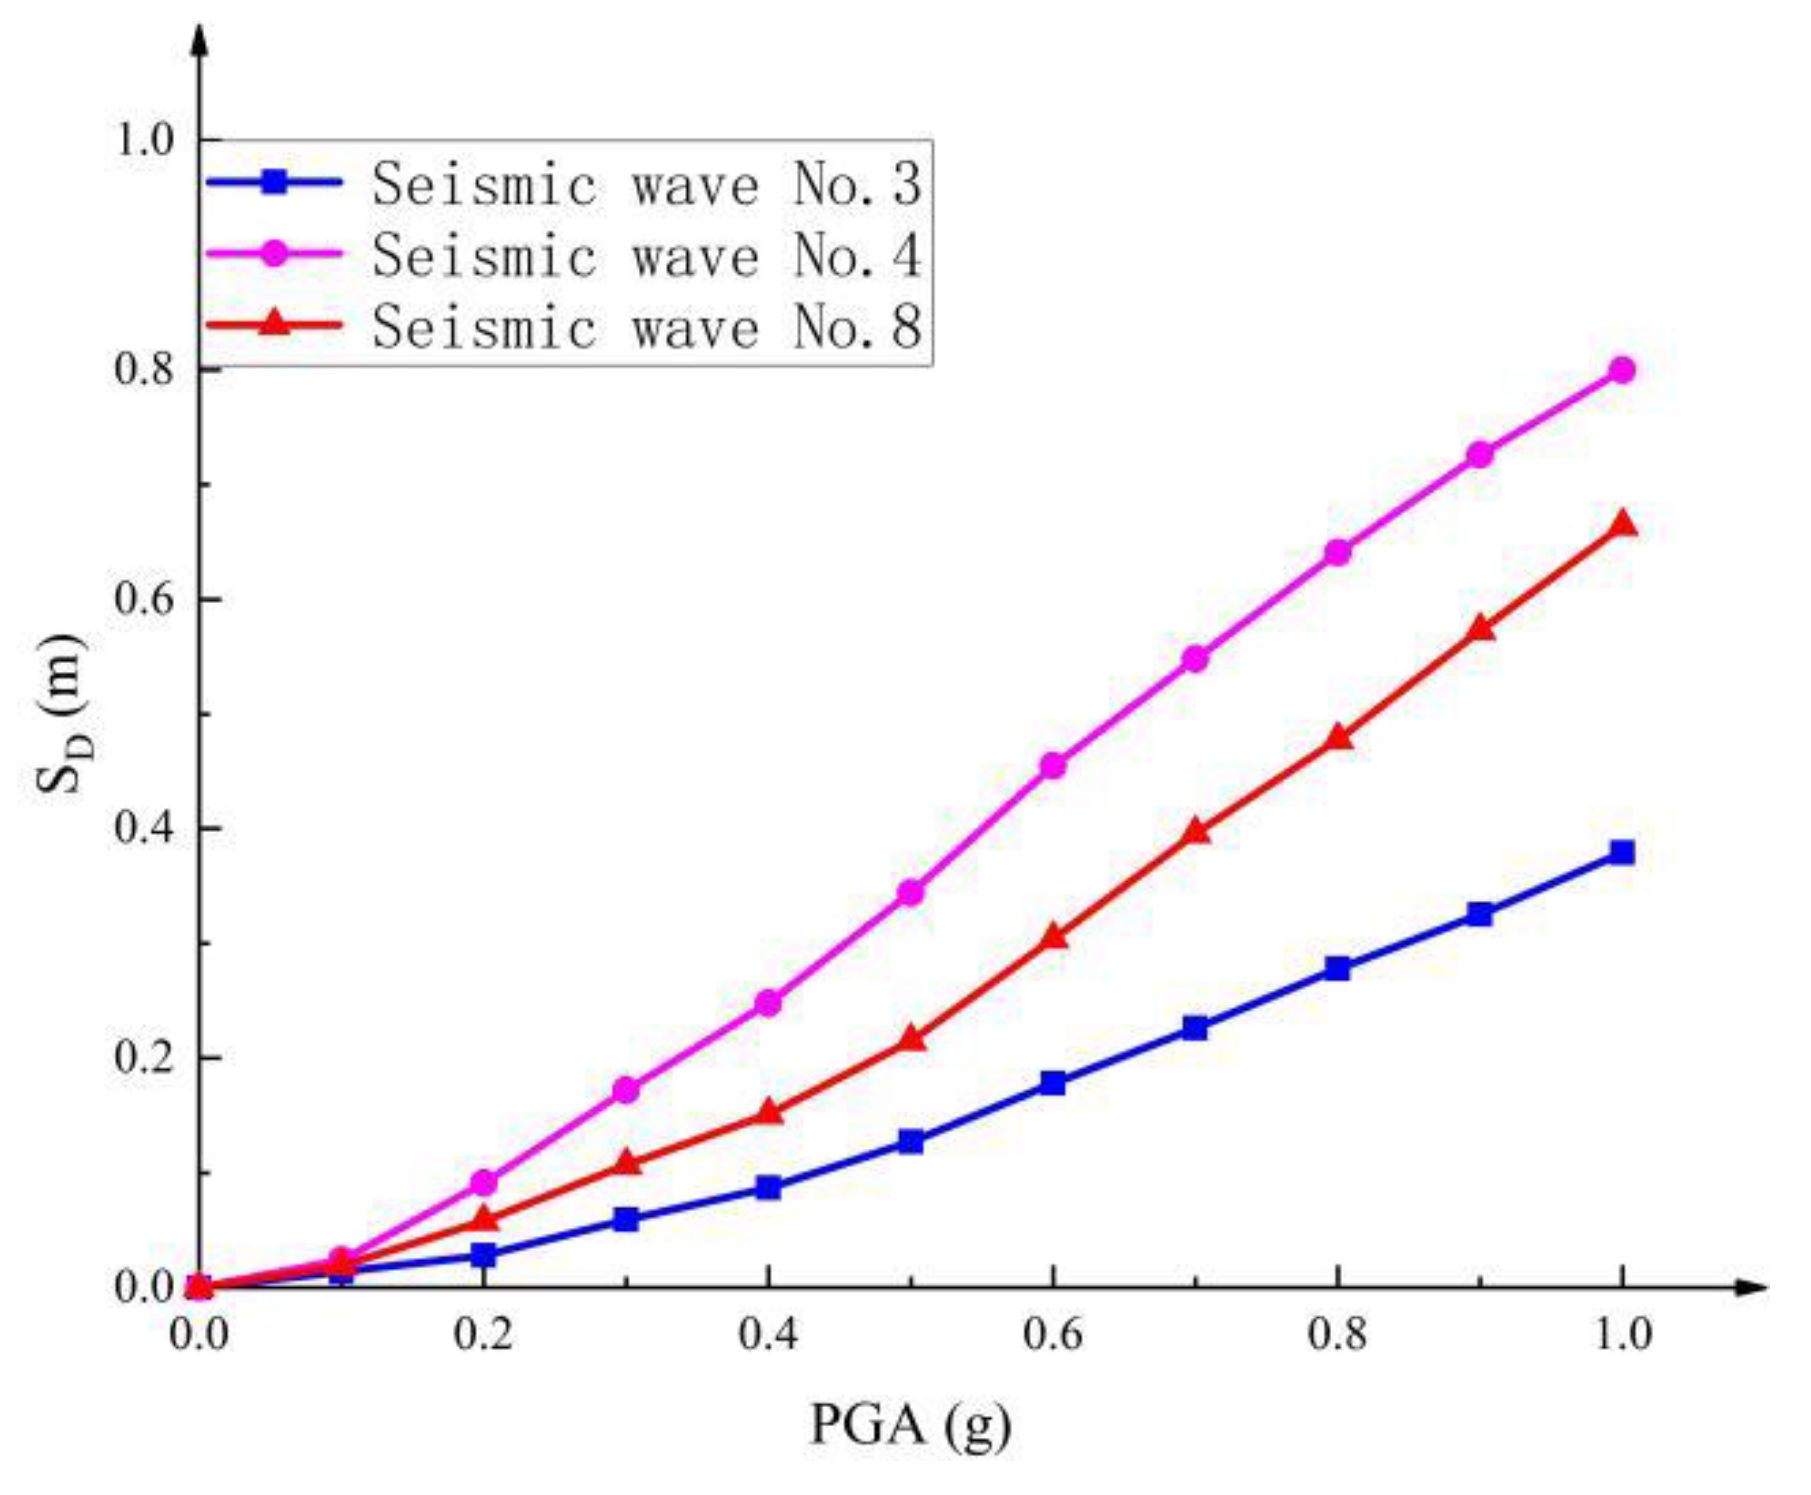
According to the seismic wave information in Table 4, seismic wave Nos. 3, 4, and 8 were selected, with different magnitudes and epicentral distances. These three seismic waves were amplitude-modulated to 0.1–1.0 g, and the amplitude modulation step was set as 0.1. The IDA curves of the maximum displacements of the top of the intake tower structure in the parallel direction were obtained through analysis. The performance level of intake tower structures cannot be obtained using empirical methods because they are relatively complex large-scale hydraulic buildings for which there is a lack of actual seismic information and experimental data. The performance levels of intake tower structures are defined based on the method of quantifying the performance level of concrete structures, such as reservoir dams, and observing the changes in the slope of the IDA curve [29]. As shown in Figure 8, four displacement-based performance level thresholds were defined for the intake tower structure, as follows: LS1 = 0.02 m—generally intact to slightly damaged; LS2 = 0.2 m—slightly damaged to moderately damaged; LS3 = 0.3 m—moderately damaged to severely damaged; and LS4 = 0.8 m—severely damaged to destroyed.
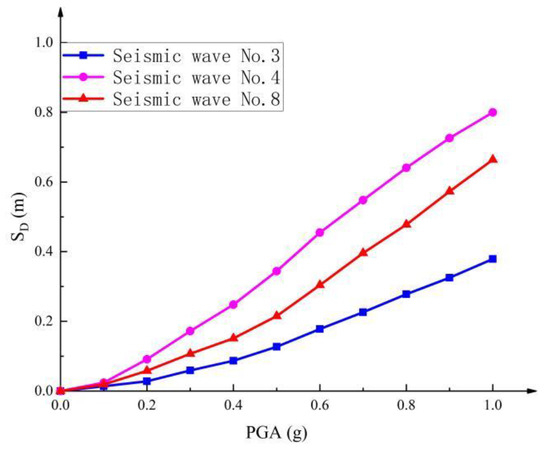
Figure 8.
IDA curve of maximum displacement along the flow direction at the top of the intake tower.
The damage-index-based performance level was defined by analyzing the trends of the IDA curves of the intake tower structure under the action of these three waves to assess its fragility.
4.3.2. Localized Damage Index Performance Level Quantification
The IDA curve of the damage index of the front of the intake tower structure is shown in Figure 9a, which was analyzed. In this study, LSD11 = 0.05, LSD12 = 0.16, LSD13 = 0.35, and LSD14 = 0.85 are defined as the performance level values of the intake tower structure based on its pre-damage indices.
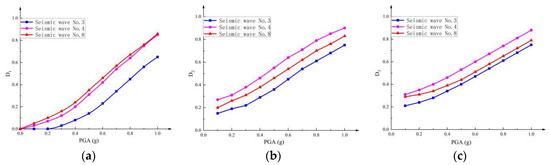
Figure 9.
IDA curves of local damage indices of intake tower structure. (a) Front impairment index of the tower, (b) post-damage index, (c) damage index of tower side.
The IDA curve of the post-damage index of the intake tower structure is shown in Figure 9b, which was analyzed. LSD21 = 0.20, LSD22 = 0.38, LSD23 = 0.55, and LSD24 = 0.90 were defined as the performance level values of the intake tower structure based on its post-damage indices. The IDA curve of the damage index of the side of the intake tower structure is shown in Figure 9c, which defines LSD31 = 0.30, LSD32 = 0.40, LSD33 = 0.53, and LSD34 = 0.88 as the performance level values of the intake tower structure based its side damage indices.
4.3.3. Quantification of Overall Damage Index Performance Level
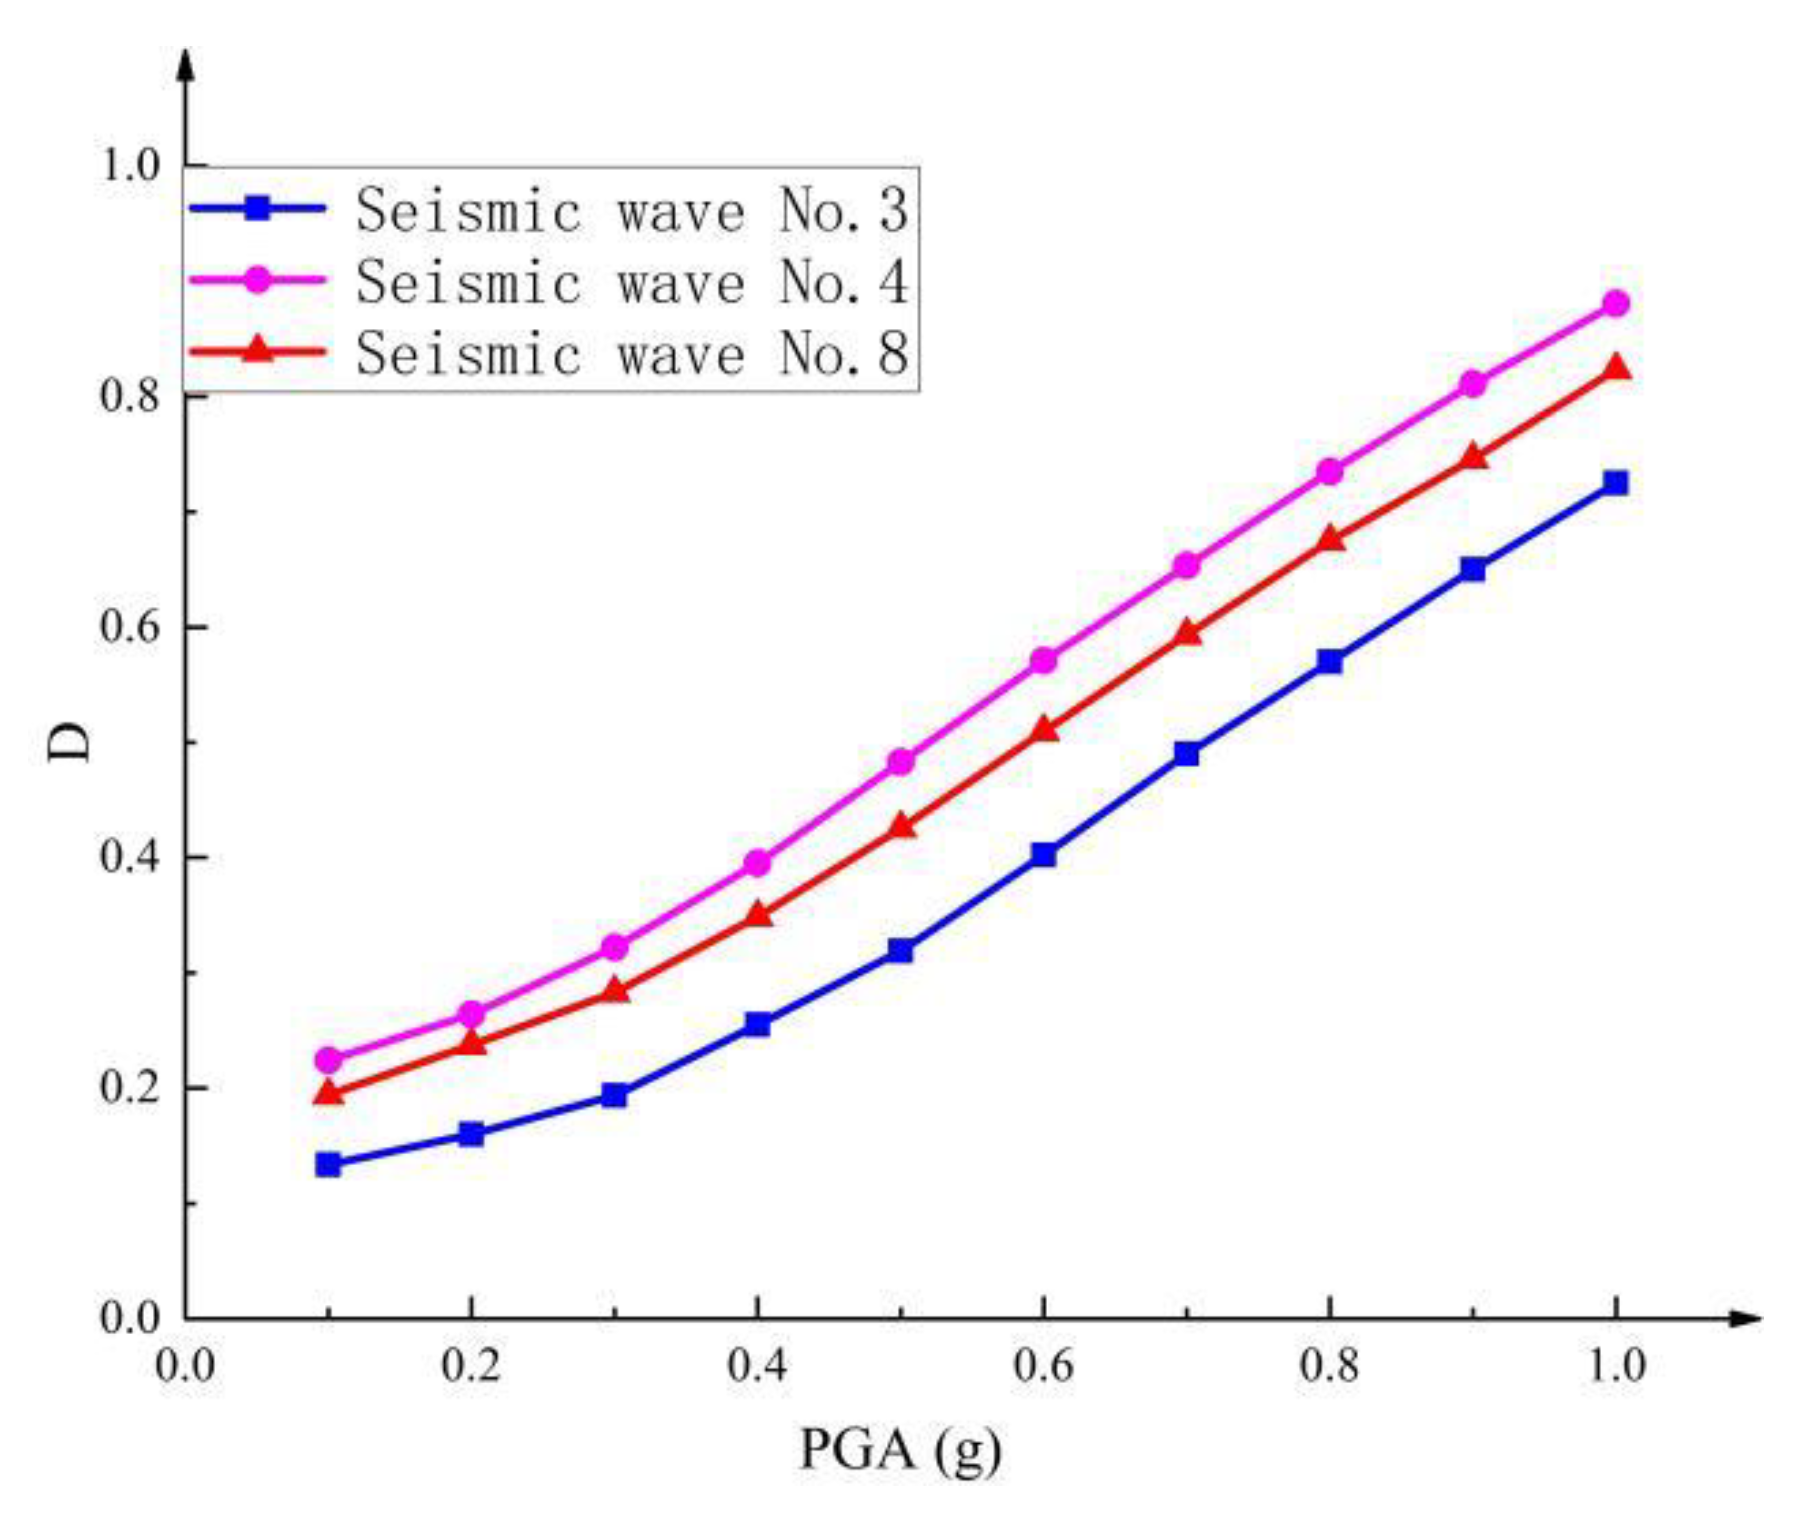
The IDA curve of the overall damage index of the intake tower structure is shown in Figure 10. Combined with the quantification of the performance level of the local damage index of the intake tower structure above, the IDA curve was analyzed, and LSD1 = 0.20, LSD2 = 0.30, LSD3 = 0.50, and LSD4 = 0.88 were defined as the four performance level values in the seismic fragility analysis of the intake tower structure based on its overall damage index.
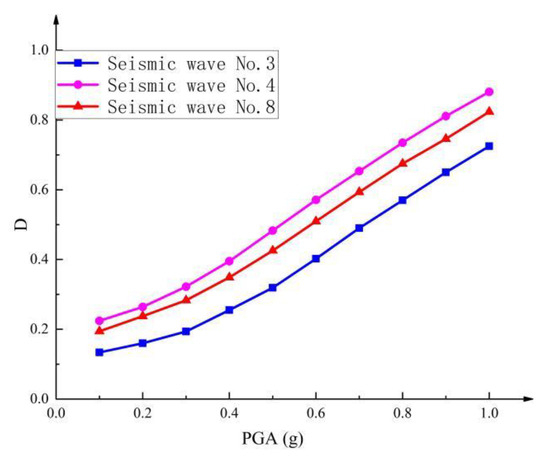
Figure 10.
IDA curve of overall damage index of intake tower structure.
5. Fragility Analysis
5.1. Two-Dimensional Seismic Fragility Analysis
Assuming that the maximum displacement in the parallel flow direction of the intake tower structure, the local damage index, and the overall damage index of the tower all conform to a lognormal distribution, Equation (9) was used to calculate the exceeding probability that the intake tower structure will reach the limit performance state. We analyzed the fragility of the maximum displacement in the parallel flow direction of the intake tower structure with the local damage index and the overall damage index, and the fragility curves are shown in Figure 11 and Figure 12.
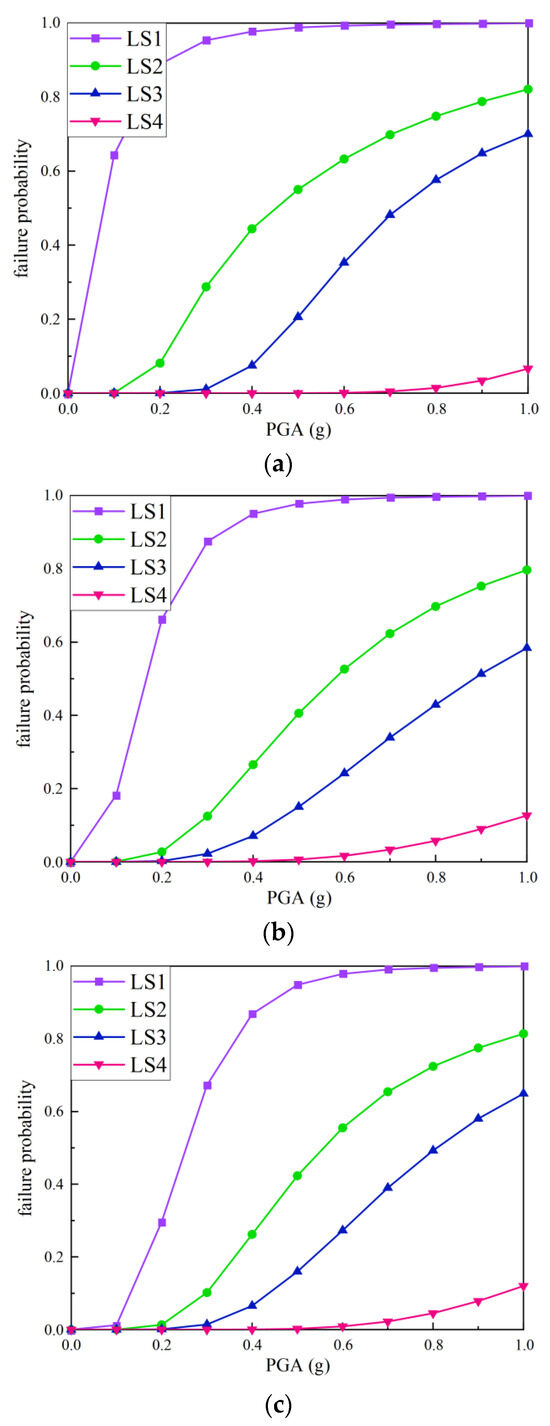
Figure 11.
Fragility curves considering the maximum displacement and the limit state of the local damage index. (a) Maximum displacement and damage index of tower front, (b) maximum displacement and post-damage index, (c) maximum displacement and damage index of tower side.
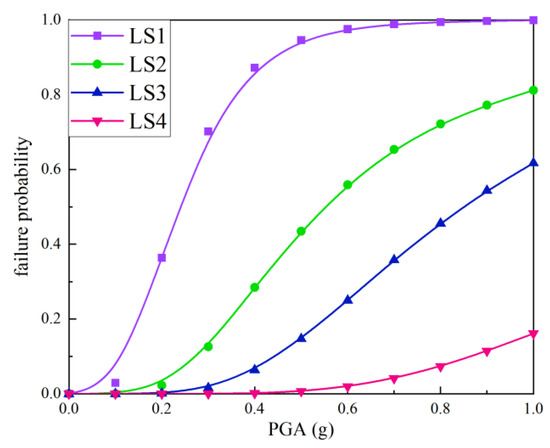
Figure 12.
Fragility curves considering both the maximum displacement and the limit state of the overall damage index.
In Figure 11a, it can be seen that the probabilities of the structure reaching LS1 and LS2 under the designed seismic acceleration are 88.87% and 8.13%, respectively, and the probabilities of reaching the LS3 and LS4 performance states are small and negligible. As shown in Figure 11b, the probabilities of the intake tower structure reaching the first three limit states under the designed seismic acceleration are 66.25%, 2.71%, and 0.23%, respectively. As shown in Figure 11c, the probabilities of the intake tower structure failing to reach LS1 and LS2 under the designed seismic acceleration are 29.65% and 1.33%, respectively. As shown in Figure 12, the probabilities of the intake tower structure reaching LS1, LS2, and LS3 are 36.35%, 2.27%, and 0.11%, respectively.
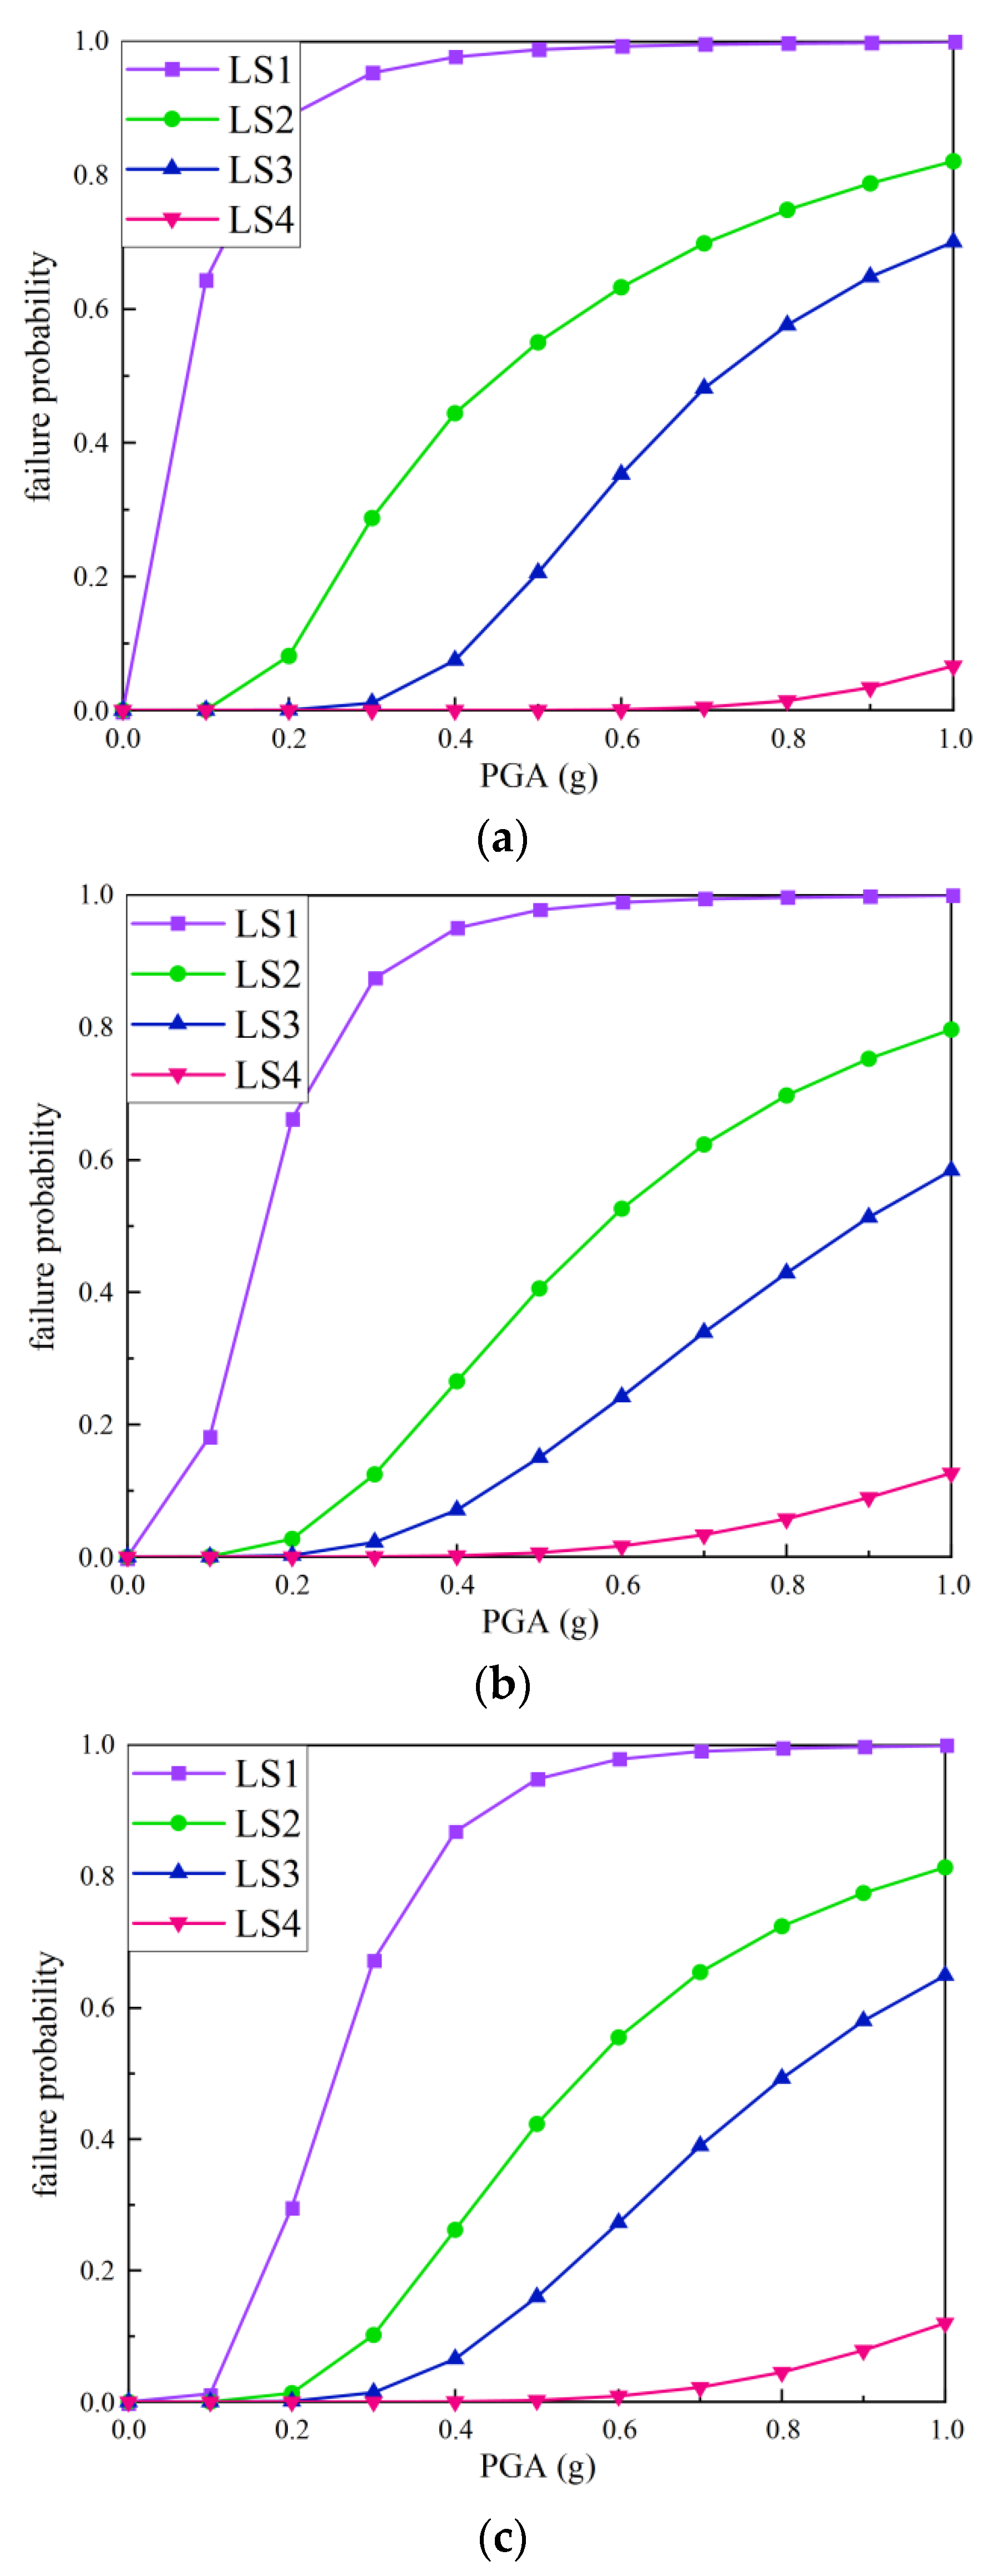
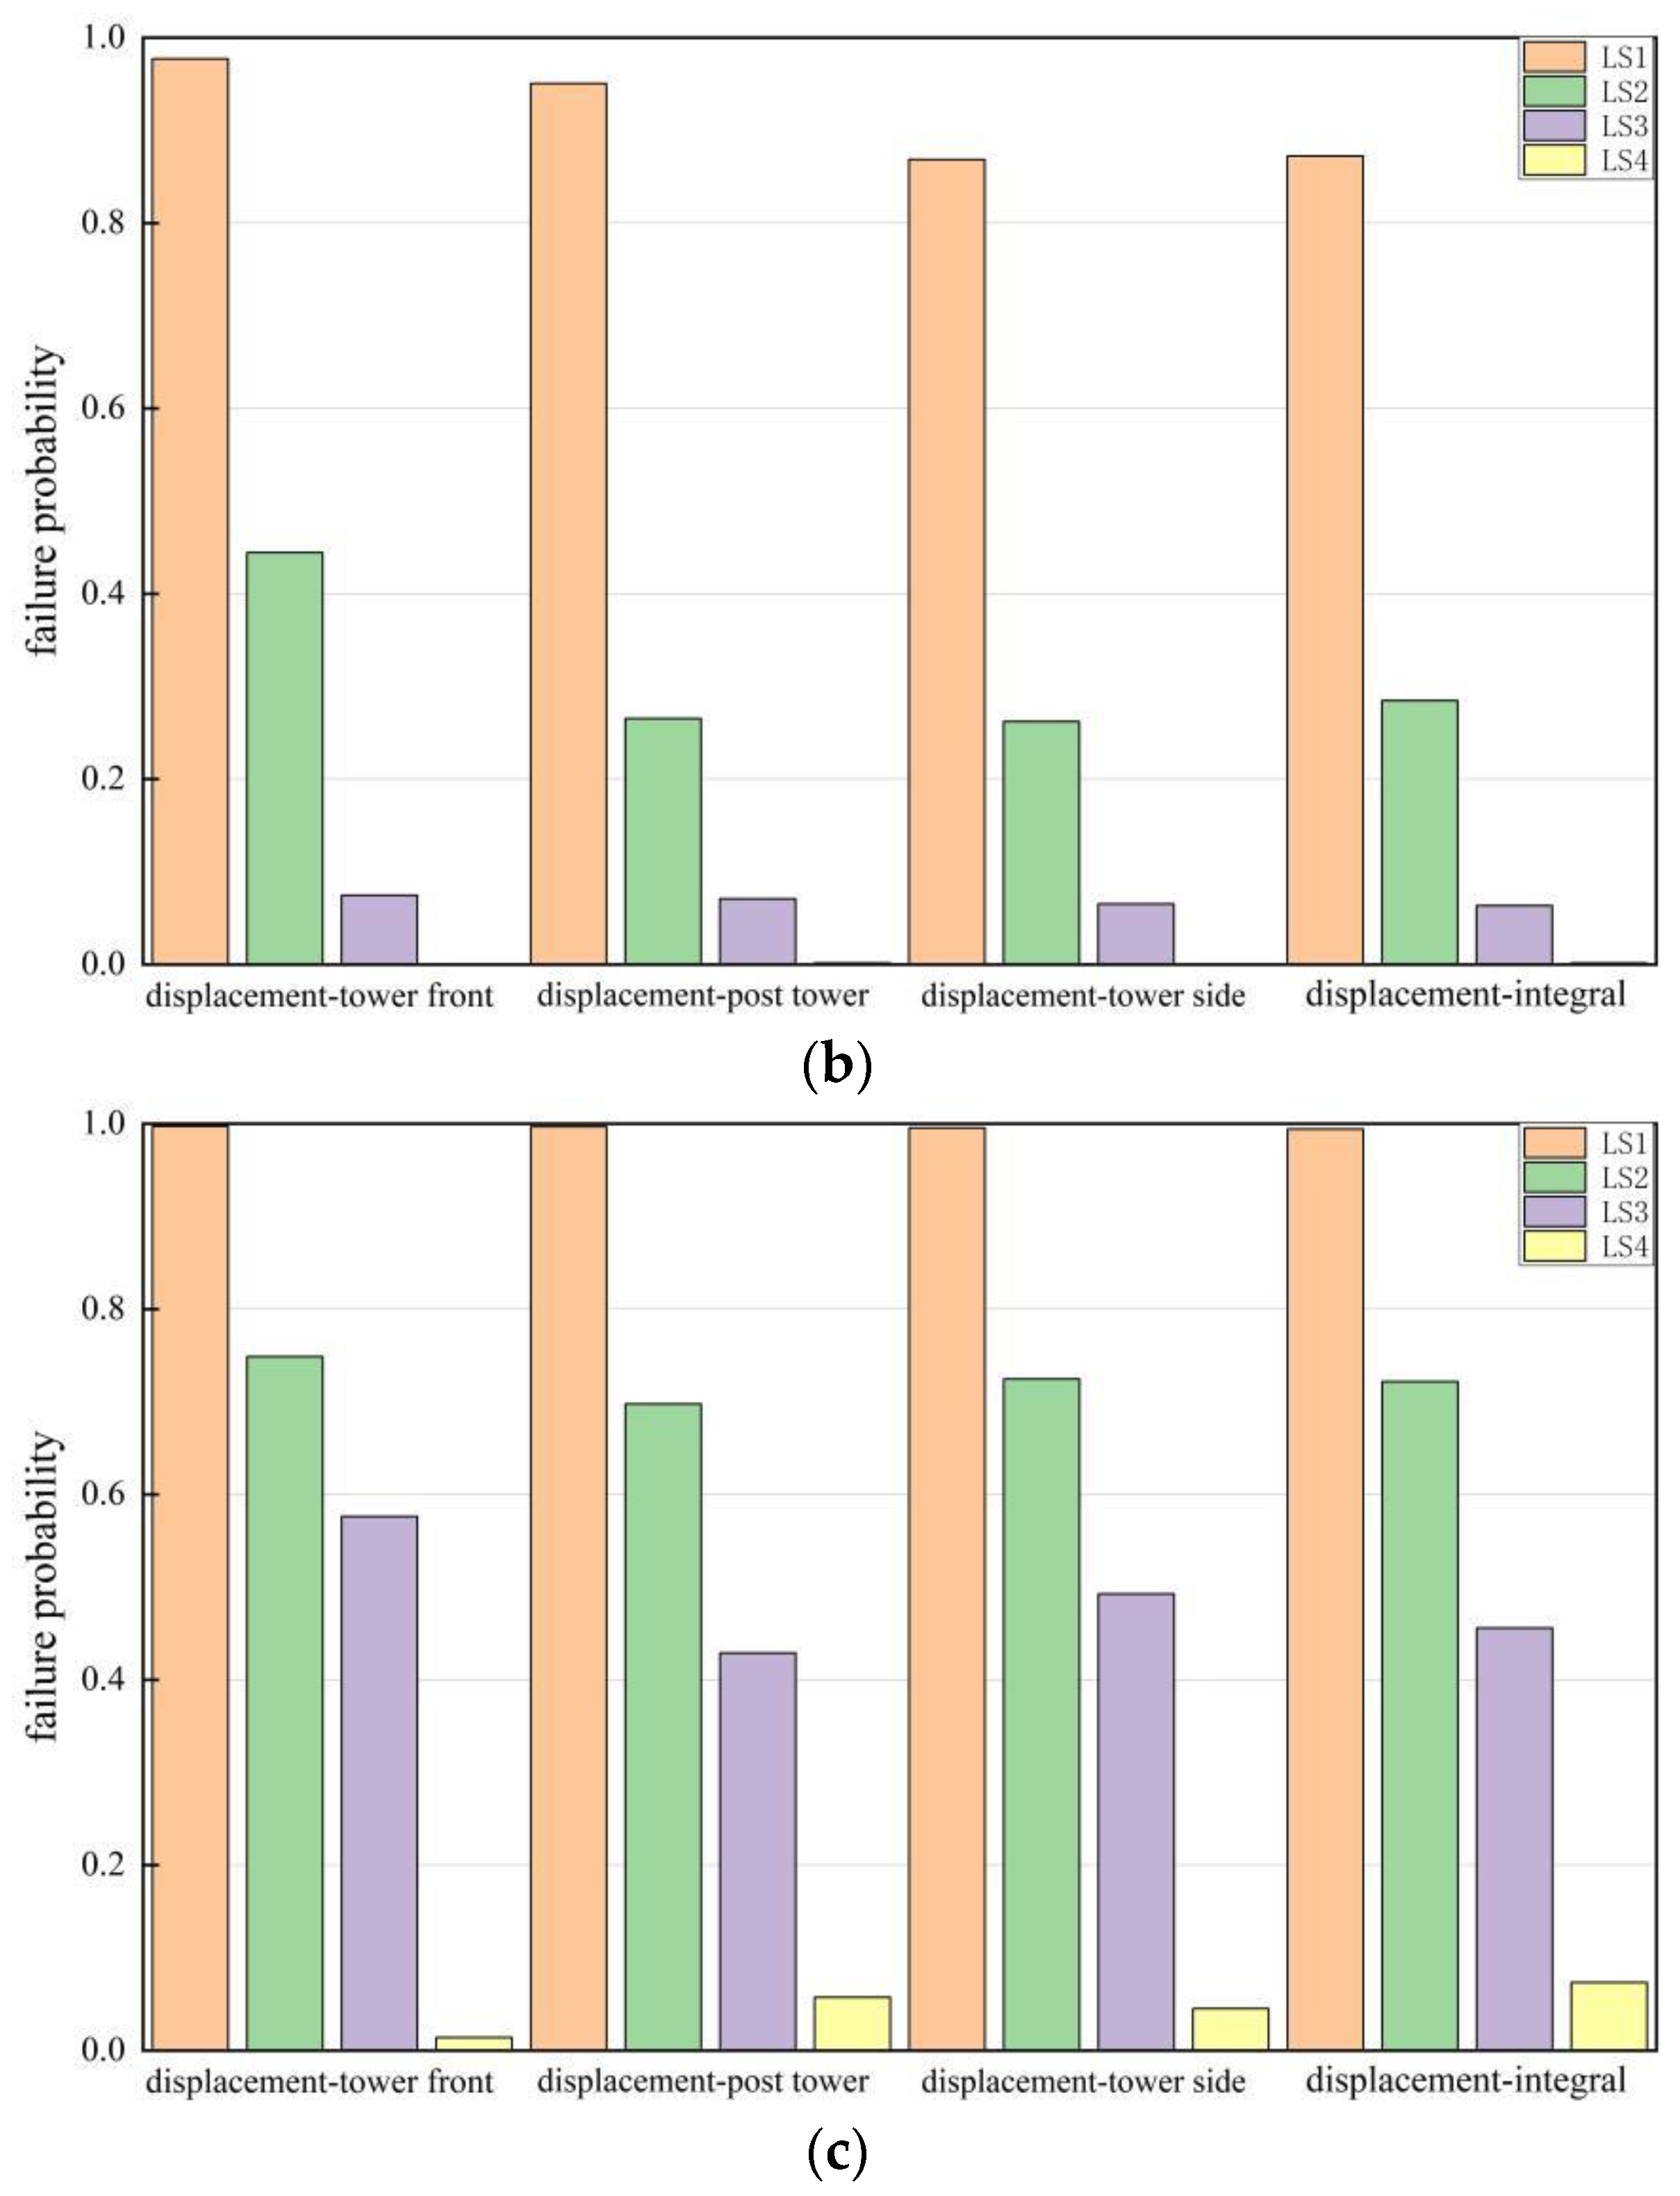
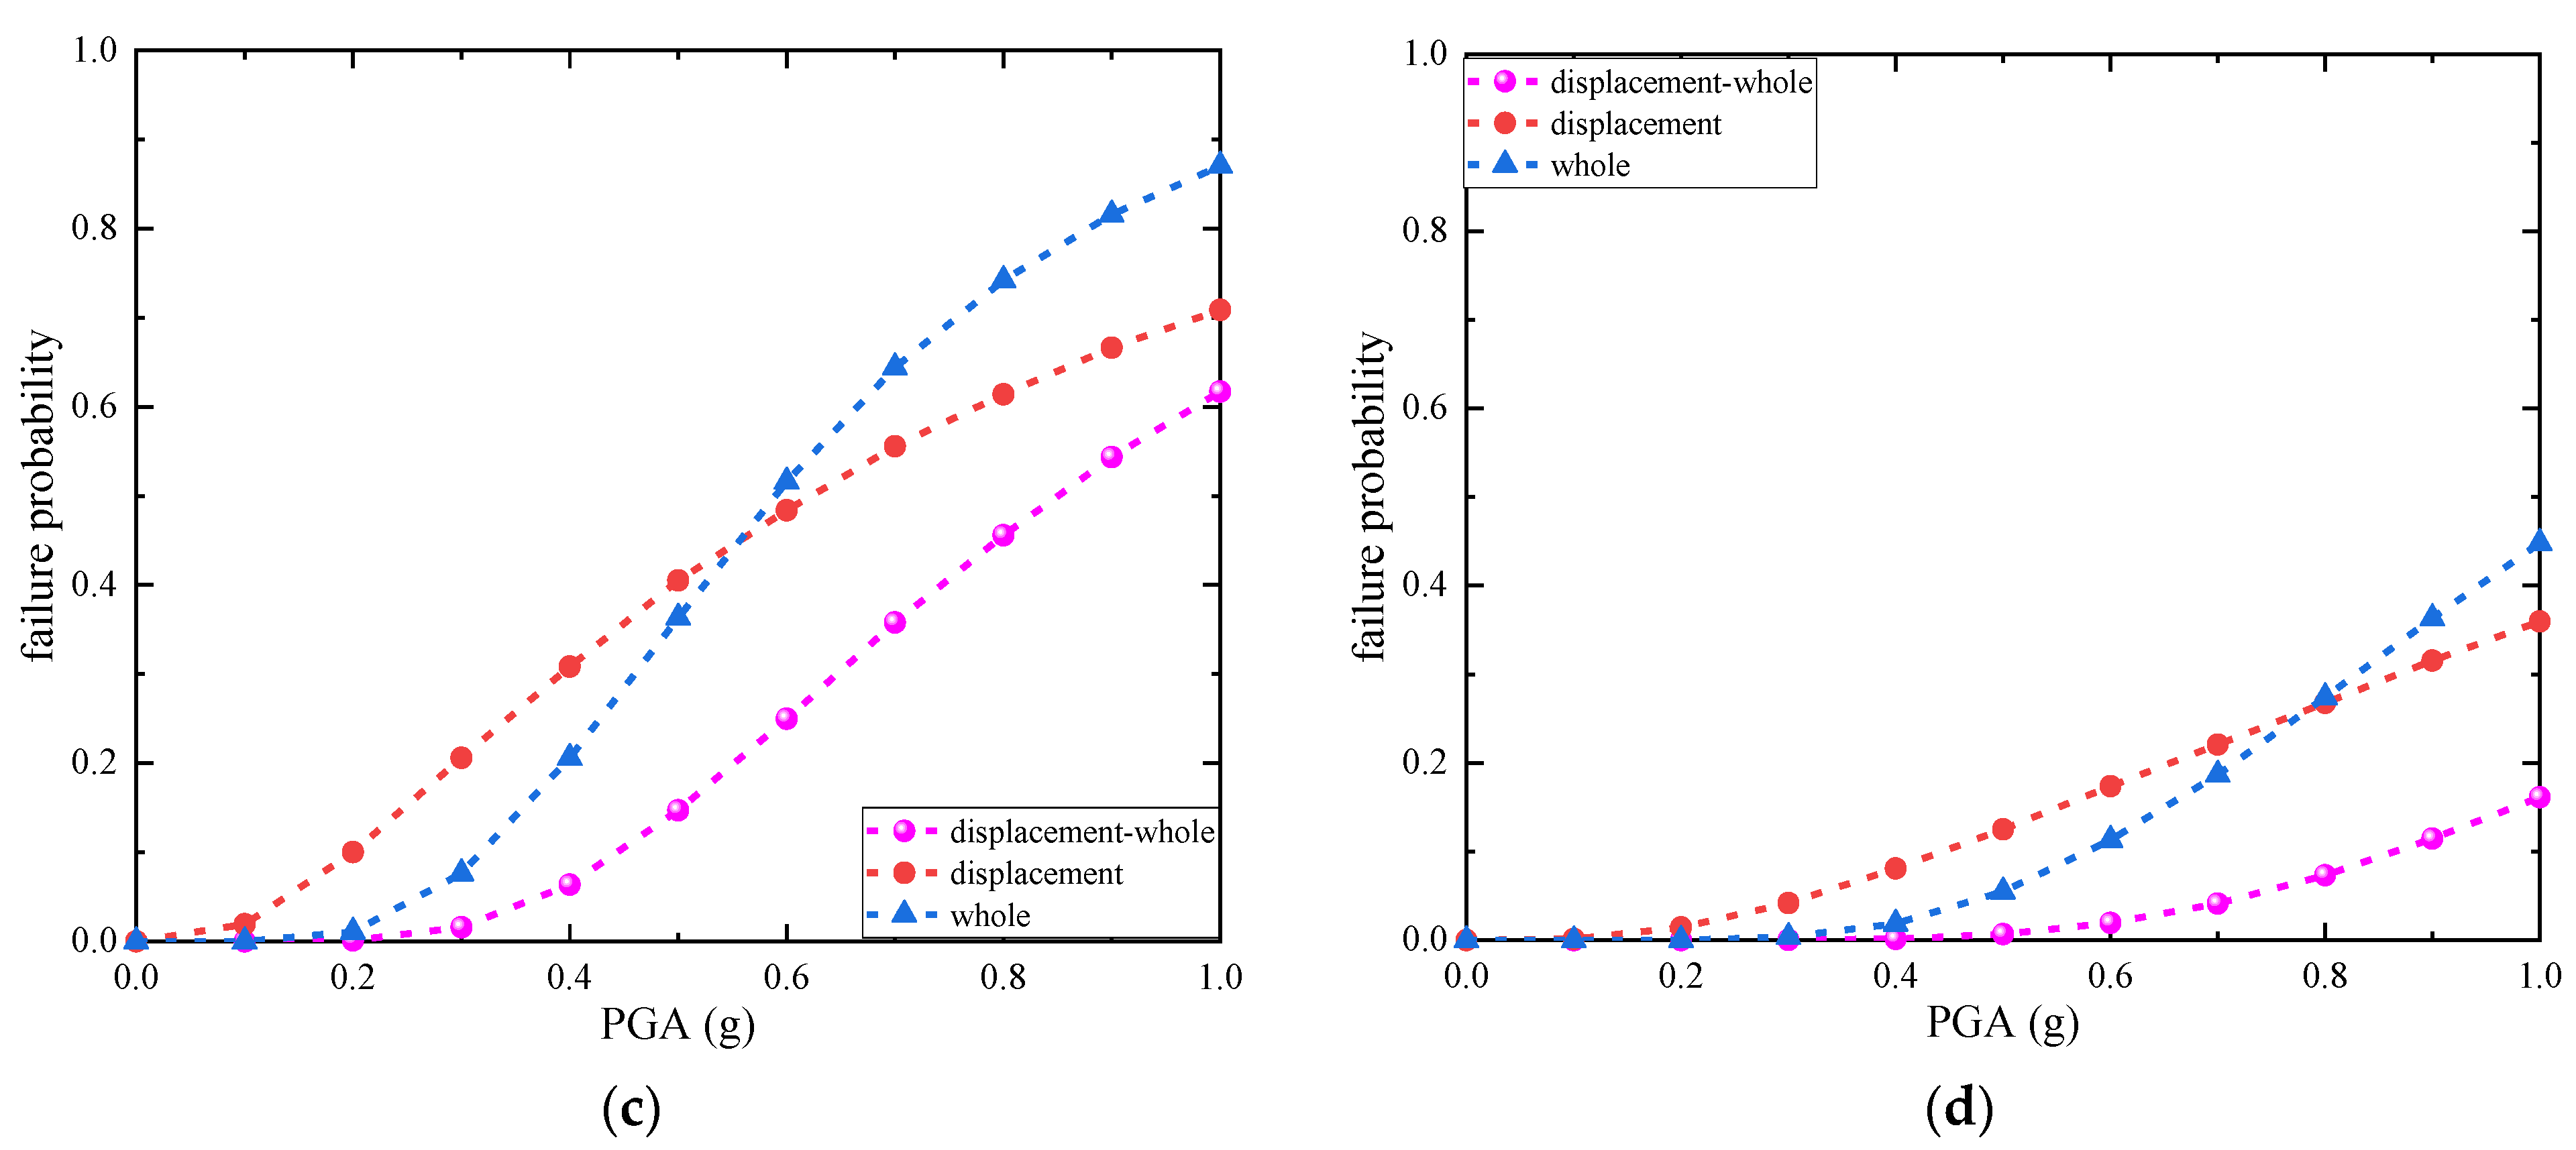
Figure 13 presents the failure probability of the intake tower structure at different performance levels under the designed seismic acceleration, two times the designed seismic acceleration, and four times the designed seismic acceleration, which gives a more intuitive view of the relationship between the structural response of the intake tower and the intensity of the ground shaking, as well as the magnitude of the likelihood of damage to various parts of the structure.
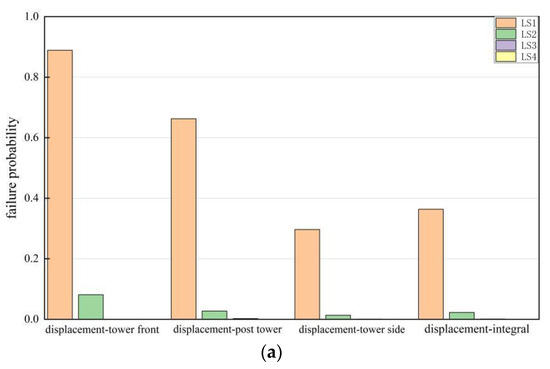
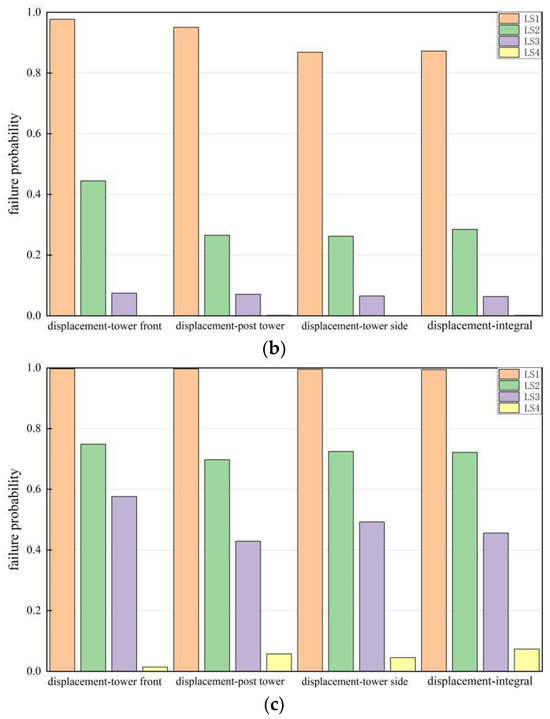
Figure 13.
Failure probability of intake tower structures under three peak ground-shaking accelerations: (a) 0.2 g, (b) 0.4 g, (c) 0.8 g.
5.2. Comparison of One- and Two-Dimensional Seismic Fragility
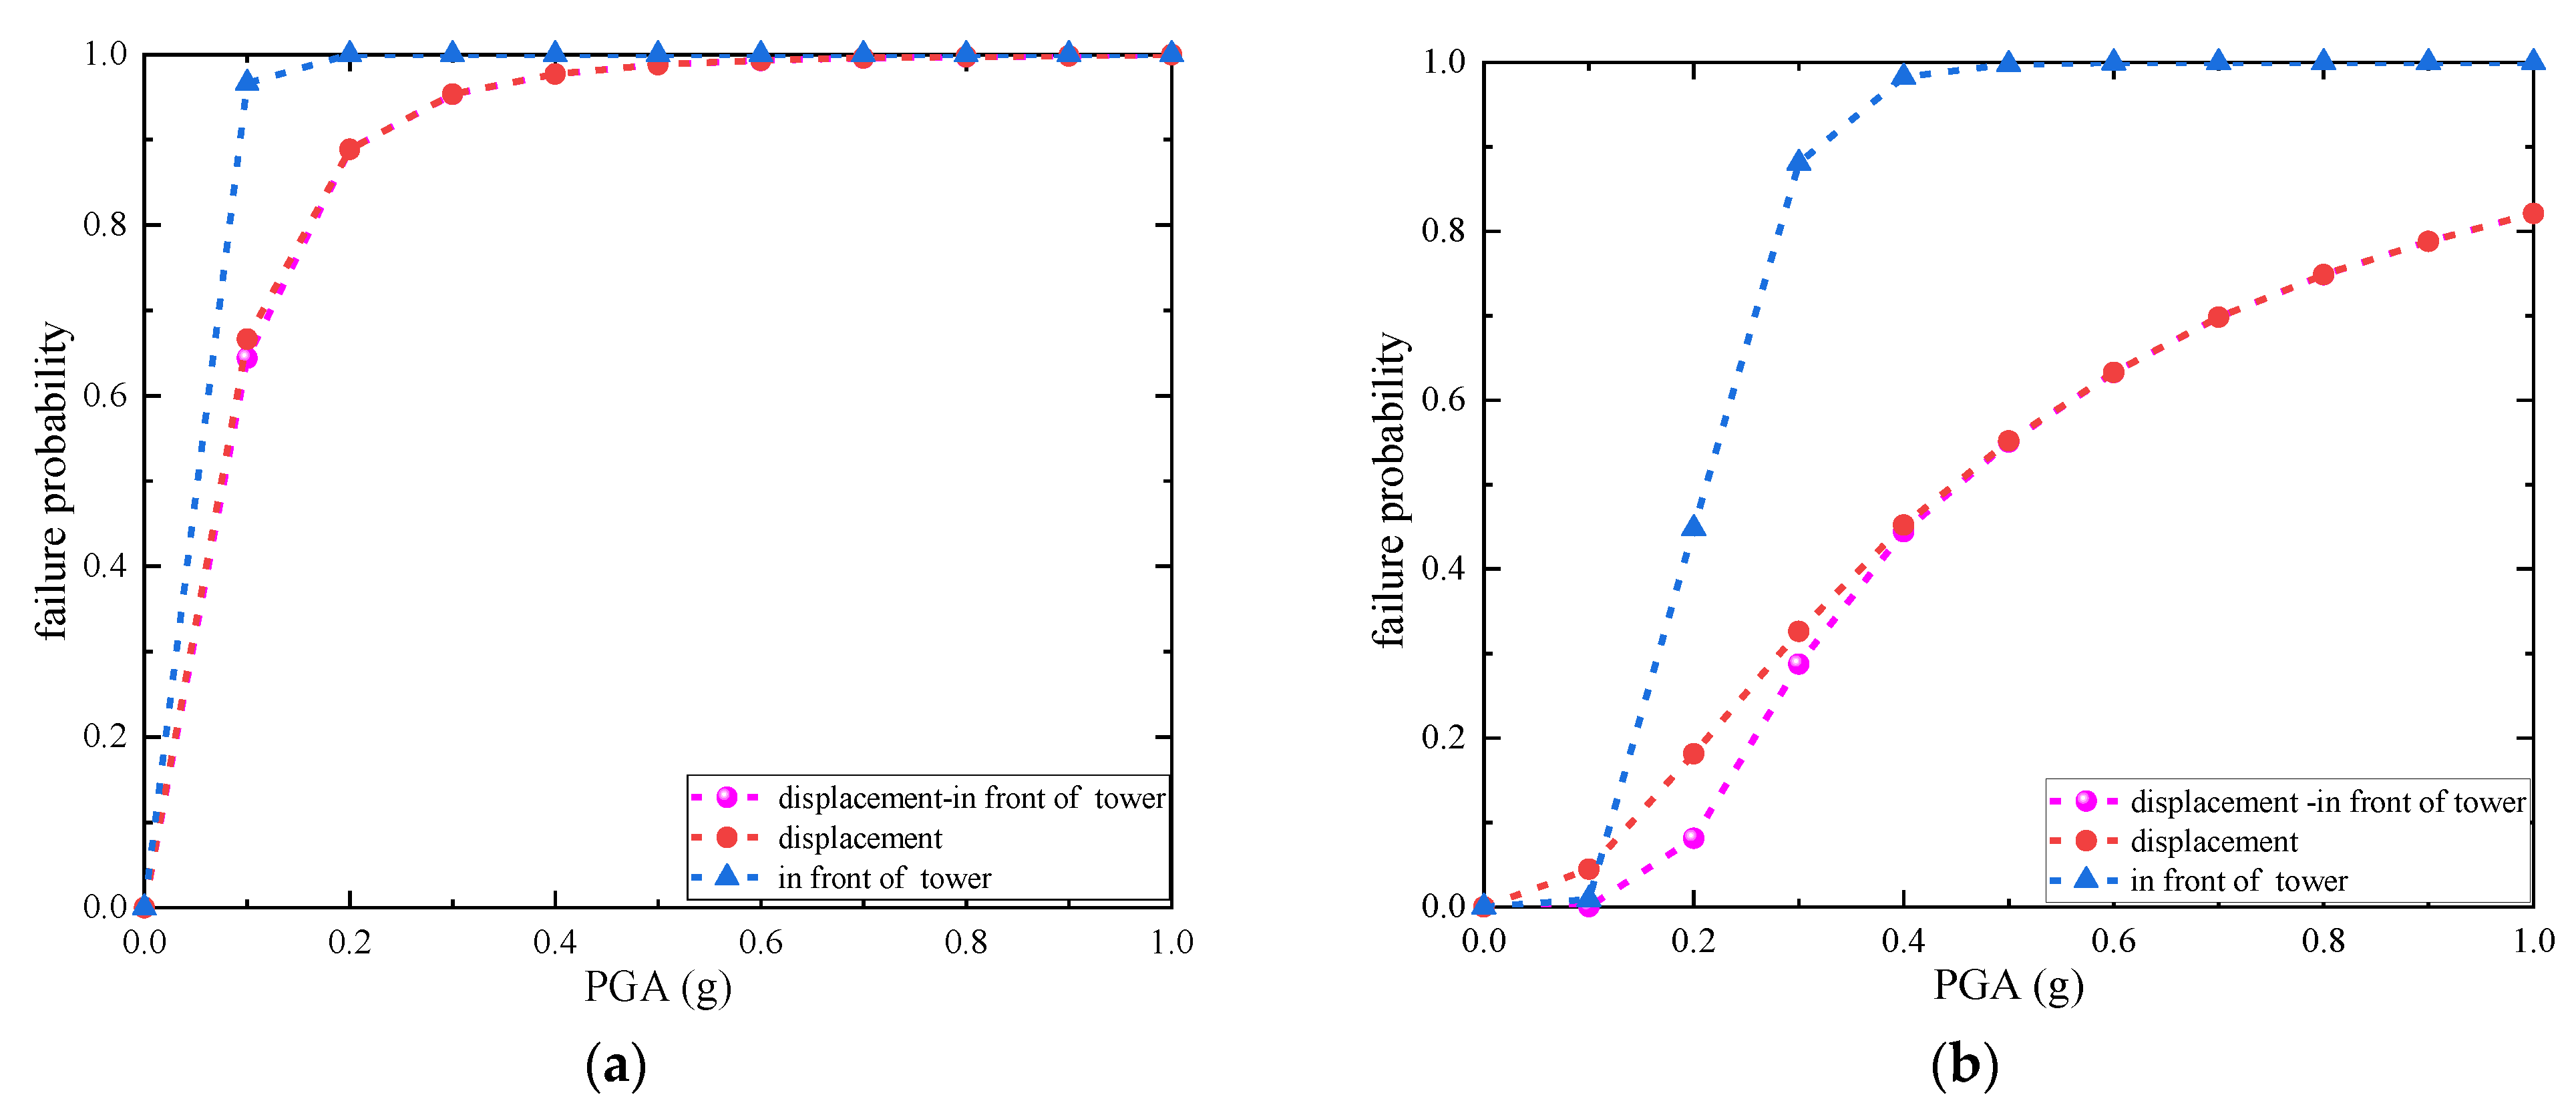
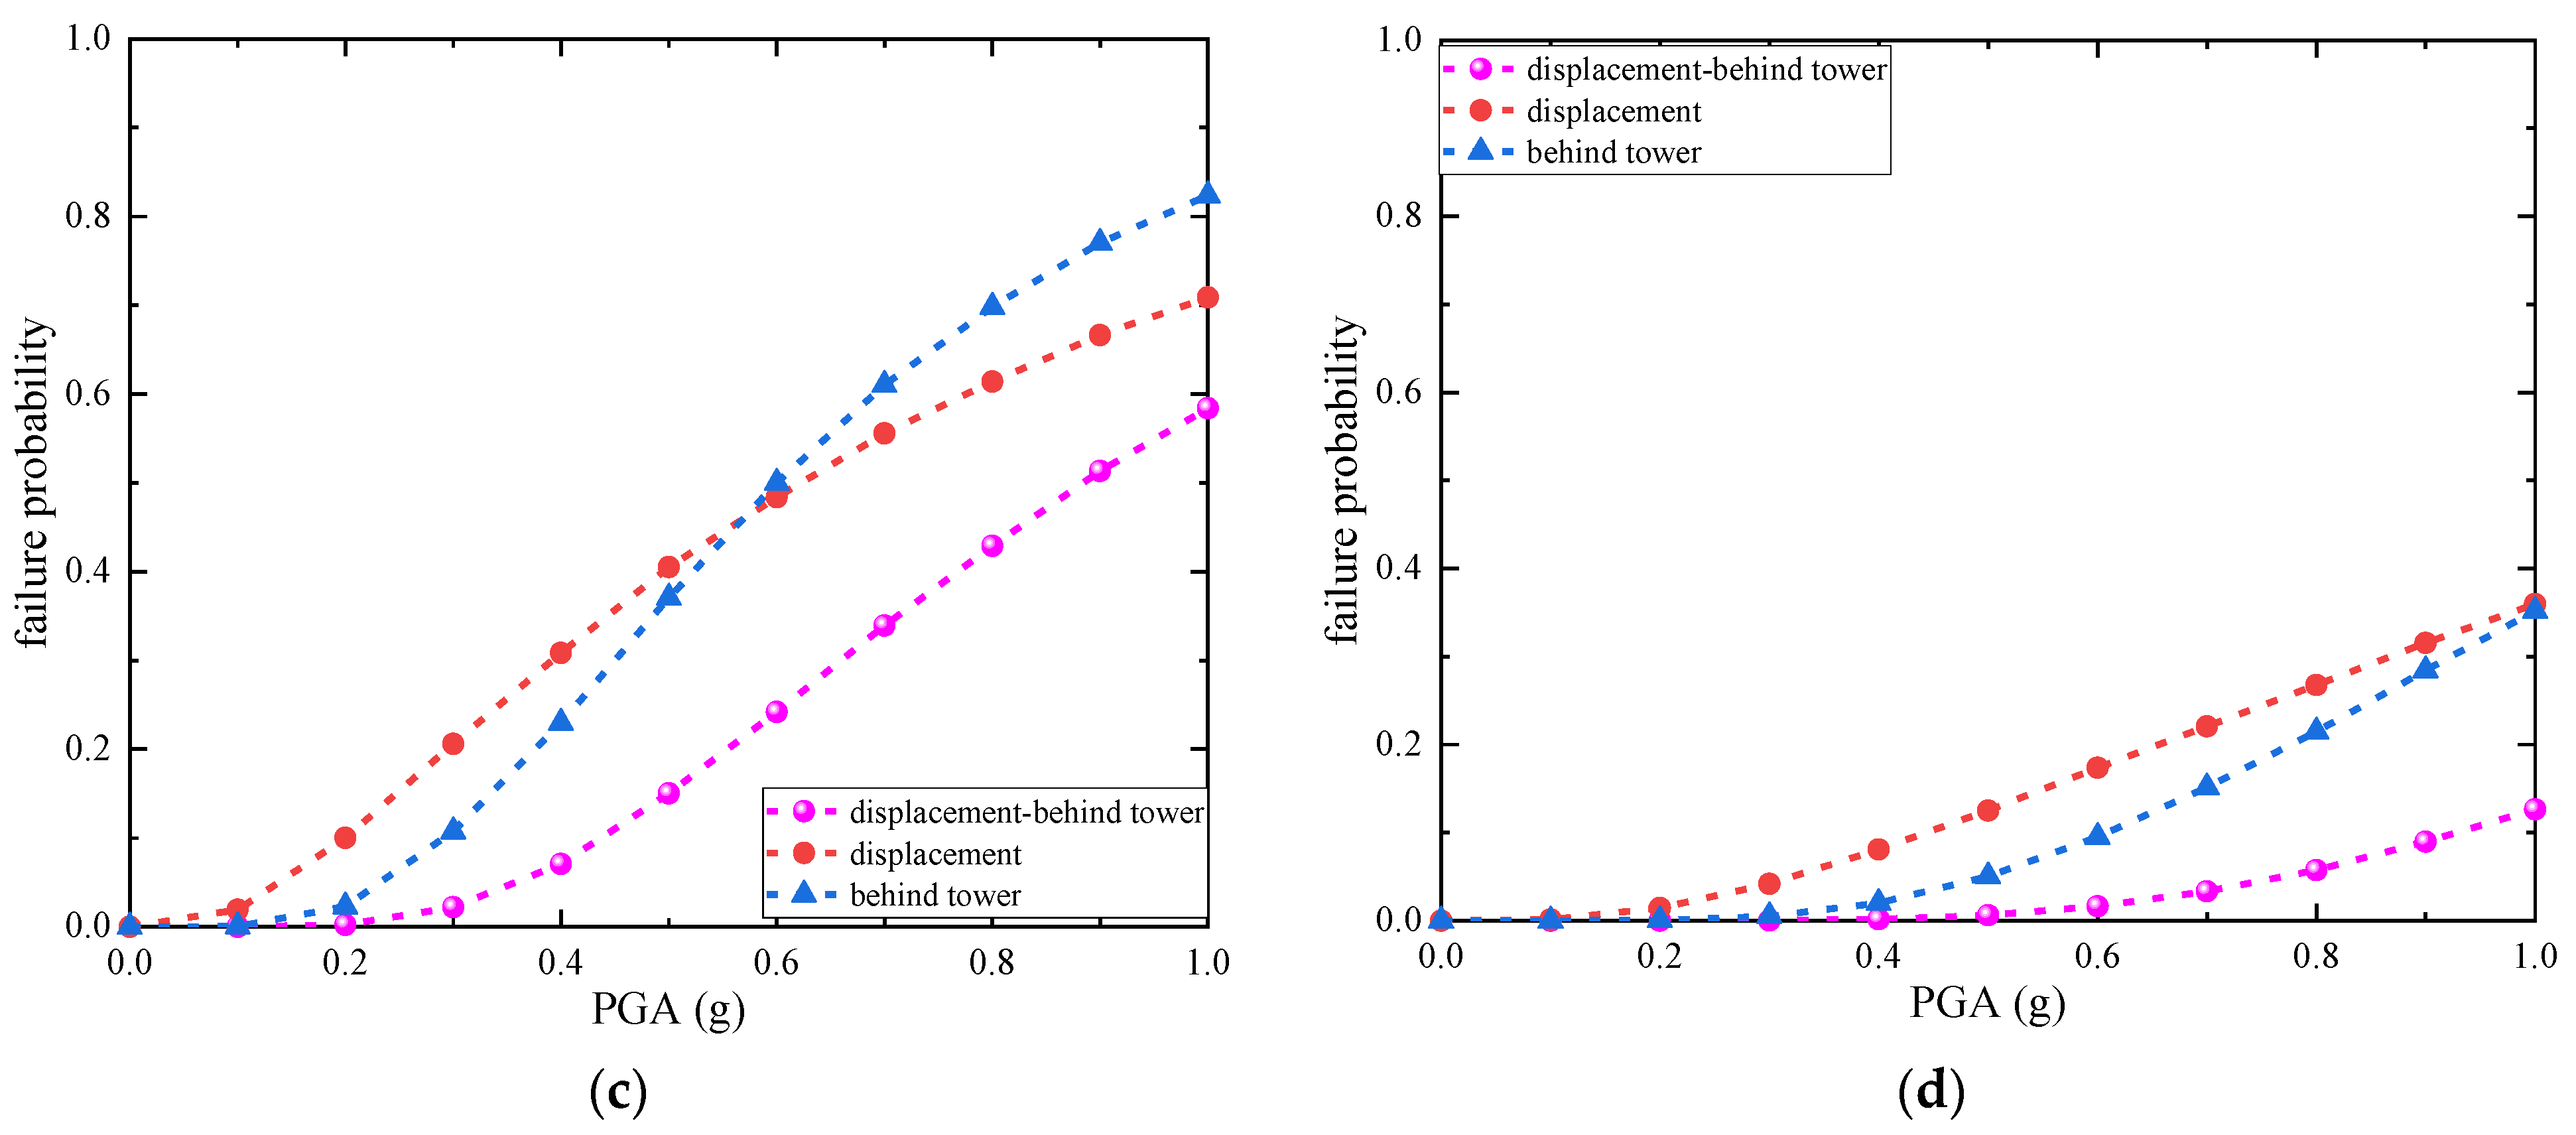
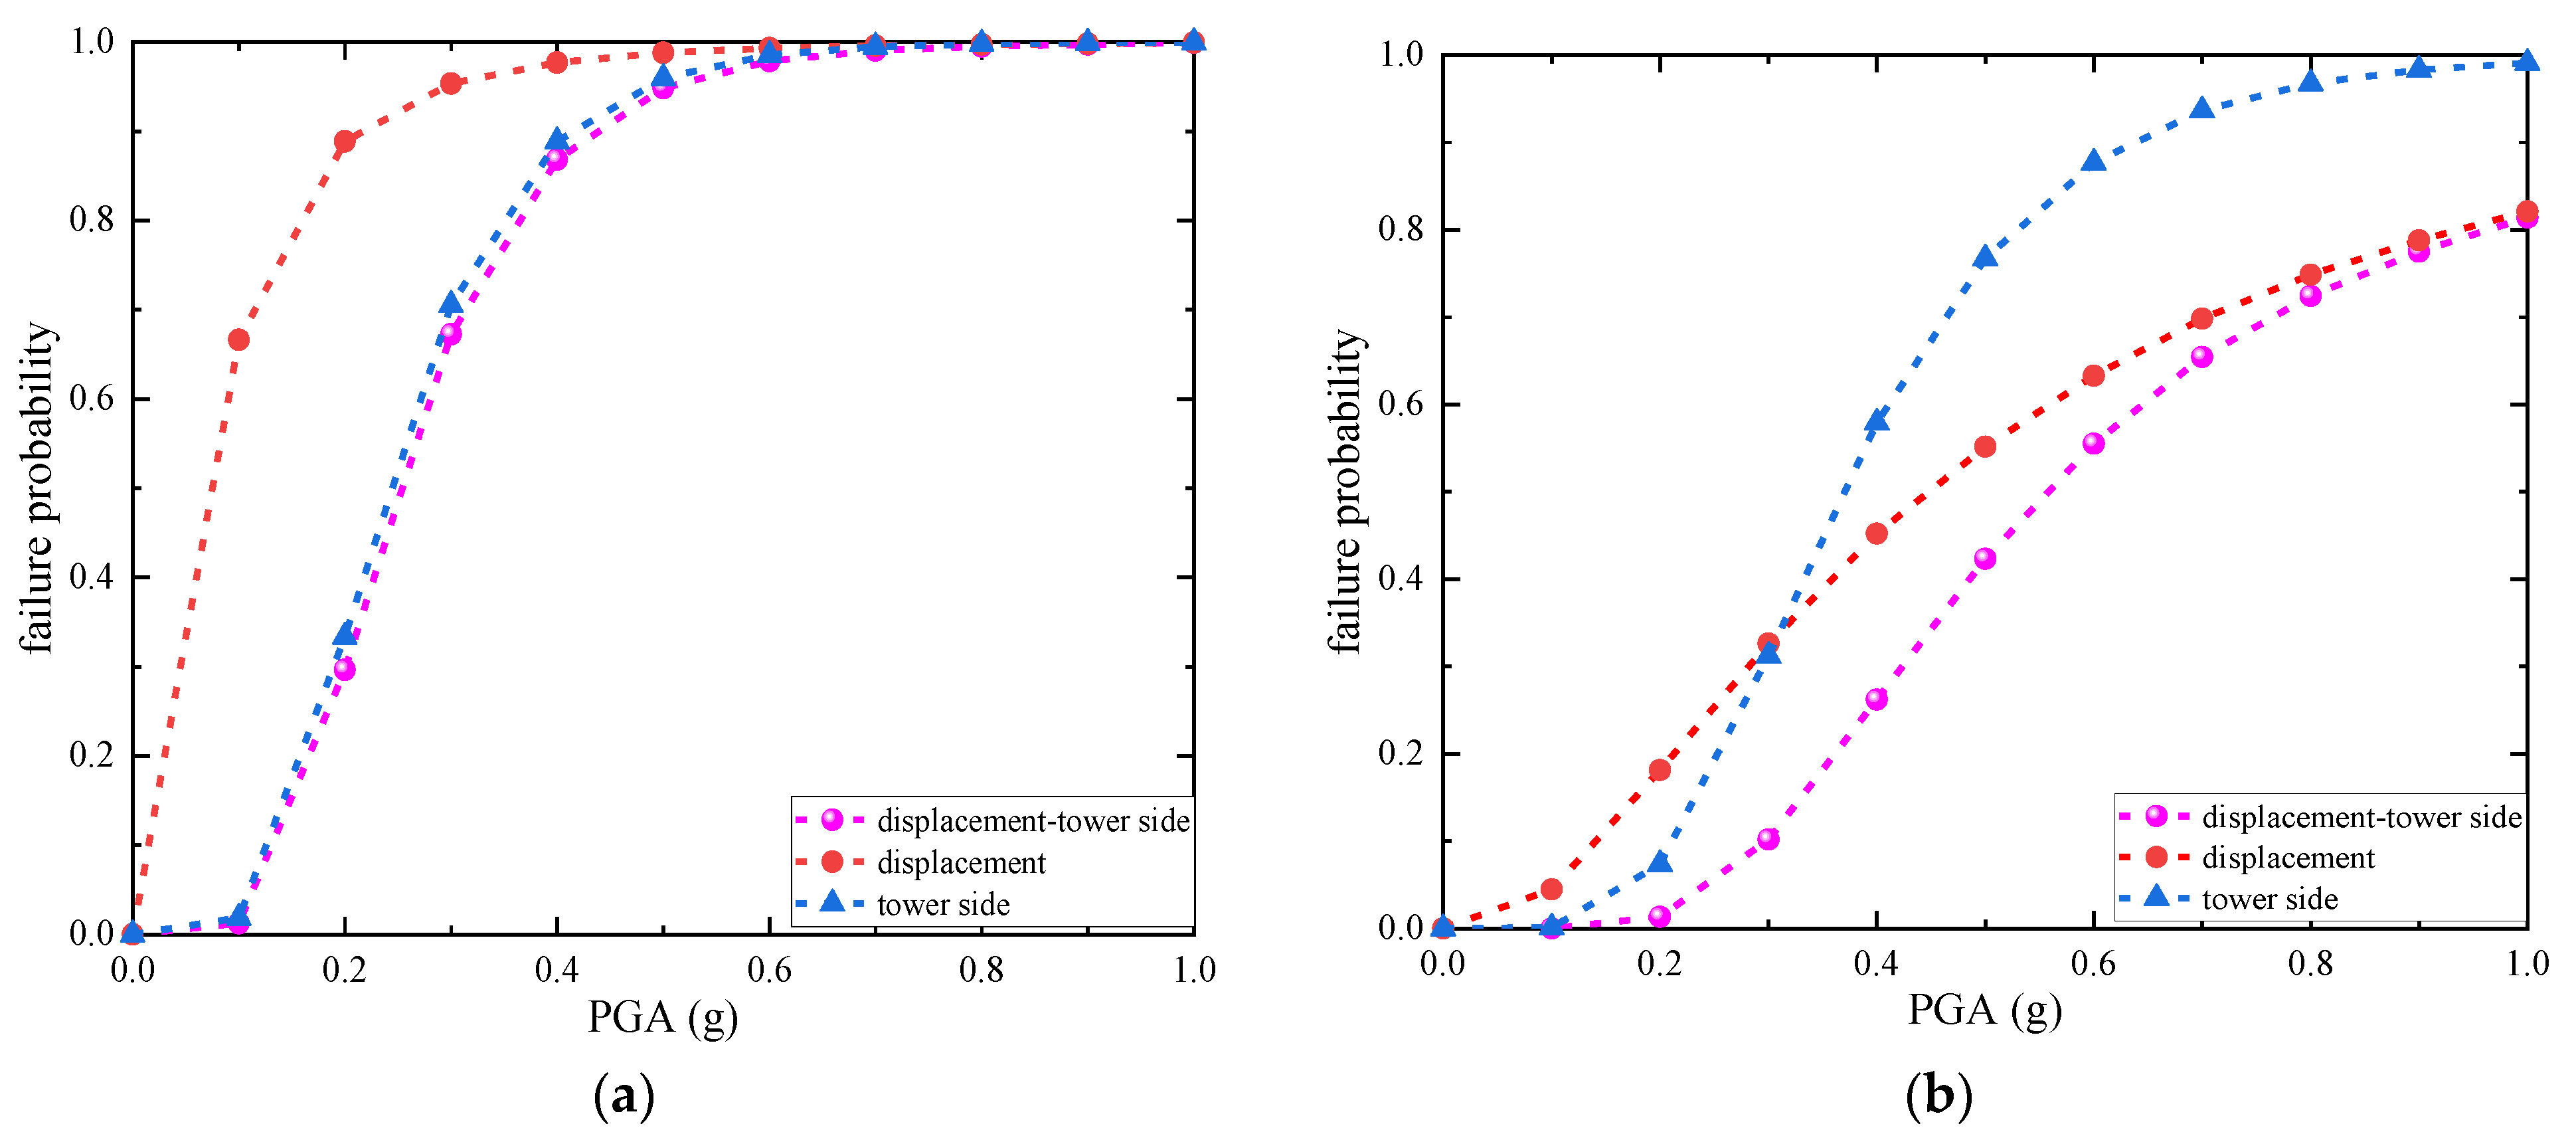
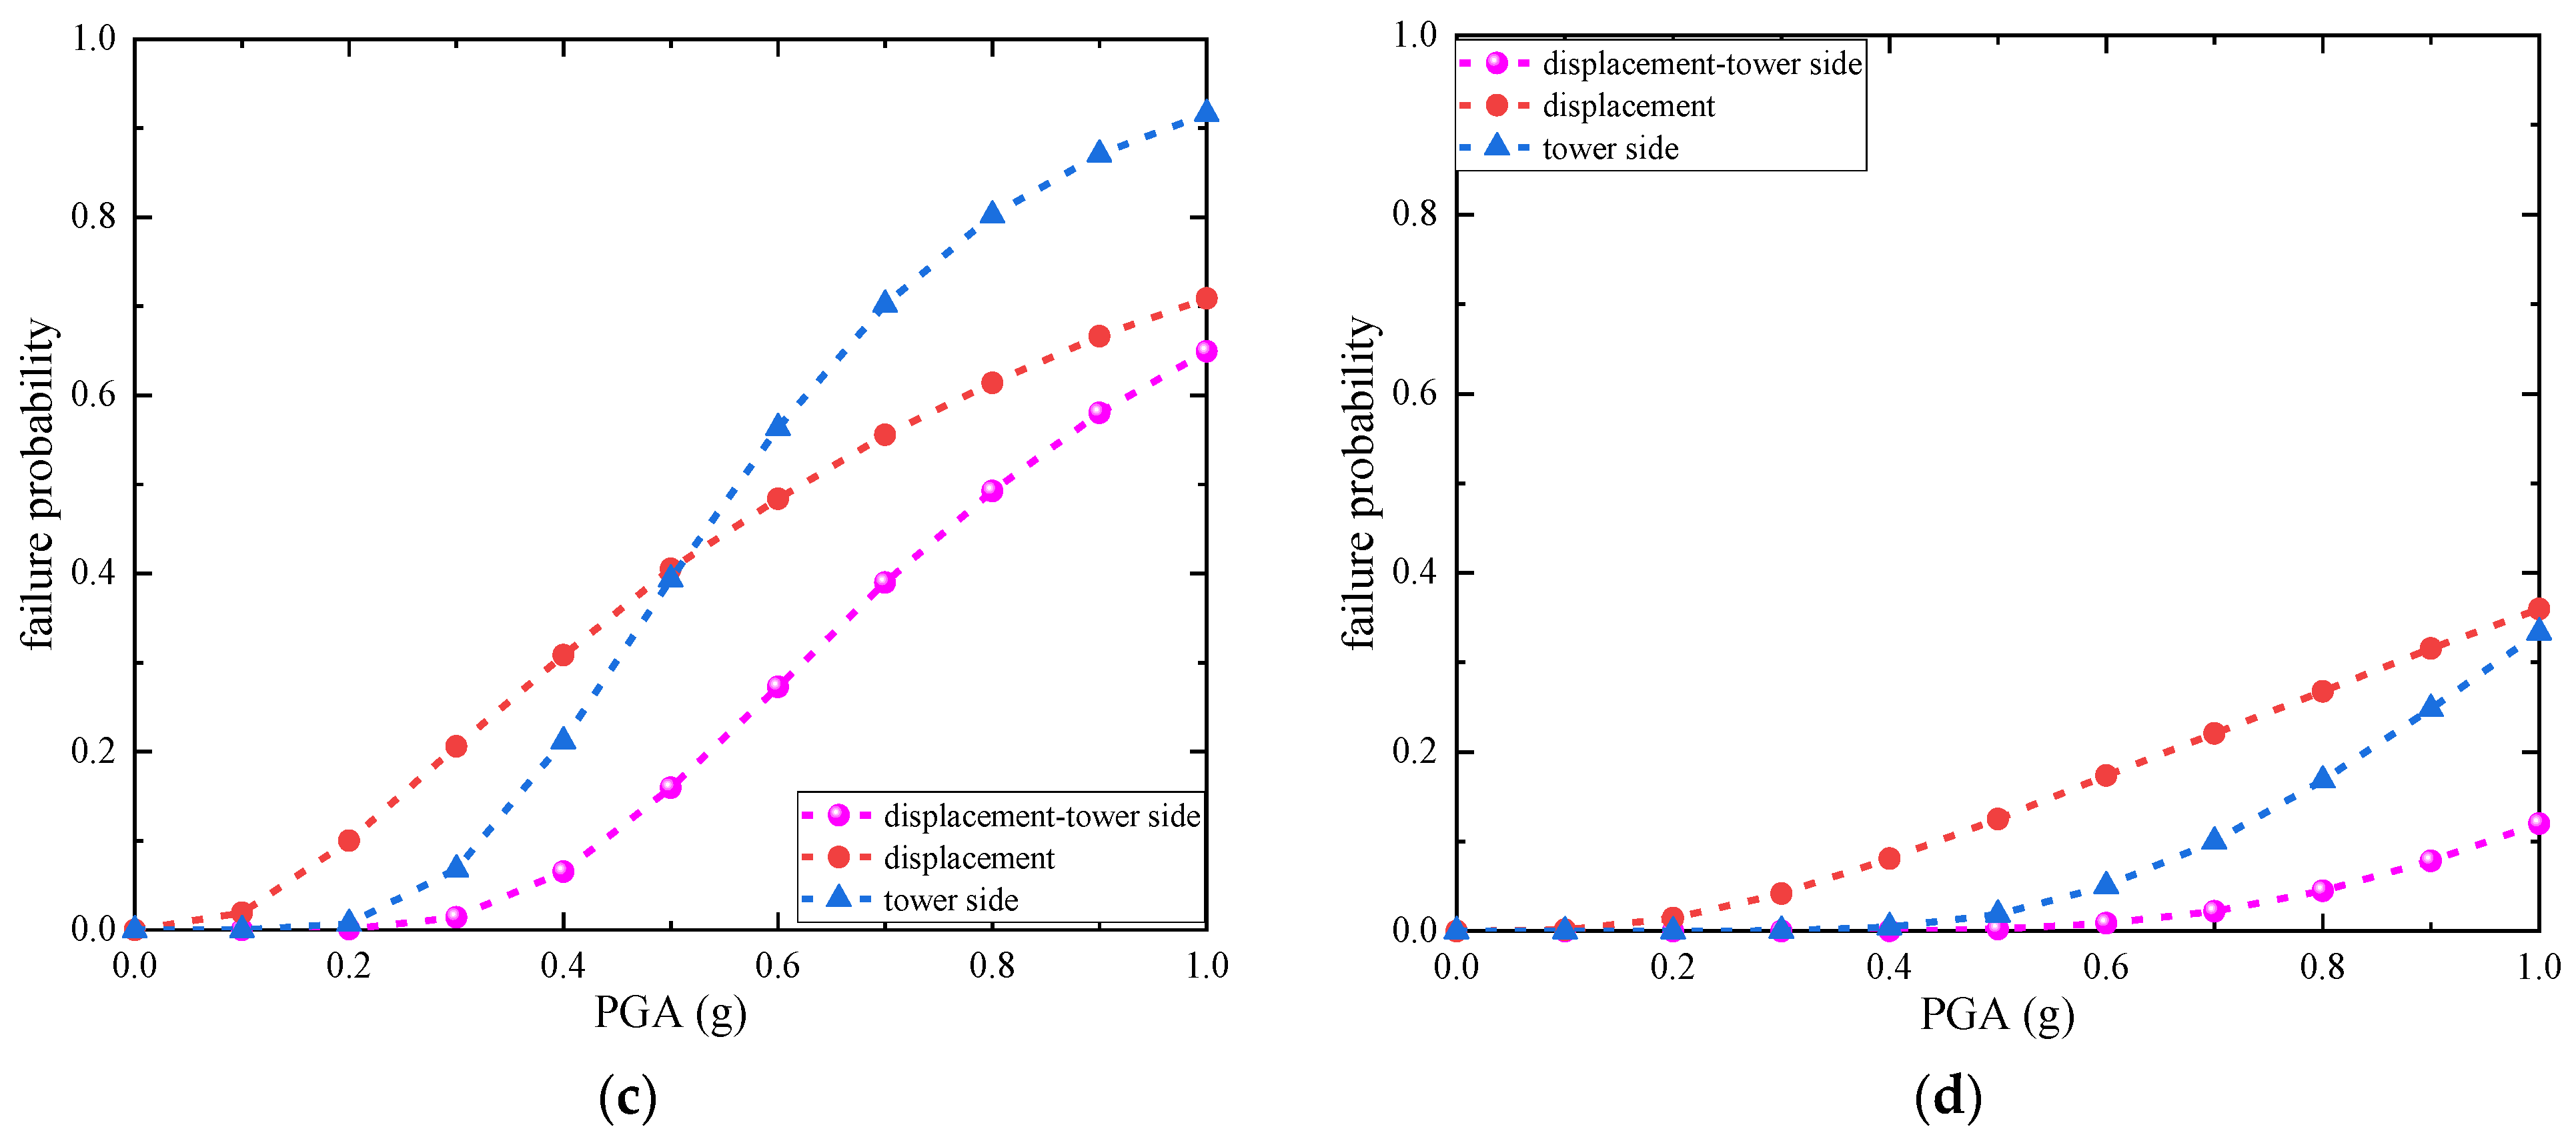
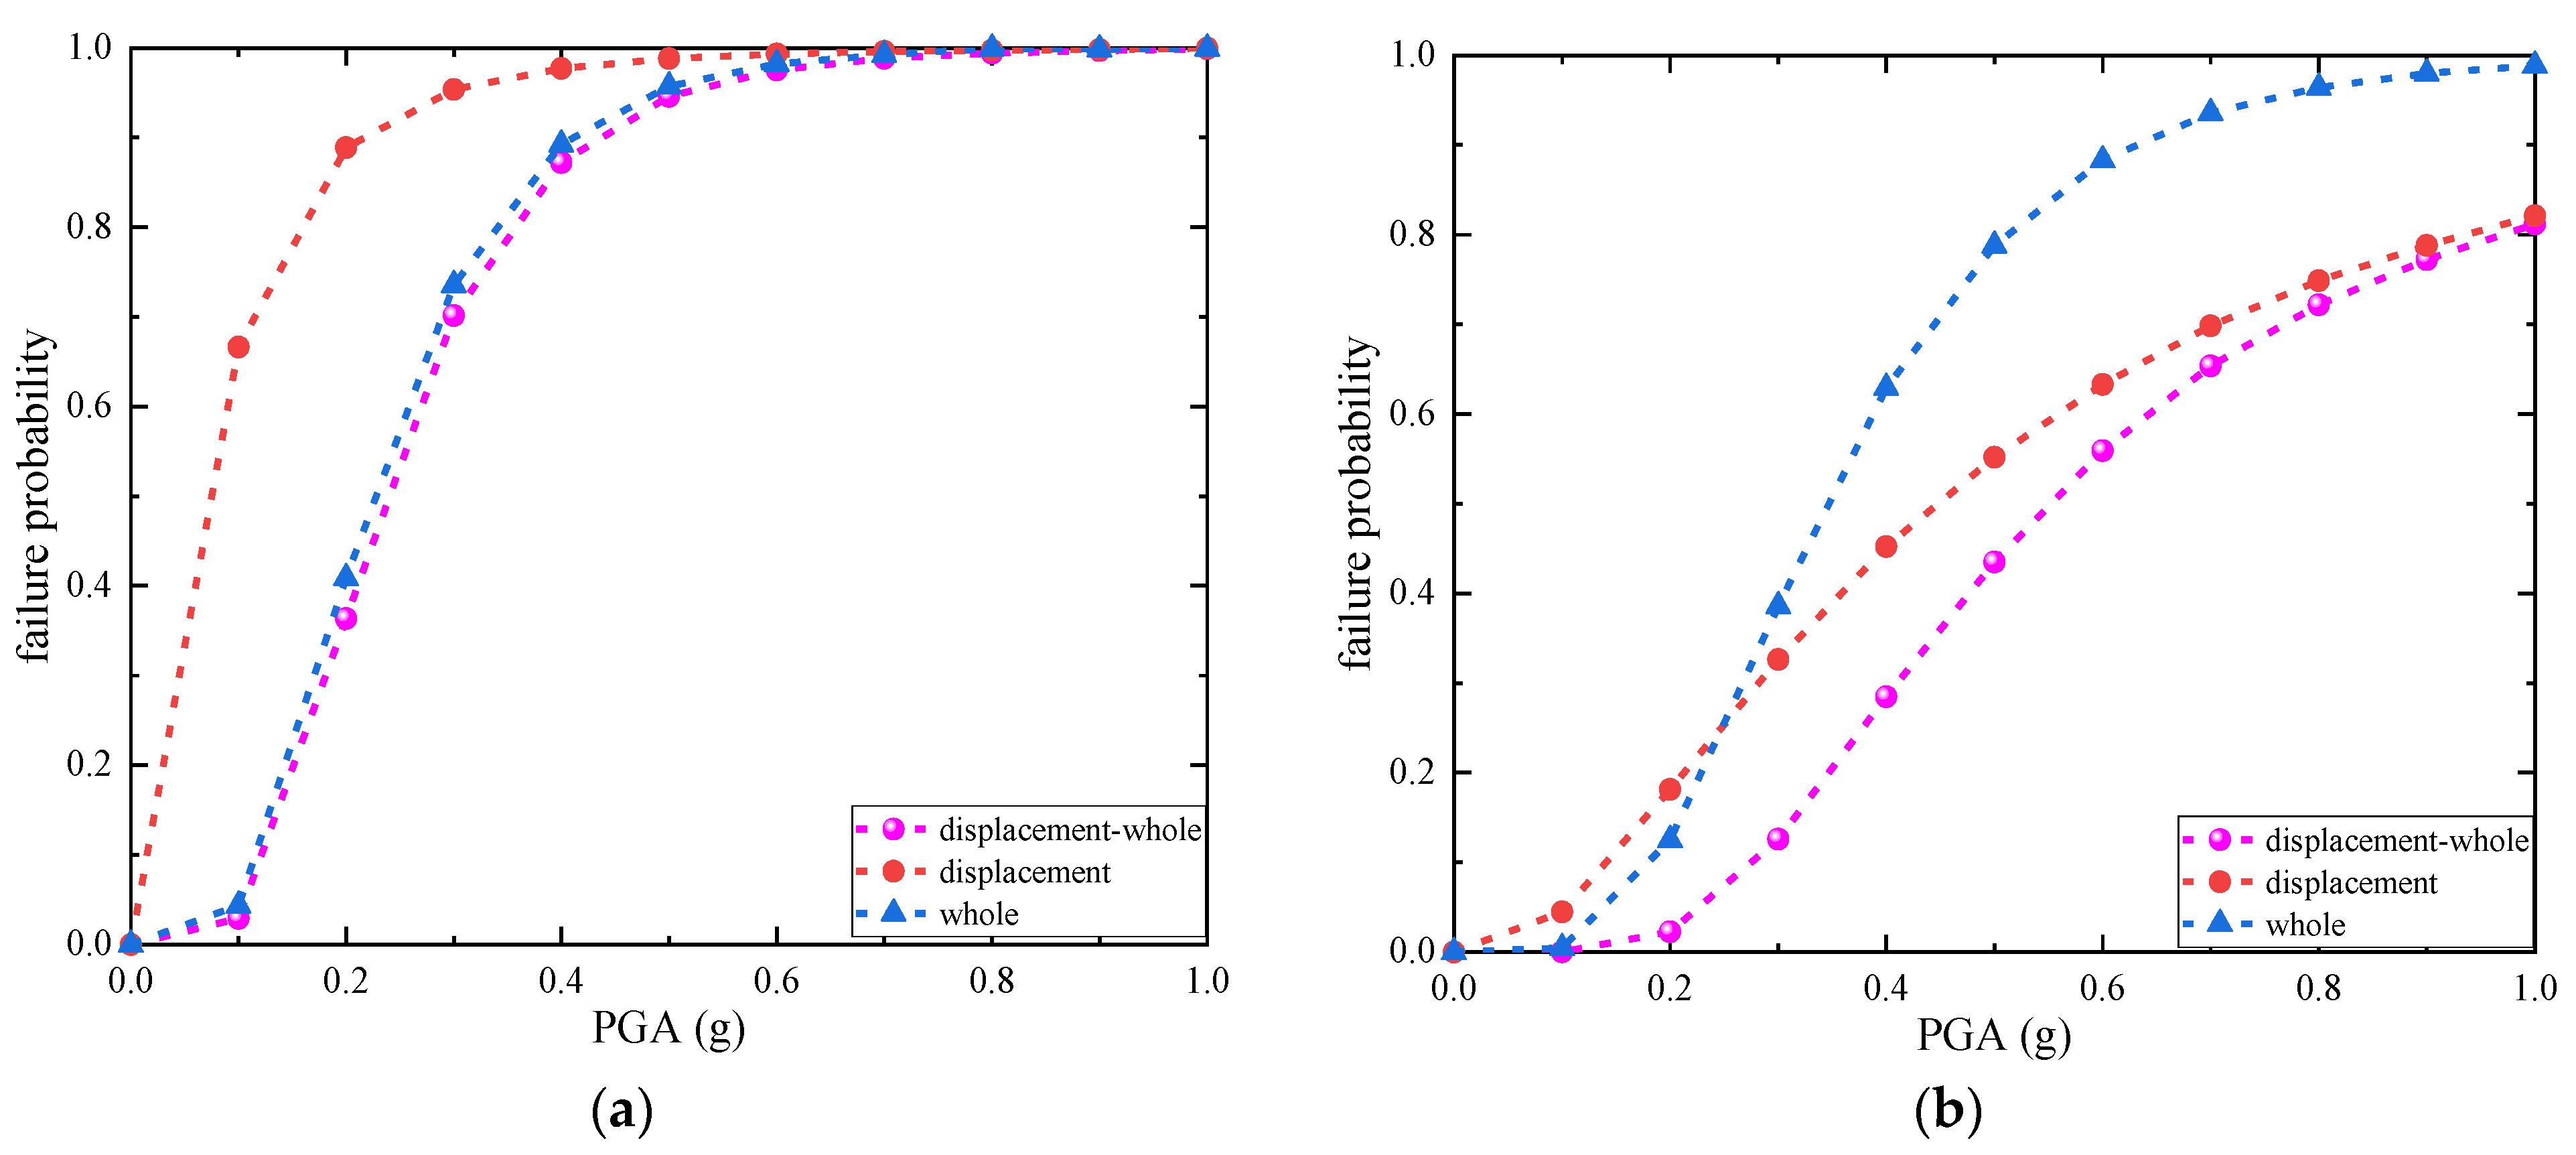
The one- and two-dimensional fragility curves of the maximum displacement of the intake tower structure in the parallel flow direction, with local and overall damage indices for different performance levels, are given in Figure 14, Figure 15, Figure 16 and Figure 17.
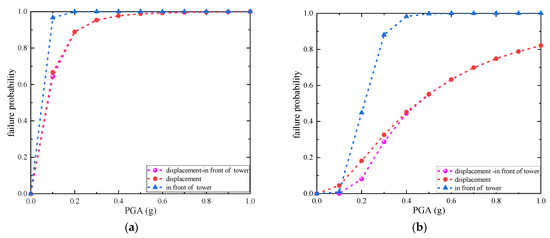
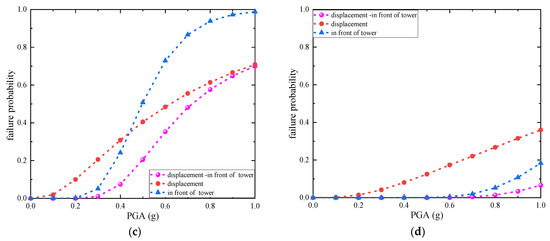
Figure 14.
One-dimensional and two-dimensional fragility curves of maximum displacement and the damage index of the front of the tower. (a) LS1, (b) LS2, (c) LS3, (d) LS4.
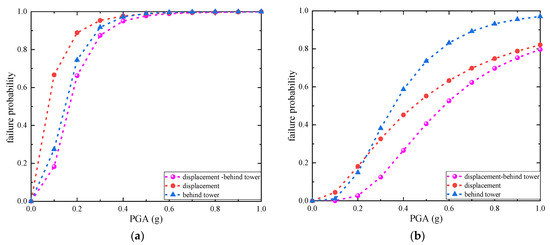
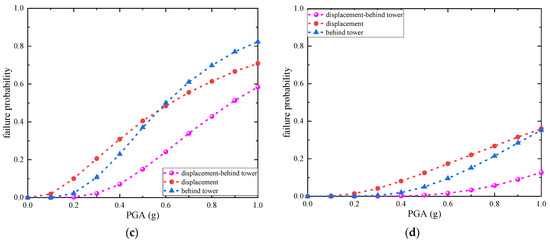
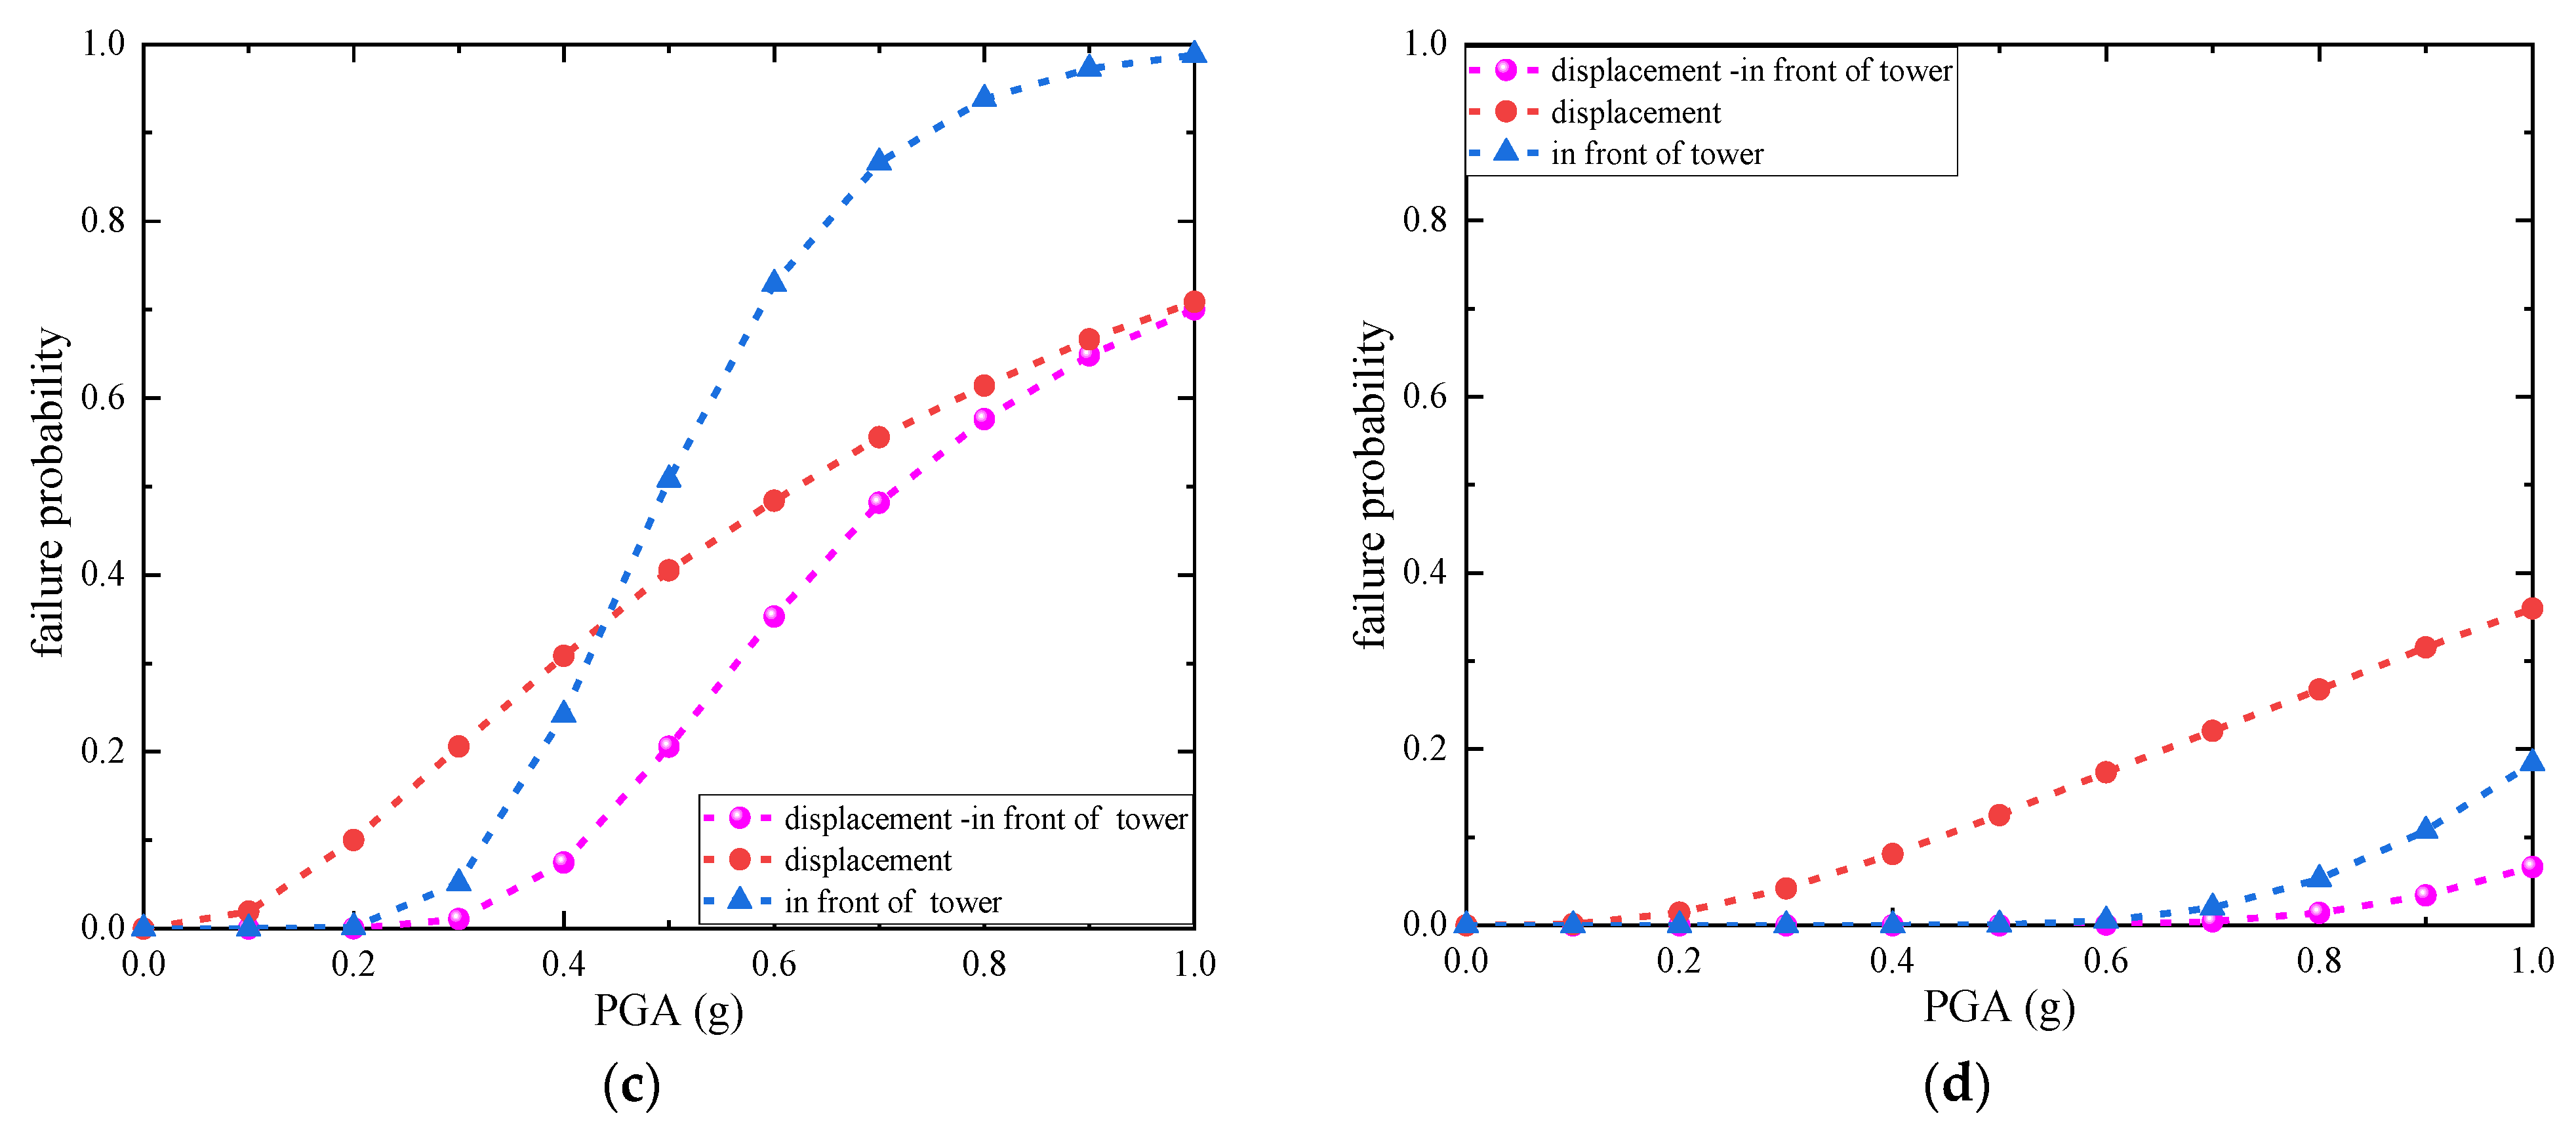
Figure 15.
One-dimensional and two-dimensional fragility curves of the maximum displacement and post-damage index. (a) LS1, (b) LS2, (c) LS3, (d) LS4.

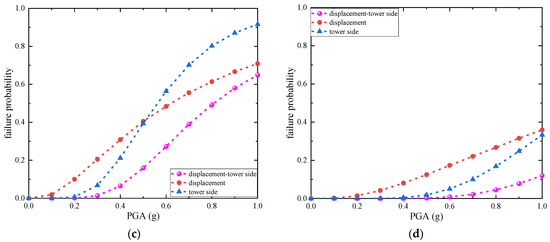
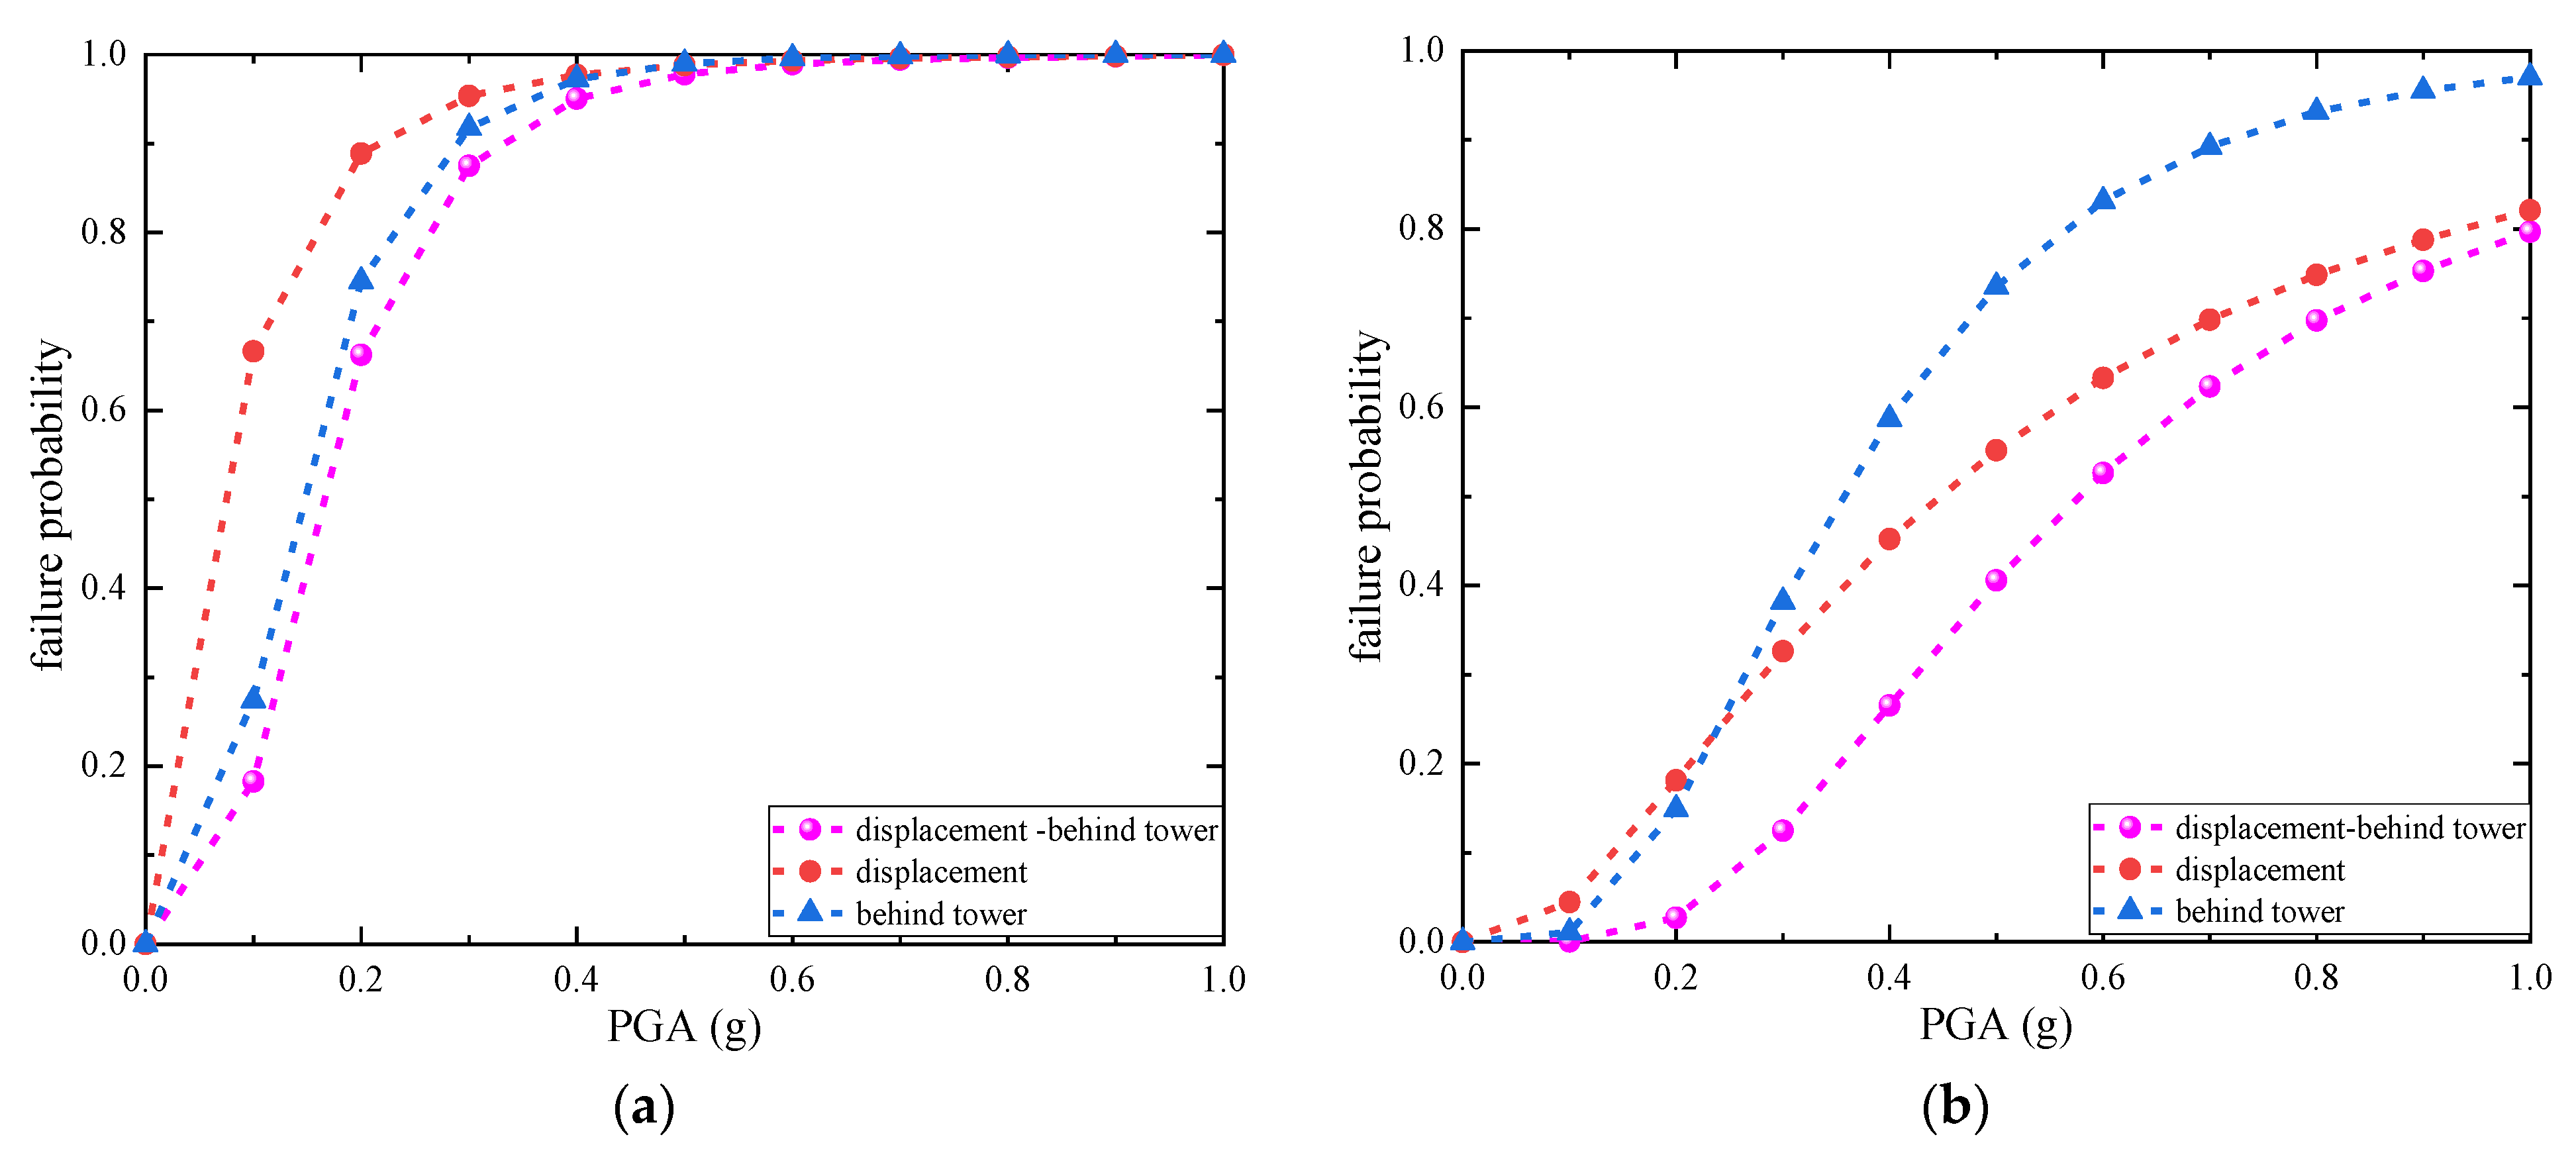
Figure 16.
One-dimensional and two-dimensional fragility curves of maximum displacement and damage index of tower side. (a) LS1, (b) LS2, (c) LS3, (d) LS4.
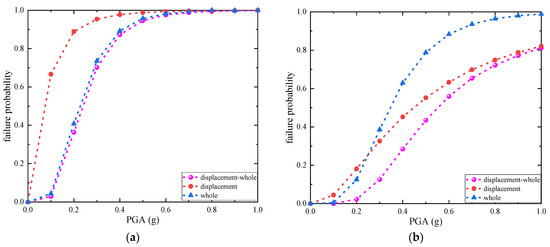
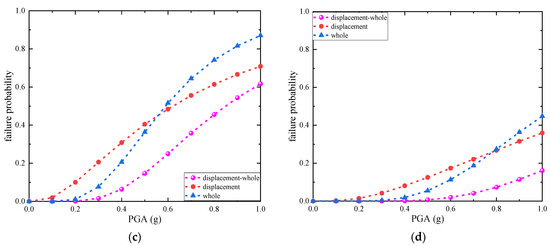
Figure 17.
One-dimensional and two-dimensional fragility curves of maximum displacement and overall damage index. (a) LS1, (b) LS2, (c) LS3, (d) LS4.
As can be seen in Figure 14, under the designed basic seismic acceleration, when the intake tower structure was in the basic intact and slightly damaged state, considering the damage index, the failure probability of the front of the tower was larger than the other two indices. The difference between the failure probability considering the displacement and the damage index of the tower front and the failure probability considering the displacement is very small. When the damage state of the structure entered into the medium level, considering the displacement, the failure probability was larger than the other two indices. However, when the local vibration intensity was greater than two times the designed basic seismic acceleration, and when the intake tower structure had sustained medium-level damage, the failure probability of the tower front was the largest, considering the damage index, and the probability of the other two indices were correlated with the increase in the local vibration intensity.
It can be seen in Figure 15 that, under the designed basic seismic acceleration, the intake tower structure changed from basically intact to completely damaged. Additionally, the failure probability considering only displacement was the largest, followed by the failure probability considering the post-damage index of the tower, and the failure probability considering the above two indices was the smallest. When the structure was in a slightly damaged state, and when the ground-shaking intensity was greater than the designed basic seismic acceleration, the failure probability of the back of the tower, considering the damage index, increased rapidly and exceeded the failure probability considering the displacement. When the damage state of the structure entered into the moderate damage level, the failure probability of the back of the tower only exceeded the failure probability considering displacement when the ground-shaking intensity was greater than three times the designed basic seismic acceleration.
It can be seen from Figure 16 that the displacement fragility curve of the intake tower structure was higher than the other two curves for the whole damage process under the designed basic seismic acceleration. When the structure entered into the slightly damaged level, with an increase in ground-shaking intensity, it appears that the failure probability considering the damage index of the tower side inversely exceeded the failure probability considering the displacement.
6. Conclusions
Based on the seismic probabilistic demand analysis method, the authors of this paper carried out nonlinear dynamic time-course analysis, determined the fragility curves of a water intake tower under different performance levels, and conducted a comparative analysis of various types of fragility curves, obtaining the following conclusions:
- (1)
- Due to the effect of additional mass, the self-oscillation frequency of the water intake tower structure in wet mode is smaller than that in dry mode. When the PGA exceeds 0.3 g, the structure enters the plastic phase and plastic damage begins to occur; the damage mainly occurs on both sides of the tower and at the interface of the backfill concrete and the tower, extending upward.
- (2)
- With increases in seismic acceleration, the probability of failure increases considering both the maximum displacement of the intake tower structure in the parallel flow direction with the local damage index and the overall damage index. Taking the fragility curve under the designed seismic acceleration as an example, the failure probabilities of the intake tower reach LS1 and LS2, in descending order, as follows: displacement with damage on the front of the tower, displacement with damage at the back of the tower, displacement with overall damage, and displacement with damage on the side of the tower. The failure probabilities of the four cases to reach LS3 and LS4 were very small and negligible. The displacements and damage sustained by the intake tower structure after encountering different intensities of seismic action are not negligible.
- (3)
- Under the designed seismic acceleration, the two-dimensional fragility curve of the intake tower structure was lower than the one-dimensional fragility curve; that is, the cumulative failure probability of the two-dimensional fragility analysis was lower than that of the one-dimensional fragility analysis. The results of the designed seismic acceleration of the intake tower structure based on the one-dimensional performance index were unstable; therefore, the maximum displacement and the damage index were considered at the same time to evaluate the safety performance of the intake tower structure under the action of strong earthquakes. In this way, the obtained seismic design results were more reasonable.
Author Contributions
Conceptualization, X.L.; Methodology, X.L.; Validation, Y.L.; Formal analysis, Y.Z. and H.Z.; Investigation, Y.L.; Resources, H.A.; Data curation, Y.Z. and H.Z.; Writing—original draft, Y.Z.; Writing—review & editing, X.L.; Visualization, Y.Z.; Supervision, H.A.; Project administration, H.A.; Funding acquisition, X.L. All authors have read and agreed to the published version of the manuscript.
Funding
This study was financially supported by the National Natural Science Foundation of China (Program No. 51809212).
Data Availability Statement
Data are contained within the article.
Conflicts of Interest
Author Hemin Zhu was employed by the company Ningxia Water Conservancy and Hydropower Survey and Design Institute Company Ltd. The remaining authors declare that the research was conducted in the absence of any commercial or financial relationships that could be construed as a potential conflict of interest.
References
- Zheng, X.; Shen, Y.; Zong, X.; Su, H.; Zhao, X. Dynamic Response Analysis of Intake Tower-Hydrodynamic Coupling Boundary Based on SV Wave Spatial Incidence. Buildings 2023, 13, 1704. [Google Scholar] [CrossRef]
- Chen, X.; Liu, Y.; Zhou, B.; Yang, D. Seismic response analysis of intake tower structure under near-fault ground motions with forward-directivity and fling-step effects. Soil Dyn. Earthq. Eng. 2020, 132, 106098. [Google Scholar] [CrossRef]
- Teymouri, E.; Abbasi, S. Study of the efects of adding vertical stifeners on the frequency and seismic behavior of the cylindrical intake tower, considering the interaction of water and structure. Asian J. Civ. Eng. 2023, 24, 559–578. [Google Scholar] [CrossRef]
- Zhang, H.; Jiang, C.; Liu, S.; Zhang, L.; Wang, C.; Zhang, Y. Shaking-table tests of seismic responses of slender intake tower-hoist chamber systems. Eng. Struct. 2021, 242, 112517. [Google Scholar] [CrossRef]
- Tidke, A.R.; Adhikary, S. Seismic fragility analysis of the Koyna gravity dam with layered rock foundation considering tensile crack failure. Eng. Fail. Anal. 2021, 125, 105361. [Google Scholar] [CrossRef]
- Ashna, K.N.; Maheshwari, P.; Viladkar, M.N. Fragility analysis of a concrete gravity dam under mainshock-aftershock sequences. Structures 2024, 61, 106117. [Google Scholar] [CrossRef]
- Li, Z.; Wu, Z.; Lu, X.; Zhou, J.; Chen, J.; Liu, L.; Pei, L. Efficient seismic risk analysis of gravity dams via screening of intensity measures and simulated non-parametric fragility curves. Soil Dyn. Earthq. Eng. 2022, 152, 107040. [Google Scholar] [CrossRef]
- Hariri-Ardebili, M.A.; Saouma, V. Quantitative failure metric for gravity dams. Earthq. Eng. Struct. Dyn. 2015, 44, 461–480. [Google Scholar] [CrossRef]
- Liang, H.; Tu, J.; Guo, S.; Liao, J.; Li, D.; Peng, S. Seismic fragility analysis of a High Arch Dam-Foundation System based on seismic instability failure mode. Soil Dyn. Earthq. Eng. 2020, 130, 105981. [Google Scholar] [CrossRef]
- Kadkhodayan, V.; Meisam, A.S.; Hasan, M. Seismic Assessment of Arch Dams Using Fragility Curves. Civ. Eng. J. 2015, 1, 14–20. [Google Scholar] [CrossRef]
- Wang, J.-T.; Zhang, M.-X.; Jin, A.-Y.; Zhang, C.-H. Seismic fragility of arch dams based on damage analysis. Soil Dyn. Earthq. Eng. 2018, 109, 58–68. [Google Scholar] [CrossRef]
- Chen, D.; Pan, Z.; Zhao, Y. Seismic damage characteristics of high arch dams under oblique incidence of SV waves. Eng. Fail. Anal. 2023, 152, 107445. [Google Scholar] [CrossRef]
- Chen, K.; Pang, R.; Xu, B. Stochastic dynamic response and seismic fragility analysis for high concrete face rockfill dams considering earthquake and parameter uncertainties. Soil Dyn. Earthq. Eng. 2023, 167, 107817. [Google Scholar] [CrossRef]
- Zhou, Y.; Zhang, Y.; Pang, R.; Xu, B. Seismic fragility analysis of high concrete faced rockfill dams based on plastic failure with support vector machine. Soil Dyn. Earthq. Eng. 2021, 144, 106587. [Google Scholar] [CrossRef]
- Khalid, M.I.; Park, D.; Fei, J.; Nguyen, V.-Q.; Nguyen, D.-D.; Chen, X. Selection of efficient earthquake intensity measures for evaluating seismic fragility of concrete face rockfill dam. Comput. Geotech. 2023, 163, 105721. [Google Scholar] [CrossRef]
- Lin, T.; Baker, J.W. Introducing Adaptive Incremental Dynamic Analysis: A New Tool for Linking Ground Motion Selection and Structural Response Assessment. Civil and Environmental Engineering Faculty Research and Publications. 2013, Volume 40. Available online: https://epublications.marquette.edu/civengin_fac/40 (accessed on 25 July 2024).
- Khanmohammadi, M.; Mazlaghani, Z. Piecewise incremental dynamic analysis (PIDA) based on the vector of intensity measures correlated with the structural responses. Soil Dyn. Earthq. Eng. 2021, 150, 106933. [Google Scholar] [CrossRef]
- Song, P.-Y.; Wang, C.; Sun, Q.-Q. Mainshock-aftershock fragility surfaces analysis of reinforced concrete frame structures using a double incremental dynamic analysis approach. Structures 2023, 56, 104868. [Google Scholar] [CrossRef]
- Liu, X.X.; Wu, Z.-Y.; Liang, F. Multidimensional performance limit state for probabilistic seismic demand analysis. Bull. Earthq. Eng. 2016, 14, 3389–3408. [Google Scholar] [CrossRef]
- Jia, D.-W.; Wu, Z.-Y. Seismic fragility analysis of RC frame-shear wall structure under multidimensional performance limit state based on ensemble neural network. Eng. Struct. 2021, 246, 112975. [Google Scholar] [CrossRef]
- Jia, D.-W.; Wu, Z.-Y. Effect of fuzzy failure criterion on probabilistic seismic risk analysis under multidimensional performance limit state. J. Build. Eng. 2022, 52, 104438. [Google Scholar] [CrossRef]
- NB 35047-2015; Code for Seismic Design of Hydraulic Structures in Hydropower Engineering. National Standards of the People’s Republic of China: Beijing, China, 2015.
- Shome, N. Probabilistic Seismic Demand Analysis of Nonlinear Structures; Stanford University: Stanford, CA, USA, 1999. [Google Scholar]
- Haghgou, H.; Alembagheri, M.; Bigdeli, A. Determination of optimal intensity measure for probabilistic seismic demand analysis of intake towers. Structures 2021, 34, 1998–2013. [Google Scholar] [CrossRef]
- Cornell, C.A.; Jalayer, F.; Hamburger, R.O.; Foutch, D.A. Probabilistic Basis for 2000 SAC Federal Emergency Management Agency Steel Moment Frame Guidelines. J. Struct. Eng. 2002, 128, 526–533. [Google Scholar] [CrossRef]
- Wan, Z. Seismic Vulnerability and Risk Analysis of Frame Structures Based on Probabilistic Damage Model. Master’s Dissertation, Harbin Polytechnic Institute, Harbin, China, 2009. (In Chinese). [Google Scholar]
- GB/T 24335-2009; Classification of Earthquake Damage to Structures. China Earthquake Administration (CEA): Beijing, China, 2009.
- GB/T 17742-2020; China Earthquake Intensity Scale. China Earthquake Administration (CEA): Beijing, China, 2020.
- Yao, X. Performance-Based Seismic Vulnerability Analysis and Seismic Safety Assessment of High-Arch Dams. Ph.D. Dissertation, Zhejiang University, Hangzhou, China, 2013. (In Chinese). [Google Scholar]


Disclaimer/Publisher’s Note: The statements, opinions and data contained in all publications are solely those of the individual author(s) and contributor(s) and not of MDPI and/or the editor(s). MDPI and/or the editor(s) disclaim responsibility for any injury to people or property resulting from any ideas, methods, instructions or products referred to in the content. |
© 2024 by the authors. Licensee MDPI, Basel, Switzerland. This article is an open access article distributed under the terms and conditions of the Creative Commons Attribution (CC BY) license (https://creativecommons.org/licenses/by/4.0/).