Abstract
The revitalization of historic districts is crucial for the sustainable development of cities, with street corner spaces being a vital component of the public space in these districts. However, street corner spaces have been largely overlooked in previous research on crowd dynamics within historic districts. This study investigates the key factors influencing crowd dynamics in street corner spaces within historic districts. First, a hierarchical model of vitality-influencing factors was developed based on prior research. Potential factors influencing the vitality of street corners were quantified using multi-source data collection methods, including deep learning algorithms, and crowd vitality within these spaces was assessed through multidimensional measurements. The impact of each element on crowd vitality was then analyzed through a multivariate linear regression model. The findings revealed that eight factors—corner building historicity, first-floor functional communality, transparency, openness, density of functional facilities, greenness, functional variety of buildings, and walkability—significantly influence the vitality of corner spaces, collectively explaining 77.5% of the vitality of these spaces. These conclusions offer new perspectives and scientific evidence for the revitalization and conservation of historic districts.
1. Introduction
Historic districts represent a crucial aspect of urban cultural heritage, and their revitalization is essential for the sustainable development of cities [1]. As one of the most vibrant micro-public spaces within historic districts, street corners differ from linear street spaces by simultaneously guiding pedestrian flow and gathering crowds [2]. They serve not only as traffic nodes but also as vital spaces for social interaction and cultural expression [3]. Therefore, optimizing street corner spaces has become a crucial strategy for revitalizing historic districts and enhancing their quality in the era of urban regeneration [4]. An in-depth analysis of the factors influencing street corner vitality in historic districts holds significant value for improving both urban space quality and residents’ quality of life.
The relationship between the street environment and the vitality of the crowd has always been a hot issue in urban research. Jacobs believed that the street is the core of the modern city [5] and took the lead in proposing the concept of street vitality. Lynch considered vitality a primary indicator for assessing urban spatial quality [6], while Gehl emphasized that enhancing street vitality is key to improving urban life quality [7]. Urban morphology experts view street vitality as a manifestation of activity stemming from the spatial structure of streets, asserting that the physical environment of buildings and streets shapes and influences street-level life and activity [8]. The current research on the impact of the built environment on street activities is categorized into qualitative and quantitative studies. Qualitative methods include field surveys, questionnaires, and cognitive mapping [9], such as Jalaladdini et al., who analyzed street vitality and its influencing factors using a questionnaire survey [10]. However, qualitative methods are labor-intensive, limited in scale, and often lack timeliness, thus generally serving as a supplement to quantitative approaches.
Quantitative methods dominate the current research. With advancements in computer technology, methods integrating big data and computer vision are increasingly employed in street environment research. The quantitative analysis of the physical environment, incorporating street view images, POI data, and road network information from multi-source datasets, has become a standard approach [11]; additionally, deep learning algorithms for semantic segmentation of street view images and target detection have advanced beyond traditional qualitative methods, enabling the quantification of street environment elements from a human perspective [12], e.g., Hyung-Sup Shin et al. used a semantic segmentation algorithm to process a street view image dataset to anticipate environments suitable for crowd activities [13].
Big data technology is also widely used to measure crowd vitality in urban environments, and the more common methods for obtaining crowd vitality data include population heat maps [14], mobile signal data [15,16], GPS data [17], LBS data [18], Wi-Fi hotspot data [19], traffic trajectory data [20,21], nighttime light data [22,23], and social media data [24]. The above methods can achieve the purpose of obtaining crowd vitality data on a large scale, but they are not precise enough for small-scale studies and singly measure crowd vitality.
Furthermore, mathematical and statistical methods, particularly regression analysis, have been widely adopted in recent years to study the interaction between street vitality and the built environment, valued for their objectivity, clarity, and detail. For example, Sung constructed a multivariate regression model to explore the correlation between pedestrian activities and elements of the built environment in the case of Seoul’s streets [25].
The aforementioned quantitative methods objectively and accurately measure street space attributes and examine the relationship between urban street crowd vitality and its influencing factors from a social perception perspective. In summary, there are abundant research results on the relationship between street environment and crowd vitality; however, the existing studies still have some shortcomings. The current body of research on urban environments has predominantly focused on large- and medium-scale analyses, such as neighborhoods or entire streets, often overlooking the nuanced dynamics of street corner spaces. This oversight is particularly evident in the dearth of studies dedicated to the quantitative analysis of environmental elements and crowd vitality within these micro-scale public spaces. Furthermore, while deep learning algorithms have been instrumental in processing street images for broader urban studies, their application to the quantitative examination of street corner spatial characteristics remains largely unexplored. Similarly, quantitative methods that have been effective in larger contexts, such as big data analytics, have proven inadequate for assessing crowd vitality in small-scale public spaces due to inherent limitations in data precision. Therefore, there is a clear need for the development of tailored quantitative research methods that can accurately capture and analyze the spatial elements and crowd dynamics unique to street corners.
Therefore, this study aims to examine the correlation between spatial environmental elements and crowd vitality on the street corners of historic districts. This study quantitatively analyzes the key spatial elements influencing street corner vitality using multi-source data acquisition and deep learning algorithms, employing a multidimensional, high-precision approach to measure crowd vitality in these spaces, and explores the interaction between spatial elements and crowd vitality in historic district street corners through multiple linear regression models.
2. Research Concepts
2.1. Historic Districts
The concept of historic districts has been clearly defined during the gradual improvement of the cultural heritage protection system. In 1933, the International Institute of Modern Architecture (IIMA) proposed, for the first time, that districts of historical value should be properly preserved, and thus the awareness of historic district protection was formed [26]. In 1987, the International Council on Monuments and Sites (ICOMOS) believed that the contents to be preserved in the historic districts include the pattern and spatial form of the lot and the street and their functions and roles [27]. In 1986, the State Council of China formally put forward the concept of “historic districts”. It was emphasized that historic districts should preserve the historical characteristics of the city in terms of the pattern and style.
The concept of historic districts involved in this study refers to those districts in a city with a relatively high concentration of historic buildings and cultural relics, which more fully reflects the traditional style and the national and regional characteristics of a specific historical period.
2.2. Street Corner Space
Corner space is an integral component of the street and a significant urban public space. Jacobs defines it as a corner intersection [28], while previous studies describe corner space as the public area created by the intersection of two or more streets, bounded by physical elements such as the ground and buildings [2]. In this study, the corner space of the historic district is defined as the public area between the boundary of the sidewalk and the building interface at street intersections, comprising sidewalks, historic building interfaces, and public facilities. Figure 1, for example, is a schematic image defining the scope of a street corner space study.
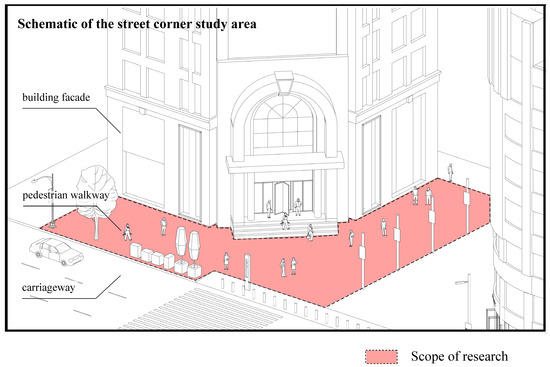
Figure 1.
Schematic of the street corner study area (an example within the Bund district of Shanghai).
3. Influencing Factors of Street Corner Vitality and Selection of Indicators for Crowd Vitality Measurement in Historical Neighborhoods
3.1. Selection of Factors Influencing Crowd Vitality on Street Corners
According to the theory of environmental behavior, the characteristics of the environment will have a significant impact on the activities and behaviors of the crowd [8]. Based on a review of previous studies and street design guidelines, this study examines the factors influencing crowd vitality at street corners in historic districts across four dimensions: historical imagery, architectural function, spatial form, and spatial function. The factors potentially affecting crowd vitality in these spaces are identified.
3.1.1. Historical Imagery
In historic districts, buildings define the vertical enclosure of corner spaces, and their historical quality and imagery influence crowd dynamics. Previous studies have demonstrated that crowd behavior in small-scale public spaces is affected by the characteristics of historic building façades [29]. The historical and cultural connotations, architectural styles, and decorations of buildings influence crowd dynamics and distribution. This study will therefore explore the role of both the historical quality of corner buildings and the aesthetic quality of building façades on crowd dynamics in historic district corner spaces.
3.1.2. Corner Building Functions
A corner space is an area of interaction between roads and buildings, where the first floor of a corner building is directly connected to the space. The public nature of its function significantly influences crowd stay or entry/exit behaviors. Additionally, previous studies have found that functional diversity is one of the most important factors in enhancing the vitality of buildings and their surrounding environments. A variety of building functions not only meets the diverse needs of the crowd but also increases the range of activities in the area, thereby enhancing vitality [30]. Additionally, the functional mix of a building significantly impacts the vitality of both the building and its surrounding environment [31].
3.1.3. Spatial Form of Street Corners
Previous studies have shown that greenery in urban public spaces has various positive effects, such as increasing crowd dwell time by influencing aesthetic perceptions and alleviating psychological stress and anxiety [32]. Enclosure describes how the built environment surrounds pedestrians, influencing their sense of spatial limitation and perceived livability. It is widely used to assess the spatial quality of streets [33]. Additionally, openness refers to the visibility and brightness of the sky, describing the portion of the sky observable from the ground [34]. Street environments with higher degrees of openness have higher levels of attractiveness and comfort [35]. The visual permeability of a building’s ground-floor façade reflects the degree of interaction between the building interface and corner space, which significantly impacts street vitality [36]. Additionally, corner spaces rich in visual elements tend to be more attractive and stimulate greater imagination [37].
3.1.4. Street Corner Space Functions
As part of the street space, the corner space presents the functional attributes of the street, and its functional characteristics also affect the crowd vitality; access is one of the important basic functions of the corner space, while walkability reflects the overall support of the environment for pedestrians. Walkability also reflects people’s perceptions of street safety [38]. Additionally, public facilities in corner spaces, such as seating and vending machines, enhance the spatial function of the corner by promoting crowd retention for rest and social activities, thus influencing crowd vitality. The proximity of the corner to public transportation stations reflects the ease with which crowds can access the corner, which is expected to influence crowd activity.
Based on the relevant influencing factors screened under the four dimensions, a hierarchical model of influencing factors on the vitality of street corners in historic districts was generated as shown in Figure 2.
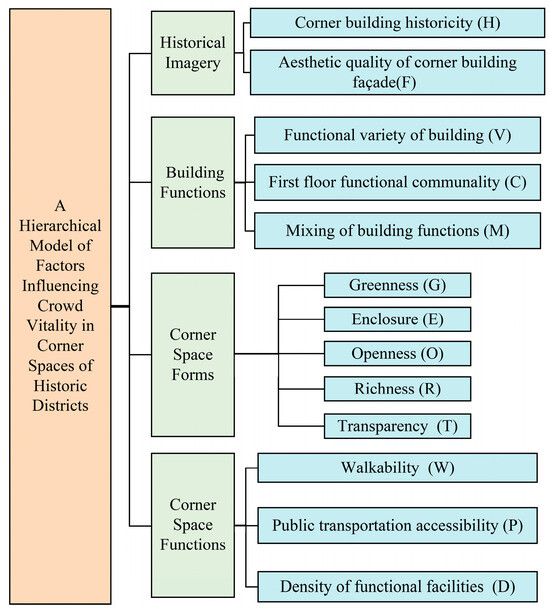
Figure 2.
Hierarchical model of factors influencing the vitality of street corners in historic districts.
3.2. Selection of Indicators for Measuring Crowd Vitality in Street Corner Spaces
Crowd vitality in public space should be measured not only in terms of the number of crowds and the duration of the stay, but should also be evaluated in terms of the composition of the crowd and the type of activity [39]. Through a review of previous research literature and an analysis of the spatial characteristics of street corners, crowd vitality at street corners was measured in four key aspects.
3.2.1. Average Vigor Density and Vigor Stability
Highly concentrated crowd activity in urban space is an important manifestation of urban vitality [40], and the average vitality density is an average measure of the number of active crowds in daily public space, which is one of the important criteria for measuring the vitality of urban space, and the daily average vitality density of the street corner space is taken as an important indicator for measuring the vitality of the crowd in the street corner space.
The stability of crowd vitality is another important metric for assessing public space vitality. The vitality stability indicator reflects the dynamic change in crowd activity density over time [41]. Generally, public spaces with a higher and more stable average vitality density tend to be more attractive and active.
3.2.2. Age Diversity in Active Populations and Diversity of Activity Types
The age composition of the active population in a public space reflects the degree of attractiveness of the space to people of different ages [42], and spaces with a richer and more homogeneous age composition of the active population tend to have a high degree of publicity, convenience, and functional richness and can satisfy the activity needs of people of different ages.
The diversity of activity types reflects the richness of space functions. Gale classifies outdoor activities in public spaces into three types: necessity activities, spontaneous activities, and social activities [43]. A vibrant public space should accommodate all three types of activities simultaneously, with a more even distribution of each activity type.
4. Research Methodology, Sample Selection, Data Sources, and Processing
4.1. Research Methodology and Framework
This study aims to explore the elements that significantly affect crowd vitality at street corners in historic districts. The research framework, as illustrated in Figure 3, first defines the study scope and selects research samples, then identifies and determines the elements affecting street corner vitality and measures of crowd vitality. Subsequently, the data required to quantify the indicators were collected and processed according to their characteristics to derive the values of influencing factors and measures of crowd vitality. Finally, data analysis was performed to model the indicator values and vitality measures using a multiple regression linear equation model in SPSS to identify the factors influencing crowd vitality at street corners in the historic district.
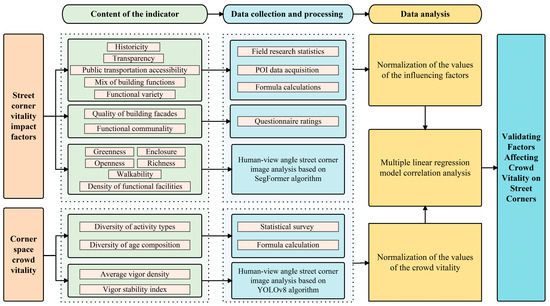
Figure 3.
Research framework.
4.2. Study Area and Sample Selection
4.2.1. Scope of the Study
The study selected a more typical historic district: the Shanghai Bund Historic District, located in the Huangpu District of Shanghai, China (Figure 4), is an important witness to China’s modern history. Since 1843, when the port of Shanghai was officially opened, the Bund area has gradually become the financial center of the whole of China and even of the Far East. By the 1850s, the basic pattern of streets and neighborhoods in the Shanghai Bund area was established, as shown in Figure 5. The historical buildings and street patterns of the Bund have preserved the historical characteristics of Shanghai in a specific period. Currently, the Shanghai Municipal Planning and Resource Management Department has organized the preparation of a conservation plan for the Bund Historical and Cultural Landscape Protection Zone and has divided the architectural conservation levels according to the quality of the historical buildings in the historic district (Figure 6). As shown in Figure 6, the relevant authorities have categorized the buildings in the Bund area into five levels of protection based on their historical value, providing a more official and authoritative reference for determining the historical value of the buildings.
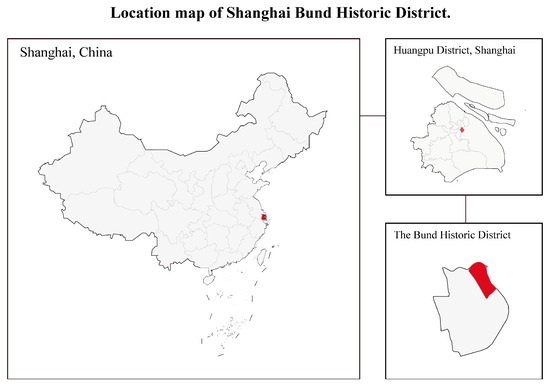
Figure 4.
Location map of Shanghai Bund Historic District.
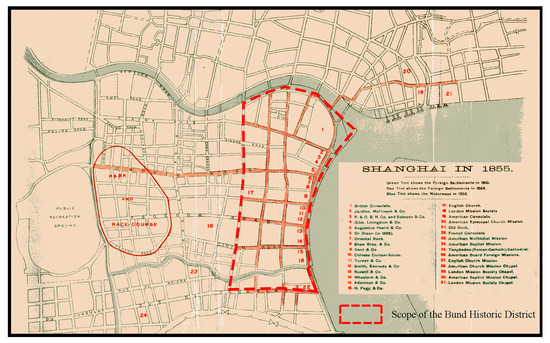
Figure 5.
Map of the Bund in Shanghai in 1885 with a schematic representation of the study area (Source from “A Short History of Shanghai” by H. Pott, redrawn by the author).
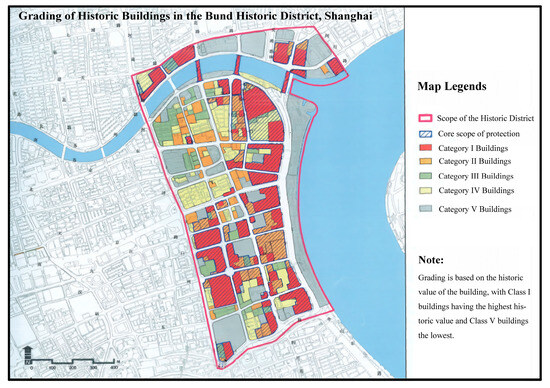
Figure 6.
Historic building grading and conservation plan for the Bund Historic District (Source from Xu, Li-Xun [44] Redrawn by the author).
4.2.2. Study Sample Selection
In the Bund Historic District, street corner samples were selected for the study. Firstly, the streets and street blocks in the Bund Historic District of Shanghai were sorted out and counted, with a total of 33 street blocks and 131 street corners, and to avoid duplication of data caused by the same location of indicators, a more typical street corner was selected at each road intersection, and a total of 44 representative street corners were selected as the study samples (Figure 7). In Figure 7, the study area of the Bund Historic District is clearly defined, with all street blocks and street corners within the area numbered and the locations of selected corner samples indicated.
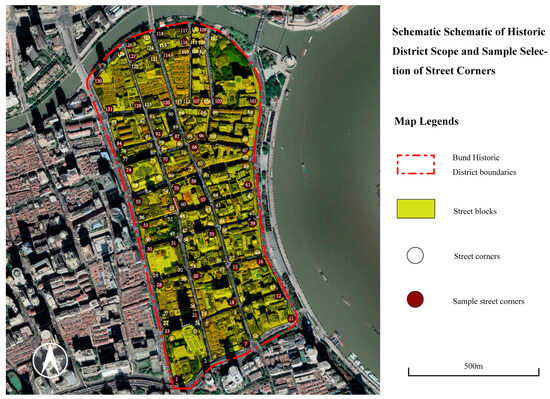
Figure 7.
Schematic diagram of the selection of the study sample within the study area. (The numbers represent the identification numbers for each street corner sample).
4.3. Data Sources
4.3.1. Network Access
The collection of open-source data and information on the Internet included gathering the conservation plan map of Shanghai for the Bund Historic District to determine the historical quality grading of the buildings within the district (Figure 6). Parallel to the architectural analysis, an automated web crawler was deployed to extract Point of Interest (POI) data from within the study area, utilizing the open platform of Gaode Map. This crawler was designed to systematically navigate the platform’s API, identifying and cataloging a variety of POIs that represent different functional uses of the buildings, such as commercial, residential, and recreational spaces. The data extraction process involved filtering the POIs based on their categories, operational status, and user ratings, which are indicative of the functional diversity and activity levels within the district.
4.3.2. Questionnaires
To address indicators that are not readily quantifiable through objective data collection methods, a questionnaire survey was employed. Two different questionnaires were designed to address different aspects of the spatial characterization of street corners.
For assessing the aesthetic quality of street corner building facades, a questionnaire was designed with a 5-point Likert scale. Thirty architecture and urban planning experts were invited to score based on predefined criteria, ensuring their responses were aligned with professional standards. For the indicator measuring the publicity of the building’s first floor, a user group questionnaire was developed. During field surveys, 179 questionnaires were distributed to street corner space activists and frequent visitors, resulting in 170 valid responses, which corresponds to a 95% validity rate. The questionnaire included a mix of multiple-choice and open-ended questions to capture a comprehensive view of user experiences.
Data from the expert questionnaires were analyzed using descriptive statistics, calculating mean scores and standard deviations for each facade quality attribute. User questionnaire responses were compiled and content analyzed to categorize and quantify feedback on first-floor functionalities. The truncated mean was applied to each indicator to provide a robust central tendency estimate, mitigating the impact of outliers.
The reliability of the expert questionnaire was measured with Cronbach’s alpha, yielding a coefficient of 0.85, indicating good internal consistency. Content validity was confirmed through a review by three independent subject matter experts. This detailed methodology ensures, to the extent possible, the credibility and accuracy of the questionnaire approach to quantifying the corresponding indicator.
4.3.3. Field Surveys and Manual Statistics
To address data acquisition for specific elements in the Bund Historic District of Shanghai, field research was conducted from 17 to 23 July 2023, focusing on manual photo-taking and the assessment of the transparency indicator. A DSLR camera was used for detailed imaging of street corners, capturing architectural details and public spaces at different times of the day. A laser distance meter was employed to measure the dimensions necessary for calculating the transparency index, which is vital for evaluating the visual openness of the area.
Data were recorded using tablets with a custom app for note-taking and geotagging photos, ensuring standardized observations. Privacy was respected, and informed consent was obtained where required. The photos were organized and analyzed for metadata extraction.
4.3.4. Machine Learning Processing of Street Corner Images
Through computer deep learning algorithms, urban environmental elements were identified and extracted from street view images, and then evaluate the urban physical environment [37]. From 17 July to 23 July 2023 (one full week), the street corner images of 44 sample street corners selected within the study area were photographed from the human eye viewpoint on weekdays and days off in the morning and afternoon, a total of 616 photographs were collected, the images of each sample street corner in different periods were organized, and the images and data statistics using deep learning algorithms were processed (Figure 8 and Figure 9). Among them, Figure 8 illustrates the methodological framework of the deep learning algorithm used in the study for processing street corner images, and Figure 9 shows the processing results of some sample images.
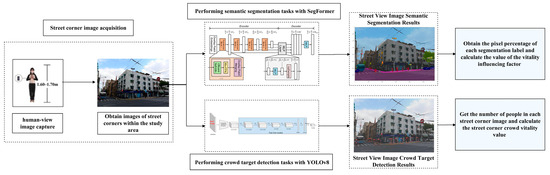
Figure 8.
Deep learning street corner image processing framework diagram.
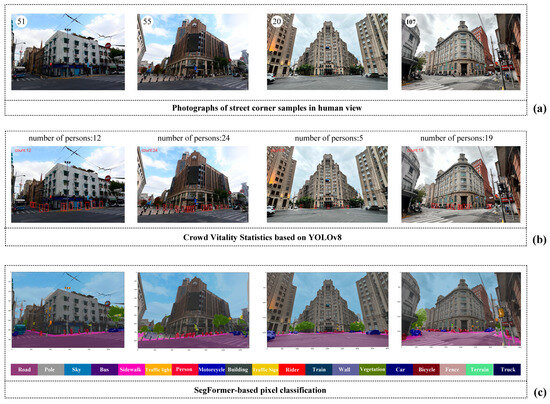
Figure 9.
Results of deep learning algorithm processing of some sample street corner images: (a) sample images of selected street corners taken from a human-view angle; (b) crowd target detection results based on the YOLOv8 algorithm; (c) semantic segmentation results of samples based on the SegFormer algorithm.
The SegFormer algorithm [45], which performs better in terms of efficiency, accuracy, and robustness in the street view segmentation task, was selected and the Cityscapes training dataset was used to identify and segment a variety of environmental elements such as greenery, pedestrian walkway facilities, motorized traffic, buildings, and traffic signs in a total of 19 elements in the street view image, and the segmentation results were labeled with different colors (Figure 9), and scripts were written to count the pixel share of different elements in the street corner human-view image as the raw data for metric quantification [12].
The YOLOv8 algorithm [46], which has better crowd target detection ability, was chosen to detect crowd targets in the captured street corner images, and the number of crowds in each sample street corner image at different moments was counted and recorded, which was used as the raw data to analyze the average vitality density of the street corners and the vitality steadiness index.
4.4. Data Processing Methods and Results
4.4.1. Street Corner Vitality Influencing Factors
In this study, we comprehensively evaluated the quality of street corners by examining various indicators, including historical imagery, building functions, space forms, and functional aspects of the corner spaces.
The historical imagery of street corner buildings was assessed through two main indicators: the historical degree of the corner building and the aesthetic quality of the building façade. The historical degree was determined based on the official classification of the building’s historical significance (Figure 4), while the façade quality was evaluated by experts, with scores ranging from 1 to 5 points for each indicator.
Building functions were analyzed by considering the first-floor functional communality, functional variety of the building, and building functional mixing degree. The first-floor functional publicity was measured using population questionnaire scores, while the diversity and mixing degree of building functions were calculated from Point of Interest (POI) raw data. The specific methodologies for these calculations are detailed in Table 1.

Table 1.
Content, quantification, and interpretation of indicators.
The forms of street corner spaces were evaluated based on indicators such as greenness, enclosure, openness, richness, and transparency. These indicators were calculated following the study by Xiangyuan Ma et al. [12], using the statistical results from the semantic segmentation data of street corner images. The richness indicator was determined by the number of different scene elements recognized by semantic segmentation, and transparency was calculated using measured data from actual research [36].
Lastly, the functionality of corner spaces was assessed by considering the accessibility of public transportation and walkability. Public transportation accessibility was defined by the number of stops (bus and subway) within a 400 m radius of the corner, as this distance is generally considered comfortable for walking [47]. Walkability was quantified by the proportional relationship between the sidewalk and the overall road, calculated from the pixel share values identified through semantic segmentation [12]. Additionally, the density of street functional facilities was determined by the pixel share of these facilities in the semantic segmentation results of the street corner images.
The specific quantification methodology or equation for each indicator is shown in Table 1.
According to the quantitative method in the above table, 13 indicator values of 44 sample street corners of historical neighborhoods were calculated, and descriptive statistics based on the raw data were obtained. The results are shown in Table 2:
Table 2.
Descriptive statistical results of quantitative values of indicators.
According to the results of descriptive statistics, different indicators have different magnitudes and large differences in values, which will affect the results of data analysis, to eliminate the influence of the magnitude between indicators. The raw data were standardized to solve the problem of comparability. After processing, the indicators were in the same order of magnitude, restricted to the interval [0, 1], thus eliminating the adverse effects caused by singular sample data and facilitating comprehensive comparison and data analysis [48,49]. In this study, the Min–Max standardization method was used for indicator data processing with the following equation [50]:
where x represents an individual data point and min(x) denotes the smallest value present, while max(x) signifies the largest value. The term x′ is the standardized data.
The raw data for each indicator underwent a rigorous process of standardization and calculation. Following this, the data were meticulously sorted and categorized to ensure clarity and comparability. Subsequently, a series of cluster bar charts were employed to represent the statistical outcomes of the standardized data graphically. These visual representations are detailed in Figure 10, Figure 11, Figure 12 and Figure 13.
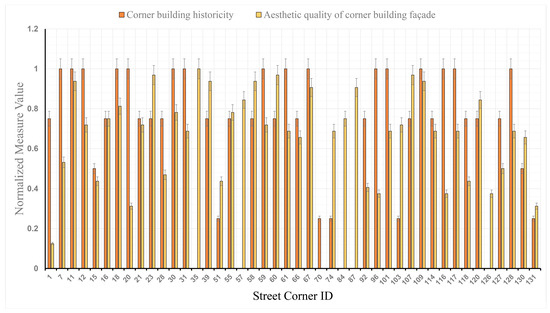
Figure 10.
Historical imagery indicator values for corner buildings.
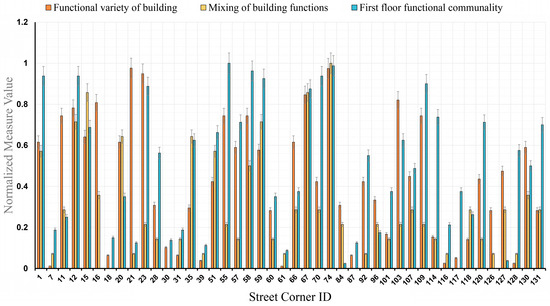
Figure 11.
Corner buildings functional indicator values.
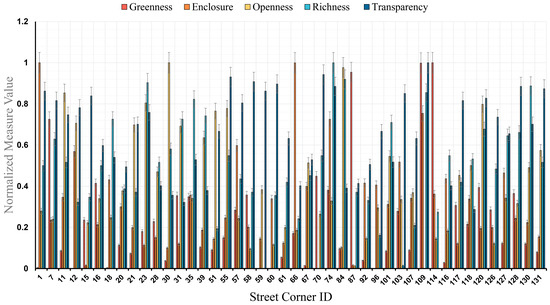
Figure 12.
Spatial form indicator values for street corners.
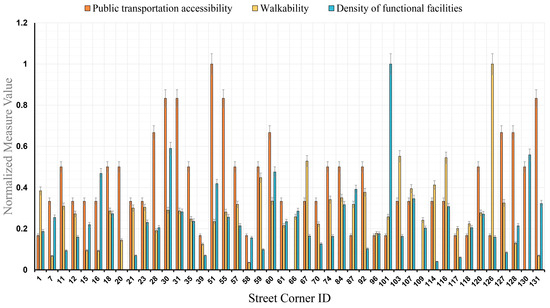
Figure 13.
Street corner spatial functional indicator values.
4.4.2. Measurement of Crowd Vitality in Street Corner Spaces
Previous on-site surveys or low-precision big data survey methods are not suitable for conducting vitality research on small public spaces such as street corners. This study combines the characteristics of small-scale street corners and poor precision of big data quantification, extracts the vitality characteristics of crowd activities from street corner photographs taken at different periods from the perspective of human viewpoints, and comprehensively evaluates the vitality of crowds in street corner spaces from four indicators, namely, average vitality density, vitality steadiness, diversity of age composition of crowds, and diversity of types of activities. The coefficient of variation method was used to assign weights to each indicator [51] and then weighted and summed to obtain the final comprehensive vitality value to realize a more efficient and fine-grained people-oriented vitality assessment. The specific content of the vitality measurement indicators, the calculation formula and interpretation, and the weighting content of each indicator are organized, as shown in Table 3.
Table 3.
Quantitative methods for measuring crowd vitality in street corner spaces.
(I) Average vigor density and vigor stability
The number of active people in the area obtained by using the YOLOv8 target detection algorithm to detect and count the collated street corner images serves as the raw data for the average vitality density and vitality stability index (Figure 9), in which the average vitality density represents the average number of active people in the street corner space of the study sample in different survey periods (Table 3), and the vitality stability index reflects the population activity density in different periods. Dynamic changes, using the inverse indicator of the standard deviation of vitality density of each research unit in the specified period, expresses that the larger the value, the more stable the crowd vitality of the street corner space. Calculation of vigor stability begins with the calculation of the general and mean values of the standard deviation of crowd density, with the following equation [41]:
In Equation (17), σ is the standard deviation of the population density, is the mean of the standard deviation of the population density, m is the number of photographs sampled per day for each street corner sample during the survey period, Di is the density of vitality in each street corner photograph, is the average density of vitality, and n in Equation (18) is the total number of days of the survey. In this study, m = 2 (photographs taken every day in the morning and in the afternoon for each sample corner) and n = 7 (five working days and two rest days in a week). The maximum value of the general value of the standard deviation of population density σmax and the minimum value of σmin were averaged with the standard deviation of population density to calculate the value of the vitality stability index using Equation (13).
(II) Diversity of age composition of the population
The age composition of the street activity crowd can reflect the vitality diversity of the street corner space to a certain extent. The study assessed demographic diversity by counting people in four age groups in 14 photos per street corner. Age groups were identified using visual cues and verified manually for accuracy. The proportion of each age group was calculated against the total number of people. Statistical analysis included calculating mean proportions and standard deviations to assess data variability. Results are shown in cluster bar charts (Figure 14). The proportion of people of different ages in each street corner sample was used as raw data and the diversity of age composition of the population was calculated according to Equation (15).
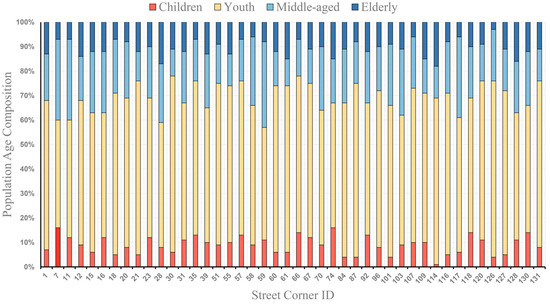
Figure 14.
Street corner activity population age composition.
(III) Diversity of activity types
The vitality of street corner public spaces is characterized by a variety of activities that engage pedestrians. Following Jan Gehl’s urban design principles, these activities are categorized into three distinct types: necessity, spontaneity, and social interaction [39]. To assess the diversity of activities, a systematic approach was taken, with 14 photographs taken at each street corner at various times throughout the day. Each photo was manually analyzed to tally the number of activities within Gehl’s categories. Trained observers used a standardized checklist during this process to ensure the data collected was consistent and precise. The activity types and their respective proportions for each street corner sample were recorded, and the results were presented in Figure 15. The percentage data obtained was then utilized to calculate a diversity index of activity types using the Shannon–Weiner Index formula, as shown in Equation (16).
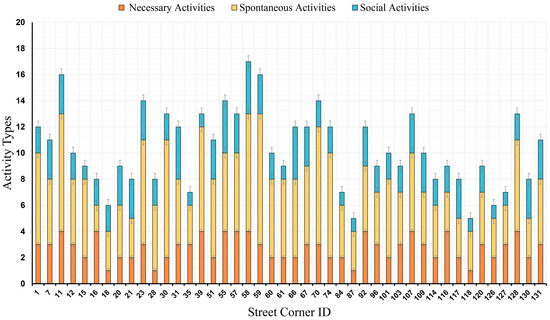
Figure 15.
Street corner activity types of the crowd.
(IV) Calculation of crowd vitality measures for street corner spaces
To facilitate the statistical analysis of the data, the specific values of the four indicators of vitality measurements were processed using the coefficient of variation method to obtain the corresponding weights [51]. The four index values were weighted to obtain the vitality index VI (vitality index) of the street corner space, and the calculation equation is as follows:
The values of the four indicators, average vitality density, vitality stability index, diversity of age composition, and diversity of activity types for the 44 street corner samples were standardized using Equation (12), and then weighted according to Equation (19) to obtain the integrated vitality index value VIi for each street corner sample. The calculation results were visualized using the bar chart shown in Figure 16.
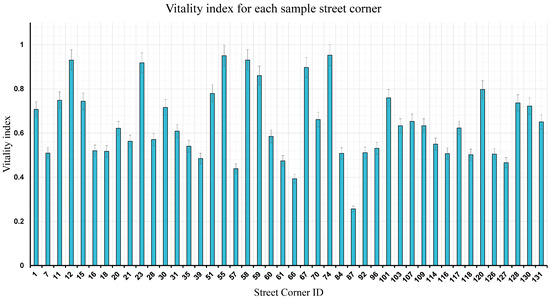
Figure 16.
Vitality index for each sample street corner.
4.4.3. Multiple Linear Regression Analysis
A multiple linear regression mathematical model was used to analyze the correlation between indicator variables that may affect the vitality of street corners in historic districts and the vitality of street corners in historic districts and to analyze the degree of influence of each variable on the vitality of street corners [52].
First, the vitality value of the street corner samples was used as the dependent variable in the multiple linear regression model; the 13 normalized values of each street corner sample that may affect the street corner vitality indicators were used as independent variables, and statistical analysis was performed using the multiple regression analysis function in the SPSS statistical software to validate the relationship between the dependent variable and the many independent variables [53]. Second, model characteristics such as multicollinearity and residuals were examined to determine the applicability of the model based on the computational results output by the software. Third, the regression model between the independent and dependent variables was obtained through significance analysis and mathematical transformation, and the regression model was interpreted to determine the exact relationship between the influencing factors and the vitality of the crowd on the street corners of the historic district.
After calculation, in the regression model, as shown in Table 4, the coefficient of determination (R) was 0.918 and the adjusted R-squared value was 0.775. It indicates that there was a significant correlation between the dependent and independent variables and that the independent variable explained 77.5% of the causes of change in the dependent variable, i.e., 77.5% of the street corner activeness was influenced by the 13 spatial element indicators selected. The standard error of 0.093 indicated that the model predicts accurately and the Durbin–Watson value of 1.792 indicated that there was no significant autocorrelation between the residuals. Analysis of variance (ANOVA) indicated that the model was valid with a p-value of less than 0.001, i.e., it was highly statistically significant at the 0.05 level of significance. In addition, the histogram of residuals (Figure 17) showed that the mean of residuals in this case was normally distributed, satisfying the normality condition. The results of the scatter plot (Figure 18) showed that the standardized residuals were uniformly distributed around the value of 0 above and below, and there was no significant autocorrelation between the residuals. In summary, the regression model had high explanatory power and significance, and the independent variables had a significant effect on the dependent variable.
Table 4.
Results of variables of the linear regression model.
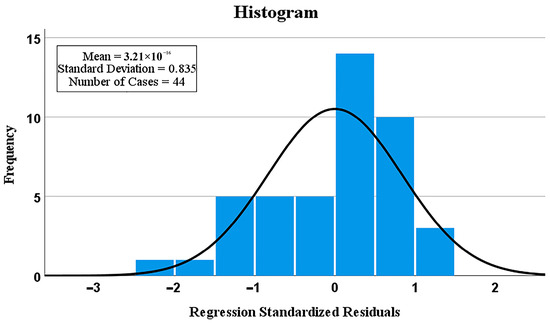
Figure 17.
Histogram of residuals. (Bar charts show residual frequencies per interval. The line indicates the normal distribution of residuals.)
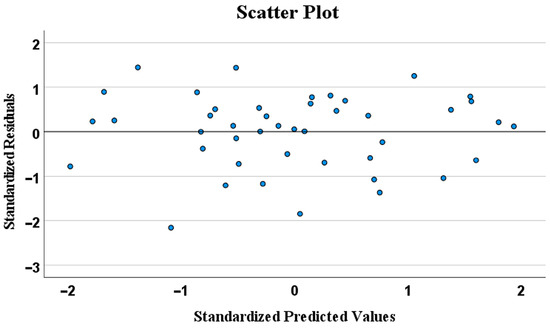
Figure 18.
Scatterplot of residuals.
The regression model coefficients were calculated, as shown in Table 5, where the standardized coefficient Beta value reflects the degree of influence of each independent variable x on y. The significance p-value reflects the significance of the influence of the independent variable on the dependent variable; when p < 0.05, it means that the corresponding independent variable significantly influences the dependent variable, and the VIF value reflects the multicollinearity relationship between the independent variables.
Table 5.
Coefficient results.
The calculation results showed that among the 13 elemental indicators that may affect the vitality of street corners in historic districts, corner building historicity (H), functional variety of building (V), first-floor functional communality (C), greenness (G), openness (O), transparency (T), walkability (W), and density of functional facilities (D), a total of eight indicator contents had a significant effect on street corner vitality (p < 0.05). The VIF values of this model were less than 5, indicating that the problem of multicollinearity was not serious and the model estimation results were reliable.
The estimated regression equation resulting from the analysis was as follows:
The above equation expressed the quantitative influence relationship of the eight significant indicators on the vitality of street corners in historic districts, and based on the standardized coefficients corresponding to the significant indicators, the degree of influence of each indicator on the vitality of street corners was calculated [54], and the results of the calculations were summarized in Table 6. To present the validity and characteristics of the established multiple linear regression model more intuitively and comprehensively, the parameters of each predictor variable and their respective impacts on vitality were summarized and categorized. This process resulted in the regression model parameter diagram depicted in Figure 19.
Table 6.
The degree to which variables affect crowd vitality on the street corner.
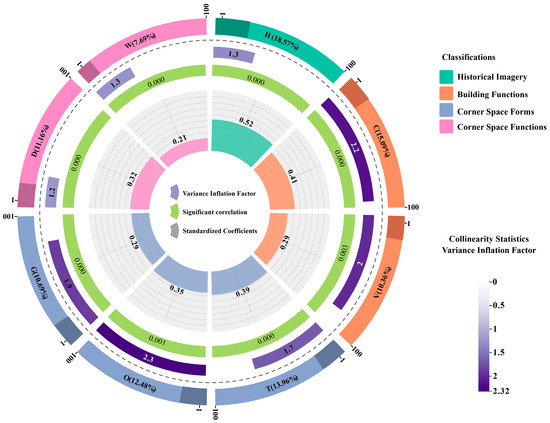
Figure 19.
Model regression parameter diagram.
As shown in Figure 19, all eight influences had a positive effect on the vitality of the street corner crowd in the following order: corner building historicity (18.57%) > first-floor functional communality (15.09%) > transparency (13.96%) > openness (12.48%) > density of functional facilities (11.16%) > greenness (10.69%) > functional variety of building (10.36%) > walkability (7.69%), with the most significant impacts on the vitality of people at street corners being the history of the corner building (18.57%) and the functional public nature of the first floor (15.09%). Walkability (7.69%) had the least effect.
5. Discussion
Based on the data results of the study, as a key element of corner spaces in historic districts, the form and function of corner buildings significantly influence crowd vitality (44.02%). In particular, the tourist nature of the Bund Historic District in Shanghai amplifies the impact of the historical quality of corner buildings on crowd vitality (18.57%). During the field research, it was also found that stopping in front of the historic buildings, filming, and talking were the main types of lingering activities. This finding aligns with previous studies [29]. To enhance corner vitality, the preservation measures for historic buildings should be strengthened to ensure their historical qualities are maintained [27]. Additionally, when the public accessibility and functional diversity of a corner building’s first floor are higher, crowd frequency increases, thereby enhancing the vitality of the corner space [30]. The public accessibility of the first floor should be enhanced by adding functions such as cafés, bookstores, and exhibition spaces to further engage the public and promote crowd vitality in corner spaces [41].
The form of corner spaces accounts for 37.13% of the influence on crowd vitality, with interface transparency being the most influential factor (13.96%). Corner spaces with highly transparent building interfaces tend to attract crowds, encouraging them to linger and engage in activities. Using transparent or semi-transparent materials to improve building interface transparency can increase the visibility and interactivity of the corner space, attracting pedestrian attention and prolonging their stay [36]. Additionally, more open corner spaces (12.48% impact) and those with higher green visibility (10.69% impact) are associated with increased crowd activity. These two indicators influence spatial vitality by affecting visual perception and psychological states. Increasing the openness of corner spaces and introducing more green elements, such as trees, lawns, and vertical greening, can significantly enhance corner vitality [12].
The functional influence of corner spaces on crowd vitality is 18.85%, with the density of functional facilities accounting for 11.16%. Functional facilities (e.g., street furniture, landscape elements) in corner spaces impact crowd activities by enhancing the space’s convenience and capacity for longer stays [2]. To enhance corner vitality, additional street furniture, such as chairs and art installations, should be incorporated, providing spaces for rest and socialization. Additional facilities, such as vending machines and signage, can further enhance the convenience and attractiveness of corner spaces [42]. Walkability (7.69%) primarily reflects pedestrian access to corner spaces and is the least influential of the eight factors [12].
At the same time, there are limitations in the current study. Filming and field surveys of street corner spaces are conducted manually, limiting continuous data collection over extended periods. However, the research includes a one-week sampling period covering both weekdays and weekends, ensuring significant and representative temporal coverage. Processing street corner images with deep learning algorithms offers advantages, such as speed and objectivity, but also presents limitations. The limitations include information loss and the restricted applicability of certain indicators. Not all indicators are identifiable, definable, or calculable through deep learning algorithms. For instance, because of the accuracy limitations of semantic segmentation algorithms, transparency indicators must be obtained through manual measurement of basic data. Additionally, target detection faces challenges in accurately identifying the age characteristics of people in street corner photographs.
Consequently, future research should focus on increasing time efficiency, refining data collection methods, and broadening the scope of spatial element indicators. Additionally, subsequent studies should not only build upon the current framework but also evaluate its applicability in various urban environments and augment the dataset to improve the model’s predictive accuracy.
6. Conclusions
In urban conservation and revitalization, this study addresses a pivotal yet often overlooked aspect: the micro-scale dynamics of street corner spaces in historic districts. This research sheds light on the subtle interplay of factors contributing to the vitality of these spaces, thereby addressing a gap in the current scholarly discourse. An integrated approach was employed, utilizing various data sources to construct a nuanced model for assessing street corner vitality. The model is underpinned by field research capturing the essence of on-ground interactions, complemented by an expansive repository of web-based open-source data. Additionally, computerized deep-learning analyses were applied to quantify and interpret the spatial characteristics of street corners. Through multiple linear regression, the analysis identified the spatial elements exerting significant influence on street corner vitality. The regression model revealed the presence and magnitude of each element’s effect on crowd vitality.
It was found that corner building historicity, first-floor functional communality, transparency, openness, density of functional facilities, greenness, functional variety of building, and walkability have a significant impact on the vitality of the crowd in the corner space of the historic district, which can explain 77.5% of the vitality of the crowd in the corner space of the historic district.
The findings enrich quantitative research on micro-street environments and provide actionable insights. They shed light on the multifaceted nature of street corner spaces and emphasize their critical role in energizing historic neighborhoods. Thus, this research contributes a more comprehensive understanding of how small urban elements can significantly impact larger urban systems. Additionally, due to the generalizability and transferability of the indicators used in this study, the workflow remains applicable to similar research topics and holds value for reference and replication.
In essence, this study serves as a call to action for urban planners, conservationists, and researchers alike. It highlights the transformative potential of street corner spaces and encourages a reevaluation of strategies for preserving and enhancing the vitality of historic districts.
Author Contributions
Conceptualization, J.Z. and Z.W.; investigation and software, Z.W. and M.L.; methodology, data curation, validation, Z.W.; writing—original draft preparation, Z.W.; writing—review and editing, J.Z. and Z.W.; visualization, Z.W. All authors have read and agreed to the published version of the manuscript.
Funding
This research received no external funding.
Data Availability Statement
The original contributions presented in the study are included in the article. Further inquiries can be directed to the corresponding author.
Conflicts of Interest
The authors declare no conflicts of interest.
References
- Lyu, Y.; Abd Malek, M.I.; Jaafar, N.H.; Sima, Y.; Han, Z.; Liu, Z. Unveiling the potential of space syntax approach for revitalizing historic urban areas: A case study of Yushan Historic District, China. Front. Archit. Res. 2023, 12, 1144–1156. [Google Scholar] [CrossRef]
- Hu, Y.; Gan, Y.; Kang, Z. Spatial Vitality and Influencing Factors at Corners of Commercial Streets: A Tianjin Case Study. South Archit. 2023, 40–48. [Google Scholar]
- Herriott, R. The topological relations of corner buildings at street junctions. J. Archit. Urban. 2016, 40, 322–334. [Google Scholar] [CrossRef][Green Version]
- Sun, Y.; Wang, Y.; Dai, D. From the direction to the path: Reflections on the development of urban street in my country. J. Archit. 2020, 154–158. [Google Scholar]
- Jacobs, J. The Death and Life of Great American Cities; Vintage Books: New York, NY, USA, 2012. [Google Scholar]
- Lynch, K. Good City Form; Design; MIT Press: Cambridge, MA, USA, 1984. [Google Scholar]
- Gehl, J.; Kaefer, L.J.; Reigstad, S. Close encounters with buildings. Urban Des. Int. 2006, 11, 29–47. [Google Scholar] [CrossRef]
- Racine, F. Developments in urban design practice in Montreal: A morphological perspective. Urban Morphol. 2016, 20, 122–137. [Google Scholar] [CrossRef]
- Sung, H.G.; Go, D.H.; Choi, C.G. Evidence of Jacobs’s Street life in the great Seoul city: Identifying the association of physical environment with walking activity on streets. Cities 2013, 35, 164–173. [Google Scholar] [CrossRef]
- Jalaladdini, S.; Oktay, D. Urban public spaces and vitality: A socio-spatial analysis in the streets of Cypriot towns. Procedia-Soc. Behav. Sci. 2012, 35, 664–674. [Google Scholar] [CrossRef]
- Ma, Z. Deep exploration of street view features for identifying urban vitality: A case study of Qingdao city. Int. J. Appl. Earth Obs. Geoinf. 2023, 123, 103476. [Google Scholar] [CrossRef]
- Ma, X.; Wu, C.; Xi, Y.; Yang, R.; Chen, Z. Measuring human perceptions of streetscapes to better inform urban renewal: A perspective of scene semantic parsing. Cities 2021, 110, 103086. [Google Scholar] [CrossRef]
- Shin, H.S.; Woo, A. Analyzing the effects of walkable environments on nearby commercial property values based on deep learning approaches. Cities 2024, 144, 104628. [Google Scholar] [CrossRef]
- Zikirya, B.; He, X.; Li, M.; Zhou, C. Urban food takeaway vitality: A new technique to assess urban vitality. Int. J. Environ. Res. Public Health 2021, 18, 3578. [Google Scholar] [CrossRef] [PubMed]
- Jia, C.; Liu, Y.; Du, Y.; Huang, J.; Fei, T. Evaluation of urban vibrancy and its relationship with the economic landscape: A case study of Beijing. ISPRS Int. J. Geo-Inf. 2021, 10, 72. [Google Scholar] [CrossRef]
- Liu, S.; Zhang, L.; Long, Y.; Long, Y.; Xu, M. A new urban vitality analysis and evaluation framework based on human activity modeling using multi-source big data. ISPRS Int. J. Geo-Inf. 2020, 9, 617. [Google Scholar] [CrossRef]
- Delclòs-Alió, X.; Gutiérrez, A.; Miralles-Guasch, C. The urban vitality conditions of Jane Jacobs in Barcelona: Residential and smartphone-based tracking measurements of the built environment in a Mediterranean metropolis. Cities 2019, 86, 220–228. [Google Scholar] [CrossRef]
- Yue, W.; Chen, Y.; Thy, P.T.M.; Fan, P.; Liu, Y.; Zhang, W. Identifying urban vitality in metropolitan areas of developing countries from a comparative perspective: Ho Chi Minh City versus Shanghai. Sustain. Cities Soc. 2021, 65, 102609. [Google Scholar] [CrossRef]
- Kim, Y.L. Seoul’s Wi-Fi hotspots: Wi-Fi access points as an indicator of urban vitality. Comput. Environ. Urban Syst. 2018, 72, 13–24. [Google Scholar] [CrossRef]
- Zeng, P.; Wei, M.; Liu, X. Investigating the spatiotemporal dynamics of urban vitality using bicycle-sharing data. Sustainability 2020, 12, 1714. [Google Scholar] [CrossRef]
- Ta, N.; Zeng, Y.; Zhu, Q.; Wu, J. Analysis of the relationship between built environment and urban vitality in central Shanghai based on big data. Sci. Geogr. Sin. 2020, 40, 60–68. [Google Scholar]
- Zhang, Y.; Shang, K.; Shi, Z.; Wang, H.; Li, X. Spatial pattern of the vitality of Chinese characteristic towns: A perspective from nighttime lights. Land 2022, 11, 85. [Google Scholar] [CrossRef]
- Kim, Y.L. Data-driven approach to characterize urban vitality: How spatiotemporal context dynamically defines Seoul’s nighttime. Int. J. Geogr. Inf. Sci. 2020, 34, 1235–1256. [Google Scholar] [CrossRef]
- Huang, B.; Zhou, Y.; Li, Z.; Song, Y.; Cai, J.; Tu, W. Evaluating and characterizing urban vibrancy using spatial big data: Shanghai as a case study. Environ. Plan. B Urban Anal. City Sci. 2020, 47, 1543–1559. [Google Scholar] [CrossRef]
- Sung, H.; Lee, S. Residential built environment and walking activity: Empirical evidence of Jane Jacobs’ urban vitality. Transp. Res. Part D Transp. Environ. 2015, 41, 318–329. [Google Scholar] [CrossRef]
- Corbusier, L.; Eardley, A. The Athens Charter; Grossman Publishers: New York, NY, USA, 1973; p. 88. [Google Scholar]
- Kolonias, S.A. Charter for the Conservation of Historic Towns and Urban Areas (Washington 1987); Springer: New York, NY, USA, 2014. [Google Scholar]
- Jacobs, A.B. Great Streets; No. qt3t62h1fv; University of California Transportation Center: Berkeley, CA, USA, 1993. [Google Scholar]
- Mao, Y.; Qi, J.; He, B.J. Impact of the heritage building façade in small-scale public spaces on human activity: Based on spatial analysis. Environ. Impact Assess. Rev. 2020, 85, 106457. [Google Scholar] [CrossRef]
- Wang, C.; Wang, B.; Wang, Q.; Lei, Y. Nonlinear associations between urban vitality and built environment factors and threshold effects: A case study of central Guangzhou City. Prog. Geogr. 2023, 42, 79–88. [Google Scholar] [CrossRef]
- Ye, Y.; Zhuang, Y.; Zhang, L.; van Ness, A. A Morphological Inquiry into Vitality Creation in Urban Design—Based on Quantitative Analysis of Urban Spatial Morphological Characteristics and Examination of Residents’ Activities. Int. Urban Plan. 2016, 31, 26–33. [Google Scholar]
- Lu, Y. Using Google Street View to investigate the association between street greenery and physical activity. Landsc. Urban Plan. 2019, 191, 103435. [Google Scholar] [CrossRef]
- Wang, R.; Lu, Y.; Zhang, J.; Liu, P.; Yao, Y.; Liu, Y. The relationship between visual enclosure for neighbourhood street walkability and elders’ mental health in China: Using street view images. J. Transp. Health 2019, 13, 90–102. [Google Scholar] [CrossRef]
- Li, X.; Cai, B.Y.; Ratti, C. Using street-level images and deep learning for urban landscape studies. Landsc. Archit. Front. 2018, 6, 20–30. [Google Scholar] [CrossRef]
- Tang, J.; Long, Y. Measuring visual quality of street space and its temporal variation: Methodology and its application in the Hutong area in Beijing. Landsc. Urban Plan. 2019, 191, 103436. [Google Scholar] [CrossRef]
- Chen, Y.; Zhao, X. A study on street subterranean interface based on pedestrian’s perspective—A case study of Huaihai Road in Shanghai. Urban Plan. 2014, 38, 24–31. [Google Scholar] [CrossRef]
- Lynch, K. The image of the city (1960). In Anthologie zum Städtebau. Band III: Vom Wiederaufbau nach dem Zweiten Weltkrieg bis zur Zeitgenössischen Stadt; Gebr. Mann Verlag: Regensburg, Germany, 2023; pp. 481–488. [Google Scholar]
- Ewing, R.; Handy, S. Measuring the unmeasurable: Urban design qualities related to walkability. J. Urban Des. 2009, 14, 65–84. [Google Scholar] [CrossRef]
- Gehl, J. Life between Buildings; The Danish Architectural Press: Copenhagen, Denmark, 2011. [Google Scholar]
- Yin, J.X. Summary of research methods on urban space vitality. Sichuan Arch. 2019, 39, 54–57. [Google Scholar]
- Liu, S.; Lai, S. Influence Factors of Urban Public Space Vitality Based on Multi-source Data: A Case Study of Huangpu River Waterfront Area of Shanghai. Landsc. Archit. 2021, 28, 75–81. [Google Scholar]
- Mao, Z.R.; Chen, X.K.; Xiang, Z.H.; Chen, Y.R. Research on the measurement and influencing factors of street vigour in historic districts: A case study of Wenming Street historic district in Kunming. South Archit. 2021, 4, 54–61. [Google Scholar]
- Zhang, L.; Pei, T.; Chen, Y.; Song, C.; Liu, X. A review of urban environmental assessment based on street view images. J. Geo-Inf. Sci. 2019, 21, 46–58. [Google Scholar]
- Xu, L. The Bund Building No. 12—A Representative Architecture of the Historical and Cultural Style Protection Area of the Bund in Shanghai. Available online: http://www.pipcn.com/research/201012/14594.htm (accessed on 7 August 2024).
- Xie, E.; Wang, W.; Yu, Z.; Anandkumar, A.; Alvarez, J.M.; Luo, P. Segformer: Simple and efficient design for semantic segmentation with transformers. Adv. Neural Inf. Process. Syst. 2021, 34, 12077–12090. [Google Scholar]
- Varghese, R.; Sambath, M. YOLOv8: A Novel Object Detection Algorithm with Enhanced Performance and Robustness. In Proceedings of the 2024 International Conference on Advances in Data Engineering and Intelligent Computing Systems (ADICS), Chennai, India, 18–19 April 2024; IEEE: Piscataway, NJ, USA, 2024. [Google Scholar]
- Sharifi, A. From Garden City to Eco-urbanism: The quest for sustainable neighborhood development. Sustain. Cities Soc. 2016, 20, 1–16. [Google Scholar] [CrossRef]
- Sharma, A.; Singh, S. A review on data normalization techniques in data mining. Int. J. Comput. Sci. Inf. Secur. 2017, 15, 1–6. [Google Scholar]
- Han, J.; Kamber, M.; Pei, J. Data Mining: Concepts and Techniques; Elsevier: Amsterdam, The Netherlands, 2011. [Google Scholar]
- Cabello-Solorzano, K.; Ortigosa de Araujo, I.; Peña, M.; Correia, L.; J Tallón-Ballesteros, A. The impact of data normalization on the accuracy of machine learning algorithms: A comparative analysis. In Proceedings of the 18th International Conference on Soft Computing Models in Industrial and Environmental Applications, Salamanca, Spain, 5–7 September 2023; Springer Nature: Cham, Switzerland, 2023; pp. 344–353. [Google Scholar]
- Yu, S.; Ding, H.; Zeng, Y. Evaluating water-yield property of karst aquifer based on the ahp and cv. Sci. Rep. 2022, 12, 3308. [Google Scholar] [CrossRef]
- Oliveira Neto, E.A.; Gonçalves, L.; Moreira, F.; Santana, W.; Maués, L.M. Assessment of the Influence of Contracting Models on the Well-Being of Construction Workers in the Brazilian Amazon. Buildings 2024, 14, 2539. [Google Scholar] [CrossRef]
- Kafle, S.C. Correlation regression analysis using SPSS. Manag. Technol. Soc. Sci. 2019, 126. Available online: https://journal.oxfordcollege.edu.np/file/1681898552journal-1.pdf#page=126 (accessed on 7 August 2024).
- Whang, S.W.; Park, K.S.; Kwon, C. Influence of aesthetic design elements on residential satisfaction in apartment Based on Seoul apartment complex. J. Asian Archit. Build. Eng. 2024, 23, 1381–1392. [Google Scholar] [CrossRef]


Disclaimer/Publisher’s Note: The statements, opinions and data contained in all publications are solely those of the individual author(s) and contributor(s) and not of MDPI and/or the editor(s). MDPI and/or the editor(s) disclaim responsibility for any injury to people or property resulting from any ideas, methods, instructions or products referred to in the content. |
© 2024 by the authors. Licensee MDPI, Basel, Switzerland. This article is an open access article distributed under the terms and conditions of the Creative Commons Attribution (CC BY) license (https://creativecommons.org/licenses/by/4.0/).